1. Introduction
In 2016 and 2017, approximately 45 and 46 million tons of electronic waste (e-waste) was generated globally, respectively [
1]. Balde et al. [
1] projected that the amount of e-waste generated is likely to increase to 52.2 million tons by the year 2021. Mishra et al. [
2] suggested that with an annual growth rate of 4% to 5%, e-waste is becoming one of the fastest growing waste streams in the world. European countries generate approximately 8.3 to 9.1 million tons of e-waste per annum, with Wu et al. [
3] projecting an increase of 12.3 million tons by the year 2020, while the USA alone is generating about 10 million tons annually. Moreover, the generation rates of e-waste are expected to rise further because of the shorter life spans of some of the electronic products [
1,
4,
5,
6].
Electronic wastes, also known as waste electrical and electronic equipment (WEEE), entail discarded electrical or electronic equipment that are no longer useful to the end-users. This waste stream is also comprised of electrical and electronic equipment such as mobile phones, laptops, computers, electric bulbs, and television sets [
7,
8]. Several studies have indicated that the e-waste stream is a source of about 1000 different hazardous components with potential threats to human health and environmental quality, thus making its management a challenge or problem in most communities [
9,
10,
11]. The severity and significance of this problem is high in many developing countries, especially among those who lack appropriate policies, environmental management systems, and processes to regulate this waste stream, as well as suitable infrastructure to effectively and efficiently manage it.
Hence, the appropriation, utilization, disposal, and recycling of e-waste affect many stakeholders in society, including households who play an important role in the generation and management of this waste stream [
8,
12]. Due to some measure of ignorance in handling this waste stream, households face greater challenges in the disposal of e-waste than is the case with industrial enterprises and other institutions [
8,
13]. Thus, the extent to which households are informed and are aware of the problems associated with e-waste becomes an important factor that influences their ‘utility maximizing decisions about the handling’ of such wastes [
14].
Nevertheless, in many developing countries, there is little household and public awareness about the precautions and proper management of e-waste. In a study on e-waste knowledge and attitudes in India, Sivanthanu [
15] indicated that consumer awareness has a direct relationship with willingness to recycle e-waste, which is a crucial condition for efficient e-waste management. Furthermore, there are ineffective e-waste recycling efforts in developing countries such as Bangladesh and India because large proportions of their populations are relatively unaware about the precautionary measures necessary for handling and disposing e-wastes [
15,
16]. However, literature also points out that households in these cities are willing to pay for the effective disposal of e-wastes [
15,
16,
17].
It is projected that the population of Nigeria is likely to reach 200 million people before 2025 as it exceeded 180 million inhabitants in 2017 [
18], along with a growing economic base with a higher economic demand for electronic products such as mobile phones, laptops, and smart television sets [
19,
20]. Given the accelerated rate at which these devices are being upgraded and improved by manufacturers for enhanced functionality, the amount of discarded wastes from obsolete appliances is growing exponentially, thus leading to increased e-waste generation rates [
21]. This problem is compounded by increasing e-waste imports from the USA and some of the countries in the European Union [
10,
22]. According to the United Nations research, over 60,000 tons of e-wastes are being shipped into Nigeria annually mainly via the ports in Lagos, apart from additional imports reaching this country from neighbouring countries [
23]. These amounts are excessive for Nigeria considering that nearly 290,000 tons of a similar waste stream were generated nationally during the year 2017 [
23]. This increased e-waste generation rate is leading to severe environmental management problems due to indiscriminate dumping in public open spaces, and river banks where it is illegally dumped alongside municipal or hospital wastes. Consequently, these unsafe practices are leading to undesirable environmental despoliation likely to worsen as most cities in Nigeria lack efficient management systems for dealing with e-wastes [
24]. According to Nnorom and Osibanjo [
24], the National Environmental Standards and Regulatory Enforcement Agency (NESREA) responsible for the administration of environmental laws, guidelines, and implementation in Nigeria, lacks appropriate resources, skills, and technology for proper e-waste management. Hence, large quantities of e-waste are smuggled into Nigeria as a result of inherent institutional weaknesses, thus creating greater e-waste management challenges.
Although research on e-waste at household level has been conducted in some of the states in Nigeria [
19,
25,
26], there is still limited research on the knowledge and awareness of e-waste streams across many states. Therefore, in this paper, household e-waste awareness and knowledge in the Jos metropolis of Plateau State (Nigeria) have been surveyed and the key questions are summarized as follows:
What types of electronic devices are used by households within this metropolis?
How much awareness and knowledge exists amongst households regarding e-waste?
Is there any willingness amongst households to participate in e-waste management?
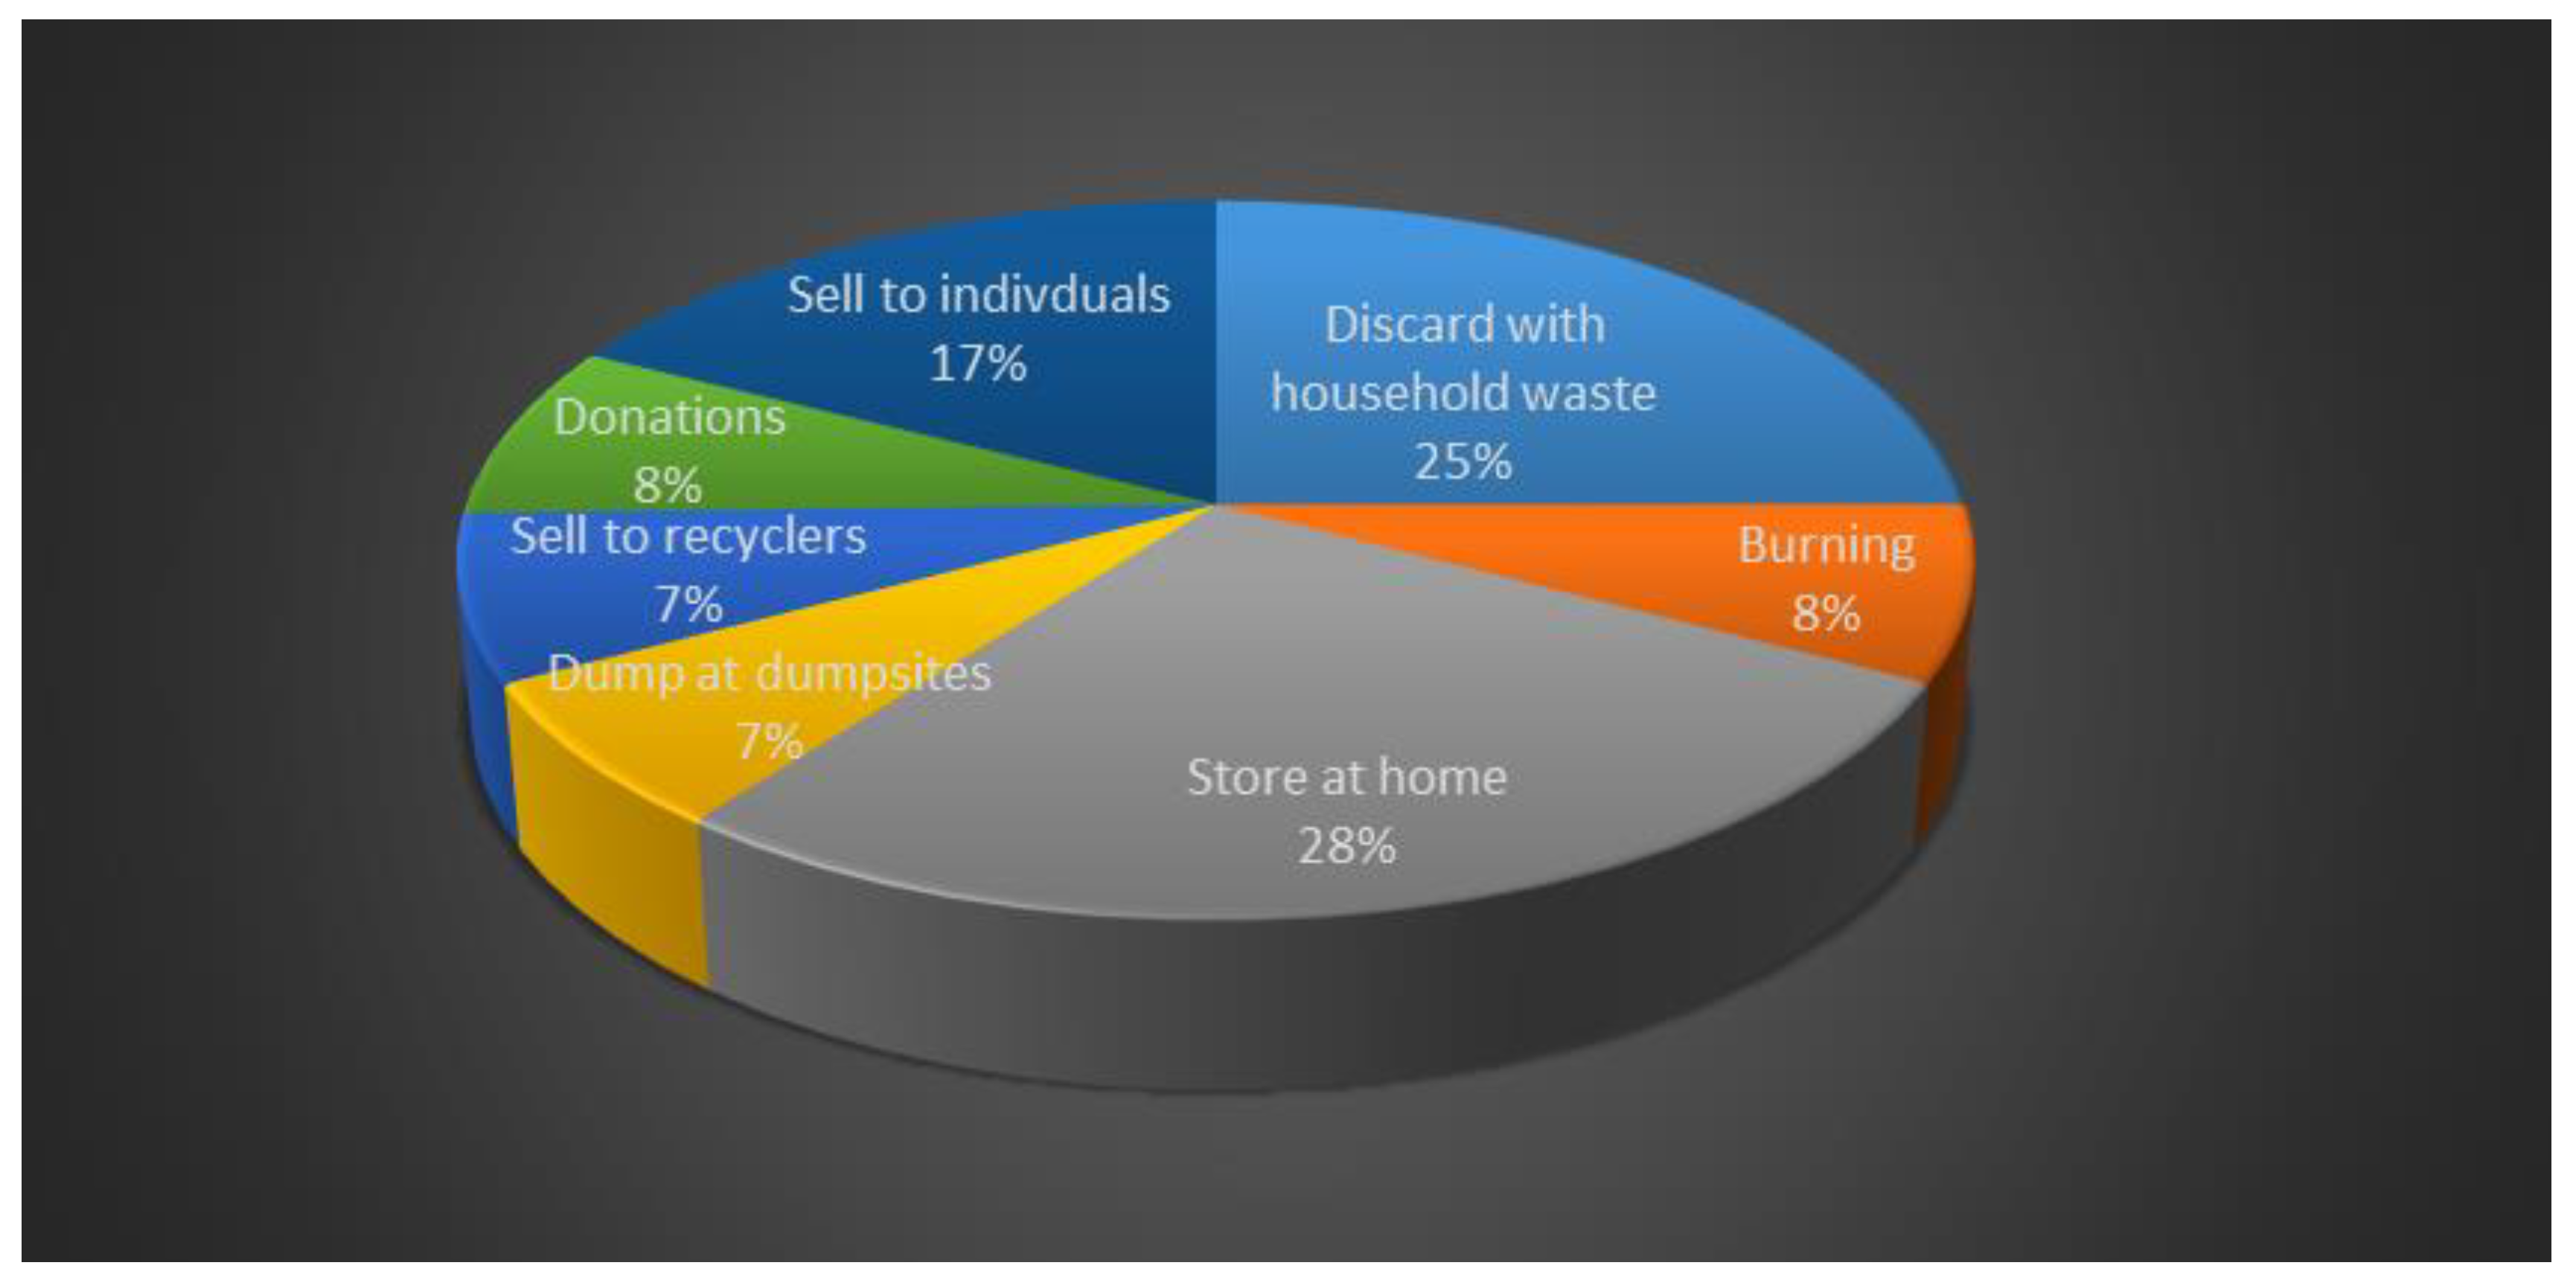
What methods are used in disposing away e-waste in this metropolis?
In addition to these research questions, two different hypotheses were formulated to help validate and illuminate our results while enriching existing theory on e-waste management in the study area:
There are no significant differences in the knowledge and awareness levels amongst households according to their socio-demographic characteristics.
There are no significant differences in household willingness to participate in e-waste management depending on their socio-demographic characteristics.
3. Study Area, Materials, and Methods
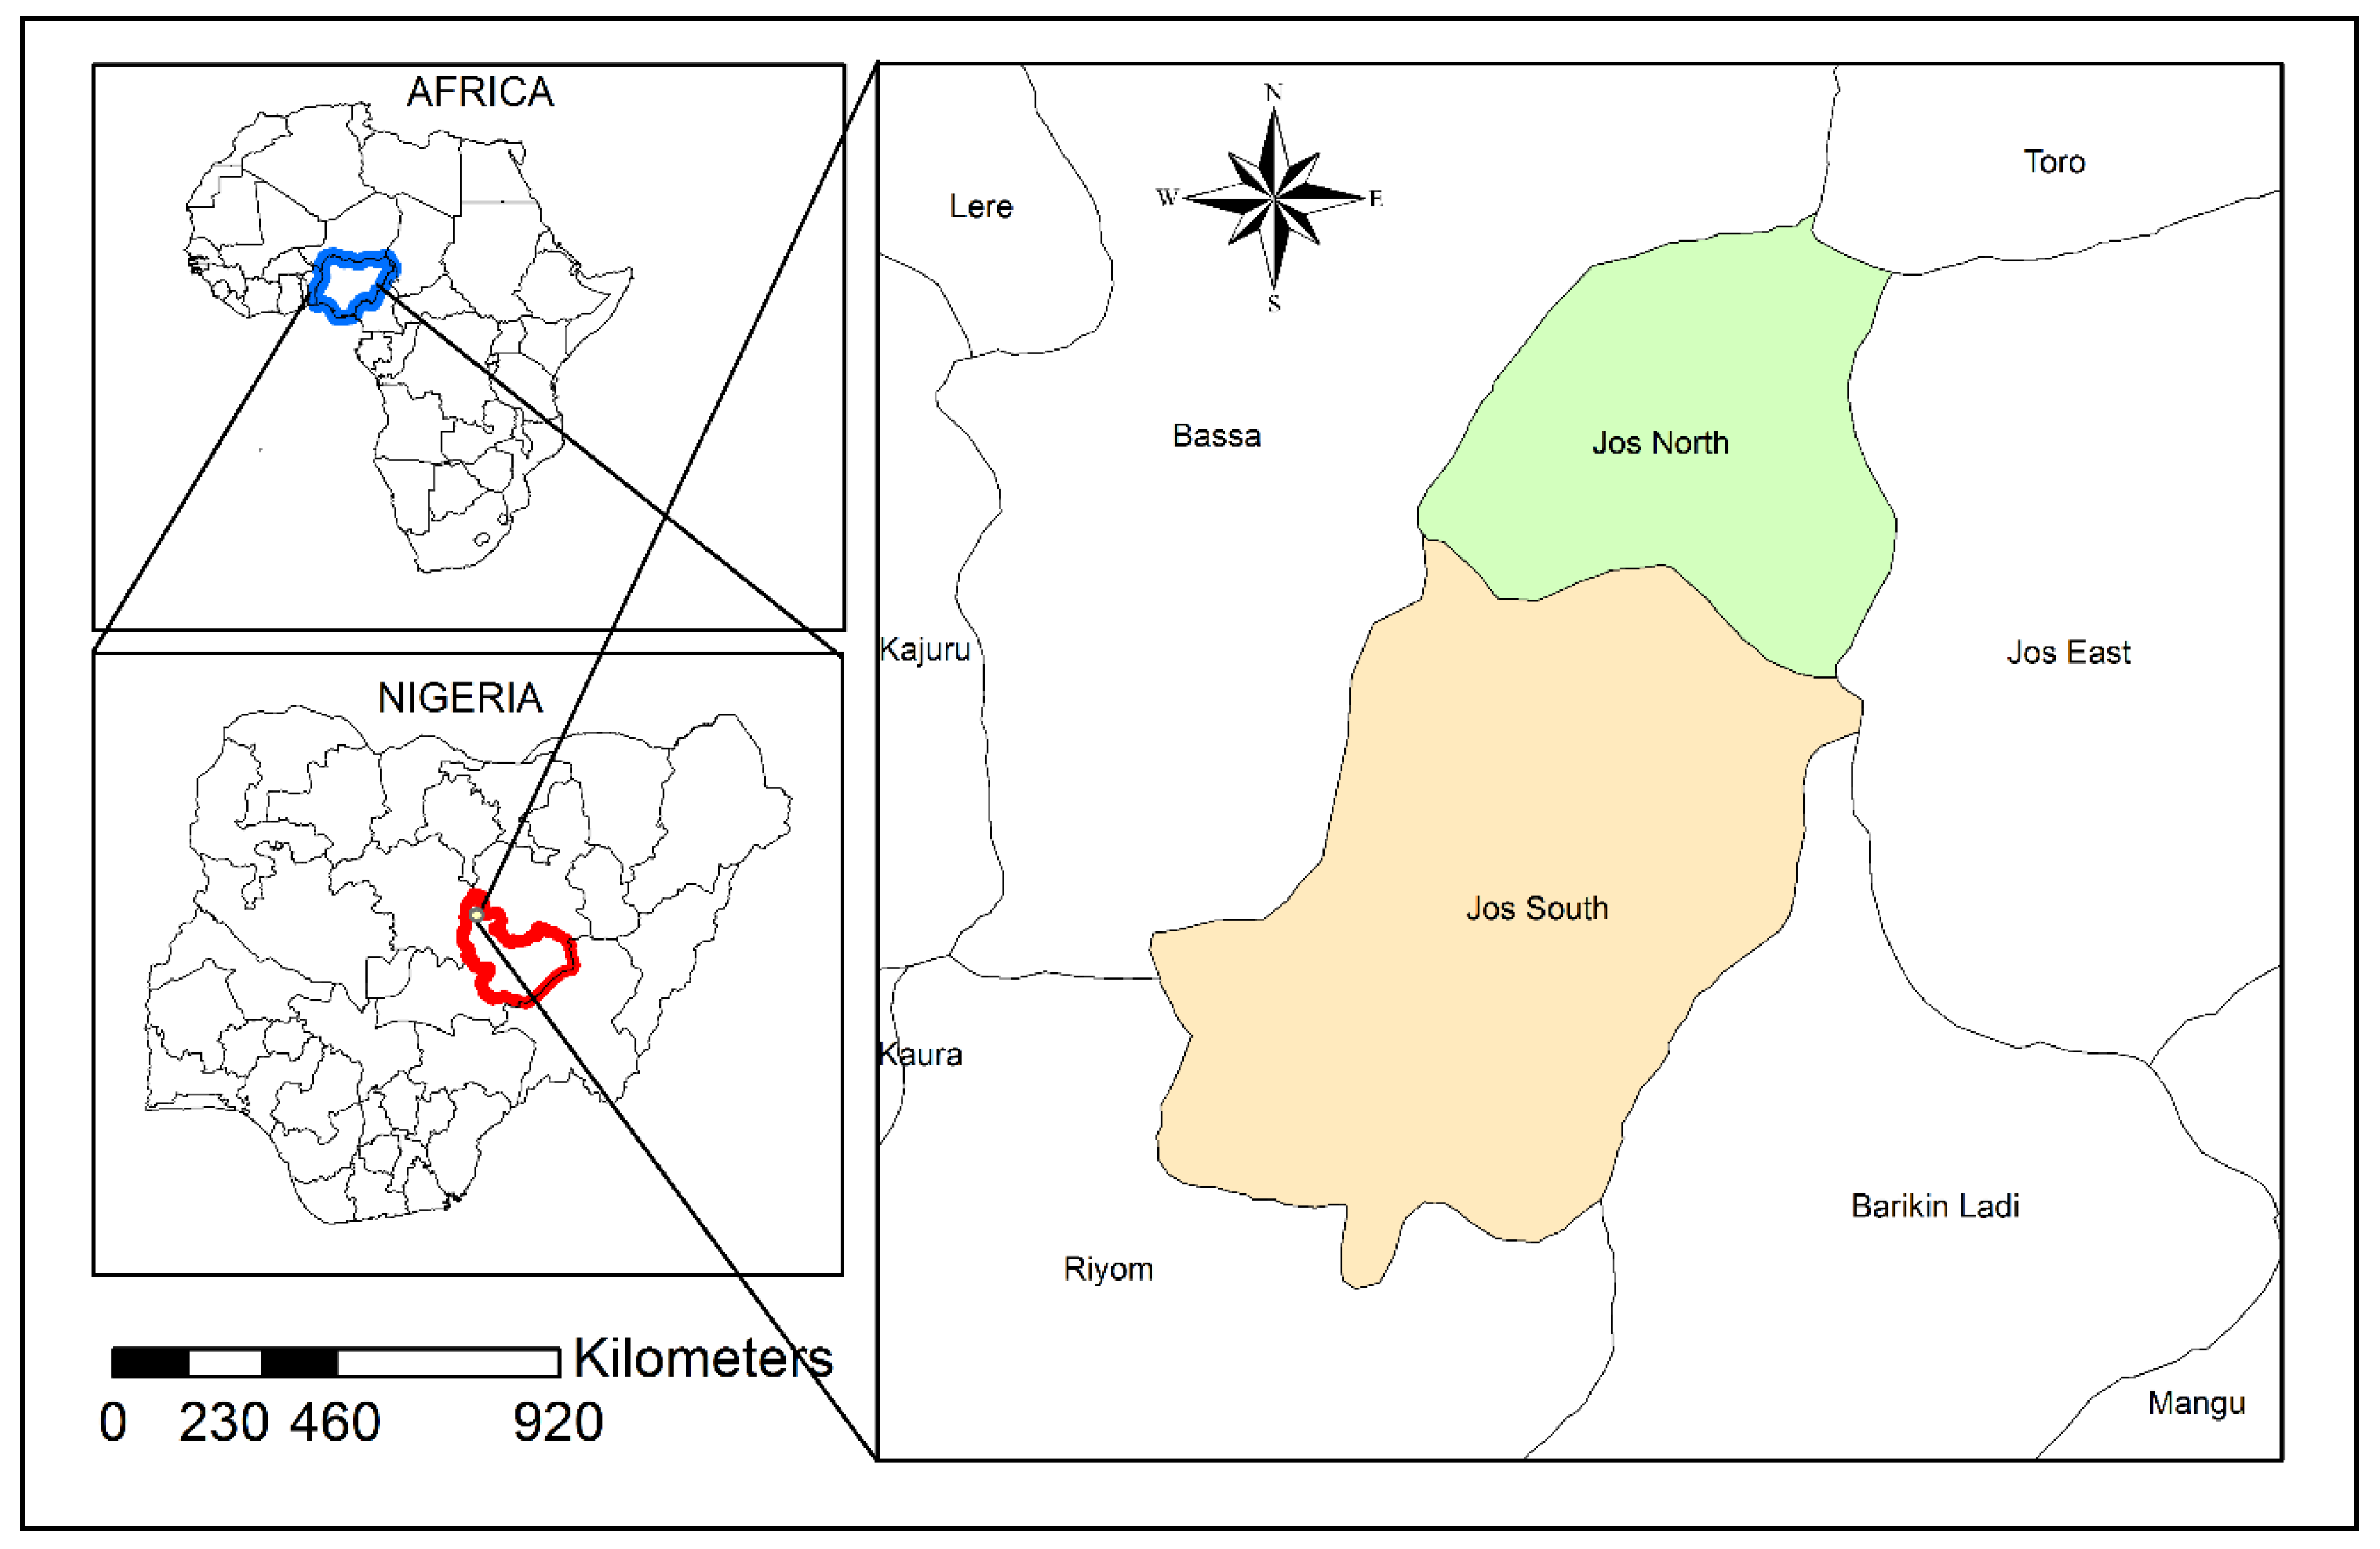
3.1. The Study Area
This survey was conducted amongst households in the Jos metropolis (Nigeria). Jos is the administrative capital of Plateau State in Nigeria and has a total land mass of about 249.7 km
2 (
Figure 1). This city is located at an elevation of 1238 m (i.e., 4062 ft) above sea level [
56] and is comprised of two local Government Areas (LGAs), namely, (1) Jos South and (2) Jos North as shown in
Figure 1.
Jos is also one of the coolest cities in Nigeria with temperatures ranging from 22 to 32 °C (minimum and maximum, respectively) and has attracted many settlers from different parts of Nigeria, as well as foreigners from other countries. The Dilimi River is an important source of water to many other states in Nigeria, both for domestic and agricultural activities, especially for irrigation farming.
Jos city was chosen for this survey mainly because of the importance of prevailing economic activities, an accelerated pace of urbanization, and a population size of about 1 million people, along with the increased burden of municipal waste management [
57]. According to Peter et al. [
58], the urban population in Jos is increasing at a rate of 5.5%, and similarly the proportion of e-waste is expected to rise concomitantly. Furthermore, this metropolis serves as the business hub of Plateau State, thus is home to some of the largest electrical and electronic stores which include household brands such as PZ, LG, and Samsung. Given this background, large amounts of e-wastes are generated from this city, thus necessitating the need for more empirical research to provide solutions to this environmental management problem.
3.2. Survey Procedures and Sampling Framework
The aim of this survey was to investigate knowledge and awareness levels related to e-waste and related issues amongst households in Jos. Similarly, with an e-waste survey conducted by Nduneseokwu et al. [
59] in the city of Onitsha in Anambra State (Nigeria), the respondents for the present survey were selected randomly across Jos. Household heads were the main targets for face-to-face questionnaire-administered interviews. The principle of random sampling in our survey was intended to bring statistical credibility, as well as data representability, thus in line with previous research approaches adopted to investigate the willingness and behaviour of residents towards e-waste recycling in Beijing (China) [
60]. Moreover, Bhat and Patil [
51] followed a random sampling approach in attempting to understand the consciousness, as well as the disposal practices of residents of Pune city in India.
In total, 300 questionnaires were administered to households’ respondents during our survey although only 228 were successfully populated, thus yielding a response rate of 76%. Such interviews were conducted mostly in English although there were translations into the regional indigenous language known as ‘Hausa’ whenever respondents experienced difficulties in understanding interview questions.
3.3. Data Collection Methods
The survey collected mainly quantitative primary data through interviews from June 2018 until September 2018. The questionnaires were comprised of close-ended questions that were grouped into four different sections that are summarized as follows:
Demographic and socio-economic characteristics of respondents.
Knowledge and awareness of electronic wastes.
Reasons for changing electronic products.
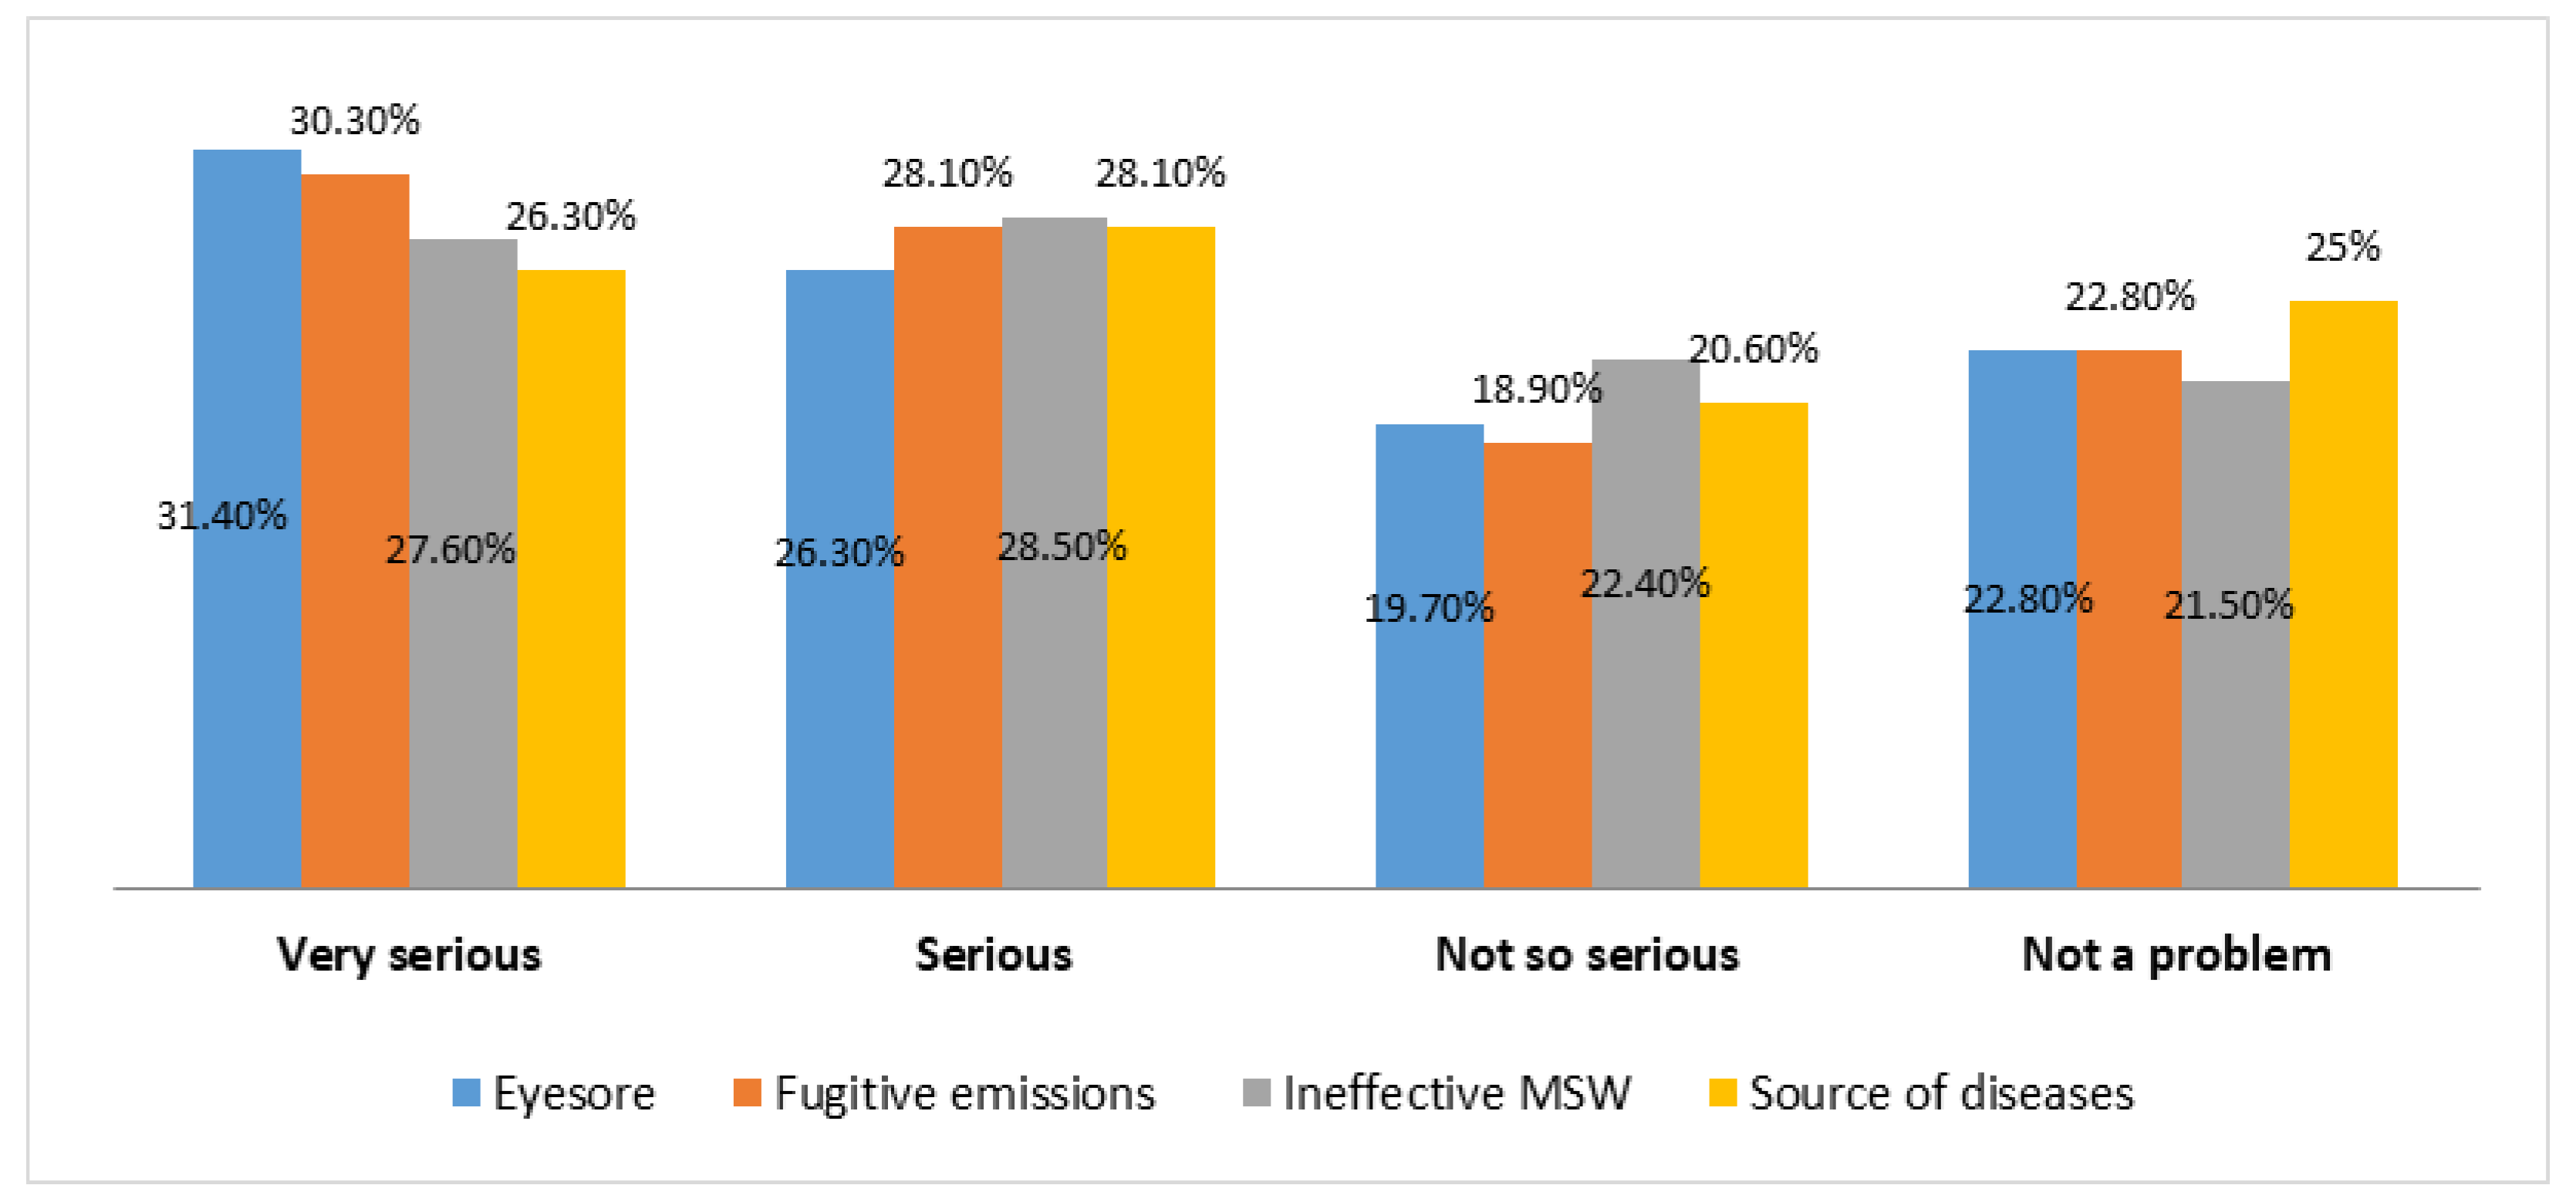
Environmental problems associated with e-waste management.
From an ethical point of view and consonant with the research policy of the University of Johannesburg, interviews for collecting primary data occurred only when respondents offered prior informed consent for their participation in this survey. Such consent meant that the respondents understood the purpose of the surveys and gave permission for interviews while their privacy and anonymity were being protected.
3.4. Data Analyses
Primary data collected during interviews were stored in MS Excel (Version 2016) for further processing and coding. Subsequently, the data were subjected to both descriptive and inferential statistical analyses by making use of the SPSS 25 version. The hypotheses were subjected to t-tests and analysis of variance (ANOVA). Regarding the testing of these hypotheses, a probability level of 0.05 (p < 0.05) was taken into consideration. The results are presented in the next section by means of tables and different types of statistical illustrations.
5. Conclusions and Recommendations
In our survey, we investigated household awareness on e-waste and the associated willingness to participate in its management in Jos (Plateau State of Nigeria). Sound knowledge and awareness of e-waste is essential towards safe disposal, reuse, as well as its recycling, along with minimizing exposure to harmful components. Based on the findings from our survey, the following conclusions and recommendations are made.
Most (70.2%) of the respondents were men because many of them are household heads while the most (50.9%) represented age group amongst respondents were in the category of 31 to 40 years old. In terms of income levels, about 71% of respondents earned incomes above the Nigerian minimum monthly wage of $83.3, thereby raising the likelihood of increased capacity to purchase electronic goods as indicated in several studies.
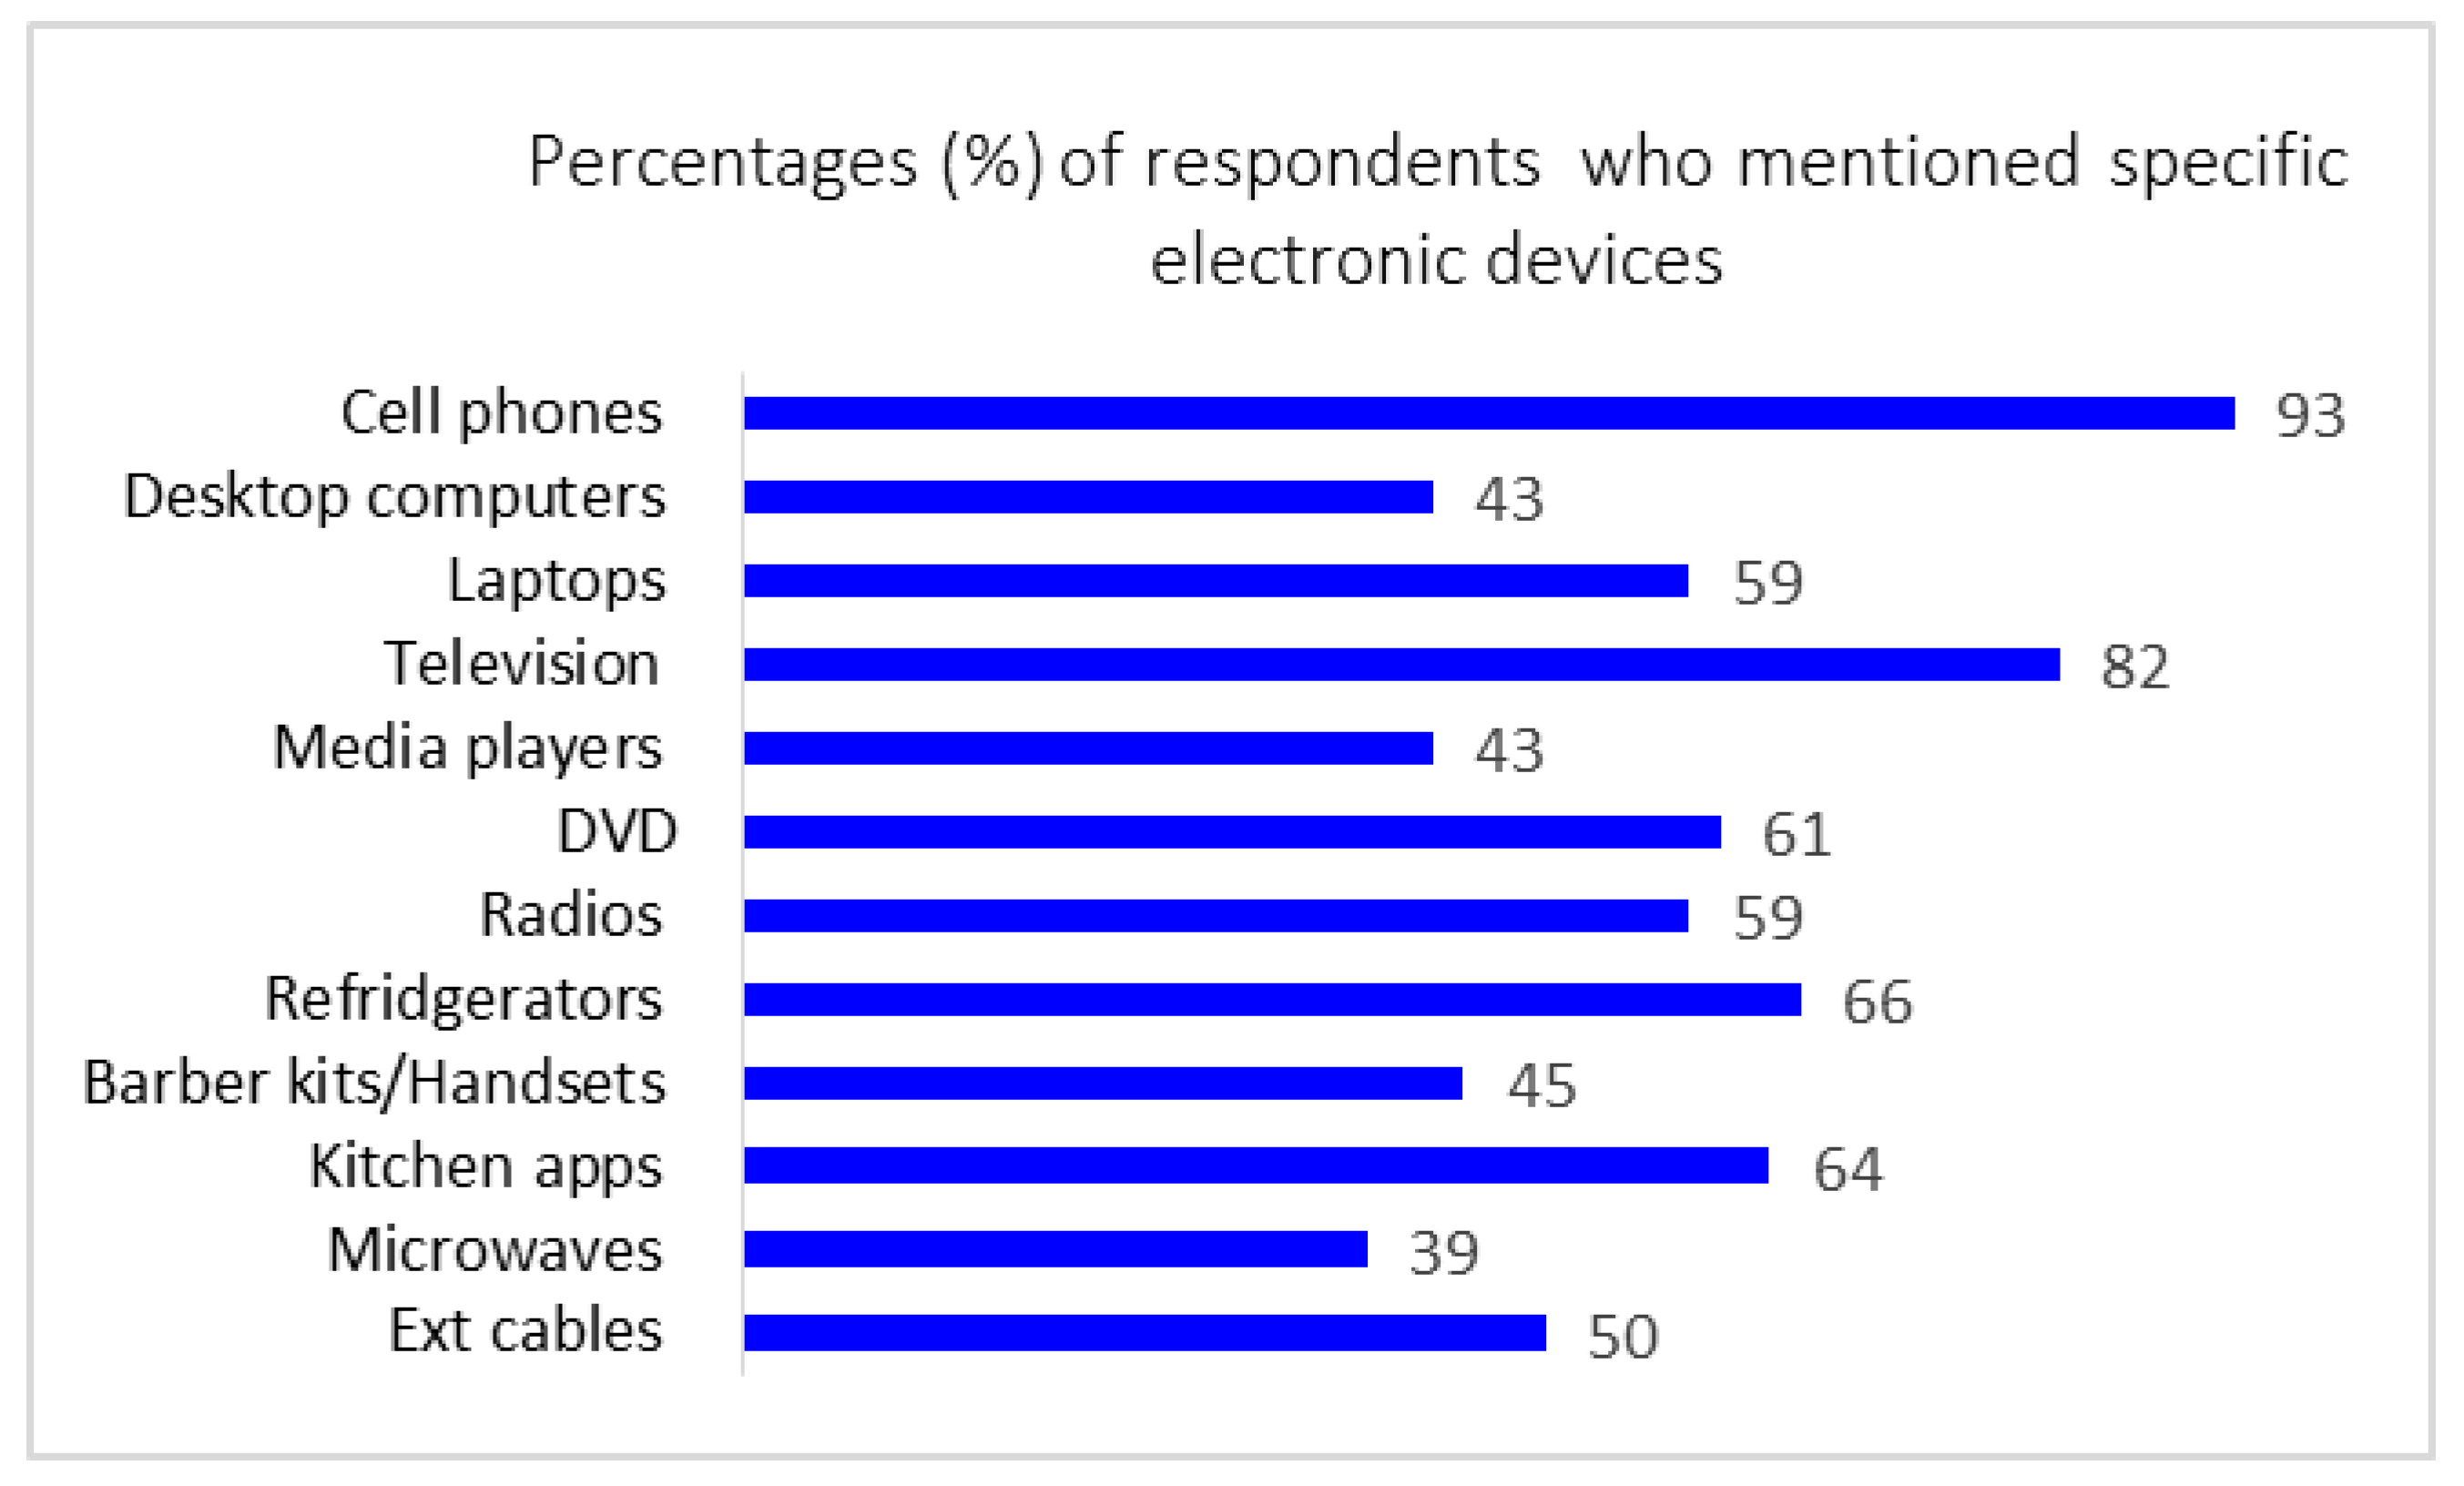
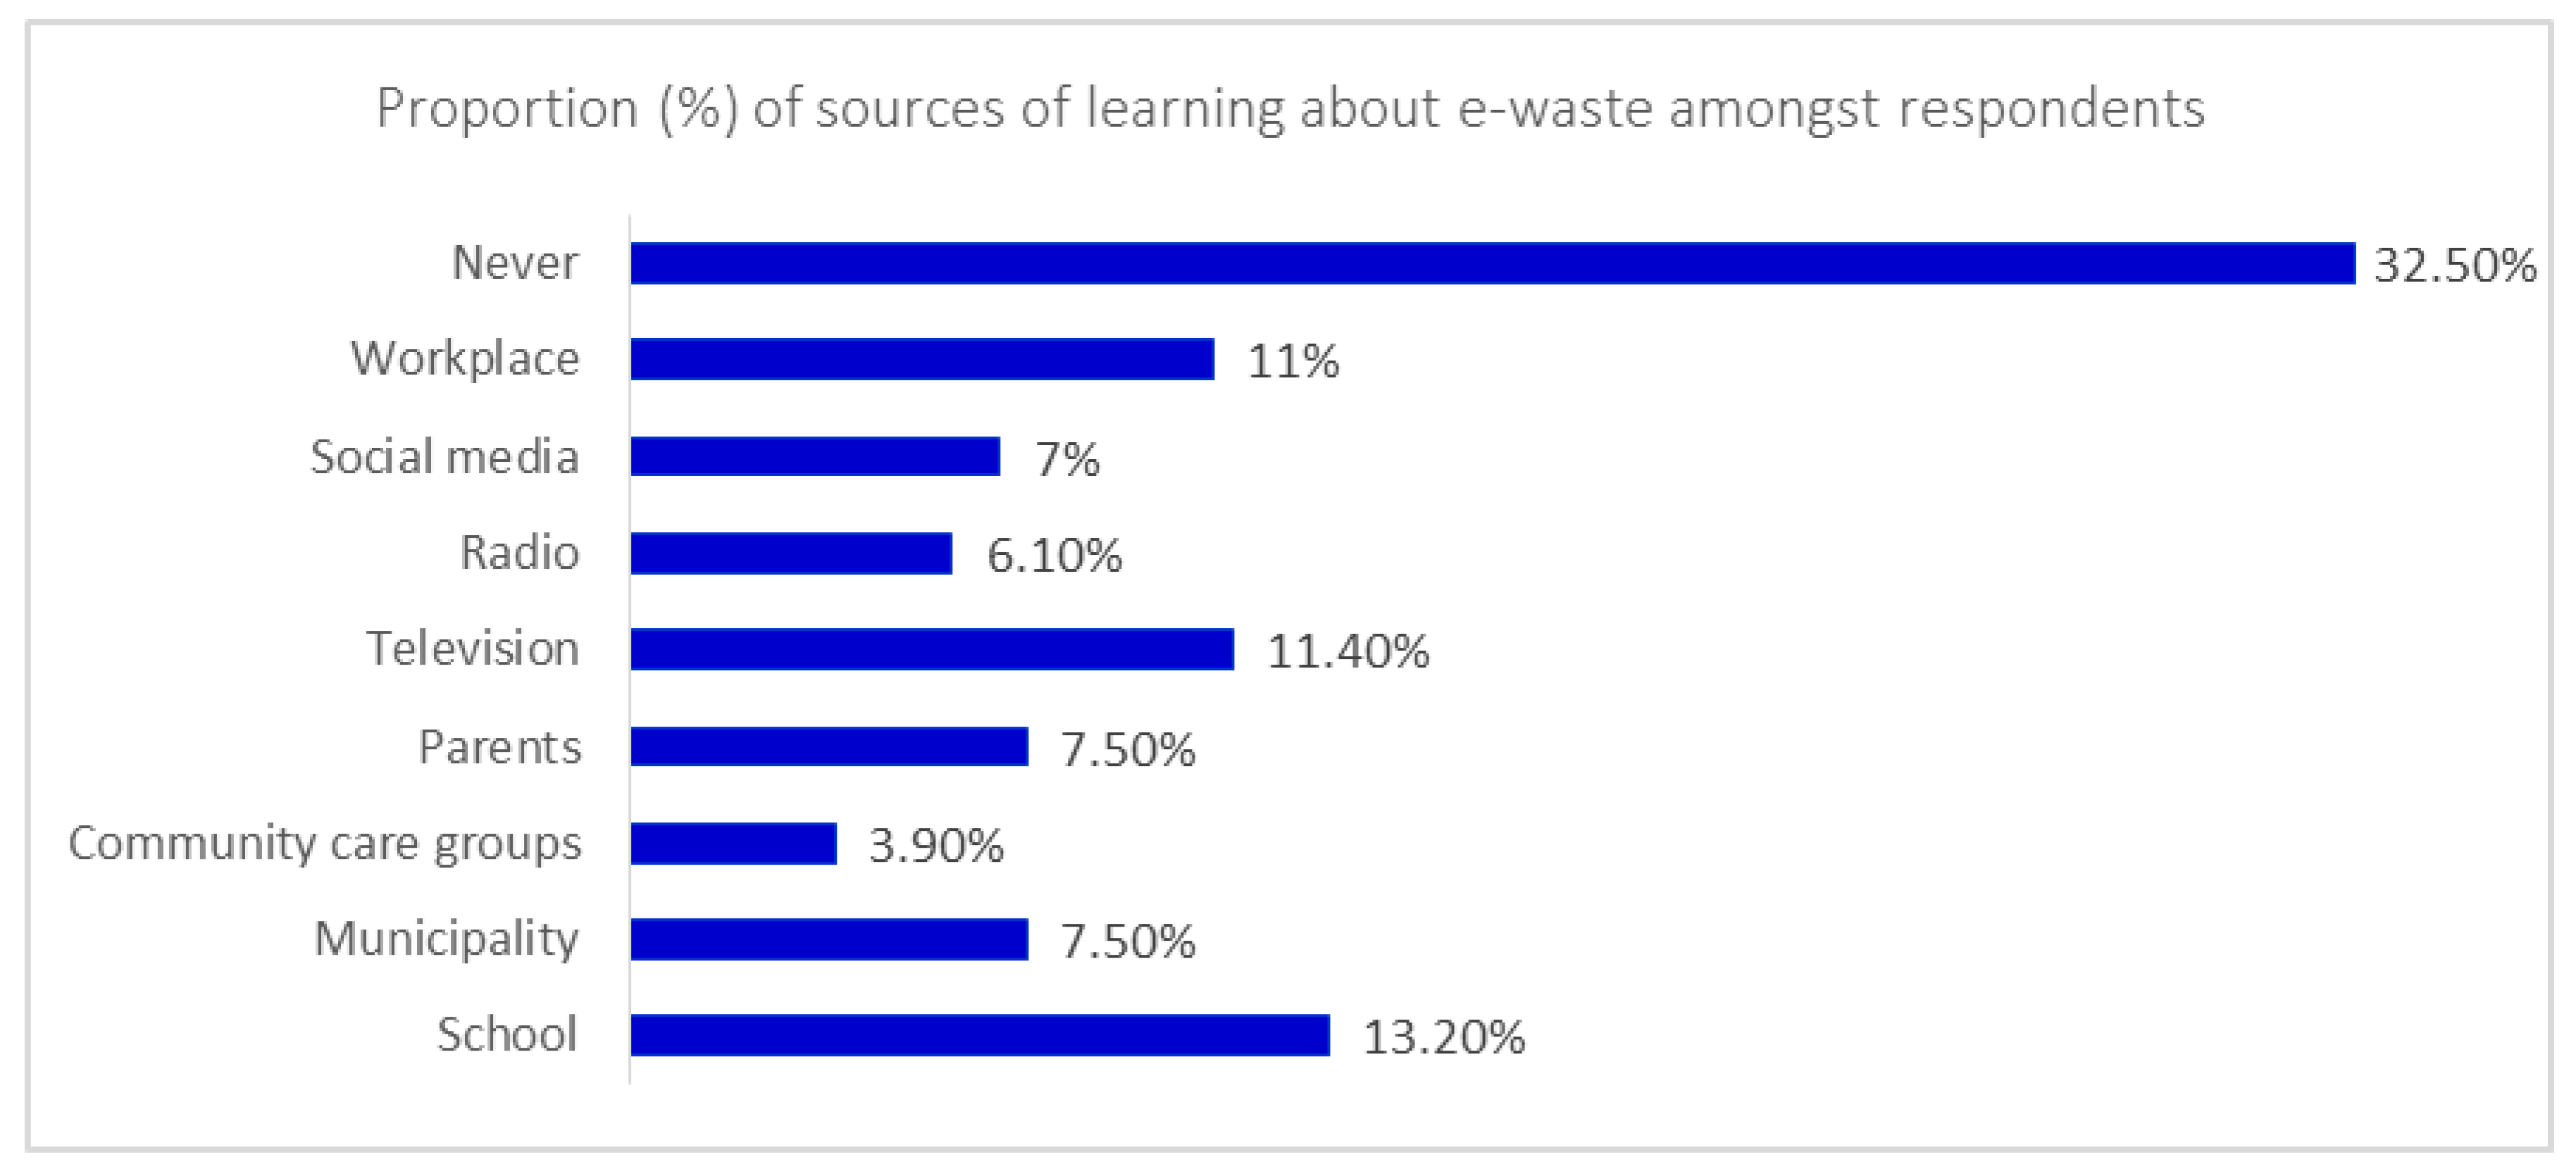
Electronic devices mentioned by most households included cell phones (82%), televisions sets (82%), DVDs (61%), as well as laptops (59%). Similarly, the level of awareness on e-waste amongst the respondents was relatively high (67.5%), although many seemed to lack detailed knowledge and proper education (73%) on the proper handling and management of e-wastes. For example, 32.5% of respondents have never received any training from any source regarding e-waste management. Given this weakness, community-based interventions to improve awareness levels on e-waste management are recommended.
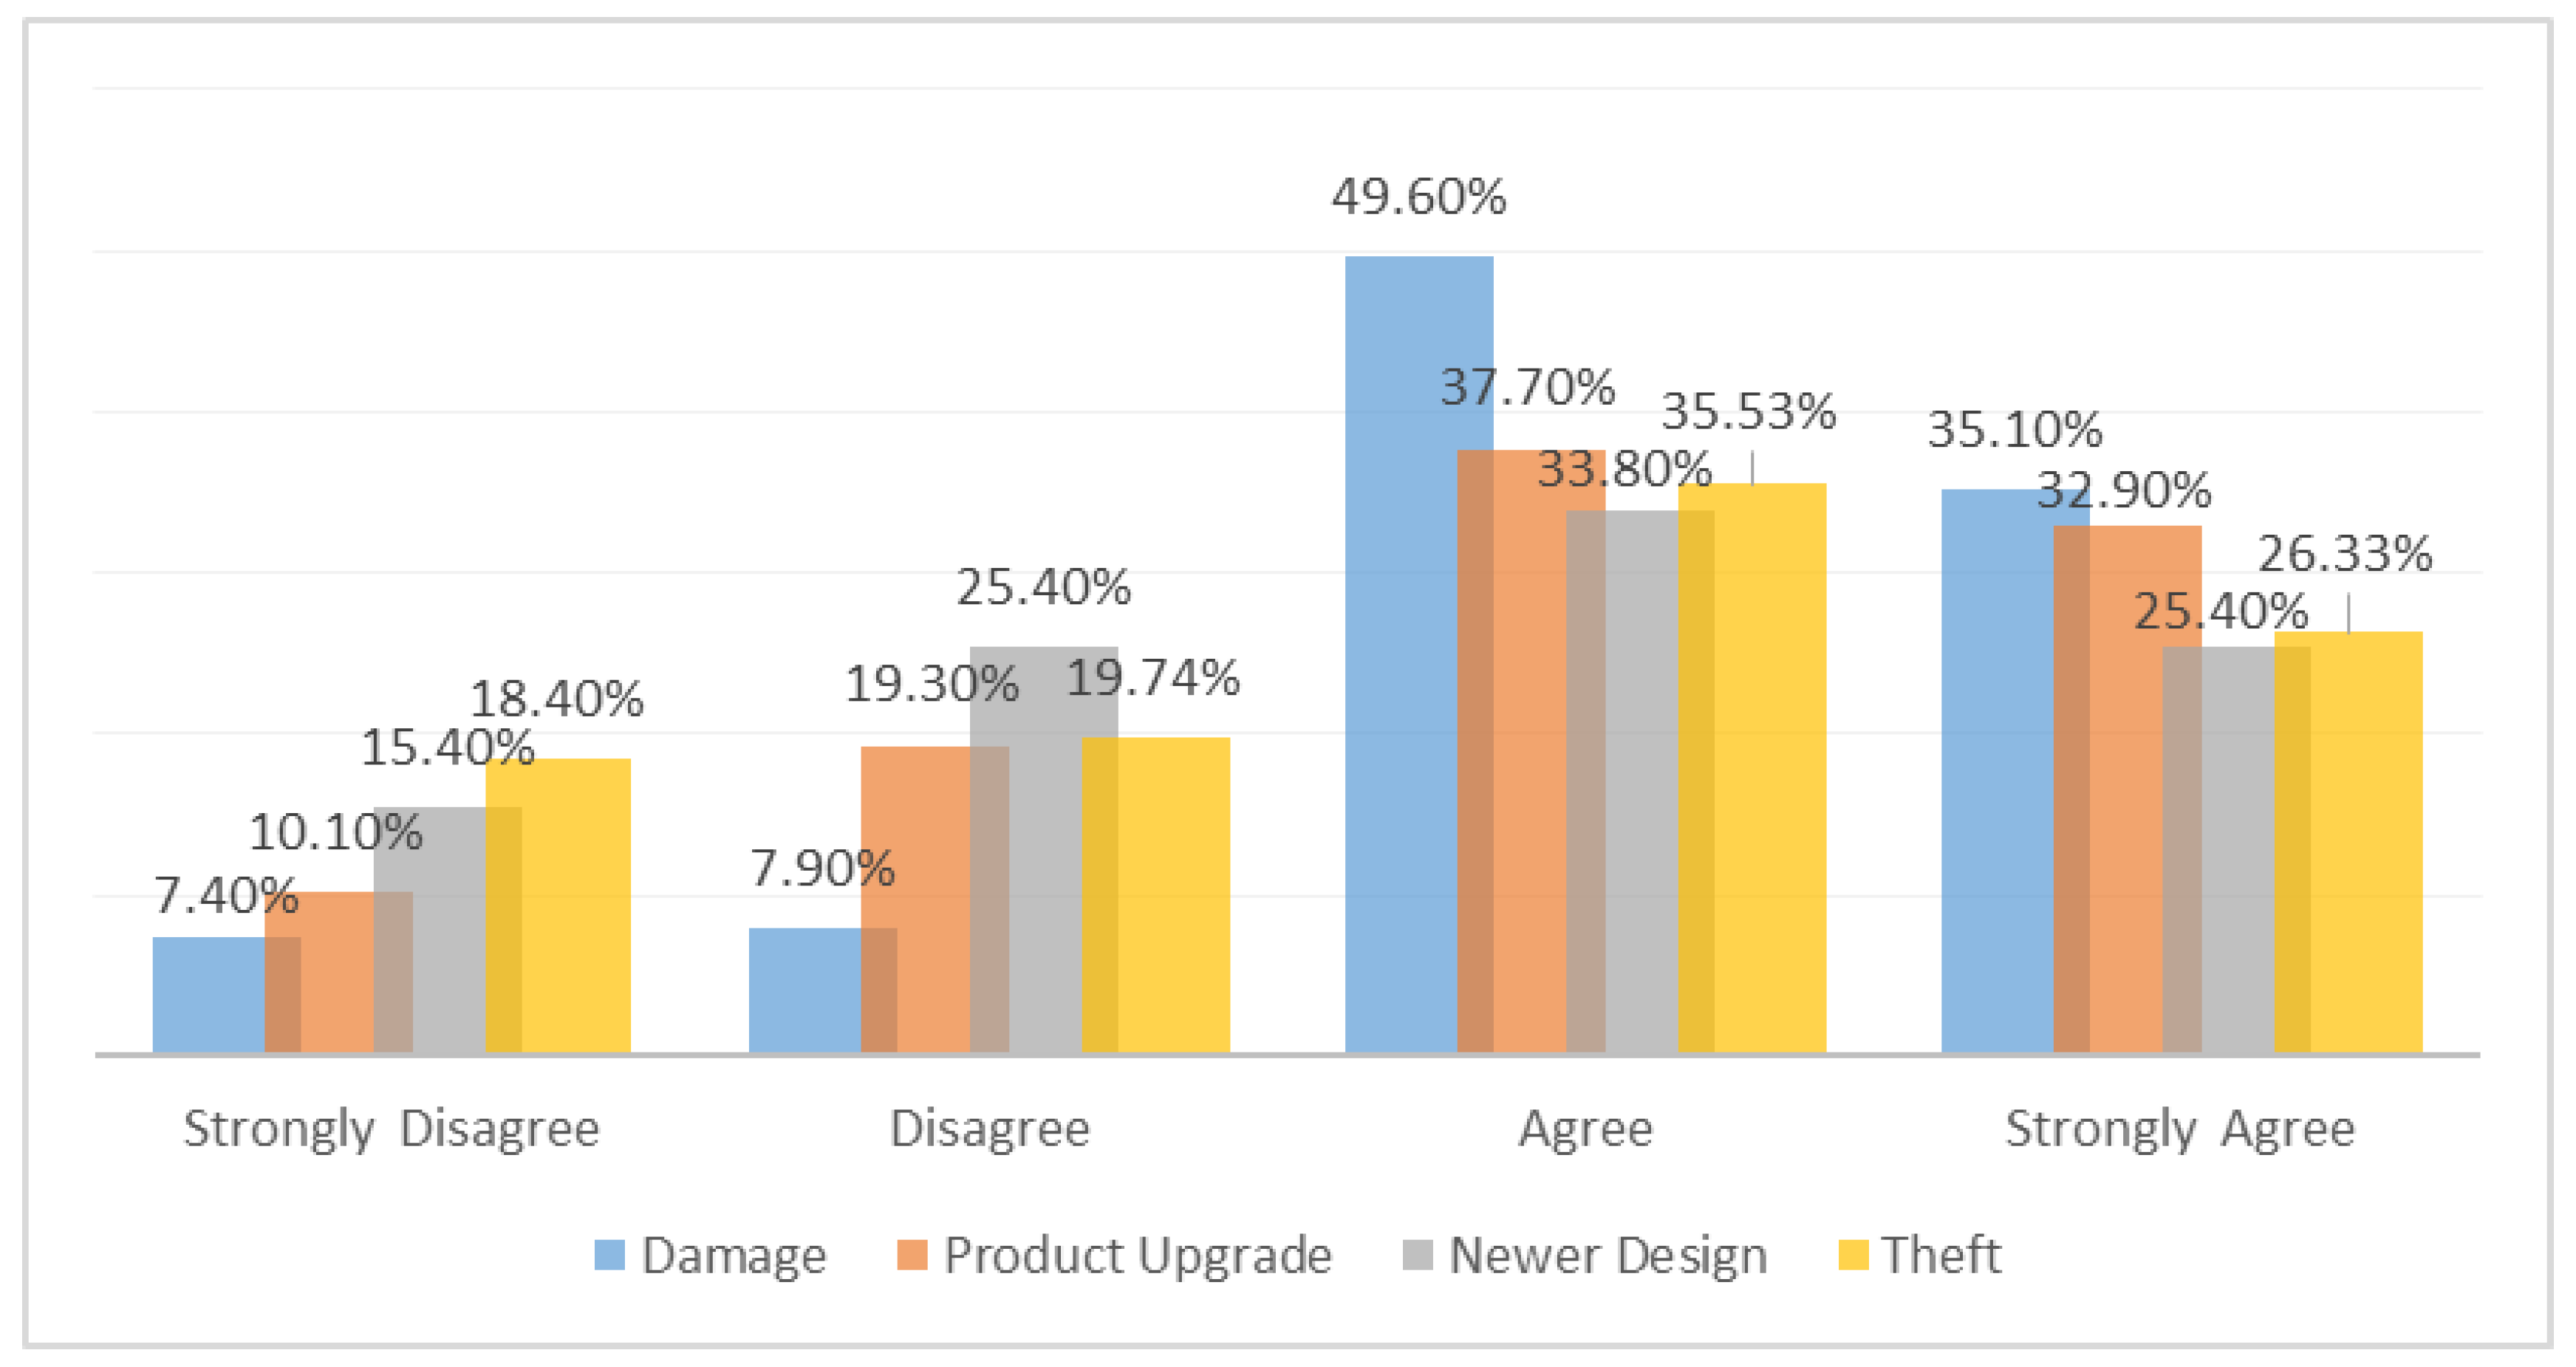
The most predominant reasons for acquiring more electronic devices amongst respondents entailed damage to existing products, theft, product upgrades, as well as the introduction of newer versions. Furthermore, several environmental problems from the perspective of the respondents were linked to poor practices of disposing away e-wastes in their neighbourhoods, the most important being the negative impacts it has on aesthetics, ambient air quality, as well as weak municipal management to deal effectively with this waste stream.
The majority of respondents were willing to participate in e-waste management programmes (68.9%), as well as become involved in the extended producer responsibility schemes (84.2%). However, existing literature [
66,
67,
68] shows that to adequately evaluate the viability of introducing such schemes would require further engagement, interactions, and collaboration with computer manufacturers, associated vendors, and other stakeholders who are likely to be affected by the financial and logistical impacts involved.
Furthermore, the survey revealed some of the factors that may help moderate e-waste knowledge and awareness amongst respondents, as well as their willingness to participate in its management and possible recycling. Based on the hypotheses formulated for this survey, levels of awareness and knowledge amongst respondents were not affected by any of the socio-demographical characteristics of respondents. Similarly, there were no significant differences amongst respondents in terms of their willingness to participate in e-waste management.

 ,
, 


