Article

Analysis of Factors Influencing Carbon Emissions in the Energy Base, Xinjiang Autonomous Region, China

1
College of Resource and Environment Sciences, Xinjiang University, Urumqi 830046, Xinjiang, China
2
Key Laboratory of Desert and Oasis Ecology, Xinjiang Institute of Ecology and Geography, Chinese Academy of Sciences, Urumqi 830011, Xinjiang, China
3
University of Chinese Academy of Sciences, Beijing 100049, China
4
Akesu National Station of Observation and Research for Oasis Agro-Ecosystem, Akesu 843017, Xinjiang, China
5
School of Geographical Science, Nanjing University of Information Science & Technology, Nanjing 210044, China
6
Hydrogeology Working Group, Institute of Geological Sciences, Freie Universität Berlin, 12249 Berlin, Germany
7
Jiangxi Climate Center, Nanchang 330096, China
*
Author to whom correspondence should be addressed.
Sustainability 2020, 12(3), 1089; https://0-doi-org.brum.beds.ac.uk/10.3390/su12031089
Submission received: 2 October 2019 / Revised: 8 January 2020 / Accepted: 10 January 2020 / Published: 4 February 2020
(This article belongs to the Special Issue Sustainable Urban and Regional Management)

Abstract

:
Analyzing the driving factors of regional carbon emissions is important for achieving emissions reduction. Based on the Kaya identity and Logarithmic Mean Divisia Index method, we analyzed the effect of population, economic development, energy intensity, renewable energy penetration, and coefficient on carbon emissions during 1990–2016. Afterwards, we analyzed the contribution rate of sectors’ energy intensity effect and sectors’ economic structure effect to the entire energy intensity. The results showed that the influencing factors have different effects on carbon emissions under different stages. During 1990–2000, economic development and population were the main factors contributing to the increase in carbon emissions, and energy intensity was an important factor to curb the carbon emissions increase. The energy intensity of industry and the economic structure of agriculture were the main factors to promote the decline of entire energy intensity. During 2001–2010, economic growth and emission coefficient were the main drivers to escalate the carbon emissions, and energy intensity was the key factor to offset the carbon emissions growth. The economic structure of transportation, and the energy intensity of industry and service were the main factors contributing to the decline of the entire energy intensity. During 2011–2016, economic growth and energy intensity were the main drivers of enhancing carbon emissions, while the coefficient was the key factor in curbing the growth of carbon emissions. The industry’s economic structure and transportation’s energy intensity were the main factors to promote the decline of the entire energy intensity. Finally, the suggestions of emissions reductions are put forward from the aspects of improving energy efficiency, optimizing energy structure and adjusting industrial structure etc.

1. Introduction

The Fifth Assessment Report of the Intergovernmental Panel on Climate Change (IPCC AR5) concluded that global air temperature had increased to about 0.85 °C over the period 1880–2012, and it is certain that global warming had significantly increased the frequency and intensity of extreme disaster events and losses since the 1970s [1]. Studies have pointed out carbon emissions as the main reason for global warming, which are generated by the overuse of fossil energy consumption in the process of human socio-economic development [2]. As a result, the issue of carbon emissions has grabbed much more attention from scientists and politicians in recent years. It is witnessed that the topic of carbon emissions has shifted from a climate change perspective to a political, economic, social, geographical and technological issue over the past 20 years [3]. A global consensus has been developed over curbing of carbon emissions. In December 2015, the international community adopted the Paris Agreement, which aims to limit the rise of the global temperature to 2 °C above the pre-industrial level. Another target has also been set to achieve the balance between carbon emissions sources and sinks [4]. At the time of drafting the Paris Agreement, countries submitted their own Intended Nationally Determined Contribution plans to address the challenges posed by climate change. Carbon emission reduction was the key component of the targets and actions in this plan [5]. China’s economy has continued to grow since 2000, making it the second-largest economy in the world. Owing to an energy-intensive and heavy industry-based developmental pattern spanning decades, China has become the largest emitter in the world since 2005 [3]. With the sustained economic growth and rapid development of urbanization and industrialization, China’s carbon emissions will continue to grow in upcoming years. The sensitivity of high carbon emissions has incurred global attention, which has brought more and more international pressure on China. It is noteworthy that China has made great efforts to reduce carbon emissions. In order to respond to climate change, China pledged at the Paris Agreement to a reduction in energy usage intensity of 60–65% compared to 2005, and make efforts to hit a peak of carbon emissions by around 2030 [6]. The importance and urgency of carbon emissions research are further highlighted by whether China can fulfill its strictest emission reduction commitments while keeping the rapid socio-economic development [7].
At present, in order to achieve carbon emissions peak under the conditions of stable economic growth, China urgently needs to find a feasible way to harmonize the relationship between energy consumption and economic growth and ensure continuous reduction of carbon emissions. To achieve this target, researches conducted on carbon emissions to find low-carbon development pathways. Currently, carbon emissions study is mainly classified as emissions accounting [8,9], spatio-temporal evolution of carbon emissions [10], the analysis of economic development and carbon emissions [11], decomposition of carbon emissions [12], driving force of carbon emissions [13], the impact of technological changes on carbon emissions [14], the transfer of carbon emissions from international trade [15], scenario analysis on carbon emissions [16], reduction measures and simulation [17,18], carbon tax [19,20], carbon emissions distribution and trading [21,22]. Therefore, the study regarding drivers of carbon emissions will not only provide a scientific foundation to achieve low-carbon development but also help to suggest some appropriate supply-side reform measures. Since the 1990s, the drivers of carbon emissions mainly focus on economic development [23], energy and industrial structure [24,25], technology change [14], population [26] and trade [15] and so on. It is generally believed that economic development, population growth, energy intensity and the changes in industrial and energy structure have an important impact on carbon emissions. Being the largest carbon emitter country, many studies have revealed the main driving force of carbon emissions in China [27,28,29,30,31]. The results indicated that economic development has made a significant contribution to Chinese carbon emissions, while population growth is an important factor in the long run. Optimization of industrial and energy structures can potentially influence the emissions reduction [27,30], and the decline of energy intensity is emphasized to restrain the rise of carbon emissions [27,31]. Several studies also found that carbon emissions are more affected by the population and industrial structure in China [32]. Provincial studies highlighted that population, GDP per capita, heavy industry and urbanization rate are the most significant drivers affecting carbon emissions [7,33,34,35]. Obviously, both spatial heterogeneity and regional differences affect carbon emissions [36]. However, China is a vast country, and there are obvious discrepancies that exist in social development, industrial structure, per capita disposable income, technological accessibility, habits and customs, resources and environment among the different provinces. In addition to that, these regional differences pose a serious challenge to achieve the intended carbon emissions targets. If the provincial carbon emissions are not fully understood, the policies of national emissions reduction could not be effectively implemented [7]. Under these circumstances, there is great significance to further extend the analysis of driving factors from the national to provincial level and put forward targeted emissions reduction policies with the consideration of regional differences [37]. Therefore, it is important to deepen the understanding of the provincial case studies so that sustainable development can be achieved.
Xinjiang is one of the five national autonomous regions located in northwest China. As the largest province of China, Xinjiang accounts for 1/6th of the national total land area (Figure 1). Moreover, Xinjiang has the most proven reserves of fossil energy and renewable energy in China [38]. In 2013, China promulgated the 12th Five-year Energy Development Plan, proposing the construction of integrated energy bases including the Xinjiang autonomous region, Shanxi province, Ordos Basin, Eastern Inner Mongolia region and southwestern China. Meanwhile, as the energy base of “West-East Natural Gas Transmission Project” and “West-East Power Transmission Project”, Xinjiang exports huge amounts of fossil fuel and electricity to central and eastern China, which has led to a huge transfer in carbon emissions [38]. The huge demand for energy consumption leads to rapid growth in carbon emissions. In 2015, Xinjiang accounted for about 5% of the nation’s total carbon emissions, but only for 1.35% of the nation’s GDP [8]. Xinjiang is also a typically underdeveloped region in the western part of China. On 30 March 2010, Chinese central government held a working meeting about the “Counterpart Aid” policy to promote the rapid development of the socio-economy in Xinjiang. With the support of the “Counterpart Aid” policy, Xinjiang’s socio-economic condition is in the rapid development phase. Since the 1990s, the utilization of fossil fuels has made a huge contribution to socio-economic development, and rapid progress in the economy has accelerated carbon emissions. Therefore, reducing carbon emissions without compromising socio-economic development is a major challenge for the local authorities.
Research regarding carbon emissions in Xinjiang, economic growth and population scale were confirmed as important contributors to increased carbon emissions, while the decrease of energy intensity was highlighted for curbing carbon emissions [7,39]. But the approach to carbon emissions reduction will depend on effective mitigation strategy of each sector; however, variable energy intensities of different sectors can impact the magnitude of carbon reduction. Nonetheless, an effective implementation of reducing measures in key sectors can help to achieve emissions reduction targets. Hence it is imperative to identify important measures suitable for the key sectors to attain the desirable emissions reduction goal [40]. At the same time, drivers of carbon emissions are different at different stages of social development. The key is to reveal the main drivers of carbon emissions at different policy stages so that policymakers can develop effective and efficient mitigation policies. In addition to that, due to the different domains of policy background, sectors’ economic structure and energy intensity was diverse. Therefore, how the sectors’ energy intensity affects the carbon emissions under different development domains of policy making still needs to be explored in Xinjiang. Leaning on the existing research experiences, this paper analyses the influencing factors on carbon emissions, then further decompose energy intensity into sectors’ energy intensity effect and sectors’ economic structure effect. Compared with previous studies [7,38], this study analyzes the effects of population, GDP per capita, energy intensity, energy structure and emission coefficient on carbon emissions under different policies, and discusses the influence of energy intensity on carbon emissions in different sectors. Therefore, it is of great significance to explore the influencing factors of carbon emissions under the different policy background and analyze the impact of sectors’ energy intensity on carbon emissions. Thereby we can determine the technical route of reduction, formulating reduction policies and achieving the emissions reduction target.

2. Data

We used three databases for the decomposition analysis. The emissions coefficients of various fossil fuels come from the 2006 IPCC National Greenhouse Gas Inventories [41] and China Emission Accounts and Datasets [8]. The time series of data is from 1990 to 2016 due to the data available. The data of population, GDP (hundred million yuan), energy consumption and industrial structure are collected from Xinjiang Statistical Yearbook [42]. Based on the criteria for the classification of the national economy, Xinjiang’s national economy was divided into agriculture, industry, construction, transportation, commerce and services. Specifically, the economic data is based on Chinese GDP as the time series and adjusted according to the constant price in 2010 to avoid the effects of inflation.

3. Methodology

3.1. Calculation of Carbon Emissions

According to the 2006 IPCC Guidelines for National Greenhouse Gas Inventories [41], the energy-related carbon emissions can be calculated in accordance with the following Equation (1):
C t = j E t j × L c v j × C f t j × O j
where Ct denotes carbon emissions in the year t, E t j represents the consumption of the fuel j in the year t, and L c v j denotes the lower calorific value of the fuel j, C f t j represents the emissions factors of the fuel j in the year t, and O j represents the oxidation rate of the fuel j. j denotes different fossil energy.

3.2. Kaya Identity

The Kaya identity [43] reveals the relationship between carbon emissions and driving factors. The driving factors include the emission coefficient, energy intensity, GDP per capita and population. The Kaya identity can be expressed as follows:
C = P × G P × E G × C E
where C represents carbon emissions, P denotes population scale, G represents GDP, E denotes energy consumption. In order to better analyze the impact of influencing factors on carbon emissions, it is very significant to add the energy consumption structure as a factor to decomposed carbon emissions. The factor of the energy consumption structure can be expressed as the percentage of fossil energy consumption in the primary energy consumption amount (denoted as FE/E), where EF is the fossil energy consumption. By adding FE/E to the Kaya identity (2), the extended Kaya identity can be written as:
C = P × G P × E G × F E E × C F E = P g j h f
where P represents population scale, g denotes the GDP per capita, j denotes the energy intensity; h represents the percent of fossil energy consumption in the primary energy consumption amount; f denotes the emission coefficient of the fossil fuel.

3.3. Logarithmic Mean Divisia Index (LMDI) Method

General speaking, decomposition analysis is a further extension of Kaya identity. The Logarithmic Mean Divisia Index (LMDI) is a path-independent decomposition method that provides a perfect decomposition process and resolves the problem of retaining an unexplained residual term in the results. In addition, the LMDI method can solve the zero-value problem, and it is more suitable for carbon emissions studies [44,45]. Studies have explored the impact of macroscopic scale socioeconomic factors on carbon emissions by using LMDI decomposition, i.e., energy structure, energy intensity, economic development and population [45,46,47]. The LMDI decomposition method was used in this study to discuss the effects of population, economic development (GDP per capita), energy structure, energy intensity, renewable energy penetration, and emission coefficient. The total change of carbon emissions from the baseline year o to the report year t can be expressed as follows:
ΔC = CtCo = ΔCp + ΔCg + ΔCj + ΔCh + ΔCf
The change of carbon emissions between the base year o and the target year t is denoted as ΔC. The ΔC can be decomposed as the following factors, namely the population effect (denoted by ΔCp), the GDP per capita effect (denoted by ΔCg), the energy intensity effect (denoted by ΔCj), the renewable energy penetration effect (denoted by ΔCh), and the emission coefficient effect (denoted by ΔCf). Based on the LMDI method, the effect of Equation (4) can be expressed as follows:
Δ C p = C t C o L n C t L n C o L n ( P t P o )
Δ C g = C t C o L n C t L n C o L n ( g t g o )
Δ C j = C t C o L n C t L n C o L n ( j t j o )
Δ C h = C t C o L n C t L n C o L n ( h t h o )
Δ C f = C t C o L n C t L n C o L n ( f t f o )

3.4. Decomposition of Energy Intensity Factors

Energy intensity is the key influencing factor to curb carbon emissions, but it is also affected by other factors [48,49]. In order to explore the impact of energy intensity on carbon emissions, we further used the LMDI method to decompose energy consumption intensity, and the decomposition formula is as follows:
j = E / G = i = E i G D P = i E i G D P i × G D P i G D P = i e i × S i
where ei denotes the energy consumption intensity, indicating the sectors’ energy intensity effect; Si denotes the proportion of the added value of the GDP, indicating the effect of the sectors’ economic structure. And i uses 1, 2, 3, 4, 5, and 6 to represent agriculture, industry, transportation, construction, commerce, and service.
Based on the LMDI decomposition method [44,49], the total change of energy intensity can be written as:
Δ j e = i ( E i t E i t 1 L n G D P i t L n G D P i t 1 ) L n ( e i t e i t 1 )
Δ j s = i ( E i t E i t 1 L n G D P i t L n G D P i t 1 ) L n ( S i t S i t 1 )
Proof of perfect in decomposition of this technique is as followed:
Δ j = j t j t 1 = Δ j e + Δ j s = i ( E i t E i t 1 L n G D P i t L n G D P i t 1 ) L n ( e i t e i t 1 ) + i ( E i t E i t 1 L n G D P i t L n G D P i t 1 ) L n ( S i t S i t 1 ) = i ( E i t E i t 1 L n G D P i t L n G D P i t 1 ) [ L n ( e i t e i t 1 ) + L n ( S i t S i t 1 ) ] = i ( E i t E i t 1 L n G D P i t L n G D P i t 1 ) [ L n ( j i t j i t 1 ) ] = i ( j t j t 1 ) = Δ j
where Δ j e and Δ j s denotes the sectors’ energy intensity effect and sectors’ economic structure effect, representing the contribution of sectors’ energy intensity and sectors’ economic structure from the base year o to the target year t, respectively.

4. Results

4.1. Trajectories of Carbon Emissions

Figure 2 shows the trajectories of sectors’ carbon emissions during 1990–2016. The energy-related carbon emissions gradually increased by 7.1 times from 53.86 million tons in 1990 to 436.13 million tons in 2016. From the view of entire study period (1990–2016), the industry’s carbon emissions increased from 22.53 million tons in 1990 to 320.11 million tons in 2016. The industry was the key body of carbon emissions in Xinjiang, which accounted for 63% of annual average carbon emissions.

4.2. Driving Forces of Carbon Emission Changes in Xinjiang

Based on the accessibility of socio-economic data, this study set the starting year for analysis from 1990 to 2016. Learning from the different policies and the history of socio-economic development, the Xinjiang’s history development can be divided into three stages. Namely, the Reform and Opening Up stage (1990–2000), the Western Development Strategy stage (2001–2010), the Counterpart Aid stage (2011–2016). The influencing factors on the carbon emissions were analyzed during 1990–2016.
The driving force of carbon emissions was revealed using the time series LMDI method. Carbon emissions from residents’ living consumption were not considered within this decomposition analysis as they do not have associated GDPs. Aggregated and percentage effects of driving forces for three stages are demonstrated in Figure 3. Results showed that GDP per capita effect (ΔCg) was the main driving factor of carbon emissions increase in Xinjiang, followed by a positive population effect (ΔCp) during 1990–2016. For the period of 1990–2010, energy intensity (ΔCj) showed a negative effect on the carbon emissions growth, while emission coefficient effect (ΔCf) showed a positive impact. In addition, renewable energy penetration effect (ΔCh) played a remarkable role in counteracting the carbon emissions increase during 2011–2016 (Figure 3).
The Reform and Opening Up stage (1990–2000): The GDP per capita effect (ΔCg) was the critical factor for the increase of carbon emissions (Figure 3), that caused an increase of 40.79 million tons (Table 1), accounting for 97.8% of the total carbon emissions changes (ΔCt). The contributing rate of GDP per capita effect (ΔCg) might be closely related to the deepening “Reform and Opening Up” policy, China comprehensively abandoned the centrally planned economy to market-oriented economic reforms, which caused rapid economic growth and huge energy consumption after 1990. In addition, the population effect (ΔCp) and emission coefficient effect (ΔCf) also had a positive impact on carbon emissions, which increased 11.54 and 2.37 million tons of carbon emissions (Table 1), accounting for 27.7% and 5.7% of the total carbon emissions changes (ΔCt), respectively. The energy intensity (ΔCj) had a significant negative effect on carbon emissions, counteracting 20.47 million tons emissions, accounting for −49.1% of the total carbon emissions changes (ΔCt). The renewable energy penetration effect (ΔCh) also had a relatively minor negative effect on carbon emissions, offsetting 0.93 million tons emissions (Table 1).
The Western Development Strategy stage (2001–2010): The GDP per capita effect (ΔCg) remained as the main contributing factor. Table 1 indicates that the ΔCg increased 134.3 million tons of carbon emissions, accounting for 174.7% of the total carbon emissions changes (ΔCt) (Figure 3). The improvement in GDP per capita effect (ΔCg) was closely related to the “Western Development Strategy” policy. Due to the support of preferential policy, Xinjiang relies on the advantages of energy resources to develop energy-intensive industries, socio-economic development grew faster. With the upgrading of energy resources exploration and development, carbon emissions continued to increase. The population effect (ΔCp) and emission coefficient effect (ΔCf) were still have positive effects on carbon emissions, resulting in 20.97 and 28.49 million tons increase, respectively (Table 1). The energy intensity effect (ΔCj) played a key role to offset carbon emissions, counteracting 28.71 million tons (Table 1), accounting for −37.4% of the total carbon emissions changes (ΔCt). Compared to the Reform and Opening Up stage, the energy intensity effect (ΔCj) and renewable energy penetration effect (ΔCh) have declined, it was mainly because of the increase of coal consumption in the energy consumption structure (Figure 3).
The Counterpart Aid stage (2011–2016): A great discovery was found during this stage, the energy intensity effect (ΔCj) changed from negative to positive. The ΔCj played a most important role in contributing carbon emissions growth, resulting in a 122.54 million tons increase, accounting for 45.4% of the total changes (ΔC) in absolute value (Figure 3). The GDP per capita effect (ΔCg) and population effect (ΔCp) were the main positive factors that affected the carbon emissions growth, with an increase of 77.98 and 33.5 million tons (Table 1), which accounted for 28.9% and 12.4% of the total carbon emissions changes (ΔCt) during 2011–2016, respectively. Another significant difference was found that the emission coefficient effect (ΔCf) turned from positive to negative when compared to the Reform and Opening Up stage and the Western Development Strategy stage (Figure 3). The emission coefficient effect (ΔCf) played a vital role to offset carbon emissions, counteracting by 47.75 million tons and accounting for −17.7% of the total carbon emissions changes (ΔCt). Compared to the Reform and Opening Up stage and the Western Development Strategy stage, the renewable energy penetration effect (ΔCh) was the second important factor to offset carbon emissions in this stage. The ΔCh offset 15.89 million tons emissions, and accounting for −5.9% of the total carbon emissions changes (ΔCt) during 2011–2016 (Figure 3). After 2014, Xinjiang has carried out supply-side structural reform to change the economic development pattern and optimize the industrial structure. But, as a result of the slowdown in economic growth, Xinjiang entered into a phase where energy consumption is growing faster than economic growth. In the meantime, the energy consumption structure was optimized. The percentage of renewable energy in energy consumption increased from 5.5% in 2011 to 9.1% in 2016, and the proportion of coal in energy consumption decreased from 67.9% in 2011 to 65.8% in 2016. The adjustment of energy consumption structure has promoted carbon emissions reduction in this stage.

4.3. Driving Forces of Energy Intensity

As noted above, the decline in energy intensity was the most important negative factor for the carbon emissions increase. To explore the factors that influence energy intensity, we used Equations (10–13) to analyze the change of energy intensity during 1990–2016. As shown in Figure 4 and Figure 5, it was found that the contribution rate of the sector’s energy intensity effects was much higher than economic structure effects (Table 2 and Table 3).
In terms of energy intensity, the industry’s energy intensity effects were the main contributor to the decline of entire energy intensity in Xinjiang. The industry’s energy intensity effects has changed from −122.63% in the Reform and Opening Up stage to 173.27% in the Counterpart Aid stage (Table 2), which indicated that the industry’s energy intensity was the key factor for the decline of entire energy intensity in Xinjiang (Figure 4). The transportation’s energy intensity effects were next to the industry. (Table 2). The contribution rate of service and construction’s energy intensity effects were from negative to positive. The agriculture and commerce’s energy intensity effects showed alternately between positive and negative trends (Figure 4). In a word, the agriculture, construction, and commerce’s energy intensity effects have a trend of alternating between positive and negative, and the range of change was relatively small, indicated that those impacts on the decline of energy intensity were very limited in Xinjiang (Figure 4). The transportation and service’s energy intensity effects were negative and decreasing during three stages, which indicated that the change of transportation and service’s energy intensity effects promoted the decline of entire energy intensity to a certain extent. The changes in industry’s energy intensity effects during the three stages indicated that the industry’s energy intensity was the key factor in the decline of the entire energy intensity in Xinjiang (Table 2).
From the perspective of the sector’s economic structure effects, the contribution rate of industry’s economic structure effects had a strong impact on the entire energy intensity. The contribution rate of industry’s economic structure effects has changed from 42.55% in the Reform and Opening Up stage to −90.26% in the Counterpart Aid stage (Table 3) (Figure 5). The contribution rate of transportation’s economic structure effects was also significant. The commerce’s economic structure effects are opposite to that of industry (Table 3). The construction and service’s economic structure effects were positive, but the contribution rates were relatively low (Table 3) (Figure 5). The positive effects of industry’s economic structure form 1990 to 2010 turns to the negative effects during 2011–2016, which showed that with the economic development, the change of the industry’s economic structure was the key factor to the decline of the entire energy intensity in Xinjiang (Figure 5). According to the changing trends of transportation, commerce and service’s economic structure effects, Xinjiang’s energy intensity decreased gradually, which indicated that with the increment of the economic structure in the tertiary industry, Xinjiang’s entire energy intensity has decreased (Figure 5).

5. Discussion

The above analysis revealed the drivers of energy-related carbon emissions at different development stages in Xinjiang. This section will discuss the implications of these findings by investigating drivers.
GDP per capita effect was the main factor of the rapid growth in carbon emissions from 1990 to 2016 [50,51,52]. The rapid economic development has caused an increase in energy demand. This indicated that the rapid increase in energy consumption was the result of economic development [53]. Therefore, efforts must be made to reduce the dependence of economic development on energy consumption. Moreover, the GDP per capita effects on carbon emissions at different stages were much higher than other factors, which revealed that Xinjiang is more focused on economic growth rather than improved economic quality. Therefore, appropriate measures must be taken to promote the quality of development and to seek the balance between economy and environment [54].
Population effect was one of the key drivers for carbon emissions rise during 1990–2016. Xinjiang is not only a border area but also a special region for minority ethnic (especially Uighurs, Mongolian and Kazakh). Since the 1980s, China has implemented the Family Planning policy, while the population policy in minority ethnic regions have more liberal than other areas. With the implementation of Comprehensive Two-Child policy after 2016, it is generally recognized that Xinjiang’s population might grow faster in the future. Therefore, it is foreseeable that the impact of the population on carbon emissions might continually increase. In addition, future population policies should pay more attention to educating citizens to buy low-carbon products and reduce energy consumption in their lives [38].
After 2005, the industry’s carbon emissions continued to increase rapidly. With the support of some preferential policies, the urbanization and industrialization levels have improved rapidly in Xinjiang. [55]. Especially after 2014, Xinjiang was identified as the national energy strategic base. Due to its rich resources, energy-intensive sectors had resource and cost advantages [56]. However, energy-intensive industries have the characteristics of high carbon emissions and high energy consumption [57]. In addition to that, energy demand grew swiftly in the industry, but the energy efficiency was not improved with the development of industry during 2005–2016. This further indicated that the growth of the industry’s output depends on the increase in energy consumption. Therefore, technological improvements in the energy-intensive sectors are the key to realize the low-carbon development in Xinjiang. After 2000, the sector’s economic structure effect has gradually become stronger, which led to the growth of carbon emissions in less developed areas of western China [58]. Based on rich energy resources, the underdeveloped economy has promoted Xinjiang to give priority to the development of energy-intensive industries, such as metal production, supply, smelting, and crushing. The industry was highly dependent on energy-intensive industries, which is not conducive to carbon emissions reduction in Xinjiang. In the meantime, the government should vigorously promote the leading industries from secondary industry to tertiary industry, and through fiscal policies for low-carbon sectors.
According to the existing studies, energy intensity in other provinces showed declining trend and restricted the carbon emissions to increase [59,60,61]. Energy intensity declined in all sectors during 1990–2005, particularly in the industry. This indicated that Xinjiang’s energy efficiency has improved significantly. But the industry’s energy intensity has boosted carbon emissions in recent years. After 2010, local governments increased investment to consolidate the base of economic development in Xinjiang [57]. While large-scale investment has contributed to the rapid development in the industry. But outdated industrial sectors and production processes were also common. So, Xinjiang should increase the investment in improving energy efficiency. The increase in technology investment not only helps to reduce emissions but also promotes the development of enterprises towards low-carbon production [62]. In other words, by adopting advanced technology and increasing investment, carbon emissions can be reduced by the decline of energy intensity [63].
Furthermore, the renewable energy penetration effect was also a constraint to the carbon emissions increase during 1990–2016. Coal consumption has remained at a high level in Xinjiang. Since 2014, Xinjiang has taken a lot of measures to reduce coal consumption, for example replacing coal for heating with natural gas in winter. Although the decline in coal consumption was limited, it still contributes to carbon emission reduction in Xinjiang. Therefore, the coal-based energy structure needs to be changed in the long term. This indicated that reducing coal consumption will be the main strategy for curbing carbon emissions. In addition, Xinjiang is rich in wind and solar energy [64], but the utilization rate is still low. So, the diversification of the energy consumption structure has great potential, which further highlights the increased utilization of wind and solar energy for the exchange of coal consumption in Xinjiang.

6. Conclusions and Recommendations

6.1. Key Findings

The purpose of this paper is to study the driving forces of carbon emissions in Xinjiang. First, we calculated carbon emissions from 1990 to 2016. Then, we utilized the LMDI method to identify the key drivers affecting carbon emissions. The change of carbon emissions was decomposed into five factors: population effect, GDP per capita effect, energy intensity effect, renewable energy penetration effect and emission coefficient effect under different policy stages. Further, we decomposed the influence degree of the sector’s energy intensity and the sectors’ economic structure to the Xinjiang energy intensity. The main conclusions as follows:
(1)
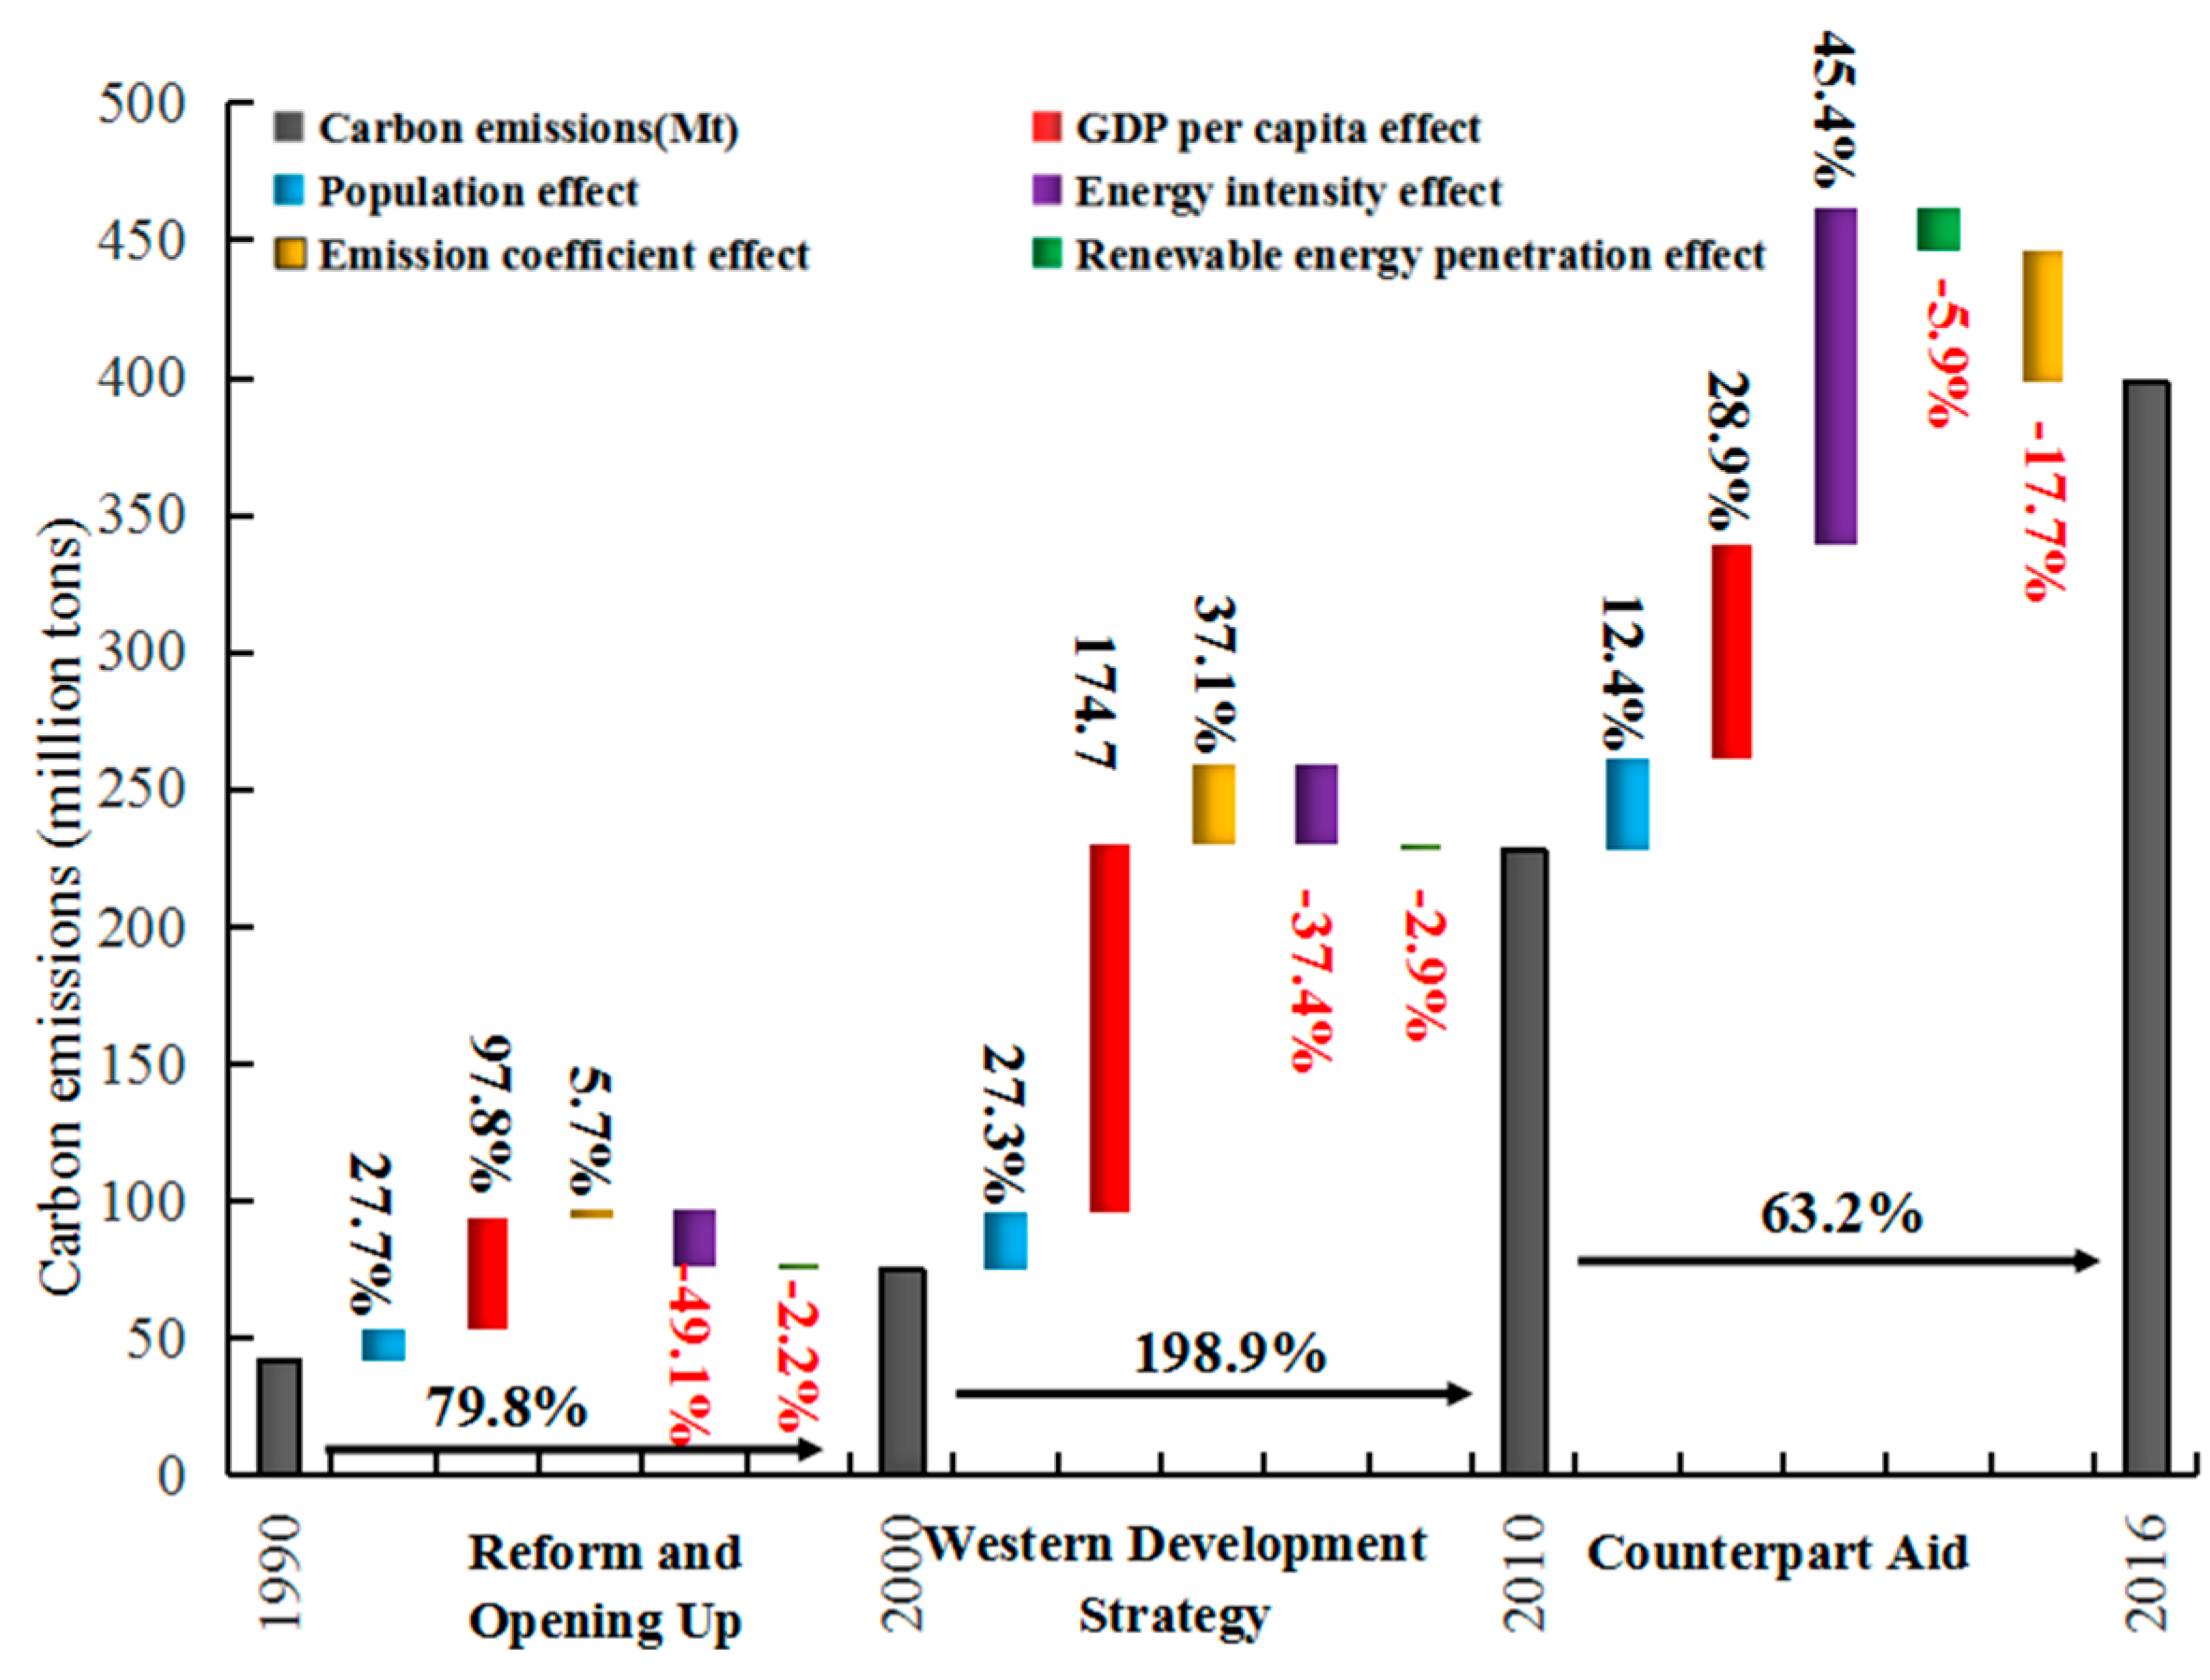
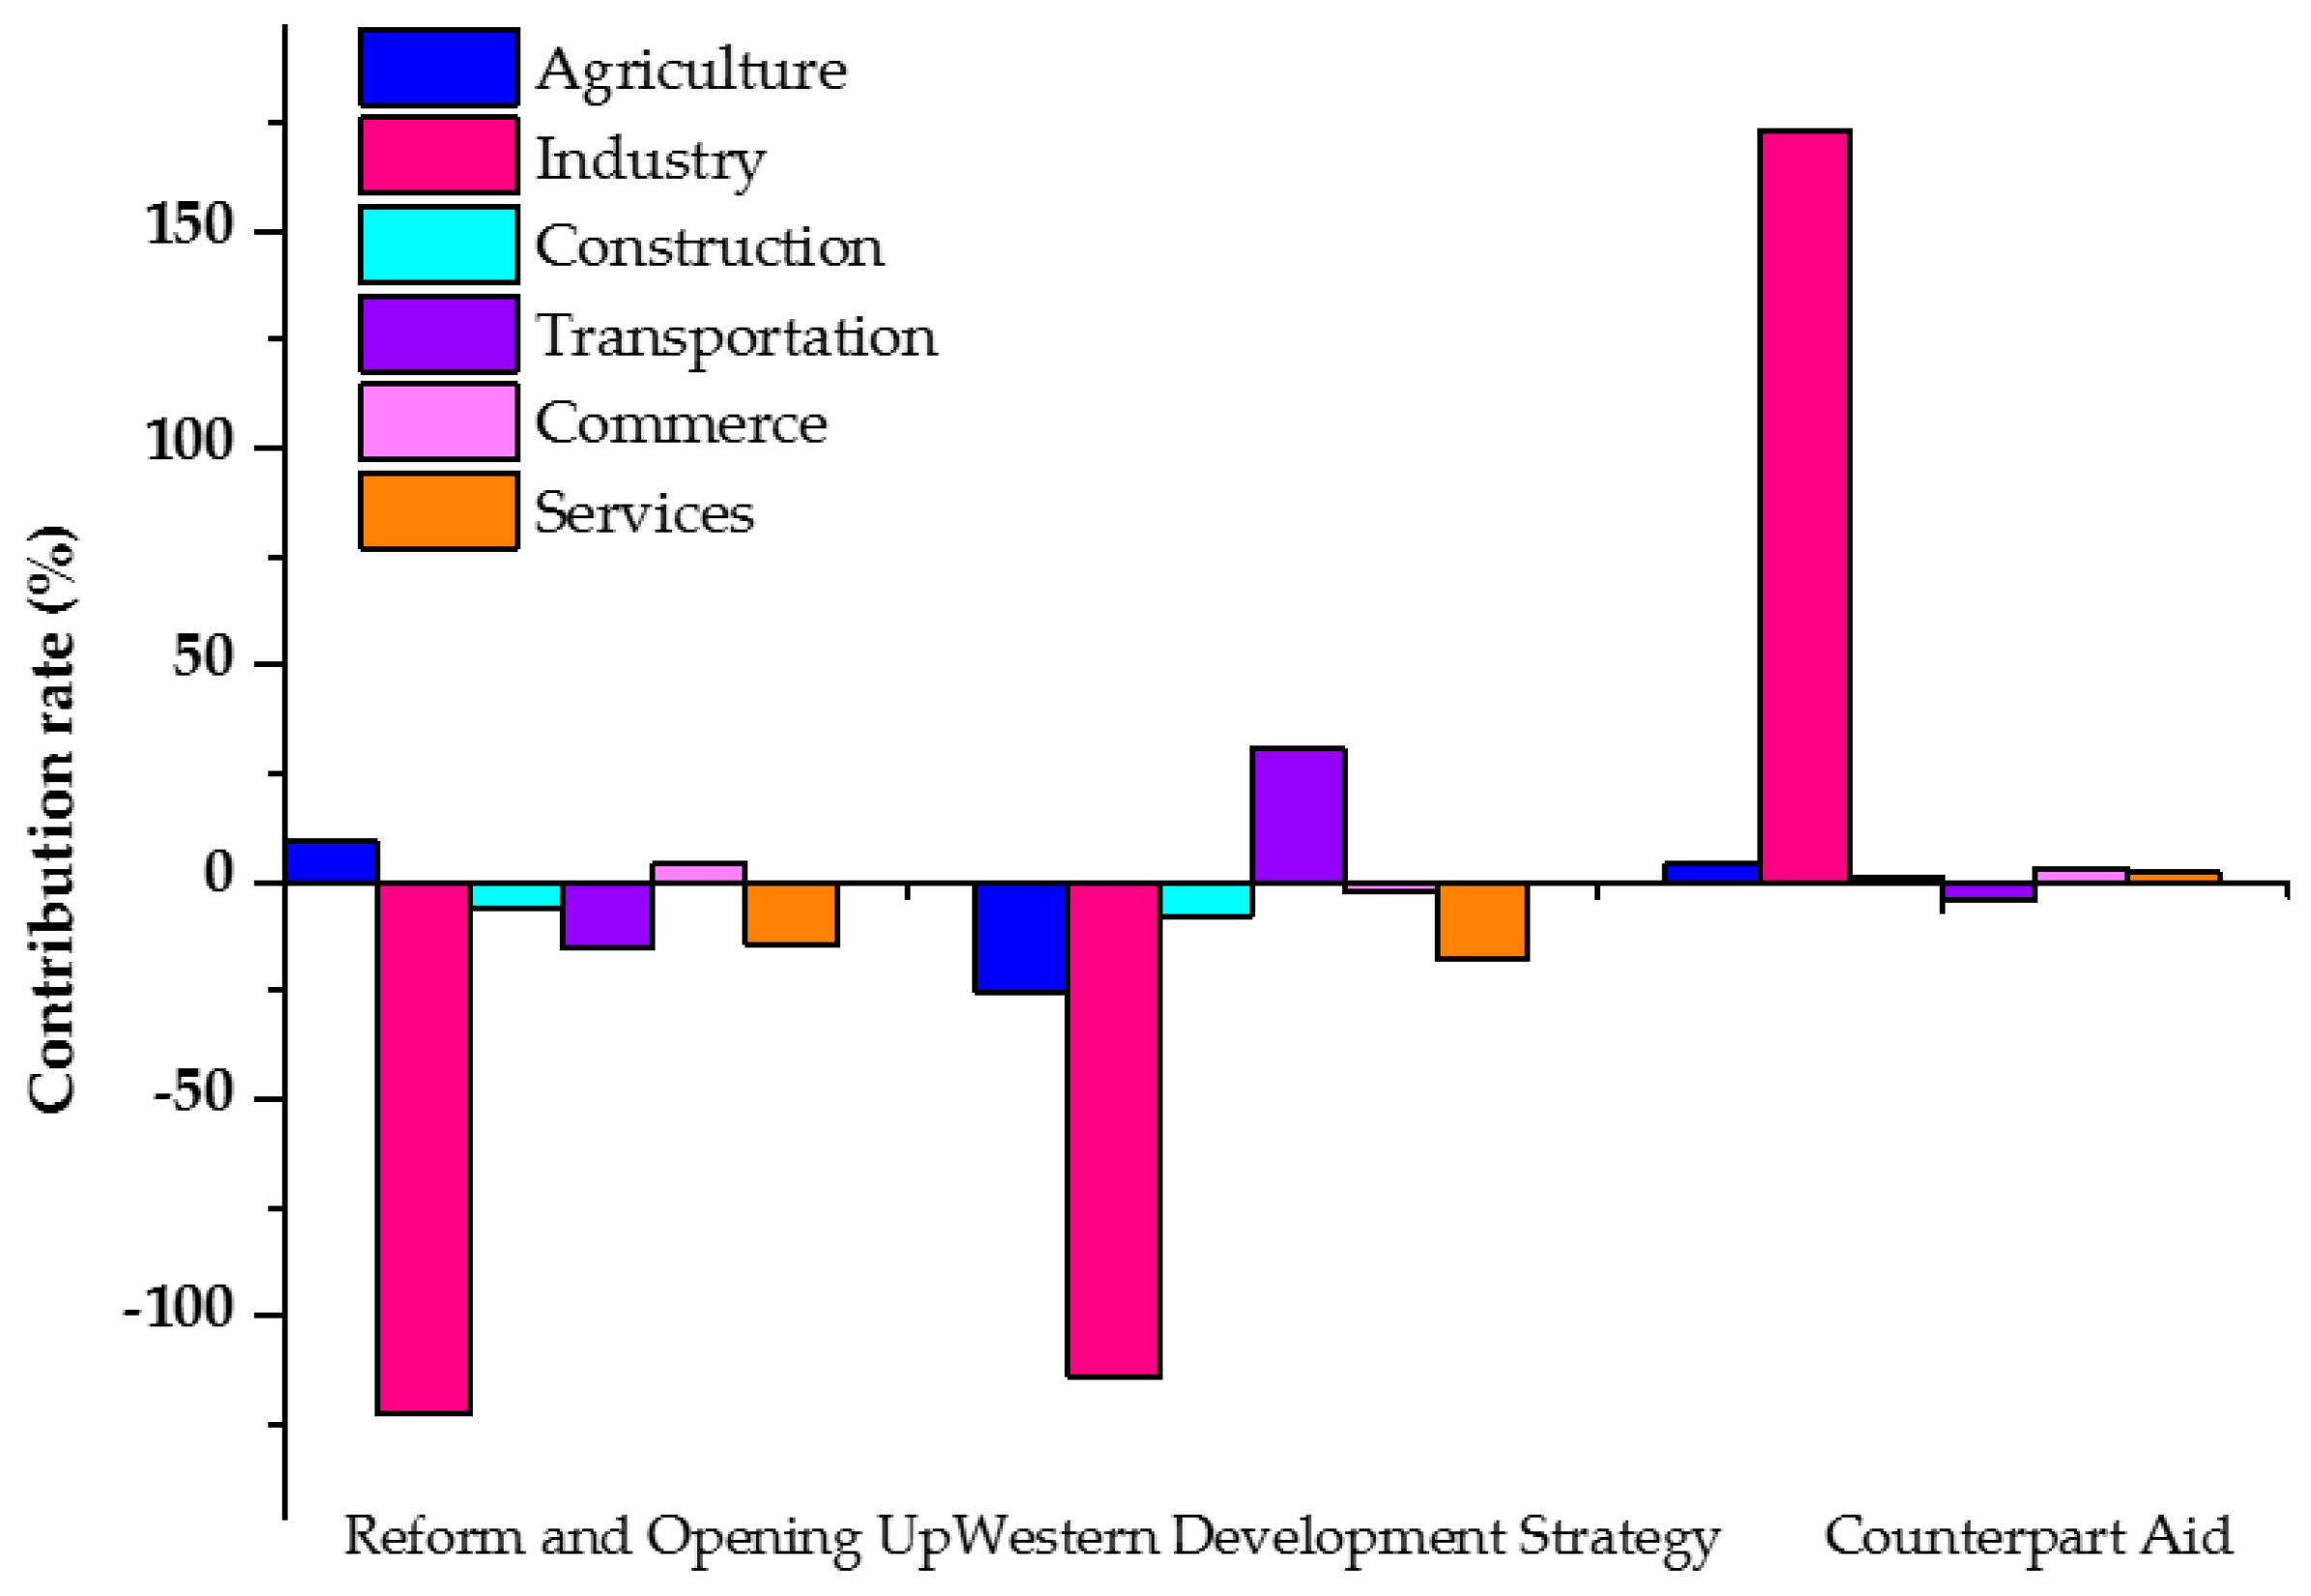
During 1990–2016, the carbon emissions increased continuously from 53.86 million tons in 1990 to 436.13 million tons in 2016. The industry was the main body of carbon emissions in Xinjiang, accounting for 63% of Xinjiang’s annual average carbon emissions. The industry’s energy intensity was significantly higher than that of the other sectors.
(2)
The results of time-series data showed that the GDP per capita effect was the key factor in carbon emissions increase. The cumulative GDP per capita effect increased by 253.07 million tons, accounting for 70.9% of the total increase in carbon emissions during 1990–2016. Energy intensity effect was the key factor to offset the carbon emissions. The effect of renewable energy penetration was relatively small because there had been no fundamental change in the coal-led energy consumption structure.
(3)
Energy intensity effect was the most significant of all inhibiting factors for carbon emissions increase. In terms of the sector’s energy intensity effects, industry played the dominant roles, service had the most marginal influence, and commerce contributed the least. But transportation promoted the carbon emissions increase. During 2011–2016, the Xinjiang energy intensity effect had a positive influence on the carbon emissions increase, which accounted for 45.4% of the total carbon emissions change. After 2011, the industry’s energy intensity was mainly responsible for energy intensity’s positive influence on carbon emissions in Xinjiang. The sector’s economic structure affects only played its role during 2011–2016, indicating that it is necessary to increase efforts to optimize the industrial structure and develop the tertiary industry in the future.

6.2. Policy Implications

Based on the above results, policies and measures are put forward to carbon emissions reductions in Xinjiang.
(1)
Xinjiang should continuously transform the pattern of economic growth through innovative technologies and upgrade the industrial structure. Effective policies (e.g., taxes, subsidies) should be adopted to reduce the energy-intensive industries and phasing out of inefficient productive capacities in the industrial sectors. Moreover, the energy-intensive industries should work with other sectors to form an ecological chain to reduce carbon emissions. Such as, the implementation of a regional cogeneration project can greatly reduce the utilization of small heating boilers.
(2)
Xinjiang should continuously improve energy efficiency and promote utilization rate of clean technologies. Energy-saving technology is the key to the improvement of energy efficiency. The utilization of clean technologies is also an effective way to the decline of energy intensity. Moreover, encouraging rational research activities can play a significant role in abating the corresponding carbon emissions, the research of energy efficiency will lead to the reduction of carbon emissions. In addition to that, the government should adjust the industry’s energy utilization structure by reducing coal consumption, improving the utilization rate of clean coal technology and increasing the utilization of natural gas and electricity.
(3)
Energy diversification and energy restructuring are essential to reduce energy-related carbon emissions in industrial sectors. Xinjiang is also rich in wind and solar energy, which is the basis to optimize its energy consumption structure. The development and distribution of wind and solar energy should be integrated by planning to increase their usage. At the same time, raising the price of fossil fuels can improve the competitiveness of clean energy markets, making space for the development of renewable energy, and gradually move away from the dependence on traditional fossil fuels.

Author Contributions

All authors conceived, designed, and implemented the study. J.Q., G.M., J.D. and H.T. designed and carried out the study. J.Q., C.C. and M.Z. collected and analyzed the data. K.B. improved the expression and grammar. All authors have read and agreed to the published version of the manuscript.

Funding

This research was funded by National Key Research and Development Program of China MOST, grant number 2018FY10050001.

Conflicts of Interest

The authors declare no conflict of interest.

References

  1. IPCC. Climate Change 2013: The Physical Science Basis; Cambridge University Press: Cambridge, MA, USA; New York, NY, USA, 2013. [Google Scholar]
  2. Bong, C.P.C.; Li, Y.L.; Ho, W.S.; Lim, J.S.; Klemeš, J.J.; Towprayoon, S.; Ho, C.S.; Lee, C.T. A review on the global warming potential of cleaner composting and mitigation strategies. J. Clean. Prod. 2017, 146, 149–157. [Google Scholar] [CrossRef]
  3. Liu, D.; Xiao, B. Can China achieve its carbon emission peaking? A scenario analysis based on STIRPAT and system dynamics model. Ecol. Indic. 2018, 93, 647–657. [Google Scholar] [CrossRef]
  4. Tanaka, K.; O’Neill, B.C. The Paris Agreement zero-emissions goal is not always consistent with the 1.5 °C and 2 °C temperature targets. Nat. Clim. Chang. 2018, 8, 319–324. [Google Scholar] [CrossRef]
  5. Rogelj, J.; Fricko, O.; Meinshausen, M.; Krey, V.; Zilliacus, J.J.J.; Riahi, K. Understanding the origin of Paris Agreement emission uncertainties. Nat. Commun. 2017, 8, 15748. [Google Scholar] [CrossRef] [PubMed] [Green Version]
  6. Wu, C.B.; Huang, G.H.; Xin, B.G.; Chen, J.K. Scenario analysis of carbon emissions’ anti-driving effect on Qingdao’s energy structure adjustment with an optimization model, Part I: Carbon emissions peak value prediction. J. Clean. Prod. 2018, 172, 466–474. [Google Scholar] [CrossRef]
  7. Wang, C.J.; Fei, W. Examining the driving factors of energy related carbon emissions using the extended STIRPAT model based on IPAT identity in Xinjiang. Renew. Sustain. Energy Rev. 2017, 67, 51–61. [Google Scholar] [CrossRef]
  8. Shan, Y.; Guan, D.; Zheng, H.; Ou, J.; Li, Y.; Meng, J.; Mi, Z.; Liu, Z.; Zhang, Q. China CO2 emission accounts 1997–2015. Sci. Data 2018, 5, 170201. [Google Scholar] [CrossRef] [PubMed] [Green Version]
  9. Shan, Y.; Guan, D.; Liu, J.; Mi, Z.; Liu, Z.; Liu, J.; Schroeder, H.; Cai, B.; Chen, Y.; Shao, S. Methodology and applications of city level CO2 emission accounts in China. J. Clean. Prod. 2017, 161, 1215–1225. [Google Scholar] [CrossRef] [Green Version]
  10. Mi, Z.; Meng, J.; Guan, D.; Shan, Y.; Song, M.; YM, W.; Liu, Z.; Hubacek, K. Chinese CO2 emission flows have reversed since the global financial crisis. Nat. Commun. 2017, 8, 1712. [Google Scholar] [CrossRef]
  11. Zaman, K.; Moemen, M.A. Energy consumption, carbon dioxide emissions and economic development: Evaluating alternative and plausible environmental hypothesis for sustainable growth. Renew. Sustain. Energy Rev. 2017, 74, 1119–1130. [Google Scholar] [CrossRef]
  12. Shao, S.; Yang, L.; Gan, C.; Cao, J.; Geng, Y.; Guan, D. Using an extended LMDI model to explore techno-economic drivers of energy-related industrial CO2 emission changes: A case study for Shanghai (China). Renew. Sustain. Energy Rev. 2016, 55, 516–536. [Google Scholar] [CrossRef] [Green Version]
  13. Guan, D.; Hubacek, K.; Weber, C.L.; Peters, G.P.; Reiner, D.M. The drivers of Chinese CO2 emissions from 1980 to 2030. Glob. Environ. Chang. 2008, 18, 626–634. [Google Scholar] [CrossRef] [Green Version]
  14. Ke, L.; Lin, B. The improvement gap in energy intensity: Analysis of China’s thirty provincial regions using the improved DEA (data envelopment analysis) model. Energy 2015, 84, 589–599. [Google Scholar]
  15. Al-Mulali, U.; Sheau-Ting, L. Econometric analysis of trade, exports, imports, energy consumption and CO2 emission in six regions. Renew. Sustain. Energy Rev. 2014, 33, 484–498. [Google Scholar] [CrossRef]
  16. Wang, C.; Cai, W.; Lu, X.; Chen, J. CO2 mitigation scenarios in China’s road transport sector. Energy Convers. Manag. 2007, 48, 2110–2118. [Google Scholar] [CrossRef]
  17. Ford, A. Simulation scenarios for rapid reduction in carbon dioxide emissions in the western electricity system. Energy Policy 2008, 36, 443–455. [Google Scholar] [CrossRef]
  18. Henrigues, M.F.; Dantas, F.; Schaeffer, R. Potential for reduction of CO2 emissions and a low-carbon scenario for the Brazilian industrial sector. Energy Policy 2010, 38, 1946–1961. [Google Scholar] [CrossRef]
  19. Ross, M. Regional Implications of National Carbon Taxes. Clim. Chang. Econ. 2018, 9, 1840008. [Google Scholar] [CrossRef]
  20. Haites, E. Carbon taxes and greenhouse gas emissions trading systems: What have we learned? Clim. Policy 2018, 18, 955–966. [Google Scholar] [CrossRef] [Green Version]
  21. Leimbach, M. Equity and carbon emissions trading: A model analysis. Energy Policy 2003, 31, 1033–1044. [Google Scholar] [CrossRef]
  22. Ermolieva, T.; Ermoliev, Y.; Fischer, G.; Jonas, M.; Makowski, M.; Wagner, F. Carbon emission trading and carbon taxes under uncertainties. Clim. Chang. 2010, 103, 277–289. [Google Scholar] [CrossRef]
  23. Al-Mulali, U.; Lee, J.Y.; Mohammed, A.H.; Sheau-Ting, L. Examining the link between energy consumption, carbon dioxide emission, and economic growth in Latin America and the Caribbean. Renew. Sustain. Energy Rev. 2013, 26, 42–48. [Google Scholar] [CrossRef]
  24. Zheng, Y.; Luo, D. Industrial structure and oil consumption growth path of China: Empirical evidence. Energy 2013, 57, 336–343. [Google Scholar] [CrossRef]
  25. Wang, C.; Chen, J.; Ji, Z. Decomposition of energy-related CO2 emission in China: 1957–2000. Energy 2005, 30, 73–83. [Google Scholar] [CrossRef]
  26. Saidi, K.; Mbarek, M.B. The impact of income, trade, urbanization, and financial development on CO2 emissions in 19 emerging economies. Environ. Sci. Pollut. Res. Int. 2017, 24, 12748–12757. [Google Scholar] [CrossRef] [PubMed]
  27. Wang, C.J.; Zhang, X.L.; Wang, F. Decomposition of energy-related carbon emissions in Xinjiang and relative mitigation policy recommendations. Front. Earth Sci. 2015, 9, 65–76. [Google Scholar] [CrossRef]
  28. Yang, Y.; Kong, Q. Analysis on the influencing factors of carbon emissions from energy consumption in China based on LMDI method. Nat. Hazards 2017, 88, 1691–1707. [Google Scholar]
  29. Li, H.; Mu, H.; Zhang, M.; Li, N. Analysis on influence factors of China’s CO emissions based on Path–STIRPAT model. Energy Policy 2011, 39, 6906–6911. [Google Scholar] [CrossRef]
  30. Feng, K.; Hubacek, K.; Guan, D. Lifestyles, technology and CO2 emissions in China: A regional comparative analysis. Ecol. Econ. 2009, 69, 145–154. [Google Scholar] [CrossRef]
  31. Zhang, Y. Structural decomposition analysis of sources of decarbonizing economic development in China; 1992–2006. Ecol. Econ. 2012, 68, 2399–2405. [Google Scholar] [CrossRef]
  32. Xu, S.-C.; He, Z.-X.; Long, R.-Y. Factors that influence carbon emissions due to energy consumption in China: Decomposition analysis using LMDI. Appl. Energy 2014, 127, 182–193. [Google Scholar] [CrossRef]
  33. Shan, Y.; Liu, J.; Liu, Z.; Xu, X.; Shao, S.; Wang, P.; Guan, D. New provincial CO2 emission inventories in China based on apparent energy consumption data and updated emission factors. Appl. Energy 2016, 184, 742–750. [Google Scholar] [CrossRef] [Green Version]
  34. Feng, K.; Hubacek, K.; Sun, L.; Liu, Z. Consumption-based CO2 accounting of China’s megacities: The case of Beijing, Tianjin, Shanghai and Chongqing. Ecol. Indic. 2014, 47, 26–31. [Google Scholar] [CrossRef]
  35. Wang, Z.; Yin, F.; Zhang, Y.; Zhang, X. An empirical research on the influencing factors of regional CO2 emissions: Evidence from Beijing city, China. Appl. Energy 2012, 100, 277–284. [Google Scholar] [CrossRef]
  36. Wang, S.; Fang, C.; Guan, X.; Pang, B.; Ma, H. Urbanisation, energy consumption, and carbon dioxide emissions in China: A panel data analysis of China’s provinces. Appl. Energy 2014, 136, 738–749. [Google Scholar] [CrossRef]
  37. Jiang, J.; Ye, B.; Xie, D.; Tang, J. Provincial-level carbon emission drivers and emission reduction strategies in China: Combining multi-layer LMDI decomposition with hierarchical clustering. J. Clean. Prod. 2017, 169, 178–190. [Google Scholar] [CrossRef]
  38. Guo, B.; Yong, G.; Dong, H.; Liu, Y. Energy-related greenhouse gas emission features in China’s energy supply region: The case of Xinjiang. Renew. Sustain. Energy Rev. 2016, 54, 15–24. [Google Scholar] [CrossRef]
  39. Qin, J.; Tao, H.; Zhan, M.; Munir, Q.; Brindha, K.; Mu, G. Scenario Analysis of Carbon Emissions in the Energy Base, Xinjiang Autonomous Region, China. Sustainability 2019, 11, 4220. [Google Scholar] [CrossRef] [Green Version]
  40. Shen, L.; Lou, Y.; Huang, Y.; Chen, J. A driving–driven perspective on the key carbon emission sectors in China. Nat. Hazards 2018, 93, 349–374. [Google Scholar] [CrossRef]
  41. IPCC. IPCC Guidelines for National Greenhouse Gas Inventories; Institute for Global Environmental Strategies Press: Kanagawa, Japan, 2006. [Google Scholar]
  42. Xinjiang Bureau of Statistics. Xinjiang Statistical Yearbook 1991–2017; Peking Info. Press: Beijing, China, 2017. (In Chinese) [Google Scholar]
  43. Kaya, Y. Impact of Carbon Dioxide Emission Control on GNP Growth: Interpretation of Proposed Scenarios; Oxford University Press: London, UK, 1990. [Google Scholar]
  44. Ang, B.W. The LMDI approach to decomposition analysis: A practical guide. Energy Policy 2005, 33, 867–871. [Google Scholar] [CrossRef]
  45. Ang, B.W. Decomposition analysis for policymaking in energy: Which is the preferred method? Energy Policy 2004, 32, 1131–1139. [Google Scholar] [CrossRef]
  46. Mahony, T.O. Decomposition of Ireland’s carbon emissions from 1990 to 2010: An extended Kaya identity. Energy Policy 2013, 59, 573–581. [Google Scholar] [CrossRef] [Green Version]
  47. Wang, M.; Feng, C. Decomposing the change in energy consumption in China’s nonferrous metal industry: An empirical analysis based on the LMDI method. Renew. Sustain. Energy Rev. 2018, 82, 2652–2663. [Google Scholar] [CrossRef]
  48. Ma, C.; Stern, D.I. China’s changing energy intensity trend: A decomposition analysis. Energy Econ. 2008, 30, 1037–1053. [Google Scholar] [CrossRef] [Green Version]
  49. Qiang, W.; Li, R. Journey to burning half of global coal: Trajectory and drivers of China׳s coal use. Renew. Sustain. Energy Rev. 2016, 58, 341–346. [Google Scholar]
  50. Sadorsky, P. The impact of financial development on energy consumption in emerging economies. Energy Policy 2010, 38, 2528–2535. [Google Scholar] [CrossRef]
  51. Ntanos, S.; Skordoulis, M.; Kyriakopoulos, G.; Arabatzis, G.; Chalikias, M.; Galatsidas, S.; Batzios, A.; Katsarou, A. Renewable Energy and Economic Growth: Evidence from European Countries. Sustainability 2018, 10, 2626. [Google Scholar] [CrossRef] [Green Version]
  52. Fang, Y. Economic welfare impacts from renewable energy consumption: The China experience. Renew. Sustain. Energy Rev. 2011, 15, 5120–5128. [Google Scholar] [CrossRef]
  53. Yang, Z.; Liu, Y. Does population have a larger impact on carbon dioxide emissions than income? Evidence from a cross-regional panel analysis in China. Appl. Energy 2016, 180, 800–809. [Google Scholar]
  54. Tan, Y.; Shuai, C.; Jiao, L.; Shen, L. An adaptive neuro-fuzzy inference system (ANFIS) approach for measuring country sustainability performance. Environ. Impact Assess. Rev. 2017, 65, 29–40. [Google Scholar] [CrossRef]
  55. Wang, C.; Wang, F.; Zhang, X.; Zhang, H. Influencing mechanism of energy-related carbon emissions in Xinjiang based on IO-SDA model. J. Geogr. Sci. 2016, 71, 1105–1118. [Google Scholar]
  56. Huo, J.; Yang, D.; Zhang, W.; Fei, W.; Wang, G.; Qian, F. Analysis of influencing factors of CO2 emissions in Xinjiang under the context of different policies. Environ. Sci. Policy 2015, 45, 20–29. [Google Scholar] [CrossRef]
  57. Zhang, X.; Zhao, Y.; Wang, C.; Fei, W.; Qiu, F. Decoupling effect and sectoral attribution analysis of industrial energyrelated carbon emissions in Xinjiang, China. Ecol. Indic. 2019, 97, 1–9. [Google Scholar] [CrossRef]
  58. Du, K.; Xie, C.; Ouyang, X. A comparison of carbon dioxide (CO2) emission trends among provinces in China. Renew. Sustain. Energy Rev. 2017, 73, 19–25. [Google Scholar] [CrossRef] [Green Version]
  59. Li, Q.; Wei, Y.N.; Dong, Y. Coupling analysis of China’s urbanization and carbon emissions: Example from Hubei Province. Nat. Hazards 2016, 81, 1333–1348. [Google Scholar] [CrossRef]
  60. Lu, Q.; Hong, Y.; Huang, X.; Chuai, X.; Wu, C. Multi-sectoral decomposition in decoupling industrial growth from carbon emissions in the developed Jiangsu Province, China. Energy 2015, 82, 414–425. [Google Scholar] [CrossRef]
  61. Song, M.; Xu, G.; Wu, K.; Wang, G. Driving effect analysis of energy-consumption carbon emissions in the Yangtze River Delta region. J. Clean. Prod. 2015, 103, 620–628. [Google Scholar] [CrossRef]
  62. Brizga, J.; Feng, K.; Huback, K. Drivers of greenhouse gas emissions in the Baltic States: A structural decomposition analysis. Ecol. Econ. 2014, 98, 22–28. [Google Scholar] [CrossRef]
  63. Wang, Z.H.; Zeng, H.L.; Wei, Y.M.; Zhang, Y.X. Regional total factor energy efficiency: An empirical analysis of industrial sector in China. Appl. Energy 2012, 97, 115–123. [Google Scholar] [CrossRef]
  64. Fan, X.C.; Wang, W.Q.; Shi, R.J.; Cheng, Z.J. Hybrid pluripotent coupling system with wind and photovoltaic-hydrogen energy storage and the coal chemical industry in Hami, Xinjiang. Renew. Sustain. Energy Rev. 2017, 72, 950–960. [Google Scholar] [CrossRef]
Figure 1. The location of the study area.
Sustainability 12 01089 g001
Figure 2. Total carbon emission changes in Xinjiang during 1990–2016.
Sustainability 12 01089 g002
Figure 3. Decomposition of carbon emissions changes in Xinjiang during 1990–2016.
Sustainability 12 01089 g003
Figure 4. Sector’s energy intensity effect in Xinjiang’s energy intensity during 1990–2016.
Sustainability 12 01089 g004
Figure 5. Sector’s economic structure effect in Xinjiang’s energy intensity during 1990–2016.
Sustainability 12 01089 g005
Table 1. Decomposition of carbon emissions changes in Xinjiang during the three stages.
Parameter/VariablesReform and Opening UpWestern Development StrategyCounterpart Aid
Population effect11.5420.9733.5
GDP per capita effect40.79134.377.98
Energy intensity effect−20.47−28.71122.54
Renewable energy penetration effect−0.93−2.19−15.89
Emission coefficient effect2.3728.49−47.75
Total changes33.31152.86170.39
Note: The unit is million tons.
Table 2. Contribution of the sector’s energy intensity effect for Xinjiang’s energy intensity in the three stages.
SectorsReform and Opening UpWestern Development StrategyCounterpart Aid
Emissions (million tons)Percent (%)Emissions (million tons)Percent (%)Emissions (million tons)Percent (%)
Agriculture1.939.44−7.29−25.375.184.23
Industry−25.10−122.63−32.70−113.89212.33173.27
Construction−1.23−6.03−2.24−7.811.140.93
Transportation−3.03−14.798.8330.74−5.04−4.11
Commerce0.864.19−0.63−2.194.023.28
Services−2.91−14.23−5.08−17.692.882.35
Table 3. Contribution of the sector’s economic structure effect for Xinjiang’s energy intensity in the three stages.
SectorsReform and Opening UpWestern Development StrategyCounterpart Aid
Emissions
(million tons)
Percent
(%)
Emissions
(million tons)
Percent
(%)
Emissions
(million tons)
Percent
(%)
Agriculture−2.79−13.650.090.30−2.02−1.65
Industry8.7142.5523.0580.26−110.61−90.26
Construction0.803.90−0.20−0.701.361.11
Transportation1.949.46−10.62−36.999.257.55
Commerce−0.36−1.77−2.30−8.021.241.01
Services0.733.550.391.372.792.28

