Environmental Collaborative Governance Degree of Government, Corporation, and Public

1
College of Public Administration, Central China Normal University, Wuhan 430079, China
2
School of Management, Harbin Institute of Technology, Harbin 150001, China
3
School of Humanities, Social Sciences & Law, Harbin Institute of Technology, Harbin 15001, China
4
School of Public Administration and Law, Northeast Agricultural University, Harbin 150030, China
*
Author to whom correspondence should be addressed.
Sustainability 2020, 12(3), 1138; https://0-doi-org.brum.beds.ac.uk/10.3390/su12031138
Submission received: 8 December 2019
/
Revised: 14 January 2020
/
Accepted: 31 January 2020
/
Published: 5 February 2020
Abstract
:The Chinese government has attached great importance to environmental collaborative governance recently to cope with rising pollution problems. How to measure environmental collaborative governance degree is a key issue to evaluate the level and progress of the implementation of this great ambition. This paper designs an index system for measuring environmental collaborative governance degree, covering dimensions of government, corporation and the public. The entropy method is applied to measure the change of environmental governance capacity. The coupling coordination model is adapted to evaluate the environmental collaborative governance degree of government–corporation–public. Empirical analysis is conducted by using the panel data of 30 provinces of China for the years 2006–2015. The results are provided and discussed from various dimensions. Suggestions are put forward accordingly. This paper focuses on developing a method for measuring environmental collaborative governance degree and is meaningful for enlightening future research about the effect of collaboration on environmental governance.
1. Introduction
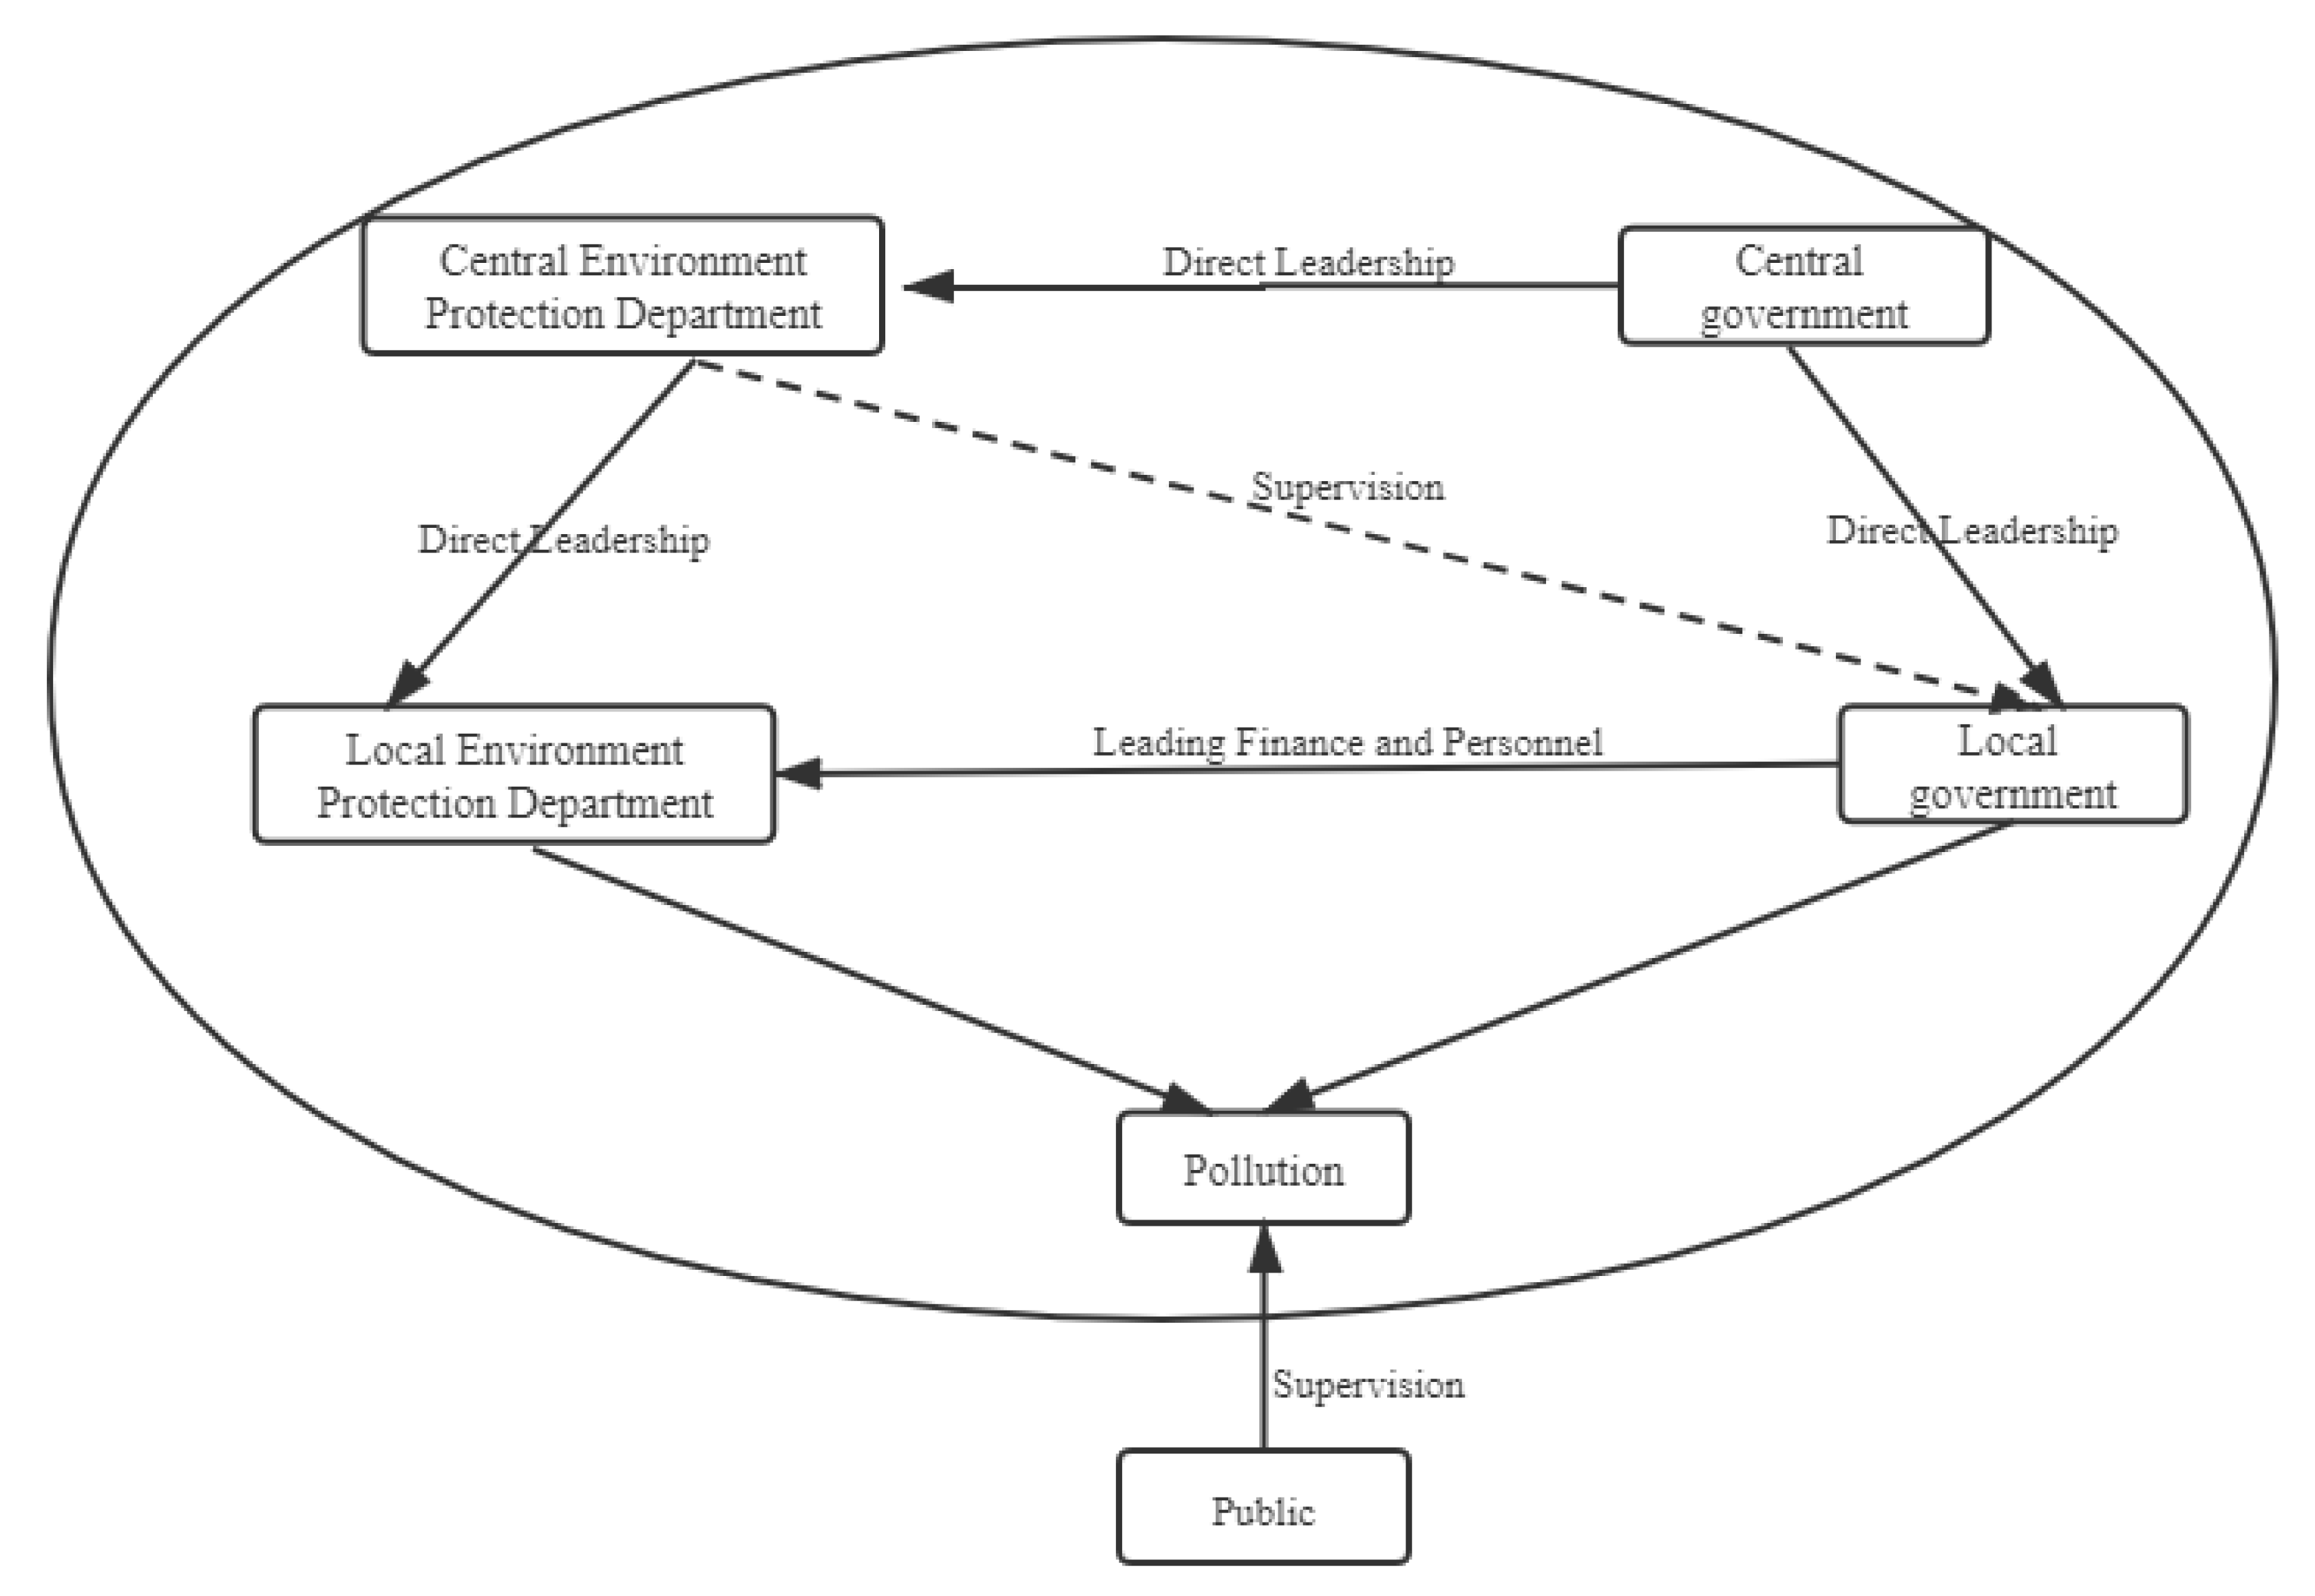
Environmental governance has been given great importance due to the increasing serious pollution problems in China [1,2]. Since the 1970s, China’s environmental governance system has established and finally formed the hierarchical governance by longitudinal and transverse subsectors, namely “vertical and regional” dual leadership system (see Figure 1) [1,2,3,4,5]. It is a government-led environmental governance system. The higher environmental protection department implements professional leadership over lower ones. That is the “vertical governance”. At the same time, local government is responsible for the local environment, supervising local environmental investment and manning quotas of local environmental protection departments; namely, the “regional governance” [6,7,8]. On the one hand, the local environmental protection departments have to accept the direct leadership of the higher department. On the other hand, local governments managed the personnel and finance of the local environmental protection departments (see Figure 1). In view of this environmental governance system, many studies have analyzed the institutional changes, effect evaluations as well as the existing problems of this environmental governance system [6,7,8,9,10,11,12,13]. It is understandable that the profits of local governments and environmental protection departments at different levels are sometimes at conflict. This situation results in commissioned-agent relationship and various constrains on local environmental protection departments.
With time going by, in order to cope with rising pollution difficulties at the root level, the Chinese government has devoted itself to environmental collaborative governance recently. The latest national congress of the Communist Party of China (CPC) explicitly proposed that China should establish an environmental governance system with “government as the leader, and corporations and the public as main participants” [14]. The new approach is based on understanding that environmental issue cannot be solved by a single body, and it needs the alliance of government, corporations, and the public to build a collaborative governance pattern [15,16]. Firstly, the government is always a leader in China’s environmental governance, it plays a dominant role in China’s environmental governance system. Secondly, the corporation is the main producer of environmental pollution, which should take more environmental responsibility [17,18,19]. Research on corporation environmental governance has focused on analyzing the impact of environmental regulation on corporate technological innovation, industrial competitiveness, and business performance [20,21,22,23,24]. These all require some amount of environmental investment. Thirdly, mass events and environmental petitions happened in the past decades because the rise of public environment awareness has started to play a key roles [12,13,15,25]. Many previous studies showed that public environmental awareness and environmental participation can effectively promote local governmental governance [8,26]. Especially, under the background of the development of technology and the popularity of new media, the effect of public participation in environmental governance via new media is significantly more effective than the traditional petition channel [18,27,28,29]. Thus, public participation of environmental governance is likely to be an irreversible trend.
Based on the existing research findings, it has been recognized that it is necessary to systematically integrate the multi-actor system of environmental governance, involving in government, corporation, and the public, to create a collaborative effect. However, there are few studies on the collaboration of the government, corporation, and public on ecological environment. This paper is thus devoted to meet the challenge via the perspective of a multi-actor system.
The collaborative environmental governance of government–corporation–public is a kind of system integration of multi-actors in environmental governance, which is to give full play to their advantages. It is able to better achieve the goal because the overall effect could be greater than the sum of the parts. Under the environmental collaborative governance, the government plays the leading role by issuing environmental policies and statutes towards corporations and the public [5,6,12,13]. The corporation is an important part in the environmental collaborative governance [25,30]. Based on the incentive theory [31], it is important to encourage corporations to increase their investment in environmental governance through a host of environmental regulations such as collecting pollution discharge fees, environmental tax, and so forth [32]. In addition, due to the tendency of only chasing for Gross Domestic Product (GDP) increase in the assessment on local government officials in China [33,34,35], local governments often have the attitude of “free riding” in environmental governance, which leads to the “prisoner’s dilemma” [36]. Therefore, public participation is important for curing government failure in environmental governance [4]. It makes the exercising of the government’s power more transparent. This is a new requirement emphasized in the 17th National Congress of CPC to conform to the requirements of the new times [37].
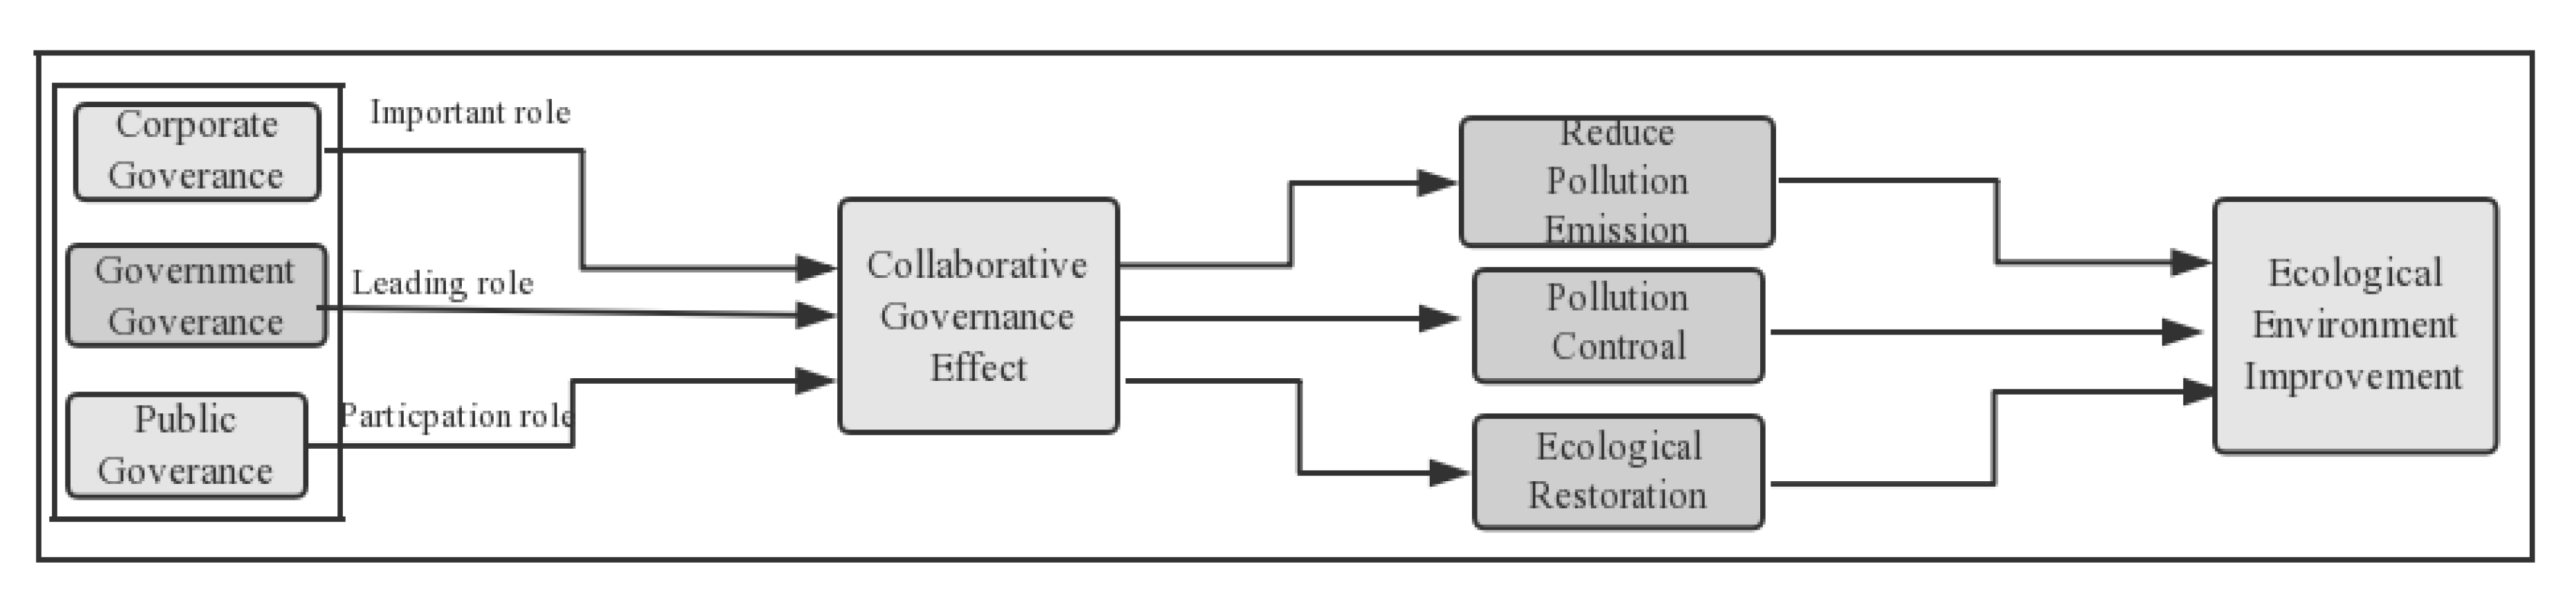
Environmental governance generally covers addressing pollution and preventive emission reduction at the ending [38,39,40]. Considering that nature has the ability to repair itself [41,42,43,44], measures of environmental governance can also help in some adaptations; for example, afforestation and returning farmland to forests and lakes to enhance the self-repair capacity of the ecosystem. To sum up, the utility mechanism of environmental collaborative governance can be briefly illustrated as shown in Figure 2. How to measure environmental collaborative governance degree is a key issue to evaluate the level and progress of the implementation of this great ambition. This paper tries to design an index system for measuring environmental collaborative governance degree, which is inclusive of dimensions of government, corporation, and the public.
The rest of this paper goes as follows. It first introduces the methodology and models. Next, it conducts empirical analysis. Then the paper provides results analysis. After that, it discusses the result. In the end, it makes conclusions and gives future research implications.
2. Methodology
2.1. Index System Design
So far, there are a large number of indirect references about government–corporation–public environmental governance [45,46,47,48], which inspired the index system design in this paper. From the perspective of government, according to the priors, it can be found that since the administrative evaluation of local governments by Chinese higher authorities in the past decades has been mainly based on GDP, local government officials are more likely to be promoted if the rate of the local economic development is increased faster. Local governments often start working on the environment regulation after environmental pollution has occurred. Moreover, the Chinese government mainly invests in environmental governance funds, environmental governance manpower, and the introduction of corresponding regulations for environmental governance [49,50,51]. Based on the scientific and operable index system and further refinement [52,53], the governmental environmental governance system is measured by choosing 12 indexes [54,55,56,57], including issued local laws and regulations, local rules, personnel, and funds (see Table 1).
Secondly, it is clear that the corporations are the major source of environmental pollution and an important subject of pollution control [58]. In fact, corporate environmental pollution mainly involves four major aspects: wastewater pollution, exhaust gas pollution, solid waste pollution, and noise pollution. When facing environmental pollution, corporations mainly invest corresponding funds to reduce the pollution generated during their production and business operations [59,60]. Accordingly, the corporate environmental governance system is measured in this paper by four indicators, including amount of investment in wastewater, waste gas, solid waste, and noise.
Thirdly, for the public, they are more in a supervisory role in China’s environmental pollution governance system. They use environmental letters, visits, the National People’s Congress (NPC) and the Chinese People’s Political Consultative Conference (CPPCC) to reflect the environmental pollution problem to the government. Namely, the main ways for the public to take part in environment governance in China is surveillance on environmental pollution and expressing their environmental concerns to the corresponding governmental sectors [48,61]. Thereby, this paper chooses the number of environmental petitions, personnel of environmental petition, the number of environmental proposals expressed in NPC and the CPPCC to analyze the public environmental governance system (see Table 1). The data of all indicators are collected from the China Statistical Yearbook (2007–2016), the China Environmental Yearbook (2007–2016), and regional statistical bulletins.
2.2. Evaluation Model
The collaboration of government–corporation–public for environmental governance can be understood as a kind of coupling coordination. Tang (2015) analyzed the coupling coordination level between tourism and ecological environment [62]. Liao et al. (2018) studied the coupling coordination between tourism destination finance and tourism industry level [63]. These papers indicate that the calculation of coupling coordination model mainly consists of two core parts: level of variables should be calculated first, and then, the coordination degree between variables is calculated. By referring to these studies, the specific calculation process of coupling coordination model of environmental collaborative governance is as follows:
First of all, the original data needs to be standardized by Formulas (1) and (2) to eliminate the influence of dimension, magnitude, and positive and negative orientation.
Positive indicator:
Negative indicator:
In the above formulas, the Xij denotes the sample value; and respectively denote the maximum and minimum values in the sample data.
Then, the entropy method is used to calculate the level of governmental environmental governance. Formulas (3)–(6) are applied to calculate the weight of each index.
The proportion of the indicator j in year i:
Information entropy of the indicator:
Entropy redundancy:
Weight of the indicator:
After using Formulas (1) and (2) to calculate the standardized value of each indicator, Formulas (3)–(6) can get the weight of each indicator, and Formulas (7) and (8) can evaluate the level of governmental environmental governance in each year.
Evaluation of a single indicator:
Comprehensive level in year i:
The calculation method and process of the environmental governance level of corporation and the public are similar to that of the government, so they are not repeated here.
2.3. Measurement of Environmental Collaborative Governance Degree
By referring to literature [64], the calculation formula of the environmental collaborative governance degree of the government–corporation–public can be obtained as:
where , , respectively denote the level of environmental governance of government, corporation, and the public.
However, a higher coordination degree can also be gained if the three subsystems are at a lower level. Thereby, Formula (9) needs to be modified to avoid such defect. So, the following formulas are adopted:
where c means the collaboration between the three subsystems, t means the comprehensive level of the three subsystems, and d represents the collaboration degree between the three systems. α, ε, and η indicate weights, showing the relative importance of each subsystem. Since the government plays a dominant role in the environmental collaborative governance, this paper assumed α = 1/2, ε = 1/4, η = 1/4.
3. Results
In order to empirically analyze the environmental collaborative governance in different regions of China, the paper divides China’s 30 provinces into four regions in line with convention based on economic and social development, namely Eastern China, Northeastern China, Inner China, and Western China [34,64].
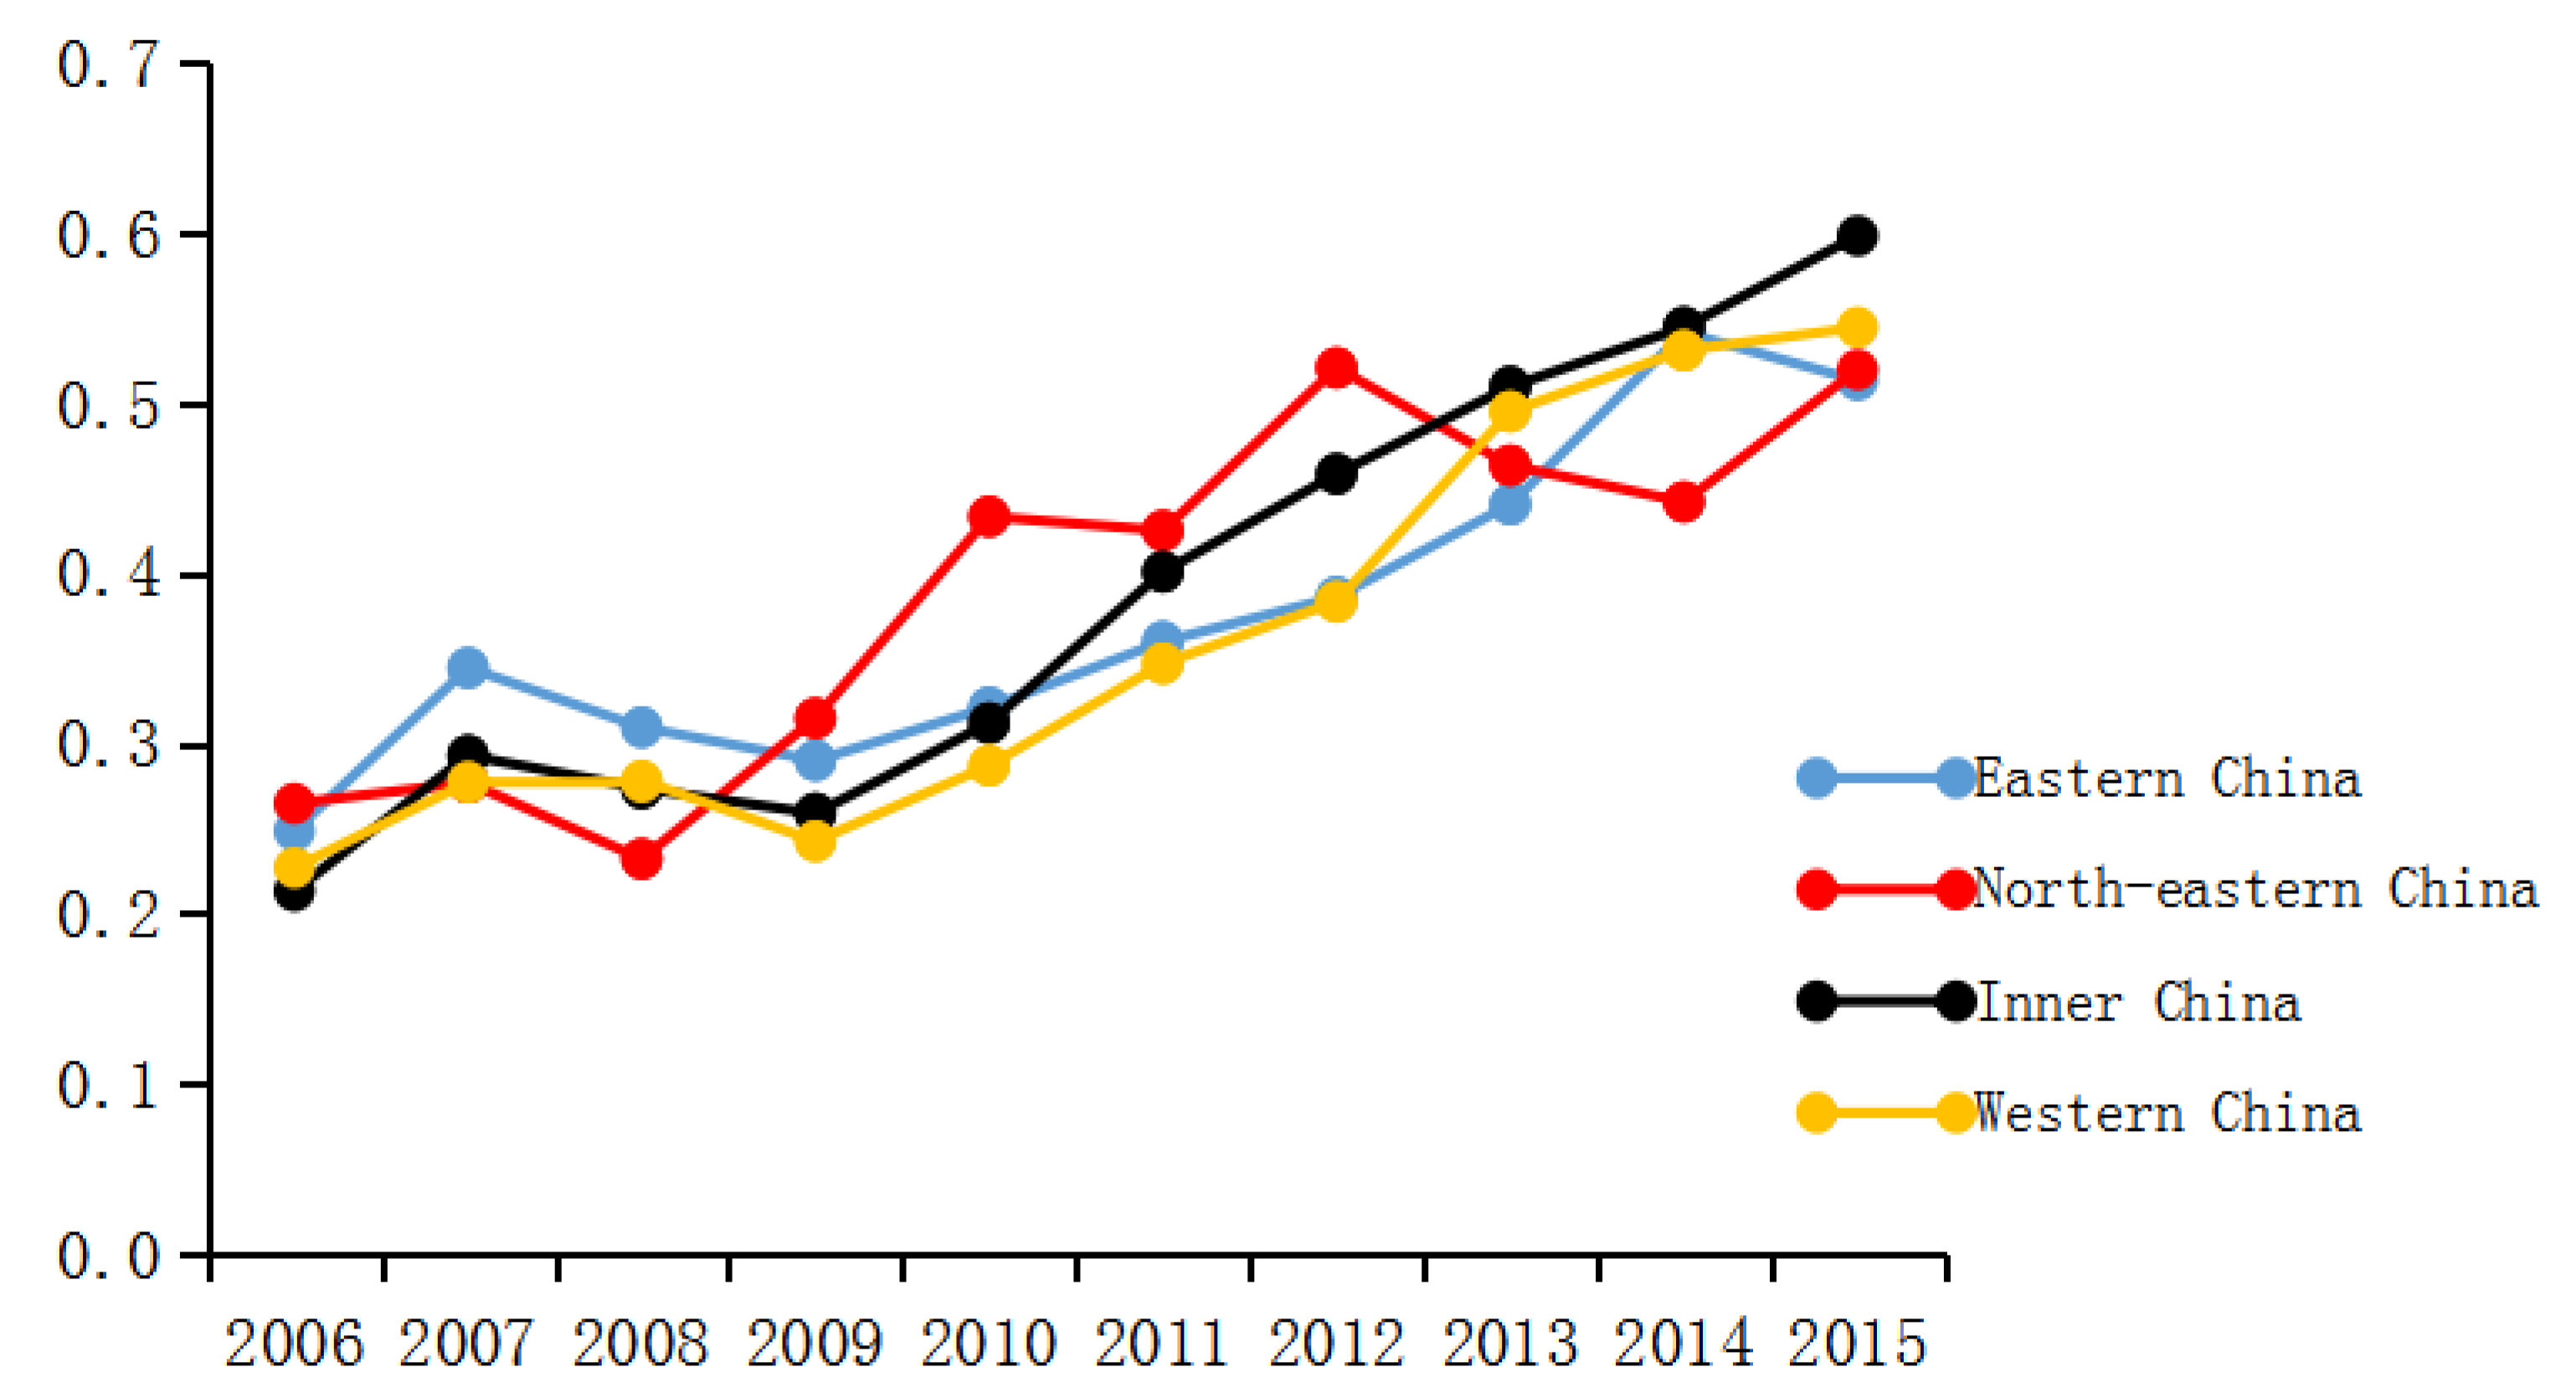
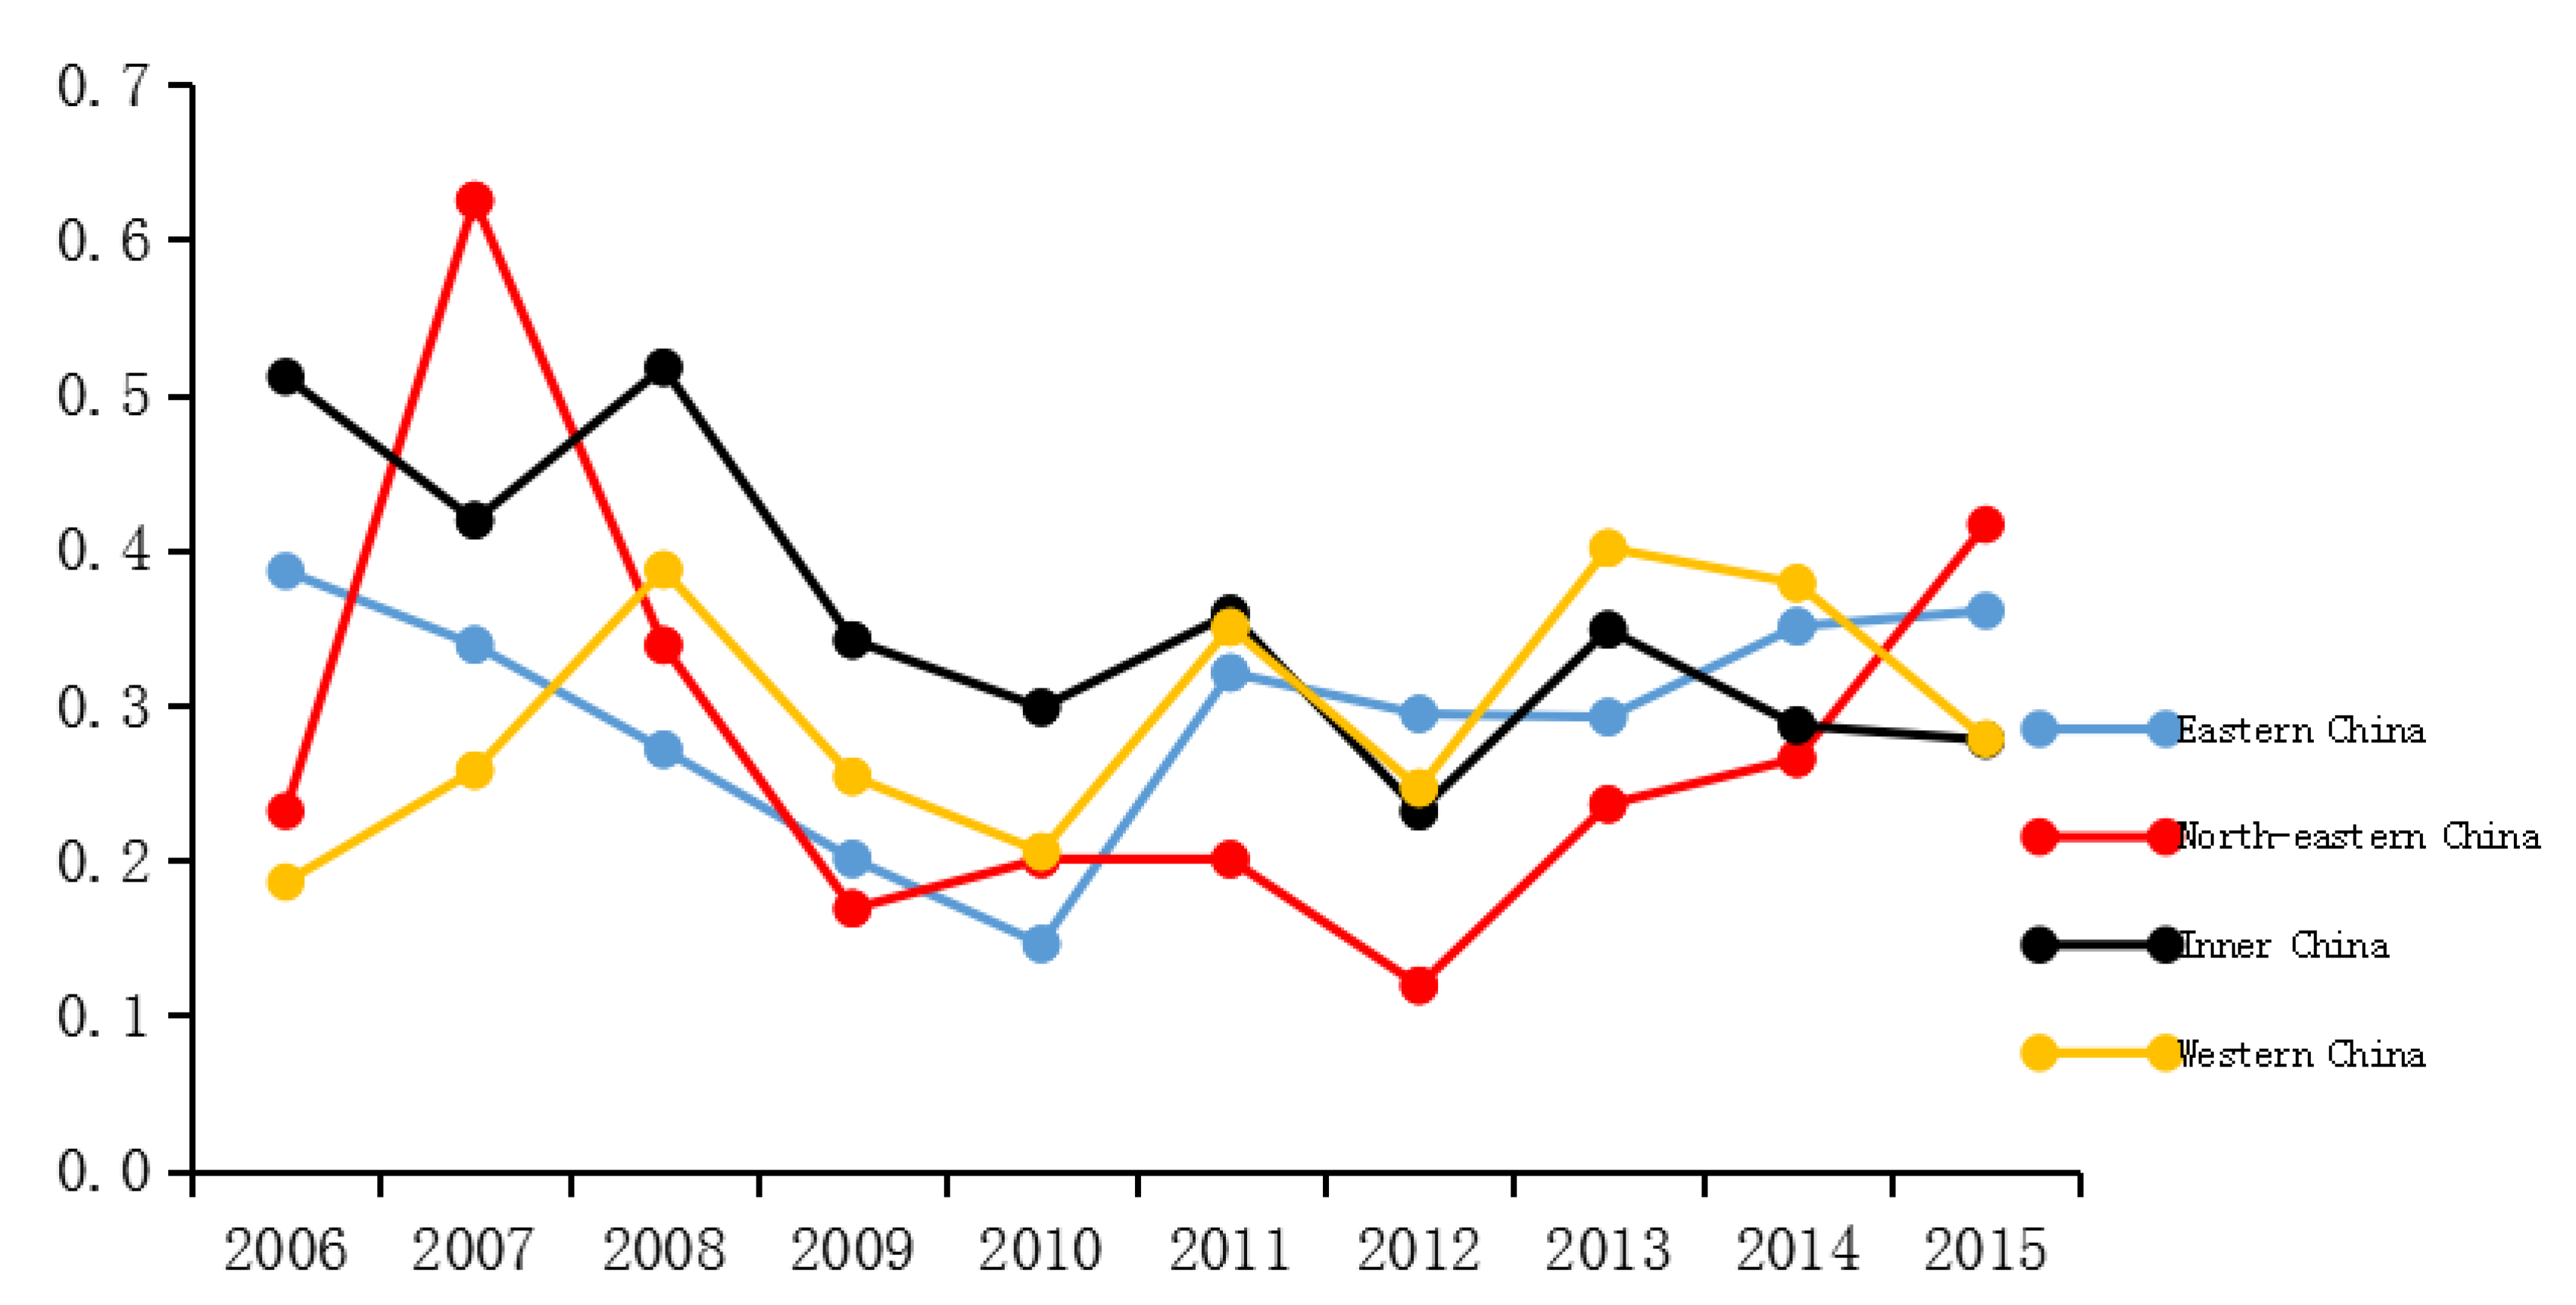
The empirical method is adopted by referring to Liao et al. (2018) and Yu et al. (2018) [63,65]. Based on the above index system, this paper first standardized the collected data, and then used the entropy method to evaluate governmental environmental governance level, corporate environmental governance level, and public environmental governance level during the years 2006–2015 in the four regions of China (see Table 3). In order to present changes in the four regions from 2006 to 2015, this paper averaged the total value of each region and depicted the changing trend of environmental governance level of the three main actors (see Figure 3, Figure 4 and Figure 5).
According to Formulas (1)–(8), the environmental collaborative governance degrees of government–corporation–public in different regions of China from 2006 to 2015 are calculated and shown in Table 4. The trend of the degree of collaboration in 2006–2015 is shown in Figure 6.
Figure 6 shows that there is an overall growth trend despite regional differences for the environmental collaborative governance degrees of government–corporation–public in different regions of China from 2006 to 2015.
4. Discussion
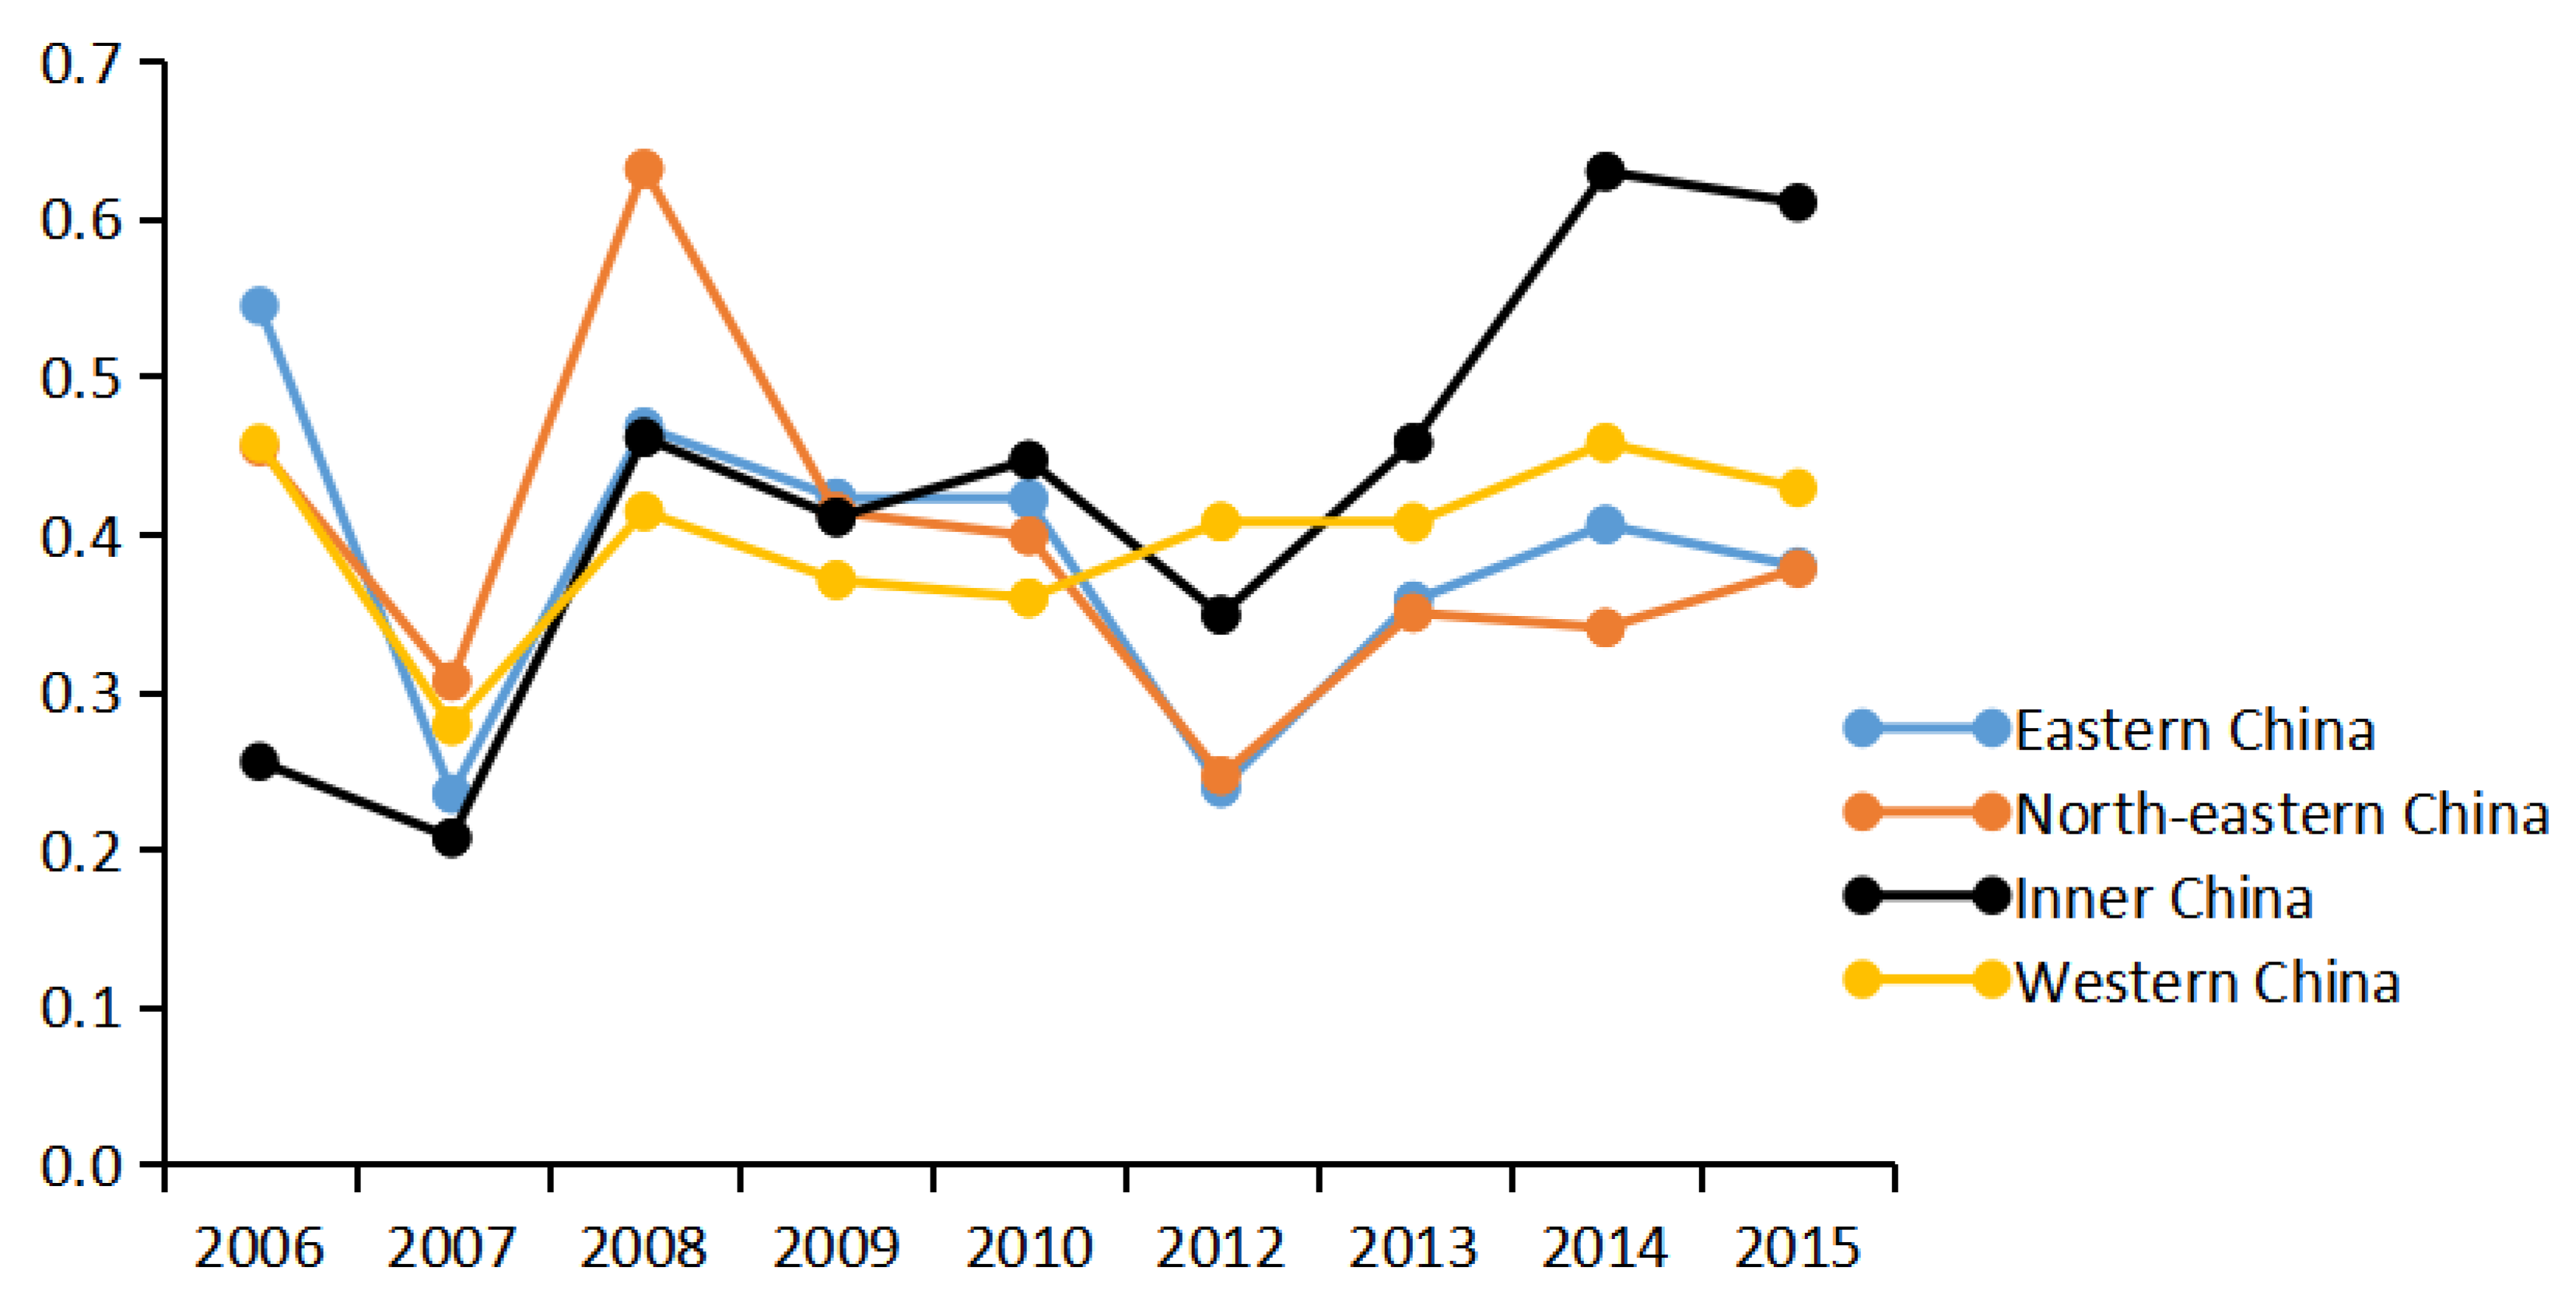
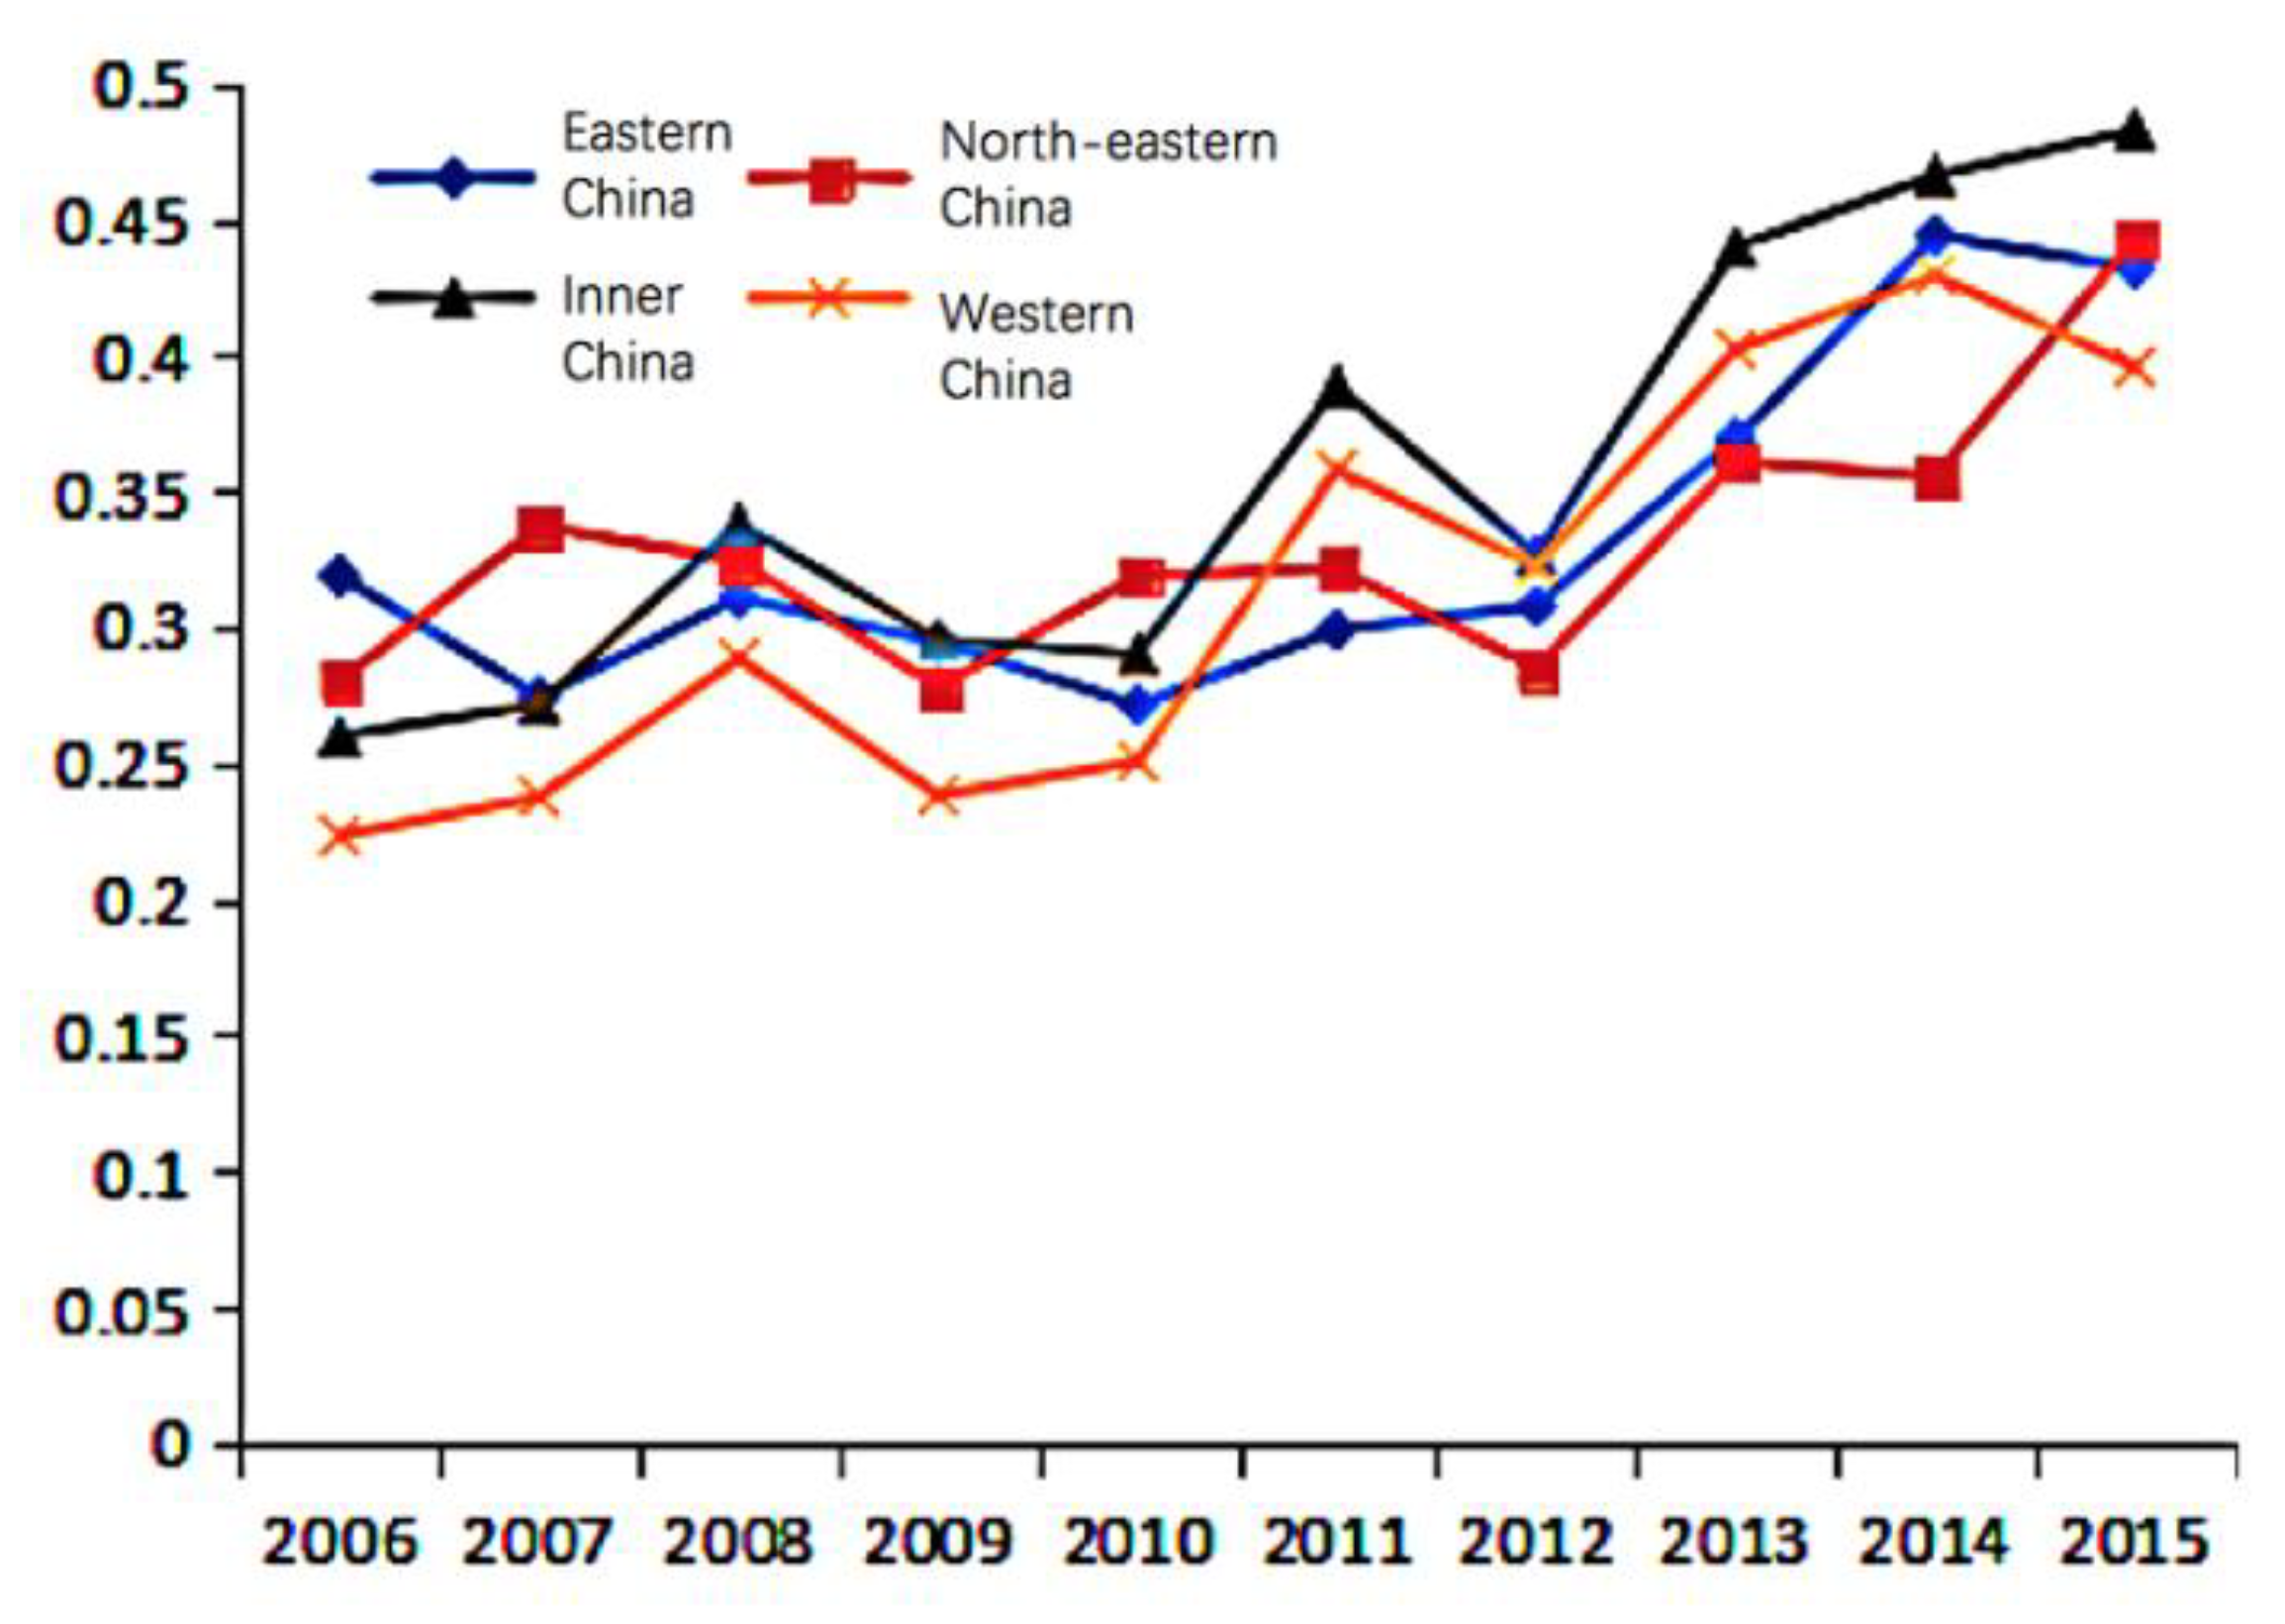
The results show that environmental governance level of government in the four regions during the period experienced an upward trend. The environmental governance level of corporation in Eastern China has shown a downward trend between 2005 and 2010, and then increased with fluctuation. However, in the northeast, Inner and Western regions of China, the trend showed wide fluctuation until 2013. As for the environmental governance level of public, Eastern, Northeastern, and Inner China showed similar trend, experiencing three cycles of first rising and then falling, and gradually stabilizing after 2014. In comparison, the environmental governance level of public in the Western region has remained relatively stable.
It is notable that the Chinese government should pay more attention to public participation, as it showed a relatively unstable trend during the studied period. Furthermore, the environmental governance level of public in Northeast China is relatively low, and this region should be paid more attention. Moreover, corporate environmental governance level was generally lower than that of the other two. It might because corporations are profit-oriented organizations, and environmental governance would increase corporate cost [58]. However, corporations are the main polluters who need to shoulder more environmental responsibility [34]. How to balance this contradiction has become the key point to be studied.
The results show the environmental collaborative governance degrees of government–corporation–public generally keep increase. However, the collaboration level is not high. According to Kim (2017), only when the stakeholder groups keep continuous trust, cooperate with each other and communicate equally, effectively, and openly, can the environmental problems be better solved [18]. Corporations as profit-oriented organizations, usually have no motivation to take part in the environmental governance [66]. On the basis of institutional incentive theory and green political theory [35,66,67], the situation needs the government as the main leader to introduce a series of policies, such as tax reduction to encourage companies to reduce emissions and upgrade technology. In addition, it is understandable that the environmental governance and environmental rehabilitation need a large number of qualified people. Thus, attracting qualified people through subsidies is one of the necessary ways to improve the level of environmental collaborative governance.
The results show the levels of government environmental governance in different regions have generally been continuously increasing. However, the levels of corporate environmental governance and public environmental governance show fluctuation. The public and the corporations needs further encouragement to participate in environmental governance.
The results show that there is no obvious regional disparity for governmental and corporate environmental governance. However, the level of public environmental governance in the Eastern region is significantly higher than that in other regions of the country in recent years, which may be because the proportion of young people in the Eastern region of China is larger and the education level of the public in the Eastern region is relatively higher, so the public there can participate more actively and effectively in environmental governance.
5. Conclusions
This article introduced the background of China’s government-led, corporate, and public participation in the environmental collaborative governance system. It also analyzed the mechanism of environmental collaborative governance of government–corporation–public. By constructing a new indicator system to measure the level of environmental collaborative governance of government–corporation–public and using the panel data of 30 provinces in China, the research provides multidimensional results and discussion. Suggestions are put forward accordingly.
This research provides academic support for China to establish a collaborative environmental governance system dominated by the government and participated in by corporations and the public. However, though the study has made a number of contributions to analyze China’s current environmental governance system and provided some insights for regional environmental governance, this study also has some limitations. Future studies are encouraged to adopt other scientific methods to analyze and test the environmental collaborative governance effect and develop environmental collaborative governance theory. Further comparative analysis with other countries might generate interesting insights and enlighten the summary of valuable experience. It is also meaningful to conduct research on specific environmental governance behaviors of government, corporations, and the public in a certain province or local area.
Author Contributions
X.D. and S.D. drafted the manuscript. R.Y. conceptualized and designed the study. Z.D. contributes to materials and analysis. Y.T. contributed to theories and revising the manuscript. All authors have read and agreed to the published version of the manuscript.
Funding
This work is supported by the Humanities and Social Science Foundation of Ministry of Education (grant no. 15YJC630116), and Graduate Education Innovation Grant Program in Central China Normal University (grant no. 2019CXZZ013).
Conflicts of Interest
The authors declare no conflict of interest.
References
- Llorca, M.; Meunie, A. So2 emissions and the environmental Kuznets curve: The case of Chinese provinces. J. Chin. Econ. Bus. Stud. 2009, 7, 1–16. [Google Scholar] [CrossRef]
- Teixidó, F.J.; Duro, J.A. International ecological footprint inequality: A methodological review and some results. Environ. Resour. Econ. 2015, 60, 607–631. [Google Scholar] [CrossRef]
- Zheng, S.Q.; Matthew, K. Understanding China’s urban pollution dynamics. J. Econ. Lit. 2013, 51, 731–772. [Google Scholar] [CrossRef] [Green Version]
- Wu, J.; Yong, H.; Deng, J.H.; Randall, M.; Bernard, Y. Incentives and outcomes: china’s environmental policy. Cent. Cap. Soc. J. 2014, 1, 9. [Google Scholar]
- Tang, Y.; Miao, X.; Zang, H.; Gao, Y. Information disclosure on hazards from industrial water pollution incidents: Latent resistance and countermeasures in China. Sustainability 2018, 10, 1475. [Google Scholar] [CrossRef] [Green Version]
- Zheng, S.Q.; Wan, G.H.; Sun, W.Z.; Luo, D.L. Public Pressure and Cities’ Environmental Management; Management World: Beijing, China, 2013; pp. 72–84. [Google Scholar]
- Li, H.; Zhou, L. Political turnover and economic performance: The disciplinary role of personnel control in China. J. Public Econ. 2005, 89, 1743–1762. [Google Scholar] [CrossRef]
- Zhou, X.G.; Lian, H. An Analytical Model of Inter-departmental Negotiation within Government: A Case Study of Environmental Policy Implementation. Soc. Sci. China 2011, 5, 80–96. [Google Scholar]
- Pierre, F.L. Decentralized Authoritarianism in China; Cambridge University Press: New York, NY, USA, 2008. [Google Scholar]
- Jonathan, B. Bounded Rationality and Politics; University of California Press: Berkeley, CA, USA, 2010. [Google Scholar]
- Dais, E.E. Comparative government and environmental policy. Policy Stud. J. 2010, 1, 201–205. [Google Scholar] [CrossRef]
- Wang, A. The search for sustainable legitimacy: Environmental law and bureaucracy in China. Harvard Environ. Law Rev. 2013, 37, 365. [Google Scholar] [CrossRef]
- Horsley, J.P. China Deepens Its Disclosure Regime. Available online: Freedominfo.org (accessed on 4 April 2014).
- Tian, X.L.; Guo, Q.G.; Han, C.; Ahmad, N. Different extent of environmental information disclosure across Chinese cities: Contributing factors and correlation with local pollution. Glob. Environ. Chang. 2016, 39, 244–257. [Google Scholar] [CrossRef]
- Chen, J.; Xu, Y. Why do authoritarian regimes allow citizens to voice opinions publicly? J. Politics 2017, 79, 792–803. [Google Scholar] [CrossRef]
- People Net. 2018. Available online: http://opinion.people.com.cn/n1/2018/0111/c1003-29757475.html (accessed on 23 August 2019).
- Kim, S. The Process Model of Corporate Social Responsibility (CSR) Communication: CSR Communication and its Relationship with Consumers’ CSR Knowledge, Trust, and Corporate Reputation Perception. J. Bus. Ethics 2019, 154, 1143–1159. [Google Scholar] [CrossRef]
- Marquis, C.; Toffel, M.W.; Bird, Y.Z. Scrutiny, norms, and selective disclosure: A global study of greenwashing. Soc. Sci. Electron. Publ. 2011, 27, 483–504. [Google Scholar] [CrossRef]
- Zhang, T.B.; Zhang, Q.; Fan, Q.Q. Research on the governance motivation of companies and the externality of public participation under the government environmental regulation. China Popul. Resour. Environ. 2017, 27, 36–43. [Google Scholar]
- Wang, Q. China’s environmental civilian activism. Science 2010, 328, 824. [Google Scholar] [CrossRef]
- Wang, Q.; Chen, X.; Xu, Y.C. Green issues are catching on in China. Nature 2012, 489, 502. [Google Scholar] [CrossRef] [Green Version]
- Steyn, B.; Niemann, L.; Pubrev, J. Strategic role of public relations in enterprise strategy, governance and sustainability—A normative framework. Public Relat. Rev. 2014, 40, 171–183. [Google Scholar] [CrossRef]
- Davies, A.R. Does sustainability count? environmental policy, sustainable development and the governance of grassroots sustainability enterprise in Ireland. Sustain. Dev. 2010, 17, 174–182. [Google Scholar] [CrossRef]
- Fiorino, D.J. The role of information in environmental governance. Public Adm. Rev. 2009, 69, 980–982. [Google Scholar] [CrossRef]
- Wong, C.W.Y.; Miao, X.; Cui, S.; Tang, Y. Impact of corporate environmental responsibility on operating income: Moderating role of regional disparities in China. J. Bus. Ethics 2018, 149, 363–382. [Google Scholar] [CrossRef]
- Mateeva, A.; Hart, D.; Mackay, S. Environmental governance in a multilevel institutional setting. Energy Environ. 2008, 19, 779–786. [Google Scholar]
- Pan, F.; Xi, B.; Wang, L. Evolutionary Game Analysis of Environmental Regulation Strategy Between Local Governments. China Popul. Sources Environ. 2014, 24, 97–102. [Google Scholar]
- Zhang, B.; Bi, J.; Yuan, Z.; Ge, J.; Liu, B.; Bu, M. Why do firms engage in environmental management? an empirical study in China. J. Clean. Prod. 2008, 16, 1036–1045. [Google Scholar]
- Zhang, T. The effect of Public Participation on Environmental Governance in the perspective of New Media—An Empirical Analysis Based on Panel Data of Provincial Pollutants in China. Chin. Public Adm. 2018, 9, 79–85. [Google Scholar]
- Marquis, C.; Qian, C. Corporate social responsibility reporting in China: Symbol or substance? Organ. Sci. 2014, 25, 127–148. [Google Scholar] [CrossRef]
- Chen, Y.S.; Chang, C.H. Greenwash and green trust: The mediation effects of green consumer confusion and green perceived risk. J. Bus. Ethics 2013, 114, 489–500. [Google Scholar] [CrossRef]
- Leisinger, K. Business needs to embrace sustainability targets. Nature 2015, 165, 528. [Google Scholar] [CrossRef] [Green Version]
- DiMaggio, P.J.; Powell, W.W. The iron cage revisited: Institutional isomorphism and collective rationality in organizational fields. Am. Sociol. Rev. 1983, 48, 147–160. [Google Scholar] [CrossRef] [Green Version]
- Wang, H.; Choi, J.; Li, J. Too little or too much? Untangling the relationship between corporate philanthropy and firm financial performance. Organ. Sci. 2008, 19, 143–159. [Google Scholar] [CrossRef] [Green Version]
- Chen, F. Regional race-to-the-bottom, informal economy and incomplete urbanization: A perspective to observe China’s economy and urbanization development model. Urban Plan. Int. 2014, 29, 1–7. [Google Scholar]
- Yin, K.; Wang, R.; An, Q.; Yao, L.; Liang, J. Using eco-efficiency as an indicator for sustainable urban development: A case study of Chinese provincial capital cities. Ecol. Indic. 2014, 36, 665–671. [Google Scholar] [CrossRef]
- Wei, Q.; Schaltegger, S. Revisiting carbon disclosure and performance: Legitimacy and management views. Br. Account. Rev. 2017, 49, 365–379. [Google Scholar]
- Li, S.; Chen, X.C. Governance Dilemma of Trans-District Water Pollution: An Intergovernmental Game Perspective. China Popul. Resour. Environ. 2011, 21, 104–109. [Google Scholar]
- People Net. 2012. Available online: http://politics.people.com.cn/n/2012/0828/c1001-18847841.html (accessed on 26 October 2019).
- O’Connor, O.T.R. Property, technology, and environmental policy: The politics of acid rain in ontario, 1978-1985. J. Policy Hist. 2015, 27, 636–669. [Google Scholar]
- Blevis, E. Greening through it: Information technology for environmental sustainability. Rev. Policy Res. 2011, 28, 638–640. [Google Scholar]
- Wang, P.; Xie, L.W. Pollution Control Investment, Enterprise Technical Innovation and Pollution Control Efficiency. China Popul. Resour. Environ. 2014, 24, 51–58. [Google Scholar]
- Brown, C. Politics and the environment: Nonlinear instabilities dominate. Am. Polit. Sci. Rev. 1994, 88, 292–303. [Google Scholar] [CrossRef]
- Beeden, R.; Maynard, J.; Johnson, J.; Dryden, J.; Kininmonth, S.; Marshall, P. No-anchoring areas reduce coral damage in an effort to build resilience in Keppel bay, southern great barrier reef. Aust. J. Environ. Manag. 2014, 21, 311–319. [Google Scholar] [CrossRef]
- Wang, Y.J.; Han, D.L. Air Quality, Perception of Environmental Pollution, and the Evaluation of Local Governments’ Environmental Governance. China Soft Sci. 2019, 41–51. [Google Scholar]
- Sun, K.; Wang, B. Responsibility Division of Environmental Protection Expenditure, Transfer Payment and Environmental Governance. Tax. Econ. 2019, 20–28. [Google Scholar]
- Guo, P.; Yang, M.J. A Research on the Impact of China’s Fiscal Decentralization on Environmental Governance. Urban Stud. 2014, 21, 84–90. [Google Scholar]
- Wu, J.N.; Xu, M.M.; Ma, Y.Y. Environmental Assessment, Public Participation and Governance Effectiveness: Evidence from the Chinese Provinces. Chin. Public Adm. 2016, 9, 75–81. [Google Scholar]
- Fan, Z.Y.; Zhao, R.J. Does Rule of Law Promote Pollution Control? Evidence from the Establishment of the Environmental Court. Econ. Res. J. 2019, 54, 21–37. [Google Scholar]
- Liu, B.X.; Wang, B.G.; Xue, G. On Assessment of Public Spending Efficiency of Environment Protection in Local China: Based on Three-stage Bootstrapped DEA. J. Zhongnan Univ. Econ. Law 2016, 160, 89–95. [Google Scholar]
- Qi, Y.; Lu, H.Y.; Xu, Y.K. Research on Reformation of China’s Environmental Decentralization System: Institutional Change, Numerical Estimates and Effects Assessment. China Ind. Econ. 2014, 1, 31–43. [Google Scholar]
- Bi, K.; Sun, D.H. The Construction of Synergetic Development System of Product Innovation and Process Innovation in Manufacturing Corporations. In Proceedings of the 2006 International Conference On Management Science & Engineering (13th), Lille, France, 5–7 October 2006. [Google Scholar]
- Bi, K.; Sun, D.H. Empirical Study on Synergy Development between Product Innovation and Process Innovation in Manufacturing Corporations—Based on Coordination Measurement Model with Respect to Composite System. China Soft Sci. 2010, 9, 156–162. [Google Scholar]
- Pagell, M.; Yang, C.L.; Krumwiede, D.W.; Sheu, C. Does the competitive environment influence the efficacy of investments in environmental management? J. Supply Chain Manag. 2010, 40, 30–39. [Google Scholar] [CrossRef]
- Canfa, W. Chinese environmental law enforcement: Current deficiencies and suggested reforms. Vt. J. Envtl. Law 2006, 8, 159. [Google Scholar]
- Olzak, S.; Soule, S.A. Cross-cutting influences of environmental protest and legislation. Soc. Forces 2009, 88, 201–225. [Google Scholar] [CrossRef]
- Duncan, R. The use of predictive modelling in impact assessment: Implications for environmental legislation and regulation. AJPA 2010, 65, 75–88. [Google Scholar] [CrossRef]
- Li, D.; Zhao, Y.; Sun, Y.; Yin, D. Corporate environmental performance, environmental information disclosure, and financial performance: Evidence from China. Hum. Ecol. Risk Assess. Int. J. 2017, 23, 323–339. [Google Scholar] [CrossRef]
- Li, Q.; Ruan, W.J.; Sun, T.T. Corporate governance and corporate environmental investments: Evidence from China. Energy Environ. 2019, 0958305X19882372. [Google Scholar] [CrossRef]
- Yang, D.F.; Wang, Z.Q.; Lu, F.M. The influence of corporate governance and operating characteristics on corporate environmental investment: Evidence from China. Sustainability 2019, 11, 2737. [Google Scholar] [CrossRef] [Green Version]
- Zhang, Y.; Lu, X.X. Public Participating in Management and China Reduction Action: An Empirical Analysis Based on the Provincial Panel Data. Chin. J. Popul. Sci. 2011, 64, 72–112. [Google Scholar]
- Tang, Z. An integrated approach to evaluating the coupling coordination between tourism and the environment. Toursim Manag. 2015, 19, 46. [Google Scholar] [CrossRef]
- Liao, K.C.; Yue, M.Y.; Sun, S.W. An Evaluation of Coupling Coordination between Tourism and Finance. Sustainability 2018, 10, 2320. [Google Scholar] [CrossRef] [Green Version]
- Song, M.; Song, Y.; Yu, H.; Wang, Z. Calculation of China’s environmental efficiency and relevant hierarchical cluster analysis from the perspective of regional differences. Math. Comput. Model. 2013, 58, 1084–1094. [Google Scholar] [CrossRef]
- Yu, Y.T.; Huang, J.H.; Luo, N.S. Can More Environmental Information Disclosure Lead to Higher Eco-Efficiency? Evidence from China. Sustainability 2018, 528, 2. [Google Scholar]
- Symons, J.; Karlsson, R. Green political theory in a climate-changed world: Between innovation and restraint. Environ. Polit. 2015, 24, 173–192. [Google Scholar] [CrossRef]
- Buysse, K.; Verbeke, A. Proactive environmental strategies: A stakeholder management perspective. Strat. Manag. J. 2003, 24, 453–470. [Google Scholar] [CrossRef]
Figure 1.
China’s environmental governance system.

Figure 2.
The utility mechanism of environmental collaborative governance.

Figure 3.
Environmental governance level of government in the four regions of China from 2006 to 2015.
Figure 3.
Environmental governance level of government in the four regions of China from 2006 to 2015.

Figure 4.
Environmental governance level of corporation in the four regions of China from 2006 to 2015.
Figure 4.
Environmental governance level of corporation in the four regions of China from 2006 to 2015.

Figure 5.
Environmental governance level of public in the four regions of China from 2006 to 2015.

Figure 6.
Trend of collaborative degrees in 2006–2015.


Table 1.
Index system of environmental collaborative governance.
| Total System | First-Order Subsystem | Secondary Subsystem | Order Parameters |
|---|---|---|---|
| Collaborative Governance | Government environmental governance | Environmental regulation | Issued local laws and regulations (piece), local rules (piece), administration review (piece), administrative punishment (piece). |
| Environmental administrator | Administrative department of environmental protection (person), personnel of environmental monitoring agencies (person), personnel of environmental monitoring stations (person), personnel of publicity and education centers (person), personnel of environmental information centers (person). | ||
| Environmental governance fund | Pollution discharge fees (ten thousand yuan), investment in urban environmental construction (ten thousand yuan), investment in industrial pollution control (ten thousand yuan). | ||
| Corporation environment governance | Investments in environmental governance | Investment in solid waste governance (ten thousand yuan), investment in wastewater treatment (ten thousand yuan), investment in waste gas treatment (ten thousand yuan), investment in noise control (ten thousand yuan). | |
| Public environmental governance | Environmental petition | Number of environmental petitions (piece), personnel of environmental petition (person), | |
| Environmental proposals | Number of NPC environmental proposals (piece), Number of CPPCC environmental proposals (piece). |
Table 2.
Classification of degrees of the collaboration.
| Collaboration Category | Disorder Interval | Collaboration Transition Interval | Collaboration Development Interval | |||||||
|---|---|---|---|---|---|---|---|---|---|---|
| 0.0~0.09 | 0.10~0.19 | 0.20~0.29 | 0.30~0.39 | 0.40~0.49 | 0.50~0.59 | 0.60~0.69 | 0.70~0.79 | 0.80~0.89 | 0.90~1.00 | |
| Collaboration Level | Extreme disorder | Seriously disorder | Moderate disorder | Mild disorder | On the verge of disorder | Barely coordination | Primary coordination | Intermediate coordination | Good coordination | Excellent coordination |
Table 3.
Environmental governance level of government, corporation, and public.
| Level | Region | 2006 | 2007 | 2008 | 2009 | 2010 | 2011 | 2012 | 2013 | 2014 | 2015 |
|---|---|---|---|---|---|---|---|---|---|---|---|
| Environmental governance level of government | Eastern China | 0.248 | 0.344 | 0.309 | 0.290 | 0.321 | 0.360 | 0.386 | 0.440 | 0.542 | 0.513 |
| Northeastern China | 0.265 | 0.277 | 0.232 | 0.315 | 0.433 | 0.425 | 0.521 | 0.463 | 0.442 | 0.520 | |
| Inner China | 0.213 | 0.293 | 0.273 | 0.259 | 0.312 | 0.401 | 0.458 | 0.510 | 0.545 | 0.598 | |
| Western China | 0.227 | 0.277 | 0.278 | 0.242 | 0.287 | 0.347 | 0.383 | 0.495 | 0.531 | 0.545 | |
| Environmental governance level of corporation | Eastern China | 0.386 | 0.339 | 0.271 | 0.201 | 0.146 | 0.321 | 0.294 | 0.292 | 0.351 | 0.386 |
| Northeastern China | 0.231 | 0.625 | 0.338 | 0.169 | 0.201 | 0.200 | 0.119 | 0.236 | 0.265 | 0.231 | |
| Inner China | 0.511 | 0.419 | 0.517 | 0.342 | 0.298 | 0.359 | 0.231 | 0.348 | 0.287 | 0.511 | |
| Western China | 0.186 | 0.258 | 0.387 | 0.254 | 0.205 | 0.350 | 0.246 | 0.401 | 0.378 | 0.186 | |
| Environmental governance level of public | Eastern China | 0.545 | 0.235 | 0.468 | 0.423 | 0.421 | 0.239 | 0.357 | 0.406 | 0.379 | 0.545 |
| Northeastern China | 0.455 | 0.306 | 0.632 | 0.414 | 0.399 | 0.247 | 0.350 | 0.340 | 0.378 | 0.455 | |
| Inner China | 0.255 | 0.207 | 0.461 | 0.410 | 0.447 | 0.348 | 0.458 | 0.630 | 0.610 | 0.255 | |
| Western China | 0.457 | 0.278 | 0.414 | 0.371 | 0.359 | 0.408 | 0.407 | 0.458 | 0.429 | 0.457 |
Table 4.
Measurement of environmental collaborative governance degree.
| Regions | Province (abbreviation) | 2006 | 2007 | 2008 | 2009 | 2010 | 2011 | 2012 | 2013 | 2014 | 2015 | |
|---|---|---|---|---|---|---|---|---|---|---|---|---|
| C | C | C | C | C | C | C | C | C | C | |||
| Eastern China | BJ | 0.325 | 0.191 | 0.239 | 0.133 | 0.109 | 0.219 | 0.235 | 0.221 | 0.353 | 0.221 | |
| TJ | 0.263 | 0.252 | 0.318 | 0.253 | 0.174 | 0.274 | 0.149 | 0.139 | 0.330 | 0.415 | ||
| HB | 0.290 | 0.189 | 0.272 | 0.260 | 0.226 | 0.340 | 0.309 | 0.529 | 0.646 | 0.465 | ||
| SD | 0.225 | 0.348 | 0.325 | 0.298 | 0.237 | 0.393 | 0.392 | 0.427 | 0.519 | 0.488 | ||
| JS | 0.291 | 0.409 | 0.476 | 0.382 | 0.384 | 0.344 | 0.433 | 0.502 | 0.432 | 0.575 | ||
| SH | 0.241 | 0.277 | 0.297 | 0.251 | 0.208 | 0.281 | 0.214 | 0.243 | 0.484 | 0.385 | ||
| ZJ | 0.320 | 0.346 | 0.360 | 0.323 | 0.331 | 0.291 | 0.269 | 0.361 | 0.497 | 0.403 | ||
| FJ | 0.512 | 0.183 | 0.250 | 0.321 | 0.347 | 0.315 | 0.384 | 0.481 | 0.302 | 0.574 | ||
| GD | 0.401 | 0.274 | 0.261 | 0.427 | 0.425 | 0.234 | 0.384 | 0.418 | 0.430 | 0.361 | ||
| HN | 0.247 | 0.219 | 0.115 | 0.098 | 0.202 | 0.375 | 0.212 | 0.206 | 0.291 | 0.249 | ||
| Mean | 0.312 | 0.269 | 0.291 | 0.275 | 0.264 | 0.307 | 0.298 | 0.353 | 0.428 | 0.414 | ||
| Northeastern China | LN | 0.331 | 0.409 | 0.399 | 0.288 | 0.370 | 0.343 | 0.252 | 0.389 | 0.414 | 0.549 | |
| JN | 0.297 | 0.229 | 0.317 | 0.283 | 0.338 | 0.298 | 0.233 | 0.254 | 0.280 | 0.405 | ||
| HLJ | 0.212 | 0.372 | 0.257 | 0.263 | 0.248 | 0.323 | 0.369 | 0.438 | 0.371 | 0.374 | ||
| Mean | 0.280 | 0.337 | 0.324 | 0.278 | 0.319 | 0.321 | 0.285 | 0.360 | 0.355 | 0.443 | ||
| Inner China | SX | 0.205 | 0.199 | 0.309 | 0.226 | 0.231 | 0.331 | 0.295 | 0.519 | 0.330 | 0.291 | |
| HN | 0.244 | 0.289 | 0.358 | 0.291 | 0.260 | 0.341 | 0.258 | 0.477 | 0.517 | 0.527 | ||
| HB | 0.294 | 0.216 | 0.294 | 0.338 | 0.365 | 0.295 | 0.325 | 0.376 | 0.565 | 0.490 | ||
| HN | 0.156 | 0.433 | 0.378 | 0.358 | 0.372 | 0.479 | 0.413 | 0.416 | 0.382 | 0.523 | ||
| JX | 0.233 | 0.202 | 0.224 | 0.342 | 0.269 | 0.381 | 0.175 | 0.411 | 0.442 | 0.396 | ||
| AH | 0.429 | 0.289 | 0.463 | 0.218 | 0.242 | 0.502 | 0.493 | 0.439 | 0.558 | 0.668 | ||
| Mean | 0.260 | 0.271 | 0.338 | 0.296 | 0.290 | 0.388 | 0.327 | 0.440 | 0.466 | 0.483 | ||
| Western China | GX | 0.247 | 0.399 | 0.361 | 0.176 | 0.194 | 0.296 | 0.180 | 0.264 | 0.353 | 0.472 | |
| CQ | 0.194 | 0.500 | 0.393 | 0.277 | 0.356 | 0.297 | 0.279 | 0.338 | 0.321 | 0.369 | ||
| SC | 0.408 | 0.350 | 0.485 | 0.258 | 0.177 | 0.318 | 0.360 | 0.350 | 0.401 | 0.367 | ||
| GZ | 0.161 | 0.126 | 0.187 | 0.180 | 0.277 | 0.481 | 0.477 | 0.537 | 0.441 | 0.410 | ||
| YN | 0.243 | 0.183 | 0.315 | 0.251 | 0.261 | 0.334 | 0.439 | 0.641 | 0.593 | 0.452 | ||
| IM | 0.219 | 0.224 | 0.340 | 0.266 | 0.322 | 0.480 | 0.417 | 0.303 | 0.470 | 0.363 | ||
| SX | 0.174 | 0.225 | 0.211 | 0.435 | 0.351 | 0.481 | 0.399 | 0.468 | 0.481 | 0.501 | ||
| GS | 0.264 | 0.259 | 0.253 | 0.274 | 0.298 | 0.261 | 0.400 | 0.448 | 0.460 | 0.369 | ||
| QH | 0.062 | 0.083 | 0.224 | 0.218 | 0.144 | 0.324 | 0.188 | 0.292 | 0.434 | 0.449 | ||
| NX | 0.233 | 0.204 | 0.301 | 0.102 | 0.171 | 0.379 | 0.237 | 0.369 | 0.390 | 0.297 | ||
| XJ | 0.227 | 0.077 | 0.277 | 0.323 | 0.252 | 0.265 | 0.279 | 0.609 | 0.517 | 0.447 | ||
| Mean | 0.221 | 0.239 | 0.304 | 0.251 | 0.255 | 0.356 | 0.332 | 0.420 | 0.442 | 0.409 |
Note: C denotes the environmental collaborative governance degree of government–corporation–public. Province name is in acronym with initials.
© 2020 by the authors. Licensee MDPI, Basel, Switzerland. This article is an open access article distributed under the terms and conditions of the Creative Commons Attribution (CC BY) license (http://creativecommons.org/licenses/by/4.0/).
Share and Cite
MDPI and ACS Style
Duan, X.; Dai, S.; Yang, R.; Duan, Z.; Tang, Y. Environmental Collaborative Governance Degree of Government, Corporation, and Public. Sustainability 2020, 12, 1138. https://0-doi-org.brum.beds.ac.uk/10.3390/su12031138
AMA Style
Duan X, Dai S, Yang R, Duan Z, Tang Y. Environmental Collaborative Governance Degree of Government, Corporation, and Public. Sustainability. 2020; 12(3):1138. https://0-doi-org.brum.beds.ac.uk/10.3390/su12031138
Chicago/Turabian StyleDuan, Xin, Shengli Dai, Rui Yang, Ziwei Duan, and Yanhong Tang. 2020. "Environmental Collaborative Governance Degree of Government, Corporation, and Public" Sustainability 12, no. 3: 1138. https://0-doi-org.brum.beds.ac.uk/10.3390/su12031138
Note that from the first issue of 2016, this journal uses article numbers instead of page numbers. See further details here.