Article

Accurate Sizing of Residential Stand-Alone Photovoltaic Systems Considering System Reliability

by
Eduardo Quiles
1,*,
Carlos Roldán-Blay
2,
Guillermo Escrivá-Escrivá
2 and
Carlos Roldán-Porta
2
1
Instituto de Automática e Informática Industrial, Universitat Politècnica de València, 46022 Valencia, Spain
2
Institute for Energy Engineering, Universitat Politècnica de València, 46022 Valencia, Spain
*
Author to whom correspondence should be addressed.
Sustainability 2020, 12(3), 1274; https://0-doi-org.brum.beds.ac.uk/10.3390/su12031274
Submission received: 10 January 2020 / Revised: 4 February 2020 / Accepted: 6 February 2020 / Published: 10 February 2020
(This article belongs to the Special Issue Renewable Energies for Sustainable Development)

Abstract

:
In rural areas or in isolated communities in developing countries it is increasingly common to install micro-renewable sources, such as photovoltaic (PV) systems, by residential consumers without access to the utility distribution network. The reliability of the supply provided by these stand-alone generators is a key issue when designing the PV system. The proper system sizing for a minimum level of reliability avoids unacceptable continuity of supply (undersized system) and unnecessary costs (oversized system). This paper presents a method for the accurate sizing of stand-alone photovoltaic (SAPV) residential generation systems for a pre-established reliability level. The proposed method is based on the application of a sequential random Monte Carlo simulation to the system model. Uncertainties of solar radiation, energy demand, and component failures are simultaneously considered. The results of the case study facilitate the sizing of the main energy elements (solar panels and battery) depending on the required level of reliability, taking into account the uncertainties that affect this type of facility. The analysis carried out demonstrates that deterministic designs of SAPV systems based on average demand and radiation values or the average number of consecutive cloudy days can lead to inadequate levels of continuity of supply.

1. Introduction

The need to reduce dependency in fossil fuels has promoted the use of renewable energy sources. The appearance of renewable energy sources such as wind power, solar power, or small hydro plants in the electrical market is increasing every day. Many of these renewable energy plants are customer owned and have small unitary power.
These renewable microgeneration systems can be isolated from the distribution network (off-grid) or connected to it exporting their energy surpluses [1,2,3]. In rural areas or in isolated communities in developing countries it is increasingly common to install micro-renewables sources by residential consumers without access to the utility distribution network (DN). In Spain these micro-renewables are mainly off-grid photovoltaic (PV) systems for electrification of single residential households. These stand-alone photovoltaic (SAPV) energy systems generally include batteries for energy storage [4,5,6].
The Spanish Administration has recently regulated self-consumption of electricity [7]. This regulation was issued as an urgent measure for renewable energy promotion and consumer protection. It has reduced the administrative hurdles suffered by small-scale energy plants and it allows collective self-consumption for the first time.
This new regulation defines the concept of “neighbor facility” in order to regulate collective self-consumption and confirms the elimination of the charge to self-consumed energy. It creates a simplified compensation mechanism to compensate self-consumers with surplus energy that export to the network and facilitates the installation of energy storage elements without more requirements than to comply with safety and industrial quality regulations. This regulation is expected to incentive the installation of more SAPV generation systems for residential customers.
To design a SAPV system it is necessary to determine the PV panels’ rated power and battery storage capacity. PV generation has uncertainty associated to its energy output which depends on the irradiation level [8,9]. This irradiation level depends on the weather condition, varying widely between sunny and cloudy days, in the short term (hour to hour) and in the long term (seasonal variations) [10,11]. Even for a typical clear-sky day, fluctuations of PV power are caused by passing clouds. Getting a good prediction of the reliability of a SAPV is mandatory in order to improve its sustainability. A detailed analysis of the characteristics of solar radiation for the area where a SAPV will be installed is convenient. Uncertainty associated to PV generation must be modelled to predict average performance in the future. Time-series measurements of solar radiation data from near-site weather stations are required to estimate expected generation [12,13,14].
Simultaneity between PV generation and energy consumption in residential households is limited. PV generation is maximum at noon while for a typical residential customer the peak period occurs in the evening. The battery system allows to storage PV energy surpluses produced during the day. As long as the battery does not reach its maximum state of charge (SOC), the PV energy surpluses will be used to charge the battery. Another option to improve self-sufficiency of PV systems is shifting the consumption of deferrable loads by demand-side management to periods with PV-surpluses [15,16]. The creation of cooperative microgrids with different SAPV generators has also been proposed [17,18] to address this problem.
To make a realistic design of the SAPV system an accurate model of load demand is required. This is especially difficult for individual residential customers that usually have a variable load profile. Residential load has a time-varying nature and it changes depending on the time of the day, day of the week and season of the year. To simulate the energy flows between PV unit, battery and load, time series data of PV generation and load demand with a high temporal resolution are required.
Many studies have been carried out to determine the feasibility of SAPV systems [19]. There are some studies [20,21,22,23] that evaluate residential PV plants connected to the DN. In this way they can sell energy surpluses to the utility and import energy from the DN when needed. Some other studies [24,25] consider SAPV systems, autonomous and isolated from the DN. This is usually the only available option in many rural areas. Different solutions have been proposed for the design of such SAPV systems. The main objective is to determine the most reliable and cost-effective configuration of PV units for energy generation and batteries for energy storage.
Some authors propose analytical solutions based on energy balance equations [26]. Some of them include statistical approaches to consider solar radiation fluctuations [12]. A review of SAPV systems sizing methodologies can be found in [1,27].
The SAPV design considering reliability of involved systems requires a realistic model of the energy resource, energy demand, and system components faults. Several studies usually consider average solar irradiance levels for a broad area. These values are monthly averages obtained from databases of meteorological services [28,29] In this study local hourly irradiance levels are measured and included in the design process.
As previously stated, residential demand is highly variable between different users and different days. The simplified approach of considering an average daily peak demand clearly underestimates demand fluctuation [1]. This work considers actual demand data measured in an hourly basis from average customers.
Another factor that influences the applicability of simulation results is the temporal resolution of the PV generation and load demand. At least an hourly resolution is required to reflect the power balance between PV generation and energy demand [30,31,32]. Some authors [1] propose smaller temporal resolutions (10-min sampled data) in order to evaluate energy flows between PV units, batteries, and loads.
Several studies conclude that SAPV systems are an economic and profitable solution for residential customers without access to the DN [33]. These studies show that the initial investments in PV panels, batteries, and installation costs have an amortization period smaller than the PV plant useful life [20,34]. Therefore, for many residential customers the reliability of the electrical supply is the key factor when planning the installation of a SAPV system, rather than the investment costs. Many individual residential investors are willing to afford the investment costs of the PV generation system as far as a satisfactory electrical supply reliability level is warranted [35].
SAPV design must take into account faults that unexpectedly occur in the system. Assuming no component faults can result in an over-optimistic performance prediction and in the subsequent infra-sizing of PV units and batteries [36].
Monte Carlo simulation (MCS) can be performed in a sequential or non-sequential manner [37]. In the sequential MCS the states of the components are sequentially sampled simulating the chronology of the stochastic process of the system operation. For renewable-energy systems with energy storage, the state of the system depends on previous states, i.e., battery SOC level. PV generation and residential demand are not usually correlated. The complexity of this reliability analysis can better be dealt with a sequential MCS. Other approaches as reliability evaluation based on analytical models or Markov models require modeling simplifications that are not suitable for a realistic assessment of SAPV systems [38].
This study addresses the evaluation of component faults using a sequential Monte Carlo simulation methodology. The objective of the paper is to obtain an optimal sizing of the SAPV system from the economical point of view, but imposing some constraints related to the desired reliability of the system. The novelty of this work compared with existing studies is the consideration of actual PV generation and load demand time series data, and the simultaneous evaluation of uncertainties associated to PV generation, load demand, and system component faults. To the authors’ best knowledge this is the first work where these three sources of uncertainty are simultaneously taken into account in the design of SAPV systems. The objective is to guarantee a desired reliability in the continuity of the supply in the design of a SAPV generation system.
To validate the results of the proposed method, the sizing of a SAPV system is firstly approached using a deterministic worst case procedure. Then, a reliability evaluation method is used, considering PV generation uncertainty, demand uncertainty and unexpected faults performing a sequential Monte Carlo simulation. The results of both approaches are compared to extract relevant conclusions about the design process of SAPV systems.

2. Materials and Methods

2.1. Stand-Alone Photovoltaic Energy System

Many residential households have installed PV renewable generation to satisfy its own energy requirements. This generation is accompanied by batteries to storage energy when surpluses are available and to supply energy when the PV output is insufficient. Figure 1 shows a scheme of the installation of PV panels and batteries to supply a residential load without connection to the grid. The battery has a regulator or battery controller (BC) to control the SOC and its maximum current, both in charge and discharge operations. The BC decides the power flows between the PV panel array and the battery.
The SAPV system has been divided into two sections:
  • The generation section: PV panel array, BC and batteries.
  • The load section: inverter and loads.
The reliability analysis performed in this work will take into account the possible failures in the PV panel array and the BC considering the failure rate per year of these elements ( λ c ). These failures can be covered by the batteries, that also present a specific failure rate ( λ b ). The possible failures in the inverter ( λ i ) cannot be supported by other elements in the proposed scheme. Therefore, to include these failures in the analysis, this element should be considered in series with the generation section and the overall reliability would be the product of the reliability of both systems.
To model a typical household energy demand, the authors of this study have registered time series of data with a temporal resolution of an hour. Figure 2 shows typical values of the daily demand from a residential customer in different seasons.
PV generation used in this work is based in the actual measurements obtained in the laboratory of Distributed Energy Resources (LABDER) at the Institute for Energy Engineering of the Universitat Politècnica de València, Spain [39]. This laboratory enables the assembly of Hybrid Renewable Energy Systems (HRES) combining different renewable sources: photovoltaic, biogas, wind power and hydrogen fuel cells, interconnected by a controlled microgrid that supplies a specific load. Additionally, the laboratory includes the capability to store energy, both in batteries and hydrogen, to cover most of the possible HRES configurations [40].
All the systems are working in the 10 kW range. Specifically, the photovoltaic generator in the LABDER is made up of monocrystalline and polycrystalline silicon modules mounted on the roof of the laboratory, facing south with tilt angle of 30 degrees to produce maximum annual energy. The total power of the photovoltaic generator now installed in this lab is 2.1 kWp and the panels are connected to a single phase grid inverter.
The operating point of the panels and the inverter, currents, voltages, power and energy injected to the grid are also monitored using a power meter installed at the AC output of the inverter and a data logger to storage the data. This information enables the management system to check the correct operation of the system and to know the energy produced at any time.
The registered power produced during a year has been used to obtain the PV power generation in this work, as depicted in Figure 2. This register allows to use actual data and to obtain reliable values in the different simulations performed later.
To provide a deterministic design (DD) of the size of the SAPV system, the average demand recorded in this study, Pd(t), at the most unfavorable time of the year (winter) is considered. The average daily energy consumption in this period E d (Wh/day) will be:
E d = 0 24 P d t d t .
This energy is obtained from the PV array. The output power of the PV system depends on the irradiance level. This fact introduces uncertainty in the energy resource.
The battery must be designed to secure the energy supply to the loads when the PV output is not enough (at nights and in cloudy days). From the values of the instantaneous PV energy generation PS(t) and the energy demand Pd(t) the useful energy contributed by the battery in one day is obtained, as depicted in Figure 3.
As shown in Figure 3, the power produced by the array on a sunny day, PS(t), must exceed the demand during the time interval t1–t2. Then, the energy available to be stored in the battery, E1, will be:
E 1 = t 1 t 2 P s t P d t d t   w h e n   P S t > P d t .
To keep the system stable, the energy that the battery can return in a daily discharge cycle, Eb will be computed according to Equation (3), where ηc and ηd are the battery charge and discharge performance and ηb the overall efficiency of the energy storage and recovery process.
E b = η c · η d · E 1 = η b · E 1 .
From the adjustment to the balance of the previous data, Equation (4) must be fulfilled:
0 24 P s t d t = E d + E 1 · 1 η b .
The minimum rated power required for the PV array (PVpeak) is then obtained from Equation (4).
For a set of n c cloudy days, the energy production would be much less than the theoretical one with good weather. For example, admitting that 15% of the theoretical value is obtained, since the irradiance can be between 10% and 20% of a sunny day [41], it would result:
n c · E d 0.15 · 0 24 P s t d t = E b ,
Q b = E b · 100 η d · 100 S O C m i n
where E b is the energy contributed by the battery the n c cloudy days (it has been assumed that Pd(t) > 0.15·PS(t) during all the time those days), S O C m i n is the minimum admissible value of SOC after those n c days (for example 15%) and Q b is the value of the necessary battery capacity.
After these days it is necessary to recover the normal state of charge in the batteries in a not very long period, for this reason it is necessary to oversize the value PVpeak (for example 20%).
In this way, the batteries are designed for a sufficient capacity to supply the load for n c cloudy days.

2.2. Reliability Assessment Methodology

To evaluate the reliability of the SAPV system two questions must be addressed. An interruption of supply will occur if the instant power provided by the PV arrays plus the energy stored in the batteries is not enough to satisfy the demand. The second cause for an interruption of supply is when unexpected faults occur in the system.
The reliability model of a PV plant is a complex issue [42,43,44]. For the objectives of this paper an aggregated reliability model of the PV plant (panels and BC) is used ( λ c ). The reliability model of the PV plant is assumed to be a two state model, with total power output in the up state and zero power output in the down state (Figure 4). Faults in the batteries are not considered as they are assumed to be maintained and substituted before ending its useful life period (so it is considered λ b = 0 ).
Time to failure (TTF) of the PV plant is modeled using an exponential distribution and the mean time to repair (TTR) is modeled following a Rayleigh distribution [45]. TTF and TTR are randomly generated using the inverse transform method [46].
The PV generation curve is combined with the sequence of failures obtained, making it zero when there is a PV panel array or BC failure. In this way the generating capacity sequence (GCS) is obtained. The SOC of the battery is then calculated by combining the GCS with the demand sequence.
Considering the instantaneous power demand Pd(t) and GCS(t), SOC (t) is obtained from Equation (7):
SOC t = SOC t 1 + α GCS t P d t · Δ t ,
where α = ηc, if GCS(t) − Pd(t) > 0 and α = 1/ηd, if GCS(t)Pd(t) < 0.
An interruption of supply due to generation inadequacy occurs when:
SOC t SOC min   and   GCS t < Pd t .
With Equations (7) and (8) during PV failure periods, the energy provided by the battery is evaluated to reduce the failure time totally or partially until the battery is discharged to S O C m i n . If a state in which Pd cannot be supplied is reached, the frequency of interruptions (FOI in number of interruptions/yr) is increased and the loss of energy expectation (LOEE in Wh/yr), i.e., energy not supplied expectation, is evaluated as indicated in the description of the reliability analysis method.
If SOC(t) = S O C m a x and GCS(t) > Pd(t) there is an energy production capacity that cannot be used. This energy will correspond to energy not used (ENU).
To apply the analysis method numerically, variables Ps(t), and Pd(t) must be discretized. For each hour h of the year, the energy produced by the PV array is calculated and its value is assigned to the discrete variable Ps(h). Since its value corresponds to the average hourly power it can be expressed both in kW or in kWh equivalently. The GCS(t) is automatically discretized as GCS(h) if it is calculated with the discrete values of Ps(h). Similarly, the energy demanded in each hour is assigned to the discrete variable Pd(h).

Description of the Reliability Analysis Method

A sequential Monte Carlo Simulation (MCS) is performed where the hourly behavior of the system for a series of years is simulated (400 years in this work). The randomized irradiance level for every hour of the day for every month of the year is considered, together with the hourly demand to construct chronological generation and demand random sequences.
The reliability evaluation method is performed as follows (Figure 5):
  • BEGIN: Initialize counter: n = 1 (number of years). Obtain initial system parameters.
  • FOR n = 1 to 400 DO//Consider a possible convergence criterion (*).
    Initialize counters: h = 1 (number of simulated hours of the year); i = 0 (counter of interruptions); H = 0 (hours of interruption); LOEE = 0; ENU = 0, SOC = 80% (battery state of charge).
    Simulate TTF and TTR consecutively to generate the annual failure sequence.
    Obtain randomized hourly PV generation time series data Ps(h) from the historical record.
    Generate the hourly chronological curve of annual demand Pd(h) from the historical record.
    Combine Ps(h) and the annual failure sequence to get the generating capacity sequence GCS(h) for the simulated year.
    FOR h = 1 to 8760 DO:
    Using GCS(h) and Pd(h), obtain SOC(h) with Equation (7).
    Update the number of interruptions i and evaluate the duration in hours of each interruption Hi
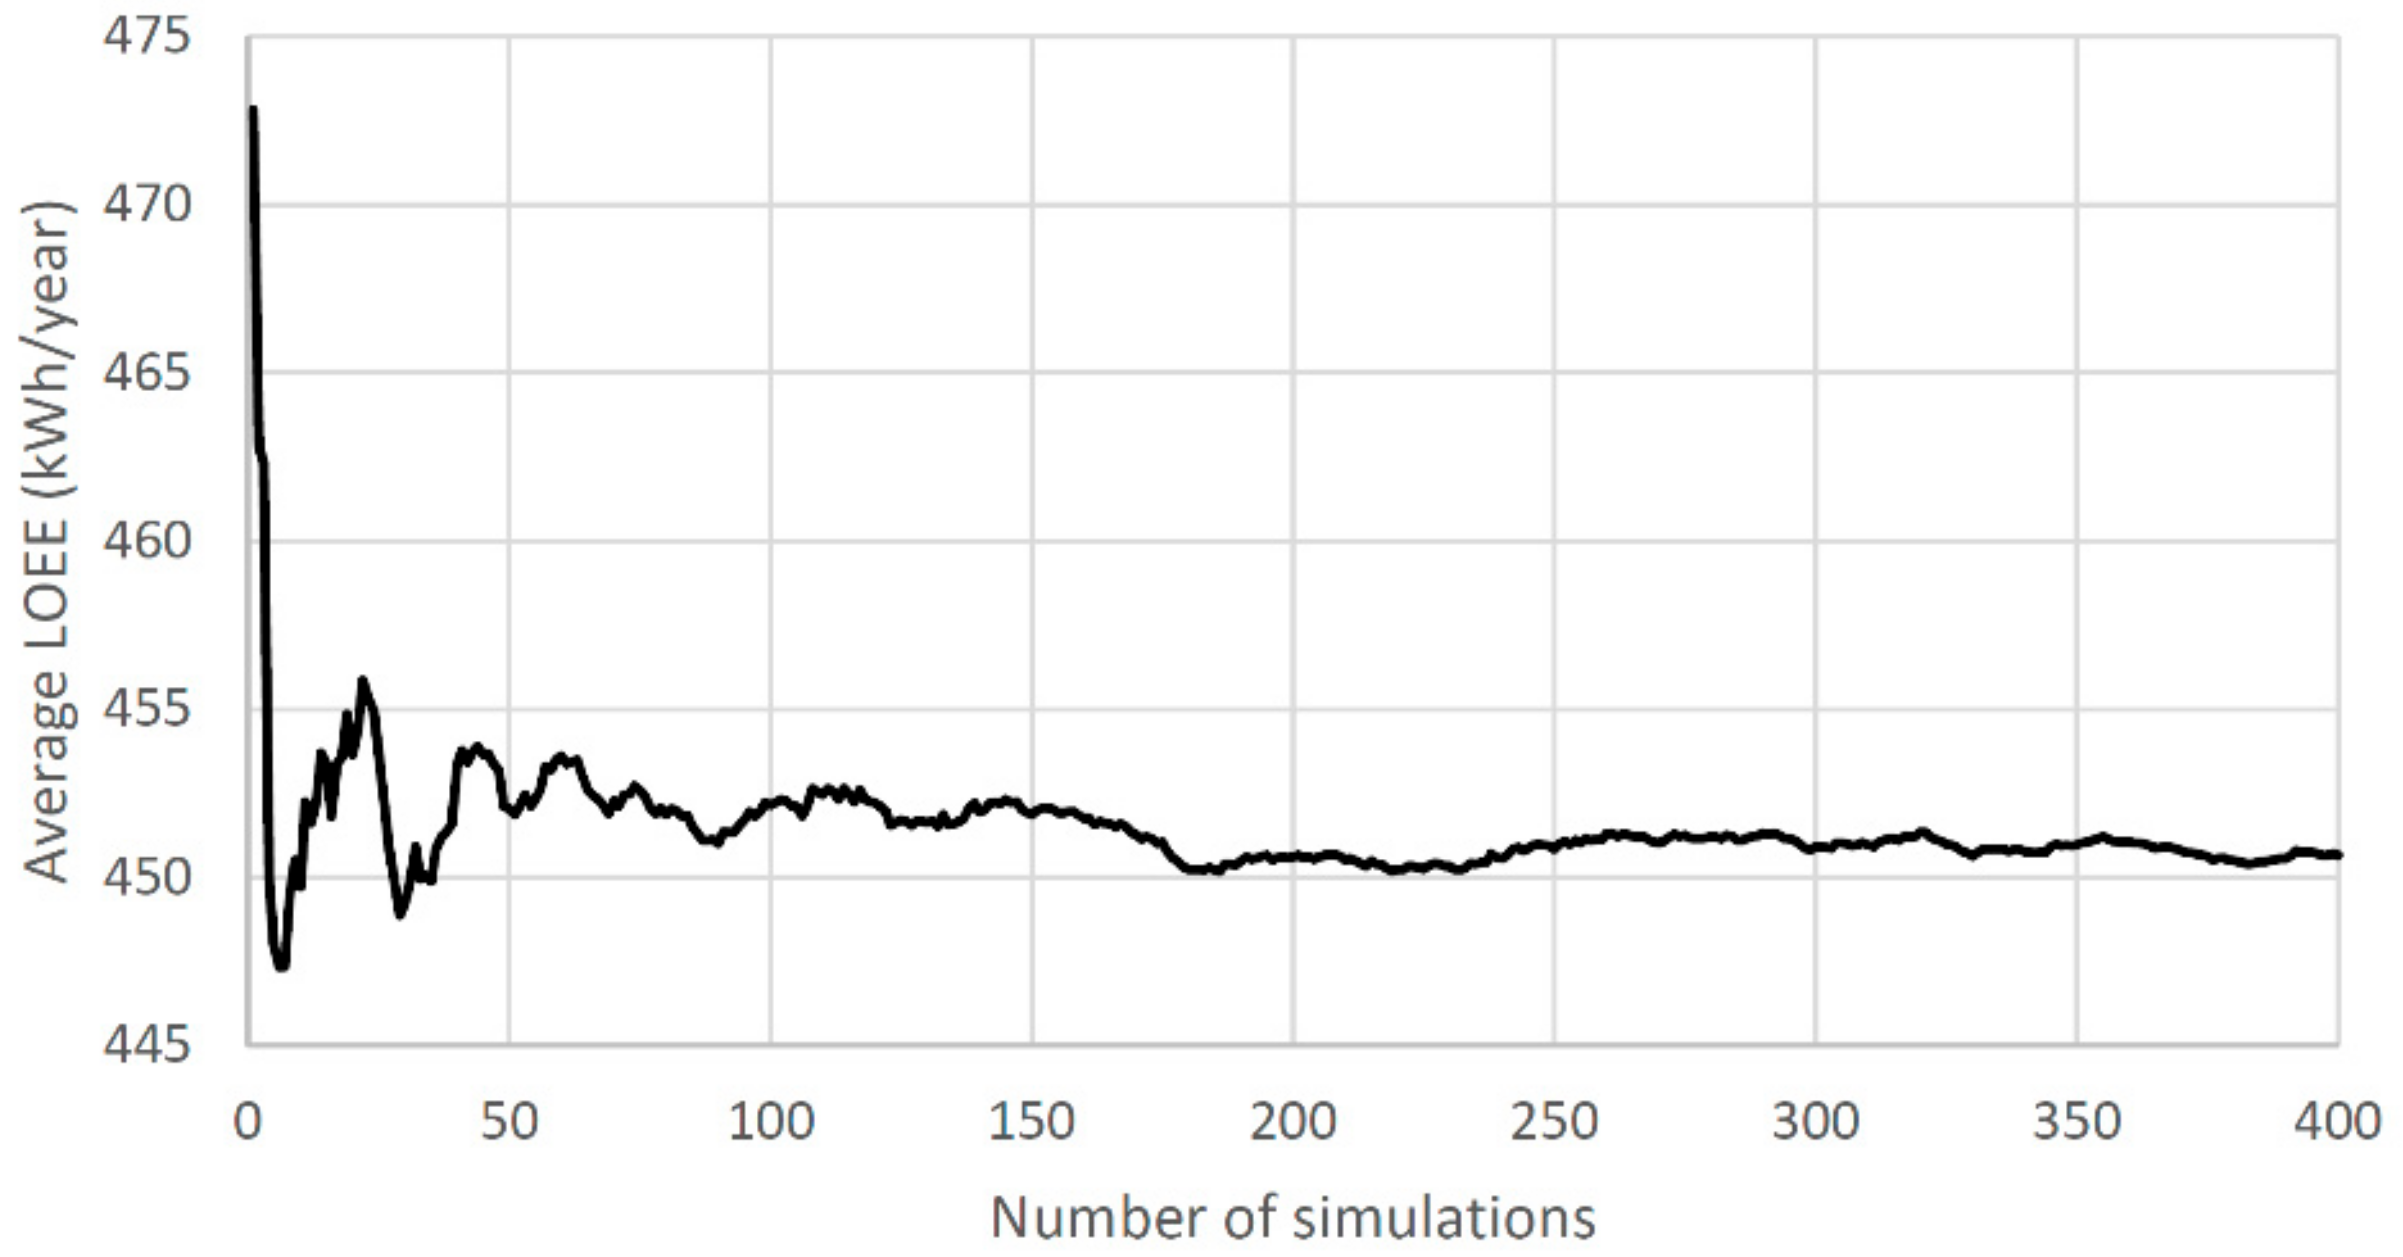
    If SOC = SOCmin and GCS(h)<Pd(h), update LOEE: LOEE = LOEE+Pd(h)-GCS(h)
    If SOC = SOCmax and GCS(h)>Pd(h), update ENU: ENU = ENU+GCS(h)−Pd(h)
    Evaluate FOI index: FOI = i.
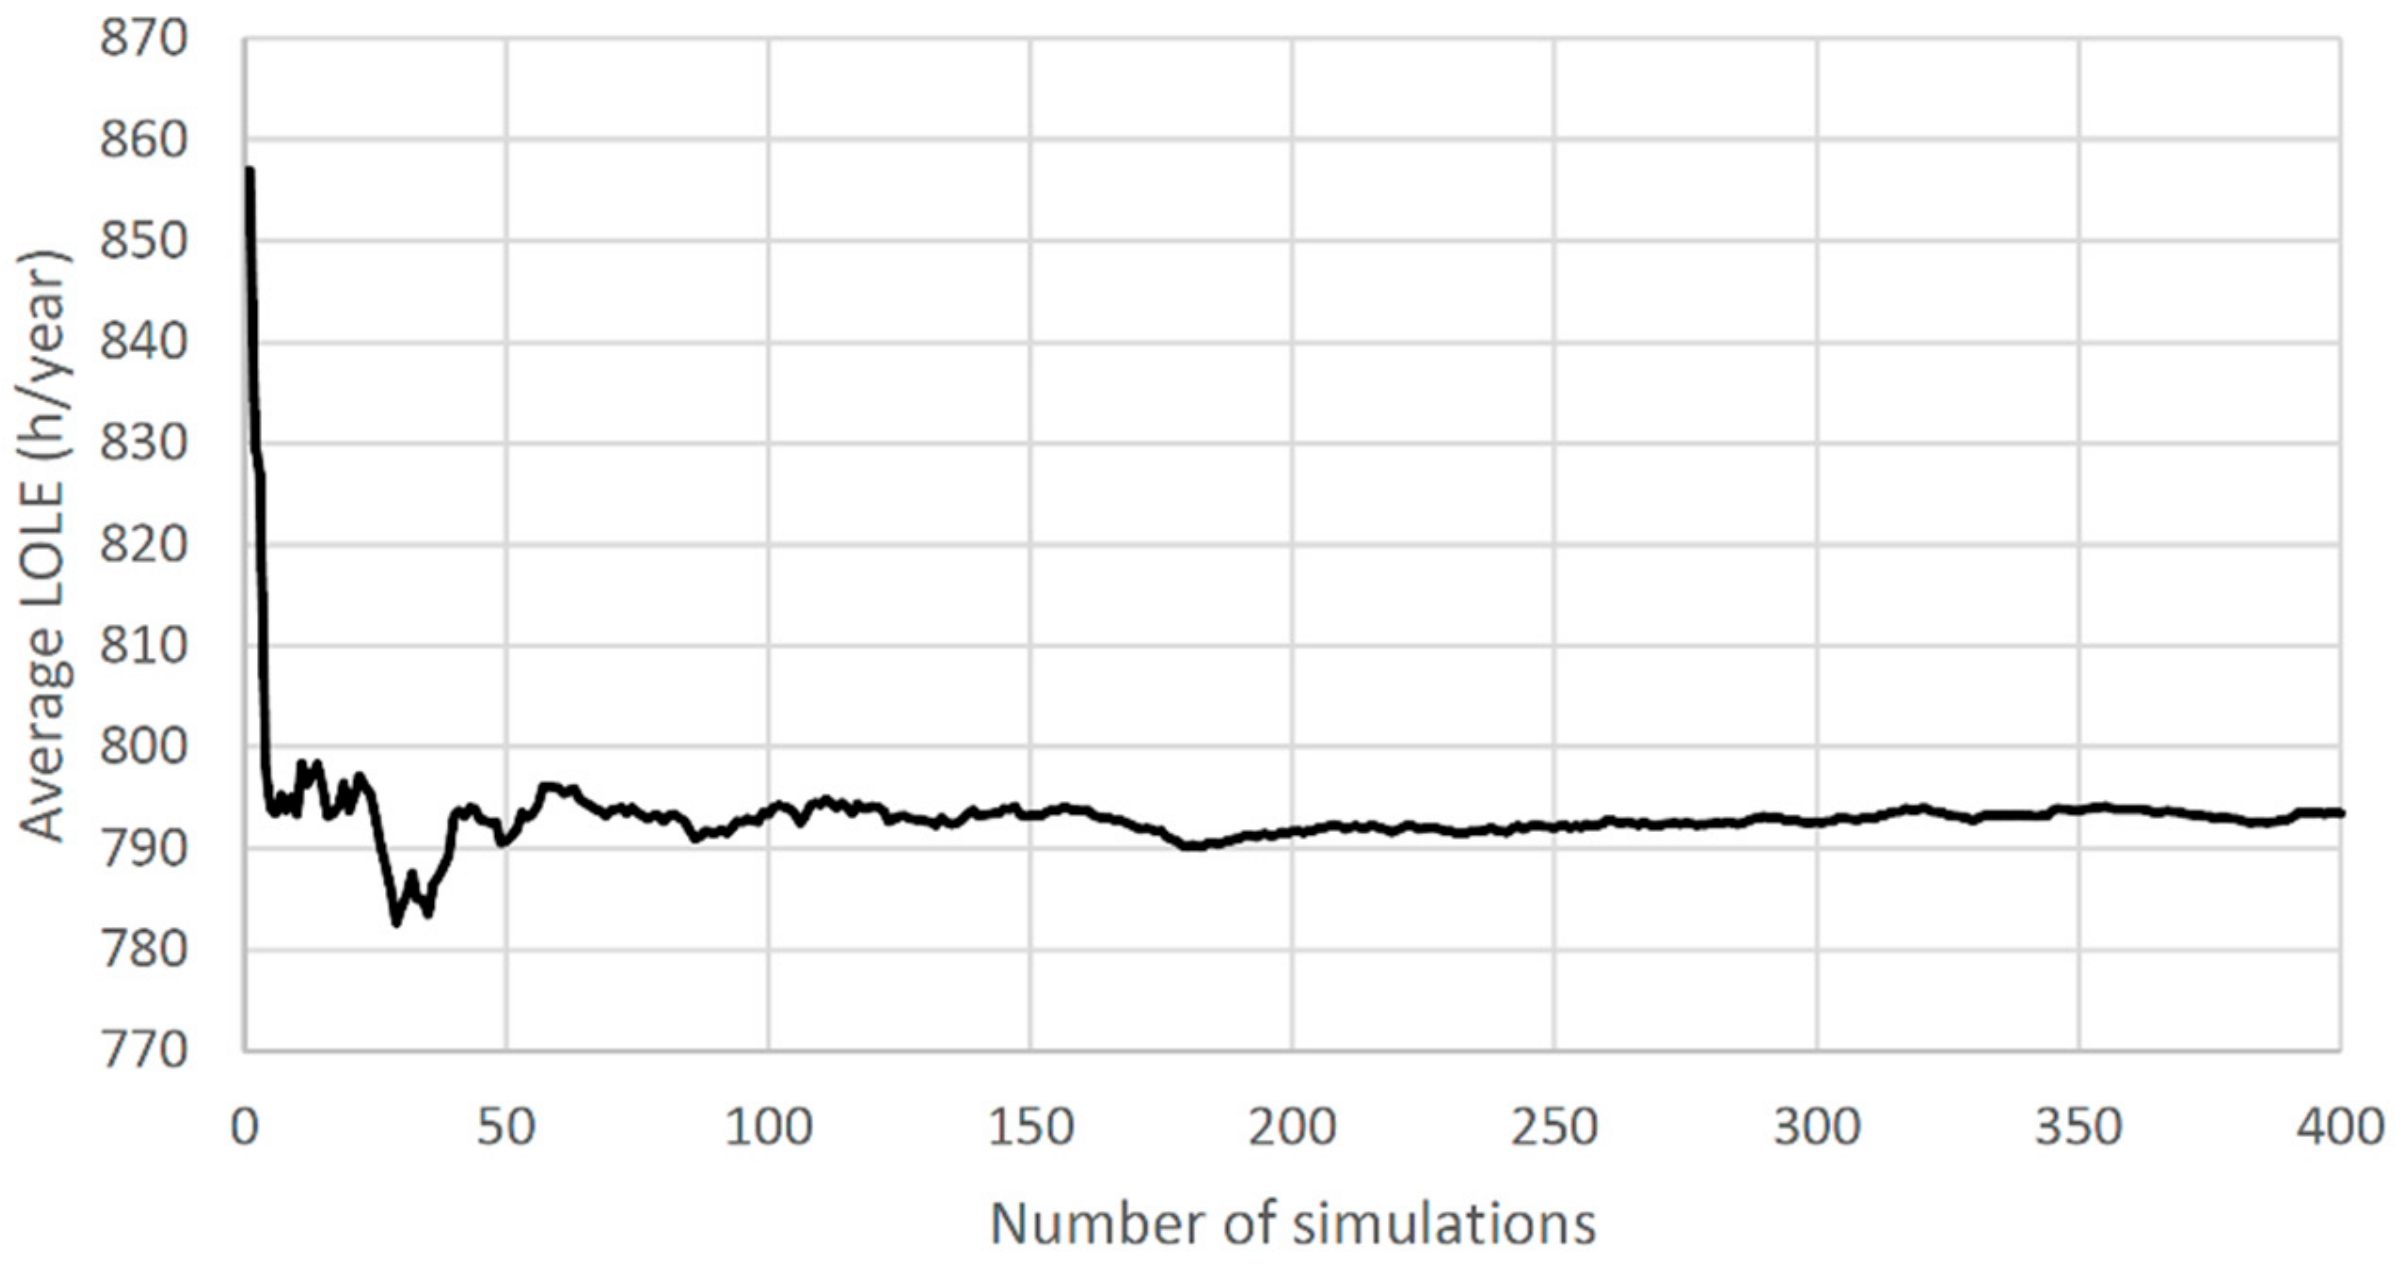
    Evaluate the loss of load expectation (LOLE) index: LOLE = ∑Hi (h/yr).
    Evaluate the loss of load probability (LOLP) index: LOLP = 100·LOLE/8760.
    Calculate average values of the indices for the n simulated years//Consider a possible convergence criterion (*).
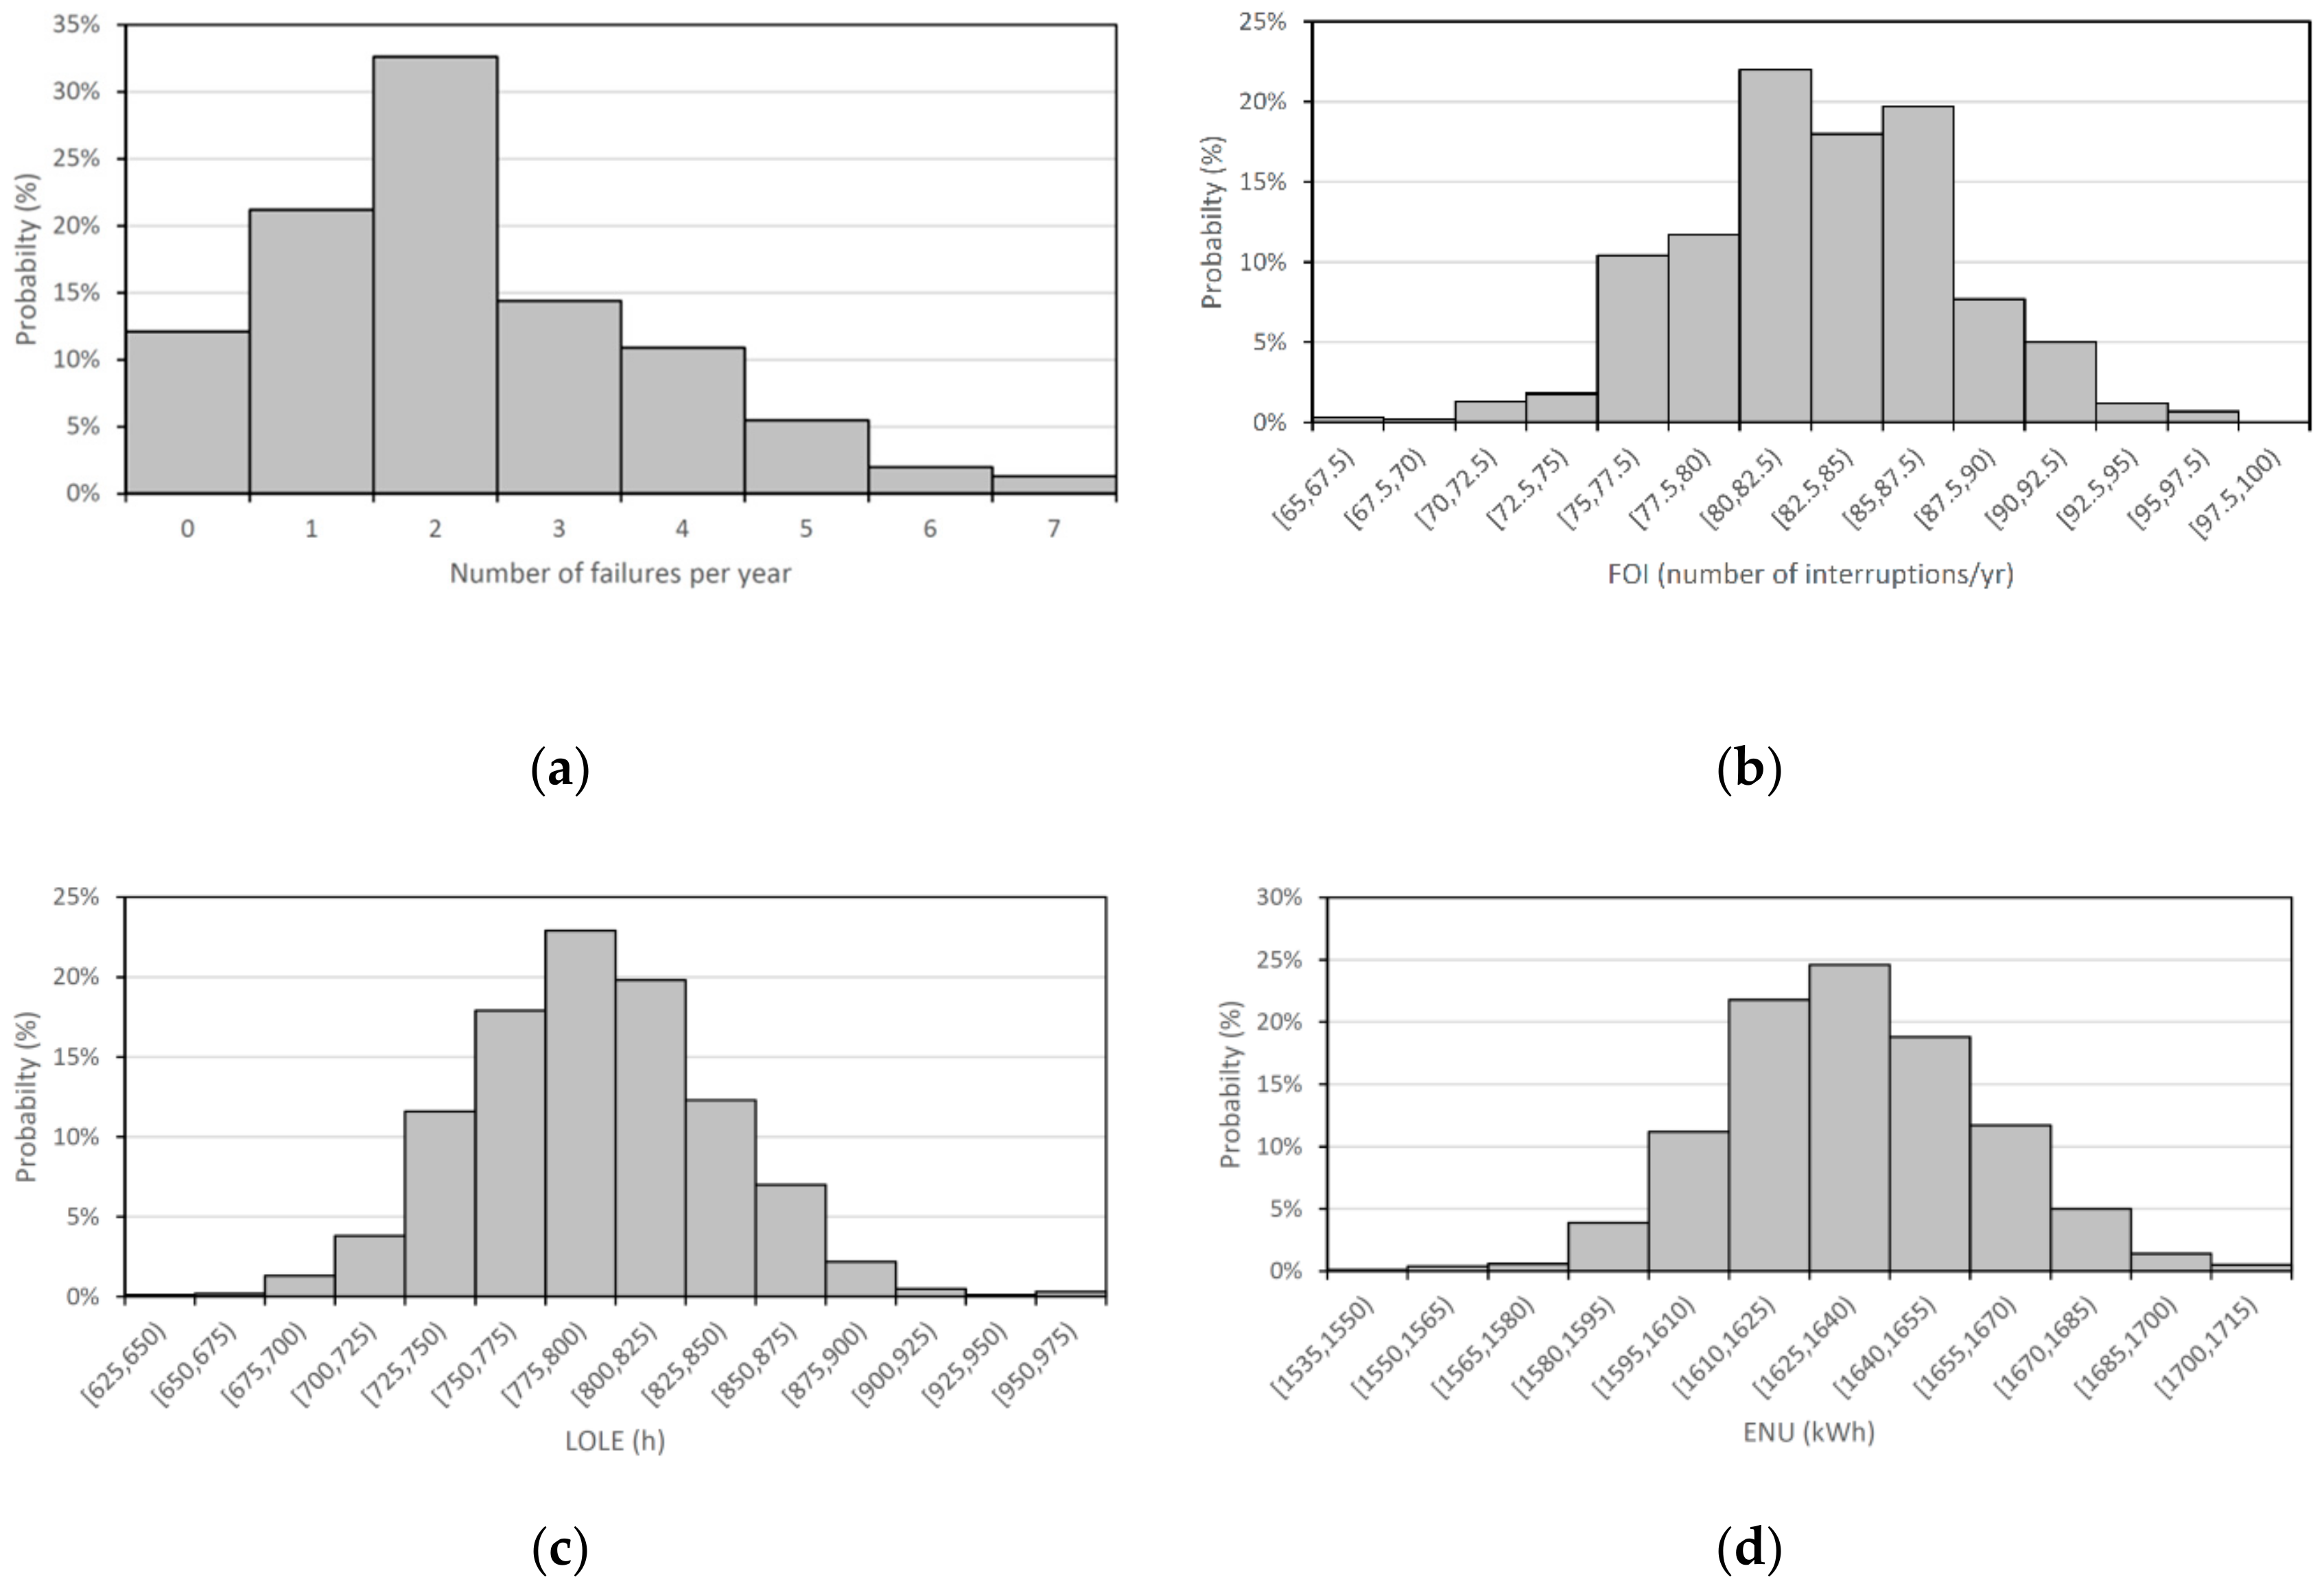
  • Calculate frequency histograms for the reliability indices per year.
(*) A possible convergence criterion is to stop the process if for 10 consecutive years, for example, the average values of the indices vary less than a fixed value.

3. Results

In this section, the reliability of supply is evaluated for a real SAPV system, using the proposed methodology.
On the one hand, using the registered demand data of a real consumer during a whole year, a deterministic design (DD) using equations (1) to (6) provides a design of PVpeak = 4 kW. Assuming n c = 4 days, it results in Qb = 35 kWh (Table 1). The selected case study developed corresponds to a dwelling, but the proposed method can be applied to larger SAPV systems.
On the other hand, using the MCS proposed several situations have been evaluated and different cases are obtained for the considered system.
First, depending on the load demand, PV generation and battery capacity, some days present a generation surplus, as represented in Figure 6a. The PV generation capacity exceeds the load demand and the SOC of the battery has reached SOCmax. This results in surplus power not used (PNU), due to a lack of energy storage capacity in the batteries, that would lead to surplus ENU.
Secondly, there are days when PV generation is low and the battery capacity is exhausted resulting in load curtailments and interruptions of supply to the user, as depicted in Figure 6b. These events result in a loss of energy expectation, or its instantaneous equivalent loss of power expectation (LOPE).
Lastly, in addition to the variability in PV generation, unexpected faults occur in the system that cause PV energy generation interruptions. These faults may result in interruptions of supply depending on the duration of the power interruption, the energy demand during that time and the energy stored in the battery (SOC). Figure 6c shows an example where the fault is successfully covered by the batteries and Figure 6d shows an example where the fault is not covered by the batteries.
The proposed MCS method enables the evaluation of reliability indices taking into account the uncertainty associated to variable PV generation, variable load demand and unexpected failures. The computed LOLE is shown in Figure 7 with an average value of 791.6 h/yr. This continuity of supply corresponds to an average LOLP of 9% and supposes that LOEE equals 450 kWh/yr (Figure 8). ENU is 1634 kWh/yr occurring during 1065 h when there is surplus non-used PV generation.
This MCS method provides not only long-term average values but also the reliability indices distribution, useful to determine possible extreme values. Figure 9—(a) shows the yearly histograms of the number of failures in the generation system, (b) FOI due to a deficit of PV generation and energy storage, including the effect of the system failures, (c) LOLE and (d) ENU.
Although average values of 2 failures per year, 83 energy deficit events, 790 h of LOLE and 1634 kWh of ENU are estimated, more extreme values are not unlikely.

4. Discussion

Results displayed in Figure 6 show that several factors interplay to determine supply interruptions in the system. Insufficient PV generation can lead to power interruptions when the battery energy is exhausted (Figure 6b). Component faults unexpectedly occur that can lead to an interruption of supply depending in the outage duration and the SOC of the battery (Figure 6c,d). The uncertainty associated to solar radiation, demand and component faults and the dependency on previous states of the system (battery SOC) to determine power outages make the evaluation of the system’s expected reliability indices complex.
A method based on sequential MCS is then convenient as proposed in this work. Figure 7 and Figure 8 show that when the number of simulations increases, the reliability indices converge to a steady state value.
One advantage of the proposed method is that the distribution of the reliability indices can be easily obtained (Figure 9). These distributions allow considering extreme values in the design of the SAPV system that are unlikely to happen.
A sensitivity analysis is performed to evaluate the impact of different parameters of the SAPV generation system in the reliability indices. The average failure tax and repair time will affect the number and duration of the interruptions. The capacity of the batteries and the installed peak power of the PV panels will affect the reliability indices experienced by the user in stand-alone installations.
The continuity of supply depends on the failure tax of the system. Figure 10a,b show, respectively, how the LOLP and LOEE indices increase linearly when the failure rate λ c increases from 0.1 f/yr to 20 f/yr for a fixed average repair time of 24 h.
In the proposed method system failures are just one of the three different sources of uncertainty considered (PV generation, power demand, and component faults). In fact, the main contribution to the outage time is due to deficits in the energy balance. As shown in Figure 10 for negligible failure rates, resulting in years with no faults in the PV components, power interruptions occur due to insufficient PV generation and stored energy in the batteries. Reliability indices for years with no component faults are LOLP = 9% and LOLE = 440 kWh for the installed PV power and battery storage resulting from the deterministic design. These results show that the design method based on worst case scenarios can lead to inadequate continuity of supply levels.
The average repair time after any failure also affects the reliability indices. Figure 11a,b show, respectively, how the LOLP and LOEE indices increase linearly when the average TTR increases from 6 h to 7 days for a fixed failure tax of 2 f/yr.
Higher installed peak power (PVpeak) in the PV panels will suppose increased self-sufficiency of the SAPV system. A sensitivity analysis is performed for variable PVpeak with fixed failure rate (2 f/yr), repair time (24 h) and for several values of Qb, from 10 to 50 kWh. Figure 12 shows how increasing PVpeak from 1 kWp to 8 kWp improves exponentially the LOLP, while further increases result in marginal improvements. The same can be said about the LOEE.
Another sensitivity analysis is performed for variable Qb and fixed λ c (2 f/yr), repair time (24 h) and varying PVpeak from 4 to 10 kW. Figure 13 shows how increasing Qb from 1 kWh to 25 kWh improves exponentially the LOLP, while further increases result in a much slower decrease. The same can be said about the LOEE. Similarly, the ENU is reduced as Qb increases up to the same limit of Qb = 25 kWh where further reductions are marginal.
The results shown demonstrate the usefulness of reliability analysis based on MCS to improve the design of SAPV systems. It is observed that the optimal values of Qb are between 20 and 30 kWh, while higher values provide very little improvements to the system. Likewise, it is observed that the installed power PVpeak must be increased to values between 6 and 8 kW in order to obtain a LOLP around 2%. Comparing to the initial deterministic design (PVpeak = 4 kW and Qb = 35 kWh are shown as circled points in Figure 12 and Figure 13), this means that it is more convenient to increase PVpeak and slightly reduce Qb (to a value of 25–30 kWh). This type of design is the only one that can guarantee continuity in the supply, based on statistical values.
The main contributions of this work are:
  • Development and implementation of a reliability evaluation method in an SAPV generation system with energy storage.
  • Consideration of the uncertainty associated with the generation, demand and system failures simultaneously.
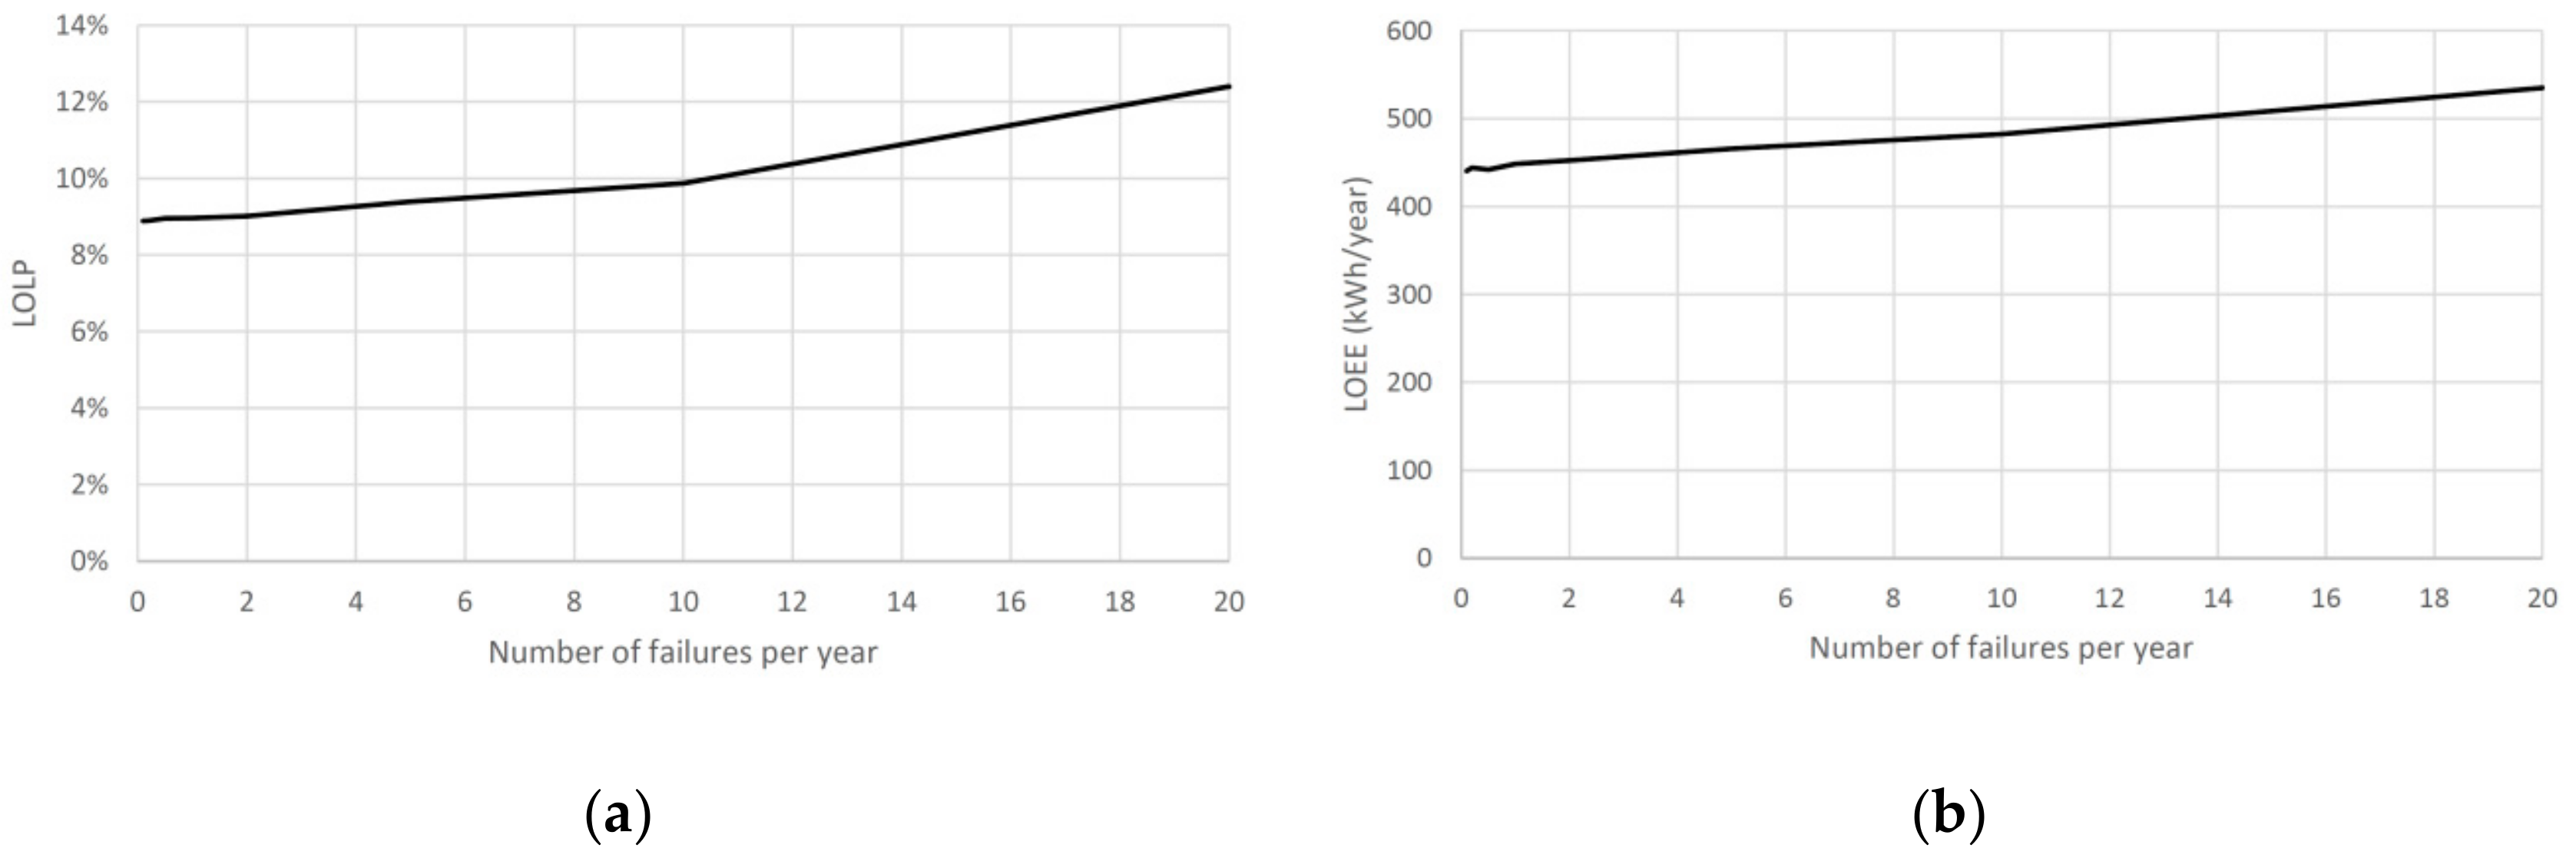
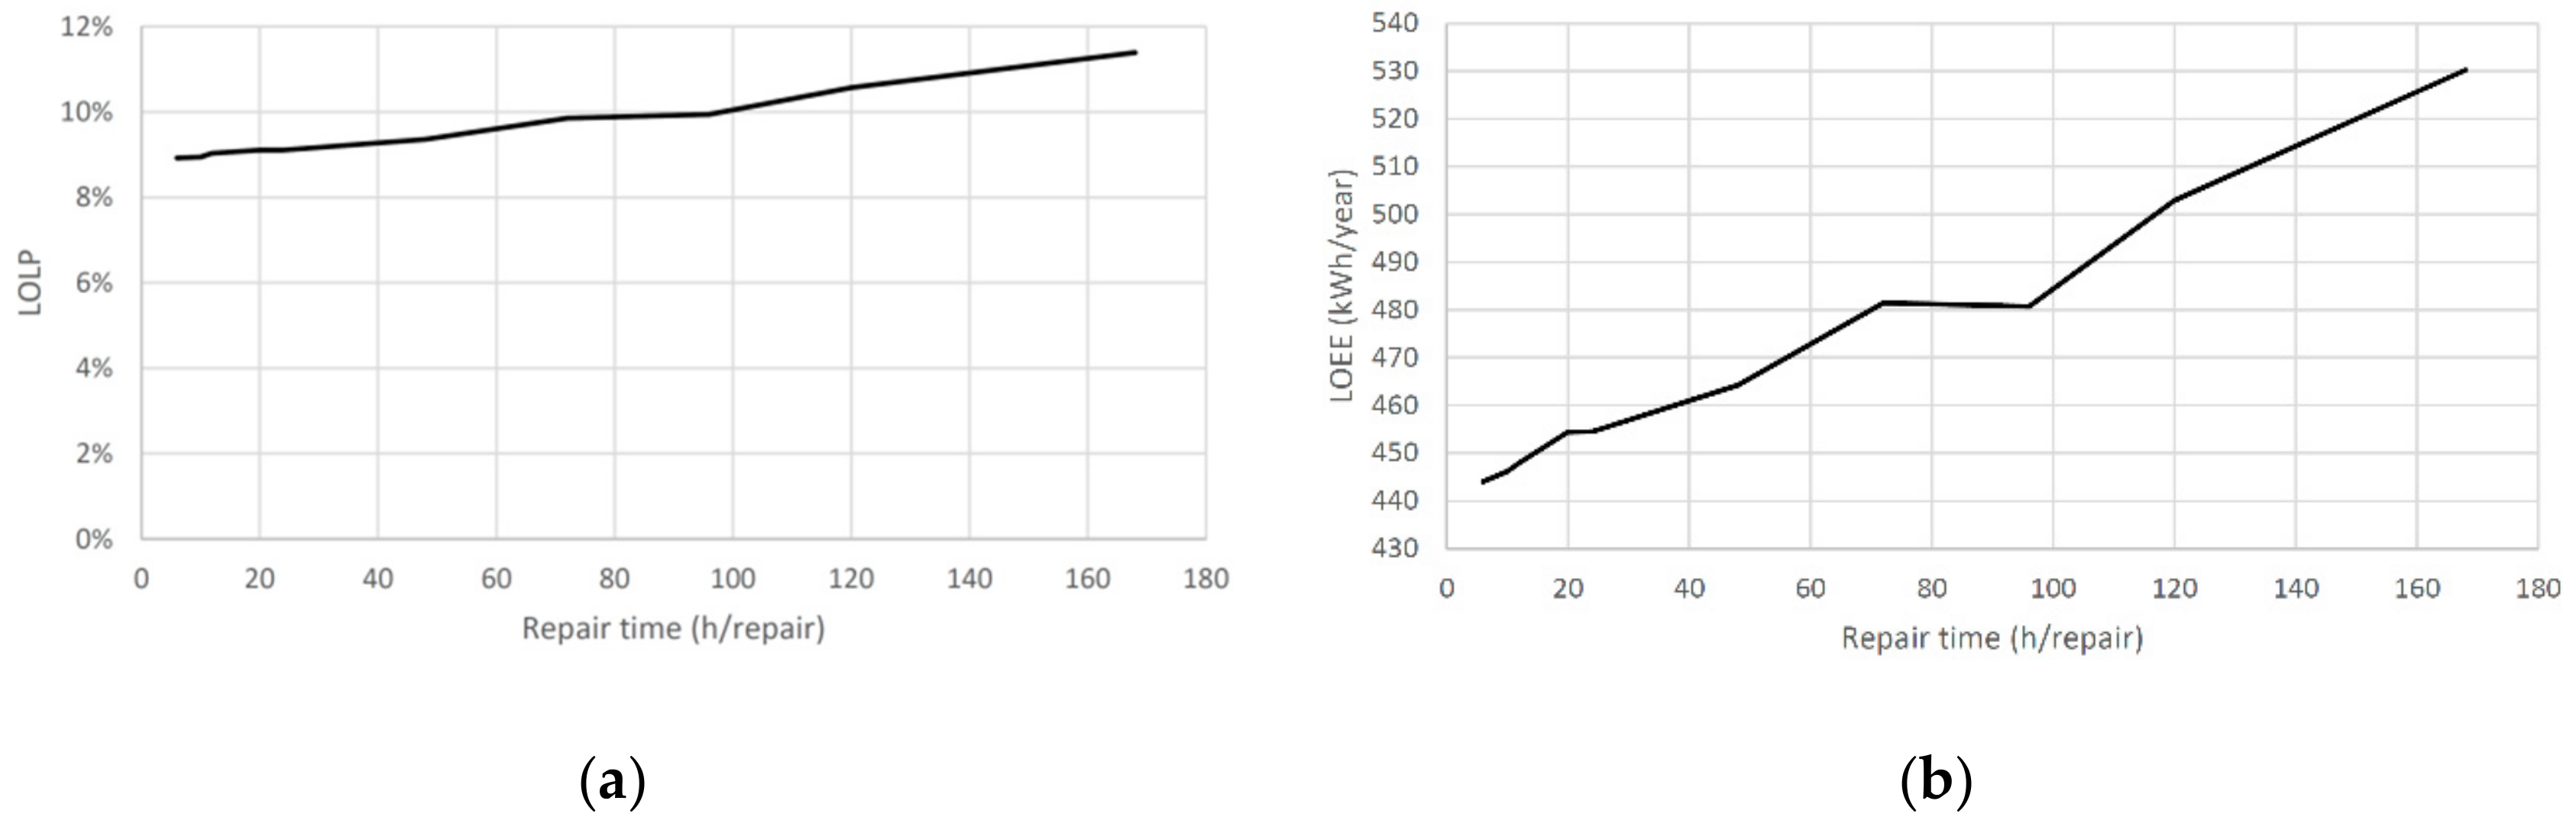
  • Parametric analysis of the influence of TTF and TTR on the operation of the system.
  • Use of a local weather model of PV generation and demand for each day of the year, to achieve realistic results.
  • Demonstration of the advantages offered by the sequential Monte Carlo simulation versus deterministic methods to achieve a design of an SAPV generation system with energy storage based on required continuity of supply values.
  • Although the case study has been carried out for a domestic residence, the method is directly applicable to any other installation if adequate generation and consumption data are available. As an example, it could be applied to small residential communities, agricultural facilities or others.

5. Conclusions

The application of the developed probabilistic method enables the evaluation of reliability indices according to the system parameters. From the experimental results it can be concluded that, as one would expect, the values of loss of load probability (LOLP) or loss of energy expectation (LOEE) indices increase as the average failure rate per year and the average repair time increase. However, this increase is very small for moderate increases in the failure rate in the panels and battery controller (between 1 failure every 10 years and 3 failures per year) and in the average time to repair (between 6 and 24 h). This analysis makes it possible to evaluate the utilization of solar panels with greater robustness and an assistance service with a limited response time.
From the sensitivity analysis carried out in the presented case study, it is concluded that using a standard deterministic method based in worst case scenarios, as stated in Section 2, for the initial design of the installed power of photovoltaic panels and the battery capacity criteria results in inadequate levels of reliability. The developed method allows the determination of the expected continuity of supply values based on the energy parameters of the installation and the probability distributions associated with failure and repair times. It is concluded that the deterministic design results in an undersized installed power in PV panels and an oversized battery capacity.
The reliability assessment method proposed by the authors in Section 3 enables an optimal design of the installed power and the energy storage for the desired reliability in the system supply (a LOLP around 2%).
The use of renewable energy sources, such as solar energy, is one of the keys to improving energy sustainability. However, the intermittent nature of these sources and their difficult management are great disadvantages for their use. To improve these aspects, energy storage systems are used. As demonstrated in this paper, if the design of renewable energy facilities is not carried out with appropriate criteria, supply interruption periods may be inadmissible. Very few consumers would be willing to rely on energy systems that cause frequent interruptions. The article demonstrates that a design based on reliability parameters is possible, providing higher security to users and improving their confidence in these sustainable energy systems.
The obtained results can also be useful to guide the design of new installations in the same geographical area. In addition, the presented analysis method enables to draw conclusions about the modifications needed in a facility in which the admissible reliability criteria are not met. The results prove which measures will be more effective to improve reliability: increase batteries capacity, installed peak power or both at once. Without this kind of analysis, some extensions of facilities could be ineffective, have a very low impact or represent a very high and unjustified cost.
The presented case study and the discussion of the results show that in this type of stand-alone systems there are situations of lack of energy as well as moments with ENU due to an excess of generation. The diversity of consumers and their energy systems suggests studying the creation of small microgrids formed by several facilities such as the one described in this paper, interconnected by the grid, so that these facilities can be supported by energy transfers between them. Reliability analysis of these small communities linked in microgrids is now an objective for future research of the authors.

Author Contributions

Conceptualization and methodology, E.Q. simulation software design C.R.-B. experiments design and validation, all authors; formal analysis, E.Q. and C.R.-P. data curation C.R.-B., G.E.-E., and E.Q. writing-original draft preparation, E.Q., C.R.-B., and G.E.-E. writing-review and editing, all authors; supervision E.Q. and C.R.-P. funding acquisition, all authors. All authors have read and agreed to the published version of the manuscript.

Funding

This work has been supported by research funds of the Universitat Politècnica de València.

Acknowledgments

This work has been supported by the Universitat Politècnica de València.

Conflicts of Interest

The authors declare no conflict of interest.

Abbreviations

ACalternating current
BCbattery controller
DCdirect current
DNdistribution network
Ebenergy contributed by the battery
Eddaily energy consumption
E1excess energy produced by the photovoltaic panels
ENUenergy not used
FOIfrequency of interruptions
GCSgenerating capacity sequence
HREShybrid renewable energy systems
LOEEloss of energy expectation index
LOLPloss of load probability index
LOLEloss of load expectation index
LOPEloss of power expectation index
MCSMonte Carlo simulation
ncconsecutive cloudy days
Pd(t)instantaneous power demand
Pd(peak)maximum demanded power
PNUpower not used
PVpeakrated power installed in the photovoltaic panels
PS(t)power produced by the photovoltaic array
PVphotovoltaic array generation system
Qbbattery capacity
SAPVstand-alone photovoltaic system
SOCstate of charge of battery
SOCmaxmaximum admissible value of SOC
SOCminminimum admissible value of SOC
TTFtime to failure
TTRtime to repair
λ b battery failure rate per year
λ c photovoltaic panel array and battery controller failure rate per year
λ i inverter failure rate per year
η b li-ion battery efficiency
ηcbattery charging efficiency
ηdbattery discharging efficiency

References

  1. Twaha, S.; Ramli, M.A. A review of optimization approaches for hybrid distributed energy generation systems: Off-grid and grid-connected systems. Sustain. Cities Soc. 2018, 41, 320–331. [Google Scholar] [CrossRef]
  2. IEA PVPS. Trends 2018 in Photovoltaic Applications; T1-34:2018; IEA PVPS: Paris, France, 2018; Available online: http://www.iea-pvps.org/fileadmin/dam/intranet/task1/IEA_PVPS_Trends_2018_in_Photovoltaic_Applications.pdf (accessed on 3 February 2020).
  3. Masson, G.; Latour, M. Self-consumption as the new Holy Grail of the PV industry: From theory to reality. In Photovoltaics International, 17th ed.; PV Tech: London, UK, 2012; pp. 166–169. [Google Scholar]
  4. Mandelli, S.; Barbieri, J.; Mereu, R.; Colombo, E. Off-grid systems for rural electrification in developing countries: Definitions, classification and a comprehensive literature review. Renew. Sustain. Energy Rev. 2016, 58, 1621–1646. [Google Scholar] [CrossRef]
  5. Luthander, R.; Widén, J.; Nilsson, D.; Palm, J. Photovoltaic self-consumption in buildings: A review. Appl. Energy 2015, 142, 80–94. [Google Scholar] [CrossRef] [Green Version]
  6. Evans, A.; Strezov, V.; Evans, T.J. Assessment of utility energy storage options for increased renewable energy penetration. Renew. Sustain. Energy Rev. 2012, 16, 4141–4147. [Google Scholar] [CrossRef]
  7. Decree, R.; del Estado, B.O. Available online: https://www.boe.es/diario_boe/txt.php?id=BOE-A-2019-5089 (accessed on 23 December 2019).
  8. Bugała, A.; Zaborowicz, M.; Boniecki, P.; Janczak, D.; Koszela, K.; Czekała, W.; Lewicki, A. Short-term forecast of generation of electric energy in photovoltaic systems. Renew. Sustain. Energy Rev. 2018, 81(Part 1), 306–312. [Google Scholar] [CrossRef]
  9. Abuagreb, M.; Allehyani, M.; Johnson, B.K. Design and Test of a Combined PV and Battery System under Multiple Load and Irradiation Conditions. In Proceedings of the 2019 IEEE Power & Energy Society Innovative Smart Grid Technologies Conference (ISGT), Washington, DC, USA, 17–20 February 2019; pp. 1–5. [Google Scholar] [CrossRef]
  10. Moharil, R.M.; Kulkarni, P.S. Reliability analysis of solar photovoltaic system using hourly mean solar radiation data. Sol. Energy 2010, 84, 691–702. [Google Scholar] [CrossRef]
  11. Dissawa, D.M.L.H.; Godaliyadda, G.M.R.I.; Ekanayake, M.P.B.; Ekanayake, J.B.; Agalgaonkar, A.P. Cross-correlation based cloud motion estimation for short-term solar irradiation predictions. In Proceedings of the 2017 IEEE International Conference on Industrial and Information Systems (ICIIS), Peradeniya, Sri Lanka, 15–16 December 2017; pp. 1–6. [Google Scholar] [CrossRef]
  12. Kaplani, E.; Kaplanis, S. A stochastic simulation model for reliable PV system sizing providing for solar radiation fluctuations. Appl. Energy 2012, 97, 970–981. [Google Scholar] [CrossRef]
  13. Benmouiza, K.; Tadj, M.; Cheknane, A. Classification of hourly solar radiation using fuzzy c-means algorithm for optimal stand-alone PV system sizing. Int. J. Electr. Power Energy Syst. 2016, 82, 233–241. [Google Scholar] [CrossRef]
  14. Ozoegwu, C.G. Artificial neural network forecast of monthly mean daily global solar radiation of selected locations based on time series and month number. J. Clean. Prod. 2019, 216, 1–13. [Google Scholar] [CrossRef]
  15. Palensky, P.; Dietrich, D. Demand Side Management: Demand Response, Intelligent Energy Systems, and Smart Loads. IEEE Trans. Ind. Inform. 2011, 7, 381–388. [Google Scholar] [CrossRef] [Green Version]
  16. Roldán-Blay, C.; Escrivá-Escrivá, G.; Roldán-Porta, C. Improving the benefits of demand response participation in facilities with distributed energy resources. Energy 2019, 169, 710–718. [Google Scholar] [CrossRef]
  17. Roldán-Porta, C.; Roldán-Blay, C.; Escrivá-Escrivá, G.; Quiles, E. Improving the Sustainability of Self-Consumption with Cooperative DC Microgrids. Sustainability 2019, 11, 5472. [Google Scholar] [CrossRef] [Green Version]
  18. Huang, Y.; Yang, L.; Liu, S.; Wang, G. Cooperation between Two Micro-Grids Considering Power Exchange: An Optimal Sizing Approach Based on Collaborative Operation. Sustainability 2018, 10, 4198. [Google Scholar] [CrossRef] [Green Version]
  19. Goel, S.; Sharma, R. Performance evaluation of stand alone, grid connected and hybrid renewable energy systems for rural application: A comparative review. Renew. Sustain. Energy Rev. 2017, 78, 1378–1389. [Google Scholar] [CrossRef]
  20. Weniger, J.; Tjaden, T.; Quaschning, V. Sizing of residential PV battery systems. Energy Procedia 2014, 46, 78–87. [Google Scholar] [CrossRef] [Green Version]
  21. Maleki, A.; Rosen, M.; Pourfayaz, F. Optimal operation of a grid-connected hybrid renewable energy system for residential applications. Sustainability 2017, 9, 1314. [Google Scholar] [CrossRef] [Green Version]
  22. Cao, S.; Hasan, A.; Sirén, K. Matching analysis for on-site hybrid renewable energy systems of office buildings with extended indices. Appl. Energy 2014, 113, 230–247. [Google Scholar] [CrossRef]
  23. Ren, H.; Wu, Q.; Gao, W.; Zhou, W. Optimal operation of a grid-connected hybrid PV/fuel cell/battery energy system for residential applications. Energy 2016, 113, 702–712. [Google Scholar] [CrossRef]
  24. Ghafoor, A.; Munir, A. Design and economics analysis of an off-grid PV system for household electrification. Renew. Sustain. Energy Rev. 2015, 42, 496–502. [Google Scholar] [CrossRef]
  25. Maleki, A.; Hajinezhad, A.; Rosen, M.A. Modeling and optimal design of an off-grid hybrid system for electricity generation using various biodiesel fuels: A case study for Davarzan, Iran. Biofuels 2016, 7, 669–712. [Google Scholar] [CrossRef]
  26. Castillo-Cagigal, M.; Caamano-Martín, E.; Matallanas, E.; Masa-Bote, D.; Gutiérrez, A.; Monasterio-Huelin, F.; Jiménez-Leube, J. PV self-consumption optimization with storage and Active DSM for the residential sector. Sol. Energy 2011, 85, 2338–2348. [Google Scholar] [CrossRef] [Green Version]
  27. Zhou, W.; Lou, C.; Li, Z.; Lu, L.; Yang, H. Current status of research on optimum sizing of stand-alone hybrid solar–wind power generation systems. Appl. Energy 2010, 87, 380–389. [Google Scholar] [CrossRef]
  28. Yadav, A.K.; Chandel, S.S. Solar radiation prediction using Artificial Neural Network techniques: A review. Renew. Sustain. Energy Rev. 2014, 33, 772–781. [Google Scholar] [CrossRef]
  29. JPW Stackhouse. Surface meteorology and Solar Energy. Atmospheric Science Data Center. 2011. Available online: https://eosweb.larc.nasa.gov/ (accessed on 3 February 2020).
  30. Roldán-Blay, C.; Escrivá-Escrivá, G.; Roldán-Porta, C.; Álvarez-Bel, C. An optimisation algorithm for distributed energy resources management in micro-scale energy hubs. Energy 2017, 132, 126–135. [Google Scholar] [CrossRef]
  31. Hoevenaars, E.J.; Crawford, C.A. Implications of temporal resolution for modeling renewables-based power systems. Renew. Energy 2012, 41, 285–293. [Google Scholar] [CrossRef]
  32. Cao, S.; Sirén, K. Impact of simulation time-resolution on the matching of PV production and household electric demand. Appl. Energy 2014, 128, 192–208. [Google Scholar] [CrossRef]
  33. Cucchiella, F.; D’Adamo, I.; Gastaldi, M.; Stornelli, V. Solar Photovoltaic Panels Combined with Energy Storage in a Residential Building: An Economic Analysis. Sustainability 2018, 10, 3117. [Google Scholar] [CrossRef] [Green Version]
  34. Kosmadakis, I.E.; Elmasides, C.; Eleftheriou, D.; Tsagarakis, K.P. A Techno-Economic Analysis of a PV-Battery System in Greece. Energies 2019, 12, 1357. [Google Scholar] [CrossRef] [Green Version]
  35. Werner, C.; Breyer, C.; Gerlach, A.; Beckel, O. Photovoltaic with Energy Storage: An Overview on Economics, System Design and Politics. In Proceedings of the 27th European Photovoltaic Solar Energy Conference, Frankfurt, Germany, 24–28 September 2012. [Google Scholar]
  36. Faza, A. A probabilistic model for estimating the effects of photovoltaic sources on the power systems reliability. Reliab. Eng. Syst. Saf. 2018, 171, 67–77. [Google Scholar] [CrossRef]
  37. Borges, C.L.T. An overview of reliability models and methods for distribution systems with renewable energy distributed generation. Renew. Sustain. Energy Rev. 2012, 16, 4008–4015. [Google Scholar] [CrossRef]
  38. Billinton, R. Reliability considerations in the utilization of wind energy, solar energy and energy storage in electric power systems. In Proceedings of the 2006 International Conference on Probabilistic Methods Applied to Power Systems, Stockholm, Sweden, 11–15 June 2006; IEEE: Piscataway, NJ, USA, 2006; pp. 1–6. [Google Scholar]
  39. Roldán-Blay, C.; Roldán-Porta, C.; Peñalvo-López, E.; Escrivá-Escrivá, G. Optimal Energy Management of an Academic Building with Distributed Generation and Energy Storage Systems. IOP Conf. Ser. Earth Environ. Sci. 2017, 78, 012018. [Google Scholar] [CrossRef] [Green Version]
  40. Pérez-Navarro, A.; Alfonso, D.; Ariza, H.E.; Cárcel, J.; Correcher, A.; Escrivá-Escrivá, G.; Hurtado, E.; Ibáñez, F.; Peñalvo, E.; Roig, R.; et al. Experimental verification of hybrid renewable systems as feasible energy sources. Renew. Energy 2016, 86, 384–391. [Google Scholar] [CrossRef]
  41. Wang, J.Y.; Qian, Z.; Zareipour, H.; Wood, D. Performance assessment of photovoltaic modules based on daily energy generation estimation. Energy 2018, 165 Pt B, 1160–1172. [Google Scholar] [CrossRef]
  42. Eltawil, M.A.; Zhao, Z. Grid-connected photovoltaic power systems: Technical and potential problems: A review. Renew. Sustain. Energy Rev. 2010, 14, 112–129. [Google Scholar] [CrossRef]
  43. Zhang, P.; Li, W.; Li, S.; Wang, Y.; Xiao, W. Reliability assessment of photovoltaic power systems: Review of current status and future perspectives. Appl. Energy 2013, 104, 822–833. [Google Scholar] [CrossRef]
  44. Collins, E.; Dvorack, M.; Mahn, J.; Mundt, M.; Quintana, M. Reliability and availability analysis of a fielded photovoltaic system. In Proceedings of the 34th IEEE Photovoltaic Specialists Conference (PVSC), Philadelphia, PA, USA, 7–12 June 2009. [Google Scholar]
  45. Billinton, R.; Jonnavithula, A. Application of sequential monte carlo simulation to evaluation of distributions of composite system indices. IEEE Proc. Gener. Transm. Distrib. 1997, 144, 87–90. [Google Scholar] [CrossRef]
  46. Billinton, R.; Allan, R.N. Reliability Evaluation of Power Systems; Springer: Boston, MA, USA, 1984. [Google Scholar]
Figure 1. Stand-alone photovoltaic (SAPV) system electric scheme.
Sustainability 12 01274 g001
Figure 2. Daily load profile for residential customers and hourly generation curve in different seasons.
Sustainability 12 01274 g002
Figure 3. Useful energy contributed by the battery in one day.
Sustainability 12 01274 g003
Figure 4. Up and down sequence for the photovoltaic (PV) generation unit.
Sustainability 12 01274 g004
Figure 5. Flowchart of the reliability evaluation method for the SAPV system.
Sustainability 12 01274 g005
Figure 6. (a) (15/4/2018) Day without failures and surplus energy not used (ENU) (ENU > 0); (b) (12/11/2018) Day without failures with an interruption due to a deficit of generation which is not supplied by the battery (state of charge (SOC) < SOCmin and LOEE > 0); (c) (20/4/2018) day with a failure that is supplied by the battery (SOC > SOCmin and LOEE = 0); (d) (11/11/2018) day with a failure which is not covered by the battery (SOC < SOCmin and LOEE > 0).
Sustainability 12 01274 g006aSustainability 12 01274 g006b
Figure 7. Evolution of average loss of load expectation (LOLE) along 400 simulations.
Sustainability 12 01274 g007
Figure 8. Evolution of average loss of energy expectation (LOEE) along 400 simulations.
Sustainability 12 01274 g008
Figure 9. (a) Histograms of the number of failures in the generation system, (b) number of supply interruptions, (c) LOLE and (d) ENU.
Sustainability 12 01274 g009
Figure 10. (a) loss of load probability (LOLP) and (b) LOEE evolution when λ c varies from 0.1 to 20 f/yr.
Sustainability 12 01274 g010
Figure 11. LOLP (a) and LOEE (b) evolution when time to repair (TTR) varies from 6 h to 7 days.
Sustainability 12 01274 g011
Figure 12. LOLP evolution when PVpeak varies from 1 to 8 kWp for several values of Qb.
Sustainability 12 01274 g012
Figure 13. LOLP evolution when Qb varies from 1 to 95 kWh for several values of PVpeak.
Sustainability 12 01274 g013
Table 1. Generation and demand data.
MethodVariableValueComments
DDPd(peak)3 kWMaximum demanded power
DDηc, ηd0.9Efficiency of Li-ion battery (charge and discharge)
DD n c 4Consecutive cloudy days
DD S O C m i n 15%SOC min considered
DDPVpeak4 kWObtained rated power in PV panels (24 m2)
DDQb35 kWhObtained battery capacity
MCSFailure rate λ c 2 f/yrExponential distribution
MCSRepair time24 hRayleigh distribution

