Scientific Landscape of Sustainable Urban and Rural Areas Research: A Systematic Scientometric Analysis


1
Centre for Mechanical Technology and Automation, Department of Mechanical Engineering, Universidade de Aveiro, 3810-193 Aveiro, Portugal
2
School of Technology, Federal University of Santa Catarina, Trindade, Florianopolis, Santa Catarina 88040-900, Brazil
*
Author to whom correspondence should be addressed.
Sustainability 2020, 12(4), 1293; https://0-doi-org.brum.beds.ac.uk/10.3390/su12041293
Submission received: 7 January 2020
/
Revised: 28 January 2020
/
Accepted: 7 February 2020
/
Published: 11 February 2020
(This article belongs to the Section Sustainable Urban and Rural Development)
Abstract
:Urban and rural areas are the cradles of human development and civilization as all practical progress and feasible products have emerged from these places. Having a clear understanding of the sustainability of these areas, especially the progress of research in this field, is highly important. This study undertakes a comprehensive scientometric analysis to visualize and quantitatively measure the outcome of the scientific enterprise to construct sustainable urban and rural areas. The scientific productivity of recorded publications, their impacts, and their importance were systematically measured in diverse aspects by virtue of ten distinctive techniques. A critical assessment of the respected criteria for sustainable urban and rural areas is presented in order to further clarify its boundaries with other related topics, as well as providing a clear benchmark for future studies. After screening the search results between 1900 and 2018 on the Web of Science database, 7397 publications explicitly related to sustainable urban and rural areas were extracted and analyzed by the CiteSpace software via the relevant bibliometric indicators. The results of this study shed light on the trends and patterns, consisting of kernel research areas, countries, journals, institutions, and how these entities have been concatenated, inside the bibliographic records around sustainable urban and rural areas. The findings facilitate in identifying the barriers and weakness in the current sustainable urban and rural areas research, and consequently help in identifying auspicious directions for prospective investigations.
1. Introduction
Urban and rural areas—consisting of all types of settlements such as city, town, and countryside developments—are considered as the largest participant to the world economy, environmental impact, energy demand, social interaction, and greenhouse gas emissions [1,2]. An adequate recognition of the nature and aspects of urban and rural areas is important for establishing appropriate future policies aligned with sustainable urban development goals [3,4]. In fact, the prime role of cities—in all aspects of people’s lives, as well as in the sustainability of natural and built environments—is the major testimony for considering urban and rural areas as essential entities in all tactical blueprints for the future [5,6]. In order to expedite the acceleration of sustainable development in urban and rural areas, in this study the state of the art is surveyed, and its past status, current scenarios, and future prospects and outlooks are tackled to identify both the current shortcomings and also recent achievements.
1.1. Importance and Objectives
A clear but an unpleasant perspective for the near future is in front of humankind at the dawn of the global climate emergency [7,8,9]. We are facing the challenges of energy provision for a rapidly growing world population, global warming (or more correctly global heating) and climate change (or more correctly climate crisis), polluting fossil fuel dependency, and high rates of immigration due to poverty, droughts, wars, and so on toward developed countries to have a better welfare and wellbeing [10,11,12]. These challenges do not leave us much space or time for extravagance and indulgence.
Actually, it is inevitable to put a limitation on energy efficiency, consider criteria for exploitation of resources and direction of investment, as well as impose a restriction on the allowable human footprint on biodiversity. Consequently, ignoring these limitations and lack of concern to the 2030 sustainable development goals will create much higher negative externalities for future generations [13,14,15]. In other words, our developments must be aligned with a specific direction that is so-called ‘sustainability’. As most human activities take place in cities, towns, and rural areas, investigating sustainability of urban and rural areas is a critical task. This also forms the rationale of this study. The aim of this paper is to reveal the tendency of academia and the trends of science between 1900 and 2018 on the topic of sustainable urban and rural areas, and show how this topic has evolved during the course of time. Furthermore, this paper has a mission to serve as an initial step into developing a roadmap of research into the United Nations’ (UN) 2030 sustainable development agenda and push the scientific community to materialize sustainable development goals.
1.2. The Scientometry Concept
This study consists of qualitative, quantitative, and computational approaches to measure and analyze the literature by different techniques and various criteria consist of the number of publications as well as their influence, reference sets and citations. The results can be considered as a precious roadmap for researchers, scientists, practitioners, and policymakers. Additionally, the scientometric results can shed light on the condition of published communication and accordingly stakeholders can also present substantial contributions in developing and obtaining intellectual wealth.
Although Vassily Nalimov in the 1960s coined the term “scientometrics” [16] and the word of “bibliometrics” first invented by Alan Pichard in 1969 as the application of mathematics on recorded publication or any other communication media, most of the literature pieces believe that scientometric originated from outstanding works of Eugene Garfield as a founder of “journal citation”, “impact factor (IF)”, “current content”, “ISI” and “science citation index (SCI)” [17,18] as well as pioneer Derek Price, known as a father of scientometrics for his brilliant works in this area [19,20,21,22].
The top five journals in the scientometrics area from top to bottom respectively are as follows: Scientometrics, The American Society for Information Science, Nauchno-Tekhnicheskaya Informatsiya Series 1 and 2, Information Processing and Management, and Information Science. They are ranked according to the number of records [16].
Scientometry can reveal some amazing relations concealed behind scientific literature. By analyzing statistical relationship of scientometric indicator, Uzun [23] concluded that the citation impact of published papers highly depends on the number of authors per paper and the number of cited references is proportional to its citation impact to some extent; however, Wang et al. [24] found that potential communication relationship and author keyword coupling are highly correlated and that the old potential communication relationship and the new author keyword coupling are correlated and consistent.
The details of the scientometric technical approach employed in this study is provided in the methodology section containing ten distinct techniques to visualize hidden interlinks among publications on sustainable urban and rural areas (SURA). Moreover, there are scientific metrics—such as novelty, betweenness centrality (BS), burst, and so on—employed as an indicator to analyze accompanied by those techniques. Appendix A and Appendix B illustrate the meaning and application of these metrics.
1.3. The Sustainability Concept
To make this concept clearer, this part begins with the definition of sustainability. One may find various definitions for this concept, but the Brundtland Commission in 1987 presented a well-known widely accepted definition: “Sustainable development is development that meets the needs of the present without compromising the ability of future generations to meet their own needs” [25]. Nonetheless, this description is general but well described the criteria by which sustainability can be identified. Recently literature pieces consider four interlinked pillars of social, economic, environmental, and governance for sustainability [26,27], which may lead to community wellbeing. It would be obvious that its application in each area of activity must satisfy these four aspects to be considered as a sustainable activity. According to UNECE-ITU [28], one of the five regional commissions under the jurisdiction of the United Nations Economic and Social Council, the economy pillar consists of indicators such as information and communication technology (ICT), innovation, employment, trade productivity, and physical infrastructure. In the society pillar also, there are education, health, safety, housing, and culture and finally for the environment pillar there are air quality, quality and accessibility of water, level of noise, biodiversity, and energy. These indicators are important, because they will enable us to quantitatively assess a case study and measure its level of sustainability.
On sustainability, it is crucial to know that it is a fuzzy concept such that an activity can be partially sustainable, and an ideal fully sustainable society is unattainable. This concept alludes to all attempts made to improve the technical, social, environmental and economic aspects of development in the biosphere and to protect natural resources [29]. It implies that the sustainability concept has a wide attitude toward development, and it is impossible to cover all features of sustainability in a single research study. Hence, each research in this area regarding SURA is expected to address just a specific feature of sustainability on urban and rural areas. In the section of results and discussion, different features of sustainability would be revealed and illustrated.
Some unprecedented socio-environmental events have made the concept of sustainability a vital concern in all aspects of development for cities and settlement. The growing rate of energy consumption from 8.92 gigatonnes of oil equivalent per year (Gtoe/y) in 2011 to the predicted value of 14 Gtoe/y in 2020 [30] clearly shows how fast resources on earth are being depleted. This fact accompanied by ozone layer destruction [31], climate change and global warming [32] together attract worldwide attention to the subject of sustainability [33]. Moreover, by going deeper into its real practical instances, the concept of sustainability divulges its inherent interdisciplinary nature, which gathers miscellaneous fields of science together from environmentally friendly electrochemical engineering to earth science, and from green synthesis and technology to conservation biology and ecological economics [34].
2. Literature Background
In 1960, for the first time the concept of “sustainability” or “sustainable” was introduced to the scientific world by Anderson [35] for the relation between public policy and economic problems. Although there is only one citation for this article, he addressed “sustainable economic growth” well and discussed requirements of economic policy which does not need any kind of growth and established the importance of sustainable direction in this way. Many years after Anderson, peer-reviewed researches confirmed his statements and proved some disadvantages of growing cities and settlements out of control [36,37,38]. Although cities and settlements are a manifestation of humans’ advanced progress, under these circumstances, human population growth and urbanization may resemble a metastatic malignant cancer. In other words, we humans rapidly populate and urbanize and conquer the host—the planet—the way cancer cells do. Growth and conquering result in killing the host and subsequently the inevitable extinction of the human race.
As it was mentioned, immigration to developing countries and residing in cities due to having more job opportunities has already become a frustrating dilemma. In a close future, about 30 years from now, there would be more challenges for cities worldwide owing to the accommodation of more than 66% of population [39]. However, the urbanization rate in some countries has already reached 90%—in Australia, the UK, and the Netherlands to name a few. Available infrastructures should be capable of supporting the expected population in the future. Pollution problems in both air and water, accommodation, transportation and healthcare will become new challenges [40]. According to [15,41] SURA should provide a series of facilities to assist socioeconomic systems based on abovementioned concatenated pillars of sustainability.
The concept of Industry 4.0 [42,43,44,45,46] is advocated as to the ability to substantiate environmental protection towards sustainable supply chains. It is claimed that well implemented Industry 4.0 will affect the entire system of business by reconstructing and/or converting the whole procedure of designing, manufacturing, delivering, and disposing of goods [42]. Many companies and manufacturers have been affected by the advantages of available new tools such as cyberphysical system (CPS) as a computer-based algorithm integrated with Internet-of-Things (IoT) for controlling and screening [47]. These developments triggered the inception for industrial revolution and initiated the fourth generation of industry in order to transform supply chains into highly adaptive networks [48]. According to [49], being smart in all aspects of engineering, procurement and construction, individualizing the customer requirements, and customizing products are inherent features of Industry 4.0. Its implementation is expected to gradually develop into new stances in the field of sustainable trade to improve socioeconomic progress. In consequence of the second digital revolution, today the smart city is a highly popular topic [11].
The city brands of sustainability, smart, or a combination of both—e.g., smart and sustainable city—are gaining extensive popularity. This brings the need of finding effective ways to quantitatively measure and categorize these sustainable/smart terms. For this purpose, Akande et al. [50] employed hierarchical clustering as well as a principal component methodology based on Eurostat data in order to rank 28 European capital cities, which were selected based on territorial typologies for European cities and metropolitan areas. The 32 sustainability indicators extracted from Akande et al. [50] for calculating the city score, is presented in Appendix A. Similarly, Yigitcanlar & Kamzuzzaman [51] evaluated the correlation between the smart and sustainability achievements of 15 cities from the UK to address the question of if the smart city policy could result in sustainability of cities and societies.
Building on the abovementioned study, one of the most important arguments in this area is to draw a clear border, if it exists, between smart and sustainable cities [52]. In 2008, after the IBM CEO lectured on “A Smarter Planet”, the concept of smart cities has attracted more attention especially due to his emphasis on the next leadership agenda [53]. Later, as it is discussed in [12,51], it implies to “almost any form of technology-based innovation in the planning, development, operation and management of cities, for example, the deployment of smart mobility solutions to combat urban traffic challenges, with the offerings of digital technologies and online urban planning opportunities”. Like the sustainability concept, the concept of smart city has no unique definition whereas depending on the attitude and direction of observation, it may have different aspects and definition [54].
Nevertheless here, we mention some recent definitions presented in the literature. For instance, “All practices involve a system of systems approach and a sustainable and balanced view on the economic, societal, environmental and institutional development domains (in the domain of technology, innovation, community wellbeing)” [55]. Likewise, “A community that systematically promotes the overall wellbeing for all its members, and flexible enough to proactively and sustainably become an increasingly better place to live, work and play (in community, wellbeing, sustainability)” [56]. Also, “An innovative city that uses information and communications technology (ICT) and other means to improve quality of life, efficiency of urban operation and services, and competitiveness, while ensuring that it meets the needs of present and future generations with respect to economic, social and environmental aspects (in technology, wellbeing, innovation, sustainability)” [57]. Moreover, as it may be seen, the most recent literature considers the factor of sustainability as a major part of the “smart city” definition which indicates that a city (or any kind of settlements) which cannot satisfy sustainability criteria, albeit exploiting information and communications technology, cannot be considered as a smart city. In fact, being smart is to be aligned with the direction at which finally we could promote the wellbeing of communities and society. In fact, the concept of “smart city”, which is not limited to cities, comprises all kinds of settlements, and, as well and in addition to sustainability, has other pillars such as governance and planning, productivity and innovation, and accessibility [52]. It means that this concept has more limitations and requirements as well which makes it a narrower and advanced notion to be considered for construction of upcoming generation of settlements.
About these up-to-date definitions, we intend to point out some subtle tips. First, having in mind that the word “smart” is equivalent to and synonymous with “intelligent”, we may expect artificial intelligence (AI) to play a major role in all tasks defined as a goal for smart cities. This means having a reliable system that perceives its environment well and takes suitable expedient actions which maximize its chance of successfully achieving its goals, and it should be in the heart of a smart (intelligent) city (or any kind of settlements). AI itself consists of learning, self-correction, and logic conformity and hence, data/regulation acquisition and their implementation to achieve the best approximation are also considered as parts of AI. It is also seen as a major contributor of establishing smart and sustainable cities of the future.
Second, all definitions, as is expected, suffer from too much generality and consequently it makes them looks vague or obscure. Although, tending to present a complete definition encompasses all aspects of “smart city” inevitably leads to this generality. This study offers these additional criteria for “smart city” in order to make it clearer and specific. In order to assign the “smart” feature to a city, it requires exploiting latest technology in all parts of governance and services, reinforced and empowered by AI, accessible to all citizens, and for free or in the cheapest possible cost. Through these additional criteria, big data analysis and IoT are indeed the essential tools to materialize the notion of “smart city”. Now it is obvious that SURAs do not have these supplementary criteria, and hence can be distinguished well from the advanced “smart city” concept.
Last, it should be also noted that although the scientific community studied heat transfer enhancements [58,59,60,61,62,63,64,65,66,67,68,69] as well as improvement of the efficiency and/or coefficient of performance (COP), the thermohydrodynamic system can be considered as one step forward toward SURA. However, in this study only those works dealing directly and explicitly with SURA were considered.
3. Methodology
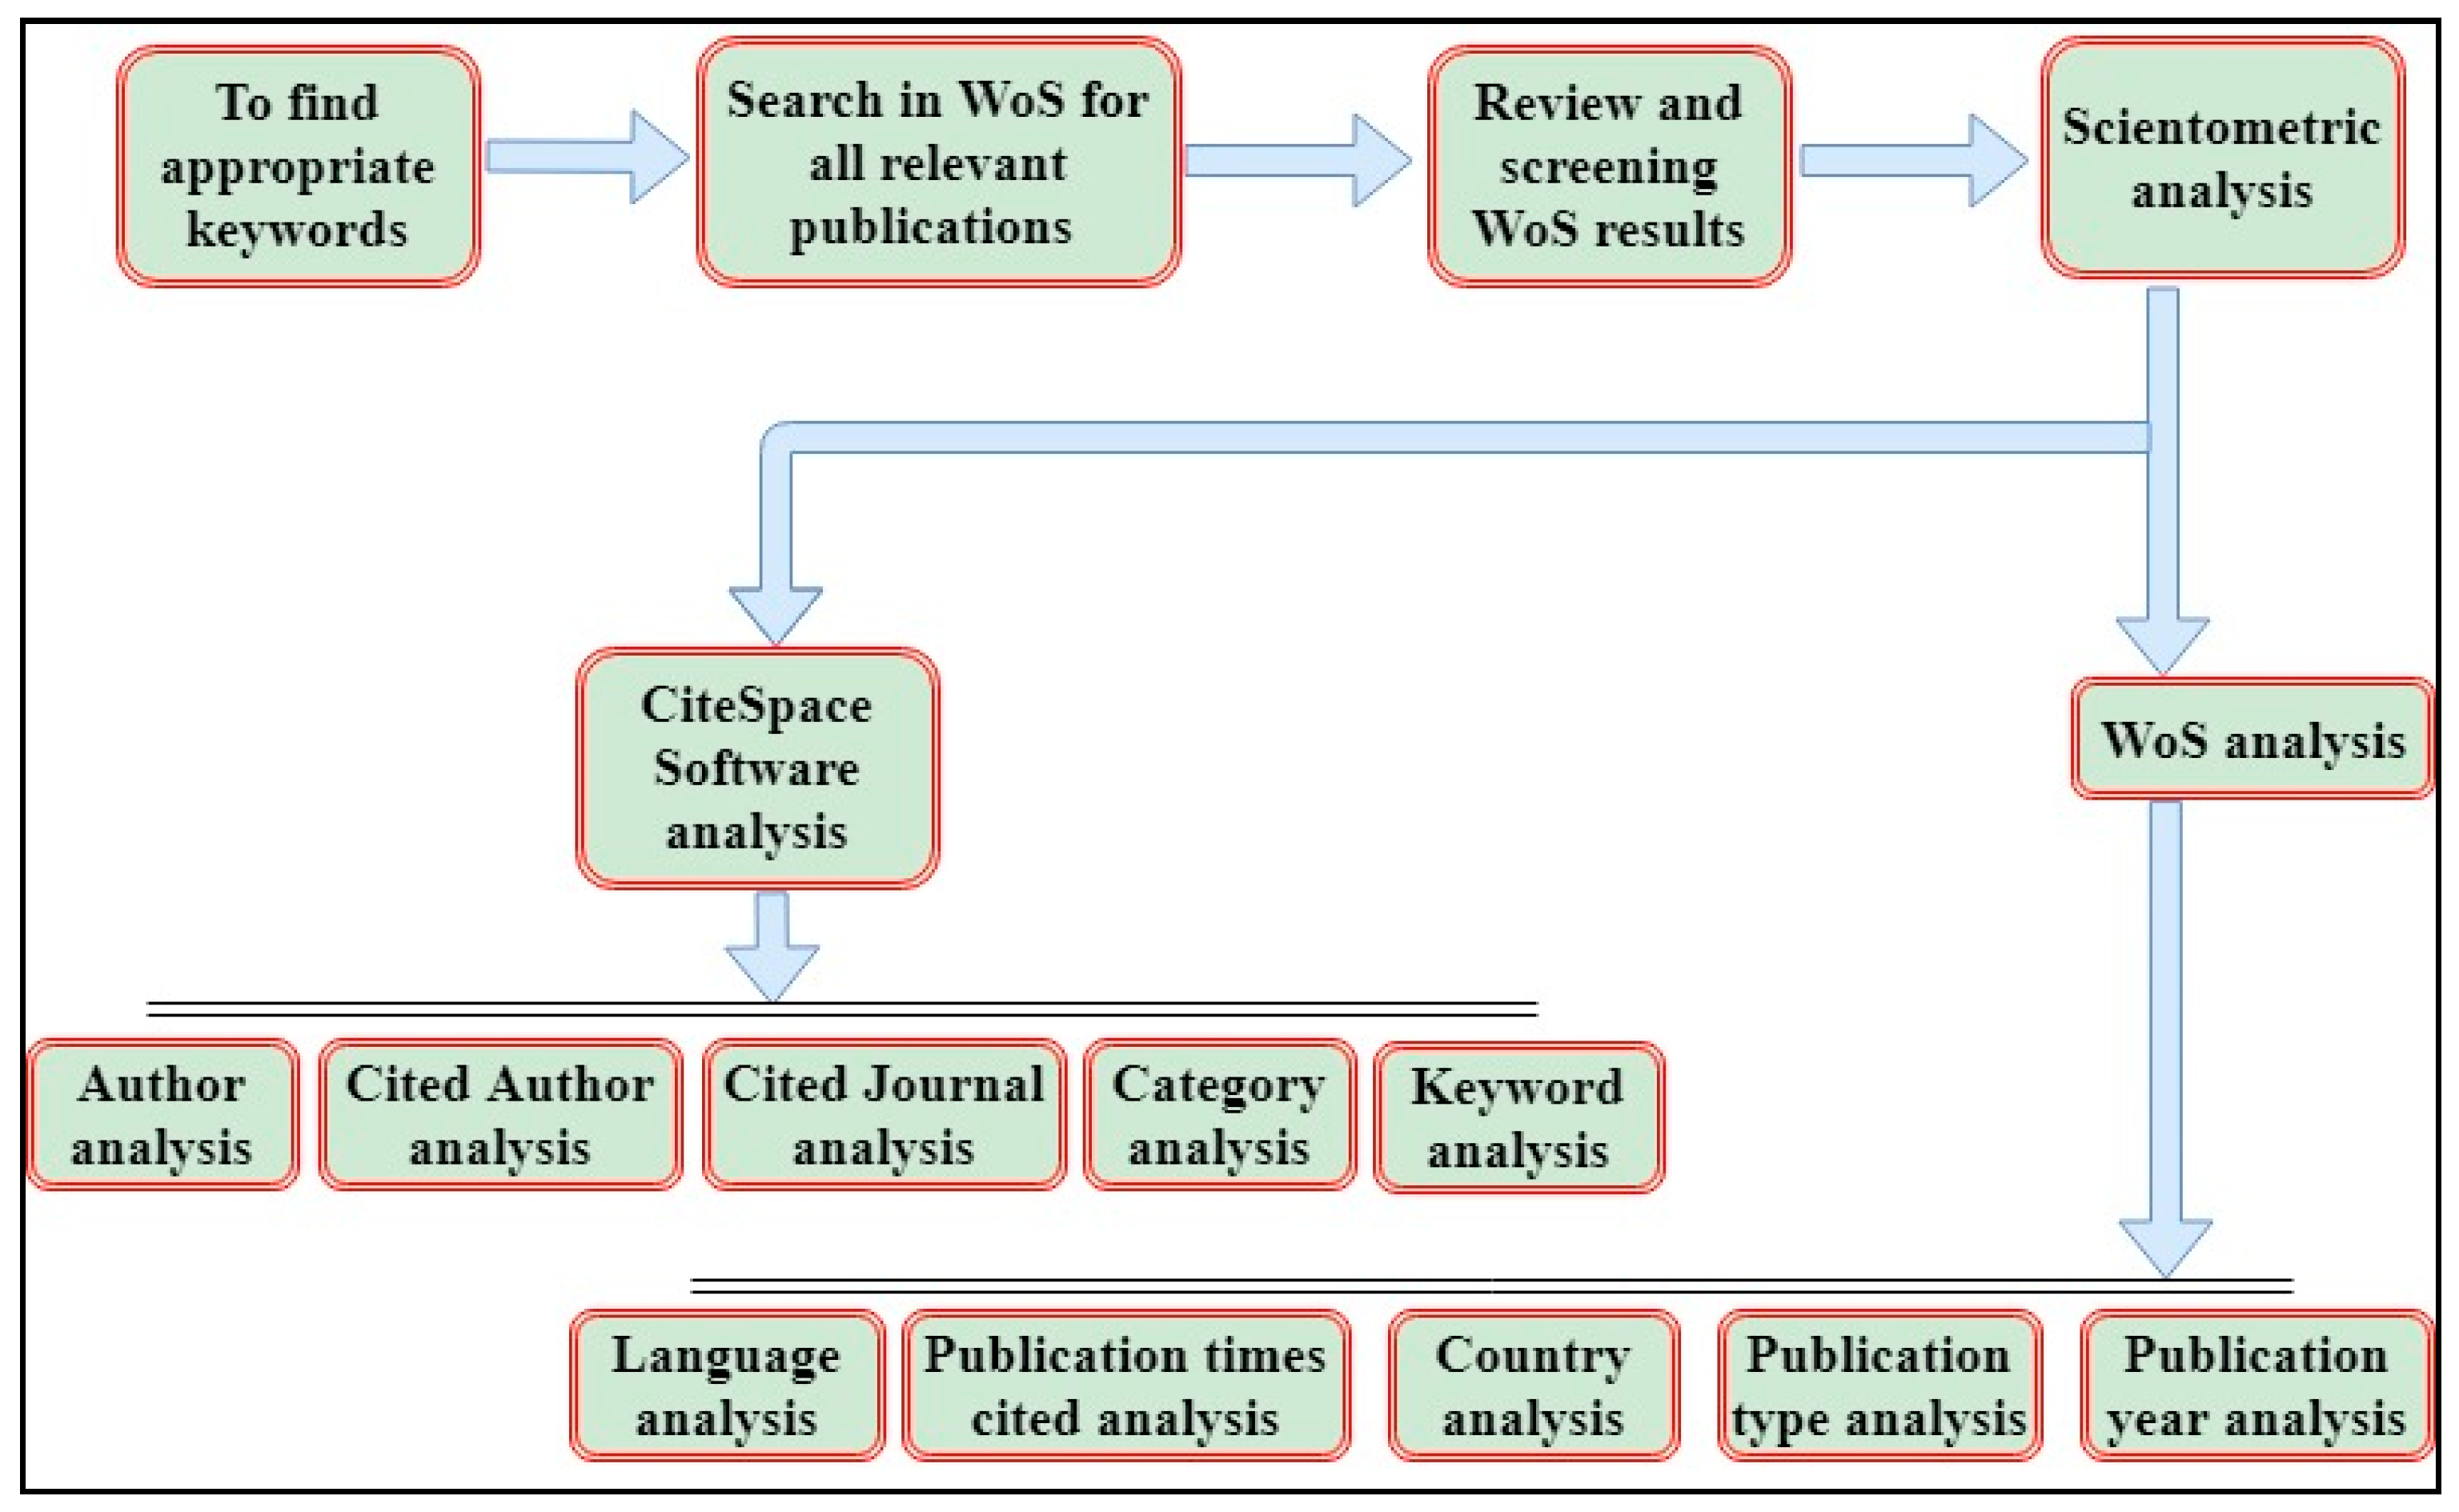
Within this investigation, the entire literature between 1900 and 2018 indexed in Thomson ISI Web of Science (WoS) were evaluated in which miscellaneous outstanding journals and publishers are wrapped. In addition, to cover all relevant records of scientific publications in the world, the option of all languages was selected. WoS is the most accurate, prestigious and well-known database providing scientific publications that widely accepted to be highly qualified [70]. The procedure of search for the relevant literature, reviewing, selection and screening is depicted in Figure 1. It was performed in the central collection of WoS through the keywords “scientometry”, “sustainable or sustainability”, and “cities or settlements or rural” appearing in the title, abstract, and keyword section of records. In order to cover all pertinent combinations, the search was also unified into a fuzzy-format including “*”.
Besides, all the details related to the screened publications such as the year of publication, authors’ information namely their names, their affiliations, as well as the keywords of each article were extracted and classified. Most of the selected articles to be taken under the analysis were in English. In this way, the CiteSpace software version 5.3, which was developed for visualizing and analyzing bibliometric data, was employed. This software, which was specially tuned and tailored for scientometric analysis, provided some useful tools to visualize the concealed pattern behind the collected publications on the sought topic. Next, the extracted results from WoS were inserted into the CiteSpace [71,72,73]. In addition, the affiliation identification for selected records of publications, was accomplished based on the location of all authors’ organization or institute [74]. Figure 1 displays the considered flowchart of a procedure in this research.
Furthermore, it is important to also mention that there is a discrepancy between the number of citations for each article reported by “Google Scholar” and “WoS”. Most of the time Google Scholar reported higher values, however, in this study, WoS is taken as the main source of reference.
4. Results and Discussion
After gathering all information and data, categorizing and preparation, in order to have a general view from screened records of publication, overall statistics are provided by Table 1. Among all 7393 total publications, which have 39,007 total citations and 7.57 averaged citation per article, the most cited article has 811 citations. Although the interval time under investigation was 1900 to 2018, the first detected article belongs to 1984. This brief statistic displays an enormous difference between most cited article and average citation which implies the wide range of citations and brilliant work of the most cited article as well.
4.1. Publication History
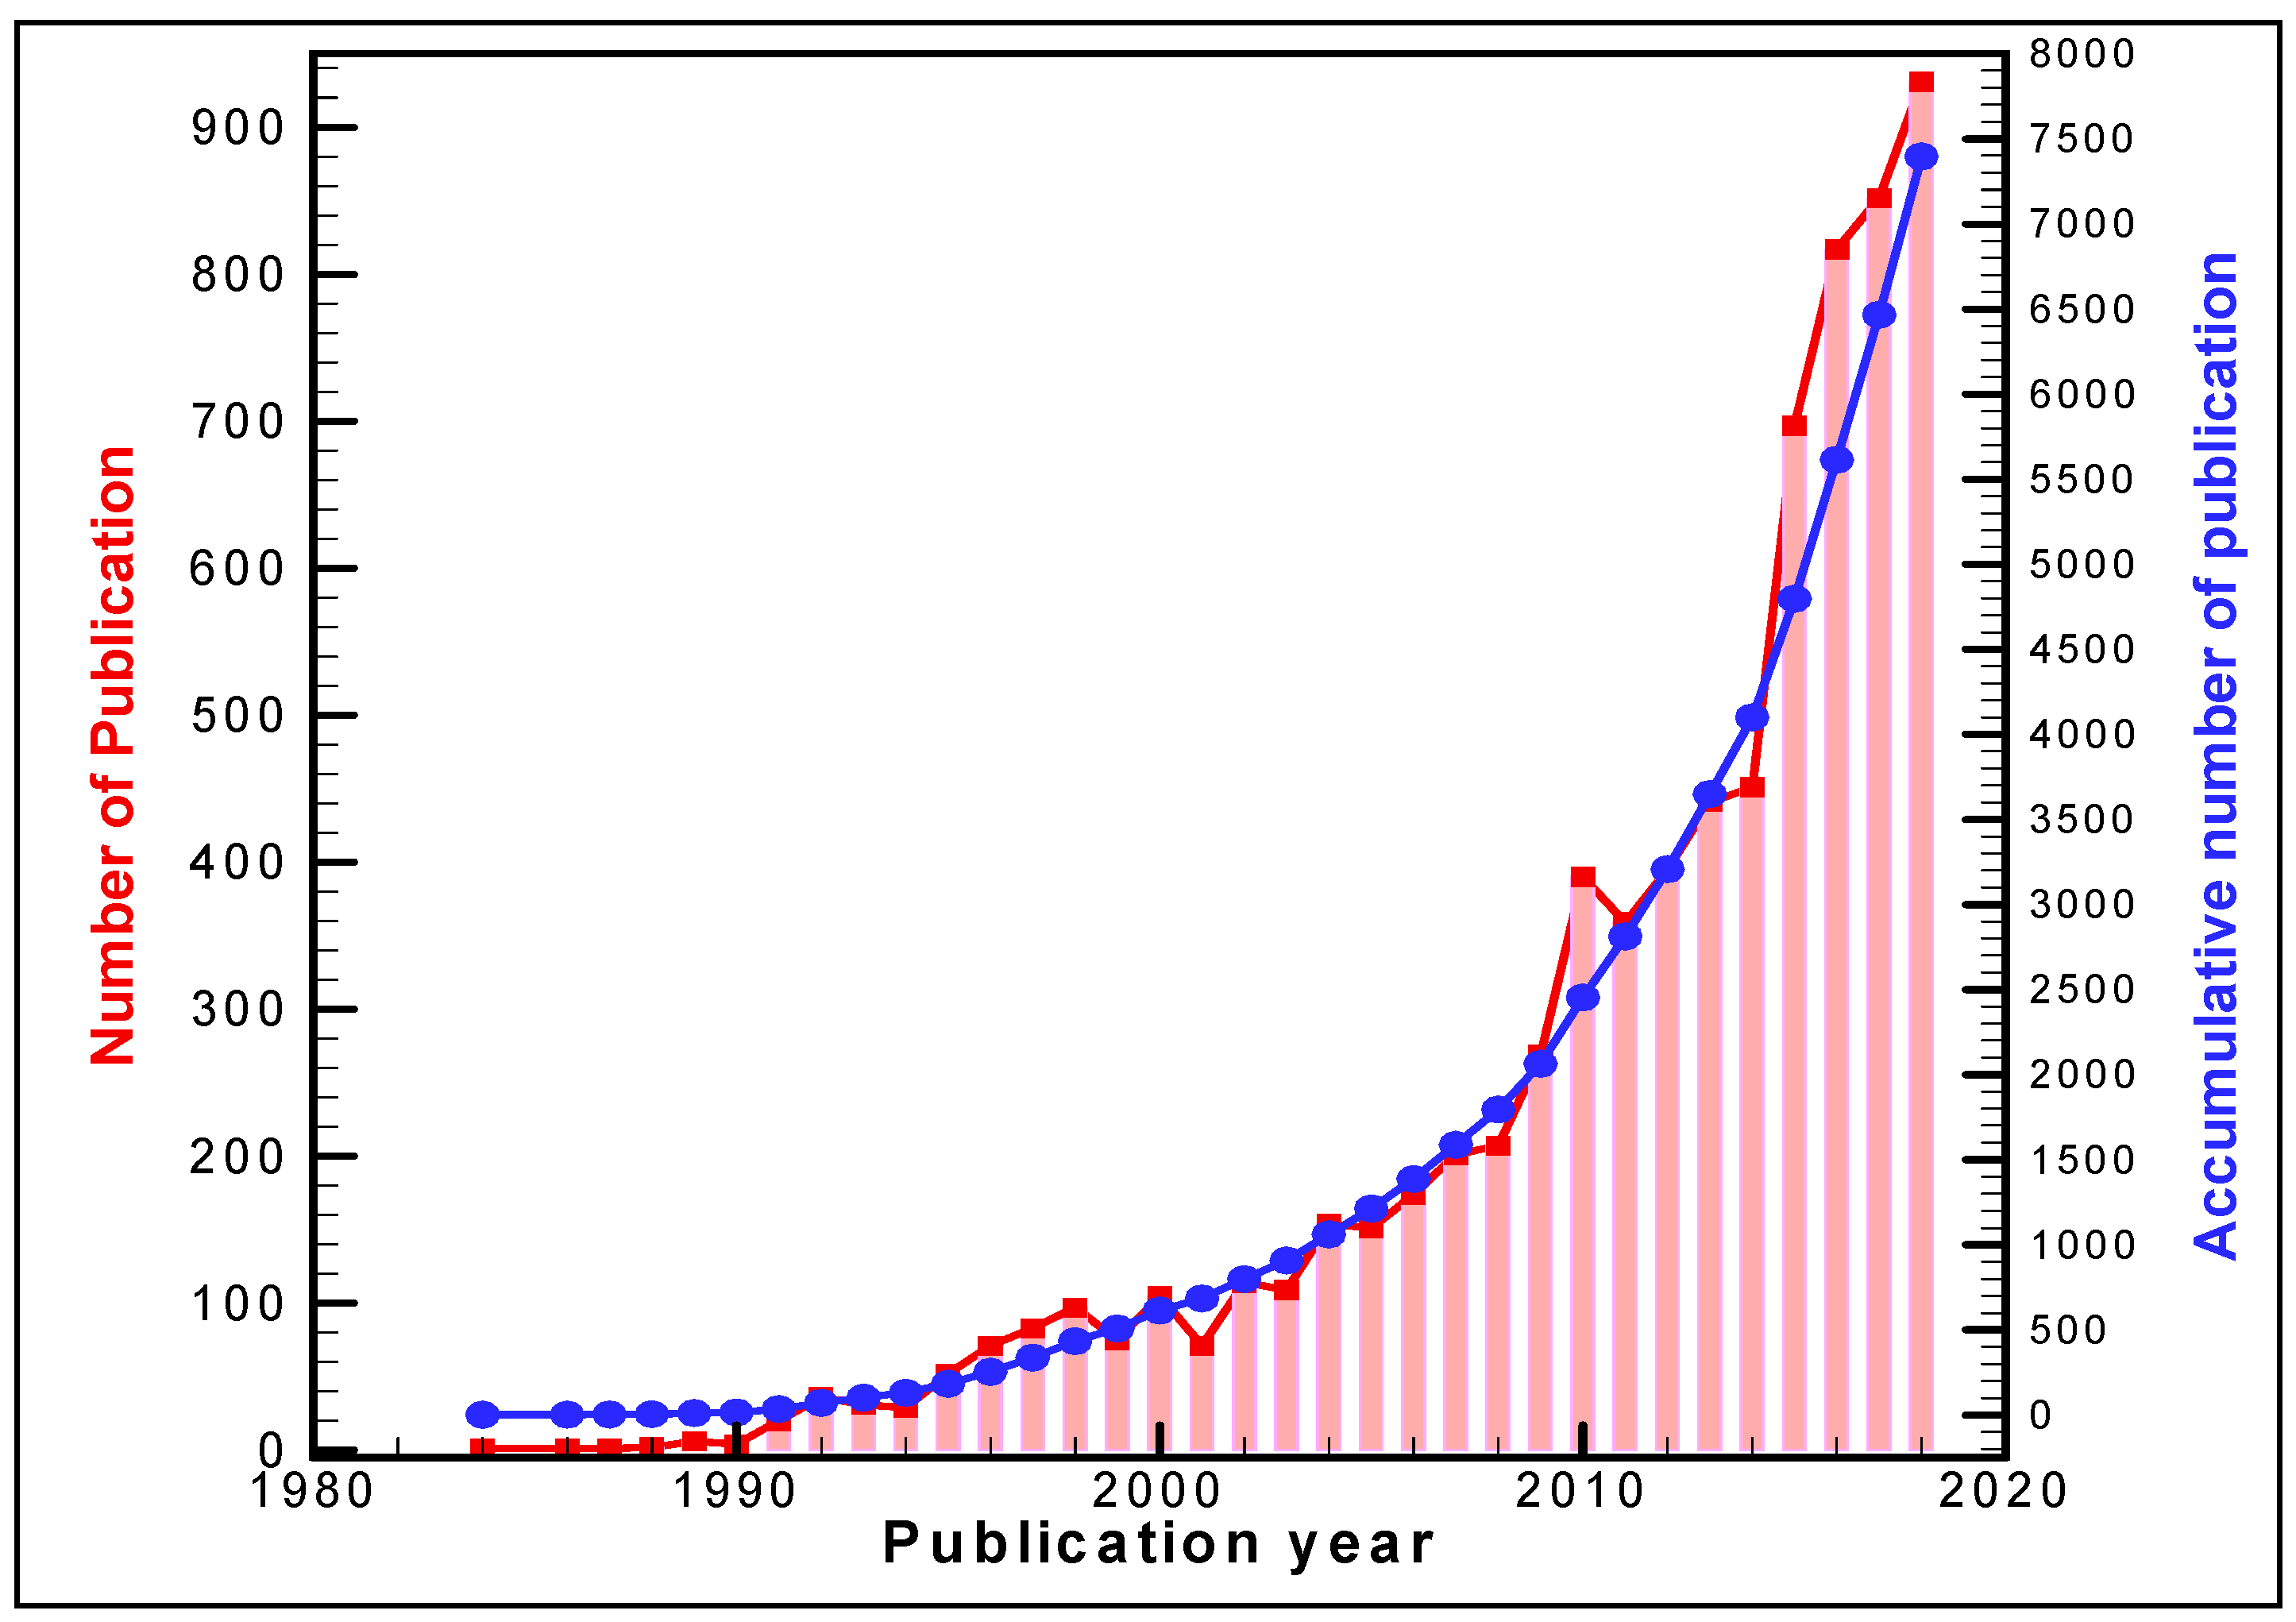
The first technique in scientometric analysis is the distribution of publication over time. The way they distributed can tell us about the importance of a topic and the initiation of attention toward it (Figure 2, Table 2). During the investigated interval time (1900–2018) the first paper published in 1984, which means that the sought topic is only 35 years old. Surprisingly, one eighth of total records belong to 2018. It may imply the intensity of the whole world about the topic of this study nowadays. Moreover, there are five jumps in which number of articles is more than 1.5-fold greater than its corresponding value in previous year.
Considering old to new records, they are respectively as follows: the first jump occurs in 1991 (fivefold), the second in 1992 (1.8-fold), the third in 1995 (1.8-fold), the fourth in 2002 (1.6-fold), and finally the fifth in 2015 (1.55-fold). It should be noted that in 1992, the first United Nation (UN) Conference on Environment and Development (UNCED), or the Earth Summit known as Agenda 21, was held in Rio de Janeiro. In fact, it was the first agenda developed and adopted for environment and development. In addition, the sustainable development goals of UN General Assembly known as 2030 agenda were set at 2015. According to this analysis, there is a coincidence of an important public event like Agenda 21 and significant jump in scientific concern toward SURA, that may indicate a motivation for UN to organize its Earth Summit in 1992. This analysis simply shows how greatly policy and scientific activity influence each other toward making our world a better place to live.
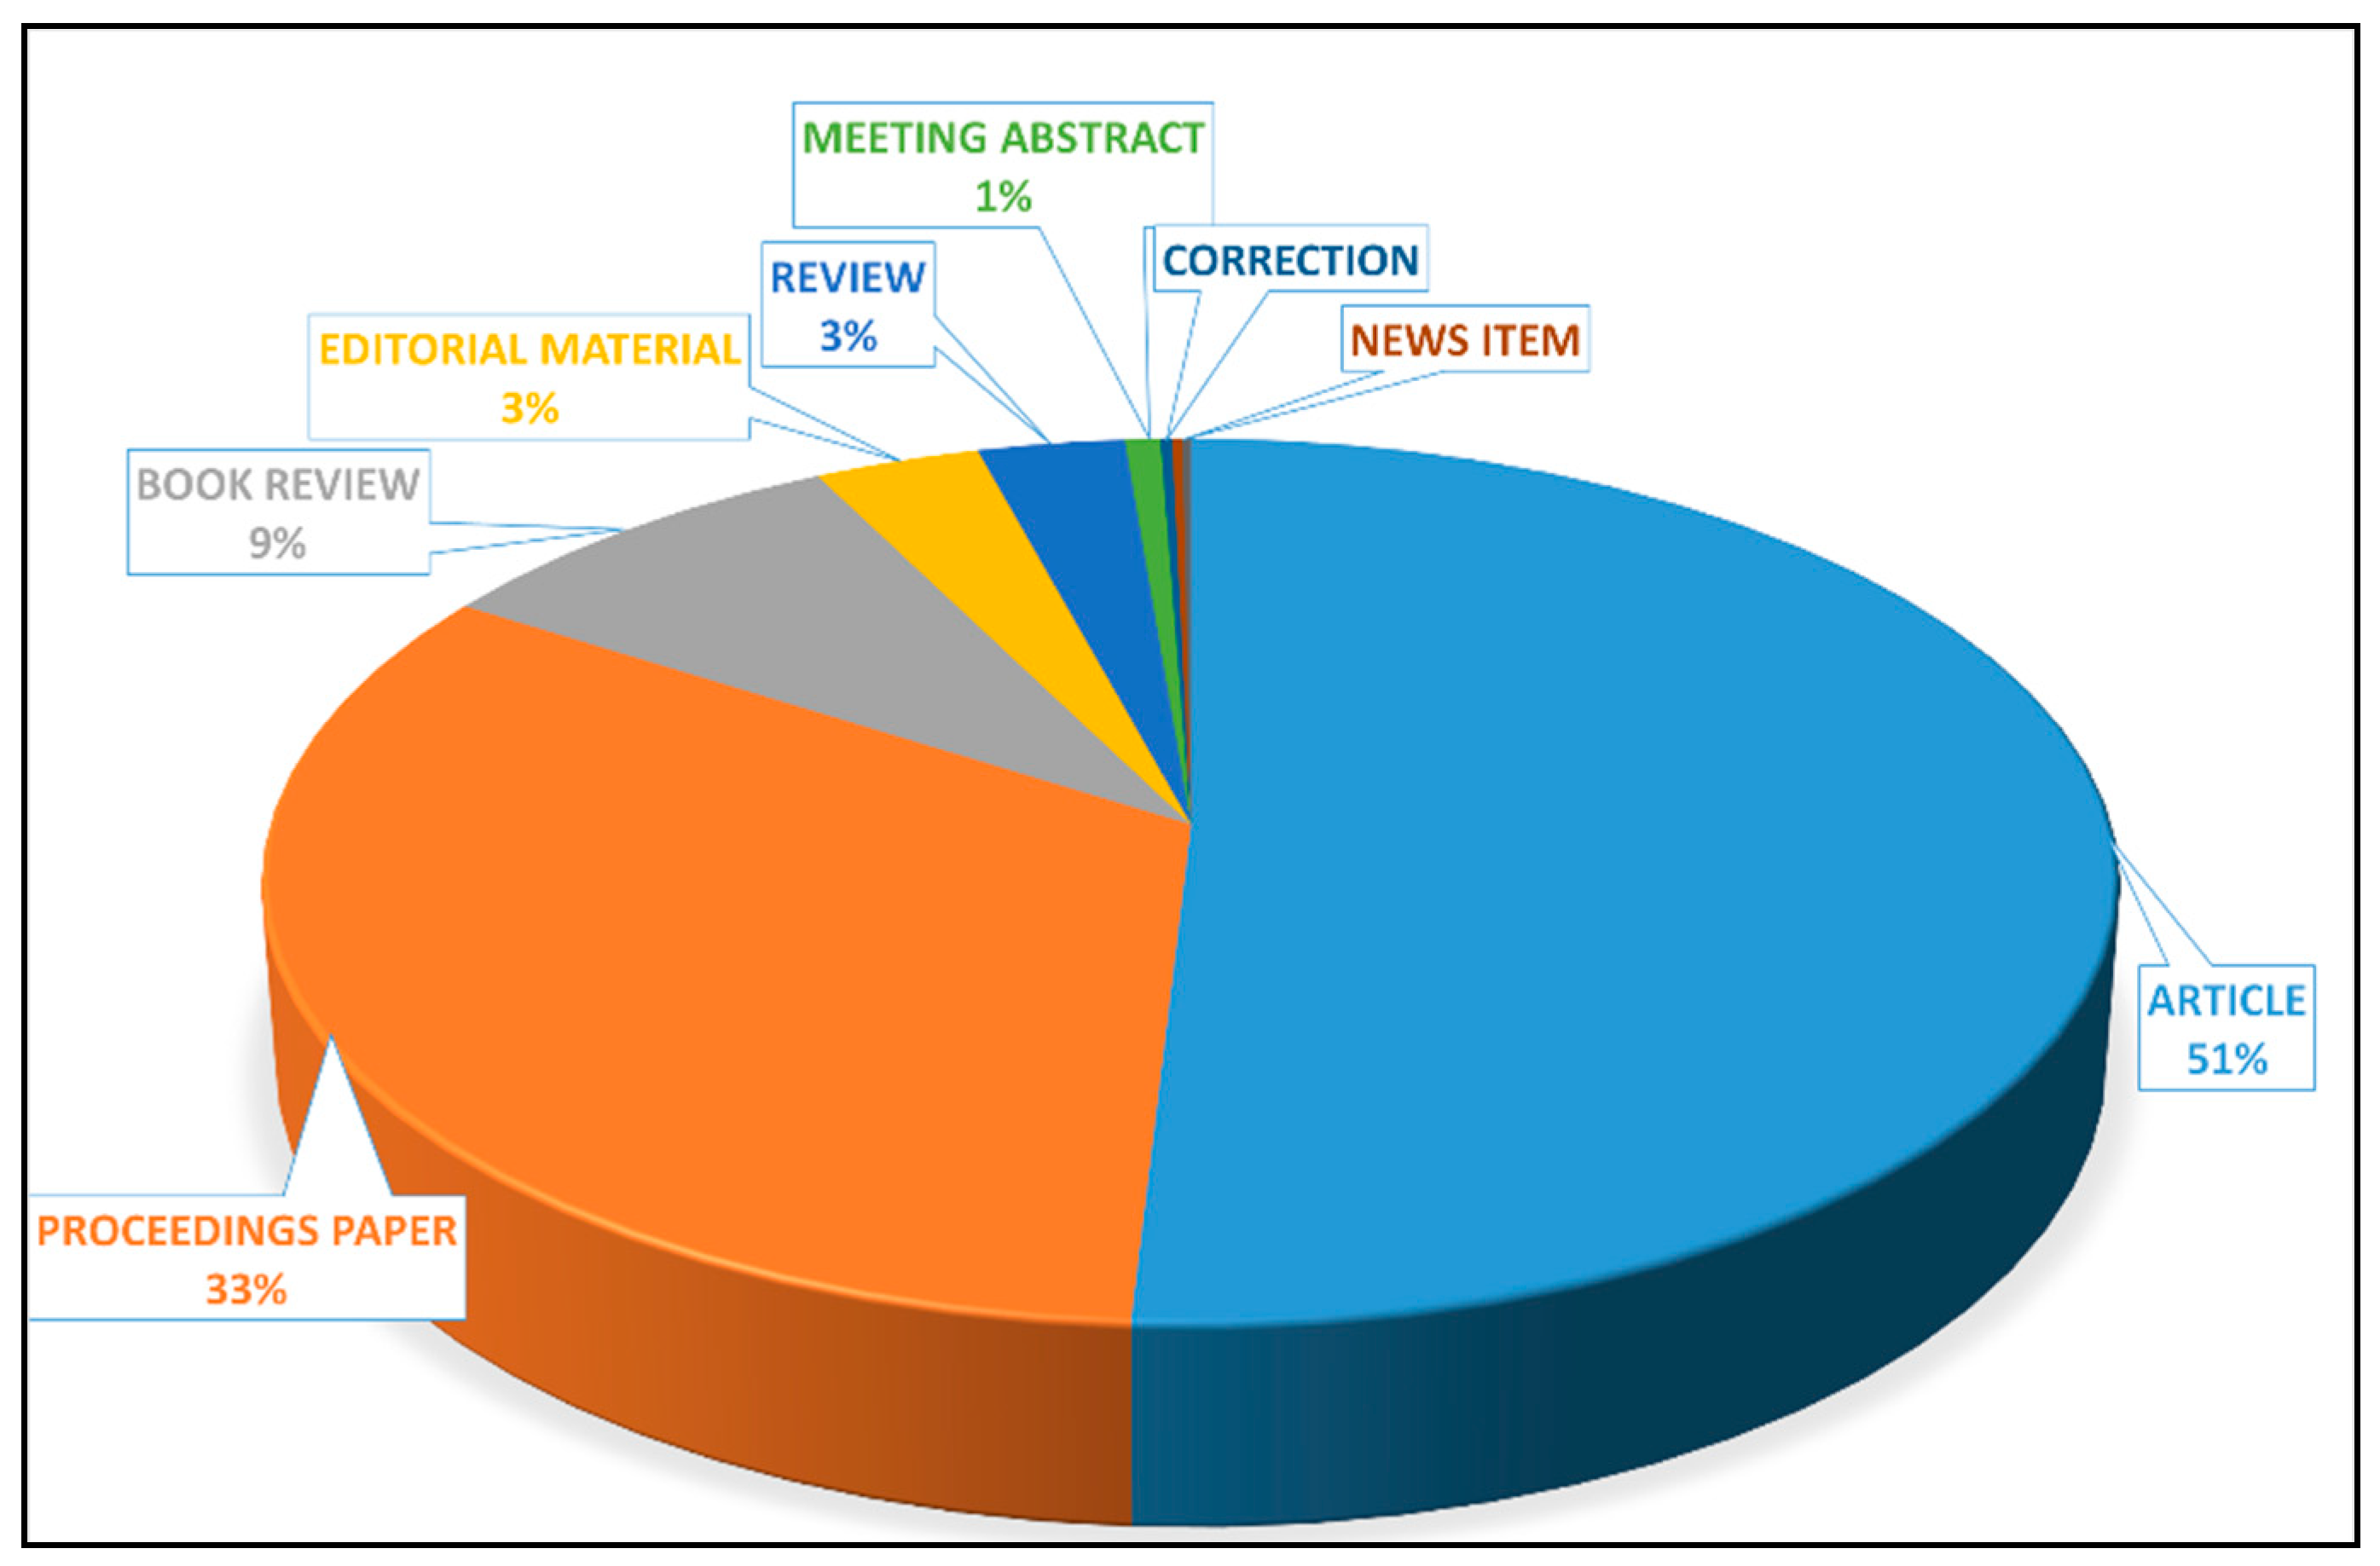
4.2. Analysis on Document Type
In this section, the types of screened records are analyzed. More than half of total publications are journal papers and one third are conference proceedings. Relative to other scientific areas, book reviews made the large part of publications, 9%, which somehow shows the well-established parts of the sought topic (Figure 3 and Table 3). While published books are mainly considered as a publicly approved science, the considerable number of 646 review books on SURA implies the well-established, well-performed academic investigations in this area. The same opinion can be expressed for review articles with total number of 220 articles.
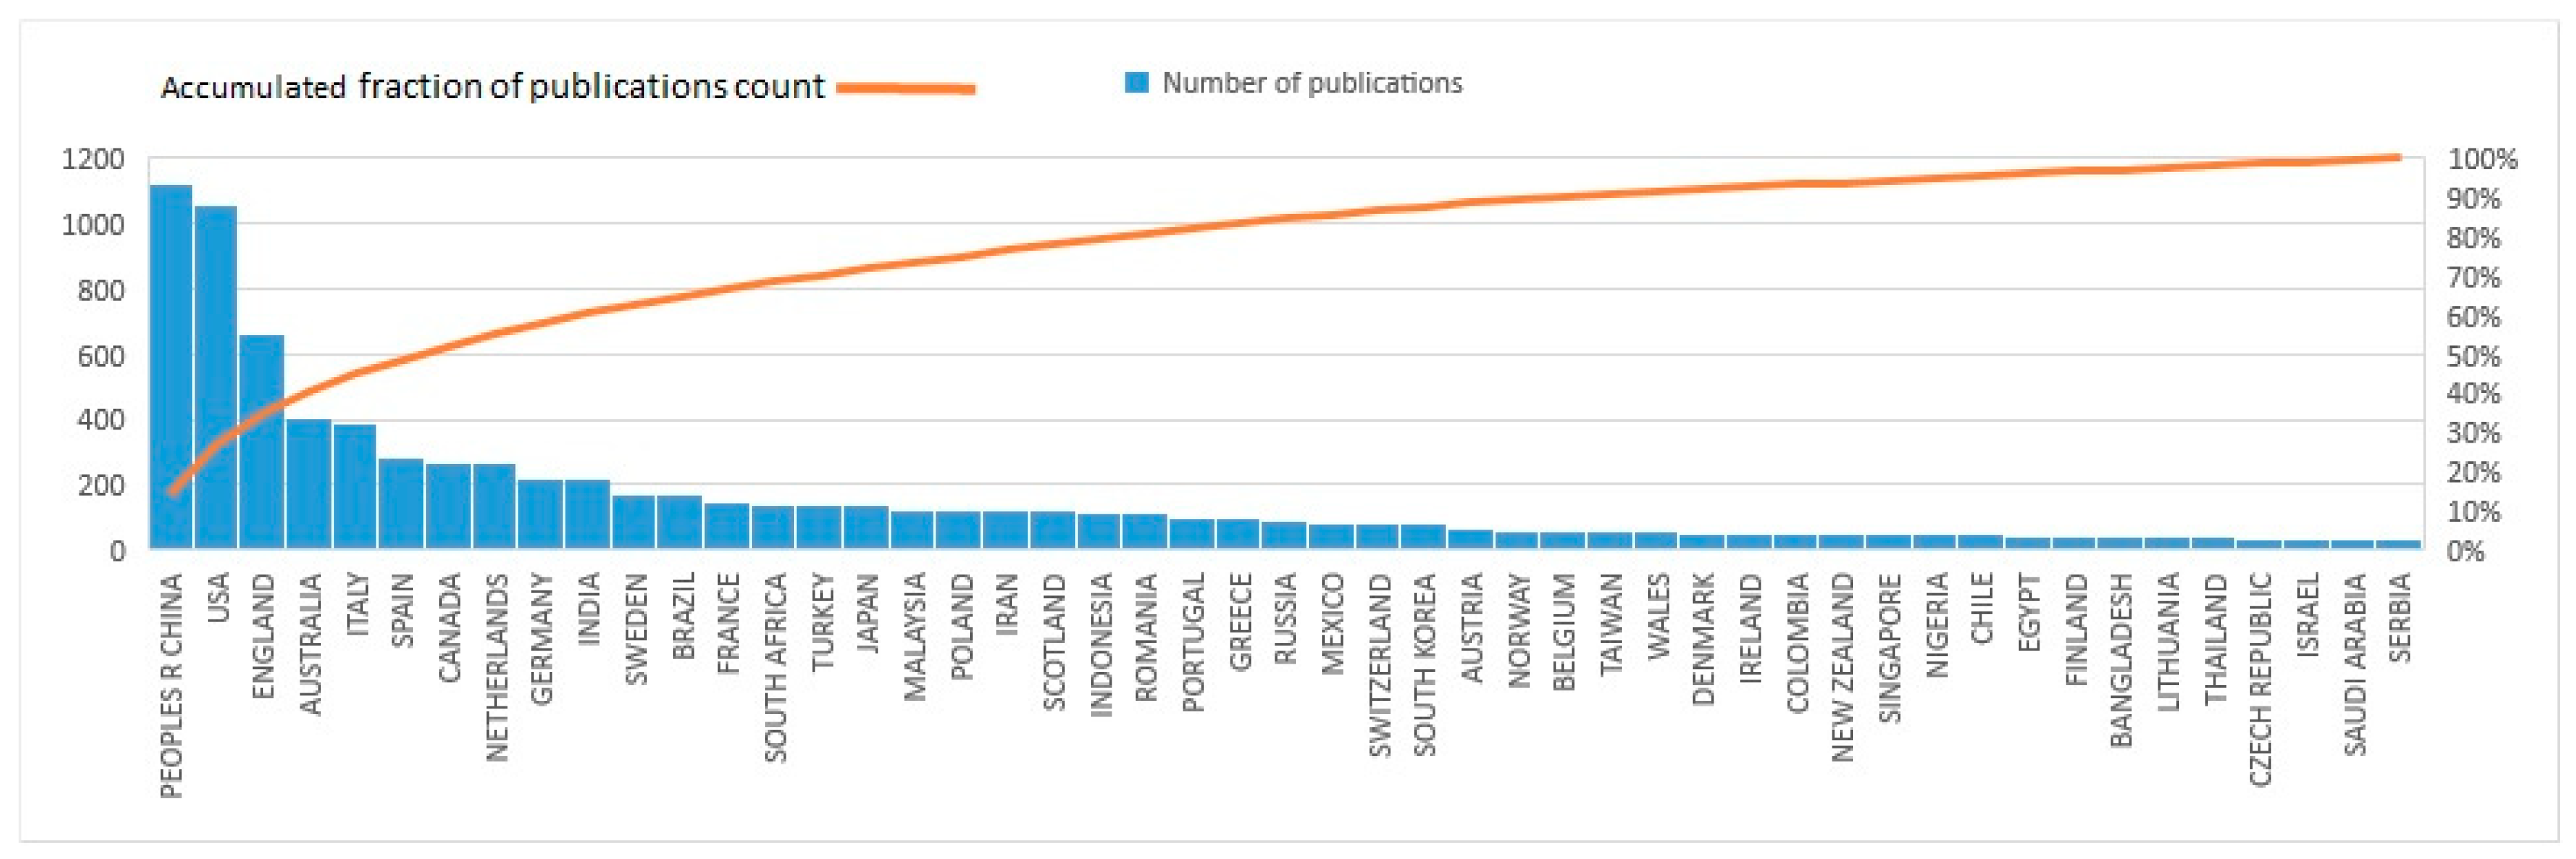
4.3. Country/Region Analysis
In this section, distribution of screened records over the countries for the top-50 counties is depicted (Figure 4). The first and second rank go to China and the US with 1126 (15.22%) (calculated by division of 1126 publications from china by total number of publications, 7397), and 1056 (14.28%) (calculated by division of 1056 publications from the US by total number of publications, 7397) publications. In this analysis, all authors in a publication are considered and hence one paper may count for more than one country. Due to this fact, summation of publications in this analysis exceeds the total number of considered publications (7397). As it is shown, developing countries such as India, Brazil, South Africa, Turkey, and Iran are among the top-20 countries scientifically contributing to SURA. India as the second most populated country in the world with many problems in the SURA area is expected to have more contribution in this area, but it is the tenth country after the Netherlands and Germany.
Some of the countries have few or almost no determined clear policy aligned with sustainable goals and/or few practical plans have been implemented in these regions. This fact implies that the volume of scientific contribution of a country to a specific field does not necessarily reflect its practice—on the contrary, in many cases academic writing determines the gap in practice.
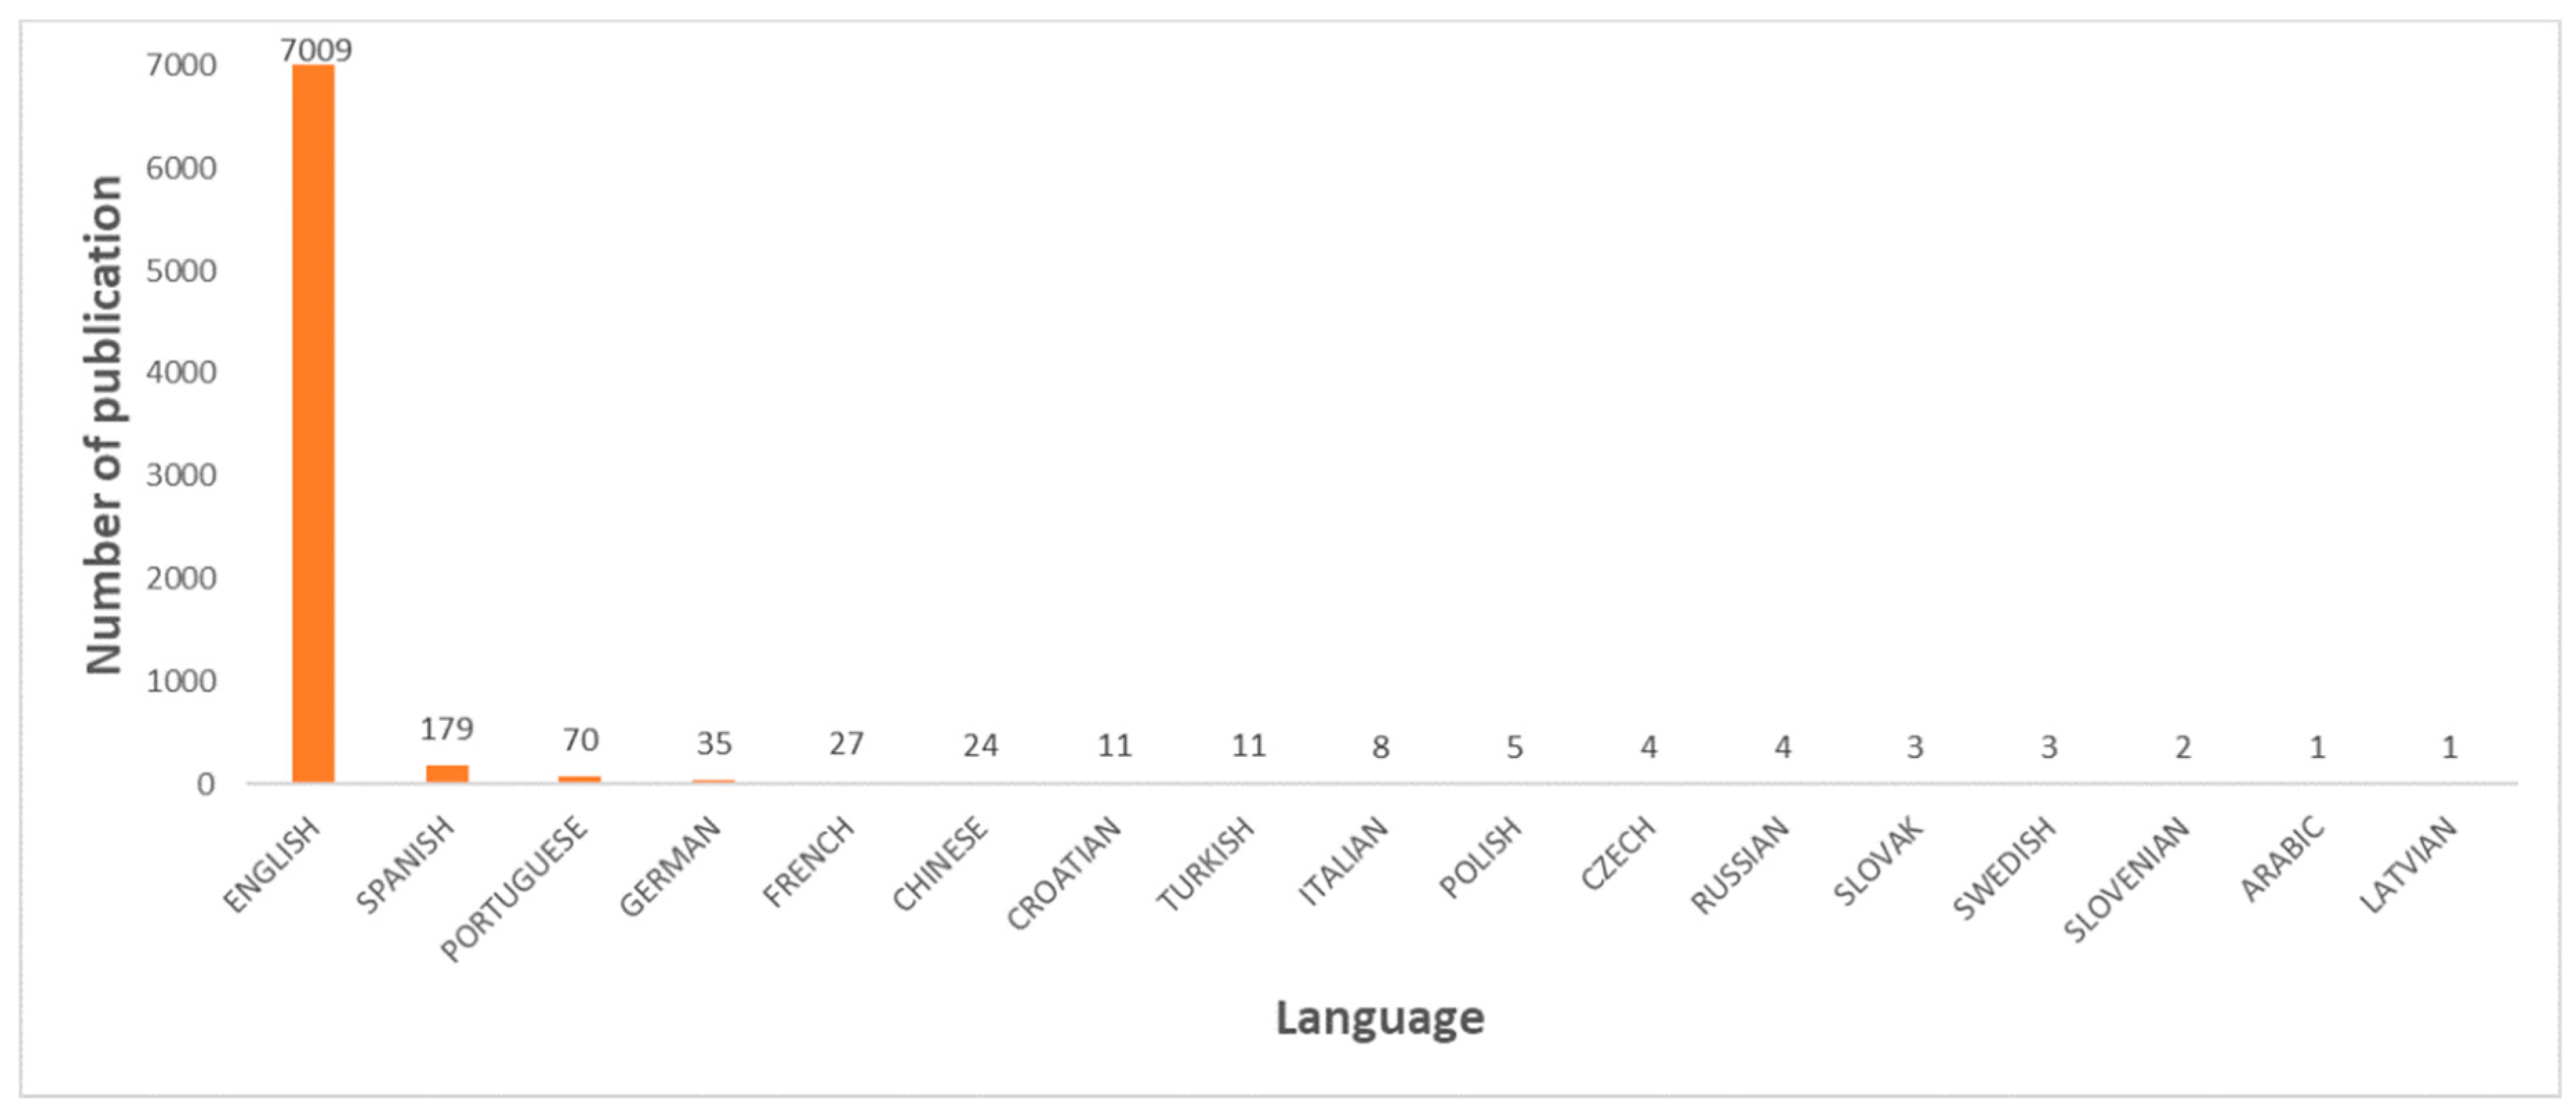
4.4. Language Analysis
In this section, language of screened records is analyzed. As it is expected, English as an international language, and sole permitted language for most of journals, obtained the first rank with approximately 95% of total publications (Figure 5). In addition, among non-English publications, Chinese comes after European languages such as Spanish, Portuguese and German. By considering China as the first-rank country in scientific contribution, one may conclude that Chinese authors preferred to publish their scientific works in the English language rather their native language. The most probable reason can be this fact that in this way, their publications will have more audiences and citations. In fact, all factors of popularity, journal mandatory rule of submission, and having more audiences together let the English language be the first rank with no competition.
4.5. Author Contribution Analysis
This technique relies on the number of articles recorded for each author is depicted in Table 4. The first rank, X.L. Zhang (h-index = 34) the active professor from City University of Hong Kong has had the first rank with highest number of publications in sought topic. Table 4 contained those authors having more than or equal to 10 published articles.
4.6. Keyword Analysis
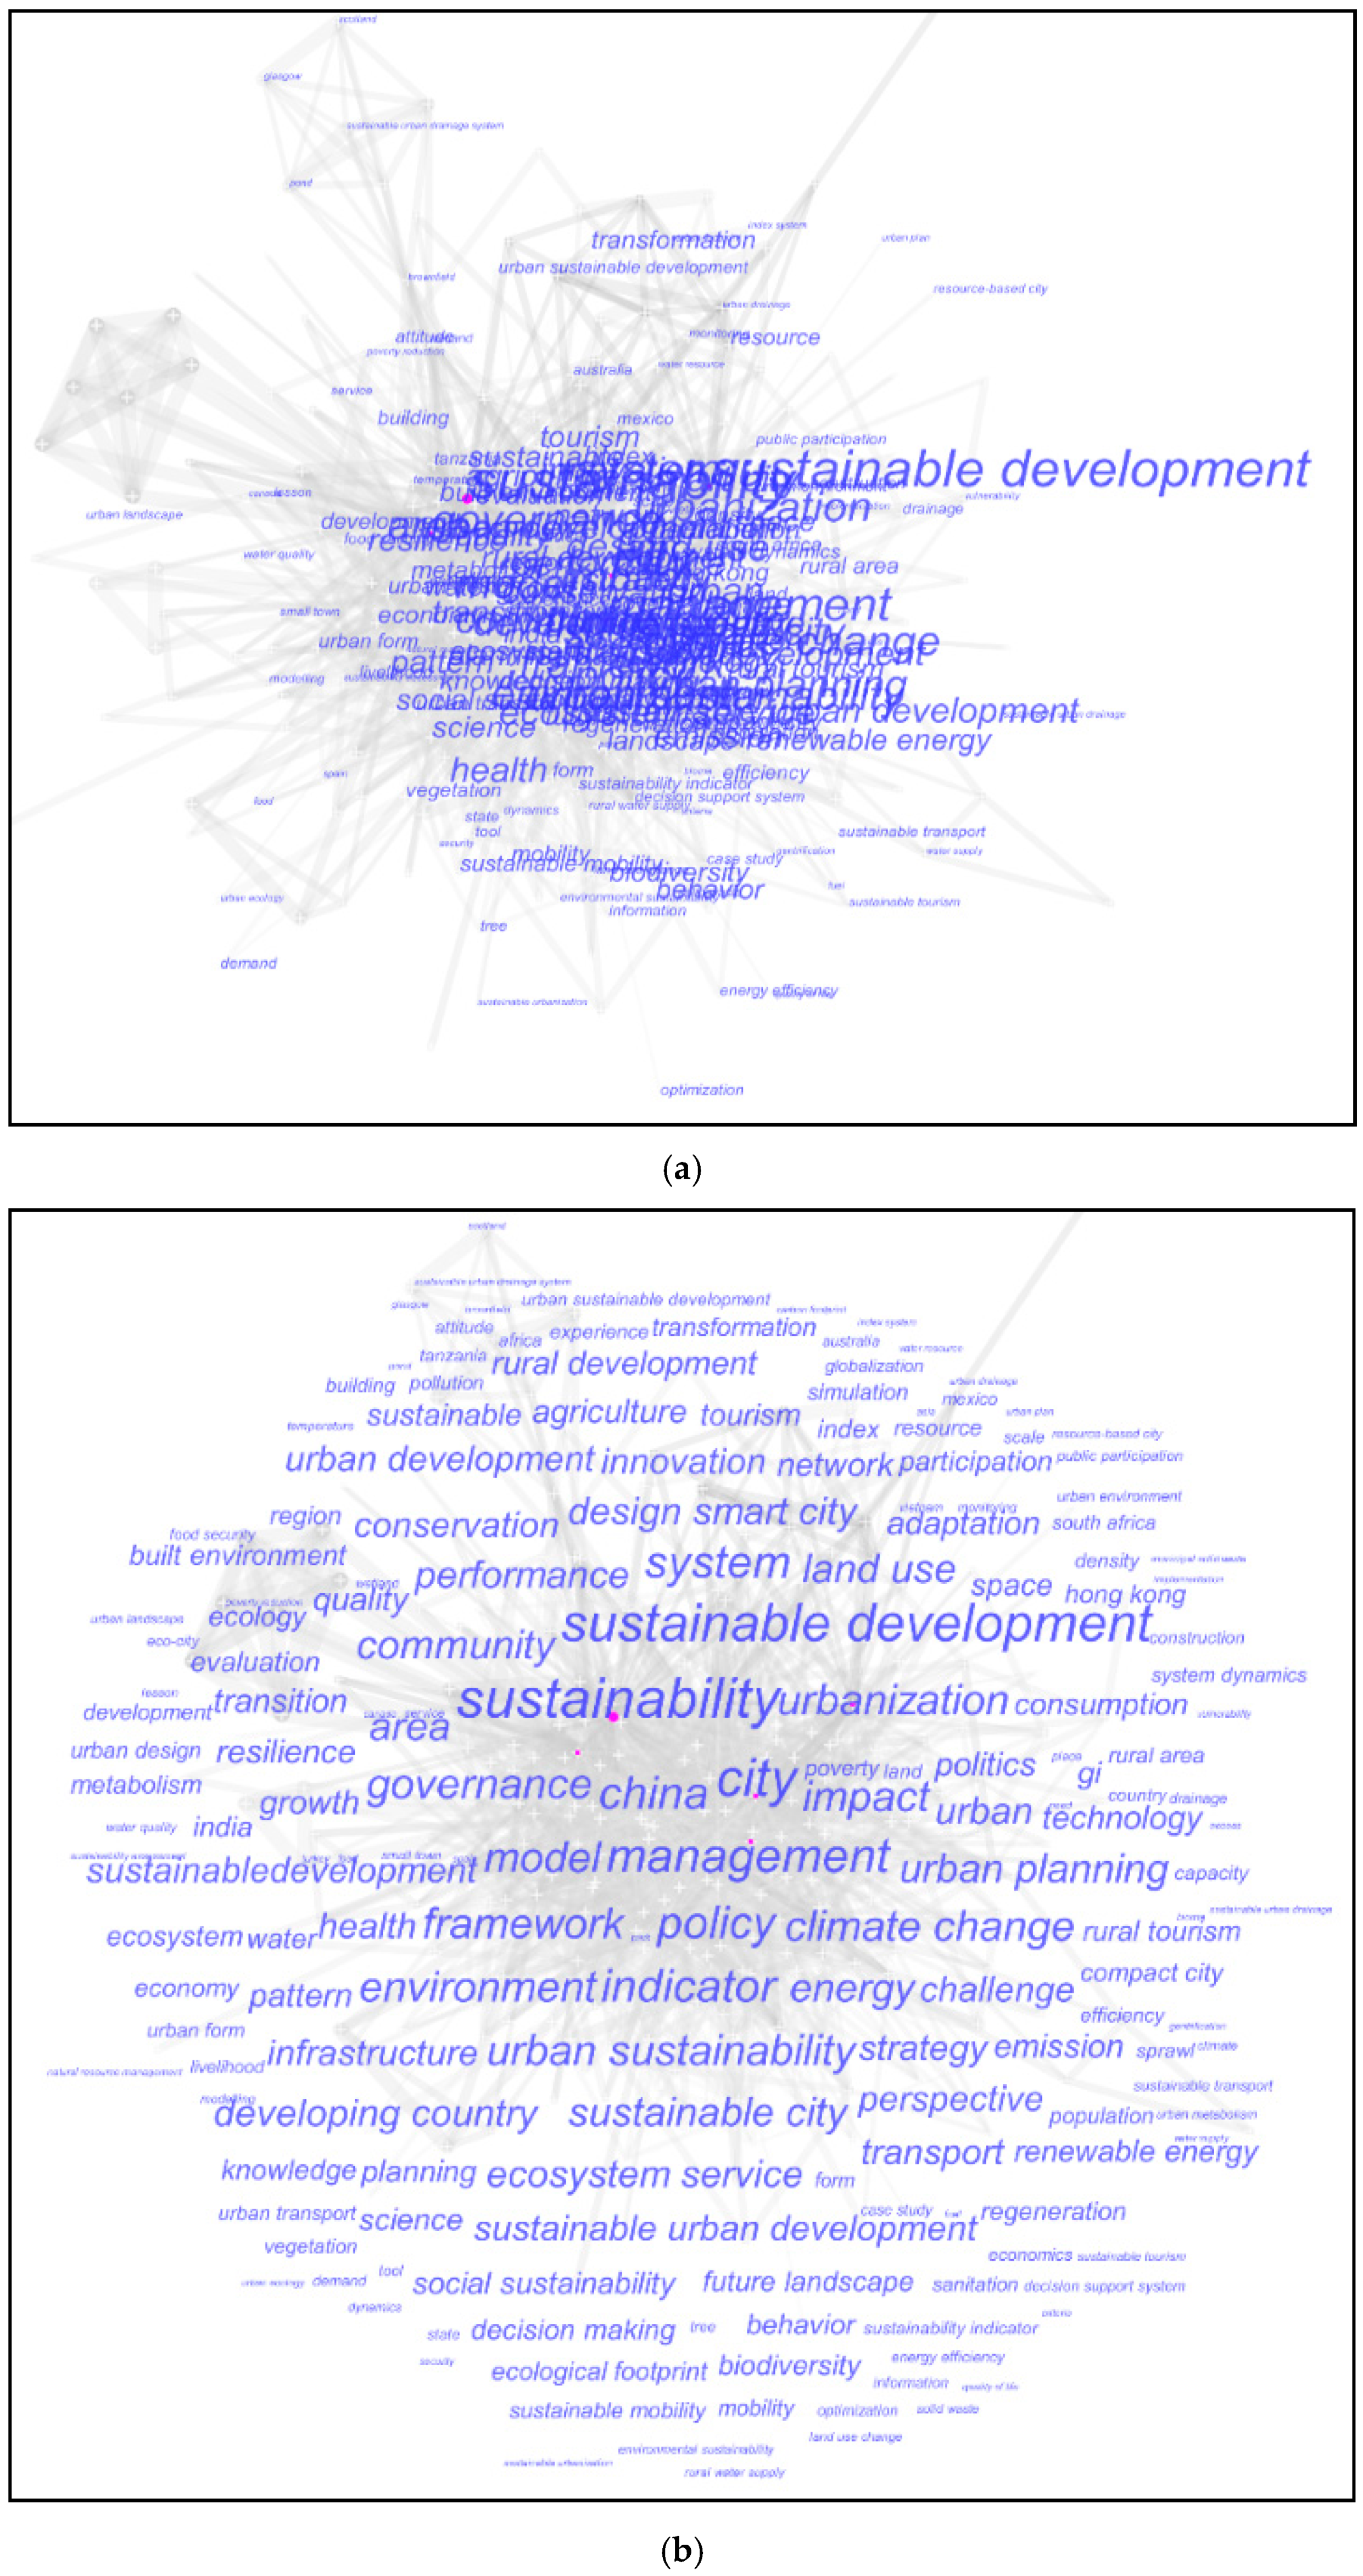
In this section the most important keywords (the top keywords with frequency greater than 80) used by authors accompanied with extra statistical information on their scientometric metrics includes burst, betweenness centrality, and novelty (Table 5). It should be noted that top keywords having frequency of more than 80 were selected for presentation in Table 5. Moreover, the bibliographical representation of keywords showing the connectivity, linkage and their importance is depicted in Figure 6. As it is expected, by considering frequency of used keywords, first three keywords are “sustainability”, “city” and “sustainable development”. However, the keyword “sustainable development” has the novelty, which shows its importance and indicates that it locates on a significant portion of connecting pairs of scientific areas.
In other words, a keyword can be considered as a pivot of multidisciplinary scientific studies due to having high betweenness centrality as well as high burst value at the same time. In Figure 6, to clearly visualize the distribution of keywords and their corresponding connections they are displayed in two different ways. In Figure 6a each keyword is placed in its correct node and with a font size proportional to its frequency value, while in Figure 6b its exploded sight is presented.
Furthermore, a quick look at the keywords listed in Table 5 gives us the impression that: (a) sustainable urban and rural development are a key concern in the developed county context; (b) urban and land use planning and design along with management and governance seem to be seen as a critical tool in achieving sustainability; (c) sustainability frameworks, models and indicators are popular in measuring and assessing the performance; (d) sustainable and smart cities are the role models for a achieving sustainability, combatting climate change and delivering healthy ecosystem services.
4.7. Cited Author Analysis
The authors’ citation analysis is considered as a robust methodology by which the connection between scientific publications to figure out or survey the shape and structure of a specific region of knowledge as well as detecting the main contributors. It also helps in the clustering of scientific records based on shared references and offers examinations of literature’s characteristics such as the speed of growing citation increments and even saturation/obsolescence of a specific topic in the world of science.
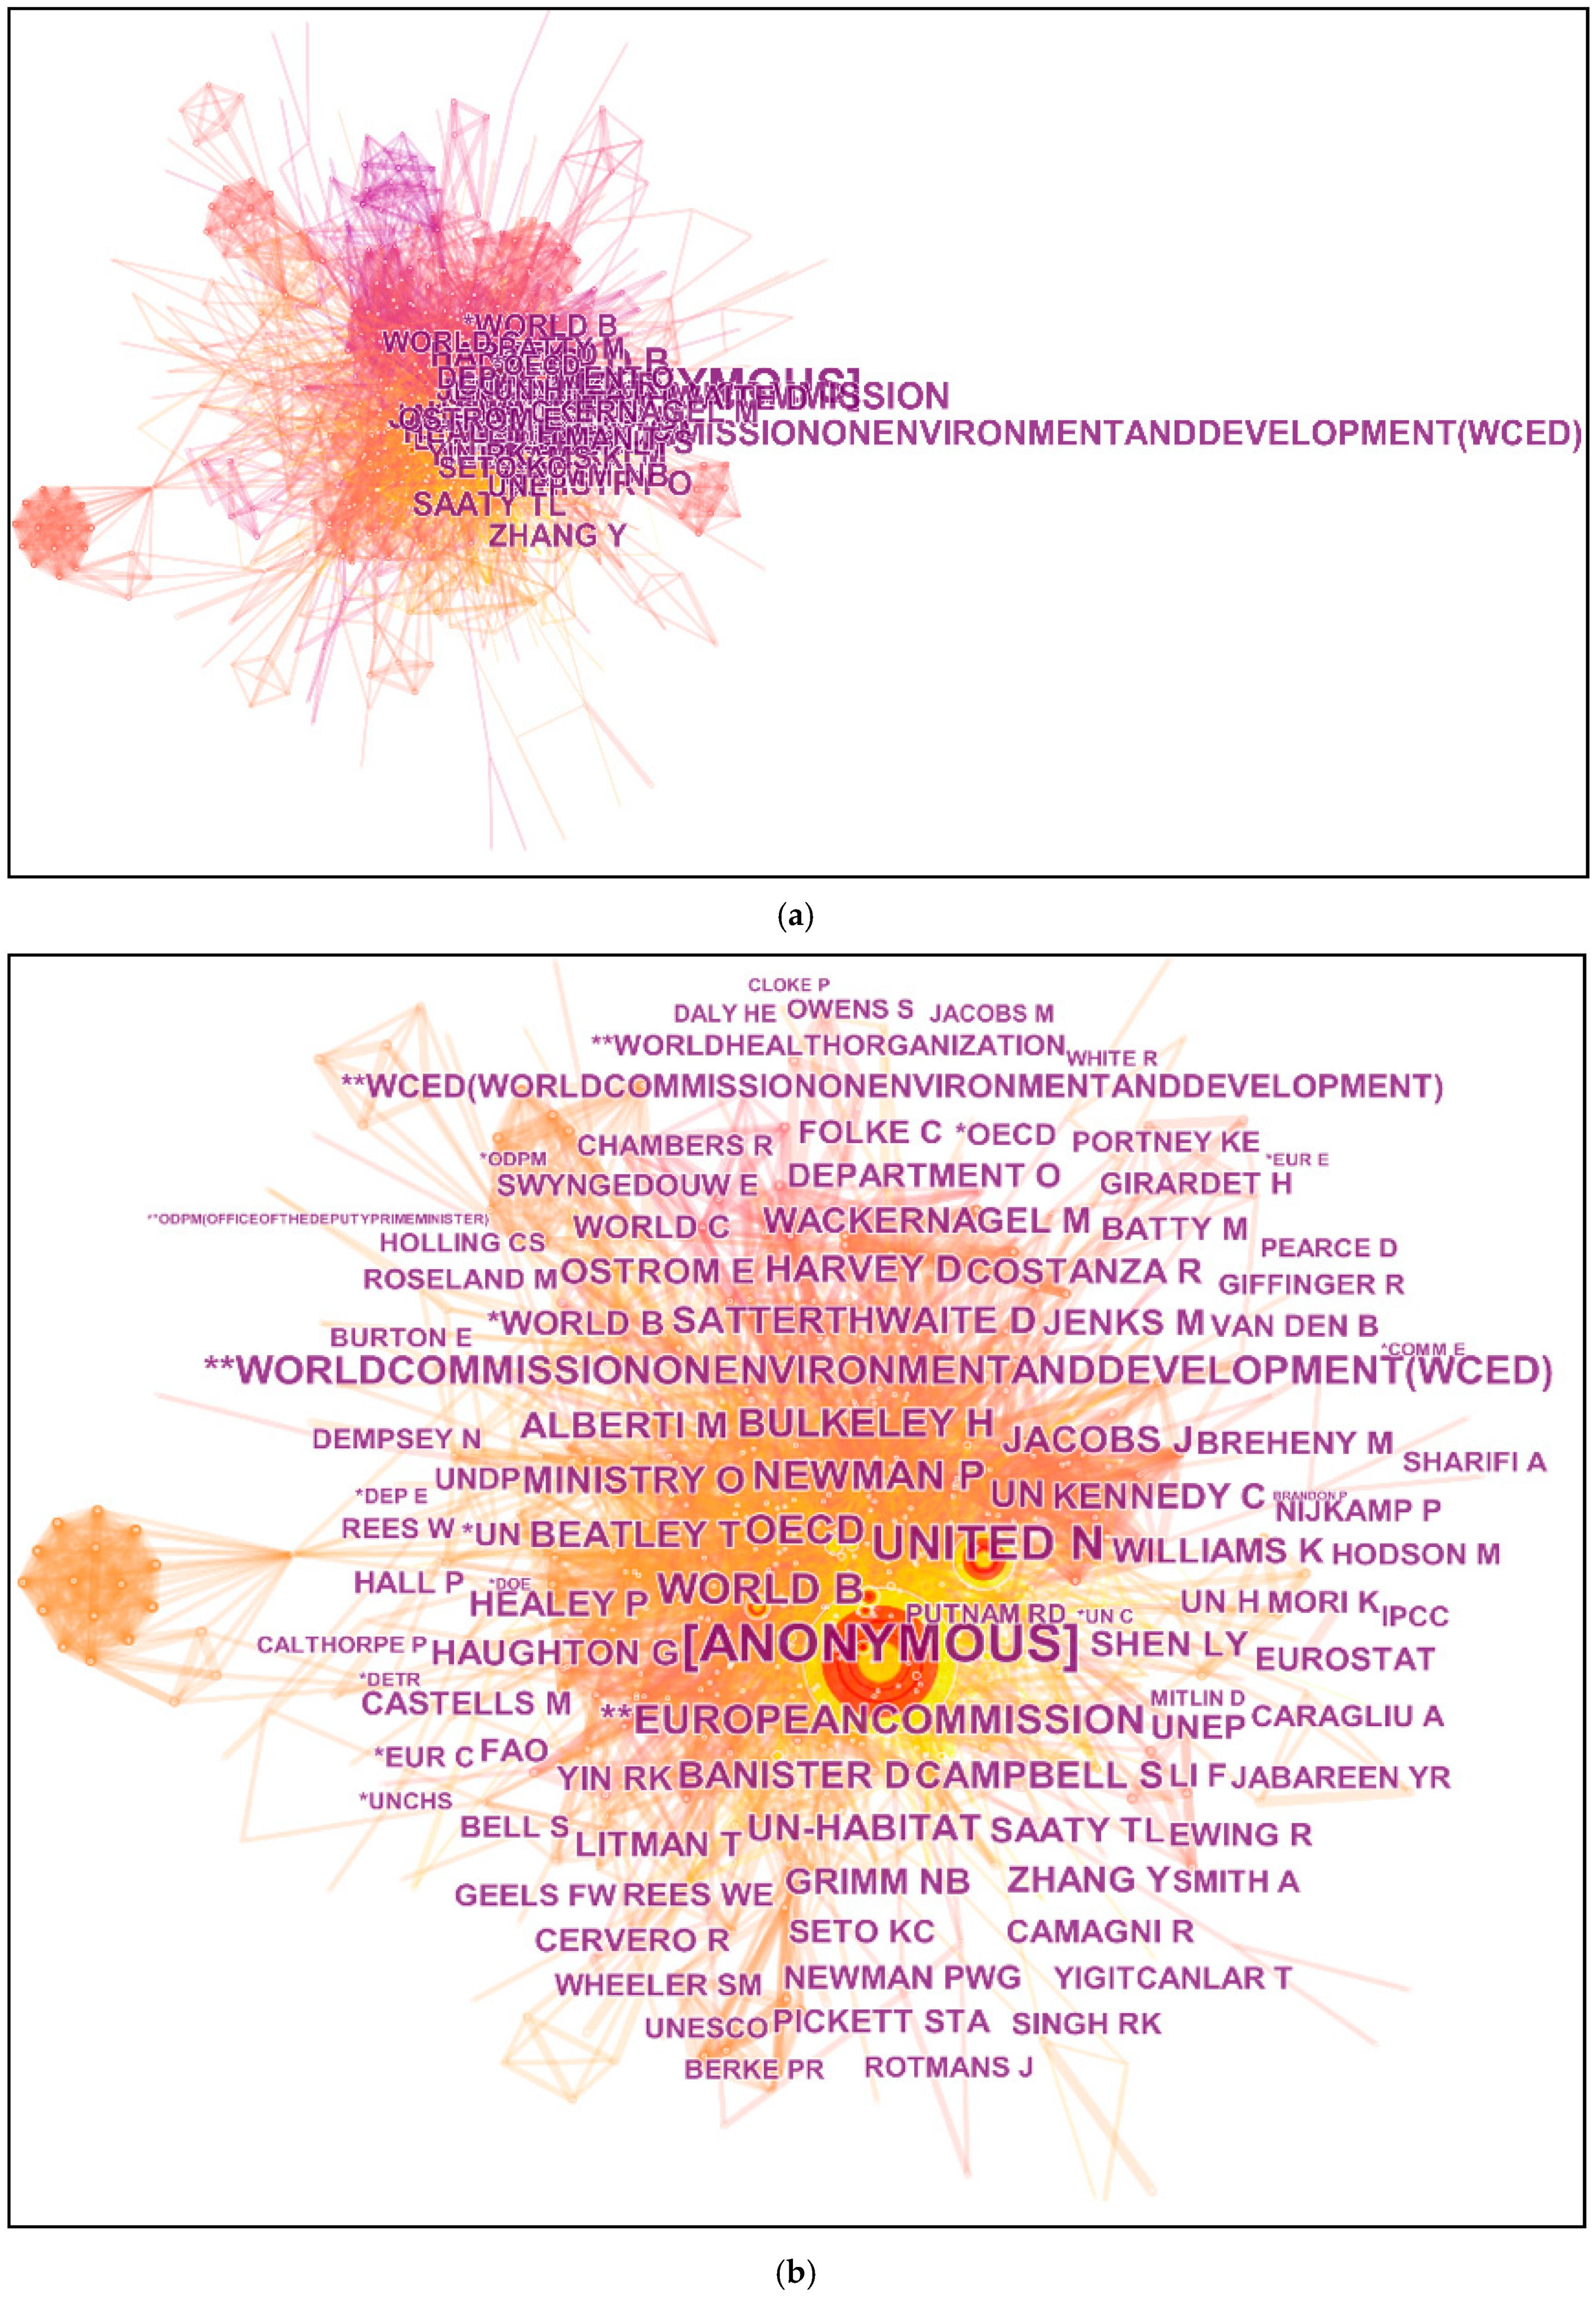
This methodology, citation analysis, also confers suitable tools to measure authors’ or journals’ contributions, productivity, communications, and connections. In this section, by the implementation of this technique using CiteSpace software, the authors’ influences on each other and their contributions as well as their cooperation are studied through the abovementioned scientometric metrics. Figure 7 depicted the obtained results of this study and the Table 6 classified their statistical information.
According to Table 6, the UN is recognized as the most cited author in the area of SURA. It shows how the scientific effort of this international organization is the basis for other investigations and became the motivation and origin of forthcoming studied all around the world. The World Bank, and Organization for Economic Co-operation and Development (OECD) are the second and third top-cited authors while the European Commission is standing in the fifth place after Peter Newman, the distinguished professor of Curtin University, Australia.
Citation count (CC) metric: By arranging cited authors by their CC United Nation in Cluster #0 by CC of 522 achieve the first place. World Bank in Cluster #0 possessed the second place, by CC of 314. The third is OECD in Cluster #0, by CC of 236. The fourth is Newman in Cluster #0, by CC of 231. The fifth is European Commission in Cluster #0, by CC of 226. The sixth is Bulkeley in Cluster #0, by CC of 165. The seventh is the WCED in Cluster #0, by CC of 155. The eighth is Ministry of Energy in Cluster #0, by CC of 147. The ninth is Banister in Cluster #7, with citation counts of 141.
Burst metric: By arranging cited authors by their citation burst, United Nation in Cluster #0 achieved the first place, with bursts of 29.75. The second position goes to Shen in Cluster #0, with bursts of 22.95. Pickett in Cluster #0 reached to the third position with bursts of 21.43. The fourth is Caragliu in Cluster #0, with bursts of 21.15. The fifth is UN Habitat in Cluster #0, with bursts of 19.21. The sixth is WCED in Cluster #0, with bursts of 19.18. The seventh is European Commission in Cluster #0, with bursts of 19.13. The eighth is Giffinger with bursts of 18.89 in Cluster #0. The ninth is Sharifi in Cluster #0, with bursts of 17.99.
Betweenness centrality metric (BS): The top ranked item by centrality is United Nation in Cluster #0, with 0.00 BS. The second is Shen in Cluster #0, with 0.00 BS. The third is Pickett in Cluster #0, by 0.00 BS. The fourth is Caragliu in Cluster #0, by BS of 0.00. The fifth is UN Habitat in Cluster #0, by BS of 0.00. The sixth is WCED (2016) in Cluster #0, by BS of 0.00. The seventh is European Commission (2005) in Cluster #0, by BS of 0.00. The eighth is Giffinger in Cluster #0, by BS of 0.00. The ninth is Sharifi in Cluster #0, by BS of 0.00.
Novelty: By arranging cited authors by their novelty index, United Nation in Cluster #0, with novelty of 1.00 stands on the first place. Shen in Cluster #0 stands in second place with novelty of 1.00. Also, Pickett in Cluster #0, with novelty of 1.00 reaches to the third place. The fourth is Caragliu, A. (2017) in Cluster #0, with novelty of 1.00. UN Habitat in Cluster #0 goes to the fifth with novelty of 1.00. The sixth is WCED in Cluster #0, with novelty of 1.00. The seventh is the European Commission in Cluster #0, with novelty of 1.00. The eighth is Giffinger in Cluster #0, with novelty of 1.00 and finally, the ninth becomes Sharifi in Cluster #0, with novelty of 1.00.
Moreover, the World Bank as is an international financial institution that provides loans to countries of the world for capital projects positioned in the second rank in the area of SURA and in the third position, OECD as an intergovernmental economic organization was established in order to stimulate economic progress and world trade. It is noteworthy that the first three most cited authors in the sought topic are international organizations. Figure 7 is the graphical representation of this discussion and shows how these cited “authors” are connected to each other and their importance as well.
4.8. Cited Journal Analysis
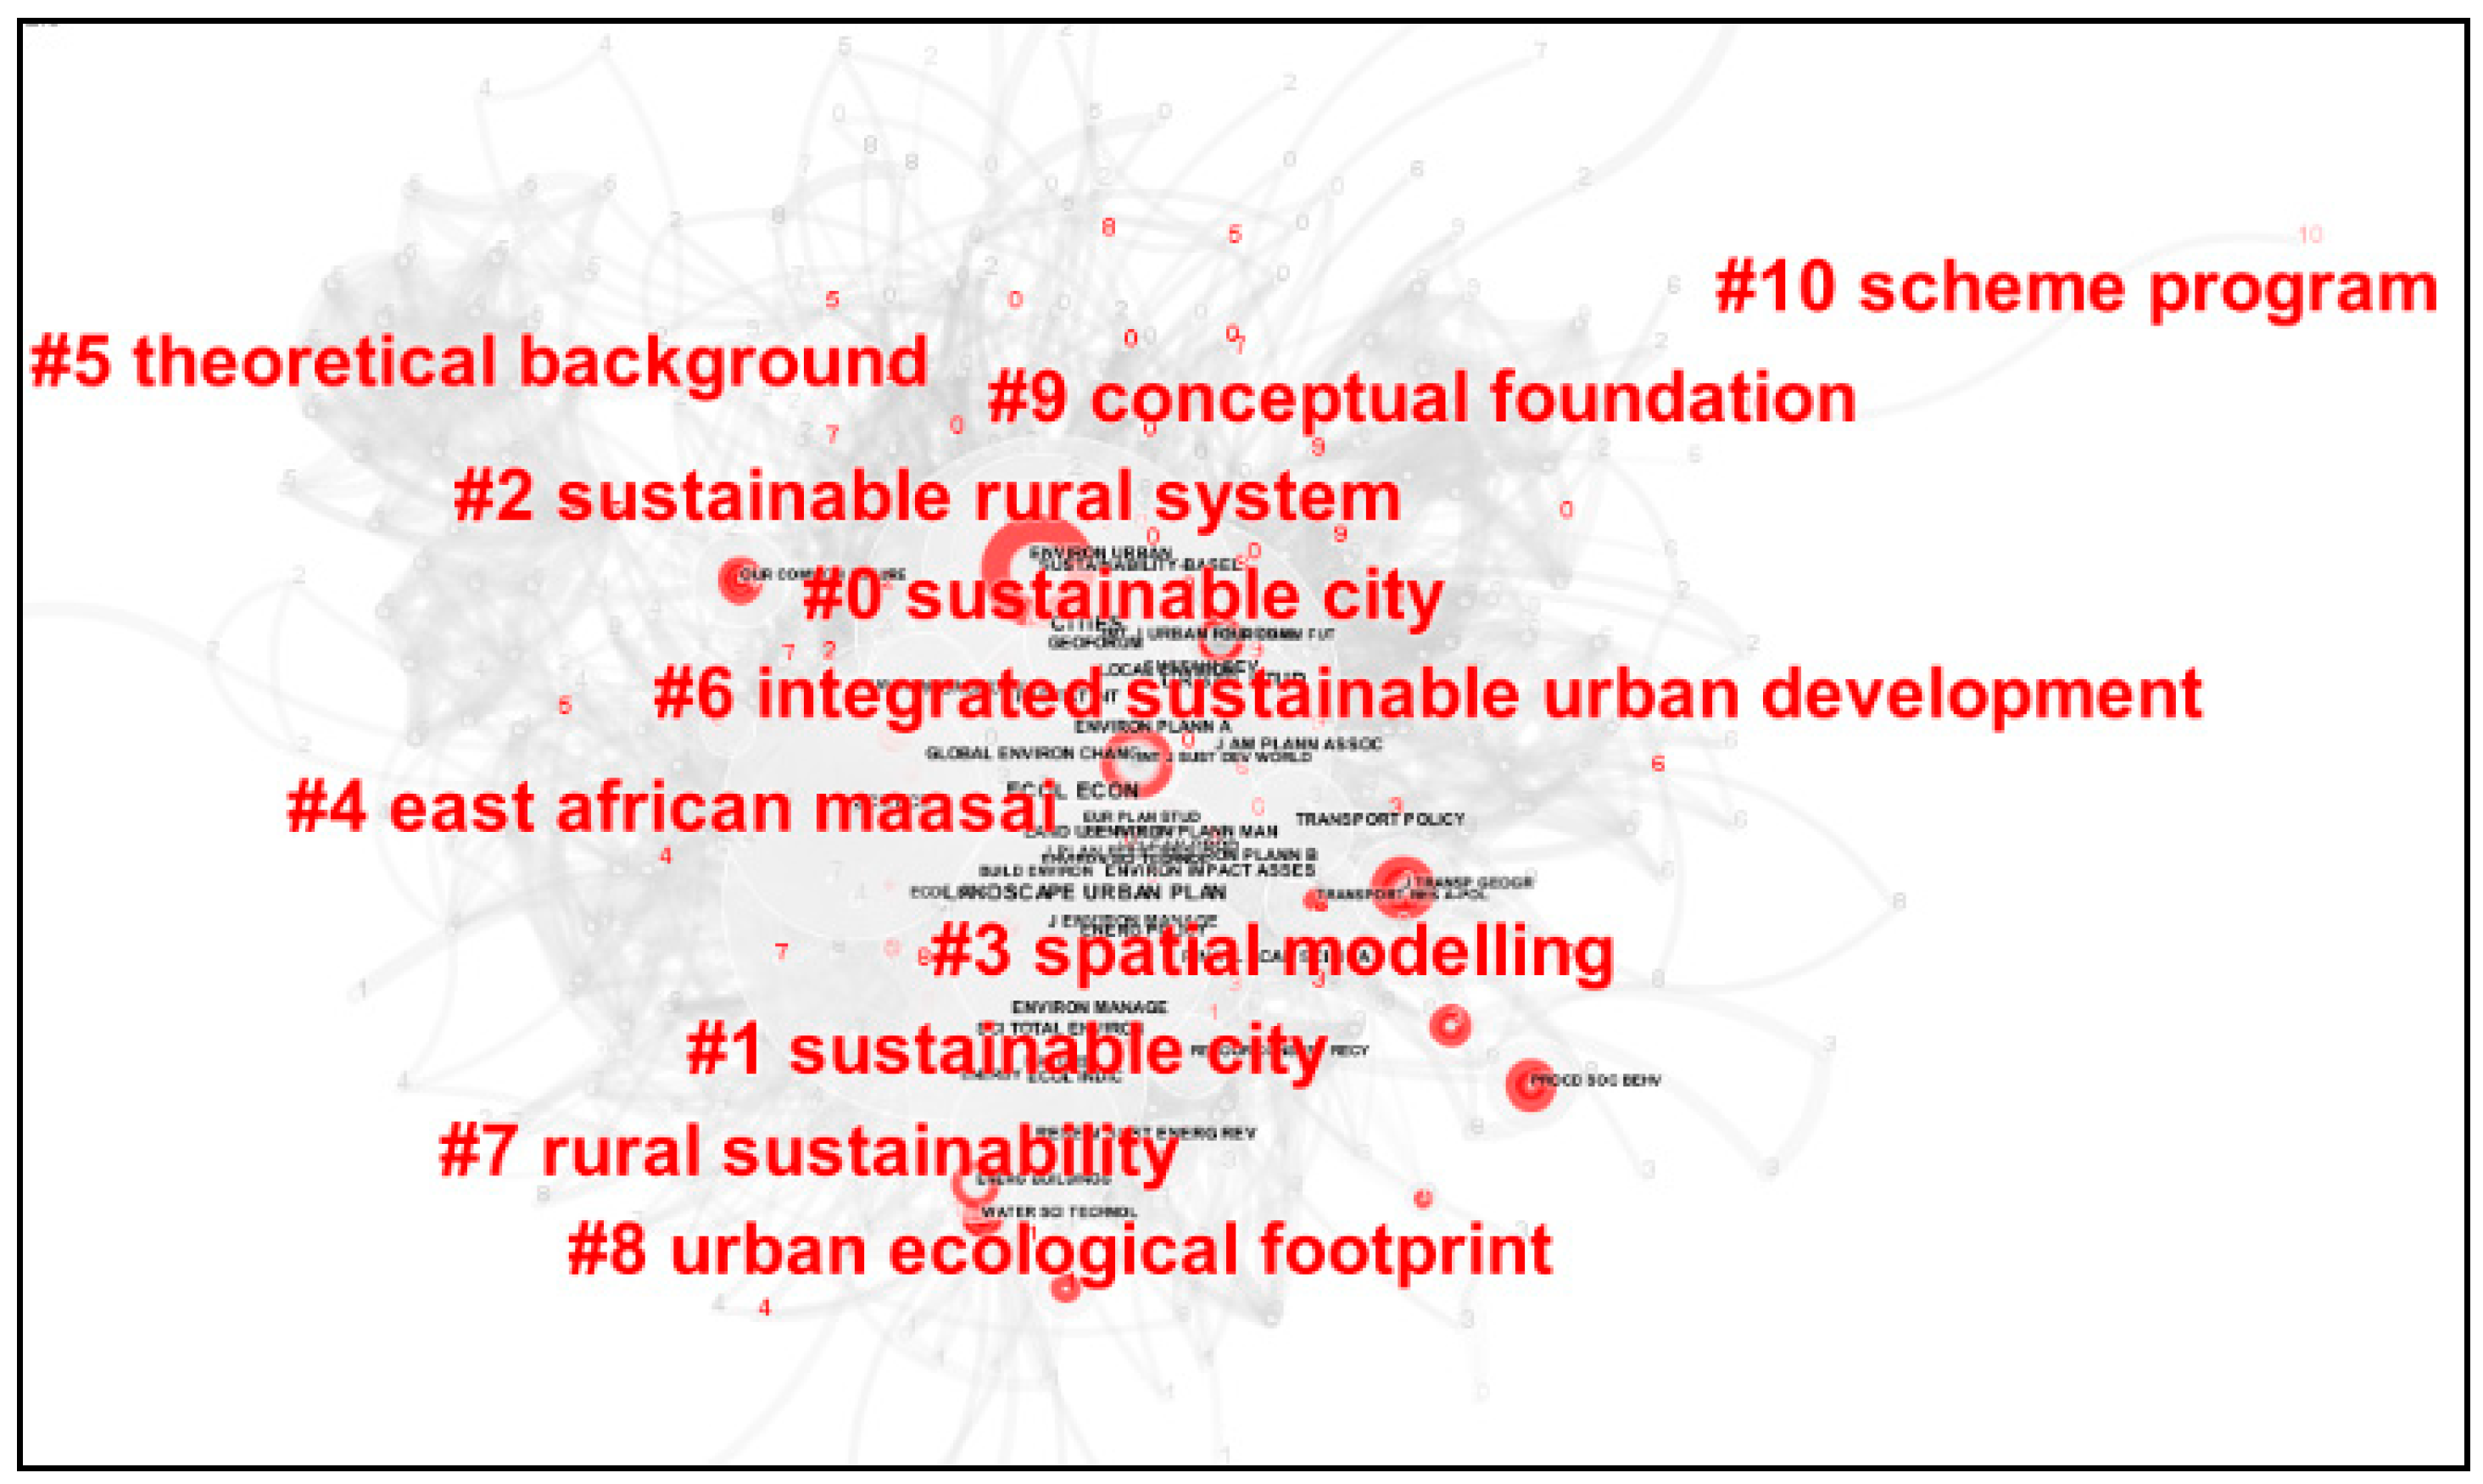
The entire detailed information of all 1280 records of scientific works on SURA from WoS in years between 1990 and 2018, were excerpted and fed into the CiteSpace software as an input data to audit and explore those journals that have had contributions in SURA area. The examination, likewise cited author section, was performed according to scientometric indices includes novelty, centrality, and burst of citations. Figure 8 displayed clusters of cited journal and detailed explanation of this graph is given as follows. Moreover, Table 7 provided more statistical information in this regard.
According to Table 7, the top cited journal is Landscape Urban Planning which shows how much attention this journal has received from the scientific community in the area of SURA. The second and the third rank belong to the journals of Cities and Urban Studies respectively.
Citation count (CC): The journal of Landscape and Urban Planning (1998) in Cluster #1 possessed the position of topmost cited journal, with citation counts of 804. The second one is Cities (1995) in Cluster #0, with 753 CC. The third is Urban Studies (1996) in Cluster #0, with CC of 719. The fourth is Ecology and Environment (1999) in Cluster #1, with citation counts of 707. The fifth is Thesis Projects and Dissertations (2010) in Cluster #33, with citation counts of 623. The sixth is Journal of Cleaner Production (2005) in Cluster #1, with citation counts of 590. The seventh is of Environmental Management (1998) in Cluster #1, with citation counts of 582. The eighth is Habitat International (1996) in Cluster #0, with 571 CC. The ninth is Science (1996) in Cluster #1, with citation counts of 517. Energy Policy (2005) with CC of 507 in Cluster #1 stands in tenth position.
Burst: By comparing the citation burst factor, the journal of Our Common Future (1991) in Cluster #6 with bursts of 77.61 reached first place. The second one is Thesis Projects and Dissertations (2010) in Cluster #33, by bursts of 68.34. The third is Water Security (1997) in Cluster #1, by bursts of 34.01. The fourth is Ecology Management (2006) in Cluster #1, with bursts of 28.80. Environmental Management and Sustainability (2006) in Cluster #1 stands in the fifth place by bursts of 28.74. The sixth is Futures (2000) in Cluster #1, with bursts of 28.22. The seventh is Tourism Management (2010) in Cluster #0, with bursts of 27.92. The eighth is Applied Ecology (2016) in Cluster #1, by bursts of 27.58. The ninth is Transport Research Record (2002) in Cluster #3, with bursts of 26.76. The tenth is Sustainable Cities and Society (1995) in Cluster #0, with bursts of 26.69.
Betweenness centrality (BS): After arranging journals based on BS parameter, the journal of Our Common Future (1991) in Cluster #6 stands in the first position, with 0.00 BS. Thesis Projects and Dissertations (2010) in Cluster #33 obtained the second rank by centrality of 0.00. Also, Water Security (1997) in Cluster #1 received the third place by BS of 0.00. The fourth is Ecology Management (2006) in Cluster #1, by BS of 0.00. The fifth is Environmental Management and Sustainability (2006) in Cluster #1, by BS of 0.00. The sixth is Futures (2000) in Cluster #1, with centrality of 0.00. The seventh is Tourism Management (2010) in Cluster #0, by BS of 0.00. The eighth is Applied Ecology (2016) in Cluster #1, by BS of 0.00. The ninth is Transport Research Record (2002) in Cluster #3, by 0.00 BS. Finally, Sustainable Cities and Society (1995) in Cluster #0 stand in tenth place by 0.00 BS.
Novelty: After arranging journals based on novelty, the top ranked item becomes Our Common Future (1991) in Cluster #6, with novelty of 1.00. Then, the Thesis Projects and Dissertations (2010) in Cluster #33 stands in second position with novelty of 1.00. Journal of Water Security (1997) in Cluster #1 by novelty of 1.00 obtained the third place. The fourth is Ecology Management (2006) in Cluster #1, by novelty of 1.00. The fifth is Environmental Management and Sustainability (2006) in Cluster #1, by novelty of 1.00. The sixth is Futures (2000) in Cluster #1, by novelty of 1.00. The seventh is Tourism Management (2010) in Cluster #0, with novelty of 1.00. The eighth is Appl E (2016) in Cluster #1, by novelty of 1.00. The ninth is Transport Research Record (2002) in Cluster #3, by novelty of 1.00. Finally, Sustainable Cities and Society (1995) in Cluster #0 possessed the tenth place by novelty of 1.00.
In Figure 8, the clusters which were analyzed by four scientometric indicators, are graphically depicted and numbered from 1 to 10. The number of clusters represented the order of cluster importance.
4.9. Category Analysis
After scientometric survey on the frequency of categories, the results of analysis are displayed in Table 8 and Figure 9. As seen, the advanced 10 categories are ordered based on their frequency as follows.
Table 8 can transfer some important information on how SURA has been categorized. First of all, the first three categories belong to the environmental issue which shows how environmental aspects of SURA are bold and significant in comparison with its other aspects. Second, the fourth category belongs to engineering which implies the technological aspects of SURA. However, the importance of a category can also be recognized by other scientometric indicators like novelty. With this indicator, science and technology as well as urban studies are positioned in first and second rank respectively. The role of these two areas are magnificent due to receiving too much attention in a short span and at the same time they are connecting many miscellaneous topics and hence can be considered as a multidisciplinary category. The category of “green & sustainable science” also have received too much attention in a short period of time but has less connectivity with respect to “science and technology” category.
In fact, Table 8 reveals the noteworthy hidden aspect of SURA. It uncovers all the branches of science which are struggling in the SURA area and at least partly have engaged with this concept. As it was mentioned in the introduction, each individual research can contribute into a limited topic related to SURA. In this way, having categories such as “geology”, “ecology”, “water resources”, “economy”, “architecture”, and “energy” are expected and categories of “public administration” and “business” in high-level of frequency are surprising.
4.10. Cited Document Frequency Analysis
As reported by the WoS, and listed in Table 9, the presented articles have the most cited rate in the interval between 1990 and 2018. The most cited article [75], written by Anna Chiesura, addressed a topic which had been received less attention, less attractive to researchers but important enough to be concerned: type of nature near to people’s accommodation, to the small-scale green lands in cities and settlements enriching human life accompanied with its importance and advantages in human societies. Chiesura in 2003 showed that human lucrative impression may be originated from having green lands where people live and work.
These statistics provided in Table 9 shows that the first 10 most cited articles are far above average value (107-fold greater for the first and 35-fold for the 10th) which implies widely distributed citations among published papers from very high to very low values.
5. Conclusions
In a rapidly populating, urbanizing and industrializing human civilization era—the Anthropocene—, sustainability of urban and rural areas is critical to secure the continuum of our existence on the planet [85,86,87]. Smart and sustainable development practices, especially at the dawn of the catastrophic natural events—that are caused by the human impacts on the ecosystem destruction such as Amazon and Australia bushfires—, are utmost importance to meet the sustainable development goals [88,89]. Within this perspective, this study concentrated on providing insights into the progress of the academic research in the field.
Mapping out the scientific landscape of a research area is critical to understand the direction and progress of the field [90]. This study aims to present an extensive and inclusive scientometric research about the sustainable cities, settlements, and rural areas. A total of 1280 publications (to a large extent articles) were analyzed for drawing of the bibliographic maps. The detailed analysis of the results achieved can be summarized as follows:
- Although 35 years have passed from the beginning of research on SURA, one-eighth of total publications were in 2018, which indeed implies the intensity of the world concern toward this issue.
- Rate of publication about SURA has five jumps (more than 1.5 folds increment), of which two are exactly matched with UN agendas (agenda 21, and 2030 agenda), and a further two of them were the initiation of changes on the high level of policymaking. This fact shows how greatly governmental and scientific activity influence each other.
- The sought topic is mainly categorized into environmental science, green and sustainable studies, and urban planning. Moreover, main keywords are highly connected to this area and include sustainability, cities, and sustainable development.
- This topic has gained growing attention from all over the world such that number of publications shows a monotonically increasing trend over the past decade.
- Articles are the major part of recoded publication among all publications; the most cited author addressed green land next to people’s workplace and living area, which few studies have researched.
- China and the US have had the topmost contributions in this scientific area.
- The most cited article addressed the role of green areas around where humans live and work on the topic of sustainable cities.
- The top-cited journal in SURA is Landscape and Urban Planning, which shows how much attention this journal has received from scientific community in the area of SURA. The second and the third ranks go to journals of Cities and Urban Studies respectively. Moreover, the UN and World Bank Group are recognized as the most cited authors/organizations in the SURA field.
- Finally, additional criterion was offered for “smart city” in order to distinguish the concepts of “sustainable city” and “smart city” and clarify their definition as well.
This study is the first scientometric analysis of the sustainable urban and rural areas topic. The results of this study shed light on the trends and patterns, consisting of kernel research areas, countries, journals, institutions, and how these entities have been concatenated inside the bibliographic records around sustainable urban and rural areas. The findings facilitate identifying the barriers and weakness in the current sustainable urban and rural areas research, and consequently help in identifying auspicious directions for prospective investigations.
Author Contributions
Y.S. designed the study, conducted the analysis, and prepared the draft of the manuscript. T.Y. improved the rigor, relevance and reach of the study, and language edited the manuscript. All authors read and approved the final version of the manuscript.
Funding
This research received no external funding.
Acknowledgments
This research did not receive any specific grant from funding agencies in the public, commercial or not-for-profit sectors. The authors thank anonymous referees for their invaluable comments on an earlier version of the manuscript.
Conflicts of Interest
The authors declare no conflict of interest.
Appendix A

Table A1.
Sustainability indicators.
| Indicator | Topic & Theme | Quantitative Interpretation |
|---|---|---|
| Household internet access | Infrastructure & Economy | |
| Total R&D appropriations | Innovation & Economy | |
| Patent applications | Innovation & Economy | |
| Persons employed | Employment & Economy | |
| E-commerce & secure transactions | ICT/Trade & Economy | |
| Public transportation | Infrastructure & Economy | |
| Length of bicycle network | Infrastructure & Economy | |
| Number of days particulate matter PM10 concentrations exceed 50 | Air quality & Environment | |
| Annual average concentration of NO2 | Air quality & Environment | |
| Transport greenhouse gas emissions | Air quality & Environment | |
| Annual average concentration of PM10 | Air quality & Environment | |
| Urban wastewater load | Water & Environment | |
| Ratio of population suffering from noise | Noise& Environment | |
| Share of solid waste recycled | Environmental quality | |
| This city is a clean city: strongly agree | Environmental quality | |
| lands dedicated to green urban areas, sports, and leisure facilities | Environmental quality | |
| Protected terrestrial area | Biodiversity & Environment | |
| Share of renewable energy in gross final energy consumption | Energy & Environment | |
| Electricity generated from renewable sources | Energy & Environment | |
| Persons with ISCED level 5, 6, 7, or 8 as the highest level of education | Education, Society and Culture | |
| Share of students in higher education in the total population | Education, Society and Culture | |
| Infant mortality rate | Health, Society and Culture | |
| Share of total deaths per year | Health & Society and Culture | |
| Index of the number of serious accidents at work per 100,000 | Health & Society and Culture | |
| share of murders and violent deaths | Safety& Society and Culture | |
| Children accessing inappropriate websites | Safety & Society and Culture | |
| Severe housing deprivation rate by tenure status | Housing& Society and Culture | |
| Number of public libraries | Society and Culture | A count of the number of public libraries in a city |
| Number of theatres | Society and Culture | A count of the number of theatres in a city |
| Gender pay gap in unadjusted form | Inclusion & Society | |
| Voter turnout in national and EU parliamentary elections | Inclusion & Society | |
| Gini coefficient equivalent disposable income | Inclusion & Society | Calculated by cumulative income against the distribution of the population |
Appendix B. The Metrics
Betweenness centrality (BC): as a branch of graph theory this crucial metric is considered a tool for measurement of probability for the shortest path between each two nodes in a graph or a network of nodes with this constrain that this path must pass over a certain node.
In 1979, Freeman [67] defined this metric to display the significant potential of decisive changes with beneficial results at a given node. The value of betweenness centrality for node k, BC(k), is given in Equation (A1).
where ∆ij(κ) represents the number of shortest links which pass over the vertex κ and ∆ij represents the total number of shortest links between vertices i and j. Consequently, a large value of BC implies that a certain node is located on the enormous number of shortest routes bringing into contact a pair of nodes. One may conclude that BC should fall into the interval [0 1]. Moreover, for a certain network, if BC of certain node becomes unity, it implies that there must be just one geodesic connecting an individual pair of nodes.
Turning points: turning point or pivotal node displays the magnitude or rank of node because of changing from a certain orientation or inclination to the other one. In scientometric analysis of citation frequency of two articles in the same document, turning point is identified where a document is cited by another cluster.
Citation Burst (CB): this metric will consider the temporal changes in citation of a document and/or a certain phrase to check if there is a rapid growth during a certain period. It means that CB of a document indicates a significant change in its citation frequency. For a given n cluster of documents, the tth cluster consists of rt pertinent documents among the whole scope of dt, then burst can be expressed by:
Equation (A2) describes the probability in which rt number of pertinent documents van be generated by employing a binomial form of probability pi. It may be deduced that, in addition, as a probability value, pi cannot surpass one, and the state qi is creditable for pi ≤ 1.
Novelty: in some scientometric research the novelty metric has been also represented by the Greek letter sigma. This metric is the combination of both CB and BC and referred to temporal and architectural significance of a publication among its connected network.
References
- Arbolino, R.; Carlucci, F.; Cirà, A.; Ioppolo, G.; Yigitcanlar, T. Efficiency of the EU regulation on greenhouse gas emissions in Italy: The hierarchical cluster analysis approach. Ecol. Indic 2017, 81, 115–123. [Google Scholar] [CrossRef] [Green Version]
- Dizdaroglu, D.; Yigitcanlar, T.; Dawes, L. A micro-level indexing model for assessing urban ecosystem sustainability. Smart Sustain. Built Environ. 2012, 1, 291–315. [Google Scholar] [CrossRef] [Green Version]
- Yigitcanlar, T.; Kamruzzaman, M.; Teriman, S. Neighborhood sustainability assessment: Evaluating residential development sustainability in a developing country context. Sustainability 2015, 7, 2570–2602. [Google Scholar] [CrossRef] [Green Version]
- Pitot, M.; Yigitcanlar, T.; Sipe, N.; Evans, R. Land Use & Public Transport Accessibility Index (LUPTAI) tool: The development and pilot application of LUPTAI for the Gold Coast. In Proceedings of the 29th Australian Transport Research Forum, Gold Coast, Australia, 27–29 September 2006; pp. 1–18. [Google Scholar]
- Yigitcanlar, T. Sustainable urban and regional infrastructure development: Technologies, applications and management: Technologies, applications and management. IGI Glob. 2010, 1, 425. [Google Scholar]
- Yigitcanlar, T. Rethinking sustainable development: Urban management, engineering, and design. IGI Glob. 2010, 1, 379. [Google Scholar]
- Yigitcanlar, T. Position paper: Benchmarking the performance of global and emerging knowledge cities. Expert Syst. Appl. 2014, 41, 5549–5559. [Google Scholar] [CrossRef] [Green Version]
- Metaxiotis, K.; Carrillo, J.; Yigitcanlar, T. Knowledge-based development for cities and societies: Integrated multi-level approaches: Integrated multi-level approaches. IGI Glob. 2010, 1, 389. [Google Scholar]
- Sotto, D.; Philippi, A.; Yigitcanlar, T.; Kamruzzaman, M. Aligning urban policy with climate action in the global South: Are Brazilian cities considering climate emergency in local planning practice? Energies 2019, 12, 3418. [Google Scholar] [CrossRef] [Green Version]
- Kamruzzaman, M.; Hine, J.; Yigitcanlar, T. Investigating the link between carbon dioxide emissions and transport-related social exclusion in rural Northern Ireland. Int. J. Environ. Sci. Technol. 2015, 12, 3463–3478. [Google Scholar] [CrossRef] [Green Version]
- Yigitcanlar, T. Smart city policies revisited: Considerations for a truly smart and sustainable urbanism practice. World Technop. Rev. 2018, 7, 97–112. [Google Scholar]
- Yigitcanlar, T.; Kamruzzaman, M. Planning, development and management of sustainable cities: A commentary from the guest editors. Sustainability 2015, 7, 14677–14688. [Google Scholar] [CrossRef] [Green Version]
- Yigitcanlar, T.; Foth, M.; Kamruzzaman, M. Towards post-anthropocentric cities: Reconceptualizing smart cities to evade urban ecocide. Urban Technol. 2019, 26, 147–152. [Google Scholar] [CrossRef] [Green Version]
- Arbolino, R.; De Simone, L.; Carlucci, F.; Yigitcanlar, T.; Ioppolo, G. Towards a sustainable industrial ecology: Implementation of a novel approach in the performance evaluation of Italian regions. J. Clean. Prod. 2018, 178, 220–236. [Google Scholar] [CrossRef] [Green Version]
- Ioppolo, G.; Cucurachi, S.; Salomone, R.; Shi, L.; Yigitcanlar, T. Integrating strategic environmental assessment and material flow accounting: A novel approach for moving towards sustainable urban futures. Int. J. Life Cycle Assess 2018, 1, 1–16. [Google Scholar] [CrossRef]
- Hood, W.W.; Wilson, C.S. The literature of bibliometrics, scientometrics, and informetrics. Scientometrics 2001, 52, 291–314. [Google Scholar] [CrossRef]
- Garfield, E. The agony and the ecstasy: The history and Meaning of the journal impact factor. J. Biol. Chem. 2005, 295, 1–22. [Google Scholar]
- Hargittai, I. The Chemical Intelligencer; Springer International Publishing: New York, NY, USA, 1999. [Google Scholar]
- de Solla Price, D.J. Networks of scientific papers Cited by me. Science 1965, 149, 510–515. [Google Scholar] [CrossRef]
- de Solla Price, D.J. Quantitative Measures of the Development of Science. Arch. Int. Hist. Sci. 1951, 4, 85–93. [Google Scholar]
- de Solla Price, D.J. A general theory of bibliometric and other cumulative advantage processes. J. Am. Soc. Inf. Sci. 1976, 27, 292–306. [Google Scholar] [CrossRef] [Green Version]
- Nicholls, P.T. Price’s square root law: Empirical validity and relation to Lotka’s law. Inf. Process. Manag. 1988, 24, 469–477. [Google Scholar] [CrossRef]
- UZUN, A. Statistical relationship of some basic bibliometric indicators in scientometrics research. In Proceedings of the International Workshop on Webometrics, Informetrics and Scientometrics & Seventh COLLNET Meeting, Nancy, France, 10–12 May 2006; p. 5. [Google Scholar]
- Prichard, A.; Spa, L. Bibliometrics, Informetrics and Scientometrics: Developments of the Concepts and its Application; de Gruyter: Berlin, Germany, 1969. [Google Scholar]
- World Commission on Environment. Our Common Future; Oxford University Press: Oxford, UK, 1987. [Google Scholar]
- Hawkes, J. The Fourth Pillar of Sustainability: Culture’s Essential Role in Public Planning; Common Ground: Melbourn, UK, 2001; Volume 1, ISBN 1 86335 050 0. [Google Scholar]
- Astara, O.H. Culture as the Fourth Pillar of Sustainable Development. SUSTAIBABLE Dev. Cult. Tradit. 2015, 1, 28–40. [Google Scholar]
- ITU-T SG20 Key Performance Indicators for Smart Internet of Things and Smart Cities and Communities. 2020. Available online: https://www.itu.int/en/ITU-D/Regional-Presence/AsiaPacific/SiteAssets/Pages/Events/2018/IOT_Platform_Applications_Thailand/2018-04-27-SG20-Ashish-updated-RU.pdf (accessed on 18 January 2020).
- Jenkins, W. Sustainability theory. Berksh. Encycl. Sustain. 2009, 1, 380–384. [Google Scholar]
- El Fouih, Y.; Kousksou, T.; Zeraouli, Y.; Mourad, Y.; Allouhi, A.; Jamil, A. Energy consumption and efficiency in buildings: Current status and future trends. J. Clean. Prod. 2015, 109, 118–130. [Google Scholar]
- Fahey, D.W.; Hegglin, M.I. Twenty Questions and Answers About the Ozone Layer: 2010 Update; World Meteorological Organization: Geneva, Switzerland, 2010; Volume 46, ISBN 9280722611. [Google Scholar]
- IPCC AR5 Summary for Policymakers. Clim. Chang. 2014 Impacts Adapt. Vulnerability-Contrib. Work. Gr. II Fifth Assess. Rep. 2013, 1, 1–32.
- Jiang, S.; Wang, N.; Wu, J. Combining BIM and Ontology to Facilitate Intelligent Green Building Evaluation. J. Comput. Civ. Eng. 2018, 32, 04018039. [Google Scholar] [CrossRef]
- Bakari, M.E.-K. The Dilemma of Sustainability in the Age of Globalization: A Quest for a Paradigm of Development; Lexington Books: New York, NY, USA, 2017; ISBN 978-1498551397. [Google Scholar]
- Anderson, R.B. Financial policies for sustainable growth. J. Finance 1960, 15, 127–139. [Google Scholar]
- Spence, M.; Annez, P.C.; Buckley, R.M. Urbanization and Growth; World Bank, Commission on Growth and Development: Washington, DC, USA, 2009; ISBN 9780821375730. [Google Scholar]
- Organisation for Economic Co-Operation and Development; China Development Research Foundation. Trends in Urbanisation and Urban Policies in OECD Countries: What Lessons for China? OECD: Paris, France, 2010; Volume 1, ISBN 9789264092259. [Google Scholar]
- Henderson, J.V. Urbanization and Growth; Aghion, P., Ed.; Elsevier: New York, NY, USA, 2004; Volume 1, ISBN 9780821375730. [Google Scholar]
- United Nations Agenda 21. In Proceedings of the United Nations Conference on Environment & Development, Rio de Janerio, Brazil, 3–14 June 1992; p. 351.
- Yigitcanlar, T.; Dodson, J.; Gleeson, B.; Sipe, N. Travel self-containment in master planned estates: Analysis of recent Australian trends. Urban Policy Res. 2007, 25, 129–149. [Google Scholar] [CrossRef] [Green Version]
- Dur, F.; Yigitcanlar, T. Assessing land-use and transport integration via a spatial composite indexing model. Int. J. Environ. Sci. Technol. 2015, 12, 803–816. [Google Scholar] [CrossRef] [Green Version]
- Luthra, S.; Mangla, S.K. Evaluating challenges to Industry 4.0 initiatives for supply chain sustainability in emerging economies. Process Saf. Environ. Prot. 2018, 117, 168–179. [Google Scholar] [CrossRef]
- Barreto, L.; Amaral, A.; Pereira, T. Industry 4.0 implications in logistics: An overview. Procedia Manuf. 2017, 13, 1245–1252. [Google Scholar] [CrossRef]
- Lu, Y. Industry 4.0: A survey on technologies, applications and open research issues. J. Ind. Inf. Integr. 2017, 6, 1–10. [Google Scholar] [CrossRef]
- Kamble, S.S.; Gunasekaran, A.; Gawankar, S.A. Sustainable Industry 4.0 framework: A systematic literature review identifying the current trends and future perspectives. Process. Saf. Environ. Prot. 2018, 117, 408–425. [Google Scholar] [CrossRef]
- Tjahjono, B.; Esplugues, C.; Ares, E.; Pelaez, G. What does Industry 4.0 mean to Supply Chain? Procedia Manuf. 2017, 13, 1175–1182. [Google Scholar] [CrossRef]
- Wollschlaeger, M.; Sauter, T.; Jasperneite, J. The future of industrial communication: Automation networks in the era of the internet of things and industry 4.0. IEEE Ind. Electron 2017, 11, 17–27. [Google Scholar] [CrossRef]
- Liao, Y.; Deschamps, F.; Loures, E.d.F.R.; Ramos, L.F.P. Past, present and future of Industry 4.0—A systematic literature review and research agenda proposal. Int. J. Prod. Res. 2017, 55, 3609–3629. [Google Scholar] [CrossRef]
- Duarte, S.; Cruz-Machado, V. Exploring Linkages Between Lean and Green Supply Chain and the Industry 4.0. In Proceedings of the Eleventh International Conference on Management Science and Engineering Management; Springer International Publishing: Cham, Switzerland, 2017; pp. 1242–1252. [Google Scholar]
- Akande, A.; Cabral, P.; Gomes, P.; Casteleyn, S. The Lisbon ranking for smart sustainable cities in Europe. Sustain. Cities Soc. 2019, 44, 475–487. [Google Scholar] [CrossRef]
- Yigitcanlar, T.; Kamruzzaman, M. Does smart city policy lead to sustainability of cities? Land Use Policy 2018, 73, 49–58. [Google Scholar] [CrossRef]
- Yigitcanlar, T.; Kamruzzaman, M.; Foth, M.; Sabatini-Marques, J.; da Costa, E.; Ioppolo, G. Can cities become smart without being sustainable? A systematic review of the literature. Sustain. Cities Soc. 2019, 45, 348–365. [Google Scholar] [CrossRef]
- Söderström, O.; Paasche, T.; Klauser, F. Smart cities as corporate storytelling. City 2014, 18, 307–320. [Google Scholar] [CrossRef]
- Ibrahim, M.; El-Zaart, A.; Adams, C. Smart sustainable cities roadmap: Readiness for transformation towards urban sustainability. Sustain. Cities Soc. 2018, 37, 530–540. [Google Scholar] [CrossRef] [Green Version]
- Yigitcanlar, T.; Kamruzzaman, M.; Buys, L.; Ioppolo, G.; Sabatini-Marques, J.; da Costa, E.M.; Yun, J.H.J. Understanding ‘smart cities’: Intertwining development drivers with desired outcomes in a multidimensional framework. Cities 2018, 81, 145–160. [Google Scholar] [CrossRef]
- Lara, A.P.; Da Costa, E.M.; Furlani, T.Z.; Yigitcanlar, T. Smartness that matters: Towards a comprehensive and human-centred characterisation of smart cities. J. Open Innov. Technol. Mark. Complex. 2016, 2, 8. [Google Scholar] [CrossRef] [Green Version]
- International Telecommunication Union. Smart Sustainable Cities: An Analysis of Definitions; Standardization Sector of ITU: Geneva, Switzerland, 2014; ISBN 978-92-61-25031-7. [Google Scholar]
- Sheikhnejad, Y.; Nassab, S.A.G. Three-dimensional numerical analysis of hydrodynamic characteristics of axial groove journal bearings running with ferrofluids under magnetic field. Proc. Inst. Mech. Eng. Part J J. Eng. Tribol. 2010, 224. [Google Scholar]
- Sheikhnejad, Y.; Ansari, A.B.; Ferreira, J.; Martins, N. Effects of parallel magnet bars and partially filled porous media on magneto-thermo-hydro-dynamic characteristics of pipe ferroconvection. Int. J. Heat Mass Transf. 2019, 136, 1273–1281. [Google Scholar] [CrossRef]
- Sheikhnejad, Y.; Gonçalves, D.; Oliveira, M.; Martins, N. Can buildings be more intelligent than users?- The role of intelligent supervision concept integrated into building predictive control. Energy Rep. 2019, 22–25. [Google Scholar] [CrossRef]
- Sheikhnejad, Y.; Rafati, A.; Sheikhnejad, F. CFD Analysis Of PDC Bit Heat Transfer By Drilling Mud Flow For Their Thermal Mortality. In Proceedings of the National Conference on CFD Applications in Chemical & Petroleum Industries; Iran University of Science and Technology: Tehran, Iran, 2014; pp. 1–11. [Google Scholar]
- Sheikhnejad, Y.; Vujicic, Z.; Almeida, Á.J.; Bastos, R.; Shahpari, A.; Teixeira, A.L. Analytical transient analysis of Peltier device for laser thermal tuning. In Proceedings of the SPIE—The International Society for Optical Engineering, Faro, Portugal, 8–12 May 2017; Volume 10453. [Google Scholar]
- Sheikhnejad, Y.; Bastos, R.; Vujicic, Z.; Shahpari, A.; Teixeira, A. Laser thermal tuning by transient analytical analysis of peltier device. IEEE Photonics J. 2017, 9, 7103613. [Google Scholar] [CrossRef]
- Sheikhnejad, Y.; Hosseini, R.; Saffar-Avval, M. Effect of different magnetic field distributions on laminar ferroconvection heat transfer in horizontal tube. J. Magn. Magn. Mater. 2015, 389, 136–143. [Google Scholar] [CrossRef]
- Sheikhnejad, Y.; Hosseini, R.; Avval, M.S. Laminar forced convection of ferrofluid in a horizontal tube partially filled with porous media in the presence of a magnetic field. J. Porous Med. 2015, 18, 437–448. [Google Scholar] [CrossRef]
- Sheikhnejad, Y.; Hosseini, M.M.; Teixeira, A.; Shahpari, A.; Hosseini, R.; Saffar Avval, M. Experimental Investigation and Three Dimensional Numerical Analysis of Ferroconvection Through Horizontal Tube Under Magnetic Field of Fixed Parallel Magnet Bars. J. Heat Transf. ASME 2017, 139, 1–10. [Google Scholar] [CrossRef]
- Sheikhnejad, Y.; Hosseini, R.; Saffar Avval, M. Experimental study on heat transfer enhancement of laminar ferrofluid flow in horizontal tube partially filled porous media under fixed parallel magnet bars. J. Magn. Magn. Mater. 2017, 424, 16–25. [Google Scholar] [CrossRef]
- Sheikhnejad, Y.; Ferreira, J.; Martins, N. A Three-Dimensional Thermo-hydrodynamic Simulation of Compact Cross-Flow Plate Heat Exchanger. Pet. Chem. Ind. Int. 2019, 2, 1–7. [Google Scholar]
- Sheikhnejad, Y.; Shokouhmand, H. Analytical solution of non-linear Heat conduction in long wire carrying current covered by an insulator. In Proceedings of the Annual International Conference on Mechanical Engineering-ISME2013, K.N.Toosi University, Tehran, Iran, 7–9 May 2013. [Google Scholar]
- Olawumi, T.O.; Chan, D.W.M. A scientometric review of global research on sustainability and sustainable development. J. Clean. Prod. 2018, 183, 231–250. [Google Scholar] [CrossRef]
- Chen, C. Citespace a Practical Guide for Mapping Scientific Literature; Nova Science Publishers, Inc.: New York, NY, USA, 2016; ISBN 2013436106. [Google Scholar]
- Chen, C. The CiteSpace Manual version 1.01. In College of Computing and Informatics; Drexel University: Philadelphia, PA, USA, 2014; pp. 1–84. [Google Scholar]
- Chen, C. Mapping Scientific Frontiers: The Quest for Knowledge Visualization; Springer: New York, NY, USA, 2003; ISBN 1-85233-494-0. [Google Scholar]
- Alves, J.; Souza, J.P.D.; Teixeira, A.P.; Nabout, J.C.; Carneiro, F.M.; Estadual, U.; Ueg, D.G.; Jardim, B.; Horizonte, N. Eutrophication in aquatic ecosystems: A scientometric study. Acta Limnol. Bras. 2018, 30, 1–15. [Google Scholar]
- Chiesura, A. The role of urban parks for the sustainable city. Landsc. Urban Plan. 2004, 68, 129–138. [Google Scholar] [CrossRef]
- Campbell, S. Green cities, growing cities, just cities? Urban planning and the contradictions of sustainable development. J. Am. Plan. Assoc. 1996, 62, 296. [Google Scholar] [CrossRef]
- Wackernagel, W.R.M. Urban ecological footprints: Why cities cannot be sustainable—And why they are a key to sustainability. Environ. Impact Assess. Rev. 1996, 16, 223–248. [Google Scholar]
- Betsill, H.B.M. Rethinking sustainable cities: Multilevel governance and the “urban” politics of climate change. Environ. Polit. 2005, 14, 42–63. [Google Scholar]
- Yeh, X.L.A.G.-O. The, Modelling sustainable urban development by integration of constrained cellular automata GIS. Int. J. Geogr. Inf. Sci. 2000, 114, 131–152. [Google Scholar]
- Jabareen, Y.R. Sustainable Urban Forms: Their Typologies, Models, and Concepts. J. Plan. Educ. Res. 2006, 26, 38–52. [Google Scholar] [CrossRef]
- Yamaguchi, A.M.D.Y. Land use and land cover change in Greater Dhaka, Bangladesh: Using remote sensing to promote sustainable urbanization. Appl. Geogr. 2009, 29, 390–401. [Google Scholar]
- Seto, K.C.; Reenberg, A.; Boone, C.G.; Fragkias, M.; Haase, D.; Langanke, T.; Marcotullio, P.; Munroe, D.K.; Olah, B.; Simon, D. Urban land teleconnections and sustainability. Proc. Natl. Acad. Sci. USA 2012, 109, 7687–7692. [Google Scholar]
- Dempsey, N.; Brown, G.B.S.P.C. The Social Dimension of Sustainable Development: Defi ning Urban Social Sustainability. Sustain. Dev. 2011, 19, 289–300. [Google Scholar] [CrossRef]
- Newman, P.W.G. Sustainability and cities: Extending the metabolism model. Landsc. Urban Plan. 1999, 44, 219–226. [Google Scholar] [CrossRef]
- Dizdaroglu, D.Y.T. Integrating urban ecosystem sustainability assessment into policy-making: Insights from the Gold Coast City. J. Environ. Plan. Manag. 2016, 1, 1982–2006. [Google Scholar] [CrossRef] [Green Version]
- Ingrao, C.; Messineo, A.; Beltramo, R.; Yigitcanlar, T.; Ioppolo, G. How can life cycle thinking support sustainability of buildings? Investigating life cycle assessment applications for energy efficiency and environmental performance. J. Clean. Prod. 2018, 10, 556–569. [Google Scholar] [CrossRef]
- Kankanamge, N.; Yigitcanlar, T.; Goonetilleke, A.; Kamruzzaman, M. Determining disaster severity through social media analysis: Testing the methodology with South East Queensland Flood tweets. Int. J. Disaster Risk Reduct. 2020, 42, 101360. [Google Scholar] [CrossRef]
- Yigitcanlar, T. Technology and the City: Systems, Applications and Implications; Routledge: New York, NY, USA, 2016. [Google Scholar]
- Yigitcanlar, T.; Han, H.; Kamruzzaman, M.; Ioppolo, G.; Sabatini-Marques, J. The making of smart cities: Are Songdo, Masdar, Amsterdam, San Francisco and Brisbane the best we could build? Land Use Policy 2019, 88, 104187. [Google Scholar] [CrossRef]
- Janik, A.; Ryszko, A.; Szafraniec, M. Scientific landscape of smart and sustainable cities literature: A bibliometric analysis. Sustainability 2020, 12, 779. [Google Scholar] [CrossRef] [Green Version]
Figure 1.
Flowchart of implemented procedures.

Figure 2.
Distribution of publication count.

Figure 3.
Distribution of publication types.

Figure 4.
Distribution of publications over the top 50 countries in Pareto histogram chart.

Figure 5.
Distribution of language of publications.

Figure 6.
Bibliographic presentation of keyword analysis: (a: top) keywords are in their own location in the network with the size proportional to their importance; (b: bottom) label locations are modified to present more legible figure.
Figure 6.
Bibliographic presentation of keyword analysis: (a: top) keywords are in their own location in the network with the size proportional to their importance; (b: bottom) label locations are modified to present more legible figure.

Figure 7.
Bibliographic presentation of cited author analysis: (a: top) authors are in their own location in the network with the size proportional to their importance; (b: bottom) label locations are modified to present more legible figure.
Figure 7.
Bibliographic presentation of cited author analysis: (a: top) authors are in their own location in the network with the size proportional to their importance; (b: bottom) label locations are modified to present more legible figure.

Figure 8.
Bibliographic presentation of cited journal cluster analysis.

Figure 9.
Bibliographic presentation of category analysis.

Table 1.
General statistics of all recorded publication on sustainable urban and rural areas (SURA) after screening.
Table 1.
General statistics of all recorded publication on sustainable urban and rural areas (SURA) after screening.
| Total Publication | Interval Time | Citing Articles | Most Cited Article | Average Citation per Article |
|---|---|---|---|---|
| 7393 | 1900–2018 | 39,007 | 811 | 7.57 |
Table 2.
Distribution of publication count.
| No | Year | Count | Accumulative |
|---|---|---|---|
| 1 | 2018 | 931 | 7397 |
| 2 | 2017 | 852 | 6466 |
| 3 | 2016 | 817 | 5614 |
| 4 | 2015 | 697 | 4797 |
| 5 | 2014 | 451 | 4100 |
| 6 | 2013 | 441 | 3649 |
| 7 | 2012 | 395 | 3208 |
| 8 | 2011 | 359 | 2813 |
| 9 | 2010 | 390 | 2454 |
| 10 | 2009 | 269 | 2064 |
| 11 | 2008 | 207 | 1795 |
| 12 | 2007 | 201 | 1588 |
| 13 | 2006 | 174 | 1387 |
| 14 | 2005 | 151 | 1213 |
| 15 | 2004 | 154 | 1062 |
| 16 | 2003 | 109 | 908 |
| 17 | 2002 | 114 | 799 |
| 18 | 2001 | 71 | 685 |
| 19 | 2000 | 105 | 614 |
| 20 | 1999 | 75 | 509 |
| 21 | 1998 | 97 | 434 |
| 22 | 1997 | 83 | 337 |
| 23 | 1996 | 71 | 254 |
| 24 | 1995 | 52 | 183 |
| 25 | 1994 | 29 | 131 |
| 26 | 1993 | 31 | 102 |
| 27 | 1992 | 36 | 71 |
| 28 | 1991 | 20 | 35 |
| 29 | 1990 | 4 | 15 |
| 30 | 1989 | 6 | 11 |
| 31 | 1988 | 2 | 5 |
| 32 | 1987 | 1 | 3 |
| 33 | 1986 | 1 | 2 |
| 34 | 1984 | 1 | 1 |
Table 3.
Distribution of publication types.
| Type | Count |
|---|---|
| Article | 3857 |
| Proceeding paper | 2508 |
| Book review | 646 |
| Editorial material | 247 |
| Review paper | 220 |
| Meeting abstract | 53 |
| Correction | 17 |
| News item | 15 |
| Others | 13 |
Table 4.
The top authors having greater than or equal to 10 published papers.
| Rank | Author | Institution | Count | % out of 7397 |
|---|---|---|---|---|
| 1 | Zhang XL | City University of Hong Kong | 26 | 0.35% |
| 2 | Shen LY | Chongqing University | 19 | 0.26% |
| 3 | Brown RR | Monash University | 17 | 0.23% |
| 4 | Nijkamp P | Vrije Universiteit Amsterdam | 17 | 0.23% |
| 5 | Wang H | University of Washington | 16 | 0.22% |
| 6 | Wang L | University of California, Santa Barbara | 16 | 0.22% |
| 7 | Li Y | Tsinghua University Beijing | 15 | 0.20% |
| 8 | Liu Y | University of Michigan | 15 | 0.20% |
| 9 | Rogers CDF | University of Birmingham | 15 | 0.20% |
| 10 | Frantzeskaki N | Swinburne University of Technology | 14 | 0.19% |
| 11 | Zhang Y | Texas A&M University | 14 | 0.19% |
| 12 | Yigitcanlar T | Queensland University of Technology | 11 | 0.15% |
| 13 | Skitmore M | Queensland University of Technology | 11 | 0.15% |
| 14 | Gibbs D | University of Hull | 11 | 0.15% |
| 15 | Salvati L | Sapienza Università di Roma | 11 | 0.15% |
| 16 | Butler D | University of Exeter | 10 | 0.14% |
| 17 | Zhang L | Maryland Transportation Institute | 10 | 0.14% |
| 18 | Zhou J | Harbin Normal University | 10 | 0.14% |
Table 5.
Statistical information of analyzed keywords.
| Frequency | Burst | Centrality | Novelty | Keyword |
| 963 | 1.53 | 0.23 | 1.38 | Sustainability |
| 762 | 0.66 | 0.16 | 1.11 | City |
| 725 | 26.3 | 0.16 | 52.06 | Sustainable development |
| 370 | 2.32 | 0.11 | 1.28 | Management |
| 303 | 0.1 | 1 | System | |
| 282 | 0.76 | 0.1 | 1.07 | China |
| 266 | 0.77 | 0.09 | 1.07 | Policy |
| 261 | 2.8 | 0.05 | 1.14 | Indicator |
| 225 | 0.13 | 1 | Governance | |
| 211 | 0.04 | 1 | Climate change | |
| 209 | 2.13 | 0.02 | 1.04 | Urbanization |
| 205 | 0.09 | 1 | Model | |
| 204 | 0.62 | 0.04 | 1.03 | Urban sustainability |
| 199 | 0.09 | 1 | Impact | |
| 191 | 1.66 | 0.03 | 1.06 | Framework |
| 182 | 1.9 | 0.06 | 1.12 | Environment |
| 152 | 0.05 | 1 | Energy | |
| 150 | 0.06 | 1 | Sustainable city | |
| 149 | 1.07 | 0.07 | 1.08 | Community |
| 143 | 2.47 | 0.03 | 1.08 | Land use |
| 130 | 1.4 | 0.03 | 1.05 | Urban planning |
| 127 | 2.59 | 0.03 | 1.07 | Area |
| 124 | 1.36 | 0.08 | 1.11 | Urban |
| 118 | 21.5 | 0 | 1.03 | Smart city |
| 110 | 4.47 | 0.02 | 1.07 | Performance |
| 109 | 0.67 | 0.01 | 1 | Ecosystem service |
| 107 | 3.92 | 0.03 | 1.12 | Design |
| 91 | 0.94 | 0.03 | 1.02 | Developing country |
| 85 | 1.9 | 0.01 | 1.01 | Strategy |
| 84 | 1.07 | 0.04 | 1.04 | Sustainable urban development |
Table 6.
Distribution of the top cited author 1.
| Rank | Freq. | Burst | BC | Novelty | Author | Year |
|---|---|---|---|---|---|---|
| 1 | 522 | 29.75 | 0 | 1 | United Nation | 2001 |
| 2 | 314 | 2.81 | 0 | 1 | World Bank | 1996 |
| 3 | 236 | 3.83 | 0 | 1 | OECD | 1999 |
| 4 | 231 | 0.7 | 0 | 1 | Newman P | 1995 |
| 5 | 226 | 19.13 | 0 | 1 | European Commission | 2005 |
| 6 | 165 | 13.02 | 0 | 1 | Bulkeley H | 2004 |
| 7 | 155 | 17.43 | 0 | 1 | WCED 2 | 1996 |
| 8 | 147 | 10.5 | 0 | 1 | Ministry of Energy | 2012 |
| 9 | 141 | 5.94 | 0 | 1 | Banister D | 1997 |
| 10 | 137 | 1.74 | 0 | 1 | Beatley T | 1996 |
| 11 | 136 | 14.75 | 0 | 1 | United Nation | 2009 |
| 12 | 134 | 1.1 | 0 | 1 | Satterthwaite D | 1997 |
| 13 | 133 | 13.78 | 0 | 1 | UN-Habitat | 2007 |
| 14 | 132 | 3.19 | 0 | 1 | Harvey D | 1996 |
| 15 | 129 | 3.54 | 0 | 1 | Jacobs J | 1997 |
| 16 | 125 | 1.45 | 0 | 1 | Campbell S | 2001 |
| 17 | 118 | 2.72 | 0 | 1 | Alberti M | 1999 |
| 18 | 115 | 7.02 | 0 | 1 | Grimm NB | 2007 |
| 19 | 114 | 4.47 | 0 | 1 | Saaty TL | 2005 |
| 20 | 107 | 8.54 | 0 | 1 | Kennedy C | 2011 |
| 21 | 107 | 22.95 | 0 | 1 | Shen LY | 2014 |
| 22 | 105 | 14.69 | 0 | 1 | Litman T | 2004 |
| 23 | 102 | 0.58 | 0 | 1 | Zhang Y | 2010 |
| 24 | 101 | 1.87 | 0 | 1 | Haughton G | 1995 |
| 25 | 100 | 3.84 | 0 | 1 | Healey P | 1995 |
1 Authors with equal to or greater than 100 frequency were considered and reported as top authors; 2 World Commission on Environment and Development.
Table 7.
Distribution of the top cited journals 1.
| Freq. | Burst | Centrality | Novelty | Cited Journal | Year |
|---|---|---|---|---|---|
| 804 | 0 | 1 | Landscape and Urban Planning | 1998 | |
| 753 | 0 | 1 | Cities | 1995 | |
| 719 | 0 | 1 | Urban Studies | 1996 | |
| 707 | 0 | 1 | Ecology and Environment | 1999 | |
| 623 | 68.34 | 0 | 1 | Thesis | 2010 |
| 590 | 0 | 1 | Journal of Cleaner Production | 2005 | |
| 582 | 0 | 1 | Journal of Environmental Management | 1998 | |
| 571 | 0 | 1 | Habitat International | 1996 | |
| 517 | 0 | 1 | Science | 1996 | |
| 507 | 0 | 1 | Energy Policy | 2005 | |
| 496 | 0 | 1 | Journal of American Planning Association | 1995 | |
| 465 | 0 | 1 | Environmental Planning and Management | 1995 | |
| 460 | 0 | 1 | Environmental Impact Analysis | 2002 | |
| 432 | 0 | 1 | Ecological Indicators | 2009 | |
| 426 | 0 | 1 | Land Use Policy | 1999 | |
| 398 | 0 | 1 | Sustainability | 2014 | |
| 377 | 0 | 1 | Global Economics | 2001 | |
| 339 | 0 | 1 | International Journal of Urban and Regional Research | 1996 | |
| 338 | 0 | 1 | Geoforum | 1995 | |
| 334 | 4.84 | 0 | 1 | Environment & Urbanization | 1994 |
| 307 | 0 | 1 | Renewable & Sustainable Energy Reviews | 2011 | |
| 304 | 0 | 1 | Environmental Research and Public Health | 1998 | |
| 303 | 0 | 1 | Sustainable Development | 1998 | |
| 293 | 0 | 1 | Nature | 2001 | |
| 293 | 0 | 1 | Journal of Petroleum Resources Economics | 1996 | |
| 293 | 0 | 1 | Proceedings of National Academy of Sciences of the USA | 2001 | |
| 281 | 9.5 | 0 | 1 | World Development | 1992 |
| 276 | 0 | 1 | Science and Technology | 2004 | |
| 260 | 5.02 | 0 | 1 | Environment Planning and Management | 1999 |
| 260 | 0 | 1 | Transport Policy | 2001 | |
| 258 | 5.45 | 0 | 1 | Environmental Management | 1989 |
| 254 | 0 | 1 | Local Environment | 1999 | |
| 237 | 0 | 1 | Environment and Security | 2009 | |
| 235 | 0 | 1 | Building and Environment | 2004 | |
| 224 | 0 | 1 | Energy | 2002 | |
| 209 | 0 | 1 | Transportation Research Record | 1997 | |
| 209 | 0 | 1 | Ecology and Society | 2010 | |
| 206 | 11.64 | 0 | 1 | Transport Geography | 2003 |
| 198 | 0 | 1 | European Planning Studies | 2007 | |
| 190 | 77.61 | 0 | 1 | Our Common Future | 1991 |
| 187 | 22.69 | 0 | 1 | Our Common Future | 1996 |
| 181 | 34.01 | 0 | 1 | Water Security | 1997 |
| 167 | 19.13 | 0 | 1 | International Journal of Sustainable Development & World Ecology | 1998 |
| 167 | 18.73 | 0 | 1 | Proceedings of SOCB | 2015 |
| 165 | 6.38 | 0 | 1 | Environmental Sciences | 2004 |
| 161 | 0 | 1 | Resources, Conservation and Recycling | 2004 | |
| 159 | 0 | 1 | Energy and Buildings | 2007 | |
| 145 | 11.3 | 0 | 1 | Ambio | 1994 |
| 134 | 18.85 | 0 | 1 | Technological Forecasting and Social Change | 2007 |
| 126 | 27.58 | 0 | 1 | Applied ecology | 2016 |
| 118 | 16.84 | 0 | 1 | Applied Geography | 2015 |
| 117 | 19.73 | 0 | 1 | Journal INDE | 2011 |
| 105 | 0 | 1 | Sustainable Cities and Society | 2017 |
1 Journals with equal to or greater than 100 frequency were considered and reported.
Table 8.
Distribution of the top categories 1.
| Freq. | Burst | Centrality | Novelty | Category | Year |
|---|---|---|---|---|---|
| 2729 | 0.26 | 1 | Environmental Sciences & Ecology | 1989 | |
| 1691 | 0.07 | 1 | Environmental Sciences | 1991 | |
| 1549 | 11.46 | 0.08 | 2.53 | Environmental Studies | 1989 |
| 1478 | 0.14 | 1 | Engineering | 1993 | |
| 1295 | 35.69 | 0.07 | 9.95 | Urban Studies | 1991 |
| 1169 | 98.6 | 0.03 | 15.65 | Science & Technology—Other Topics | 1997 |
| 1072 | 99.97 | 0.01 | 2.4 | Green & Sustainable Science & Technology | 1997 |
| 986 | 7.07 | 0.04 | 1.3 | Public Administration | 1988 |
| 913 | 7.56 | 0.03 | 1.29 | Regional & Urban Planning | 1989 |
| 659 | 10.12 | 0.1 | 2.57 | Business & Economics | 1991 |
| 610 | 20.83 | 0.05 | 2.78 | Engineering Environmental | 1995 |
| 608 | 28.43 | 0.01 | 1.17 | Geography | 1989 |
| 578 | 20.13 | 0.03 | 1.65 | Engineering Civil | 1998 |
| 433 | 0.05 | 1 | Energy & Fuels | 1992 | |
| 400 | 16.52 | 0.03 | 1.53 | Construction & Building Technology | 1992 |
| 398 | 12.05 | 0.07 | 2.17 | Economics | 1991 |
| 375 | 5.63 | 0.01 | 1.09 | Architecture | 1991 |
| 358 | 17.66 | 0.07 | 3.09 | Water Resources | 1993 |
| 358 | 15.14 | 0.02 | 1.28 | Transportation | 1996 |
| 333 | 13.45 | 0.03 | 1.53 | Ecology | 1991 |
| 286 | 29.08 | 0.05 | 3.86 | Social Sciences—Other Topics | 1996 |
| 275 | 8.18 | 0.1 | 2.2 | Computer Science | 1994 |
| 253 | 28.08 | 0.03 | 2.61 | Management | 2001 |
| 242 | 10.85 | 0.17 | 5.66 | Agriculture | 1991 |
| 222 | 0 | 1 | Development Studies | 1990 | |
| 197 | 10.91 | 0.01 | 1.13 | Transportation Science & Technology | 1998 |
| 153 | 19.08 | 0.04 | 1.93 | Social Sciences Interdisciplinary | 2000 |
| 149 | 9.51 | 0.02 | 1.24 | Business | 2005 |
| 145 | 0.01 | 1 | Engineering Electrical & Electronic | 2007 | |
| 137 | 4.35 | 0.01 | 1.02 | Physical Geography | 1993 |
| 137 | 4.35 | 0.01 | 1.02 | Geography Physical | 1993 |
| 131 | 11.43 | 0.02 | 1.28 | Engineering Multidisciplinary | 1993 |
| 129 | 29.77 | 0.02 | 1.74 | Materials Science | 2006 |
| 119 | 29.47 | 0.01 | 1.24 | Materials Science Multidisciplinary | 2007 |
| 118 | 5.9 | 0.01 | 1.07 | Geology | 1998 |
| 117 | 6.08 | 0.01 | 1.08 | Geosciences Multidisciplinary | 1998 |
| 111 | 14.53 | 0 | 1 | Hospitality Leisure Sport & Tourism | 2010 |
| 110 | 0.1 | 1 | Public Environmental & Occupational Health | 1997 | |
| 104 | 6.3 | 0.04 | 1.27 | Computer Science Applications | 2003 |
1 Categories with equal to or greater than 100 frequency were considered and reported.
Table 9.
Statistical and qualitative information on the top 10 papers obtaining most citations.
| R 1 | Publication | Title | TC 2 | ACPY 3 | J-PY 4 |
|---|---|---|---|---|---|
| 1 | Chiesura [73] | “The role of urban parks for the sustainable city” | 811 | 49.69 | Landscape and Urban Planning-2004 |
| 2 | Campbell [76] | “Green cities, growing cities, just cities? Urban planning and the contradictions of sustainable development” | 571 | 23.29 | American Planning Association-1996 |
| 3 | Wackernagel [77] | “Urban ecological footprints: Why cities cannot be sustainable-And why they are a key to sustainability” | 410 | 16.92 | Environmental Impact Assessment Review-1996 |
| 4 | Betsill [78] | “Rethinking sustainable cities: Multilevel governance and the ’urban’ politics of climate change” | 392 | 25.6 | Environmental Politics-2005 |
| 5 | Yeh [79] | “Modeling sustainable urban development by the integration of constrained cellular automata and GIS” | 387 | 19.25 | International Journal of Geographical Information Science-2000 |
| 6 | Jabareen [80] | “Sustainable urban forms—Their typologies, models, and concepts” | 326 | 22.71 | Planning Education & Research-2006 |
| 7 | Yamaguchi [81] | “Land use and land cover change in Greater Dhaka, Bangladesh: Using remote sensing to promote sustainable urbanization” | 305 | 27.55 | Applied Geography-2009 |
| 8 | Seto et al. [82] | “Urban land teleconnections and sustainability” | 287 | 35.38 | Proceedings of Sciences of the USA-2012 |
| 9 | Dempsey et al. [83] | “The Social Dimension of Sustainable Development: Defining Urban Social Sustainability” | 284 | 30.78 | Sustainable Development-2011 |
| 10 | Newman [84] | “Sustainability and cities: extending the metabolism model” | 269 | 12.71 | Landscape and Urban Planning-1999 |
1 Rank, 2 total citations, 3 average citations per year, 4 publication year.
© 2020 by the authors. Licensee MDPI, Basel, Switzerland. This article is an open access article distributed under the terms and conditions of the Creative Commons Attribution (CC BY) license (http://creativecommons.org/licenses/by/4.0/).
Share and Cite
MDPI and ACS Style
Sheikhnejad, Y.; Yigitcanlar, T. Scientific Landscape of Sustainable Urban and Rural Areas Research: A Systematic Scientometric Analysis. Sustainability 2020, 12, 1293. https://0-doi-org.brum.beds.ac.uk/10.3390/su12041293
AMA Style
Sheikhnejad Y, Yigitcanlar T. Scientific Landscape of Sustainable Urban and Rural Areas Research: A Systematic Scientometric Analysis. Sustainability. 2020; 12(4):1293. https://0-doi-org.brum.beds.ac.uk/10.3390/su12041293
Chicago/Turabian StyleSheikhnejad, Yahya, and Tan Yigitcanlar. 2020. "Scientific Landscape of Sustainable Urban and Rural Areas Research: A Systematic Scientometric Analysis" Sustainability 12, no. 4: 1293. https://0-doi-org.brum.beds.ac.uk/10.3390/su12041293
Note that from the first issue of 2016, this journal uses article numbers instead of page numbers. See further details here.