Article

Optimization of Extraction Conditions for the Antioxidant Potential of Different Pumpkin Varieties (Cucurbita maxima)

by
Bartosz Kulczyński
1,
Anna Gramza-Michałowska
1,* and
Jolanta B. Królczyk
2
1
Department of Gastronomy Sciences and Functional Foods, Faculty of Food Science and Nutrition, Poznań University of Life Sciences, 31 Wojska Polskiego Str., 60–624 Poznań, Poland
2
Department of Manufacturing Engineering and Production Automation, Faculty of Mechanical Engineering, Opole University of Technology, ul. Prószkowska 76, 45–758 Opole, Poland
*
Author to whom correspondence should be addressed.
Sustainability 2020, 12(4), 1305; https://0-doi-org.brum.beds.ac.uk/10.3390/su12041305
Submission received: 29 November 2019 / Revised: 14 January 2020 / Accepted: 7 February 2020 / Published: 11 February 2020
(This article belongs to the Special Issue Sustainable Production in Food and Agriculture Engineering)

Abstract

:
Antioxidants are a wide group of chemical compounds characterized by high bioactivity. They affect human health by inhibiting the activity of reactive oxygen species. Thus, they limit their harmful effect and reduce the risk of many diseases, including cardiovascular diseases, cancers, and neurodegenerative diseases. Antioxidants are also widely used in the food industry. They prevent the occurrence of unfavourable changes in food products during storage. They inhibit fat oxidation and limit the loss of colour. For this reason, they are often added to meat products. Many diet components exhibit an antioxidative activity. A high antioxidative capacity is attributed to fruit, vegetables, spices, herbs, tea, and red wine. So far, the antioxidative properties of various plant materials have been tested. However, the antioxidative activity of some products has not been thoroughly investigated yet. To date, there have been only a few studies on the antioxidative activity of the pumpkin, including pumpkin seeds, flowers, and leaves, but not the pulp. The main focus of our experiment was to optimize the extraction so as to increase the antioxidative activity of the pumpkin pulp. Variable extraction conditions were used for this purpose, i.e., the type and concentration of the solvent, as well as the time and temperature of the process. In addition, the experiment involved a comparative analysis of the antioxidative potential of 14 pumpkin cultivars of the Cucurbita maxima species. The study showed considerable diversification of the antioxidative activity of different pumpkin cultivars.

1. Introduction

Food consumption is directly linked to maintaining health, well-being, and preventing hunger. In this context, proper nutrition is undoubtedly a key aspect of sustainable food, and thus also environmental sustainability. Plant products are the only alternative for the consumers to alter current meat products consumption and more sustainable way of living towards reducing negative impact on the environment. The application of plant matrices enriched with mineral components, instead of relevant animal products, allows the strive to develop practical alternatives that often change existing processes and products not corresponding with a sustainable production. Therefore, sustainable food production in an environmentally acceptable manner to meet the increasing demands of a growing population is an inevitable challenge for agricultural production. Antioxidants are natural molecules found in living organisms which prevent oxidative stress. These compounds are characterized by the ability to scavenge (neutralize) reactive oxygen species (ROS), including hydroperoxide radicals, superoxide anion radicals, singlet oxygen, hydrogen peroxide, and hydroxyl radicals [1,2]. The following compounds are usually listed as strong antioxidants: Carotenoids (e.g., beta-carotene, lycopene, astaxanthin), tocopherols (e.g., alpha-tocopherol, gamma-tocopherol), flavonoids (e.g., anthocyanins, flavanols, flavonones, isoflavones), phenolic acids (hydroxybenzoic acids, hydroxycinnamic acids), stilbenes, some vitamins (vitamin C), coenzyme Q10, sulphur compounds (e.g., allicin), mineral components (e.g., selenium, zinc) [1,3,4,5]. Products of plant origin (vegetables, fruits, mainly berries, herbs, spices, juices, wine, tea, some cereals, and grains) are rich sources of antioxidants. However, they can also be found in meat products [6]. The antioxidative activity of the compounds we consume every day is important for our health [1,7,8,9,10]. Antioxidants inhibit free radicals and thus they reduce the risk of various diseases of affluence, including cardiovascular diseases (atherosclerosis, hypertension, heart attack, stroke), diabetes, cancers, neurodegenerative diseases (e.g., Alzheimer’s disease, Parkinson’s disease), and osteoporosis [11,12,13,14,15]. Antioxidants may soothe inflammations and viral infections [16,17]. They are said to prevent age-related eye diseases [18,19]. Antioxidants are not only important to maintain good health, but they are also widely used in food technology. For example, these compounds inhibit oxidation and limit the degradation of phytosterols [20] and fats [21]. In this way, they may, for example, prevent the spoilage of meat products [22]. Antioxidants also preserve the right colour of food products [23,24]. It should be noted, however, that their activity depends on many factors, such as chemical structure and profile of antioxidants, various interactions (synergistic, antagonistic effect), and also the multidimensional characteristics of the food matrix [25].
The pumpkin (Cucurbita L.) is a plant material containing antioxidants, e.g., carotenoids, tocopherols, phenolic acids, and flavonols. It is commonly grown in Europe, Asia, South America, North America, and Africa [26]. It is estimated that the annual pumpkin production exceeds 20 million tonnes [27,28]. It is a valuable dietary component because its pulp is rich in carotenoids [29,30,31] and its seeds are a source of unsaturated fatty acids [32]. Pumpkin flowers and leaves are less popular, but they are also edible [33]. Pumpkin pulp can be consumed both raw and after being processed, e.g., cooked, or as compotes, jams, purees, and juices [34]. The most common pumpkin species are: Cucurbita maxima, Cucurbita pepo, and Cucurbita moschata. Each of these species has numerous varieties [34,35]. So far there have been few studies on the antioxidative activity of the pumpkin pulp. As a result, scientific publications do not provide a comparison of the antioxidative properties of the pulp of different pumpkin varieties. Most of the available studies only determine the antioxidative potential of pumpkin seeds and oils [36,37,38]. Therefore, it is difficult to point out the trends in the contribution of specific compounds and the impact of various factors to the total antioxidant potential.
Thus far, there have not been many studies comparing the cultivars-dependent antioxidant capacity of pumpkin pulp. Additionally, reference publications lack data on the correlation analysis between the antioxidant activity tests in Cucurbita maxima cultivars extracts and its cluster analysis. The gap in the current literature to which this study is addressed includes an assessment of the antioxidant capacity of selected pumpkin cultivars, determined by selected radicals scavenging assays. The aim of this study was to compare the antioxidative activity of the pulp of various pumpkin varieties of the Cucurbita maxima species. The study also assesses the influence of various pumpkin pulp extraction conditions on its antioxidative potential.

2. Materials and Methods

2.1. Chemicals and Reagents

Gallic acid, sodium carbonate, Folin and Ciocalteu’s phenol reagent, (±)-6-hydroxyl-2,5,7,8-tetramethylchromane-2-carboxylic acid (Trolox), 2,2′-azino-bis(3-ethylbenzothiazoline-6-sulfonic acid) diammonium salt (ABTS), potassium persulphate, 2,2-diphenyl-1-picrylhydrazyl (DPPH), sodium acetate trihydrate, acetic acid, 2,4,6-tris(2-pyridyl)-s-triazine (TPTZ), iron(III) chloride hexahydrate, hydrochloric acid, iron (II) sulphate heptahydrate, iron (II) chloride tetrahydrate, 3-(2-pyridyl)-5,6-diphenyl-1,2,4-triazine-4′,4″-disulfonic acid sodium salt (Ferrozine), ethylenediaminetetraacetic acid (EDTA), sodium phosphate monobasic dehydrate, sodium phosphate monobasic dehydrate, potassium phosphate dibasic, 2,2′-azobis(2-methylpropionamidine) dihydrochloride (AAPH), and fluorescein sodium salt were purchased from Sigma-Aldrich (Darmstadt, Germany).

2.2. Sample Collection

The pulp of 14 pumpkin cultivars of the Cucurbita maxima species (‘Buttercup’, ‘Golden Hubbard’, ‘Galeux d’Eysines’, ‘Melonowa Żółta’, ‘Hokkaido’, ‘Jumbo Pink Banana’, ‘Marina di Chiggia’, ‘Flat White Boer Ford’, ‘Jarrahdale’, ‘Blue Kuri’, ‘Green Hubbard’, ‘Gomez’, ‘Shokichi Shiro’, ‘Porcelain Doll’) was used as the research material. All the cultivars were purchased from ‘Dolina Mogilnicy’ Organic Farming Products Cooperative (Wolkowo, Poland). While the plants were being grown, they were irrigated, weeded, and the soil was loosened. The pumpkins were harvested in October 2018 and transported to a laboratory, where they were immediately cleaned. The experimental unit consisted of two randomly chosen pumpkins from each variety. All chemical analyses for each pumpkin were performed in triplicate. The edible pulp was cut into pieces, freeze-dried, and then subjected to analysis. The dried pulp was stored at room temperature, without access to oxygen and light.

2.3. Extract Preparation

Preliminary studies involved solvents most commonly used for the preparation of plant extracts (acetone, ethyl acetate, ethanol, methanol, water). The extraction was carried out for various concentrations of selected solvents (20%, 40%, 60%, 80%, 100%) and the extraction time (0.5, 1, 2, 3, 4 h). Tests were carried out in three temperature ranges, which are used in plant components extraction as the most effective (30, 50, and 70 °C). Variants with the highest DPPH radical scavenging values were selected for further stages of the study. As a result, the above factors were limited to the previously mentioned nine solvents, two times and three extraction temperatures. In order to optimize the extraction pumpkin extracts were prepared by weighing 5 g of freeze-dried pumpkin and dissolving them in 50 mL of a solvent (water, methanol, 80% water–methanol solution, ethanol, 80% water–ethanol solution, acetone, 80% water–acetone solution, ethyl acetate, 80% ethyl acetate, and water solution). Next, the whole was shaken in a water bath (SWB 22N) at 30, 50, or 70 °C for 1 or 2 h. The extracts were centrifuged (1500 rpm, 10 min) and filtered through paper. Next, their antioxidative activity was assessed. The extraction of all samples was triplicated. The most favourable extraction conditions were selected on the basis of the optimization results: 2 h and 70 °C, maintaining the ratio between the amount weighed and the volume of the solvent used (1:10). Extracts for the pumpkin cultivars were prepared according to these conditions to find differences in their antioxidative activity, which included determination of the ABTS and DPPH radical scavenging assay, oxygen radical absorbance capacity (ORAC), the ferric reducing antioxidant capacity assay (FRAP), and the iron chelating activity assay.

2.4. Share of Individual Plant Elements

The pumpkin was carefully peeled in order to determine the content of individual parts of the fruit. Then, the pulp was cleared of seeds. Each part of the pumpkin was weighed with an accuracy of three decimal digits. The results were used to calculate the percentage content of the skin, seeds, and pulp. Each sample was measured in triplicate.

2.5. Pumpkin Flesh Colour

The colour of the pumpkin flesh was determined with a colorimeter (Chroma Meter CR-410, Konica Minolta Sensing Inc., Osaka, Japan). The test consisted in measuring the colour of the sample in reflected light and calculating the L * a * b value (L—color brightness; a—color in the range from green to red; b—color from blue to yellow). Before the measurement a homogeneous pulp was prepared from the pumpkin flesh. The analysis was triplicated.

2.6. Moisture Content

The water content was measured by drying 1 ± 0.001 g of fresh pumpkin, weighed, and then the sample was dried at 105 °C for 3 h. Next, the samples were cooled to room temperature and their weight was checked. The samples were then placed in a dryer again for 30 min. The samples were cooled again and weighed. The procedure was repeated until the sample weight between two measurements differed by more than 0.004 g. Each sample was measured in triplicate.

2.7. Active Acidity

The potentiometric method was used to measure acidity (pH) with a pH meter (CP-401). The result of measurement of the potential difference between the indicator and comparative electrodes was recorded. Each sample was measured in triplicate.

2.8. DPPH Radical Scavenging Activity Assay

The analysis was made in accordance with the methodology invented by Brand-Williams et al. (1995) [39]. An amount of 0.01 g of 2,2-diphenyl-1-picrylhydrazyl (DPPH) was weighed and transferred into a 25-mL volumetric flask together with the solvent (80:20 methanol/water (v/v). Next, the flask was filled up to the marking level. A calibration curve for Trolox (Tx) was also prepared. Assay: An amount of 100 µL of the extract was collected and 2.0 mL of the solvent, as well as 250 µL of the DPPH reagent were added. The whole was shaken on a Vortex at ambient temperature and left in darkness for 20 min. Next, the absorbance was measured at a wavelength λ = 517 nm (Meterek SP 830). The extraction reagent + DPPH solution was used as a control sample. The assay was triplicated. The results were given as mg Trolox equivalents (Tx) per 100 g of dry mass using the calibration curve y = 81.2991x − 2.4922 with a confidence coefficient R2 = 0.9963, and a relative standard deviation of residuals of 2.3%, slope 2.8450, and intercept 1.7469.

2.9. ABTS Radical Scavenging Assay

The analysis was conducted in accordance with the methodology invented by Re et al. (1999) [40]. An amount of 0.192 g of 2,2′-azino-bis(3-ethylbenzothiazoline-6-sulfonic acid) diammonium salt (ABTS) was weighed on an analytical balance with an accuracy of 0.001 g. Next, the weighed ABTS was transferred into a 50-mL volumetric flask. The rest was filled with deionized water up to the marking level. An amount of 0.0166 g of potassium persulphate (K2S2O8) was weighed and transferred into a 25-mL volumetric flask. The rest was filled with deionized water up to the marking level. The ABTS and K2S2O8 solution was mixed at a 1:0.5 ratio. The mixture was stored at room temperature in darkness for 16 h. Next, the mixture was diluted with a solvent to obtain an absorbance of 0.700 at a wavelength of λ = 734 nm. A calibration curve for Trolox was also prepared. Assay: An amount of 30 µL of the extract was collected into a tube and 3 mL of the ABTS reagent was added. The whole was mixed by shaking on a Vortex. After 6 min the absorbance was measured at a wavelength of λ = 734 nm (Meterek SP 830). The extraction reagent + ABTS solution was used as a control sample. The assay was triplicated. The results were given as mg Trolox equivalents (Tx) per 100 g of dry mass using the calibration curve y = 174.5970 ‒ 0.2115 with a confidence coefficient R2 = 0.9941, and a relative standard deviation of residuals of 2.5%, slope 9.5155, and intercept 2.6059.

2.10. Total Polyphenol Content

The total polyphenol content was measured with the method invented by Sanchez-Moreno et al. (1998) [41]. Preparation of saturated sodium carbonate solution: An amount of 10.6 g of sodium carbonate was weighed on an analytical balance and placed in a beaker. Then, 100 mL of deionized water was added and the whole was mixed on a magnetic stirrer. A calibration curve was prepared using gallic acid (GAE) as a standard. The Folin-Ciocalteau reagent (FCR) was diluted with deionized water at a 1:1 ratio. Assay: An amount of 125 µL of the FCR reagent, 2 mL of deionized water, 125 µL of the sample, and 250 µL of the saturated sodium carbonate solution were collected into a test tube. The whole was mixed thoroughly on a Vortex and left at ambient temperature for 25 min. Next, the absorbance was measured at λ = 725 nm (Meterek SP 830). The assay was triplicated. The results were given as mg Gallic Acid equivalents (GAE) per 100 g of dry mass using the calibration curve y = 0.0017x + 0.0071 with a confidence coefficient R2 = 0.9943, and a relative standard deviation of residuals of 2.4%, slope 0.0001, and intercept 0.0124.

2.11. Ferric Reducing Antioxidant Power (FRAP) Assay

The assay consists of measuring the increase in absorbance of the FRAP reagent, which takes place after incubation with the active ingredients contained in the plant extract due to the reduction of Fe(III) ions. It can be monitored by measuring variation in absorbance at a wavelength of 593 nm. The assay was based on the methodology invented by Benzie and Strain (1996) [42]. Preparation of acetic buffer (300 mM; pH 3.6): 3.1 g of sodium acetate trihydrate was weighed and combined with 16 mL of glacial acetic acid. The whole was placed in a 1 L flask and the rest was filled with deionized water up to the marking level. TPTZ (2,4,6-tris(2-pyridyl)-s-triazine) (10 mM in 40 mM HCl): 1.46 mL of concentrated HCl was collected into a 1 L volumetric flask, which was filled with deionized water up to the marking level. Next, 0.031 g of TPTZ was weighed and dissolved in 10 mL of 40 mM HCl in a water bath at 50 °C. FeCl3 x 6H2O (20 mM): 0.054 g of FeClx x 6H2O was weighed and dissolved in 10 mL of deionized water. Before use the three reagents were mixed at a 10:1:1 ratio. Assay: An amount of 100 µL of the sample and 3 mL of the FRAP reagent (heated to 37 °C) was collected into a test tube. The whole was mixed on a Vortex and incubated at 37 °C for 4 min. Next, the absorbance was measured at a wavelength of λ = 593 nm (Meterek SP 830). A calibration curve was prepared using FeSO4x 7H2O. The assay was triplicated. The results were given as mM FE(II) per 100 g of dry mass using the calibration curve y = 0.6884x ‒ 0.0003 with a confidence coefficient R2 = 0.9977, and a relative standard deviation of residuals of 1.8%, slope 0.0166, and intercept 0.0100.

2.12. Iron Chelating Activity Assay

The method invented by Decker and Welch (1990) [43] was used to assay the ability of compounds to bind Fe(II) ions. Iron chloride tetrahydrate (2 mM): 0.0398 g of iron chloride tetrahydrate was weighed and transferred quantitatively into a 100-mL volumetric flask, which was filled with deionized water up to the marking level. Ferrozine (5 mM): 0.123 g of ferrozine was weighed and transferred quantitatively into a 50-mL volumetric flask, which was filled with deionized water up to the marking level. Assay: 1 mL of the extract was collected into a test tube. Next, 3.7 mL of deionized water was added. The whole was mixed on the Vortex. Next, 0.1 mL of iron chloride (2 mM) and 0.2 mL of ferrozine (5 mM) were added. The whole was mixed again and incubated at ambient temperature for 20 min. Next, the absorbance was measured at λ = 562 nm (Meterek SP 830). A calibration curve was also prepared using ethylenediaminetetraacetic acid (EDTA) disodium salt. The assay was triplicated. The results were given as ppm EDTA per 100 g of dry mass using the calibration curve y = 1.4053x − 2.8349 with a confidence coefficient R2 = 0.9981, and a relative standard deviation of residuals of 1.2%, slope 0.0308, and intercept 1.4825.

2.13. Oxygen Radical Absorbance Capacity (ORAC) Assay

The ORAC method based on the methodology invented by Ou et al. (2001) [44] was used to determine the antioxidative capacity. A solution of 42 nM of fluorescein and 153 nM of AAPH as well as 0.075 M phosphate buffer (pH 7.4) were prepared. The extract was dissolved in 75 mM of phosphate buffer. The reaction mixture was prepared in a quartz cuvette to which 0.04 µM of disodium fluorescein in 0.075 M phosphate buffer was added. Next, the extract was added to the mixture, which was kept at 37 °C without access to light. Assay: The chemical reaction was initiated by adding 153 nM of the AAPH solution, which was a source of peroxide radicals. Fluorescence was measured with a Hitachi F-2700 spectrofluorometer at an excitation wavelength λ = 493 nm and emission wavelength λ = 515 nm. The first measurement was made immediately after adding the AAPH solution. Then, the fluorescence of the samples was measured every 5 min (f1, f2 … …) for 45 min. A standard curve was prepared for the Trolox solution. The assay was triplicated. The results were given as µM of Trolox equivalent per 1 g of dry mass using the calibration curve y = 5.5280x ‒ 3.5001 with a confidence coefficient R2 = 0.9943, and a relative standard deviation of residuals of 2.9%, slope 0.2088, and intercept 2.2231.

2.14. Statistical Analysis

The results were analyzed statistically (STATISTICA 13.1 software, StatSoft Inc., Kraków, Poland). An analysis of variance was made to detect statistically significant differences. A multiple comparison analysis was made using post-hoc LSD tests. The significance level was assumed at p = 0.05. Pearson’s linear correlation coefficients (p = 0.05; p = 0.01; p = 0.001) were calculated for the antioxidative activity of the samples obtained in various tests. The Ward method was used for a hierarchical cluster analysis, by means of which the pumpkin cultivars were grouped according to their antioxidative activity.

3. Results

3.1. General Characteristics of Pumpkin Cultivars

The pumpkin cultivars were characterized in general (Table 1). The visual assessment showed that the pulp of all the pumpkin cultivars was yellow or orange. The colorimetric measurement method showed that the brightness of the pumpkin pulp ranged from 48.38 to 64.43 (parameter L). There were differences in the pumpkin juice pH. The ‘Gomez’ (pH = 5.09), ‘Buttercup’ (pH = 5.16), and ‘Golden Hubbard’ (pH = 5.16) cultivars were characterized by the highest acidity. The lowest acidity was noted in the ‘Hokkaido’ (pH = 6.13) and ‘Marina di Chiggia’ (pH = 6.10) cultivars. The cultivars differed in the water content in the pulp. The highest content was found in the ‘Porcelain Doll’ (94.85%), ‘Galeux d’Eysines’ (94.78%), and ‘Melonowa Żółta’ (93.25%) cultivars, whereas the lowest content was found in the ‘Blue Kuri’ (78.76%) and ‘Marina di Chiggia’ (81.17%) cultivars. The cultivars differed in the content of skin, seeds, and pulp. The following cultivars had the highest percentage content of pulp: ‘Jumbo Pink Banana’ (87.11%), ‘Galeux d’Eysines’ (85.09%), ‘Buttercup’ (84.03%), ‘Jarrahdale’ (83.94%), ‘Flat White Boer’ (83.29%), and ‘Melonowa Żółta’ (83.21%). The smallest content of the pulp was found in the following varieties: ‘Golden Hubbard’ (63.29%), ‘Green Hubbard’ (63.47%), ‘Porcelain Doll’ (69.24%), ‘Marina di Chiggia’ (70.09%), and ‘Hokkaido’ (70.59%).

3.2. Optimization of Extraction of Pumpkin Antioxidative Components

3.2.1. DPPH Radical Scavenging Activity

The methanol–aqueous (80%) and aqueous extracts exhibited the highest antioxidative activity against the DPPH radical regardless of the extraction time and temperature (Table 2). The extracts prepared with acetone, acetone and water (80%), ethyl acetate and methanol exhibited the lowest ability to inactivate the DPPH radical. The analysis of the influence of the extraction time on the antioxidative activity of the samples showed that the samples extracted for 2 h exhibited a higher antioxidative activity only for the ethyl acetate (30 and 50 °C), methanol (30 °C), and 80% ethyl acetate (50 and 70 °C) extracts. The test also showed that the temperature of the process affected the DPPH radical scavenging ability. As the temperature increased, so did the antioxidative activity. The exceptions were the 80% ethanol extract (the activity decreased at 1 h and 50 °C, but it increased after 2 h) and the methanol extracts, whose activity decreased at 70 °C.

3.2.2. ABTS Radical Scavenging

The aqueous and methanol–aqueous (80%) extracts exhibited the highest ability to scavenge ABTS cation radicals (Table 3). The acetone extract was characterized by the lowest antioxidative activity. The antioxidative activity increased along with the extraction time in most of the samples. The exceptions were: Acetone and 80% ethyl acetate (50 °C). The comparison of the results showed that the extraction temperature affected the efficiency of the extracts in sweeping the ABTS cation radical. As the temperature increased, the antioxidative activity of the samples increased, too. The antioxidative properties decreased only in the 80% acetone (1 h), 80% ethyl acetate (1 h, 70 °C), and 80% ethanol (1 h, 50 °C) extracts.

3.2.3. Total Phenolic Content (TPC)

The highest total phenolic content was found in the aqueous and methanol–aqueous (80%) extracts (Table 4). The lowest concentration of polyphenolic compounds was found in the ethyl acetate, ethyl acetate–aqueous (80%), and acetone extracts. The analysis of the influence of the extraction time on the content of polyphenolic compounds showed that it was higher in the samples extracted for 2 h than in the ones extracted for 1 h, except the acetone (30 and 50 °C), acetone–aqueous (30 °C), and ethyl acetate (70 °C) extracts, where the samples extracted for 1 h had higher content of polyphenols. The extraction temperature also affected the results. The total polyphenolic content in the extracts prepared at 70 °C was greater than in the samples extracted at 30 and 50 °C. The exceptions were 80% acetone (1 h), ethanol–aqueous (80%) (1 and 2 h), and methanol–aqueous (80%) extracts (1 and 2 h), where the content of polyphenolic compounds was lower at 50 °C. However, the highest content of polyphenols in the 80% ethanol–aqueous and 80% methanol–aqueous extracts was found at 70 °C.

3.2.4. Ferric Reducing Antioxidant Power (FRAP)

The methanol–aqueous (80%) and ethanol–aqueous (80%) extracts exhibited the highest ferric ion reducing capacity (Table 5). The analysis of variation in the ferric ion reducing capacity over time showed that the samples extracted for 2 h exhibited greater activity than the ones extracted for 1 h. Only the ethyl acetate, ethyl acetate (70 °C), ethanol–aqueous (80%) (30 °C), methanol (70 °C), and aqueous extracts were characterized by an inverse dependence. In most cases, the higher extraction temperature increased the ferric ion reducing capacity of the extracts. The higher extraction temperature caused a slight decrease in the antioxidative activity of the acetone extract only.

3.2.5. Iron Chelating Activity

The methanol–aqueous (80%) extracts exhibited the highest Fe(II) ion chelating activity (Table 6). The lowest Fe(II) chelating activity was characteristic of the ethyl acetate–aqueous (80%) and ethyl acetate extracts. As the extraction time increased, so did the Fe(II) ion chelating activity of all the samples except the ethyl acetate–aqueous (80%) extract (50 and 70 °C), and ethanol extract (50 °C). Apart from that, the assay showed that the Fe(II) ion chelating activity increased along with temperature. Only the chelating activity of the ethanol (30 vs. 50 °C), ethanol–aqueous (80%) (30 vs. 50 °C), and methanol–aqueous (80%) extracts (30 vs. 50 °C) decreased. However, the chelating activity of these extracts increased again at 70 °C.

3.3. Comparison of the Antioxidative Activity of Selected Extracts of Various Pumpkin Cultivars

3.3.1. DPPH Radical Scavenging Activity

The research showed that the ‘Melonowa Żółta’ (245.98 and 222.23 mg Tx/100 g dm), ‘Hokkaido’ (210.97 and 183.40 mg Tx/100 g dm), ‘Galeux d’Eysiness’ (206.99 mg Tx/100 g dm), and ‘Buttercup’ cultivars (185.19 mg/Tx/100 g dm) exhibited the highest antioxidative activity against the DPPH radical (Table 7). On the other hand, the aqueous extracts of the following pumpkin cultivars were characterized by the lowest antioxidative potential: ‘Gomez’ (34.11 mg Tx/100 g dm), ‘Shokichi Shiro’ (42.22 mg Tx/100 g dm), ‘Golden Hubbard’ (52.5 mg Tx/100 g dm), and ‘Green Hubbard’ (54.39 mg Tx/100 g dm). The methanol–aqueous (80%) extracts exhibited greater DPPH radical scavenging activity than the aqueous extracts in all the pumpkin cultivars. The pumpkin pulp exhibited low DPPH radical inhibiting activity (5.8 µmol Tx/g dm). The same experiment showed that other raw materials exhibited much higher antioxidative activity, e.g., artichokes (70.1 µmol Tx/g dm), lettuce (77.2 µmol Tx/g dm), spinach (50.9 µmol Tx/g dm), turmeric (57.6 µmol Tx/g dm). The following raw materials were characterized by lower DPPH radical inactivating ability: Leek (3.2 µmol Tx/g dm), cucumber (2.3 µmol Tx/g dm), celery (3.8 µmol Tx/g dm), carrots (3.5 µmol Tx/g dm), beans (3.8 µmol Tx/g dm) (44). The antioxidative activity of pumpkin seeds and skin (Cucurbita pepo) was confirmed in a test with DPPH radical. The test showed that the aqueous extracts (72.36% inhibition) and 70% ethanol extracts (71.0% inhibition) exhibited the highest DPPH radical scavenging activity in the pumpkin skin, whereas the 70% ethanol extract (20.5% inhibition) and 70% methanol extract (18.9% inhibition) exhibited the highest antioxidative activity in the pumpkin seeds. The radicals inhibition of the aqueous extract amounted to 4.12% [37]. Valenzuela et al. researched various pumpkin species seeds and found the highest total polyphenolic content in the Cucurbita mixta Pangalo species (275 µmol GAE/g of the extract). There were lower total polyphenolic content levels in the seeds of Cucurbita maxima Duchense (212.87 µmol GAE/g of the extract) and Cucurbita moschata (Duchense ex Lam.) species (118.79 µmol GAE/g of the extract) [45]. The above research showed that the methanol–aqueous and methanol extracts of pumpkin seeds were characterized by high DPPH radical scavenging activity, and amounted to 69.18% and 86.85%, respectively [46].

3.3.2. ABTS Radical Scavenging

The ABTS cation radical test showed that the ‘Melonowa Żółta’ pumpkin cultivar was characterized by the highest antioxidative potential (Table 7). The antioxidative activity of the aqueous extracts (187.17 mg Tx/100 g dm) was higher than that of the methanol–aqueous (80%) extracts (152.86 mg Tx/100 g dm). The lowest ABTS cation radical scavenging activity was noted in the ‘Blue Kuri’ (methanol–aqueous (80%) extract—85.12 mg Tx/100 g dm), ‘Jarahdale’ (methanol–aqueous (80%) extract—95.90 mg Tx/100 g dm), and ‘Flat White Boer Ford’ cultivars (aqueous extract—95.92 mg Tx/100 g dm). In most cases, the aqueous extracts exhibited greater antioxidative activity than the methanol–aqueous (80%) extracts. The research showed that the pumpkin pulp had relatively low ABTS cation radical scavenging ability (11.0 µM Tx/g dm), as compared with other vegetables: Artichoke (39.9 µM Tx/g dm), asparagus (37.5 µM Tx/g dm), broccoli (43.0 µM Tx/g dm), lettuce (85.8 µM Tx/g dm), radishes (61.7 µM Tx/g dm), and turmeric (118.6 µM Tx/g dm) (44). Sing et al. noted that pumpkin pulp (Cucurbita maxima) extracted with ethanol and water (50%) exhibited the highest ABTS radical scavenging activity, i.e., 2.04 µM Tx/g. The ABTS radical scavenging ability of the pumpkin extract was slightly lower than that of watermelon (2.24 µM Tx/g) and melon (2.78 µM Tx/g). The authors of the study also found that pumpkin skin extracts were characterized by higher antioxidative potential [47].

3.3.3. Total Phenolic Content (TPC)

The total phenolic content in the pumpkin cultivars was analyzed with the Folin-Ciocalteu method (Table 8). The analysis showed that the content of phenolic compounds in the pumpkin pulp varied depending on the cultivar and the extraction solvent. The highest concentration of total polyphenols was found in the following cultivars: ‘Melonowa Żółta’ (232.5 and 255.69 mg GAE/100 g dm), ‘Hokkaido’ (206.47 and 237.94 mg GAE/100 g dm), and ‘Gomez’ (172.63 and 188.22 mg GAE/100 g dm). The lowest content of phenolic compounds in the methanol–aqueous extracts was found in the ‘Blue Kuri’ (49.78 mg GAE/100 g dm) and ‘Marina di Chiggia’ cultivars (49.99 mg GAE/100 g dm). On the other hand, among the aqueous extracts, the lowest total polyphenolic level was found in the ‘Blue Kuri’ (65.66 mg GAE/100 g dm), ‘Shokichi Shiro’ (66.64 mg GAE/100 g dm), ‘Flat White Boer Ford’ (66.01 mg GAE/100 g dm), and ‘Jumbo Pink Banana’ cultivars (66.40 mg GAE/100 g dm). Apart from that, it is noteworthy that when water was used as the solvent, there was higher content of polyphenols in all the cultivars except for the ‘Flat White Boer Ford’. Saavedra et al. conducted a study in which they measured the total polyphenolic content in fresh pumpkin skins and seeds. The highest content was found in aqueous extracts. The total polyphenolic content in the pumpkin skin was 741–1069 mg GAE/100 g dm, whereas in the seeds it was 234–239 mg GAE/100 g dm. The results showed that the polyphenol content in the pumpkin skin and seeds was higher than in its pulp. Only in the ‘Melonowa Żółta’ cultivar the polyphenol content (255.69 mg/100 g dm) was slightly higher than in the seeds. The Hokkaido cultivar had a similar content of polyphenols (237.94 mg/100 g dm) [37]. Kiat et al. also observed the presence of polyphenols in pumpkin seeds. They noted that the concentration of polyphenols in the methanol–aqueous extract (80%) (72 mg/100 g dm) was higher than in the methanol extract (44 mg/100 g dm) [48]. Bayili et al. showed that the total polyphenolic content in the pumpkin of the Cucurbita pepo species amounted to 100.2 mg/100 g fresh weight. The authors observed that the pumpkin contained more polyphenols than some other vegetables, e.g., tomatoes, eggplant, cucumber, and vegetable cabbage. The content of polyphenols was about two times greater in some cultivars, e.g.,: ‘Hokkaido’, ‘Gomez’, ‘Porcelain Doll’, ‘Melonowa Żółta’, but these results were calculated per dry mass [46]. Singh et al. observed that the content of polyphenolic compounds in pumpkin pulp (extracted with water) amounted to 13.92 mg GAE/100 g fresh weight. There was a higher content of polyphenolic compounds in the methanol–aqueous (19.36–30.69 mg/100 g dm) and ethanol–aqueous solvents (21.45–33.48 mg/100 g dm) [47]. Dar et al. found polyphenolic compounds in various extracts of pumpkin leaves (Cucurbita pepo). They observed that the polyphenolic content varied depending on the type of extract. The concentration of polyphenols in the ethanol extract was 40.37 mg/g GAE, in the aqueous extract—40.12 mg/g GAE, butanol extract—92.62 mg/g GAE, ethyl acetate extract—85.12 mg/g GAE, chloroform extract—21.25 mg/g GAE, and n-hexane extract—12.50 mg/g GAE [49]. Oloyede et al. conducted research on the content of total polyphenols in pumpkin pulp (Cucurbita pepo Linn.). They found that the concentration of polyphenolic compounds in pumpkin depended on the degree of ripening. The content of polyphenolic compounds in ripe fruit was 33.5 mg/100 g dm, whereas in unripe fruit it was 10.3 mg/100 g dm. This content was similar to the results observed in methanol–aqueous extracts in the ‘Blue Kuri’, ‘Marina di Chiggia’, and ‘Jumbo Pink Banana’ cultivars [50].

3.3.4. Ferric Reducing Antioxidant Power (FRAP)

In order to determine the antioxidative potential of the pumpkin cultivars the ability of the aqueous and methanol–aqueous extracts to reduce ferric ions was also investigated. The following cultivars exhibited showed the highest antioxidative activity: ‘Buttercup’ (592.78 mM Fe(II)/100 g dm), ‘Melonowa Żółta’ (555.63 mM Fe(II)/100 g dm), ‘Galeux d’Eysines’ (524.90 mM Fe(II)/100 g dm), ‘Flat White Boer Ford’ (509.28 mM Fe(II)/100 g dm), and ‘Porcelain Doll’ (501.19 mM Fe(II)/100 g dm) (Table 9). The lowest ability to reduce the degree of ferric ion oxidation was found in the ‘Hokkaido’ (48.57 mM Fe(II)/100 g dm), ‘Marina di Chiggia’ (58.19 mM Fe(II)/100 g dm), and ‘Green Hubbard’ cultivars (66.34 mM Fe(II)/100 g dm). When 80% methanol was used as the solvent, all the cultivars exhibited higher antioxidative activity. Tiveron et al. observed that pumpkin pulp (Cucurbita maxima) was capable of reducing ferric ions at an amount of 19.5 µM Fe2+/g dm. This activity was greater than that of other vegetables, such as: Celery, carrot, cucumber, and leek. On the other hand, it was about 10–15 times lower than that of chicory, broccoli, spinach, and watercress [51]. Fidrianny et al. observed that the pumpkin leaf ethanol extract (Cucurbita moschata) exhibited relatively low ferric ion reducing activity, i.e., 1.37%, as compared with 7.39% for ascorbic acid. Ethyl acetate (1.37%) and hexane (0.28%) extracts exhibited lower ferric ion reducing ability [52]. One study showed that the compounds contained in pumpkin pulp (Cucurbita maxima) were capable of reducing ferric ions. The highest reducing activity was observed for the ethanol aqueous extract (50%) (3.23 µM Fe(II)/g) and ethanol aqueous extract (50%) (2.66 µM Fe(II)/g). The aqueous extracts exhibited the lowest activity (1.83 µM Fe(II)/g), which was consistent with the results of this study [46].

3.3.5. Iron Chelating Activity

The analysis of metal ion binding properties is a method of determining the antioxidative potential of food. For this purpose, the ability to chelate Fe(II) ions by compounds contained in the extracts of various pumpkin cultivars was assayed (Table 9). The test revealed that the methanol–aqueous (80%) extracts of the following cultivars were characterized by the highest antioxidative activity: ‘Gomez’ (12,804.62 ppm EDTA/100 dm), ‘Blue Kuri’ (11,385.16 ppm EDTA/100 g dm), ‘Shokichi Shiro’ (11,350.7 ppm EDTA/100 g dm). By contrast, the aqueous extracts of the following cultivars exhibited the lowest ferric ion chelating ability: ‘Hokkaido’ (2,224.65 ppm EDTA/100 g dm), ‘Buttercup’ (2,938.91 ppm EDTA/100 g dm), ‘Golden Hubbard’ ( 3,225.99 ppm EDTA/100 g dm), ‘Melonowa Żółta’ (4,095.36 ppm EDTA/100 g dm), and ‘Galeux d’Eysines’ (4,302.19 ppm EDTA/100 g dm). As in the FRAP test, the methanol–aqueous (80%) extracts exhibited the highest antioxidative activity.

3.3.6. Oxygen Radical Absorbance Capacity (ORAC)

The antioxidative activity of the pumpkin cultivars was also measured with the oxygen radical absorbance capacity test (ORAC). This is a very high sensitivity method, which is mainly used to measure the activity of hydrophilic antioxidants [53]. It is thought to be one of the most preferable tests for measuring the antioxidative activity [54]. The ORAC test has been frequently used to prepare rankings of food products according to their antioxidative capacity [55]. The method is recommended to quantify the peroxide radical scavenging capacity. The highest antioxidative capacity was found in the following cultivars: ‘Melonowa Żółta’ (122.73 µM Tx/g dm), ‘Jumbo Pink Banana’ (117.72 µM Tx/g dm), and ‘Golden Hubbard’ (108.47 µM Tx/g dm) (Table 8). The following cultivars exhibited the lowest reactive oxygen species scavenging capacity: ‘Flat White Boer Ford’ (42.38 µM Tx/g dm), ‘Blue Kuri’ (58.47 µM Tx/g dm), ‘Jarahdale’ (65.00 µM Tx/g dm), ‘Shokichi Shiro’ (87.60 µM Tx/g dm), and ‘Hokkaido’ (89.97 µM Tx/g dm). So far, the ability of pumpkin pulp to absorb oxygen free radicals has not been analyzed. Parry et al. investigated the antioxidative activity (ORAC) of the oil extract from roasted pumpkin seeds. They noted that the product had very low antioxidative potential (1.1 µM Tx/g fat), as compared with parsley seed extract (1097.5 µM Tx/g fat), cardamom extract (941.5 µM Tx/g fat), milk thistle extract (125.2 µM Tx/g fat), and onion extract (17.5 µM Tx/g fat) [56].

3.3.7. Correlation between Antioxidative Properties of Cucurbita maxima Cultivars Observed in Different Tests

The results of the antioxidative activity assays were used to analyze correlations between the antioxidative activity exhibited both by the aqueous and aqueous–methanol extracts. As far as the aqueous extracts are concerned, there was a strong positive correlation between the results obtained in the ABTS and oxygen radical absorbance capacity (ORAC) tests (ρ = 0.64; p < 0.001), as well as between the total polyphenolic content and the ORAC (ρ = 0.59; p < 0.001) and ABTS tests (ρ = 0.41; p < 0.01) (Table 10). The results showed a strong negative correlation between the ORAC and FRAP tests (ρ = −0.47; p < 0.01), as well as between total polyphenolic content and the chelating activity (ρ = −0.47; p < 0.01). Likewise, the analysis of the results for the aqueous–methanol extracts revealed a positive correlation between the total polyphenolic content and the antioxidative activity assayed in the ABTS test (ρ = 0.37; p < 0.05) (Table 11). In addition, there was a positive correlation between both FRAP and DPPH tests (ρ = 0.45; p < 0.05) and between the FRAP test and the total polyphenolic content (ρ = 0.39; p < 0.05). On the other hand, there were negative correlations between the chelation activity and the total polyphenolic content (ρ = −0.63; p < 0.001) and the DPPH radical scavenging ability (ρ = −0.53; p < 0.001).

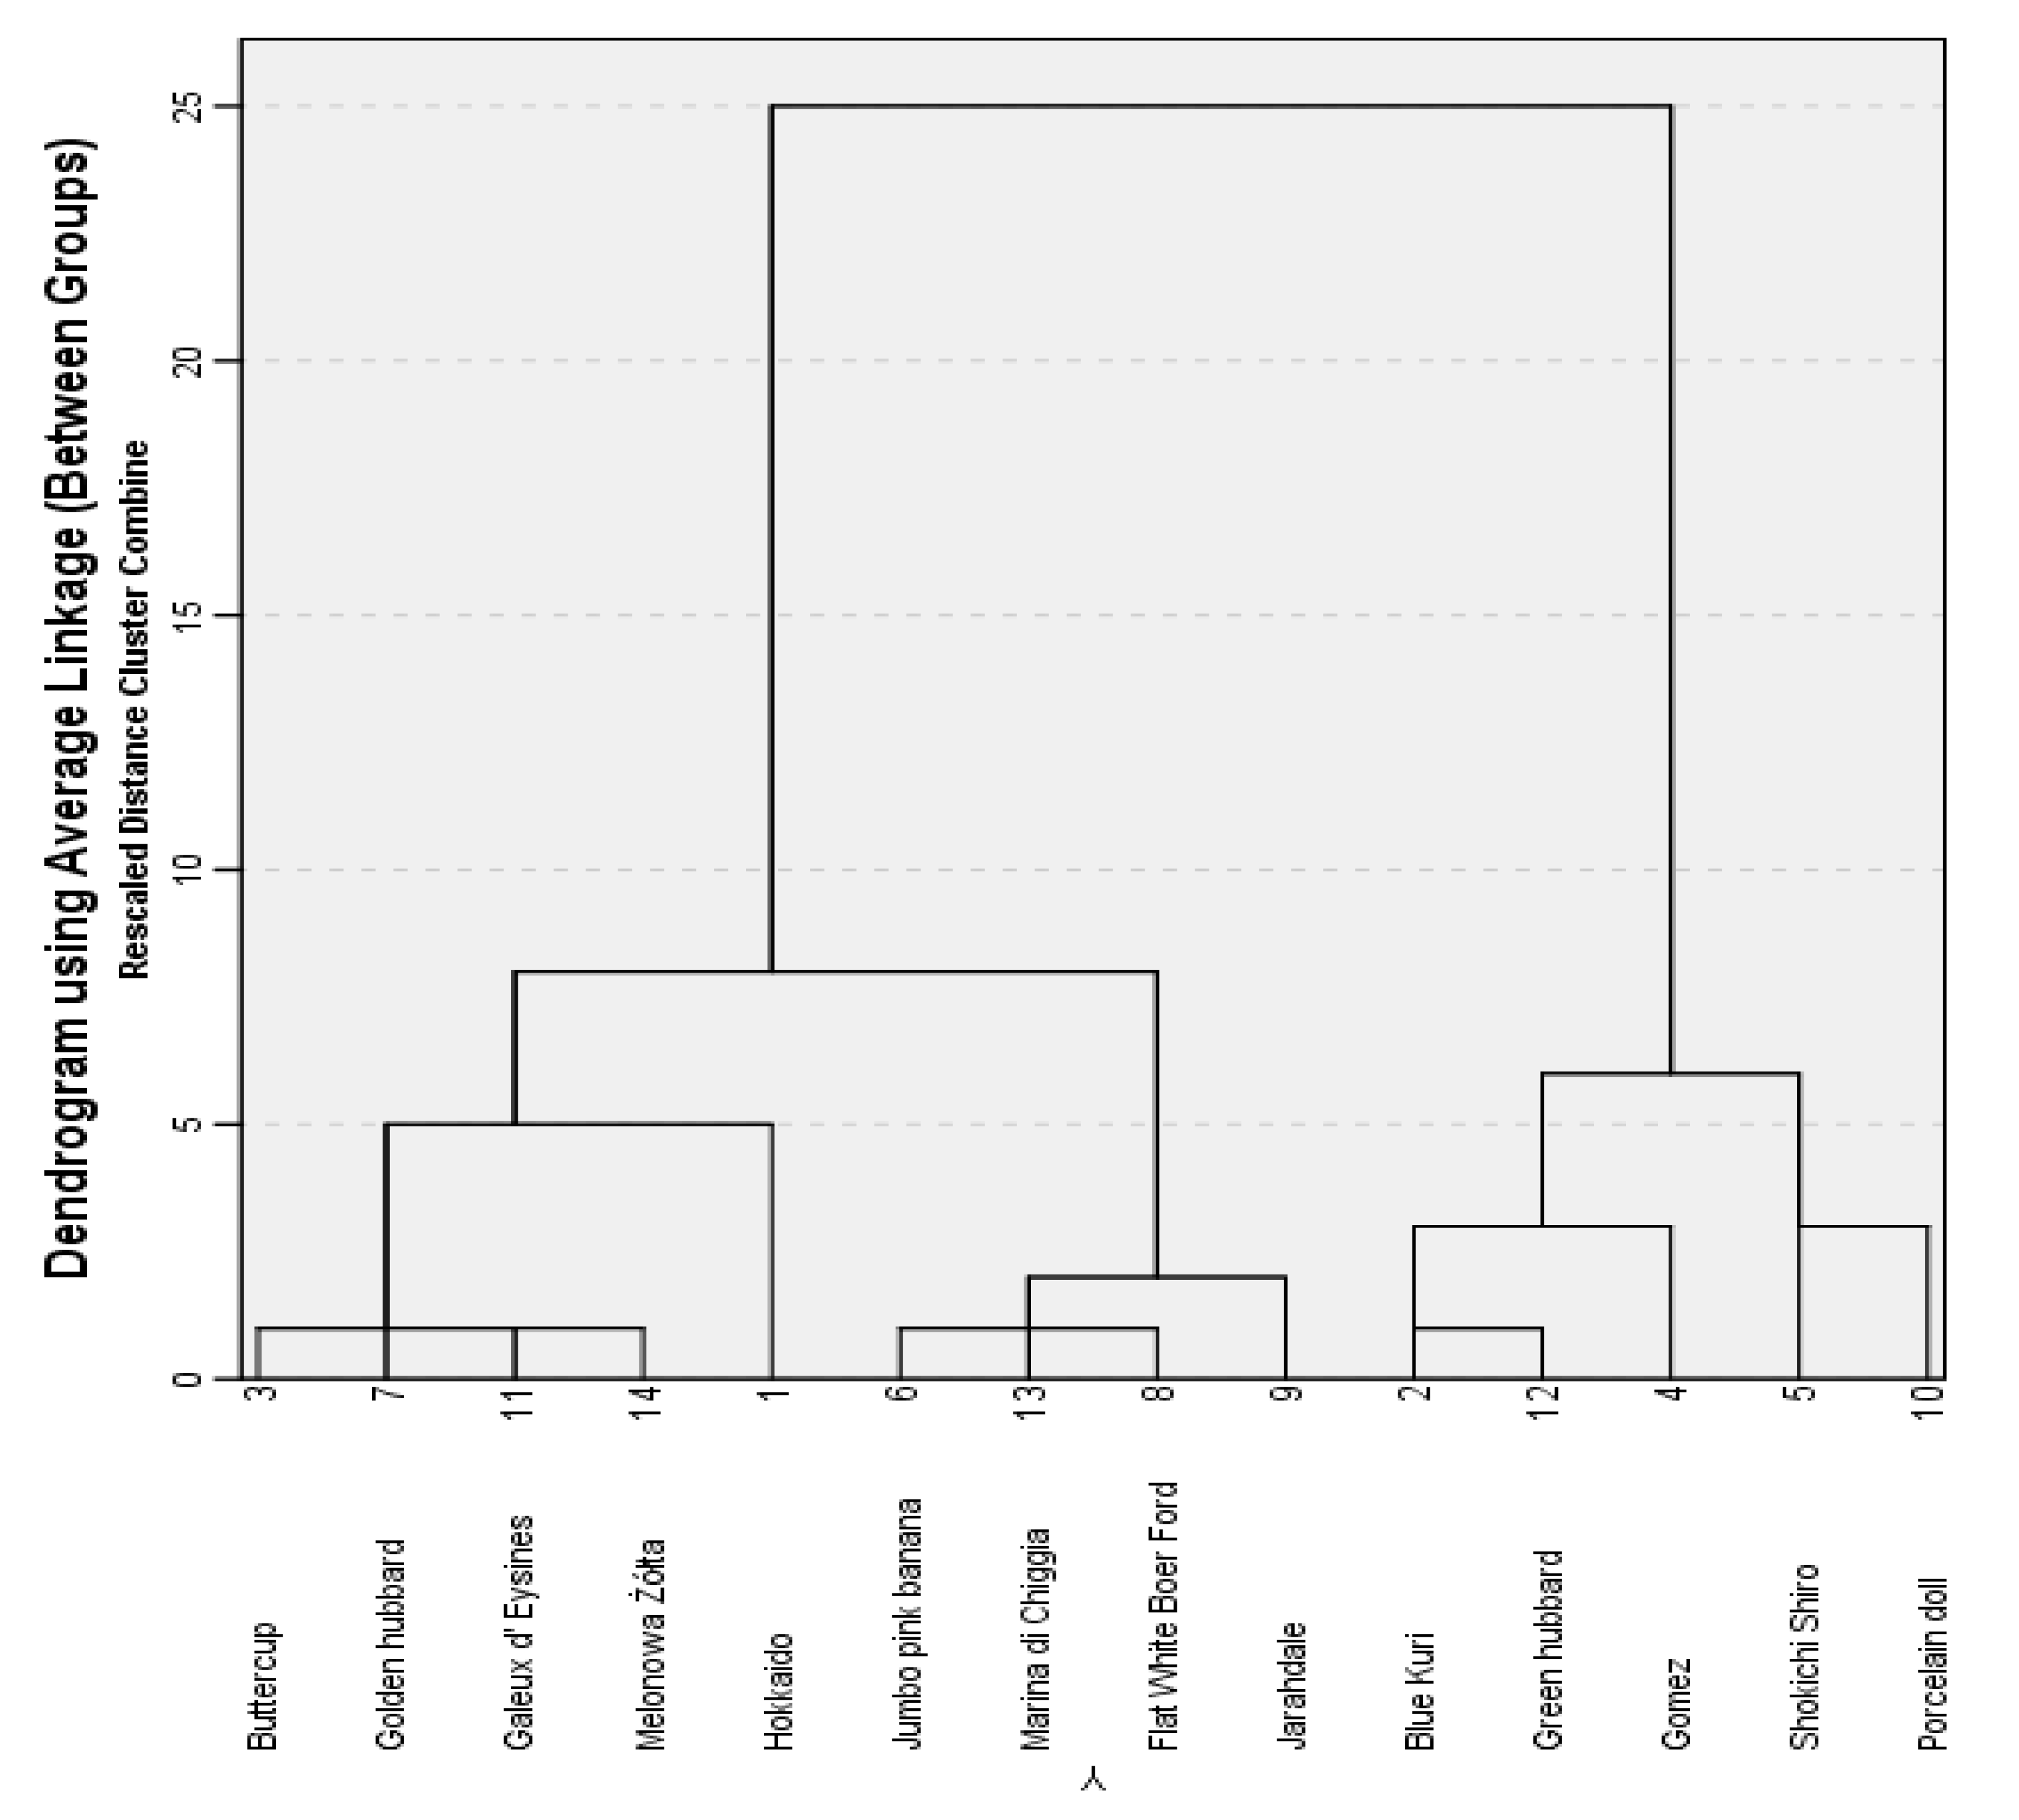
3.3.8. Cluster Analysis

A cluster analysis was made to isolate groups of the pumpkin cultivars according to their antioxidative activity (Figure 1). The assumption was that the selected groups of cultivars should differ from each other in terms of the most determining variables. The Ward method was used for a hierarchical cluster analysis. Figure 1 shows into which clusters the pumpkin cultivars were categorized.
Two groups of cultivars were distinguished on the basis of the analysis: Cluster 1 (‘Buttercup’, ‘Golden Hubbard’, ‘Galeux d’Eysines’, ‘Melonowa Żółta’, ‘Hokkaido’, ‘Jumbo Pink Banana’, ‘Marina Di Chiggia’, ‘Flat White Boer Ford’, ‘Jarrahdale’), and cluster 2 (‘Blue Kuri’, ‘Green Hubbard’, ‘Gomez’, ‘Shokichi Shiro’, ‘Porcelain Doll’) (Table 12). The Student’s t-test for independent samples was applied to check whether there were intergroup differences. The analysis showed that cluster 1 exhibited significantly greater ability to scavenge ABTS (120.49 vs. 104.84 mg Tx/100 g dm) and DPPH radicals (190.21 vs. 95.24 mg Tx/100 g dm) (in the aqueous–methanol extracts) and DPPH radicals (91.74 vs. 49.49 mg Tx/100 g dm) (in the aqueous extracts). Apart from that, cluster 1 had higher total polyphenolic content (84.46 vs. 62.78 mg GAE/100 g dm). On the other hand, cluster 2 was characterized by greater ferric ion chelating capacity in the aqueous–methanol extracts (6210.87 vs. 11061.61 ppm EDTA/100 g dm) and aqueous extracts (4346.98 vs. 6745.29 ppm EDTA/100 g dm). There were no statistically significant differences between the groups in the oxygen radicals absorbance capacity (ORAC).

4. Conclusions

The extraction methods were optimized to test the antioxidative activity of pumpkin pulp. The research showed that the aqueous and aqueous–methanol (80%) extracts exhibited the highest antioxidative potential. The best effects were achieved when the extraction was conducted at 70 °C for 2 h. The acetone and ethyl acetate extracts exhibited low antioxidative activity. The extraction optimization results were used for comparative analysis of the antioxidative potential of 14 pumpkin cultivars of the Cucurbita maxima species. To date there has not been such an extensive analysis of the antioxidative properties of the pumpkin pulp of various cultivars. The following tests were conducted to measure the antioxidative activity: ABTS, DPPH, FRAP, ORAC, chelating activity. The total polyphenolic content was also analyzed. The research clearly showed that the pumpkin cultivars under analysis were significantly diversified in their ability to scavenge free radicals and to reduce and chelate ferric ions. They also differed in the total polyphenolic content. The antioxidant activity of pumpkin extracts is generally affected by different variables such as the chemical structure and profile of antioxidants, e.g., carotenoids, tocopherols or phenolic compounds. However, this is the topic of the upcoming publication in which the profile of antioxidant compounds will be characterized. Antioxidants arise as easily extractable compounds, soluble, and as the residue of the extract. That is why it is difficult to identify and categorize the key trends in the contribution of various compounds and the concomitant influence of different factors to the total antioxidant capacity. Hence, as indicated in other studies on the antioxidant activity of the food matrix, consideration should also be given to substances bound in the extract residues. The following pumpkin cultivars exhibited high antioxidative activity: ‘Melonowa Żółta’, ‘Hokkaido’, ‘Porcelain Doll’, and ‘Gomez’. The research showed that pumpkin pulp exhibited strong antioxidative properties, which might be significant for human health. The inclusion of pumpkin or pumpkin pulp-based food products into a diet may help protect the human body from the harmful effect of free radicals. It is important to reduce the risk of diseases of affluence. Properly selected powdered pumpkin pulp can be used in the food industry, e.g., as an additive increasing the stability of fat in meat.

Author Contributions

B.K., conceptualization, formal analysis, investigation, writing, review, and editing; A.G.-M., conceptualization, investigation, writing, editing, supervision, and funding acquisition; J.B.K., investigation, editing, and funding acquisition. All authors have read and agreed to the published version of the manuscript.

Funding

This research was funded by the National Science Centre, Poland, grant number 2018/29/B/NZ9/00461.

Conflicts of Interest

The authors declare no conflict of interest.

References

  1. Oroian, M.; Escriche, I. Antioxidants: Characterization, natural sources, extraction and analysis. Food Res. Int. 2015, 74, 10–36. [Google Scholar] [CrossRef]
  2. Nathan, C.; Cunningham-Bussel, A. Beyond oxidative stress: An immunologist’s guide to reactive oxygen species. Nat. Rev. Immunol. 2013, 13, 349–361. [Google Scholar] [CrossRef] [Green Version]
  3. Evans, J.R.; Lawrenson, J.G. Antioxidant vitamin and mineral supplements for preventing age-related macular degeneration. Cochrane Database Syst. Rev. 2017, 2017, CD000253. [Google Scholar] [CrossRef] [PubMed]
  4. Prasad, K.; Laxdal, V.A.; Raney, B.L. Antioxidant activity of allicin, an active principle in garlic. Mol. Cell. Biochem. 1995, 148, 183–189. [Google Scholar] [CrossRef] [PubMed]
  5. Pala, R.; Beyaz, F.; Tuzcu, M.; Er, B.; Sahin, N.; Cinar, V.; Sahin, K. The effects of coenzyme Q10 on oxidative stress and heat shock proteins in rats subjected to acute and chronic exercise. J. Exerc. Nutr. Biochem. 2018, 22, 14–20. [Google Scholar] [CrossRef] [PubMed]
  6. Kulczyński, B.; Gramza-Michałowska, A. Characteristics of Selected Antioxidative and Bioactive Compounds in Meat and Animal Origin Products. Antioxidants 2019, 8, 335. [Google Scholar] [CrossRef] [Green Version]
  7. Kulczyński, B.; Gramza-Michałowska, A. The importance of selected spices in cardiovascular diseases. Postepy Hig. Med. Dosw. 2016, 70, 1131–1141. [Google Scholar] [CrossRef]
  8. Gramza-Michałowska, A.; Sidor, A.; Reguła, J.; Kulczyński, B. PCL assay application in superoxide anion-radical scavenging capacity of tea Camellia sinensis extracts. Acta Sci. Pol. Technol. Aliment. 2015, 14, 331–341. [Google Scholar] [CrossRef] [Green Version]
  9. Salvador, A.C.; Król, E.; Lemos, V.C.; Santos, S.A.; Bento, F.P.; Costa, C.P.; Almeida, A.; Szczepankiewicz, D.; Kulczyński, B.; Krejpcio, Z.; et al. Effect of Elderberry (Sambucus nigra L.) Extract Supplementation in STZ-Induced Diabetic Rats Fed with a High-Fat Diet. Int. J. Mol. Sci. 2017, 18, 13. [Google Scholar] [CrossRef] [Green Version]
  10. Gramza-Michałowska, A.; Kulczyński, B.; Xindi, Y.; Gumienna, M. Research on the effect of culture time on the kombucha tea beverage’s antiradical capacity and sensory value. Acta Sci. Pol. Technol. Aliment. 2016, 15, 447–457. [Google Scholar] [CrossRef]
  11. Kulczyński, B.; Gramza-Michałowska, A.; Kobus-Cisowska, J.; Kmiecik, D. The role of carotenoids in the prevention and treatment of cardiovascular disease–Current state of knowledge. J. Funct. Foods 2017, 38, 45–65. [Google Scholar] [CrossRef]
  12. Sidor, A.; Drożdżyńska, A.; Gramza-Michałowska, A. Black chokeberry (Aronia melanocarpa) and its products as potential health-promoting factors—An overview. Trends Food Sci. Technol. 2019, 89, 45–60. [Google Scholar] [CrossRef]
  13. Renaud, J.; Martinoli, M.-G. Considerations for the Use of Polyphenols as Therapies in Neurodegenerative Diseases. Int. J. Mol. Sci. 2019, 20, 1883. [Google Scholar] [CrossRef] [PubMed] [Green Version]
  14. Shahidi, F.; De Camargo, A.C. Tocopherols and Tocotrienols in Common and Emerging Dietary Sources: Occurrence, Applications, and Health Benefits. Int. J. Mol. Sci. 2016, 17, 1745. [Google Scholar] [CrossRef] [PubMed]
  15. Thayagarajan, A.; Sahu, R.P. Potential Contributions of Antioxidants to Cancer Therapy: Immunomodulation and Radiosensitization. Integr. Cancer Ther. 2018, 17, 210–216. [Google Scholar] [CrossRef] [PubMed] [Green Version]
  16. Gramza-Michałowska, A.; Sidor, A.; Kulczyński, B. Berries as a potential anti-influenza factor–A review. J. Funct. Foods 2017, 37, 116–137. [Google Scholar] [CrossRef]
  17. Arulselvan, P.; Fard, M.T.; Tan, W.S.; Gothai, S.; Fakurazi, S.; Norhaizan, M.E.; Kumar, S.S. Role of Antioxidants and Natural Products in Inflammation. Oxid. Med. Cell. Longev. 2016, 2016, 1–15. [Google Scholar] [CrossRef] [Green Version]
  18. Buscemi, S.; Corleo, D.; Di Pace, F.; Petroni, M.L.; Satriano, A.; Marchesini, G. The Effect of Lutein on Eye and Extra-Eye Health. Nutrients 2018, 10, 1321. [Google Scholar] [CrossRef] [Green Version]
  19. Braakhuis, A.; Raman, R.; Vaghefi, E. The Association between Dietary Intake of Antioxidants and Ocular Disease. Diseases 2017, 5, 3. [Google Scholar] [CrossRef] [Green Version]
  20. Kmiecik, D.; Korczak, J.; Rudzińska, M.; Gramza-Michałowska, A.; Hes, M.; Kobus-Cisowska, J. Stabilisation of phytosterols by natural and synthetic antioxidants in high temperature conditions. Food Chem. 2015, 173, 966–971. [Google Scholar] [CrossRef]
  21. Gramza-Michalowska, A.; Sidor, A.; Hes, M. Herb extract influence on the oxidative stability of selected lipids. J. Food Biochem. 2011, 35, 1723–1736. [Google Scholar] [CrossRef]
  22. Hęś, M.; Gramza-Michałowska, A. Effect of Plant Extracts on Lipid Oxidation and Changes in Nutritive Value of Protein in Frozen? Stored Meat Products. J. Food Process. Pres. 2017, 41, e12989. [Google Scholar] [CrossRef]
  23. Ismail, H.; Lee, E.; Ko, K.; Paik, H.; Ahn, D. Effect of Antioxidant Application Methods on the Color, Lipid Oxidation, and Volatiles of Irradiated Ground Beef. J. Food Sci. 2009, 74, C25–C32. [Google Scholar] [CrossRef] [PubMed]
  24. Liu, F.; Xu, Q.; Dai, R.; Ni, Y. Effects of natural antioxidants on colour stability, lipid oxidation and metmyoglobin reducing activity in raw beef patties. Acta Sci. Pol. Technol. Aliment. 2015, 14, 37–44. [Google Scholar] [CrossRef]
  25. Durazzo, A.; Lucarini, M. A current shot and re-thinking of antioxidant research strategy. Br. J. Anal. Chem. 2018, 5, 9–11. [Google Scholar] [CrossRef]
  26. Tanaka, R.; Kikuchi, T.; Nakasuji, S.; Ue, Y.; Shuto, D.; Igarashi, K.; Okada, R.; Yamada, T. A Novel 3a-p-Nitrobenzoylmultiflora-7:9(11)-diene-29-benzoate and Two New Triterpenoids from the Seeds of Zucchini (Cucurbita pepo L.). Molecules 2013, 18, 7448–7459. [Google Scholar] [CrossRef] [Green Version]
  27. Zhou, C.-L.; Mi, L.; Hu, X.-Y.; Zhu, B.-H. Evaluation of three pumpkin species: Correlation with physicochemical, antioxidant properties and classification using SPME-GC–MS and E-nose methods. J. Food Sci. Technol. 2017, 54, 3118–3131. [Google Scholar] [CrossRef]
  28. Nishimura, M.; Ohkawara, T.; Sato, H.; Takeda, H.; Nishihira, J. Pumpkin Seed Oil Extracted from Cucurbita maxima Improves Urinary Disorder in Human Overactive Bladder. J. Tradit. Complement. Med. 2014, 4, 72–74. [Google Scholar] [CrossRef] [Green Version]
  29. Kulczyński, B.; Gramza-Michałowska, A. The Profile of Carotenoids and Other Bioactive Molecules in Various Pumpkin Fruits (Cucurbita maxima Duchesne) Cultivars. Molecules 2019, 24, 3212. [Google Scholar] [CrossRef] [Green Version]
  30. Kulczyński, B.; Gramza-Michałowska, A. The Profile of Secondary Metabolites and Other Bioactive Compounds in Cucurbita pepo L. and Cucurbita moschata Pumpkin Cultivars. Molecules 2019, 24, 2945. [Google Scholar] [CrossRef] [Green Version]
  31. Zaccari, F.; Galietta, G. α-Carotene and β-Carotene Content in Raw and Cooked Pulp of Three Mature Stage Winter Squash “Type Butternut”. Foods 2015, 4, 477–486. [Google Scholar] [CrossRef] [PubMed]
  32. Montesano, D.; Blasi, F.; Simonetti, M.S.; Santini, A.; Cossignani, L. Chemical and Nutritional Characterization of Seed Oil from Cucurbita maxima L. (var. Berrettina) Pumpkin. Foods 2018, 7, 30. [Google Scholar] [CrossRef] [PubMed] [Green Version]
  33. Kim, M.Y.; Kim, E.J.; Kim, Y.N.; Choi, C.; Lee, B.H. Comparison of the chemical compositions and nutritive values of various pumpkin (Cucurbitaceae) species and parts. Nutr. Res. Pract. 2012, 6, 21–27. [Google Scholar] [CrossRef] [PubMed] [Green Version]
  34. Paris, H.S.; Daunay, M.-C.; Pitrat, M.; Janick, J. First Known Image of Cucurbita in Europe, 1503–1508. Ann. Bot. 2006, 98, 41–47. [Google Scholar] [CrossRef]
  35. Lust, T.A.; Paris, H.S. Italian horticultural and culinary records of summer squash (Cucurbita pepo, Cucurbitaceae) and emergence of the zucchini in 19th-century Milan. Ann. Bot. 2016, 118, 53–69. [Google Scholar] [CrossRef] [Green Version]
  36. Nawirska-Olszańska, A.; Kita, A.; Biesiada, A.; Sokół-Łętowska, A.; Kucharska, A.Z. Characteristics of antioxidant activity and composition of pumpkin seed oils in 12 cultivars. Food Chem. 2013, 139, 155–161. [Google Scholar] [CrossRef]
  37. Saavedra, M.J.; Aires, A.; Dias, C.; Almeida, J.A.; De Vasconcelos, M.C.; Santos, P.; Rosa, E.A. Evaluation of the potential of squash pumpkin by-products (seeds and shell) as sources of antioxidant and bioactive compounds. J. Food Sci. Technol. 2015, 52, 1008–1015. [Google Scholar] [CrossRef] [Green Version]
  38. Can-Cauich, C.A.; Sauri-Duch, E.; Moo-Huchin, V.M.; Betancur-Ancona, D.; Cuevas-Glory, L.F. Effect of extraction method and specie on the content of bioactive compounds and antioxidant activity of pumpkin oil from Yucatan, Mexico. LWT-Food Sci. Technol. 2019, 285, 186–193. [Google Scholar] [CrossRef]
  39. Brand-Williams, W.; Cuvelier, M.; Berset, C. Use of a free radical method to evaluate antioxidant activity. LWT-Food Sci. Technol. 1995, 28, 25–30. [Google Scholar] [CrossRef]
  40. Re, R.; Pellegrini, N.; Proteggente, A.; Pannala, A.; Yang, M.; Rice-Evans, C. Antioxidant activity applying an improved ABTS radical cation decolorization assay. Free. Radic. Boil. Med. 1999, 26, 1231–1237. [Google Scholar] [CrossRef]
  41. Sánchez-Moreno, J.; Fulgencio, S. A procedure to measure the antiradical efficiency of polyphenols. J. Sci. Food Agric. 1998, 76, 270–276. [Google Scholar] [CrossRef]
  42. Benzie, I.F.; Strain, J. Ferric reducing/antioxidant power assay: Direct measure of total antioxidant activity of biological fluids and modified version for simultaneous measurement of total antioxidant power and ascorbic acid concentration. Methods Enzymol. 1999, 299, 15–27. [Google Scholar] [PubMed]
  43. Decker, E.A.; Welch, B. Role of ferritin as a lipid oxidation catalyst in muscle food. J. Agric. Food Chem. 1990, 38, 674–677. [Google Scholar] [CrossRef]
  44. Ou, B.; Huang, D.; Hampsch-Woodill, M.; Flanagan, J.A.; Deemer, E.K. Analysis of Antioxidant Activities of Common Vegetables Employing Oxygen Radical Absorbance Capacity (ORAC) and Ferric Reducing Antioxidant Power (FRAP) Assays: A Comparative Study. J. Agric. Food Chem. 2002, 50, 3122–3128. [Google Scholar] [CrossRef] [PubMed]
  45. Kiat, V.V.; Siang, W.K.; Madhavan, P.; Jin, C.J.; Ahmad, M.; Akowuah, G. FT-IR profile and antiradical activity of dehulled kernels of apricot, almond and pumpkin. Res. J. Pharm. Biol. Chem. Sci. 2014, 5, 112–120. [Google Scholar]
  46. Tiveron, A.P.; Melo, P.S.; Bergamaschi, K.B.; Vieira, T.M.F.S.; Regitano-D’Arce, M.A.B.; Alencar, S.M. Antioxidant Activity of Brazilian Vegetables and Its Relation with Phenolic Composition. Int. J. Mol. Sci. 2012, 13, 8943–8957. [Google Scholar] [CrossRef] [PubMed] [Green Version]
  47. Singh, J.; Shukla, S.; Singh, V.; Rai, A.K. Phenolic Content and Antioxidant Capacity of Selected Cucurbit Fruits Extracted with Different Solvents. J. Nutr. Food Sci. 2016, 6, 6. [Google Scholar] [CrossRef]
  48. Bayili, R.G.; Abdoul-Latif, F.; Kone, O.; Diao, M.; Bassole, I.; Dicko, M. Phenolic compounds and antioxidant activities in some fruits and vegetables from Burkina Faso. Afr. J. Biotechnol. 2011, 10, 62. [Google Scholar]
  49. Valenzuela, G.M.; Soro, A.S.; Tauguinas, A.L.; Gruszycki, M.R.; Cravzov, A.L.; Giménez, M.C.; Wirth, A. Evaluation Polyphenol Content and Antioxidant Activity in Extracts of Cucurbita spp. OALib 2014, 1, 1–6. [Google Scholar] [CrossRef]
  50. Dar, P.; Farman, M.; Dar, A.; Khan, Z.; Munir, R.; Rasheed, A.; Waqas, U. Evaluation of Antioxidant potential and comparative analysis of Antimicrobial activity of Various Extracts of Cucurbita pepo L. Leaves. J. Agric. Sci. Food Technol. 2017, 3, 103–109. [Google Scholar]
  51. Oloyede, F.; Agbaje, G.; Obuotor, E.; Obisesan, I. Nutritional and antioxidant profiles of pumpkin (Cucurbita pepo Linn.) immature and mature fruits as influenced by NPK fertilizer. Food Chem. 2012, 135, 460–463. [Google Scholar] [CrossRef] [PubMed] [Green Version]
  52. Fidrianny, I.; Darmawati, A.; Sukrasno, S. Antioxidant capacities from different polarities extracts of cucurbitaceae leaves using FRAP, DPPH assays and correlation with phenolic, flavonoid, carotenoid content. Int. J. Pharm. Pharm. Sci. 2014, 6, 858–862. [Google Scholar]
  53. Chensom, S.; Okumura, H.; Mishima, T. Primary Screening of Antioxidant Activity, Total Polyphenol Content, Carotenoid Content, and Nutritional Composition of 13 Edible Flowers from Japan. Prev. Nutr. Food Sci. 2019, 24, 171–178. [Google Scholar] [CrossRef] [PubMed]
  54. Garrett, A.R.; Murray, B.K.; Robinson, R.A.; O’Neill, K.L. Measuring antioxidant capacity using the ORAC and TOSC assays. Methods Mol. Biol. 2010, 594, 251–262. [Google Scholar]
  55. Haytowitz, D.B.; Bhagwat, S. USDA Database for the Oxygen Radical Absorbance Capacity (ORAC) of Selected Foods, Release 2. Available online: https://naldc.nal.usda.gov/download/43336/PDF (accessed on 2 May 2010).
  56. Parry, J.; Hao, Z.; Luther, M.; Su, L.; Zhou, K.; Yu, L.L. Characterization of cold-pressed onion, parsley, cardamom, mullein, roasted pumpkin, and milk thistle seed oils. J. Am. Oil Chem. Soc. 2006, 83, 847–854. [Google Scholar] [CrossRef]
Figure 1. Dendrogram of studied pumpkin variety divisions.
Sustainability 12 01305 g001
Table 1. General characteristics of used pumpkin cultivars.
Pumpkin CultivarsShapeFlesh ColourpH of Pulp JuiceMoisture Content in the Pulp (%)Share of Individual Pumpkin Plant Elements
DescriptionLabSkin Content (%)Seeds Content (%)Pulp Content (%)
Hokkaidoround, slightly elongated at the tailorange53.59 ± 1.97b28.17 ± 0.74g47.57 ± 1.23ab6.13 ± 0.02h88.47 ± 0.59e17.82 ± 2.06de11.46 ± 2.38e70.59 ± 3.97b
Blue Kuriroundyellow48.38 ± 2.93a21.29 ± 1.40de43.23 ± 1.25a5.94 ± 0.02f78.76 ± 1.90a18.14 ± 2.08e8.08 ± 1.78cd75.63 ± 2.46bc
Buttercupround, slightly flattenedyellow56.58 ± 4.13bc27.76 ± 1.96g48.62 ± 1.91bc5.16 ± 0.03b83.93 ± 0.84c14.08 ± 1.89c3.44 ± 0.86b84.03 ± 2.99cd
Gomezroundorange56.43 ± 3.07bc18.82 ± 1.78cd50.76 ± 0.88c5.09 ± 0.02a91.33 ± 0.72f18.73 ± 2.41e5.82 ± 1.40c79 ± 3.71c
Shokichi Shiroroundorange53.56 ± 2.59b13.21 ± 0.87b45.25 ± 1.80ab5.72 ± 0.04e88.79 ± 1.49e20.7 ± 2.97ef6.67 ± 1.76c72.74 ± 2.15b
Jumbo pink bananaelongatedorange55.78 ± 2.05b25.81 ± 1.09f49.96 ± 2.04c5.49 ± 0.02d90.61 ± 1.33f10.39 ± 2.54a4.2 ± 1.58bc87.11 ± 3.13d
Golden hubbardround, slightly elongated at the tailorange61.96 ± 2.65de25.14 ± 1.95f56.03 ± 2.79d5.16 ± 0.02b90.85 ± 1.03f32.41 ± 3.45h5.06 ± 1.02c63.39 ± 3.10a
Flat White Boer Fordround, clearly flattenedorange55.01 ± 2.11b25.25 ± 1.65f45.89 ± 0.85ab5.22 ± 0.03c90.1 ± 0.83f15.52 ± 2.04cd3.72 ± 0.50b83.29 ± 3.39cd
Jarrahdaleround, flattened, irregularorange63.59 ± 2.85f20.02 ± 0.80d58.13 ± 1.7de6.06 ± 0.03g85.78 ± 0.69d12.53 ± 2.43ab5.82 ± 0.96c83.94 ± 4.27cd
Porcelain Dollround, slightly flattenedorange58.28 ± 1.55c17.78 ± 1.80c55.29 ± 2.49d5.51 ± 0.03d94.85 ± 0.78h22.78 ± 2.84f9.7 ± 1.31d69.24 ± 3.61b
Galeux d Eysinesflattenedorange55.47 ± 2.08bc22.73 ± 1.01e49.67 ± 1.21c5.95 ± 0.04f94.78 ± 0.45h11.44 ± 2.13a5.93 ± 1.07c85.09 ± 2.71cd
Green hubbardelongatedorange59.38 ± 2.54cd19.11 ± 0.57cd60.94 ± 1.81e5.69 ± 0.06e88.26 ± 1.92e32.54 ± 4.75h2.79 ± 0.92a63.47 ± 3.82a
Marina di Chiggiaroundyellow64.43 ± 2.55f8.36 ± 0.45a60.07 ± 1.45e6.10 ± 0.02h81.17 ± 1.29b26.7 ± 2.43fg4.23 ± 0.79bc70.09 ± 4.21b
Melonowa Żółtaroundorange60.48 ± 1.9720.2 ± 2.48d55.97 ± 1.84d5.93 ± 0.02f93.25 ± 1.32g14.37 ± 2.83c2.45 ± 0.48a83.21 ± 3.54e
L: Color brightness; a: Color in the range from green to red (positive values indicate the proportion of red, and negative values—green); b: Color from blue to yellow (positive values indicate the proportion of yellow, and negative values—blue); A–h: Means in the same column followed by the same letters shown in superscript do not significantly differ (p < 0.05) in terms of analyzed variables.
Table 2. Effect of extraction parameters on the antioxidants properties of pumpkin extracts determined by DPPH assay (mg Tx/100 g dm).
SolventExtraction Time and Temperature
1 h2 h
30 °C50 °C70 °C30 °C50 °C70 °C
Acetone74.61 ± 1.25bA90.94 ± 0.81bBn.a.82.37 ± 0.98bA91.29 ± 0.96bBn.a.
Acetone–water (80%)88.81 ± 0.99cA88.42 ± 1.08bAn.a.97.46 ± 1.24cA111.51 ± 1.31bBn.a.
Ethyl acetate63.58 ± 123aA89.98 ± 1.21bB116.15 ± 1.54bC59.57 ± 0.65aA88.25 ± 1.1aB133.59 ± 1.76bC
Ethyl acetate–water (80%)106.93 ± 1.32dA112.3 ± 1.46cB161.67 ± 1.76cC111.15 ± 1.18dA111 ± 0.97bA161.67 ± 1.76cB
Ethanol127.78 ± 2.13fA133.36 ± 1.13dB177.16 ± 2.07dC143.8 ± 1.54eA156.56 ± 1.29dB182.51 ± 1.86dC
Ethanol–water (80%)115.37 ± 1.33eA79.36 ± 1.61aB114.93 ± 2.09bA119.05 ± 1.04dA132.28 ± 1.17cB157.52 ± 2.06cC
Methanol88.44 ± 0.46cA88.58 ± 1.16bA60.46 ± 1.60aB82.29 ± 1.25bA91.59 ± 1.47bB84.33 ± 1.90aC
Methanol–water (80%)136.31 ± 1.70gA151.26 ± 1.98eB198.95 ± 2.39fC165.87 ± 1.38fA180.41 ± 1.8eB210.97 ± 2.13eC
Water151.49 ± 1.33hA158.37 ± 2.46eA180.70 ± 3.43eB168.27 ± 1.20fA174.45 ± 2.76eB183.40 ± 3.08dC
A–h: Different letters represent statistically significant differences (p < 0.05) between solvents (in column) in the variables under analysis; A–C: Different letters represent statistically significant differences (p < 0.05) between temperatures of extraction (separately for 1 and 2 h) in the variables under analysis; n.a.: Not analyzed.
Table 3. Effect of extraction parameters on the antioxidants properties of pumpkin extracts determined by the ABTS assay (mg Tx/100 g dm).
SolventExtraction Time and Temperature
1 h2 h
30 °C50 °C70 °C30 °C50 °C70 °C
Acetone24.62 ± 0.32aA31.51 ± 0.97aBn.a.19.06 ± 0.19aA27.5 ± 0.44aBn.a.
Acetone–water (80%)45.9 ± 1.04dA45.18 ± 0.98cBn.a.55.30 ± 1.00dA62.11 ± 0.35eBn.a.
Ethyl acetate24.9 ± 0.98aA30.83 ± 0.90aB41.23 ± 1.27bC33.63 ± 1.02bA35.76 ± 0.26bB52.25 ± 1.11aC
Ethyl acetate–water (80%)35.53 ± 1.23cA44.57 ± 0.38cB36.78 ± 0.55aA40.48 ± 0.66cA42.33 ± 0.42cB50.05 ± 0.95aC
Ethanol28.43 ± 0.50bA38.21 ± 1.09bB52.68 ± 1.01cC37.89 ± 0.99bA54.8 ± 1.06dB60.69 ± 1.27bC
Ethanol–water (80%)62.08 ± 0.48eB57.24 ± 2.08dA66.68 ± 0.52dC58.89 ± 1.07dA71.81 ± 1.90fB73.80 ± 1.17cB
Methanol35.47 ± 0.99cA49.23 ± 0.71cB62.26 ± 0.38dC40.07 ± 0.62cA58.86 ± 0.73dB70.65 ± 0.44cC
Methanol–water (80%)74.07 ± 1.11eA84.44 ± 0.82eB104.09 ± 1.02eC82.27 ± 1.03eA95.31 ± 0.32gB110.84 ± 0.57dC
Water79.30 ± 0.39eA108.5 ± 1.53fB108.16 ± 0.65eB85.16 ± 0.86eA127.31 ± 1.39hB124.70 ± 0.59eC
A–i: Different letters represent statistically significant differences (p < 0.05) between solvents (in column) in the variables under analysis; A–C: Different letters represent statistically significant differences (p < 0.05) between temperatures of extraction (separately for 1 and 2 h) in the variables under analysis; n.a.: Not analyzed.
Table 4. Effect of extraction parameters on the total phenolic content (TPC) of pumpkin extracts (mg GAE/100 g dm).
Solvent.Extraction Time and Temperature
1 h2 h
30 °C50 °C70 °C30 °C50 °C70 °C
Acetone12.29 ± 0.22bA24.10 ± 0.17cBn.a. 7.49 ± 0.10aA11.546 ± 0.10bBn.a.
Acetone–water (80%)89.51 ± 1.50dA64.19 ± 0.71dBn.a.67.05 ± 0.96dA74.51 ± 0.44dBn.a.
Ethyl acetate3.09 ± 0.06aA8.09 ± 0.08aB22.88 ± 0.11bC5.2 ± 0.05aA7.82 ± 0.03aB18.54 ± 0.15aC
Ethyl acetate–water (80%)12.82 ± 0.21bA14.32 ± 0.16bB18.49 ± 0.29aC16.84 ± 0.45bA24.95 ± 0.24cB30.23 ± 0.21bC
Ethanol46.27 ± 0.48cA75.95 ± 1.01eB130.59 ± 1.53cC62.00 ± 0.52cA102.35 ± 0.89fB164.47 ± 1.88dC
Ethanol–water (80%)106.52 ± 0.77fA93.25 ± 0.44fB132.86 ± 1.61cC131.63 ± 1.22fA128.11 ± 1.13gB186.75 ± 2.05eC
Methanol49.41 ± 0.46cA92.88 ± 0.77fB147.06 ± 1.28dC58.51 ± 1.10cA88.52 ± 0.61eB136.67 ± 1.26cC
Methanol–water (80%)128.62 ± 0.76gA101.69 ± 1.12gB162.51 ± 1.49eC166.23 ± 0.97gA160.12 ± 1.20hB206.47 ± 2.44fC
Water93.41 ± 1.46eA155.83 ± 1.31hB186.47 ± 2.93fC108.2 ± 1.15eA171.97 ± 2.15iB237.94 ± 2.42gC
A–h: Different letters represent statistically significant differences (p < 0.05) between solvents (in column) in the variables under analysis; A–C: Different letters represent statistically significant differences (p < 0.05) between temperatures of extraction (separately for 1 and 2 h) in the variables under analysis; n.a.: Not analyzed.
Table 5. Effect of extraction parameters on ferric ion reducing antioxidant power (FRAP) of pumpkin extracts (mM Fe(II)/100 g dm).
SolventExtraction Time and Temperature
1 h2 h
30 °C50 °C70 °C30 °C50 °C70 °C
Acetone71.32 ± 0.98dA118.96 ± 1.38cBn.a.88.21 ± 0.99dA127.91 ± 2.46dBn.a.
Acetone–water (80%)189.12 ± 1.65gA180.17 ± 3.14eAn.a.249.59 ± 2.40iA240.89 ± 2.28gAn.a.
Ethyl acetate28.56 ± 0.33bA56.69 ± 0.63bB182.27 ± 1.83cC23.32 ± 0.23bA40.82 ± 0.74bB158.37 ± 1.50cC
Ethyl acetate–water (80%)36.05 ± 0.67cA55.57 ± 0.62bB131.42 ± 2.57bC43.08 ± 0.41cA57.71 ± 0.64cB119.87 ± 2.48bC
Ethanol97.67 ± 1.52eA172.86 ± 1.62dB344.25 ± 4.09eC128.13 ± 1.09fA226.36 ± 2.40fB351.06 ± 2.53eC
Ethanol–water (80%)221.36 ± 2.03hA217.73 ± 1.86fA309.05 ± 2.01dB171.18 ± 1.12gA263.49 ± 3.09hB346.79 ± 4.40eC
Methanol106.1 ± 1.66fA181.93 ± 1.81eB360.74 ± 3.50fC117.75 ± 2.22eA222.13 ± 2.13fB349.59 ± 3.99eC
Methanol–water (80%)230.73 ± 3.54iA231.35 ± 2.60gA320.91 ± 4.65dB199.39 ± 3.60hA213.35 ± 3.21eB290.15 ± 3.48dC
Water13.15 ± 0.14aA33.76 ± 0.25aB85.06 ± 1.08aC8.67 ± 0.25aA22.51 ± 0.38aB48.57 ± 1.33aC
A–i: Different letters represent statistically significant differences (p < 0.05) between solvents (in column) in the variables under analysis; A–C: Different letters represent statistically significant differences (p < 0.05) between temperatures of extraction (separately for 1 and 2 h) in the variables under analysis; n.a.: Not analyzed.
Table 6. Effect of extraction parameters on iron chelating activity of pumpkin extracts (ppm EDTA/100 g dm).
SolventExtraction Time and Temperature
1 h2 h
30 °C50 °C70 °C30 °C50 °C70 °C
Acetone1338.66 ± 23.26dA1618.62 ± 17.42dBn.a.1435.13 ± 23.41dA1781.61 ± 16.62dBn.a.
Acetone–water (80%)1116.18 ± 13.55cA1452.60 ± 24.50cBn.a.1343.64 ± 12.54cA1527.80 ± 12.67cBn.a.
Ethyl acetate385.00 ± 3.93bA454.31 ± 3.17bB1563.68 ± 22.42bC589.78 ± 5.48bA888.62 ± 6.08bB1563.68 ± 25.42bC
Ethyl acetate–water (80%)102.37 ± 5.13aA174.30 ± 3.18aB1276.61 ± 18.34aC438.09 ± 4.22aA723.49 ± 4.24aB1236.57 ± 14.16aC
Ethanol2542.92 ± 28.88fA1809.22 ± 16.08eB3023.88 ± 25.61dC3146.40 ± 31.62fA2787.12 ± 13.93eB3486.03 ± 36.51dC
Ethanol–water (80%)3641.36 ± 32.92hA2715.41 ± 12.23gB3864.89 ± 34.29eC3905.50 ± 35.72hA3219.77 ± 18.90fB4144.63 ± 45.86fC
Methanol3015.23 ± 33.00gA3279.077.37.34hB3854.02 ± 46.36eC3497.55 ± 28.65gA3579.78 ± 39.10gB3974.26 ± 27.17eC
Methanol–water (80%)3897.77 ± 44.08hA3553.34 ± 28.12iB4060.22 ± 28.37fC4202.27 ± 37.15iA4071.18 ± 39.20hB4381.1 ± 52.25gC
Water1796.45 ± 12.16eA2108.03 ± 16.61fB2159.47 ± 16.74cC2009.48 ± 16.53eA2566.80 ± 24.05eB2224.65 ± 26.57cC
A–i: Different letters represent statistically significant differences (p < 0.05) between solvents (in column) in the variables under analysis; A–C: Different letters represent statistically significant differences (p < 0.05) between temperatures of extraction (separately for 1 and 2 h) in the variables under analysis; n.a.: Not analyzed.
Table 7. Antioxidant activity of pumpkin extracts determined by ABTS and DPPH assays.
Pumpkin CultivarsABTS
(mg Tx/100 g dm)
DPPH
(mg Tx/100 g dm)
Aqueous–Methanol ExtractAqueous ExtractAqueous–Methanol ExtractAqueous Extract
Hokkaido110.84 ± 0.57cA124.70 ± 0.59dB210.97 ± 2.13hA183.40 ± 3.08iB
Blue Kuri85.12 ± 1.73aA104.78 ± 1.45bB145.44 ± 1.80fA67.43 ± 0.88eB
Buttercup116.37 ± 1.64dA114.04 ± 1.00cA185.19 ± 2.01gA76.58 ± 1.13fB
Gomez127.36 ± 1.66eA107.19 ± 1.5bB86.12 ± 1.90bA34.11 ± 0.86aB
Shokichi Shiro99.79 ± 1.71bA123.75 ± 0.96dB57.54 ± 0.88aA42.22 ± 1.15bB
Jumbo pink banana146.91 ± 0.68fA173.11 ± 1.37gB86.72 ± 0.96bA72.9 ± 0.9fB
Golden hubbard117.24 ± 1.20dA152.01 ± 1.46gB127.5 ± 1.64dA52.5 ± 0.67dB
Flat White Boer Ford113.07 ± 1.24cdA95.92 ± 1.39aB204.12 ± 2.28gA96.49 ± 1.54gB
Jarahdale95.90 ± 1.44bA104.25 ± 1.28bB136.90 ± 2.62eA70.23 ± 1.28fB
Porcelain doll109.74 ± 1.24cA138.04 ± 1.47eB82.42 ± 0.83bA49.99 ± 1.21cB
Galeux d’ Eysines122.32 ± 1.19eA110.07 ± 1.34bB206.99 ± 2.24hA127.85 ± 1.03hB
Green hubbard103.87 ± 1.54cA136.11 ± 1.13eB101.98 ± 1.21cA54.39 ± 0.75dB
Marina di Chiggia118.28 ± 1.12dA143.52 ± 2.43fB105.63 ± 1.07cA73.86 ± 0.85fB
Melonowa Żółta152.86 ± 1.64fA187.17 ± 2.55hB245.98 ± 3.10iA222.23 ± 3.87jB
A–i: Different letters represent statistically significant differences (p < 0.05) between antioxidative activity of pumpkin cultivars; A,B: Different letters represent statistically significant differences (p < 0.05) between antioxidative activity of extracts (aqueous–methanol vs. aqueous).
Table 8. Total polyphenols content and oxygen radical absorbance capacity (ORAC) of pumpkin extracts.
Pumpkin CultivarsTotal Phenolic Content (mg GAE/100 g dm)ORAC (µM Tx/g dm)
Aqueous–Methanol ExtractAqueous Extract
Hokkaido206.47 ± 2.44hA237.94 ± 2.42iB89.97 ± 2.07d
Blue Kuri49.78 ± 0.76aA65.66 ± 0.71aB58.47 ± 0.70b
Buttercup87.99 ± 1.52eA115.24 ± 1.85fB102.08 ± 1.84f
Gomez172.63 ± 1.06gdA188.22 ± 2.73hB99.35 ± 3.05e
Shokichi Shiro58.01 ± 1.08cA66.64 ± 1.90aB108.47 ± 2.32g
Jumbo pink banana50.23 ± 1.61bA66.40 ± 0.83aB86.60 ± 1.19d
Golden hubbard91.46 ± 1.16eA101.05 ± 1.13eB116.38 ± 1.91h
Flat White Boer Ford70.99 ± 1.03dA66.01 ± 1.33aB43.04 ± 1.72a
Jarahdale56.35 ± 0.90cA72.61 ± 1.44bB65.34 ± 1.83c
Porcelain doll174.53 ± 1.37gA189.40 ± 0.78hB98.35 ± 2.36e
Galeux d’ Eysines113.40 ± 1.42fA95.56 ± 1.36dB94.87 ± 0.53e
Green hubbard58.62 ± 1.36cA126.08 ± 1.72gB102.90 ± 1.64f
Marina di Chiggia49.99 ± 1.49aA77.71 ± 1.35cB104.76 ± 1.84f
Melonowa Żółta232.5 ± 2.63iA255.69 ± 4.29jB122.73 ± 3.39i
A–j: Different letters represent statistically significant differences (p < 0.05) between antioxidative activity (ORAC) and total polyphenolic content of pumpkin cultivars. A, B: Different letters represent statistically significant differences between antioxidative activity (ORAC) and total polyphenolic content (p < 0.05) of extracts (aqueous–methanol vs. aqueous).
Table 9. Iron chelating activity and ferric ion reducing antioxidant power (FRAP) of pumpkin extracts.
Pumpkin CultivarsIron Chelating Activity
(ppm EDTA/100 g dm)
FRAP
(mM Fe(II)/100 g dm)
Aqueous–Methanol ExtractAqueous ExtractAqueous–Methanol ExtractAqueous Extract
Hokkaido4381.1 ± 52.25aA2224.65 ± 26.57aB290.15 ± 3.48bA48.57 ± 1.33aB
Blue Kuri11385.16 ± 56.32gA7561.89 ± 46.15jB337.39 ± 1.63cA123.14 ± 1.73gB
Buttercup5702.74 ± 59.19bA2938.91 ± 30.21bB592.78 ± 2.24jA283.34 ± 2.43lB
Gomez12804.62 ± 90.97gA8125.81 ± 31.32kB407.05 ± 1.72eA111.54 ± 1.66fB
Shokichi Shiro11350.7 ± 100.45gA5029.95 ± 25.77fB324.31 ± 1.60cA84.50 ± 1.84dB
Jumbo pink banana7499.11 ± 83.49dA5194.75 ± 45.07fB386.83 ± 2.43dA140.94 ± 1.76hB
Golden hubbard5635.76 ± 78.83bA3255.99 ± 38.26cB405.43 ± 2.81eA95.31 ± 1.12eB
Flat White Boer Ford7421.45 ± 78.67dA6131.97 ± 24.33iB509.28 ± 3.62gA169.41 ± 1.16iB
Jarahdale6197.18 ± 50.75cA5314 ± 26.52gB478.86 ± 4.04fA110.17 ± 1.83fB
Porcelain doll9321.91 ± 81.67fA5782.54 ± 56.89hB501.19 ± 5.79gA202.2 ± 2.13jB
Galeux d’ Eysines6119.04 ± 84.52cA4302.19 ± 65.47eB524.90 ± 4.25hA213.30 ± 2.47kB
Green hubbard10760.30 ± 99.76gA7349.57 ± 81.84jB293.67 ± 2.28bA66.34 ± 1.27cB
Marina di Chiggia7753.32 ± 25.21eA5715.51 ± 69.28hB266.24 ± 2.97aA58.19 ± 1.24bB
Melonowa Żółta5615.31 ± 49.74bA4095.36 ± 47.03dB555.63 ± 6.94iA364.90 ± 6.70mB
A–m: Different letters represent statistically significant differences (p < 0.05) between antioxidative activity (chelating properties and FRAP) of pumpkin cultivars. A,B: Different letters represent statistically significant differences (p < 0.05) between antioxidative activity of extracts (aqueous–methanol vs. aqueous).
Table 10. Results of the correlation analysis between the antioxidant activity tests in Cucurbita maxima cultivars aqueous extracts.
ABTSDPPHTotal Phenolic ContentIron Chelating ActivityFRAPORAC
ABTSx−0.010.41 **−0.37 *−0.38 *0.64 ***
DPPH−0.01x0.14−0.260.32−0.07
Total polyphenols content0.41 **0.14x−0.47 **−0.240.59 ***
Iron chelating activity−0.37 *−0.26−0.47 **x−0.01−0.35 *
FRAP−0.38 *0.32−0.24−0.01x−0.47 **
ORAC0.64 ***−0.070.59 ***−0.35 *−0.47 **x
p < 0.05 *; p < 0.01 **; p < 0.001 ***: Determination of statistically significant correlations between tested variables.
Table 11. Results of the correlation analysis between the antioxidant activity tests in Cucurbita maxima cultivars aqueous–methanol extracts.
ABTSDPPHTotal Phenolic ContentIron Chelating ActivityFRAP
ABTSx−0.040.37*−0.39*−0.06
DPPH−0.04x0.38−0.53***0.45*
Total Polyphenols Content0.37*0.38x−0.63***0.39*
Iron Chelating Activity−0.39*−0.53***−0.63***x−0.16
FRAP−0.060.45*0.39*−0.16x
p < 0.05*; p < 0.01**; p < 0.001***: Determination of statistically significant correlations between tested variables.
Table 12. Variable levels divided into groups of pumpkin varieties.
Cluster 1Cluster 2p Value
Aqueous–methanol extractABTS120.49 ± 13.72104.84 ± 14.01p < 0.05
DPPH190.21 ± 99.1295.24 ± 30.17p < 0.05
Total polyphenols content84.46 ± 31.7362.78 ± 9.72p < 0.05
Iron chelating activity6210.87 ± 1188.9411061.61 ± 1127.68p < 0.05
FRAP415.28 ± 118.85372.52 ± 76.37NS.
Aqueous extractABTS130.6 ± 25.69122.04 ± 14.5NS.
DPPH91.74 ± 40.2549.49 ± 11.66p < 0.05
Total polyphenols content95.54 ± 29.0287.29 ± 22.81NS.
Iron chelating activity4346.98 ± 1301.876745.29 ± 1191.65p < 0.05
FRAP135.33 ± 71.86117.54 ± 47.87NS.
ORAC91.75 ± 24.8893.51 ± 19.98NS.
p < 0.05: Determination of statistically significant differences between the groups of varieties; NS: Not significant; dm: Dry mass; the results are expressed as the mean values ± standard deviation of the triplicate samples; the results are expressed in the following units: ABTS, DPPH (mg Tx/100 g dm), iron chelating activity (ppm EDTA/100 g dm), FRAP (mM Fe(II)/100 g dm), total phenolic content (mg GAE/100 g dm), ORAC (µM Tx/g dm).

