Article

Decoupling Elasticity and Driving Factors of Energy Consumption and Economic Development in the Qinghai-Tibet Plateau

1
Department of Economics and Management, North China Electric Power University, Baoding 071003, China
2
State Key Laboratory of Earth Surface Processes and Resource Ecology, Faculty of Geographical Science, Beijing Normal University, Beijing 100875, China
3
College of Resources and Environmental Sciences, Henan Agricultural University, Zhengzhou 450002, China
4
Sustainable Process Integration Laboratory—SPIL, NETME Centre, Faculty of Mechanical Engineering, Brno University of Technology—VUT Brno, Technická 2896/2, 616 69 Brno, Czech Republic
*
Author to whom correspondence should be addressed.
Sustainability 2020, 12(4), 1326; https://0-doi-org.brum.beds.ac.uk/10.3390/su12041326
Submission received: 10 January 2020 / Revised: 4 February 2020 / Accepted: 9 February 2020 / Published: 12 February 2020
(This article belongs to the Special Issue Energy Consumption and Financial Development)

Abstract

:
Decoupling of energy consumption and economic development is a key factor in achieving sustainable regional development. The decoupling relationship between energy consumption and economic development in the Qinghai-Tibet Plateau region is still unclear. This paper uses the logarithmic mean Divisia index (LMDI) decomposition method and Tapio elastic index model to analyze the decoupling degree and driving factors of energy consumption and economic development, and evaluates the decoupling effort level in Qinghai-Tibet Plateau from 2006 to 2016. The results indicate that the Qinghai-Tibet Plateau region showed a weak decoupling as a whole, and that only Tibet experienced expanding negative decoupling in 2006–2007 and an expansion link in 2007–2008. Economic scale is a primary factor that hinders the decoupling of energy consumption, followed by investment intensity and industrial energy structure. The cumulative promotion effect of research and development (R&D) efficiency and intensity and the inhibition effect of investment intensity cancel each other out. With the exception of Tibet and Xinjiang, all provinces in the Qinghai-Tibet plateau have made decoupling efforts. Decoupling efforts made by R&D efficiency contributed the most, followed by energy intensity and R&D intensity. This paper provides policy recommendations for the decoupling of energy consumption experience for underdeveloped regions.

1. Introduction

1.1. Background

Economic development is largely achieved through energy consumption. At present, energy consumption is still dominated by fossil energy consumption. While energy consumption promotes economic growth, it also causes a large amount of greenhouse gas emissions. The global warming problem caused by energy consumption has attracted widespread attention [1]. Therefore, whether the decoupling of economic development and energy consumption can be realized has become the an important issue to scholars in various countries [2]. As the world’s largest developing country, China has become the world’s second largest energy consumer. In 2018, China’s energy consumption reached 4.62 billion tons of standard coal, accounting for 24% of global energy consumption [3]. Moreover, China is facing a more severe double test of economic transformation along with energy conservation and consumption reduction. No country is willing to reduce energy consumption at the expense of economic development, so it is particularly important to study whether China’s economic growth and energy consumption are decoupled and the driving factors that lead to decoupling.
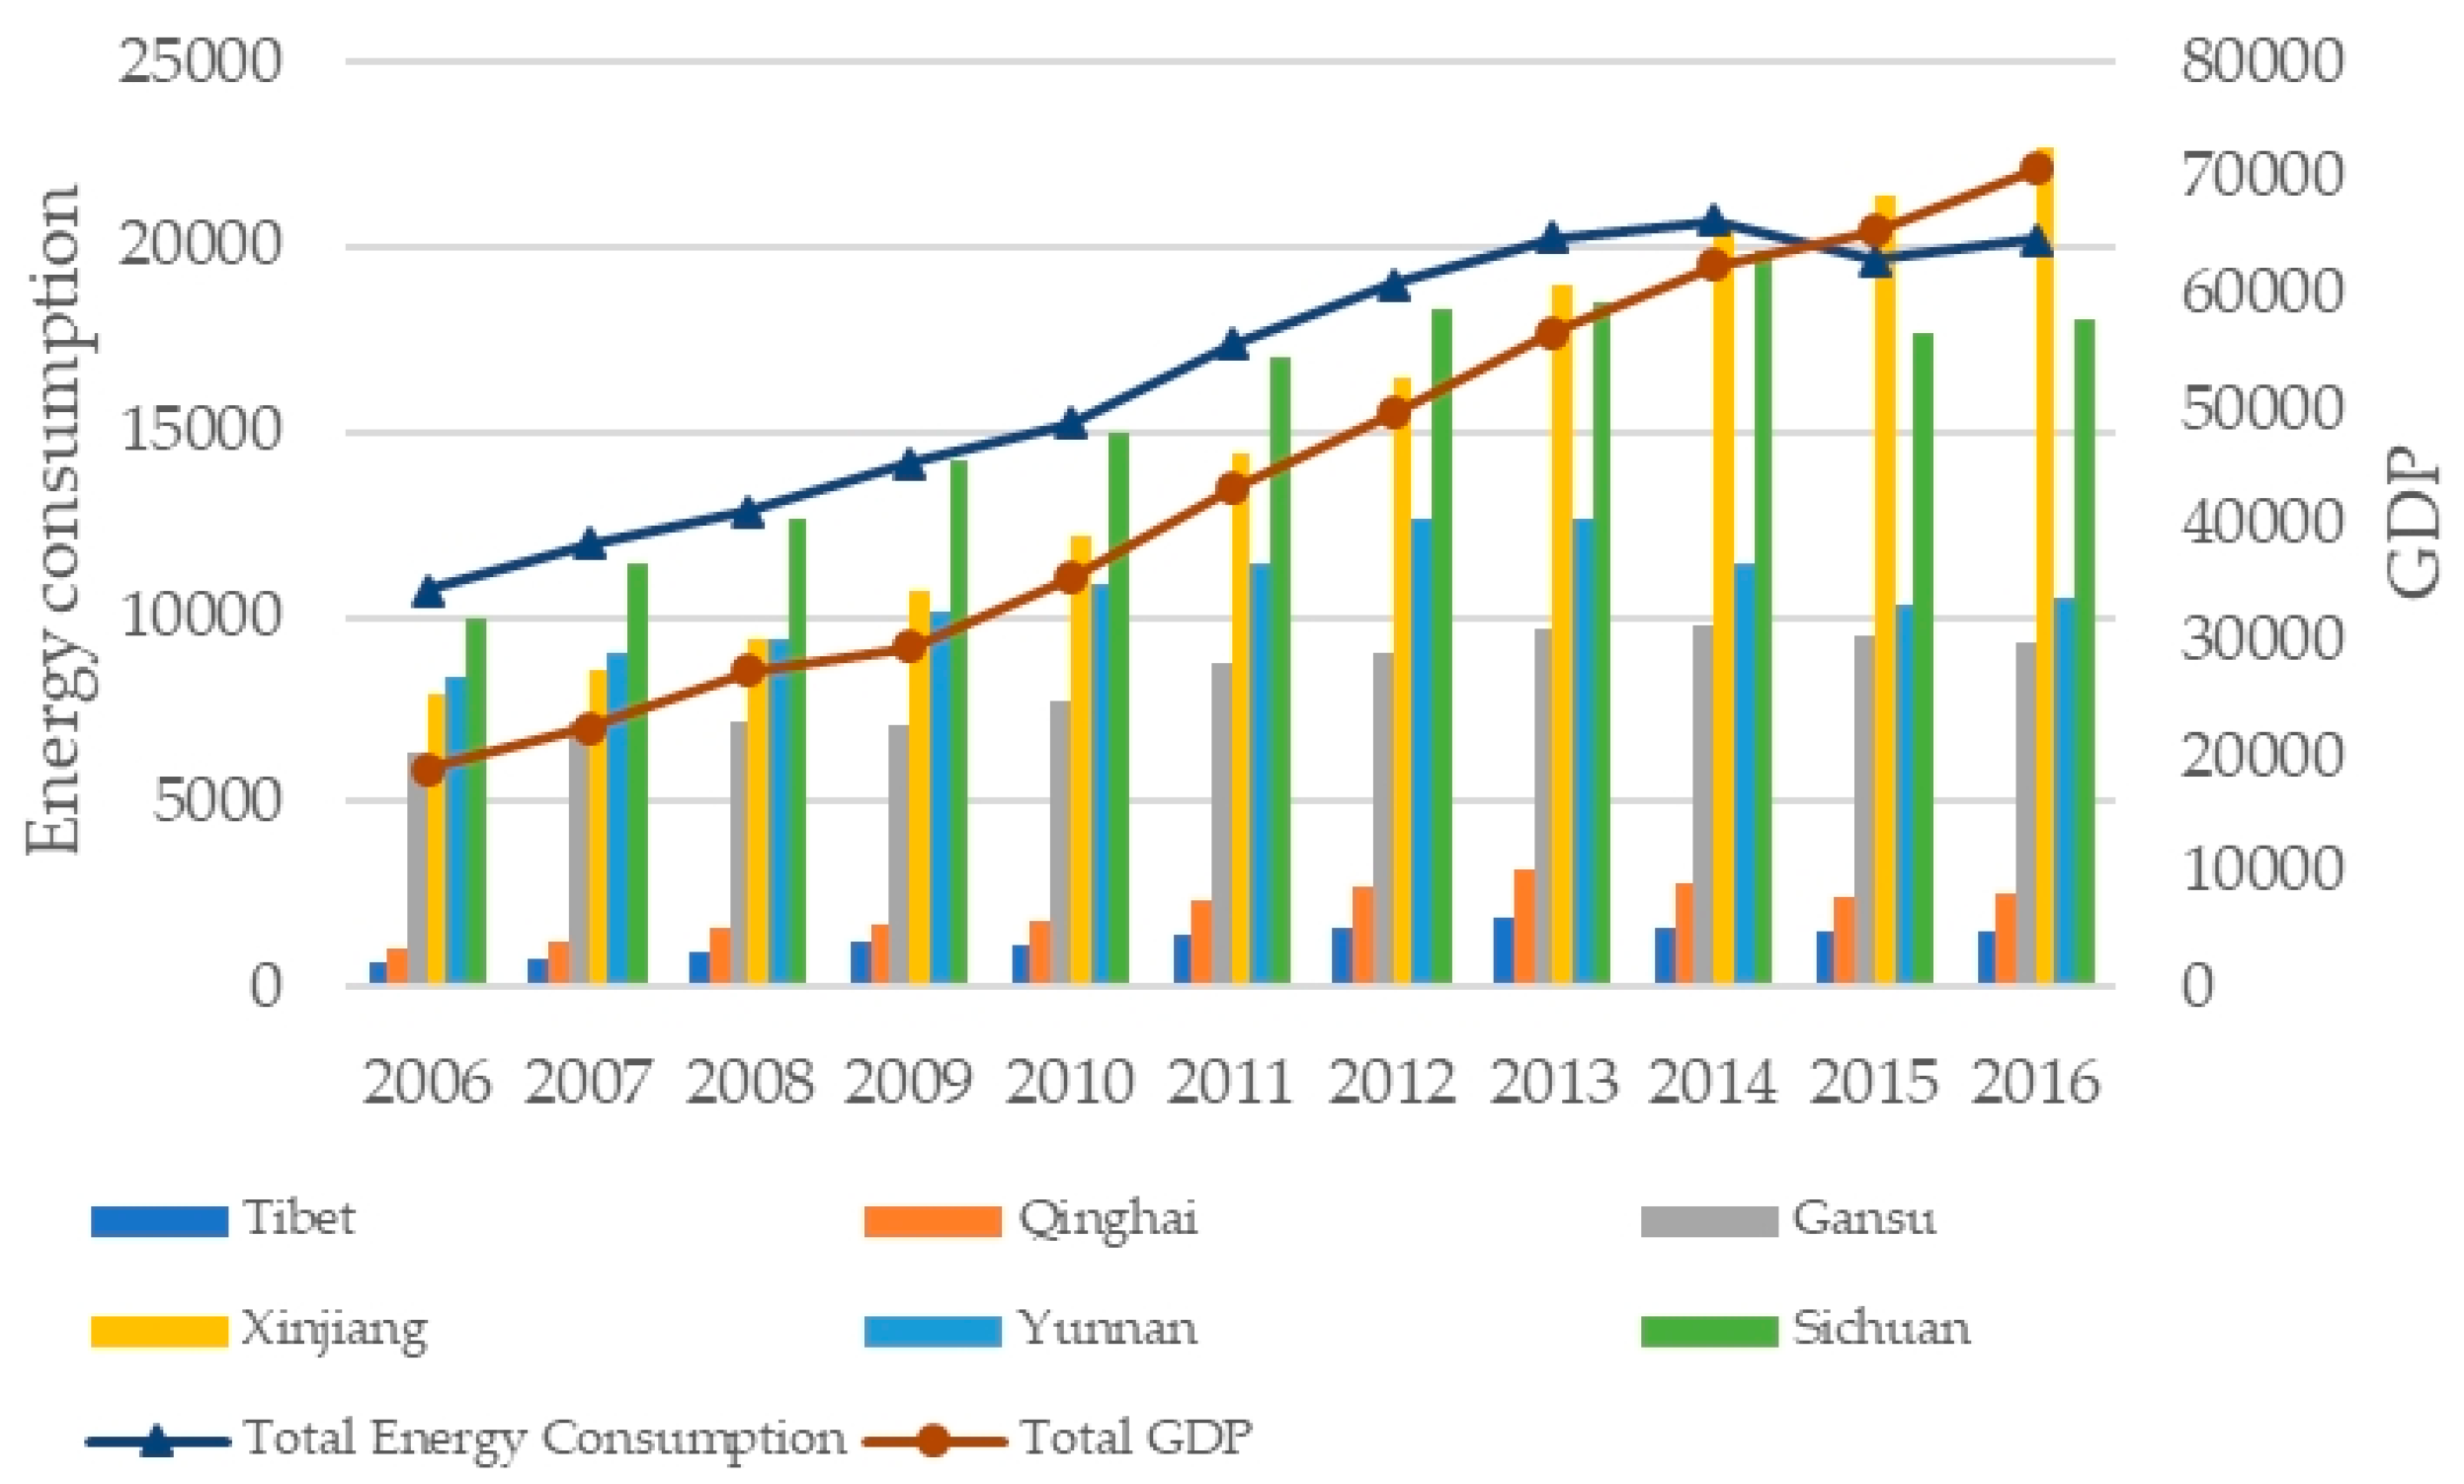
China has significant regional differences in terms of energy consumption levels, economic development and technological upgrading. Therefore, it is particularly important to explore decoupling of energy consumption by region. The Qinghai-Tibet Plateau region is a special regional unit in western China. Its special geographical location and climate make the region rich in natural resources, and it also faces the most prominent problems of ecological environment degradation and herder poverty. Because of its particularities, scholars have done little research into the economic development and energy consumption of the Qinghai-Tibet Plateau. Therefore, in solving the problem of the relationship between energy consumption and economic growth, the Qinghai-Tibet Plateau is an extremely urgent and generalizable region to draw information from. To explore the decoupling relationship between energy consumption and economic development in the Qinghai-Tibet Plateau region, and to analyze the influencing factors that cause changes in energy consumption, certain data can provide support for energy conservation and consumption reduction in the region, and provide experience and reference for regions with similar characteristics around the world, so as to jointly realize sustainable development worldwide.

1.2. Literature Review

Decoupling originates from the field of physics, meaning that a response relationship between two or more physical quantities with corresponding relationships does not exist. Currently, the methods of decoupling analysis mainly include The Organization for Economic Co-operation and Development (OECD) decoupling model, changes in the amount of comprehensive analysis, Tapio elastic model, based on decoupling analysis complete decomposition technology, differential regression coefficient method and quantitative analysis method [4,5,6]. For example, Abbas et al. [7] used an autoregressive lag (ARDL) bound test to study the relationship between household energy use and economic development in Pakistan from 1972 to 2017. Because the differential regression coefficient method and econometric analysis method require relatively more data samples, while other methods are not accurate in their classifications of decoupling degrees, the Tapio elastic analysis method can further improve the objectivity and accuracy of decoupling analysis. The main methods used to analyze the influencing factors of energy consumption decoupling include the factor decomposition method, coefficient analysis method, equation method, causal method and other methods [8,9,10]. Compared with other methods, the factor decomposition method is widely used due to its simple calculations and low data-size requirements. Among them, the LMDI method is the most widely used because it does not generate residuals and can effectively deal with zero-value problems. Thus, the Tapio model and the LMDI approach are often used to assess decoupling and drivers between economic growth and energy consumption. For example, Jana et al. [11] quantitatively evaluated the relationship between economic development and energy consumption in V4 countries from 1991 to 2015 using the Tapio model. The results showed that most V4 countries are in a state of strong decoupling. Rocio [12] used the Tapio model to analyze the decoupling degree of energy consumption in Colombia from 2000 to 2015. Wang et al. [13] discussed decoupling in developing countries through a comparative analysis of the decoupling between economic growth and energy consumption in China and India. Lin et al. [14] studied the decoupling between China’s economic development and energy consumption, and the results showed that it was mainly determined by secondary industries. In the research on decoupling of energy consumption, most scholars have analyzed it from the perspective of energy-related carbon emissions and the driving factors affecting decoupling. Engo et al. [15] used the Tapio model to explore the decoupling of energy-related CO2 from economic growth in the Cameroon transport sector between 1990 and 2016. The results showed that the growth rate of CO2 is lower than the economic growth rate, which is mainly weakly decoupled. Wang et al. [16] used Tapio and LMDI models to study the degree of decoupling between China’s economic development and energy-related carbon emissions and the driving factors of carbon emissions. The results showed that the factors restricting decoupling include the carbon coefficient effect, economic structure effect, labor force input effect and investment effect. Xie et al. [17] also used the Tapio and LMDI models to analyze the factors influencing the decoupling of CO2 emissions from GDP in China’s power industry, and they found that economic scale and electrification were the two main factors inhibiting it. Li et al. [18] predicted that the decoupling relationship between China’s CO2 emissions and economic development would become stronger between 2015 and 2030. Dong et al. [19] examined Chinese economic growth and energy-related CO2 emission decoupling driver forces from the perspective of spatial and temporal heterogeneity, and the results indicated that the influences of energy structure, energy intensity, industrial structure and technological progress in most regions were positive in the decoupling index, and are prompting weak decoupling to develop in most parts of China to develop.
In addition to analyzing the degree of decoupling between economic development and energy consumption at the national level, scholars have also discussed decoupling at the regional level. For example, Xu et al. [20] studied the relationship between economic growth and carbon emissions during the urbanization of the Pearl River Delta, and Zhong et al. [21] analyzed the relationship between economic growth and energy consumption in the Beijing-Tianjin-Hebei region. Similarly, Wang and Yang [22] used the LMDI and Tapio models to analyze the decoupling relationship between industrial development and economic growth in the Beijing-Tianjin-Hebei region from 1996 to 2010. The results showed that most years demonstrated weak decoupling. Chen et al. [23] studied the relationship between energy consumption and economic development in Macau from 2000 to 2013. The results showed that Macau has gone through four decoupling stages: expanded negative decoupling, weak decoupling, extended negative decoupling and strong decoupling. Shi et al. [24] used the decoupling index to study the relationships between economic growth and energy consumption in China’s provinces. The results showed that North China, Northeast China and East China are in a state of strong decoupling. Wang et al. [25] combined the Tapio model with the LMDI model to conduct a comparative study on the decoupling of carbon emissions from economic growth in transportation sectors in some provinces in eastern, central and western China. Studies showed that the decoupling degree of transport carbon emissions in the eastern, central and western regions were different, and that the driving factors for carbon emissions were similar. Wen and Zhang [26] used the LMDI and Tapio models to analyze the influencing factors and decoupling statuses of energy industry carbon emissions in Liaoning province. The results showed that the changes in energy intensity and energy technology were opposite to the changes in industrial carbon emissions. Zheng et al. [27] combined the LMDI and Tapio models to study the degree and driving factors of carbon emission decoupling in Shijiazhuang. The results showed that energy intensity was the most important driving factor affecting carbon emissions. Wang et al. [28] directly compared the decoupling status and driving factors of the transportation industry in four municipalities under the central government of China, and concluded that Beijing was in a weak decoupling status, Shanghai and Tianjin were in a strong decoupling status and Chongqing changed from decoupling to negative decoupling. They determined that an energy-saving effect was the main driving factor behind the decoupling in these four cities.
In a large number of studies on the degree and drivers of decoupling between economic development and energy consumption, some further efforts to evaluate decoupling drivers have been made. For example, Etem et al. [29] evaluated the decoupling process of Turkey and found that Turkey did not make or had made weak decoupling efforts in most cases, and that the biggest factor that had made decoupling efforts was energy intensity. Li et al. [30] also found that energy intensity had made the biggest contribution to decoupling through an analysis of Central Asia. Wang et al. [31] studied the status and efforts of urban carbon emission decoupling in different industrial stages in China, and concluded that cities in different industrial stages showed different decoupling states, driving forces and effects. However, to achieve energy conservation and emission reductions, efforts must be made to improve urban energy structures, energy efficiency and industrial structures. Yan et al. [32] studied the status and efforts of carbon emission decoupling in China’s transportation sector from 1991 to 2015, and the study showed that only in 1991–1995, 2005–2010 and 2010–2015 was there effective work to mitigate carbon emissions.
The research methods and driving factors related to the decoupling of energy consumption and economic development are summarized in Table 1, which is based on the above analysis and summary. Through literature analysis, most scholars have analyzed decoupling degrees at the levels of nations or regions from the perspective of energy-related carbon emissions, although few papers have studied energy decoupling directly. At the regional level, more studies have focused on more-developed regions, the results of which are not of significance to less-developed regions. Therefore, the present study chose the Qinghai-Tibet Plateau region to represent underdeveloped regions, employing the LMDI and Tapio models, decoupling state analysis and the driving factors of energy consumption and economic development to gather data. Furthermore, by using the decoupling effort model, this paper evaluated the degree of decoupling effort of each decoupling driver force. Finally, based on the results, energy consumption and economic development in Qinghai-Tibet plateau are proposed.

2. Methodologies and Data Sources

2.1. LMDI Decomposition Model

Structural decomposition analysis (SDA) and exponential decomposition analysis (IDA) are often used to analyze the driving factors affecting energy consumption or energy-related carbon emissions. Compared with the former, the latter is more suitable for decomposing models with less time series and factors [33,34]. Since 2000, the dominant IDA approach has been the LMDI approach [35]. The LMDI method was proposed by Ang [36] to solve the problems of a zero value of data and residual errors in results. Based on previous research by scholars, China has adopted a series of measures to help alleviate the environmental problems brought about by economic growth, such as improving energy efficiency, transforming energy structures and increasing investment in research and development to find a low-energy economic development path [37,38]. For this reason, this paper uses the LMDI method to decompose the energy consumption of the Qinghai-Tibet Plateau into the cumulative effects of seven driving factors: industrial energy structure, energy intensity, R&D efficiency, R&D intensity, investment intensity, economic scale and population scale. The model is as follows:
E = i j E i j = i j ( E i j E i × E i Y i × Y i R i × R i I i × I i Y i × Y i P i × P i ) = i j ( F × H × T × N × S × Q × U )
where E represents energy consumption; E i j represents the energy consumption of industry j in province i; E i represents the energy consumption of province i; Y i represents the total regional output value of province i; R i represents the R&D expenditure of province i; I i represents fixed-asset investments in province i; and P i represents the population of province i. F = E i j / E i is the industrial energy structure; H = E i / Y i is energy intensity;   T = Y i / R i is R&D efficiency;   N = R i / I i is R&D intensity; S = I i / Y i is investment intensity;   Q = Y i / P i is the economic scale; and U = P i is population size.
Therefore, changes in energy consumption can be decomposed into the following effects according to the LMDI decomposition method:
Δ E = E t E 0 = i j ( F t × H t × T t × N t × S t × Q t × U t ) i j ( F 0 × H 0 × T 0 × N 0 × S 0 × Q 0 × U 0 ) = Δ F + Δ H + Δ T + Δ N + Δ S + Δ Q + Δ U
where ∆E represents the change in energy consumption; ∆F is the industrial energy structure factor, indicating the proportion of energy consumption of different industries in the total consumption; ∆H is the energy intensity factor, indicating the energy consumption of output value per unit area; ∆T is the R&D efficiency factor, indicating the proportion of fixed-asset investment in R&D; ∆N is the R&D intensity factor, indicating the proportion of R&D in the regional GDP; ∆S is the investment intensity factor, indicating the proportion of fixed-asset investment in the regional GDP; ∆Q is the economic scale, representing the GDP per capita; and ∆U is the population size factor.
Compared to the previous factor-based methods, the LMDI method includes an improved method of indexing [39]. The coefficients Wij are defined as follows:
W i j = E i j t E i j 0 L n E i j t L n E i j 0
where E i j t represents the energy consumption of j industry in province i in year t, and E i j 0 represents the energy consumption of j industry in province i in the base year. The effect of each factor on energy consumption can be expressed as follows:
Δ F = i j W i j × L n F t F 0
Δ H = i j W i j × L n H t H 0
Δ T = i j W i j × L n T t T 0
Δ N = i j W i j × L n N t N 0
Δ S = i j W i j × L n S t S 0
Δ Q = i j W i j × L n Q t Q 0
Δ U = i j W i j × L n U t U 0

2.2. Tapio Decoupling Elastic Decomposition Model

Two commonly used methods to measure the decoupling between energy consumption and economic growth are the decoupling index proposed by the OECD and the elasticity coefficient proposed by Tapio [40,41]. Compared with the former, the latter does not have high requirements for choice of data and base period. As a result, the Tapio model is now more widely used in decoupling analysis [42]. In order to quantitatively analyze the relationship between energy consumption and economic development, this paper constructed a decoupling model of energy consumption and economic development based on the LMDI factorization method and the Tapio decoupling elasticity index. The model is as follows:
D = Δ E / E 0 Δ Y / Y 0 = Δ E × Y 0 E 0 × Δ Y = ( Δ F + Δ Η + Δ Τ + Δ Ν + Δ S + Δ Q + Δ U ) × Y 0 E 0 × Δ Y = D F + D H + D T + D N + D S + D Q + D U
In Equation (11), D is the decoupling index between energy consumption and economic development; ∆Y represents the change in region GDP; E0 and Y0 represent energy consumption and region GDP in the base period, respectively; DF is the industrial energy structure effect; DH is the energy intensity effect; DT is the R&D efficiency effect; DN is the R&D intensity effect; DS is the investment intensity effect; DQ is the economy scale effect; and DU is the population size effect. The specific classification criteria of decoupling elasticity coefficient D are shown in Table 2.

2.3. Decoupling Effort Model

Decoupling efforts are the work done to reduce energy consumption. After excluding the influence of economic factors on energy consumption, an energy consumption decoupling effort index model is constructed in order to further measure the degree of decoupling efforts of other effects on energy consumption [43]:
α = Δ E Δ Q Δ Q = Δ F Δ Q Δ H Δ Q Δ T Δ Q Δ N Δ Q Δ S Δ Q Δ U Δ Q = α F + α Η + α Τ + α Ν + α S + α U
In Equation (12), α is the decoupling effort index after excluding economic factors, and α F , α Η , α Τ , α Ν , α S , α U are decoupling effort indexes of industrial energy structure, energy intensity, R&D efficiency, R&D intensity, investment intensity and population size, respectively. When the amount of change in energy consumption caused by the decoupling effort is greater than or equal to zero (i.e., α ≤ 0), it means that no decoupling effort was made. Decoupling efforts are effective only when they cause energy consumption to be less than zero. The decoupling effort values and corresponding status classifications are shown in Table 3 below.

2.4. Data Sources

This paper studies the decoupling relationship between economic development and energy consumption in the Qinghai-Tibet Plateau. Taking into account the relationship between administrative divisions and economic divisions, as well as the similarity of natural geographical conditions, resource endowments and spatial adjacency, the six administrative divisions of Qinghai, Tibet, Gansu, Yunnan, Sichuan and Xinjiang comprise the Qinghai-Tibet Plateau. The data used in this paper are from China Statistical Yearbook (2007–2017), China Science and Technology Statistical Bulletin (2006–2016) and China Energy Statistical Yearbook (2007–2017) [44,45,46]. Among them, regional GDP, population and fixed-asset investment data are from China Statistical Yearbook (2007–2017). The data of R&D expenditure come from China Science and Technology Statistics Bulletin (2006–2016). The energy sources calculated in this paper include 30 kinds of energy sources such as raw coal, briquette, coke, cleaned coal, crude oil, gasoline, kerosene, diesel oil, natural gas and so on. The original data of energy consumption come from China Energy Statistics Yearbook (2007–2017). The standard coal conversion coefficient comes from the General Principles for Calculation of Comprehensive Energy Consumption. Data on energy consumption in Tibet come from a field investigation conducted by the Tibet Autonomous Region Statistics Bureau. In order to exclude the impact of inflation, this article adjusts regional GDP, fixed-asset investment and R&D data to 2006 constant prices.

3. Results

3.1. Analysis of Energy Consumption in Qinghai-Tibet Plateau

Figure 1 was obtained from the data of China Energy Statistical Yearbook and China Statistical Yearbook and shows the changing trend of energy consumption and economic development in the Qinghai-Tibet Plateau region. Concerning an overall analysis of the Qinghai-Tibet Plateau, economic development was accompanied by an increase in energy consumption in most years of the study period. Energy consumption only decreased in 2015 under the trend of economic growth, which proves that the region made initial achievements in vigorously developing non-fossil energy and promoting the transformation of energy production during the 12th Five-Year Plan period. From the perspective of provinces, Yunnan and Sichuan were the provinces with the highest energy consumption in the Qinghai-Tibet Plateau in the early stage of the study. After 2013, Xinjiang surpassed Yunnan and Sichuan and became the province with the highest energy consumption. Most provinces experienced a decline in energy consumption in 2015, and only Xinjiang’s energy consumption continued to grow rapidly. This has mainly been the result of the government’s vigorous support for the development of tourism in Yunnan and Sichuan in the late research period, as well as Xinjiang’s commitment to the construction of transportation industries such as railways and airports and the development of energy-intensive industries such as large and medium-sized reservoirs in 2015. The variation of energy consumption in Gansu has fluctuated, experiencing a rise and fall in 2009, and later another rise and fall in 2015. The probable reason for the decline in 2009 is that the five measures adopted by the petrochemical industry in energy conservation and emission reduction in Gansu province reduced energy consumption. The reason for the decrease of energy consumption in Gansu in 2015 is that Gansu vigorously developed and utilized abundant new energy sources such as wind, solar and biomass energy, allowing it—a traditional energy base—to enter the track of "clean development" and significantly improve its energy production. During the study period, the energy consumptions of Qinghai and Tibet were significantly lower than that of other provinces, and the change trend was slow. This is mainly because of the geographical locations of these two provinces, which has led to special climatic conditions and resource advantages. The inconvenience of transportation has also made the industries of these provinces relatively weak and the consumption of fossil energy relatively small. The economic development of Qinghai and Tibet mainly depends on agriculture and animal husbandry.

3.2. Analysis of Decoupling Degree between Economic Development and Energy Consumption

The degree of decoupling between energy consumption and economic development reflects the rate of energy consumption to economic growth. It was calculated using Equations (1)–(11), as shown in Figure 2. As can be seen in the figure, the decoupling elasticity index of the Qinghai-Tibet Plateau from 2006 to 2016 was between 0 and 0.8, indicating that the region as a whole was weakly decoupled. In other words, the economic growth depended on energy consumption to some extent, but the growth rate of energy consumption was less than that of economic growth. This is because in the 12th Five-Year Plan period, in order to protect the ecological environment of the Qinghai-Tibet Plateau region, the provinces relied on their own resources to reduce the level of fossil energy development and utilization, thereby increasing the proportion of clean energy utilization while exploring ways to develop a green economy and improve energy utilization efficiency. Thus, provinces sought to control energy consumption while at the same time speeding up economic growth. From the perspective of all provinces, the decoupling between economic development and energy consumption in each province from 2006 to 2016 was mainly weak, with only Tibet showing a negative decoupling state of expansion from 2006 to 2007 and an expansionary linkage state from 2007 to 2008. The reason for the decoupling of Tibet’s economic development and energy consumption may be that Tibet issued the "Tibet Autonomous Region firewood alternative energy development plan" in 2008. Relying on abundant hydropower and solar energy resources, Tibet implemented an unprecedented energy alternative strategy and reduced the consumption of traditional energy. The reason why other provinces exhibited weak decoupling during the study period is that the provinces did not only focus on economic development. At the same time, the development and utilization of new energy sources with minimal pollution and large reserves (such as wind energy, solar energy and biomass energy) began to transform energy consumption into low-consumption and high-efficiency aspects, thereby reducing the speed at which energy is consumed. All provinces except Tibet reduced the dependence of their economic development on energy consumption through the comprehensive effects of adjusting their industrial structures, policy regulations, forms of energy and energy-saving technologies.

3.3. Analysis of Driving Factors for Decoupling Economic Development and Energy Consumption

In order to better define the factors that affect the decoupling relationship between economic development and energy consumption, this article combines the LMDI method with the Tapio index model. As shown in Equation (11), the decoupling relationship between economic development and energy consumption was decomposed into the cumulative effect of seven driving factors, namely industrial energy structure, energy intensity, R&D efficiency, R&D intensity, investment intensity, economic scale and population scale (represented by DF, DH, DT, DN, DS, DQ, DU), so as to further discuss the factors that affect the decoupling relationship between economic development and energy consumption. The results are shown in Figure 3, in which Figures a–f represent the driving factor analysis of decoupling in Qinghai, Yunnan, Gansu, Sichuan, Qinghai and Tibet, respectively. In addition, Table 4, Table 5, Table 6 and Table 7 show the contribution rate of driving factors for decoupling energy consumption from economic development in each province.

3.3.1. Economic Scale and Energy Intensity

As can be seen in Figure 3, economic scale and energy intensity were the primary inhibiting and promoting factors, respectively, for decoupling energy consumption in all provinces in the Qinghai-Tibet Plateau region (except for Tibet). This shows that economic growth was inseparable from energy consumption, which is consistent with the weak decoupling of energy consumption in the Qinghai-Tibet Plateau region. Energy intensity reflected the energy consumption per unit of GDP (i.e., energy efficiency). In other words, the higher the energy intensity, the lower the energy efficiency. It can be seen in Figure 3 that the decline in energy intensity in most regions (i.e., the increase in energy efficiency) caused the decoupling index to decrease, meaning that energy intensity led to reduced energy consumption, and energy-saving technologies and clean development models achieved significant results. It can also be seen in Figure 3f and Table 4 that Tibet’s economic scale and energy intensity inhibited the decoupling of Tibet’s energy consumption from 2006 to 2013, with average contribution rates of 29.43% and 4.71%, respectively. Compared with Qinghai, Yunnan, Gansu, Sichuan and Xinjiang, the contributions of economic scale and energy intensity to decoupling were relatively small in Tibet. This is mainly due to the special climate and terrain of Tibet. Agriculture, forestry and animal husbandry account for a relatively high proportion of the economy, and economic development is slow. As a result, the demand for fossil energy is relatively small. In addition, economic scale and energy intensity have relatively small inhibitory effects on Tibet’s decoupling due to the low level of development and the poor utilization of Tibet’s resources (including the irrational production structure of agriculture and animal husbandry and the relatively imperfect integration of agriculture and animal husbandry). Tibet’s special geographical location has resulted in a scarcity of traditional energy sources such as coal and oil, and an abundance of renewable energy sources such as hydropower, solar energy, geothermal energy and wind energy. Tibet is one of the regions with the best ecological protections in China, and as the country pays more attention to sustainable development, government attaches greater importance to the development and utilization of renewable energy in Tibet as well as the improvement of its energy efficiency. While developing Tibet’s economy, China also pays attention to protecting its ecological environment. This is the reason why Tibet’s energy intensity inhibited the promotion of decoupling after 2013.

3.3.2. Investment Intensity

The rise of fixed-asset investments reflect the rapid development of regional industrialization and urbanization. Figure 3 shows that during the study period, investment intensity was the main inhibiting effect of energy consumption decoupling in provinces of the Qinghai-Tibet Plateau. It also shows that investment intensity was a key factor in the growth of total energy consumption. During the study period, the Qinghai-Tibet Plateau region’s economy was in a state of adjustment, the effect of fixed-asset investment on the economy was gradually weakened. The GDP growth rate decreased year by year, but the capital investment continuously increased, meaning that the ratio of output to input became less and less. It can be seen in Table 5 that the investment intensity effects of Gansu and Sichuan had the largest decoupling restraint on energy consumption between 2008 and 2009, reaching 653.70% and 99.20%, respectively. This was mainly caused by the 2008 financial crisis. Since the financial crisis, China’s economic operation mode has gradually shifted to an investment-driven mode. Economic growth mainly depends on financial stimulus from provincial governments, and the Qinghai-Tibet Plateau along with the country as a whole has increased investment in fixed assets to promote stable economic growth. However, as can be seen in Table 5, the contribution rate of investment intensity in Qinghai and Tibet from 2006 to 2008 was negative, meaning that investment intensity in Qinghai and Tibet from 2006 to 2008 promoted the decoupling of energy consumption and economic development. This may have been due to the weak economic foundations of Qinghai and Tibet in the early stage of the study, when priority was given to the development of new industries while industrial development was still in its initial stage. From 2008 to 2009, the contribution rate of investment intensity in Qinghai changed from −33.70% to 34.80%, while in Tibet it increased from −1.10% to 6.70%. The change indicates that with an increase of fixed-asset investments, the promotion of investment intensity towards energy consumption decoupling turned into an inhibiting effect, and this effect increased year by year. Because of the significant contribution of the investment effect on changes in energy consumption, we believe that changing the allocation of fixed-asset investments is the key to decoupling energy consumption from economic development.

3.3.3. R&D Efficiency and R&D Intensity

On the basis of current social and economic developments, R&D expenditure has greatly promoted economic development, and technological progress has also affected energy consumption. As shown in Figure 3, R&D efficiency always promoted the decoupling of energy consumption in most provinces during the study period, and only had a significant fluctuation in positive and negative contributions in the Qinghai and Gansu provinces. Table 6 shows that the inhibitory effect of R&D efficiency in Gansu Province decreased significantly from 655.60% to 45.80% during 2006–2008. This is mainly due to the fact that in 2006 the Gansu provincial government established the grand strategic goal of pursuing independent innovation and building an innovative Gansu. In 2007, Gansu province successively implemented a number of major scientific and technological innovation plans, including the “863” plan, the scientific and technological research plan, the scientific and technological support plan and other major scientific and technological projects. As Gansu province began to focus on the development of innovative research, research and development levels enabled the economic structure to be adjusted, the mode of economic growth to be changed, dependence on energy sources to be reduced and economic growth to be further promoted. R&D intensity promoted the decoupling of energy consumption in Gansu, Sichuan, Yunnan and Qinghai during the study period, although Figure 3a shows that Qinghai’s R&D intensity reversed contributions in 2008–2009 and 2010–2011. R&D intensity had a certain inhibitory effect on the decoupling of energy consumption in Xinjiang and Tibet, but its inhibitory effect gradually turned into a promoting effect in the two years following the study period. This confirms that the R&D investment in Sichuan, Yunnan and Gansu promoted economic growth during the research period, and that energy conservation and emission-reduction technologies were upgraded while the decoupling of energy consumption was promoted. The reason why R&D efficiency and R&D intensity in Gansu, Xinjiang and Tibet had opposite contributions in some years is that R&D funds were over-invested, limiting opportunities to expand production and develop the economy and ignoring the development of energy technologies. The R&D expenditures of Xinjiang and Tibet during the latter period of the research gradually changed to promote energy-saving and emission-reduction technologies. This also shows that the Qinghai-Tibet Plateau is a typical underdeveloped region, where R&D expenditure is generally used to develop the economy foremost. With improvements in environmental protection awareness, more and more investments are gradually being made into the innovation and applications of energy-saving technologies.

3.3.4. Industrial Energy Structure and Population Size

Change in industrial structure has a direct impact on the rational allocation of energy, which has an important effect on economic growth. It can be seen in Figure 3a,b that the decoupling coefficient of industrial energy in Qinghai and Yunnan was first negative then positive; in other words, the role of industrial energy in energy consumption decoupling changed from promotion to suppression. In the latter part of the study, Qinghai and Yunnan vigorously developed heavy industry with a high energy consumption. The rapid growth of industry led to an increase in energy consumption. Industrial energy consumption accounted for 72.14% and 62.50% of total industrial energy consumption, respectively, resulting in a transformation of the industrial energy structure from a promoting role to a restraining role. Figure 3c shows that the decoupling coefficient of Gansu’s industrial energy structure was negative, (i.e., Gansu’s industrial energy structure promoted energy consumption decoupling during the research period), which means that Gansu’s industrial structure adjustment achieved the initial results. However, Figure 3d–f shows that the decoupling coefficient of industrial energy structure in Xinjiang, Sichuan and Tibet was positive (i.e., the industrial energy structure inhibited the decoupling of energy consumption). Currently, Sichuan has entered a stage of accelerating industrialization and urbanization, and the secondary industry plays a dominant role in the total economic volume of Sichuan. Xinjiang and Tibet are focused on infrastructure and transportation while developing their economies. This shows that economic growth in Xinjiang, Sichuan and Tibet is strongly dependent on energy consumption. Therefore, adjusting the industrial structure and reducing production within high-energy-consuming industries is an effective way to reduce energy consumption. It can be seen in Table 7 that compared to the structure of industrial energy, population size contributes less to decoupling, and that the average contribution rate of population size in most provinces is less than 7.00%. The decoupling contribution rates of population size to energy consumption in Xinjiang and Yunnan are 10.92% and 13.06%, respectively, indicating that the favorable environment and suitable climate in Xinjiang and Yunnan are attractive to the general public. Sichuan province is a special case, as population size has an effect of restraining the decoupling of energy consumption in most provinces. Population size promoted energy consumption decoupling in Sichuan from 2006 to 2008 and from 2009 to 2013. The former was due to national policies giving priority to the development of eastern provinces, while Sichuan is located in the west and its development has been slow. Most migrant workers settle in prosperous cities and rarely return to their hometowns. One reason for this was the 2008 Wenchuan earthquake, which caused a large number of casualties and destroyed houses. People’s fear of the earthquake indirectly led to a loss of Sichuan’s population.

3.4. Decoupling Effort Analysis

The LMDI model can analyze the contribution of various factors to the decoupling of energy consumption, but it cannot objectively analyze the impact of decoupling efforts on energy consumption changes. Equation (12) shows how the LMDI factorization model removes the influence of economic factors and establishes a decoupling effort model in order to further explore the decoupling efforts of different influencing factors, with the calculation results shown in Figure 4.
As shown in Figure 4, the energy consumption decoupling effort indexes of Qinghai, Yunnan, Gansu and Sichuan from 2006 to 2016 were basically between 0–1, meaning that the four provinces were in a state of weak decoupling effort and that, while vigorously developing the economy, the provinces made only a small effort towards energy consumption decoupling. In particular, it can be seen from Figure 4e that the decoupling effort index of Sichuan was negative in 2008–2009. In other words, no effort was made to decouple economic development from energy consumption. In the rest of the period, different degrees of efforts to decouple were made, and the decoupling efforts increased year by year. The main reason for this change is that the reverse effect of investment intensity was too large on the surface, while the deeper reason is that Wenchuan, Sichuan experienced a major earthquake disaster in 2008, and the government invested a lot of manpower, financial resources and material resources into rebuild the disaster area. Presently, the decoupling effort indexes for both Xinjiang (except for 2007–2008) and Tibet are both less than 0, and both are in a state of expanding negative decoupling efforts (i.e., no decoupling efforts have been made as a whole). Therefore, in order to improve the overall decoupling of energy consumption in the Qinghai-Tibet Plateau, the government and enterprises should actively take measures to control the use of fossil energy in Xinjiang and Tibet and expand the scale of clean energy utilization.
As shown in Figure 4, energy intensity is the main factor influencing the decoupling of energy consumption in provinces other than Tibet in the Qinghai-Tibet Plateau. Energy intensity decoupling efforts have been significant, and since 2013 Tibet’s energy intensity effect has gradually led to an effective effort to decouple. This also confirms that all provinces in the Qinghai-Tibet Plateau are actively taking measures to improve energy efficiency. The decoupling effort coefficient of industrial energy structure in Qinghai, Gansu and Yunnan was positive for most years, while in Sichuan, Xinjiang and Tibet it was negative. In other words, the industrial energy structure only contributed to the decoupling of energy consumption in Qinghai, Gansu and Yunnan. This implies that Sichuan, Xinjiang and Tibet have faced greater urgency to adjust their industrial and energy structures. During the research period, the sum of R&D efficiency and R&D intensity decoupling effort indexes for each province were all positive, even if some provinces had negative R&D efficiencies or R&D intensity decoupling effort indexes for some years (i.e., no matter how the effects of R&D efficiency and R&D intensity worked in various provinces, their cumulative effects demonstrated decoupling efforts). This was the main factor that drove Xinjiang to change from the expansion of a negative decoupling effort to adopting a weak decoupling effort from 2007 to 2008. In the future, we should continue to optimize the allocation of R&D expenditures in order to achieve a win-win situation of economic growth and ecological protection. As is common, population size increased energy consumption in all provinces during the study period (except for Sichuan), and so no decoupling efforts were made.

4. Discussion

4.1. Discussion on Driving Factors of Energy Consumption Decoupling in the Qinghai-Tibet Plateau

A comparative analysis of the driving factors promoting the decoupling efforts of energy consumption and economic development from 2006 to 2016 are shown in Table 8 and Table 9, which are based on Equations (11)–(12) and showcase the decoupling degree and decoupling efforts of energy consumption and economic development in the Qinghai-Tibet Plateau.
As can be seen from Table 8, the overall degree of decoupling in the Qinghai-Tibet Plateau region was Gansu = Qinghai > Yunnan > Sichuan > Xinjiang > Tibet. That is, Gansu and Qinghai Province has the best decoupling degree of energy consumption, which shows that economic growth in Gansu and Qinghai province had the least dependence on energy consumption. This is mainly due to the promulgation of energy-saving policies for the construction industry in the pilot province of the circular economy. Gansu and Qinghai have always put energy conservation and emission reduction into action just to be able to balance environmental and resource issues while rapidly developing the economy. In addition to Tibet, economic scale is the primary restraining factor of energy consumption decoupling in the provinces of the Qinghai-Tibet Plateau region, followed by investment intensity. Population size is the most obvious and least influential inhibiting factor. Therefore, changing the mode of economic development and adjusting the allocation of fixed-asset investments are the most urgent tasks for the provinces in Qinghai-Tibet Plateau. Energy intensity is an important factor for promoting the decoupling of energy consumption in all provinces, especially Yunnan and Sichuan, on which is has the most significant impact—reaching 190% and 49.7%, respectively. R&D efficiency inhibited the decoupling of energy consumption in Gansu and Qinghai, and promoted the decoupling of energy consumption in other provinces. R&D intensity only inhibited the decoupling of energy consumption in Xinjiang, while promoted the decoupling of energy consumption in other provinces. Although the positive and negative effects of R&D efficiency and R&D intensity differ in each province, their cumulative effects all promote decoupling and are offset by the inhibitory effect of investment intensity effects, which is consistent with the results of Wang et al. Consistent [47]. Industrial energy structures hindered the decoupling of energy consumption in Xinjiang and Sichuan, and promoted the decoupling of energy consumption in Qinghai, Yunnan and Gansu. For Tibet, R&D efficiency alone promoted the decoupling of energy consumption, with a contribution rate of 20.6%, while other factors inhibited the decoupling of its energy consumption, of which the industrial energy structure was the primary inhibitor, reaching 72.8%. Therefore, accelerating the development of the tertiary industry in Tibet, actively adjusting and optimizing the industrial structure and increasing the use of clean energy are important measures to promote the decoupling of energy consumption in the Qinghai-Tibet Plateau. Table 9 shows that the decoupling effort indexes of Qinghai, Gansu, Yunnan and Sichuan were positive; that is, decoupling efforts were made and certain effects were achieved. Among them, Gansu province’s decoupling efforts were the most effective, while Xinjiang and Tibet were basically shown to be in a state of negative decoupling (i.e., no decoupling efforts were made). Of the various effects, R&D intensity contributed the most to decoupling in Gansu province, reaching 123%, and was the main factor that led Gansu to have the most effective decoupling effort. It also proves that the Gansu Provincial Government attaches great importance to reducing technology consumption. Although energy intensity and industrial energy structure contributed little to decoupling in Gansu, they also led to some decoupling efforts. Energy intensity was the biggest contributor to the decoupling efforts of Qinghai, Yunnan and Sichuan, followed by R&D efficiency and R&D intensity. The difference is that the industrial energy structure effect contributed to the decoupling of energy consumption in Qinghai and Yunnan, but did not promote the decoupling of energy consumption in Sichuan. Although Xinjiang’s R&D efficiency and energy intensity and Tibet’s R&D efficiency promoted the decoupling of energy consumption to a certain extent, the reduction in energy consumption brought by their decoupling efforts were less than the increases in energy consumption caused by other inactions, which is also the main reason why Xinjiang and Tibet are in a state of expanding negative decoupling efforts.

4.2. Policy Implications

On the basis of the above discussion, this paper further proposes policy recommendations to reduce energy consumption and promote the decoupling of energy consumption from economic development.
(1)
Transform economic development models, a policy which is consistent with the findings of Wu et al. [48]. Economic scale is a major inhibitor of energy consumption decoupling, which indicates that economic development is still heavily dependent on energy consumption. Therefore, one of the effective ways to promote decoupling is to reduce the dependence of economic growth on energy consumption and to actively promote the upgrading of the internal structures of secondary industries while encouraging the development of the tertiary industry.
(2)
The decoupling efforts made by the provinces in the Qinghai-Tibet Plateau region have been quite different. Therefore, provincial government departments should adjust measures to local conditions and respond to the 13th Five-Year Plan’s requests for energy conservation and consumption reduction. Provinces should adjust and continuously improve suitable economic development strategies for local areas, formulate reasonable policies and strengthen and perfect supervision systems.
(3)
Constantly adjust and optimize the structure of industrial energy. Reduce the proportions of industries that are based mainly on fossil fuel consumption, strictly control the expansion of production capacity in high-energy-consuming industries and implement different energy consumption policies for different industries. Increase the proportions of non-fossil fuels through tax incentives and financial incentives and promote the development and utilization of renewable energy sources. This is similar to the results of Dong et al. [49].
(4)
Pay attention to the rational allocations of fixed-asset investments and R&D expenditures. From the above discussion it can be seen that R&D expenditures are more concentrated on innovation and applications, while investment expenditures are used more frequently to expand production scales. In order to reduce energy consumption and improve energy efficiency, it is necessary to strengthen investment in energy-saving and emission-reduction technologies and to actively promote the research and development of clean energy production technologies. The expansion of investment scales is closely combined with the tasks of achieving energy conservation and consumption reduction through technological innovation, speeding up renovations and vigorously upgrading the technologies of traditional industries.

4.3. Research Limitations and Future Prospects

This paper studied the driving factors of decoupling energy consumption from economic development in the Qinghai-Tibet Plateau, but there were some deficiencies in the research process that need to be improved in the future. First, due to the difficulty in obtaining energy consumption data in the provinces of the Qinghai-Tibet Plateau, the research scope of this paper was from 2006 to 2016, a length of only 11 years. In addition, this article only analyzed the impacts of seven factors (industrial energy structure, energy intensity, R&D efficiency, R&D intensity, investment intensity, economic scale and population scale) on total energy consumption change and the effects of decoupling efforts, without digging deeper into other factors. Therefore, in future research we should strengthen the collection of data by basing the study across a longer time period, as well as by considering more influential factors such as lifestyle, transportation and cultural differences, so as to increase the scientific accuracy of the conclusions.

5. Conclusions

This article used the Tapio and LMDI models to analyze the decoupling relationship between economic development and energy consumption in the Qinghai-Tibet Plateau. It explored the influencing factors of decoupling in the Qinghai-Tibet Plateau by removing the effect of economic scale and further proposing a decoupling effort model to directly evaluate the Qinghai-Tibet Plateau decoupling effort situation. The main research conclusions are as follows:
(1)
The total energy consumption in the Qinghai-Tibet Plateau area showed a trend of first rising and then falling, and energy consumption and economic development showed a weak decoupling trend. All provinces except Tibet showed a weak decoupling state from 2006 to 2016. Qinghai and Gansu were the most decoupled provinces, while Tibet was the worst. Tibet has since gone through the transformation of expanding negative decoupling into weak linkage decoupling.
(2)
Economic scale is the primary factor preventing decoupling of energy consumption in the Qinghai-Tibet Plateau, followed by investment intensity and population size. Industrial energy structure promotes decoupling in Qinghai, Yunnan and Gansu, and inhibits decoupling in Xinjiang, Sichuan and Tibet. Energy intensity is the main driving factor, followed by R&D efficiency and R&D intensity, while the cumulative promoting effect of R&D efficiency and intensity and the inhibiting effect of investment intensity always cancel each other out.
(3)
Apart from Tibet and Xinjiang, other provinces in the Qinghai-Tibet Plateau have made efforts to decouple. R&D efficiency contributes the most to decoupling efforts, followed by energy intensity and R&D intensity. From the perspective of the various provinces, Gansu make the greatest effort towards decoupling, especially through R&D intensity. The energy intensity of decoupling effort was highest in Qinghai, Yunnan and Sichuan. Xinjiang and Tibet did not make decoupling efforts.

Author Contributions

Conceptualization, W.F. and H.W.; Data curation, M.M.; Formal analysis, M.M. and Q.Z.; Funding acquisition, H.W. and X.W.; Investigation, W.F. and M.M.; Methodology, W.F., M.M., X.D., H.W., X.W. and Q.Z.; Project administration, J.L. and X.D.; Supervision, J.L.; Visualization, W.F.; Writing—original draft, M.M.; Writing—review & editing, W.F. and J.L. All authors have read and agreed to the published version of the manuscript.

Funding

This research was funded by the Second Tibetan Plateau Scientific Expedition and Research Program (2019QZKK0608); the National Natural Science Foundation of China (41901259); the EU project “Sustainable Process Integration Laboratory—SPIL” (No. CZ.02.1.01/0.0/0.0/15_003/0000456) funded by EU “CZ Operational Programme Research, Development and Education”; and Humanities and Social Sciences Fund Project of the Ministry of Education (13yja630053).

Conflicts of Interest

The authors declare no conflict of interest.

References

  1. Li, L.; Shan, Y.; Lei, Y.; Wu, S.; Yu, X.; Lin, X.; Chen, Y. Decoupling of economic growth and emissions in China’s cities: A case study of the Central Plains urban agglomeration. Appl. Energy 2019, 244, 36–45. [Google Scholar] [CrossRef] [Green Version]
  2. Zhang, M.; Song, Y.; Su, B.; Sun, X. Decomposing the decoupling indicator between the economic growth and energy consumption in China. Energy Effic. 2015, 8, 1231–1239. [Google Scholar] [CrossRef]
  3. BP (British Petroleum Company). BP Statistical Review of World Energy. 2019. Available online: http://cngascn.com/public/uploads/file/20190805/20190805102652_80658.pdf (accessed on 10 January 2020).
  4. Xia, C.; Li, Y.; Ye, Y.; Shi, Z.; Liu, J. Decomposed Driving Factors of Carbon Emissions and Scenario Analyses of Low-Carbon Transformation in 2020 and 2030 for Zhejiang Province. Energies 2017, 10, 1747. [Google Scholar] [CrossRef] [Green Version]
  5. Diakoulaki, D.; Mandaraka, M. Decomposition analysis for assessing the progress in decoupling industrial growth from CO2 emissions in the EU manufacturing sector. Energy Econ. 2007, 29, 636–664. [Google Scholar] [CrossRef]
  6. Wang, Y.; Su, X.; Qi, L.; Shang, P.; Xu, Y. Feasibility of peaking carbon emissions of the power sector in China’s eight regions: Decomposition, decoupling, and prediction analysis. Environ. Sci. Pollut. Res. 2019, 26, 29212–29233. [Google Scholar] [CrossRef]
  7. Chandio, A.A.; Jiang, Y.; Sahito, J.G.M.; Ahmad, F. Empirical Insights into the Long-Run Linkage between Households Energy Consumption and Economic Growth: Macro-Level Empirical Evidence from Pakistan. Sustainability 2019, 11, 6291. [Google Scholar] [CrossRef] [Green Version]
  8. Udemba, E.N.; Güngör, H.; Bekun, F.V. Environmental implication of offshore economic activities in Indonesia: A dual analyses of cointegration and causality. Environ. Sci. Pollut. Res. 2019, 26, 32460–32475. [Google Scholar] [CrossRef] [PubMed]
  9. Huang, Y.; Shen, L.; Liu, H. Grey relational analysis, principal component analysis and forecasting of carbon emissions based on long short-term memory in China. J. Clean. Prod. 2019, 209, 415–423. [Google Scholar] [CrossRef]
  10. Wang, Q.; Su, M. The effects of urbanization and industrialization on decoupling economic growth from carbon emission—A case study of China. Sustain. Cities Soc. 2019, 51, 101758. [Google Scholar] [CrossRef]
  11. Chovancová, J.; Vavrek, R. Decoupling Analysis of Energy Consumption and Economic Growth of V4 Countries. Problemy Ekorozwoju Problem. Sustain. Dev. 2019, 1, 159–165. [Google Scholar]
  12. Román-Collado, R.; Cansino, J.M.; Botia, C. How far is Colombia from decoupling? Two-level decomposition analysis of energy consumption changes. Energy 2018, 148, 687–700. [Google Scholar] [CrossRef]
  13. Wang, Q.; Jiang, R.; Zhan, L. Is decoupling economic growth from fuel consumption possible in developing countries?—A comparison of China and India. J. Clean. Prod. 2019, 229, 806–817. [Google Scholar] [CrossRef]
  14. Lin, B.Q.; Wang, M. Possibilities of decoupling for China’ s energy consumption from economic growth: A temporal-spatial analysis. Energy 2019, 185, 951–960. [Google Scholar]
  15. Engo, J. Decoupling analysis of CO2 emissions from transport sector in Cameroon. Sustain. Cities Soc. 2019, 51, 101732. [Google Scholar] [CrossRef]
  16. Wang, Q.; Jiang, R. Is China’s economic growth decoupled from carbon emissions? J. Clean. Prod. 2019, 225, 1194–1208. [Google Scholar] [CrossRef]
  17. Xie, P.; Gao, S.; Sun, F. An analysis of the decoupling relationship between CO2 emission in power industry and GDP in China based on LMDI method. J. Clean. Prod. 2019, 211, 598–606. [Google Scholar] [CrossRef]
  18. Li, H.; Qin, Q. Challenges for China’s carbon emissions peaking in 2030: A decomposition and decoupling analysis. J. Clean. Prod. 2019, 207, 857–865. [Google Scholar] [CrossRef]
  19. Dong, F.; Li, J.; Wang, Y.; Zhang, X.; Zhang, S.; Zhang, S. Drivers of the decoupling indicator between the economic growth and energy-related CO2 in China: A revisit from the perspectives of decomposition and spatiotemporal heterogeneity. Sci. Total Environ. 2019, 685, 631–658. [Google Scholar] [CrossRef]
  20. Xu, Q.; Yang, R. The sequential collaborative relationship between economic growth and carbon emissions in the rapid urbanization of the Pearl River Delta. Environ. Sci. Pollut. Res. 2019, 26, 30130–30144. [Google Scholar] [CrossRef]
  21. Zhong, W.; Song, J.; Ren, J.; Yang, W.; Wang, S. Revealing the nexus among energy-economy system with Haken model: Evidence from China’s Beijing-Tianjin-Hebei region. J. Clean. Prod. 2019, 228, 319–330. [Google Scholar] [CrossRef]
  22. Wang, Z.; Yang, L. Delinking indicators on regional industry development and carbon emissions: Beijing–Tianjin–Hebei economic band case. Ecol. Indic. 2015, 48, 41–48. [Google Scholar] [CrossRef]
  23. Chen, B.; Yang, Q.; Li, J.S.; Chen, G.Q. Decoupling analysis on energy consumption, embodied GHG emissions and economic growth—The case study of Macao. Renew. Sustain. Energy Rev. 2017, 67, 662–672. [Google Scholar] [CrossRef]
  24. Shi, L.; Vause, J.; Li, Q.; Tang, L.; Zhao, J. Decoupling analysis of energy consumption and economic development in China. Energy Sour. Part B Econ. Plan. Policy 2016, 11, 788–792. [Google Scholar] [CrossRef]
  25. Wang, Q.; Wang, S. A comparison of decomposition the decoupling carbon emissions from economic growth in transport sector of selected provinces in eastern, central and western China. J. Clean. Prod. 2019, 229, 570–581. [Google Scholar] [CrossRef]
  26. Wen, L.; Zhang, Z. Probing the affecting factors and decoupling analysis of energy industrial carbon emissions in Liaoning, China. Environ. Sci. Pollut. Res. 2019, 26, 14616–14626. [Google Scholar] [CrossRef]
  27. Zheng, X.; Wang, R.; He, Q. A city-scale decomposition and decoupling analysis of carbon dioxide emissions: A case study of China. J. Clean. Prod. 2019, 238, 117824. [Google Scholar] [CrossRef]
  28. Wang, Q.; Wang, S.; Li, R. Determinants of Decoupling Economic Output from Carbon Emission in the Transport Sector: A Comparison Study of Four Municipalities in China. Int. J. Environ. Res. Public Health 2019, 16, 3729. [Google Scholar] [CrossRef] [Green Version]
  29. Karakaya, E.; Bostan, A.; Özçağ, M. Decomposition and decoupling analysis of energy-related carbon emissions in Turkey. Environ. Sci. Pollut. Res. 2019, 26, 32080–32091. [Google Scholar] [CrossRef]
  30. Li, J.; Chen, Y.; Li, Z.; Huang, X. Low-carbon economic development in Central Asia based on LMDI decomposition and comparative decoupling analyses. J. Arid Land 2019, 11, 513–524. [Google Scholar] [CrossRef] [Green Version]
  31. Wang, R.; Zheng, X.; Wang, H.; Shan, Y. Emission drivers of cities at different industrialization phases in China. J. Environ. Manag. 2019, 250, 109494. [Google Scholar] [CrossRef]
  32. Song, Y.; Zhang, M.; Shan, C. Research on the decoupling trend and mitigation potential of CO2 emissions from China’s transport sector. Energy 2019, 183, 837–843. [Google Scholar] [CrossRef]
  33. Ang, B.W. Decomposition analysis for policy making in energy. Energy Policy 2004, 32, 1131–1139. [Google Scholar] [CrossRef]
  34. Dong, F.; Li, J.; Zhang, S.; Wang, Y.; Sun, Z. Sensitivity analysis and spatial-temporal heterogeneity of CO2 emission intensity: Evidence from China. Resour. Conserv. Recycl. 2019, 150, 104398. [Google Scholar] [CrossRef]
  35. Ang, B.W. LMDI decomposition approach: A guide for implementation. Energy Policy 2015, 86, 233–238. [Google Scholar] [CrossRef]
  36. Ang, B.W.; Zhang, F.Q.; Choi, K. Factorizing changes in energy and environmental indicators through decomposition. Energy 1998, 23, 489–495. [Google Scholar] [CrossRef]
  37. Zhao, X.; Zhang, X.; Shao, S. Decoupling CO2 emissions and industrial growth in China over 1993–2013: The role of investment. Energy Econ. 2016, 60, 275–292. [Google Scholar] [CrossRef]
  38. Cicea, C.; Marinescu, C.; Popa, I.; Dobrin, C. Environmental efficiency of investments in renewable energy: Comparative analysis at macroeconomic level. Renew. Sustain. Energy Rev. 2014, 30, 555–564. [Google Scholar] [CrossRef]
  39. Chen, L.; Xu, L.; Xu, Q.; Yang, Z. Optimization of urban industrial structure under the low-carbon goal and the water constraints: A case in Dalian, China. J. Clean. Prod. 2016, 114, 323–333. [Google Scholar] [CrossRef]
  40. Organization for Economic Co-Operation and Development (OECD). Indicators to Measure Decoupling of Environmental Pressures from Economic Growth; Organization for Economic Co-Operation and Development (OECD): Paris, France, 2002. [Google Scholar]
  41. Tapio, P. Towards a theory of decoupling: Degrees of decoupling in the EU and the case of road traffic in Finland between 1970 and 2001. Transp. Policy 2005, 12, 137–151. [Google Scholar] [CrossRef] [Green Version]
  42. Wang, X.; Wei, Y.; Shao, Q. Decomposing the decoupling of CO2 emissions and economic growth in China’s iron and steel industry. Resour. Conserv. Recycl. 2020, 152, 104509. [Google Scholar] [CrossRef]
  43. Li, Y.; Cai, M.; Wu, K.; Wei, J. Decoupling analysis of carbon emission from construction land in Shanghai. J. Clean. Prod. 2019, 210, 25–34. [Google Scholar] [CrossRef]
  44. National Bureau of Statistics (NBS). China Statistical Yearbook 2007–2017; China Statistics Press: Beijing, China, 2018.
  45. China Science and Technology Statistics (CSTC). Bulletin of Science and Technology Statistics, 2006–2016; China Statistics Press: Beijing, China, 2018.
  46. National Energy Administration (NEA). China Energy Statistical Yearbook 2007–2017; China Statistics Press: Beijing, China, 2018.
  47. Wang, Q.; Wang, S. Decoupling economic growth from carbon emissions growth in the United States: The role of research and development. J. Clean. Prod. 2019, 234, 702–713. [Google Scholar] [CrossRef]
  48. Wu, Y.; Zhu, Q.; Zhu, B. Comparisons of decoupling trends of global economic growth and energy consumption between developed and developing countries. Energy Policy 2018, 116, 30–38. [Google Scholar] [CrossRef]
  49. Dong, B.; Zhang, M.; Mu, H.; Su, X. Study on decoupling analysis between energy consumption and economic growth in Liaoning Province. Energy Policy 2016, 97, 414–420. [Google Scholar] [CrossRef]
Figure 1. Energy consumption and GDP of the Qinghai-Tibet Plateau.
Sustainability 12 01326 g001
Figure 2. Decoupling trend of energy consumption in the Qinghai-Tibet Plateau.
Sustainability 12 01326 g002
Figure 3. Analysis of driving factors for decoupling in the provinces of the Qinghai-Tibet Plateau.
Sustainability 12 01326 g003
Figure 4. Decoupling effort index of provinces in the Qinghai-Tibet Plateau.
Sustainability 12 01326 g004
Table 1. A summary of the existing research for the decoupling of energy consumption.
Research AreaStudiesMethodsDecomposed Factors
National level energy consumptionRocio [12]
Lin et al. [14]
LMDI and Tapio indexPopulation, activity [12], energy structure, energy intensity, economic structure [14], spatial structure [14], investment efficiency [14], per capita fixed-asset investment [14]
Wang et al. [13]Cobb Douglas(C-D) production function, LMDI and Tapio indexEnergy structure, energy intensity, technology state, labor input, investment
National level CO2 emissionsEngo et al. [15] Xie et al. [17] Etem et al. [29] Li et al. [30]
Yan et al. [32]
LMDI and Tapio indexEnergy structure, energy intensity, economic structure, population economic activity [15,30], transmission and distribution loss [17] electrification [17], carbon intensity [29], fossil fuel intensity [29], conversion efficiency [29], carbon coefficient [32], fossil energy share [32], energy efficiency [32], transport activity [32]
Wang et al. [16]C-D production function, LMDI and Tapio indexLabor input, investment, carbon coefficient, energy structure, energy intensity, economic structure, technology state
Li et al. [18] LMDI and decoupling indexEmission coefficient, energy intensity, industrial structure, economy growth
Dong et al. [19]Tapio model and Geographically Temporally Weighted Regression (GTWR)Energy structure, energy intensity, economic structure, technological progress, capital, proportion of labor force, population, export trade
Regional CO2 emissionsXu et al. [20]Cointegration analysis, Vector autoregressive model (VAR) and OECD decoupling Carbon emission intensity, proportion of urban built-up land, land area occupied by per unit GDP, per capita GDP, population
Wang et al. [22,25,28,31]
Wen et al. [26]
LMDI and decoupling indexEnergy emission intensity, energy structural, energy intensity, economic structure, economic output, population, energy technology [26], investment structure [26], investment dependence [26], emission reduction [28], energy saving [28], transport share [28]
Shi et al. [24]Decoupling indexPer capita GDP, energy intensity, per capita carbon
Zheng et al. [27]LMDI and OECD decoupling modelCarbon emission coefficient, population energy structure, industrial structure, energy intensity, economic growth
Table 2. Different types of decoupling elasticity coefficients.
△E△YDDecoupling State
△E < 0△Y > 0D < 0Strong decoupling
△E > 0△Y > 00 ≤ D < 0.8Weak decoupling
△E > 0△Y > 00.8 ≤ D ≤ 1.2Expansion link
△E > 0△Y > 0D > 1.2Expanding negative decoupling
△E > 0△Y < 0D < 0Strong negative decoupling
△E < 0△Y < 00 ≤ D < 0.8Weak negative decoupling
△E < 0△Y < 00.8 ≤ D ≤ 1.2Declining link
△E < 0△Y < 0D > 1.2Recession decoupling
Table 3. Index of difference decoupling efforts.
△Q α Decoupling EffortSerial Number
Q > 0 α 1 Strong decoupling effortI
Q > 0 0 < α < 1 Weak decoupling effortII
Q > 0 α 0 Expand negative decoupling effortIII
Q < 0 α 1 Strong negative decoupling effortIV
Q < 0 0 < α < 1 Weak negative decoupling effortV
Q < 0 α 0 Recession decoupling effortVI
Table 4. Contribution rate of economic scale and energy intensity of each province.
QinghaiYunnanGansuXinjiangSichuanTibet
DQDHDQDHDQDHDQDHDQDHDQDH
2006–20072.151−0.3663.202−1.94010.366−3.1500.983−0.4401.424−0.3140.0820.007
2007–20081.193−0.1063.669−2.6664.348−2.7941.112−0.6011.058−0.4050.1850.043
2008–20091.238−0.0732.096−1.2085.090−3.7230.691−0.1280.966−0.2340.2280.167
2009–20102.150−0.6812.335−1.3564.124−2.7360.819−0.2321.246−0.4680.3260.026
2010–20111.668−0.2672.623−1.6414.015−2.3330.777−0.1831.169−0.4370.3390.034
2011–20121.553−0.2092.401−1.4122.936−1.7770.735−0.1471.264−0.4990.4050.020
2012–20131.140−0.1032.890−1.8703.110−1.8380.694−0.1101.440−0.6530.5010.026
2013–20141.611−0.4223.152−2.4462.983−1.8430.698−0.1101.497−0.6520.475−0.197
2014–20151.062−0.4093.854−3.3623.114−2.0300.661−0.0961.648−0.9140.364−0.136
2015–20161.360−0.5253.448−3.0103.588−2.4820.628−0.0791.725−0.9880.374−0.154
Table 5. Contribution rate of investment intensity of each province.
QinghaiYunnanGansuXinjiangSichuanTibet
2006–2007−0.6390.9944.5640.1950.471−0.002
2007–2008−0.3371.1162.8080.2010.394−0.011
2008–20090.3481.4036.5370.4830.9920.067
2009–20100.6351.3234.5790.3220.7620.094
2010–20110.5260.7773.4020.3510.4280.040
2011–20120.6910.8302.4010.4300.4580.095
2012–20130.5731.1522.6150.4390.5350.168
2013–20140.9071.3092.6140.4770.5590.175
2014–20150.6371.8553.0720.5430.6500.156
2015–20160.8001.8373.4990.4490.6670.175
Table 6. Contribution rates of R&D efficiency and R&D intensity in each province.
QinghaiYunnanGansuXinjiangSichuanTibet
DTDNDTDNDTDNDTDNDTDNDTDN
2006–20070.739−0.099−0.669−0.3266.556−11.120−0.2010.006−0.462−0.009−0.1020.104
2007–20080.780−0.443−0.599−0.5170.458−3.266−1.3261.125−0.105−0.289−0.3290.340
2008–2009−0.8330.485−0.717−0.686−0.751−5.786−1.3680.885−0.410−0.582−0.4260.359
2009–2010−0.608−0.027−0.641−0.6860.142−4.720−0.9050.582−0.439−0.323−0.3550.261
2010–2011−0.7290.203−0.646−0.1310.359−3.761−0.6650.313−0.161−0.266−0.0770.036
2011–2012−0.475−0.216−0.646−0.184−0.127−2.274−0.5920.162−0.211−0.247−0.2030.108
2012–2013−0.249−0.324−0.702−0.451−0.082−2.533−0.5020.063−0.253−0.281−0.2720.103
2013–2014−0.272−0.636−0.675−0.634−0.242−2.372−0.450-0.027−0.291−0.268−0.1920.017
2014–20150.052−0.689−1.372−0.483−0.491−2.581−0.464−0.079−0.386−0.264−0.1890.032
2015–2016−0.071−0.729−1.474−0.363−0.518−2.981−0.4600.010−0.402−0.264−0.038−0.137
Table 7. Contribution rate of industrial energy structure and population scale in each province.
QinghaiYunnanGansuXinjiangSichuanTibet
DFDUDFDUDFDUDFDUDFDUDFDU
2006–2007−0.8650.080−0.3940.132−6.2500.0340.2510.206−0.071−0.0380.9020.008
2007–2008−0.1200.033−0.1420.139−0.5750.0210.3290.1590.358−0.0100.7590.014
2008–2009−0.2100.0450.0130.099−0.4080.0420.3200.1170.2650.0040.5800.024
2009–2010−0.5580.090−0.0880.109−0.4260.0380.3140.0990.250−0.0290.6140.033
2010–2011−0.4690.068−0.0950.113−0.7190.0360.3220.0850.287−0.0190.5950.031
2011–2012−0.4140.070−0.0920.103−0.2000.0410.3330.0790.249−0.0140.5370.039
2012–2013−0.0920.055−0.1440.124−0.3150.0430.3410.0760.222−0.0100.4250.048
2013–2014−0.2750.0860.1570.138−0.1880.0470.3320.0800.1590.0040.5730.049
2014–20150.2850.0620.3280.180−0.1430.0590.3410.0940.2610.0050.7310.041
2015–20160.0800.0850.3930.169−0.1830.0770.3550.0970.2490.0140.7350.045
Table 8. Decoupling index of driving factors of energy consumption in the Qinghai-Tibet Plateau.
ProvincesDFDHDTDNDSDQDUD
Qinghai−0.047−0.1810.014−0.2770.2630.3020.0030.076
Yunnan−0.005−0.230−0.092−0.0550.1470.3420.0150.121
Gansu−0.047−0.1810.014−0.2770.2630.3020.0030.076
Xinjiang0.130−0.078−0.2760.1160.1600.3050.0420.399
Sichuan0.074−0.161−0.098−0.0960.1940.414−0.0040.324
Tibet0.4130.004−0.1170.0840.0330.1360.0140.567
Table 9. Decoupling effort index of driving factors of Tibetan Plateau energy consumption.
Provinces α F α H α T α N α S α U α Number
Qinghai0.1400.2050.1090.192−0.301−0.0450.301II
Yunnan0.0070.6870.2740.158−0.432−0.0440.650II
Gansu0.1430.608−0.0260.909−0.883−0.0120.739II
Xinjiang−0.4310.2480.895−0.358−0.536−0.138−0.321III
Sichuan−0.177 0.401 0.234 0.225 −0.460 0.008 0.232II
Tibet−2.862−0.0340.827−0.582−0.245−0.100−2.997III

