Article

Does Education Background Affect Digital Equal Opportunity and the Political Participation of Sustainable Digital Citizens? A Taiwan Case

1
Department of Education, National Chiayi University, Jiayi 60004, Taiwan
2
Department of Public Affairs and Civic Education, National Changhua University of Education, Zhanghua 500914, Taiwan
3
Department of Sociology, The University of Hong Kong, Hong Kong, China
4
Department of Educational Administration and Policy, The Chinese University of Hong Kong, Hong Kong, China
*
Author to whom correspondence should be addressed.
Sustainability 2020, 12(4), 1359; https://0-doi-org.brum.beds.ac.uk/10.3390/su12041359
Submission received: 29 December 2019 / Revised: 3 February 2020 / Accepted: 10 February 2020 / Published: 13 February 2020
(This article belongs to the Special Issue Educational Policy for Sustainable Development)

Abstract

:
The purpose of this article is to examine the level of digital equity and political participation in Taiwan. In this study, we argue that high digital literacy and active civic participation facilitate the formation of sustainable digital citizenship. We review the development of digital education policy in Taiwan since the 1990s. Based on the nationwide survey dataset prepared by Taiwan’s National Development Council in 2018, we examine the relations between digital literacy, digital social life, the digitalized acquisition of government information, and the political participation of digital citizens. We adopt a structural equation modeling approach and perform the multi-group analysis to validate our proposed model of digital equal opportunity. The results show that there are significantly positive relations between the four digital latent variables, but no statistically significant differences between interviewees with high and low education backgrounds in the relations with these variables. In addition, our findings reveal that the digital social life of digital citizens indirectly affects their political participation through their digitalized acquisition of government information. This paper also discusses the implications of digital education policy and the formation of sustainable digital citizenship.

1. Introduction

For the past twenty years, there has been a renewed interest in digital adoption. Recent trends in ‘digital divided’ have led to a proliferation of studies that reminds government authorities to pay close attention to the invisible gap between urban and rural areas. In the field of education, in particular, government authorities have promoted digital literacy and digital pedagogy, thereby incorporating information and communication technology (ICT) and digital use into teaching and learning. In a broad sense, the aim of digital learning is to prepare students to become digital citizens. However, the potential mechanisms behind this process are not fully understood at the school and the post-school stages.
In response to the growing trend of digitalization, the Taiwanese government has advocated the notion of digital opportunity when formulating digital policy. It has also conducted a series of annual digital opportunity surveys since 2011. In the present study, we constructed a model of digital opportunity based upon relevant research, and then examined the appropriateness between secondary nationwide survey data and the proposed model. In quantitative terms, we argued the correlations between digital literacy (DL), digital social life (DSL), the digitalized acquisition of government information (AGI), and the political participation of digital citizens (DC). To test the robustness of the proposed model, we focused on interviewees with higher and lower education backgrounds in the multi-group analysis. Then, we compared their relationships with latent variables and the structural paths of digital opportunity.

2. Reviewing the Trajectory of Digital Education Policy in Taiwan

The Ministry of Education (MOE) of Taiwan actively promotes ICT education at all levels of schools, so as to raise public awareness of ICT, improve citizens’ technology proficiency, and enhance national ICT development. It is hoped that the use of ICT will lead to better teaching quality and equal education opportunity, while fulfilling the mandates of “teaching according to students’ aptitude” and “lifelong learning”. In this paper, we have reviewed and discussed two directions of the digital education policy in Taiwan over the past thirty years.

2.1. How Taiwan Has Helped Bridge the Digital Divide in Education

As a country well-known for its information education and information infrastructure, Taiwan has started the building of the nationwide Taiwan Academic Network (TANet) in 1980, and the service has been extended from tertiary education to primary and secondary education. In the meantime, the Ministry of Education promoted and pushed forward several projects that brought up a considerable number of information technology talents, including “Improving E-teaching at All Level of Schools” [1], “Computer-Assisted Teaching and the Promotion of the Use” [2], “Information and Communication Technology (ICT) Education” [3], “Mid-term Development Plan on the Talent Cultivation for the National Information Infrastructure (NII)” [4], “Medium-term Plan for Distance Learning”, and “Social Education Networking” [5]. In 1995, the MOE set a criterion for computer courses, requiring students in their second and third academic years to attend at least one course each week. In 1998, computer studies became compulsory for all junior high school students in Taiwan. In the following year, the MOE proceeded with an initiative named “Increasing Domestic Demand: Building E-Teaching Environment in Elementary and Secondary Schools” [6]. The objective of which was to equip all schools with interconnected computer classrooms. In 2003, the National Science Council promoted the “Taiwan e-Learning and Digital Archives Program” [7] as an official attempt to narrow the digital divide. In 2005, with the establishment, operation, and guidance of the Digital Opportunity Center, as well as the resources from, amongst others, undergraduate e-service volunteers and the private sectors, information use and digital learning became more accessible to remote and isolated areas. This was under the MOE’s “Program to Create Digital Opportunities in Remote Areas” [8], which was a part of the policy of the Executive Yuan (i.e., the executive branch of Taiwan government) on narrowing the digital divide. In 2006, the National Security Council published “E-learning in Taiwan, 2005–2006” [9] for the strategic planning on national digitalization through the Institute for Information Industry. The MOE issued the “2008–2011 White Paper on Information Education at the Elementary and Secondary School Levels” [10] in 2008. Then, it promoted “Environment Creating for Quality Digital Education in Primary and Secondary Schools” [11] in 2009 to equip schools at all levels with e-specialized classrooms, digital classrooms, and the mechanism for protecting information and communication security. In addition, it started to implement “Promoting Education on Cloud Computing and Platform Service” [12] in 2012, and finished developing “Broadening the Bandwidth of Backbone Internet for Education and Research Purpose” in 2016 to improve bandwidth and serve a large number of online users simultaneously. From 2016 and 2019, it pushed forward the 4th phase of the “Digital Application Promotion Project in Remote Areas” [13], where both the private and public sectors devoted efforts to support ethnic minorities (immigrants, aborigines, women, the elderly, etc.) in digital applications and mobile service, consensus formation for communities, and digital marketing of local characteristics. Through which, digital access of socially disadvantaged people and digital equal opportunity between urban and rural areas became possible.

2.2. Fostering Digital Competence Development at All Levels of School

The “Overall Blueprint of Information Education in Elementary and Junior High Schools” [14] was promulgated in 2001 to facilitate instructional activities with innovations in information-integrated teaching. Aimed at “setting up an online education system for all”, the government implemented “Challenge 2008: National Development Focal Project” [15] in 2002, where it took supplementary measures to “narrow the digital gap between elementary and junior high schools in the cities and those in the countryside” by requiring and enabling wireless Internet access at all schools. In 2017, the government implemented the “Foresight Foundation Project—Digital Foundation”. Under which, it carried out the “Project of Establishing Campus Intelligent Websites” [16] in elementary and junior high schools and the “Project of Strengthening Digital Teaching, Learning and Information Application Environment” to promote digital campus and intelligent learning, thereby enhancing information integration into e-learning and learning applications in various fields. Expected to operate until the end of 2020, these projects put information education and course instruction in Taiwan on the path to overall digitalization and better digital competence. Centering on the ideas of information technology optimization, digital resources sharing, and digital opportunities, the “White Paper on Information Education in Elementary and Junior High Schools” [17] in 2008 helped enrich the content of digital learning, strengthen information competence for teachers and students, and establish a mechanism guarding against inappropriate online content. Apart from that, it also set out a code of behavior applied to the online environment and improved digital literacy. Launched in 2008, the “Digital Education and Internet Learning Project” [18] was developed as the sixth initiative of the “Digital Collection and Digital Learning National Technology Project”, which promoted information integration in digital teaching materials, encouraged intercollegiate collaboration on digital learning courses, and internationalized digital education in Taiwan.

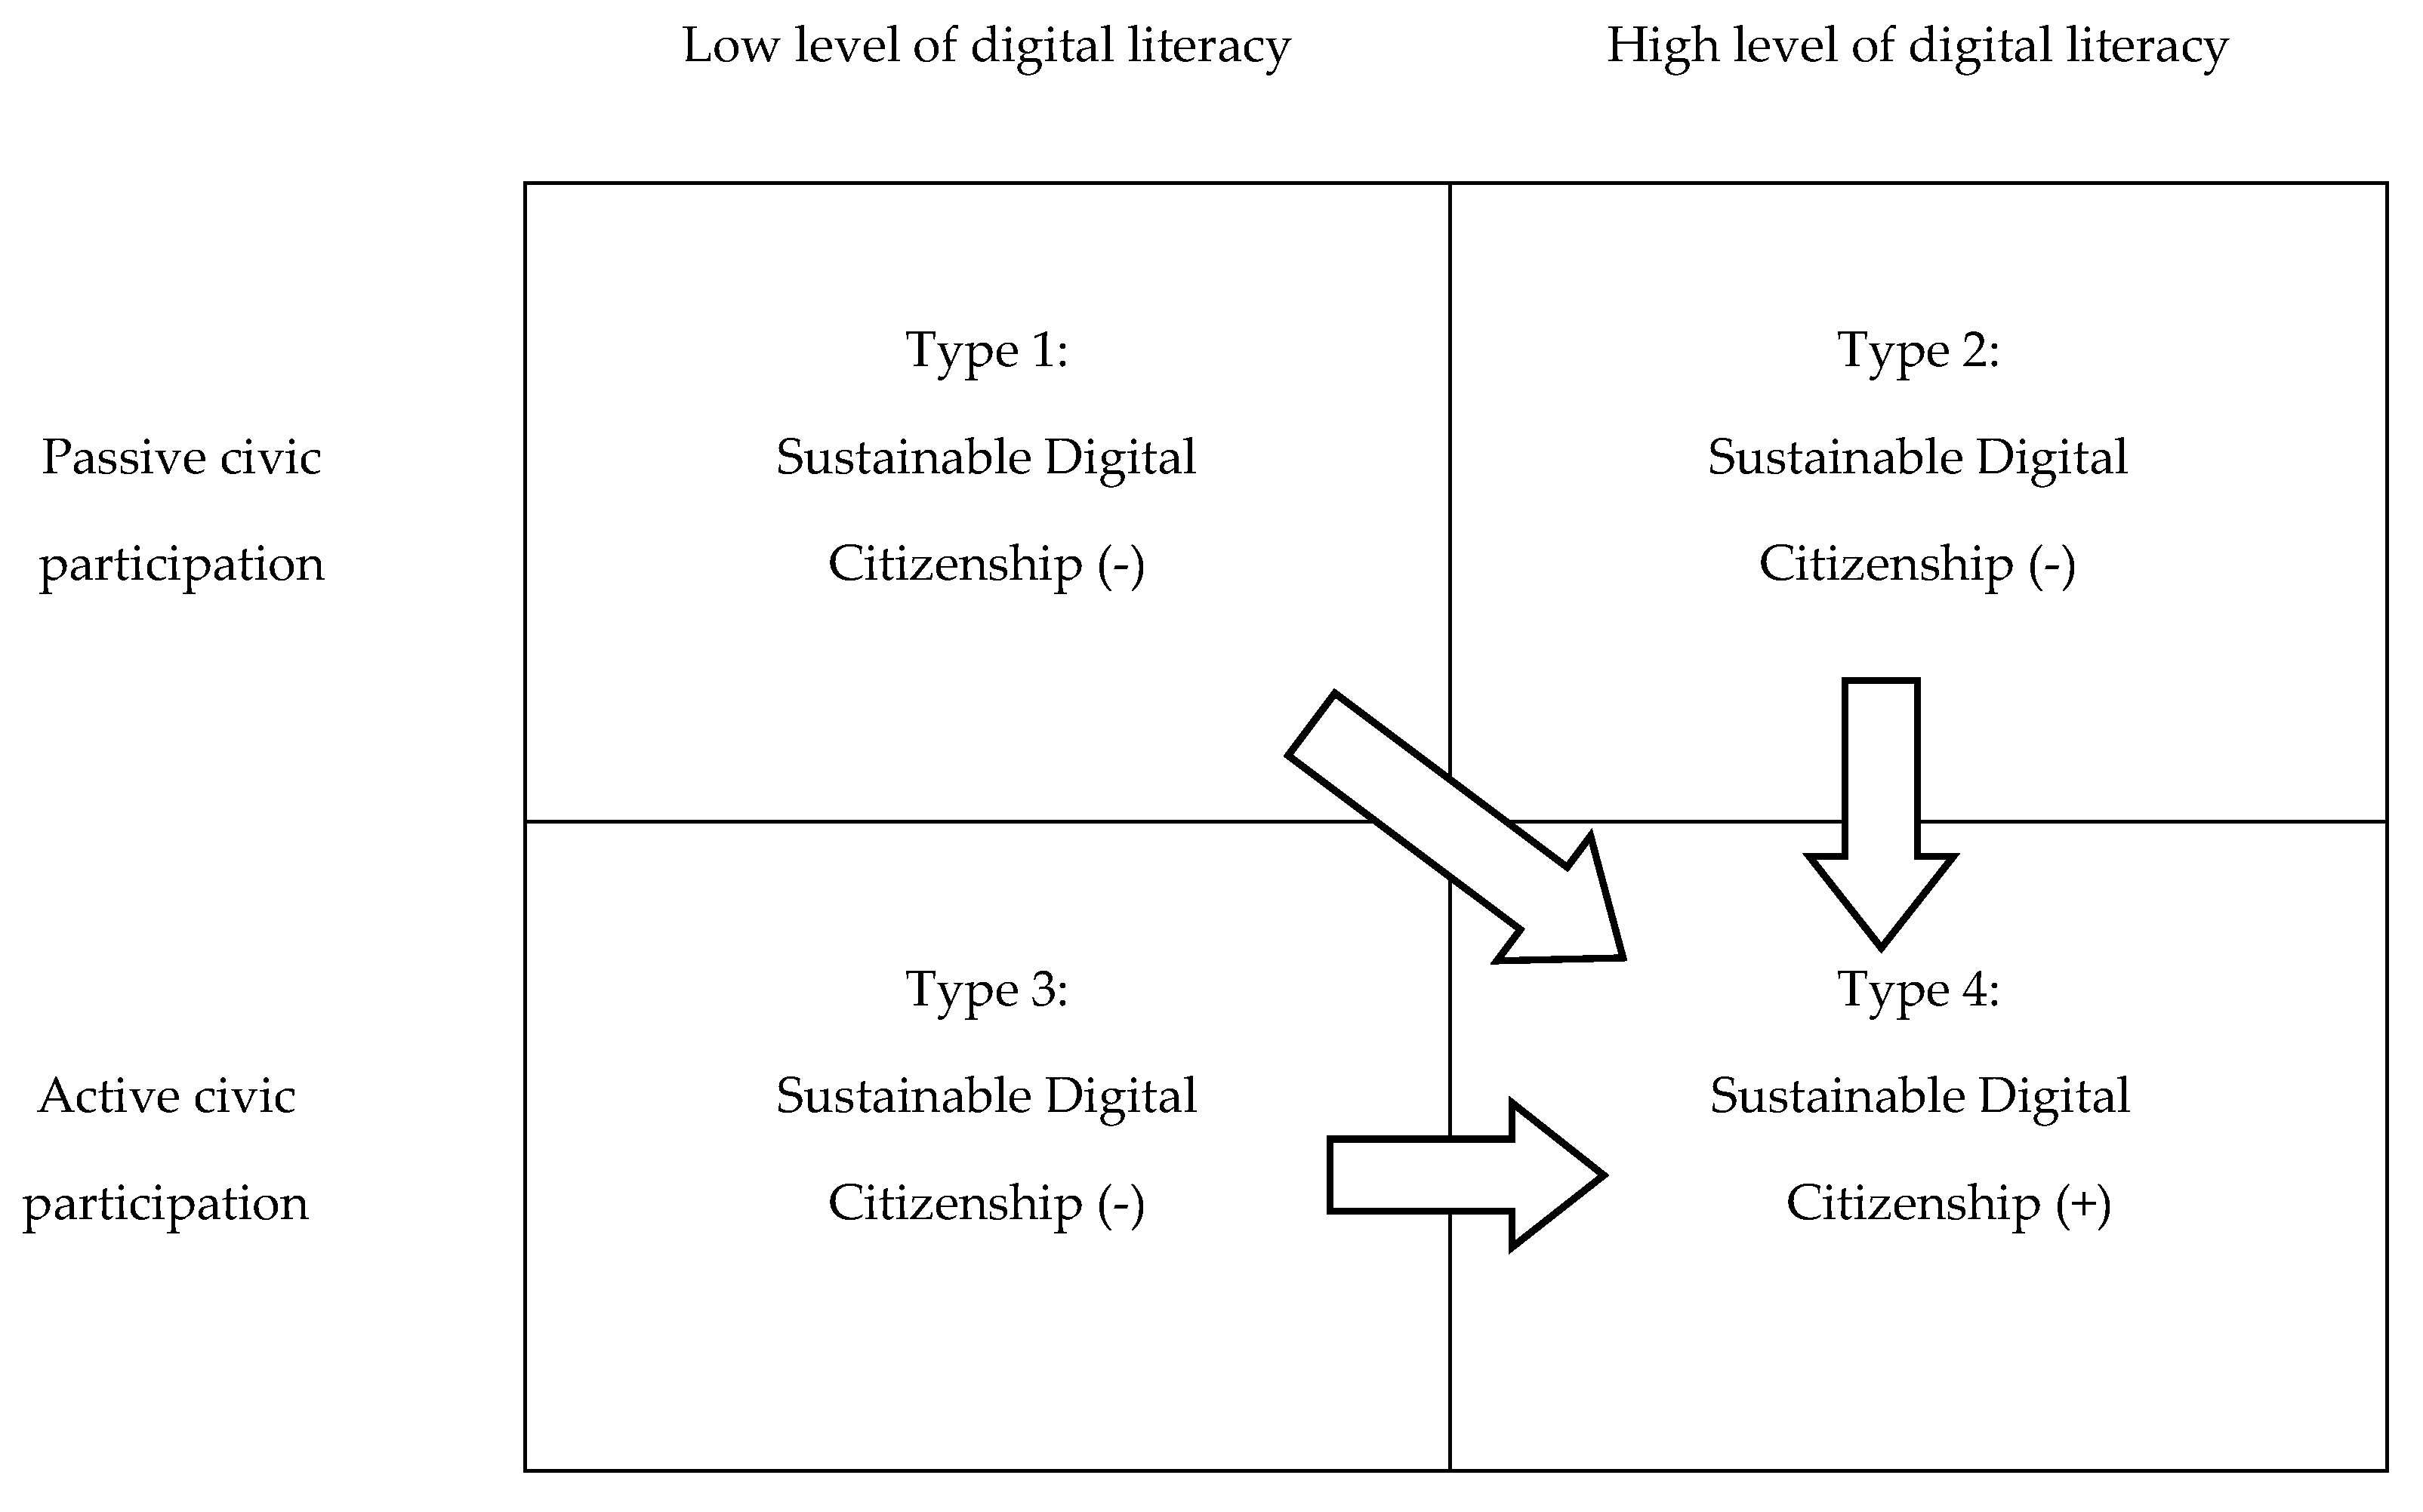
3. Conceptual Framework for Sustainable Development and Digital Citizenship

Digital equal opportunity has always been an important issue in sustainable development. Studies have shown that it can have extensive impacts on all aspects of human life, such as our medical care, education, political participation, economic structure, and social life. Besides, it can bring about major changes to individuals’ lifestyles. Many OECD studies have pointed out that digitalization not only significantly changed people’s way of accessing information, but also their digital behavior. Furthermore, research shows that those with digital literacy have a more competitive advantage in today’s society [19]. Scholars have proposed that digital literacy and computer networks can foster the concept of digital rights and help achieve social equality [20,21,22,23,24,25,26,27], allowing citizens to participate in public domain and enhancing the sustainable development of society [23,28].
There are many reasons for the digital divide. Factors of gender, urban-rural gap, economic conditions, education, ethnicity, and cultural differences are some of the possible causes. Most of these can be resolved through public policy or government measures [29,30,31,32,33,34], such as digital education policies. On the other hand, rising Internet penetration and the widespread use of smartphones have also contributed to the reduction of the digital divide. When people have better digital access, they can obtain information for political and economic actions at a cheaper cost and faster rate. Thus, digital equal opportunities can promote the development of economic and political markets, and in turn, facilitate sustainable human development.
The digital divide between developing countries and developed ones and its implications remain an important topic. Jeffrey [35] points out that there is a positive correlation between the number of Internet users and the national income level in developing countries. One prominent example is China, where the lack of Internet resources among the rural population hindered local economic development and, in turn, widened the rural-urban gap. Exploring the digital divide between different ethnic groups in Malaysian society, Rahim [36] indicates that ethnic status, Internet use, and the pattern of citizen engagement are in positive correlation, and that the more experienced one is in Internet use and the more time one spends on it, the higher the degree of citizen engagement. Information and telecommunication technology offers younger generations the opportunity of active citizen participation, and this is likely to result in better understandings of civil rights and responsibilities, and in bridging the gap between ethnic groups. The level of digital literacy is positively related to, amongst others, the abundance of computer equipment and Internet facilities, the length of education courses, and the adequacy of digital teachers. Digital literacy has also become a crucial link to specific practices in society, politics, economy, culture, and education [37]. The present study aims to inquire whether the level of digital literacy affects citizen participation. We discovered that the notion of digital literacy began to emerge in the 1990s. Prior to that, citizen participation in many advanced democracies had already reached a mature period. We also found that civic participation was not too common in some emerging democracies or developing countries. Therefore, we proceeded to investigate whether the popularity of smartphones and/or increased digital literacy would lead to a higher degree of civic participation.
Previous studies found that many developing countries suffer from insufficient digital literacy due to digital divide and local citizen participation. For example, in Africa and Latin America, the digital divide and the monopoly of digital technology by elites often result in unequal citizen participation, which hinders sustainable digital development [23,38,39]. Many scholars have warned that the concentration of digital technology and media resources among an elite few is detrimental to citizen participation [28,40,41,42,43]. Meanwhile, other studies have also shown that reducing digital divide and increasing digital literacy boosted local citizen participation in some countries [44]. For example, the dissemination of mobile phone messages has sparked many protests and large-scale social movements in China, contrary to democratic countries with a high degree of civic participation, such as Taiwan. In view of this, the present study also examines if higher digital literacy increases civic participation.
Social capital can be viewed as a brand new issue on and a challenge to network society amid the digital age. The earliest studies on social capital took the perspective of community and local governance. Putnam first defines social capital as what characterizes the social structure, such as “trust”, “norm”, and “network” which facilitate social efficiency through action coordination [45]. His argument [46] adds that social capital is the connection between individuals, i.e., the social network within which the norm of reciprocity and trust is thereof shaped. Abundant social capital does not necessarily exist in a society consisting of separated individuals despite their great virtue. Besides, Putnam [46] critically views social capital as a precondition for a society that works well because it promotes proactive collaboration. This shows that trust, or the mutualistic relationships serving as an essential nature in the norm of social networks, comes into being from norms of reciprocity and citizen engagement in the networks. Broadening the application of social capital, Putnam’s research, which is obviously based on a macroscopic angle, initiates a new aspect for relevant studies. It is of special significance in the digital age, when there is much research on social capital matters due to developed digital technology. Mandarano, Meenar, and Steins [47] are the pioneers in the studies on whether network engagement and traditional forms of citizen engagement differ. They argue that such factors as digital education and the popularity of digital technology affect citizen engagement in the digital age, and that the difference between digital forms and traditional forms of political participation lies in the established social capital that appears more widespread than before, that is, the network of relationships, trust, and social norms. Therefore, the idea of digital social capital is meant to be the use of digital technology that increases social capital and citizen engagement. It has been made possible because the access to the Internet improves information transparency, facilitates interpersonal interaction and data acquisition, makes multitudinous engagement among citizens much easier, and consequently expands citizen engagement.
In this paper, we have argued that digital equal opportunities and digital literacy are closely linked with education. At the same time, the popularity of smartphones and network equipment makes it easier for everyone to obtain information, hence it is an important factor in enhancing citizen participation. Citizens with a high degree of civic participation concern more about various social issues, for example, the environment, social welfare, race issues, and human rights. Such awareness can promote social progress and has a positive impact on sustainable development. Given that sustainable development is about more than digital technologies, but also the integration of digital infrastructure, practical application, and digital literacy [48], we assumed that the high level of digital literacy and active civic participation were conducive to the formation of sustainable digital citizenship (+). Otherwise, Type 1 illustrates that citizens with low digital literacy and passive civic participation have difficulty achieving sustainable digital citizenship (−). In particular, Type 2 and Type 3, depending on different countries’ social and political development, can be seen as a process of transition from weak (−) sustainable digital citizenship (Type 1) to robust (+) sustainable digital citizenship (Type 4) (see Figure 1). To be specific, Type 1 denotes countries with deprived civil rights and limited access to digital use (such as North Korea). Type 2 seems to appear in authoritative semi-democratic countries that control citizen’s civil rights (such as Singapore). Type 3 exists in some countries with restricted information and Internet usage, but are full of democratic aspirations (such as Middle East and North Africa countries). Type 4 can be seen as an ideal civil society with high level of digital literacy and active civic participation for the development of sustainable digital citizenship (such as North American and European countries).

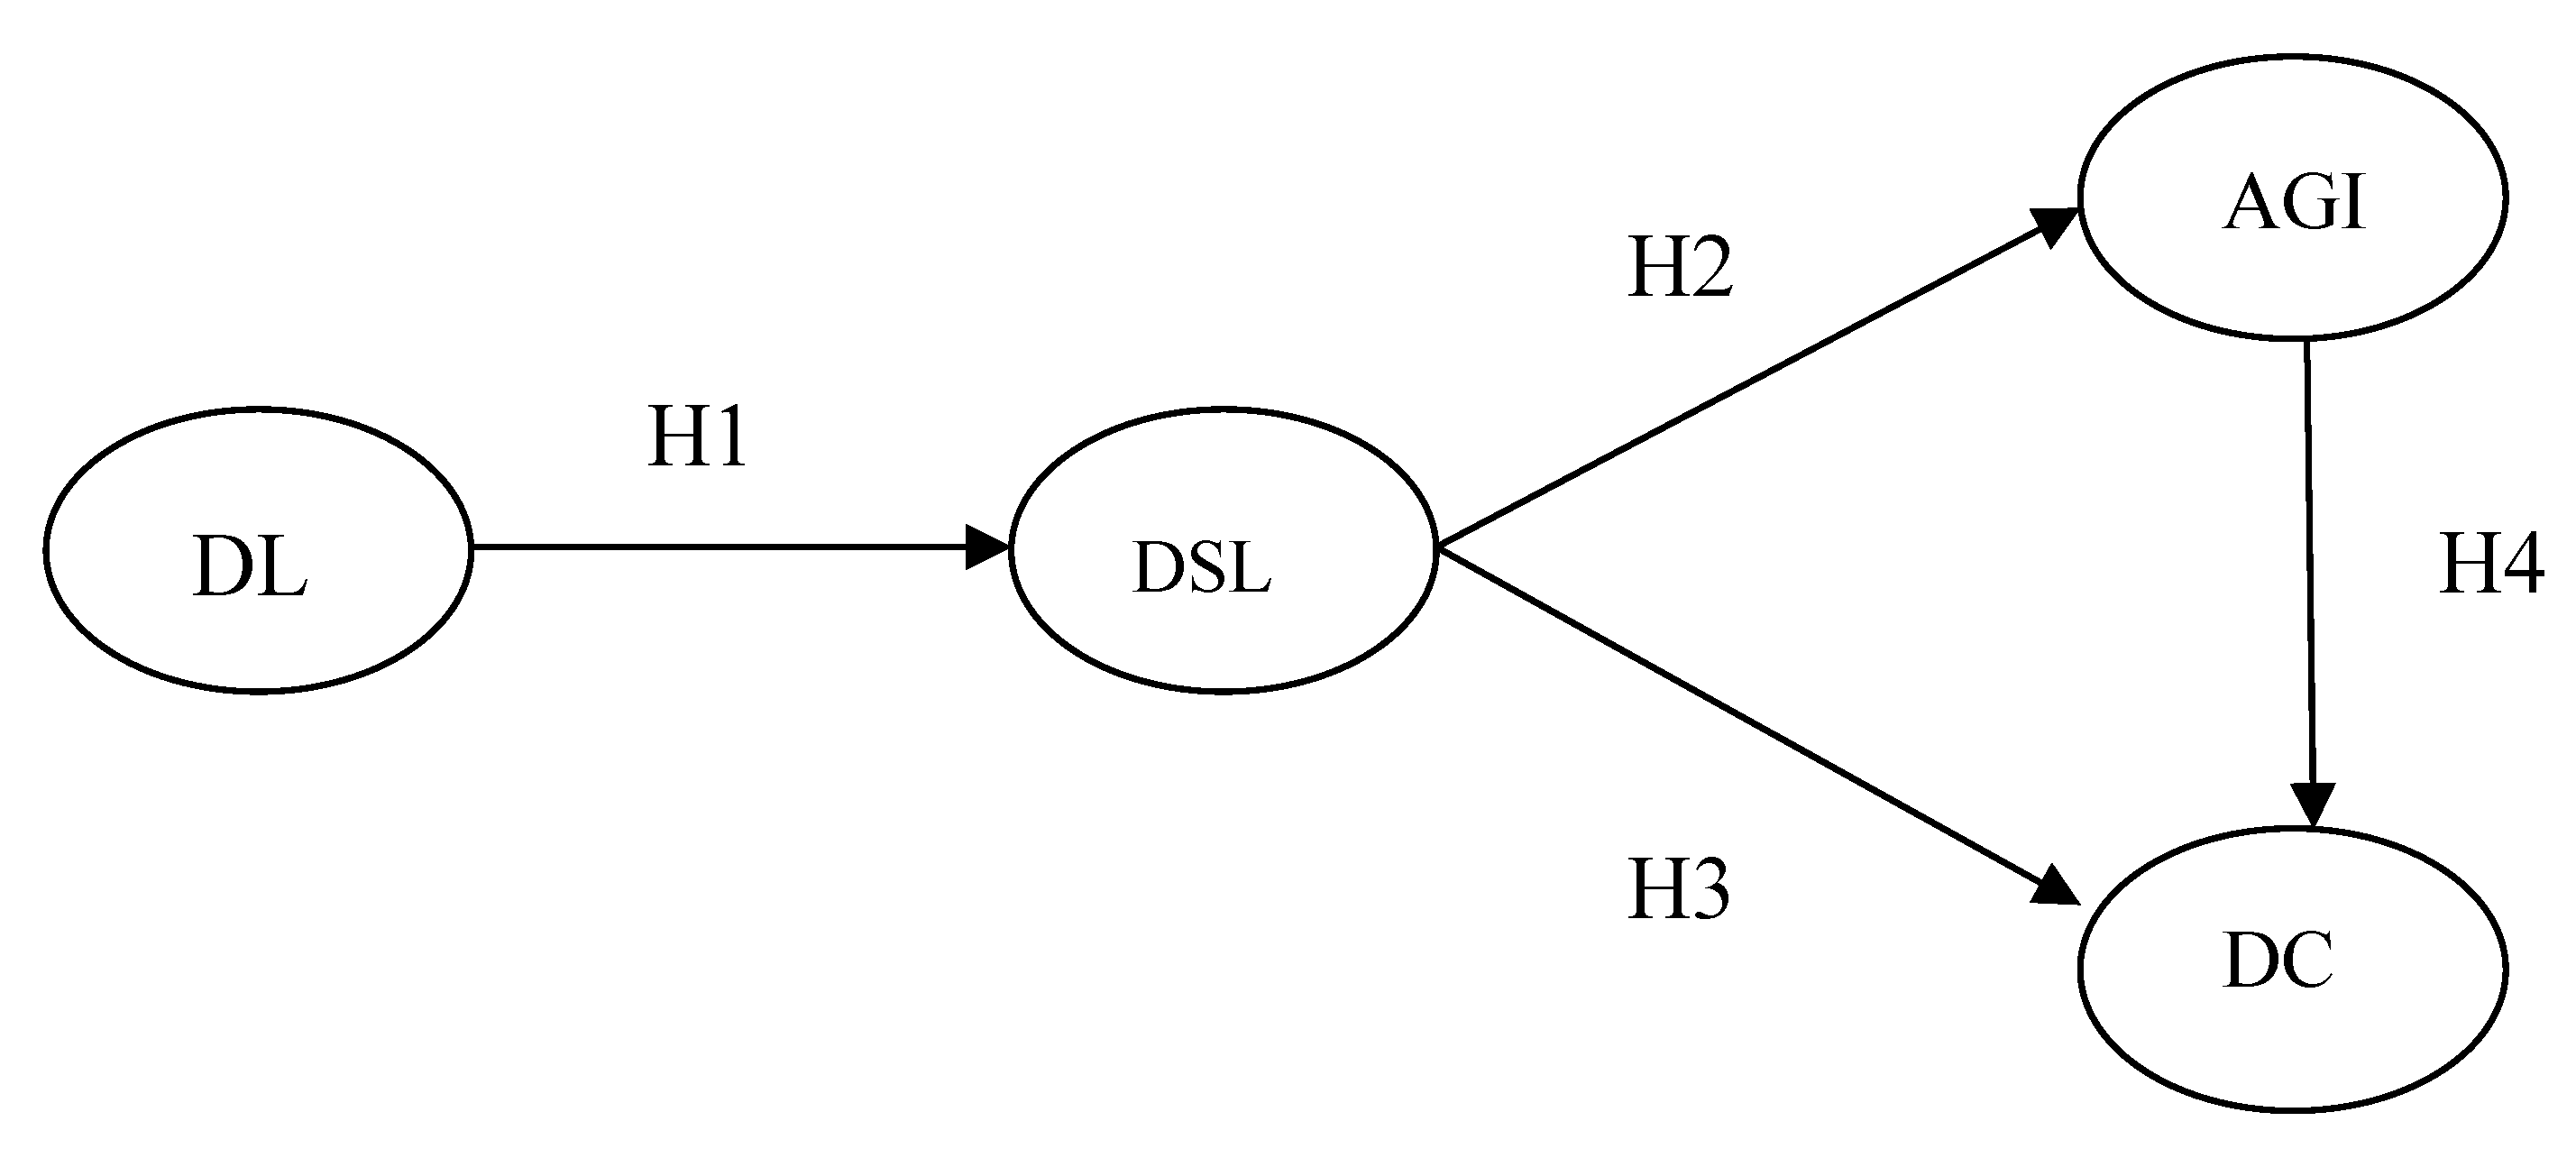
4. Research Hypotheses and Proposed Model

When discussing the factors of citizen participation, political scholars mainly focus on traditional participation. Thus, studies relating to non-traditional forms of political participation are scarce. In addition, there are limited studies in regard to both traditional and non-traditional citizen participation [49,50]. For instance, research on digital opportunity is very rare, and in two of the important works by Verba, Schlozman, and Brady [51] and Schlozman, Verba, and Brady [52], the researchers only centered on the traditional civic participation model, and there was no specific discussion of resistance activities. On the other hand, while some studies do touch on non-traditional forms of citizen participation, only a few of them concentrate on a specific type of activity [50,53,54]. There is also a lack of comprehensive discussion of different citizen participation and choices in non-traditional forms. Therefore, identifying the factors that influence the choice of non-traditional citizen participation, especially in terms of digital opportunities, can contribute new findings to existing literature.
Scholars on citizen participation in a social structure believe that cleavages may be caused by many elements, such as gender, age, education, ethnicity, or even class. When citizens engage in public activities, it also reflects on the aspects of one’s resources (such as money or time) and abilities (such as knowledge and skills). In addition, an individual’s position in the social network, or whether a person belongs to specific groups or other “personal–social” links will also affect the motivation to participate in public affairs [55].
In view of the above, we must pay attention to the ability or conditions of the general public to overcome the digital gap and participation costs in discussing digital opportunities and citizen participation. All citizen participation has its costs, which can be in the form of time, money, information costs, and coordinated actions involving transaction costs. Thus, those who are able to reduce the costs will have higher chances of participation. Socio-economic resources are often regarded as the most important factor in determining resource requirements, as those who have better education and higher income are more likely to have enough money, skills, and information to participate in public affairs and activities [51,56]. Empirically, scholars have found individuals with higher education levels [51] and higher income [57] to be more likely to vote or engage in various forms of citizen participation. Furthermore, highly educated citizens tend to participate in elections and public investment in community public affairs [58]. The characteristics of different political activities have different levels of implicit input and coordination, which affects the willingness of participants with different resources [58,59].
For non-traditional forms of citizen participation, such as opinions, co-signings, and demonstrations on online forums, participation requires organizational skills and resources. Empirical studies have shown that people with higher education levels and higher incomes are more likely to participate in actions that take more time, for example, discussing public affairs, participating in election campaigns, contacting with officials, organizing protests, engaging in local affairs, and joining social organizations [51,58].
For high economic status groups, scholars have also pointed out that, as they have much similar education and social status with policymakers, they tend to participate in public activities through institutional channels, or discuss on government websites. In contrast, vulnerable groups often cannot gain access to policymakers due to their lack of resources. When they suffer from unfair treatments by society and the state, and their well-being is seriously impaired, most of the institutional participation channels fail to offer effective relief. Therefore, they may have to rely on non-traditional ways to protest with maximum effectiveness and lower costs, such as demonstrations, marches, or even violence [50,60,61].
For the past thirty years, Taiwan has promoted digital education policy to reduce the digital divide and facilitate digital equal opportunity. On the whole, its digital education policy comprises three main parts: Digital literacy and competency learning, digital application in social life, and digital civic engagement. Of which, digital civic engagement covers how to adopt digital tools or devices to gain government information and to take further actions on public affairs for social justice. In this study, we have utilized nationwide data from a government survey to assess our proposed model of digital opportunity (see Figure 2). We assumed the following correlational relations: (a) Digital literacy directly facilitates digital application; (b) digital application either directly or indirectly influences digital civic engagement.
Based on the above empirical studies and policy review, we proposed the following research hypotheses:
Hypotheses 1 (H1).
Higher levels of digital literacy are associated with higher levels of digital social life.
Hypotheses 2 (H2).
Higher levels of digital social life are associated with higher levels of the digitalized acquisition of government information.
Hypotheses 3 (H3).
Higher levels of digital social life are associated with higher levels of the political participation of digital citizens.
Hypotheses 4 (H4).
Higher levels of the digitalized acquisition of government information are associated with higher levels of the political participation of digital citizens.
Hypotheses 5 (H5).
Digitalized acquisition of government information plays a mediating role in the relationship between digital social life and the political participation of digital citizens.
Hypotheses 6 (H6).
There are statistically significant differences between ‘higher education background’ and ‘lower education background’ groups in the relations with variables of digital opportunity.

5. Methodology

We employed a dataset of the nation-wide Digital Opportunity Survey for Individuals and Households (abbreviated as 2018 Digital Opportunity Survey) by the National Development Council [62], which adopted Computer-Assisted Telephone Interviewing (CATI) for telephone interviews. In order to collect samples at a reasonable time of the day, interviews were conducted after 6 p.m. for Mondays to Fridays, and from 2 p.m. to 10 p.m. for Saturdays and Sundays [62]. The method to implement the telephone survey is that the survey questions were designed in advance, and the telephone sample would be saved in the computer data base before the survey proceeded, and each survey question would show on the screen in order. The interviewer would read out the questions on the screen and type in interviewees’ answers, which was in line with the standard procedure.
Phone numbers of residents in 22 Taiwan counties and cities were collected from the United Daily News public opinion polling center. The selected regions represented a sub-population with stratified random sampling [62]. After a random draw of phone numbers, arbitrary changes to the last two digits were made to cover unregistered residences [62]. The interviews were carried out from 4th July, 2018 to the night of 30th August, 2018. Among 219,599 attempted calls, 100,793 households (the difference was due to redials) were successfully interviewed. Excluding non-human factors, such as fax, non-residential numbers, answering machines, phone breakdown, unreachable numbers, not-in-service numbers, and non-qualified interviewees, the valid samples were 13,222 [62]. In other words, the rate of successful interviews was 64.7 percent, and the refusal rate was 35.3 percent. Following data screening and cleaning, 8373 valid samples were used in our study [62] (see Table 1).
In this research, we adopted three dimensional categories in the questionnaire, namely ‘basic skills and literacy’ (which denotes information literacy), ‘social life participation’ (which denotes the use of ICT for one-way life participation or bilateral interaction in society), and ‘civic engagement’ (which denotes the use of ICT to utilize e-government sources and participate in bilateral Internet social movement) [62]. From these three dimensions, we selected 10 observed variables corresponding to four latent variables, i.e., digital literacy, digital social life, the digitalized acquisition of government information, and the political participation of digital citizens. The descriptive statistics of each scale item were listed in Table 1.
In terms of univariate and multivariate normality, the skewness values for the 10 observed variables ranged from −0.58 to 4.88, and the kurtosis values ranged from −0.12 to 27.92. This seemed to contradict the basic assumptions of univariate and multivariate normality. Hence, we adopted the Bollen-Stine bootstrapping estimation to test the confirmatory factor analysis, as well as the structural equation model to resolve the problem of non-normal distribution [63].

6. Results

All statistical analyses, including confirmatory factor analysis (CFA) and structural equation model (SEM), were conducted with IBM SPSS Amos 26. In this section, we first introduced the demographic profile of our samples, and then discussed the statistics of measurement and structural model by referring to and making comparisons with different model fit indices. Finally, we illustrated the results of the multi-group analysis.

6.1. Descriptive Analysis

The nationwide survey covered 8373 participants and their basic demographic information is presented in Table 2. A majority of them were females (52.6%), in contrast to males (47.4%). In terms of age group, most of them were aged 50–59 (22.8%), followed by those who were aged 40–49 years (19.9%), 30–39 years (13.6%), 65 years or above (11.5%), 20–29 years (11.3%), 15–19 years (7.7%), and 12–14 years (3.2%). Participants who received high school diplomas (including junior and senior schools) were the majority and accounted for nearly 41.2% of the total, followed by undergraduate (31.3%), college (14.6%), post-graduate (8.2%), illiterate (0.2%), and self-learning (0.1%). For the purpose of the main argument of the multi-group analysis, we re-categorized participants with different education backgrounds into two groups, namely higher education background (undergraduate and above, N = 3303) and lower education background (college and below high school, N = 5026).
Following the two-group distinction, an independent-samples t-test was conducted to compare the difference between lower and higher education background in the relations with four latent variables. As shown in Table 3, the t-test results indicated statistically significant differences between the scores of participants with lower education background and higher education background in four variables: Digital literacy, digital social life, digitalized acquisition of government information, political participation of digital citizens. We also found in these four variables that the mean scores of the more educated participants were significantly higher than those of the lower educated ones. This suggests that education background has a significant influence on different aspects of digital practice.

6.2. Results of Measurement Model: CFA Analysis

This study employed CFA for the test of composite reliability, convergent validity, and discriminant validity. First, as shown in Table 4, CFA indicated that the standardized factor loadings of the 10 observed variables (ranging from 0.44–0.84) were statistically significant (t value > 1.96), and most of the observed variables were greater than the 0.5 criterion (except DSL 3), which suggested the data was properly fit in the proposed model [64]. Second, the composite reliability (CR) ranged from 0.56 to 0.70, and the average variance extracted (AVE) ranged from 0.30 to 0.55, which was lower than the recommended values of 0.60 [65]. Hence, the internal consistency of the proposed model was acceptable, and the scale items exhibited reliability and convergent validity. Following this analysis, a low correlation between the two constructs demonstrated discriminant validity [66]. According to Anderson and Gerbing [66], the correlation coefficients between constructs should be lower than the square root of the AVE. In this study, the figure ranged from 0.55 to 0.72 (see Table 5), which was higher than the inter-correlation coefficient between each of the constructs. Based on the rigorous examination of measurement criterion, most of the constructs met the academic standard of discriminant validity.

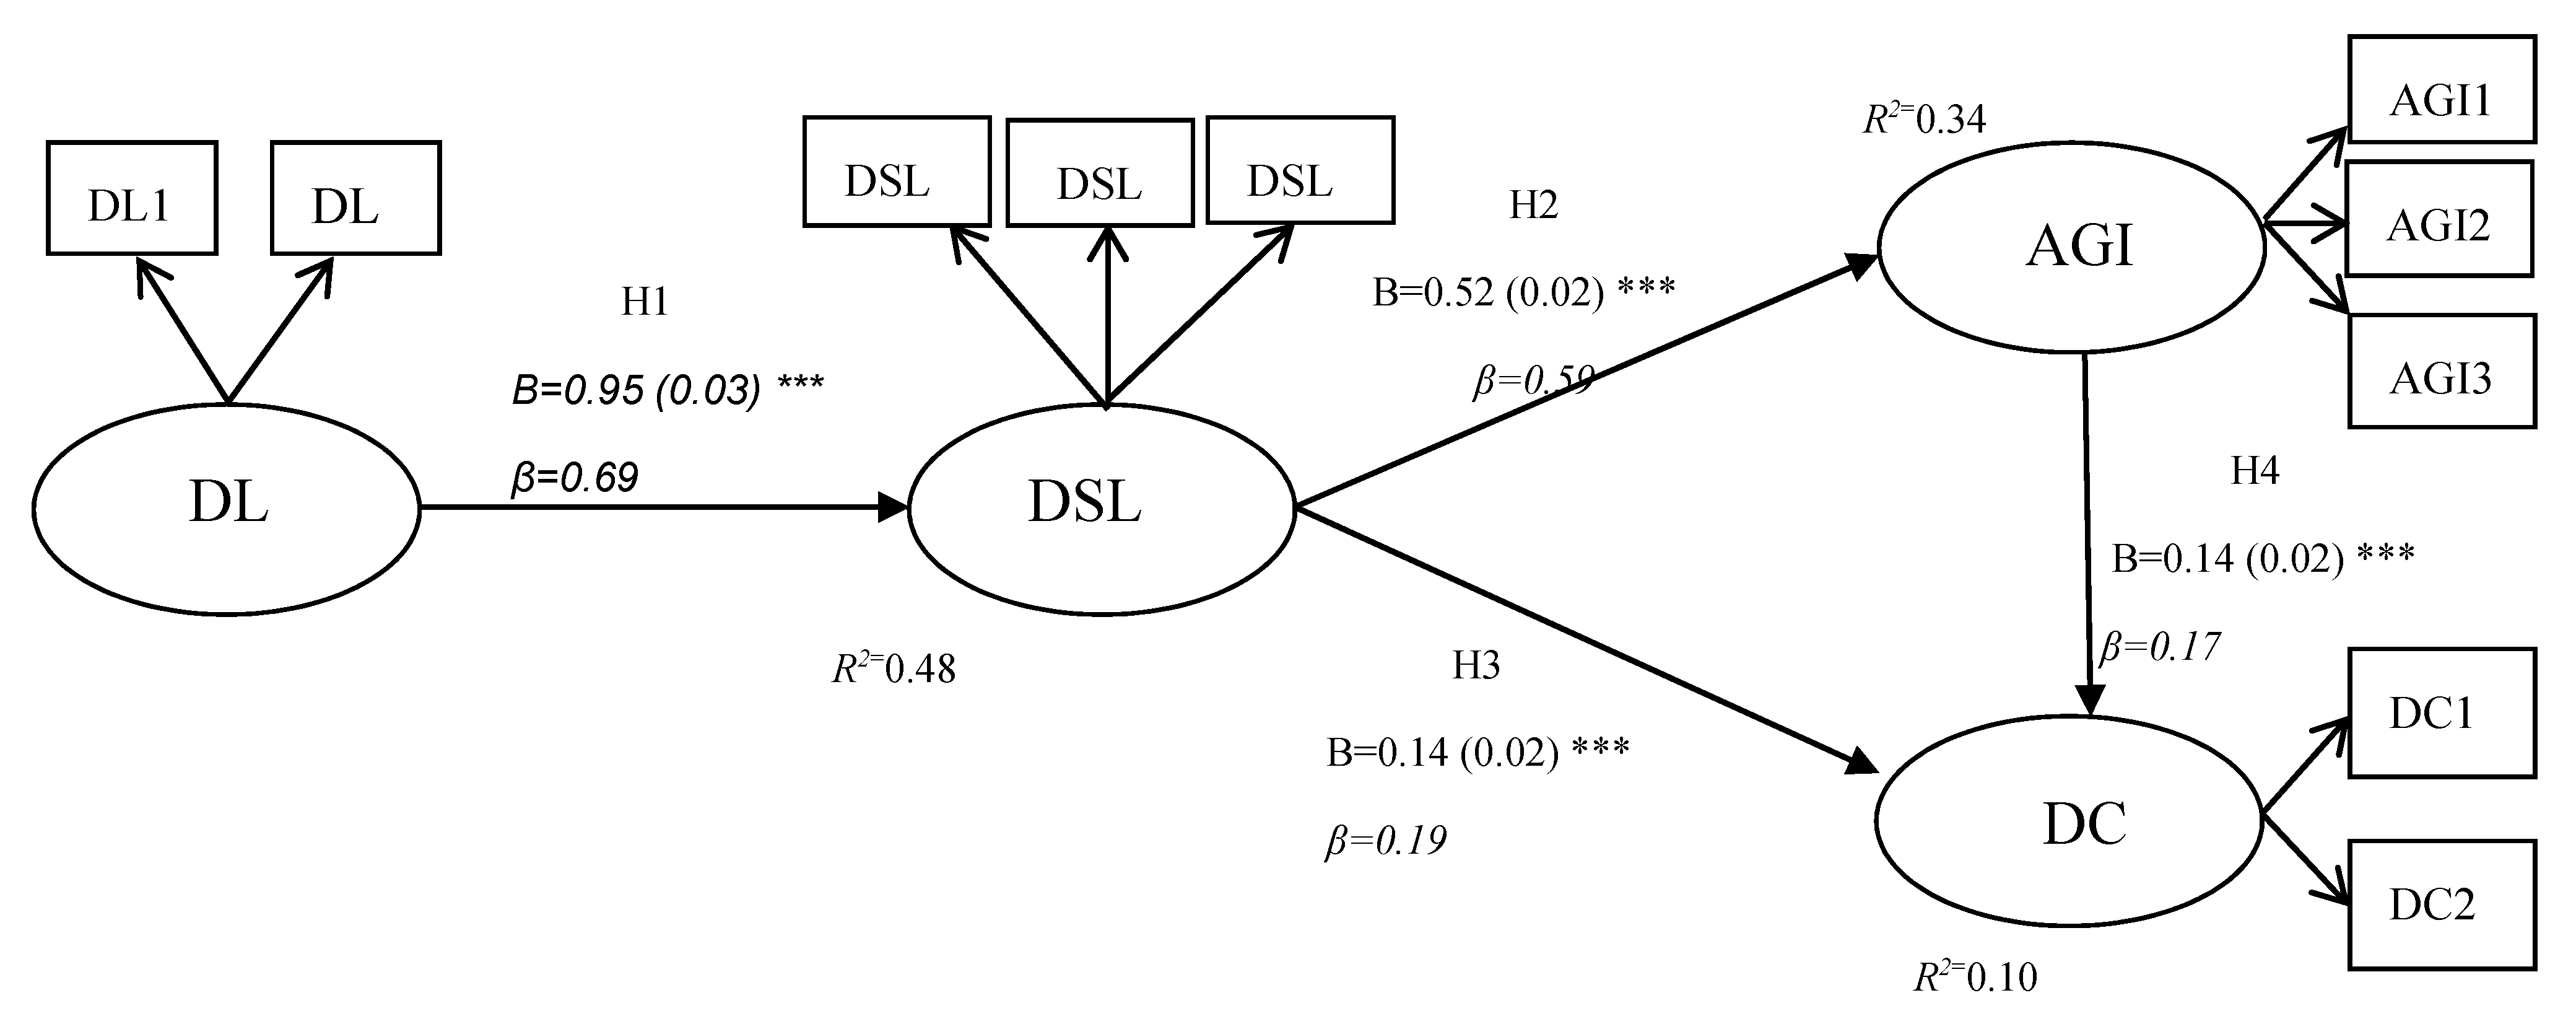
6.3. Results of Structural Model: SEM Analysis

Given the large sample size and the results of the normality test, we used the Bollen–Stine bootstrapping method to examine the fitness of the structural model. Compared with the maximum likelihood estimation, the Bollen–Stine bootstrapping method indicated appropriate index results. We adopted Bollen–Stine bootstrapping procedures to evaluate the hypothesized relations among digital literacy (DL), digital social life (DSL), the digitalized acquisition of government information (AGI), and political participation of digital citizens (DC). SEM results showed that our proposed model fitted the data well, χ2 = 39.03,χ2/df = 1.06, p < 0.001 (lower than the maximum value of 3 [67]), NFI = 0.997, NNFI = 0.999, CFI = 0.999, RFI = 0.996, IFI = 0.999 (higher than the cut-off value of 0.9, suggested by Bentler and Bonett [68], Bentler [69], Hu and Bentler [70], Bollen [71], Bollen [72]), and SRMR = 0.02 (lower than 0.08 [70]), RMSEA = 0.006 (lower than 0.06 [70]). Additionally, the PNFI and PGFI were at 0.687 and 0.563, respectively, both higher than 0.5 [73,74]. Standardized factor loadings ranged from 0.44 to 0.84, with p < 0.001 (Table 4). As shown in Figure 3, DL was positively predicted by DSL, β = 0.69, p < 0.001, 95% confidence interval (CI) [0.67, 0.71]. Furthermore, DSL positively predicted AGI, β = 0.59, p < 0.001, 95% CI [0.55, 0.62] and positively predicted DC, β = 0.19, 95% CI [0.13, 0.24]. Finally, AGI positively predicted DC, β = 0.17, p < 0.001, 95% CI [0.10, 0.24]. We also found the results of bootstrapping analysis indicating the significant indirect effect of DSL on DC through AGI, β = 0.098, p < 0.001, 95% CI [0.05, 0.14]. On the basis of the above results, we accepted H1, H2, H3, H4, and H5. (Table 6)

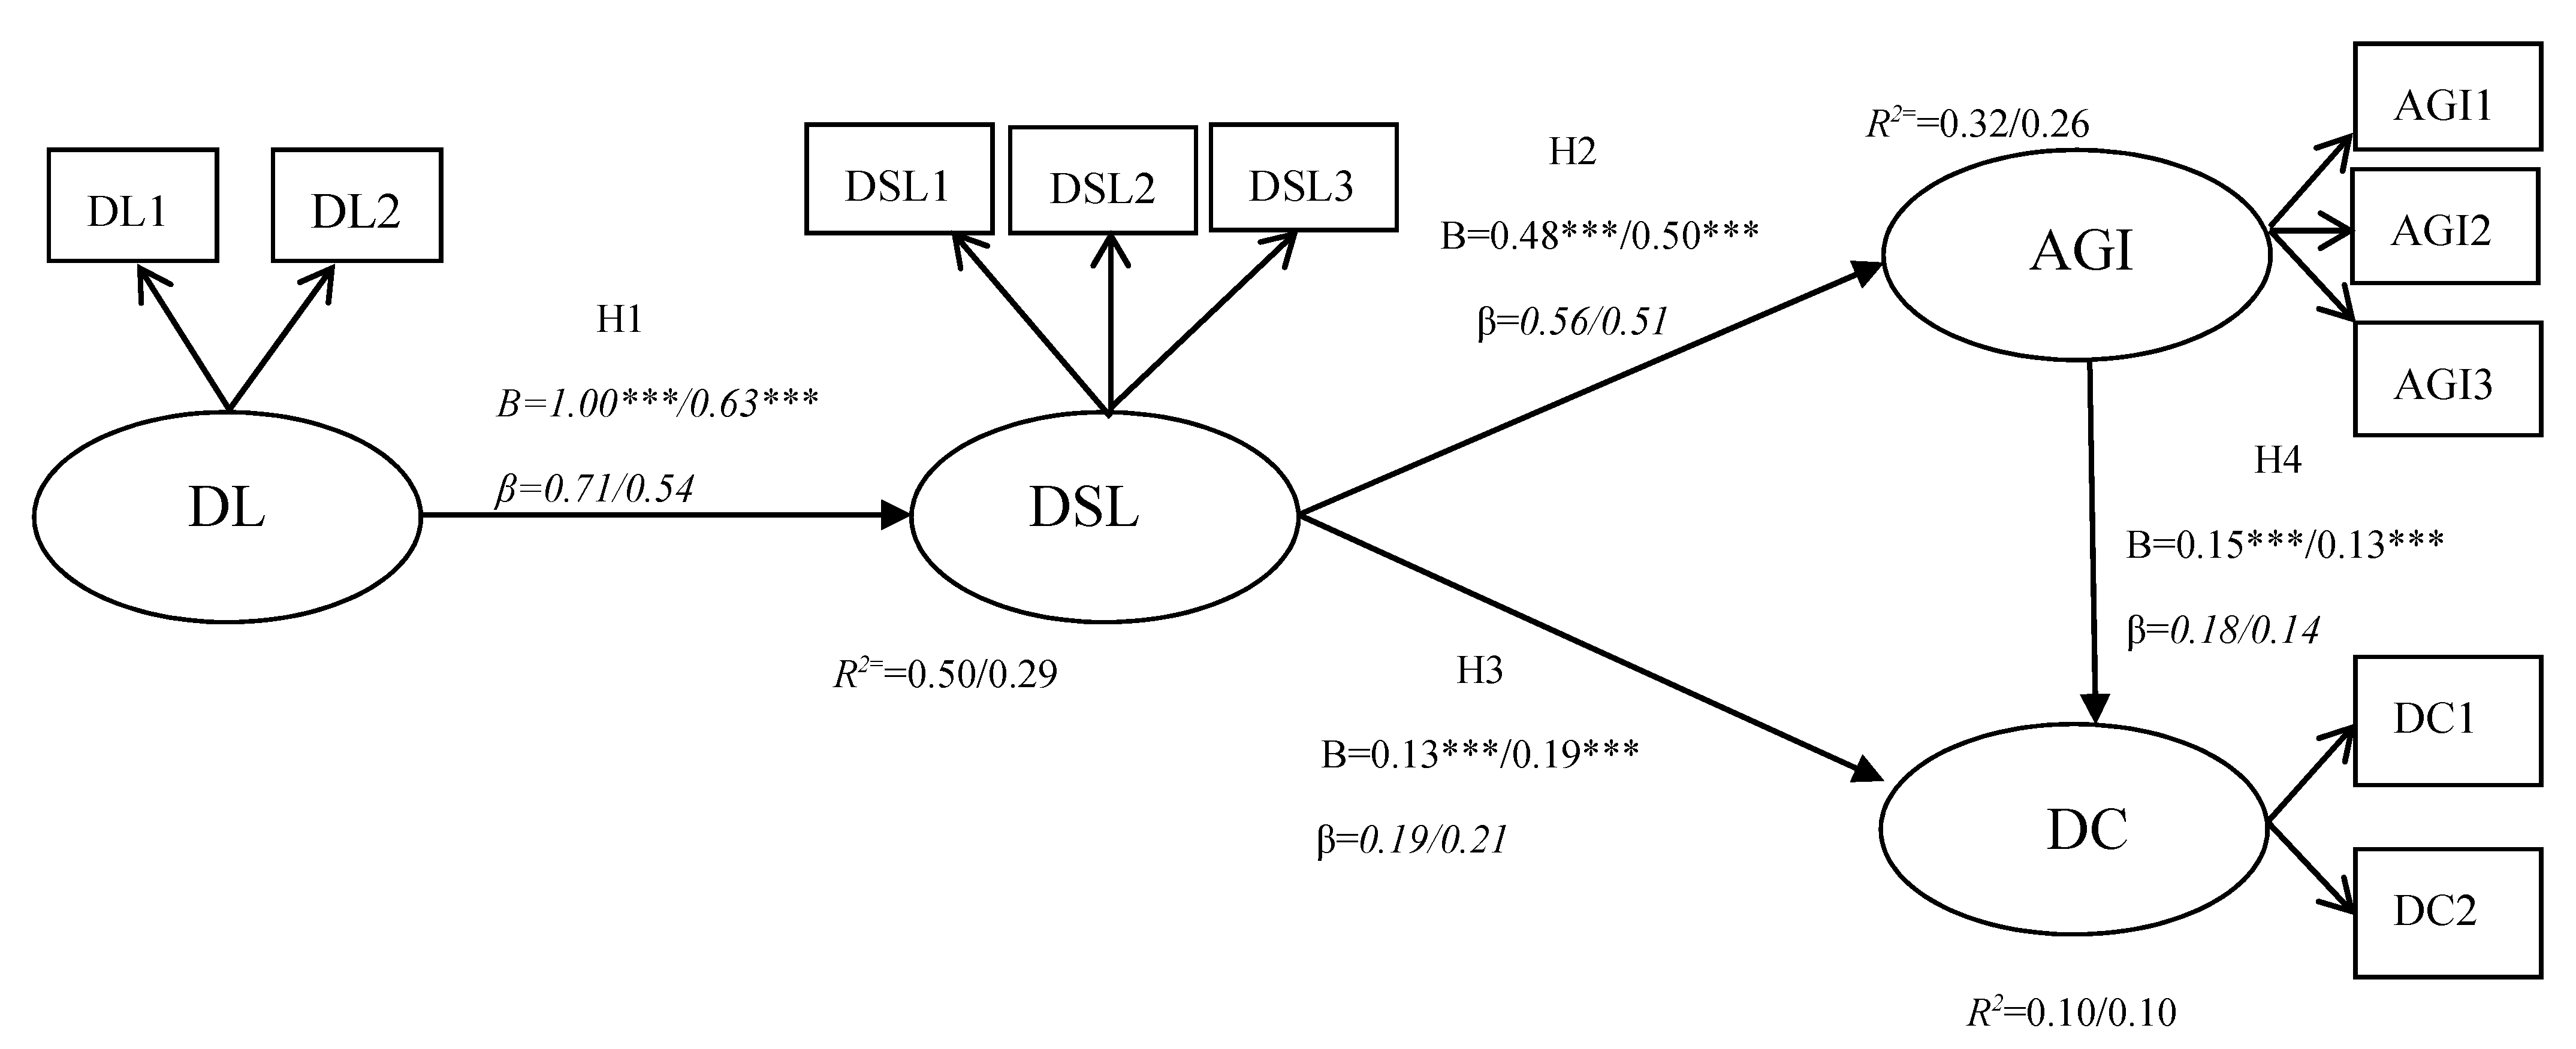
6.4. Results of Multi-Group Analysis

The results of the multi-group analysis on higher education background (HEB) and lower education background (LEB) groups are shown in Table 7. Both HEB and LEB in each of the four hypothesized paths were statistically significant. However, given the results of the z-score test in Table 8, there were no statistically significant differences between HEB and LEB in the relations with variables of digital equal opportunity. Hence we could not accept sixth hypothesis. The indirect effect of DSL on DC through AGI was also tested in the multi-group analysis. For HEB, results of bootstrapping analysis indicated significant indirect effect of DSL on DC, β = 0.07, p < 0.001, biased-corrected bootstrap 95% CI = [0.03, 0.12]. The analysis also demonstrated the indirect effect of DSL on the DC, β = 0.10, p < 0.001, biased-corrected bootstrap 95% CI = [0.04, 0.16]. In other words, our proposed model can be applied and generalized to different education backgrounds in Taiwan. Also worth noting is that, there was no evidence pointing that the digital divide between participants with higher and lower education background led to different digitalized political participation. Figure 4 shows the results of the two education background groups.

7. Discussion and Policy Implications

Due to the increasing access to digital information and the promotion of digital education, digital opportunity has become a core issue in the discussion of national public policy. This study begins with a review of the digital education policy in Taiwan since the 1990s. Our main concern is to examine whether the educational background of citizens affects their digital opportunity and political participation. In the ‘Independent-Sample’ t-test analysis, we found that more educated citizens differed significantly from the less educated ones. Their average score was higher as well (see Table 3). This indicated that education background has a potential effect on each dimension of digital social and political life. However, it is also worth mentioning that the result of the multi-group analysis showed that there was no significant difference between more and less educated citizens in the proposed path model (see Table 8). Thus, to a great extent, digital education policy at different educational levels has played a crucial role not only in promoting ‘digital opportunity’, but also in reducing the ‘digital divide’ in the country. In particular, we also found that the overall average score of ‘digital literacy’ and ‘digital social life’ was higher than that of ‘digitalized acquisition of government information’ and ‘political participation of digital citizens’. In this study, we could not provide robust evidence to argue for the correlation between the effectiveness of digital policy and each digital latent dimension. Nonetheless, these findings will remind policy stakeholders that digital education policy should focus more on encouraging citizens’ engagement in digital political life.
In response to the Sustainable Development Goals (SDGs), we conducted an extensive review of previous studies and devised a framework for sustainable digital citizenship, with a special focus on digital literacy and civic participation. With more evidence surfacing that digital literacy may be related to civic participation [52,53], the present study considered the impact of digital literacy, digital social life, and digitalized acquisition of government information in explaining the level of political participation of digital citizens. We also found that digital social life potentially acts as a mediator between digital literacy and digital political life. This corroborated our assumption that a higher level of digital literacy and active civic participation facilitate the formation of sustainable digital citizenship.
Our hypotheses H1 to H4, concerned with the correlation between four variables, were largely supported by the correlational results. It was evidenced that ‘digital literacy’ was positively related to ‘digital social life’, and ‘political participation of digital citizens’ was positively correlated to ‘digital social life’ and ‘digitalized acquisition of government information’. Consistent with our hypothesis H5, ‘digitalized acquisition of government information’ was found to mediate between ‘digital social life’ and ‘political participation of digital citizens’. This implied that government authorities and schools should educate the public on how to obtain policy information through digital devices and put it into reflective political practice. By doing so, public engagement of digital political life can directly facilitate the formation of sustainable digital citizenship.
The present study not only demonstrates the Taiwanese people’s excellent information skills, but also their ability to obtain digital government information and improve their citizen participation. Evidently, Taiwan has been very successful in digital education and effective in enhancing citizens’ information application abilities in the past 30 years. The next mission of the Taiwanese government is to increase the hours and proportion of digital courses, while promoting digital education in remote areas. It should also capitalize on digital information to reduce the educational gap between urban and rural areas, so as to promote and achieve its long-term goal of citizen participation in public affairs.

8. Conclusions

Our research found that education and socioeconomic status are the most important factors in digital opportunities. Individuals with better education and higher incomes are more likely to participate in public affairs, as they have more time, money, skills, and access to digital information [51,56]. Empirically, scholars have observed that individuals with better education [51] and incomes [57] have a higher tendency to vote or engage in other forms of citizen participation.
In the case of digital opportunities, it is obvious that education and socioeconomic status are highly and positively correlated to citizen participation. This is because digital education is the foundation of digital literacy, which affects citizens’ ability to obtain digital information, and, in turn, their digital lives and citizen participation.
According to existing literature, as well as statistical data and model of this study, we offer the following research contributions: (a) Different education levels lead to significant differences in four potential aspects; (b) digital literacy has a positive correlational relationship with digital social life; (c) digital social life has a positive correlational relationship with access to government information; (d) access to government information has a positive correlational relationship with digital citizen participation; (e) digital social life has a positive correlational relationship with digital citizen participation. There are no significant differences in the above four paths of correlational relationship, which means that the model can be applied to any subjects with different academic backgrounds.
All variables in this study suggest that there has been significant improvement in the digital abilities of Taiwan’s citizens, regardless of their age and levels of education. Furthermore, their digital opportunities and information capabilities are highly and positively correlated to their education background and citizen participation. Therefore, it is evident that the Taiwanese government has achieved remarkable results since the promotion of digital education from the 1990s.

Author Contributions

Conceptualization, C.-H.C., C.-L.L. and M.-L.C.; methodology, C.-H.C., C.-L.L., B.P.H.H. and M.-L.C.; software, B.P.H.H. and M.-L.C.; validation, B.P.H.H. and M.-L.C.; formal analysis, C.-H.C., B.P.H.H. and M.-L.C.; data curation, M.-L.C.; writing—original draft preparation, C.-H.C., C.-L.L. and M.-L.C.; writing—review and editing, C.-H.C., C.-L.L. and B.P.H.H; visualization, B.P.H.H. and M.-L.C. All authors have read and agreed to the published version of the manuscript.

Funding

This research received no specific grant from any funding agency in the public, commercial, or not-for-profit sectors.

Acknowledgments

We would like to thank Tai Ching In and Liao Heng Yang for assistance in preparation of this manuscript.

Conflicts of Interest

The authors declare no conflict of interest.

References

  1. Ministry of Education (MOE). Improving E-Teaching at All Level of School; MOE: Taipei, Taiwan, 1993.
  2. Ministry of Education (MOE). Computer-Assisted Teaching and the Promotion of the Use; MOE: Taipei, Taiwan, 1997.
  3. Ministry of Education (MOE). Information and Communication Technology (ICT) Education; MOE: Taipei, Taiwan, 1997.
  4. Ministry of Education (MOE). Mid-Term Development Plan on the Talent Cultivation for the National Information Infrastructure (NII); MOE: Taipei, Taiwan, 1997.
  5. Ministry of Education (MOE). Medium-Term Plan for Distance Learning, and Social Education Networking; MOE: Taipei, Taiwan, 1998.
  6. Ministry of Education (MOE). Increasing Domestic Demand: Building E-Teaching Environment in Elementary and Secondary Schools; MOE: Taipei, Taiwan, 1999.
  7. National Science Council (NSC). Taiwan e-Learning and Digital Archives Program; NSC: Taipei, Taiwan, 2003.
  8. Ministry of Education (MOE). Program to Create Digital Opportunities in Remote Areas; MOE: Taipei, Taiwan, 2005.
  9. National Science Council (NSC). E-Learning in Taiwan, 2005–2006; NSC: Taipei, Taiwan, 2005.
  10. Ministry of Education (MOE). White Paper on Information Education 2008–2011 at the Elementary and Secondary School Levels; MOE: Taipei, Taiwan, 2008.
  11. Ministry of Education (MOE). Environment Creating for Quality Digital Education in Primary and Secondary Schools; MOE: Taipei, Taiwan, 2009.
  12. Ministry of Education (MOE). Promoting Education on Cloud Computing and Platform Service; MOE: Taipei, Taiwan, 2012.
  13. Ministry of Education (MOE). Digital Application Promotion Project in Remote Areas; MOE: Taipei, Taiwan, 2016.
  14. Ministry of Education (MOE). Overall Blueprint of Information Education in Elementary and Junior High Schools; MOE: Taipei, Taiwan, 2001.
  15. Ministry of Education (MOE). Challenge 2008: National Development Focal Project; MOE: Taipei, Taiwan, 2002.
  16. Ministry of Education (MOE). Project of Establishing Campus Intelligent Websites; MOE: Taipei, Taiwan, 2017.
  17. Ministry of Education (MOE). Information Education in Elementary and Junior High Schools; MOE: Taipei, Taiwan, 2008.
  18. Ministry of Education (MOE). Digital Collection and Digital Learning National Technology Project; MOE: Taipei, Taiwan, 2008.
  19. Organisation for Economic Co-operation and Development. Automation and Independent Work in a Digital Economy, Policy Brief on the Future of Work; OECD: Paris, France, 2016. [Google Scholar]
  20. Benkler, Y. From Consumers to users: Shifting the deeper structures of regulation toward sustainable commons and user access. Fed. Commun. Law J. 2000, 52, 561–579. [Google Scholar]
  21. Castells, M. The Rise of the Network Society: The Information Age: Economy, Society, and Culture, 2nd ed.; John Wiley & Sons Ltd.: New York, NY, USA, 2009; Volume 1. [Google Scholar]
  22. Funtowicz, S.O.; O’Connor, M.; Ravetz, J. Scientific communication, international cooperation and capacity building for sustainable development. Int. J. Sustain. Dev. 1999, 2, 363–368. [Google Scholar] [CrossRef]
  23. Hargittai, E.; Walejko, G. The participation divide: Content creation and sharing and the digital age. Inf. Commun. Soc. 2008, 11, 239–256. [Google Scholar] [CrossRef]
  24. Hilbert, M. The end justifies the definition: The manifold outlooks on the digital divide and their practical usefulness for policy-making. Telecommun. Policy 2011, 35, 715–736. [Google Scholar] [CrossRef]
  25. Levy, P. Collective Intelligence: Mankind’s Emerging World in Cyberspace [Translated by Robert Bononno]; Perseus Books: Cambridge, MA, USA, 1997. [Google Scholar]
  26. United Nations. Indicators for Sustainable Development, Framework and Methodologies; United Nations: New York, NY, USA, 1996. [Google Scholar]
  27. Webster, F. Theories of the Information Society, 4th ed.; Routledge: Abingdon, UK, 2014. [Google Scholar]
  28. Doyle, G. Media Ownership–The Economics and Politics of Convergence and Concentration in the UK and European Media; Sage: London, UK, 2002. [Google Scholar]
  29. National Telecommunications and Information Administration, U.S. Department of Commerce. Falling through the Net: A Survey of the “Have Nots” in Rural and Urban America. 1995. Available online: http://www.ntia.doc.gov/ntiahome/fallingthru.html (accessed on 1 December 2019).
  30. National Telecommunications and Information Administration, U.S. Department of Commerce. Falling through the Net II: New Data on the Digital Divide. 1998. Available online: http://www.ntia.doc.gov/ntiahome/net2/ (accessed on 1 December 2019).
  31. National Telecommunications and Information Administration, U.S. Department of Commerce. Falling through the Net: Defining the Digital Divide. 1999. Available online: http://www.ntia.doc.gov/ntiahome/fttn99/contents.html (accessed on 1 December 2019).
  32. National Telecommunications and Information Administration, U.S. Department of Commerce. Falling through the Net: toward Digital Inclusion. 2000. Available online: http://www.ntia.doc.gov/ntiahome/fttn00/contents00.html (accessed on 1 December 2019).
  33. National Telecommunications and Information Administration, U.S. Department of Commerce. How Americans Are Expanding Their Use of the Internet. 2002. Available online: http://www.ntia.doc.gov/ntiahome/dn/html/anationonline2.htm (accessed on 1 December 2019).
  34. Czerwinski, S.J.; Abramowitz, A.D. Telecommunications: Characteristics and Choices of Internet Users. 2001. Available online: http://www.gao.gov/new.items/d01345.pdf (accessed on 1 December 2019).
  35. James, J. The Digital Divide across All Citizens of the World: A New Concept. Soc. Indic. Res. 2008, 89, 275–282. [Google Scholar] [CrossRef] [Green Version]
  36. Rahim, S.A. Digital Experience and Citizen Participation in Bridging Ethnic Divide: An Analysis of Young Generation in Malaysia. J. Komun. Malays. J. Commun. 2018, 34, 154–167. [Google Scholar] [CrossRef] [Green Version]
  37. Spilka, R. Digital Literacy for Technical Communication: 21st Century Theory and Practice; Routledge: New York, NY, USA, 2010. [Google Scholar]
  38. Eshet-Alkalai, Y. Digital literacy: A conceptual framework for survival skills in the digital era. J. Educ. Multimed. Hypermedia 2004, 1391, 93–106. [Google Scholar]
  39. Tyner, K. Literacy in a Digital World: Teaching and Learning in the Age of Information; Routledge: New York, NY, USA, 2014. [Google Scholar]
  40. Albarran, A.B.; Moellinger, T. The top six communication industry firms: Structure, performance and strategy. In Media Firms: Structures, Operations and Performance; Picard, R.G., Ed.; Lawrence Erlbaum Associates: Mahwah, NJ, USA, 2002. [Google Scholar]
  41. Bagdikian, B. The New Media Monopoly; Beacon Press: New York, NY, USA, 2004. [Google Scholar]
  42. Herman, E.S.; McChesney, R.W. The Global Media: The New Missionaries of Corporate Capitalism; Cassell: London, UK, 1997. [Google Scholar]
  43. McChesney, R.W. The Problem of the Media: Us Communication Politics in the 21st Century; Monthly Review Press: New York, NY, USA, 2004. [Google Scholar]
  44. Jenkins, H.; Clinton, K.; Purushotma, R.; Robison, A.J.; Weigel, M. Confronting the Challenges of Participatory Culture: Media Education for the 21st. 2006. Available online: https://files.eric.ed.gov/fulltext/ED536086.pdf (accessed on 1 December 2019).
  45. Putnam, R.D. Making Democracy Work: Civic Traditions in Modern Italy; Princeton University Press: Princeton, NJ, USA, 1993. [Google Scholar]
  46. Putnam, R.D. Bowling Alone: The Collapse and Revival of American Community; Simon, Schuster: New York, NY, USA, 2000. [Google Scholar]
  47. Mandarano, L.; Meenar, M.; Steins, C. Building social capital in the digital age of civic engagement. J. Plan. Lit. 2010, 25, 123–135. [Google Scholar] [CrossRef]
  48. Sharma, R.S.; Mokhtar, I.A. Bridging the digital divide in Asia-challenges and solutions. Int. J. Technol. Knowl. Soc. 2006, 1, 15–30. [Google Scholar] [CrossRef]
  49. Barnes, S.H.; Kaase, M. Political Action: Mass Participation in Five Western Democracies; Sage Publications: Beverly Hills, CA, USA, 1979. [Google Scholar]
  50. Harris, F.; Gillion, D. Expanding the Possibilities: Reconceptualizing Political Participation as a Toolbox. In The Oxford Handbook of American Elections and Political Behavior; Leighley, J.E., Ed.; Oxford University Press: New York, NY, USA, 2010; pp. 144–161. [Google Scholar]
  51. Verba, S.; Schlozman, K.L.; Brady, H.E. Voice and Equality: Civic Voluntarism in American Politics; Harvard University Press: Cambridge, MA, USA, 1995. [Google Scholar]
  52. Schlozman, K.L.; Verba, S.; Brady, H.E. The Unheavenly Chorus: Unequal Political Voice and the Broken Promise of American Democracy; Princeton University Press: Princeton, NJ, USA, 2012. [Google Scholar]
  53. Brady, H.E.; Verba, S.; Schlozman, K.L. Beyond SES: A resource model of political participation. Am. Politics Sci. Rev. 1995, 89, 271–294. [Google Scholar] [CrossRef]
  54. Wong, J.S.; Lien, P.T.; Conway, M.M. Group-Based Resources and Political Participation among Asian Americans. Am. Politics Res. 2005, 23, 545–576. [Google Scholar] [CrossRef]
  55. Norris, P. Democratic Phoenix: Reinventing Political Activism; Cambridge University Press: Cambridge, UK, 2002. [Google Scholar]
  56. Nie, N.H.; Junn, J.; Stehlik-Barry, K. Education and Democratic Citizenship in America; University of Chicago Press: Chicago, IL, USA, 1996. [Google Scholar]
  57. Endersby, J.W.; Petrocik, J.R.; Shaw, D.R. Electoral Mobilization in the United States. In Handbook of Party Politics; Katz, R.S., Crotty, W.J., Eds.; Sage: London, UK, 2006; pp. 316–336. [Google Scholar]
  58. Dalton, R.J. Citizen Politics: Public Opinion and Political Parties in Advanced Industrial Democracies; CQ Press: Washington, DC, USA, 2014. [Google Scholar]
  59. Verba, S.; Nie, N.H.; Kim, J.O. Political Participation and Political Equality. A Seven-Nation Comparison; University of Chicago Press: Chicago, IL, USA, 1978. [Google Scholar]
  60. Della Porta, D.; Diani, M. Social Movements: An Introduction, 2nd ed.; Blackwell: Oxford, UK, 2006. [Google Scholar]
  61. Tarrow, S. Fishnets, Internets, and Catnets: Globalization and Transnational Collective Action. In Challenging Authority: The Historical Study of Contentious Politics; Hanagan, M.P., Moch, L.P., te Brake, W., Eds.; University of Minnesota Press: Minneapolis, MN, USA, 1998; pp. 228–244. [Google Scholar]
  62. National Development Council. 2018 Digital Opportunity Survey for Individuals and Households (AE010016) [Data File]; Available from Survey Research Data Archive, Academia Sinica; National Development Council: Taipei, Taiwan, 2019. [Google Scholar] [CrossRef]
  63. Bollen, K.A.; Stine, R.A. Bootstrapping goodness-of-fit measures in structural equation models. In Testing Structural Equation Models; Bollen, K.A., Long, J.S., Eds.; Sage: Newbury Park, CA, USA, 1993. [Google Scholar]
  64. Joreskog, K.G.; Sorbom, D. LISREL 8: User’s Reference Guide; Scientific Software International: Chicago, IL, USA, 1996. [Google Scholar]
  65. Bagozzi, R.; Yi, Y. On the Evaluation of Structural Equation Models. J. Acad. Mark. Sci. 1988, 16, 74–94. [Google Scholar] [CrossRef]
  66. Anderson, J.C.; Gerbing, D.W. Structural equation modeling in practice: A review and recommended two-step approach. Psychol. Bull. 1988, 103, 411–423. [Google Scholar] [CrossRef]
  67. Kline, R.B. Principles and Practice of Structural Equation Modeling, 2nd ed.; Guilford: New York, NY, USA, 2005. [Google Scholar]
  68. Bentler, P.M.; Bonett, D.G. Significance tests and goodness of fit in the analysis of covariance structures. Psychol. Bull. 1980, 88, 588–606. [Google Scholar] [CrossRef]
  69. Bentler, P.M. EQS Structural Equations Program Manual; Multivariate Software: Encino, CA, USA, 1995. [Google Scholar]
  70. Hu, L.; Bentler, P.M. Cutoff criteria for fit indexes in covariance structure analysis: Conventional criteria versus new alternatives. Struct. Equ. Model. 1999, 6, 1–55. [Google Scholar] [CrossRef]
  71. Bollen, K.A. Structure Equations with Latent Variables; John Wiley: New York, NY, USA, 1989. [Google Scholar]
  72. Bollen, K.A. A new incremental fit index for general structural equation models. Sociol. Methods Res. 1989, 17, 303–316. [Google Scholar] [CrossRef]
  73. Breivik, E.; Olsson, U.H. Adding variables to improve fit: The effect of model size on fit assessment in LISREL. In Structural Equation Modeling: Present and Future, A Festschrift in Honor of Karl Jöreskog; Cudeck, R., du Toit, S., Sörbom, D., Eds.; SSI: Lincoln Wood, IL, USA, 2001; pp. 169–194. [Google Scholar]
  74. Mulaik, S.A.; James, L.R.; Altine, J.V.; Bennett, N.; Lind, S.; Stilwell, C.D. Evaluation of goodness-of-fit indices for structural equation models. Psychol. Bull. 1989, 105, 430–445. [Google Scholar] [CrossRef]
Figure 1. Proposed relationship between digital literacy and civic participation, with reference to the formation of ‘Sustainable Digital Citizenship’.
Sustainability 12 01359 g001
Figure 2. Proposed model of digital opportunity. Note. DL: Digital literacy; DSL: Digital social life; AGI: Digitalized acquisition of government information; DC: Political participation of digital citizens.
Sustainability 12 01359 g002
Figure 3. Structural equation model for the complete sample. Note. DL: Digital literacy; DSL: Digital social life; AGI: Digitalized acquisition of government information; DC: The political participation of digital citizen; Unstandardized (B) and standardized (β) coefficients with standard errors in parentheses are presented.; R2 = squared multiple correlations. *** p < 0.001.
Sustainability 12 01359 g003
Figure 4. Structural equation model for two education background groups. Note. DL: Digital literacy; DSL: Digital social life; AGI: Digitalized acquisition of government information; DC: Political participation of digital citizens; β = LEB standardized path coefficient/HEB standardized path coefficient; B = LEB unstandardized path coefficient/ HEB unstandardized path coefficient; R2 = LEB squared multiple correlations/HEB squared multiple correlations. *** p < 0.001.
Sustainability 12 01359 g004
Table 1. Scale items and descriptive statistics.
NMinMaxMSD
Latent variable 1: Digital literacy
DL1: Are you aware that information is saved when you download apps or use web browsers with computers or cellphones?8373142.470.84
DL2: Are you aware that your activity on the Internet or any public available information is recorded and traced?8373142.910.85
Latent variable 2: Digital social life
DSL1: Did you search for any new information on the Internet in the last year? How often was it? 8373163.631.64
DSL2: Did you engage in audio and video activities on the Internet in the last year, such as watching movies or listening to music? How often was it? 8373164.191.73
DSL3: Did you post any photos or videos on Facebook or personal blogs in the last year? How often was it?8373162.041.34
Latent variable 3: Digitalized acquisition of government information
AGI1: Have you used the information provided by government websites, App, Facebook, or Line in the last year, such as searching for information on Ministry, County, or City official websites, downloading forms, looking up real-time traffic information and parking fees? How often was it? 8373161.631.03
AGI2: Have you ever used the “online declaration system” on government websites in the last year, such as online declaration, online tax filing, and online payment? How often was it?8373161.310.54
AGI3: Have you downloaded any government-issued public records in the last year? How often was it?8373161.150.52
Latent variable 4: The political participation of digital citizen
DC1: Have you ever expressed your opinion on public affairs on the Internet unofficially in the last year? 8373161.140.54
DC2: In the last year, when you saw other people’s comments on public issues that were different from yours, did you also leave a comment to express your ideas? How often was it?8373161.150.55
Note. N = samples; Min = minimum scale value; Max = maximum scale value; M = mean; SD = standard deviation.
Table 2. Survey respondent profile (N = 8373).
VariablesCategoryFrequency Percentage (%)
GenderMale397047.4
Female440352.6
Age12–142663.2
15–196477.7
20–2994311.3
30–39113513.6
40–49166519.9
50–59191122.8
60–6484610.1
65 or above96011.5
Education backgroundIlliteracy160.2
Self-learning 70.1
Primary school3293.9
Junior high school8019.6
Senior high school264831.6
College122514.6
Undergraduate262031.3
Post-graduate6838.2
Unknown440.5
Table 3. Latent variables and T test.
Latent VariableEducation BackgroundM (SD)T Test
Political participation of digital citizens (DC)LEB 1.11 (0.41)−7.46 ***
HEB 1.20 (0.57)
Digital literacy (DL)LEB 2.54 (0.73)−25.23 ***
HEB 2.94 (0.67)
Digital social life (DSL)LEB 3.05 (1.14)−26.89 ***
HEB 3.70 (1.01)
Digitalized acquisition of government information (AGI)LEB 1.26(0.45)−22.09 ***
HEB 1.53(0.60)
Note. HEB: Higher education background; LEB: Lower education background; N = samples, M (SD) = mean (standard deviation). *** p < 0.001.
Table 4. Confirmatory Factor Analysis (CFA) for the complete sample.
Latent VariablesM (SD)UFL (SE)SFL
Digital literacy
DL12.47 (0.84)2.59 (0.05) ***0.69
DL22.91 (0.85)2.82 (0.05) ***0.75
Digital social life
DSL13.63 (1.64)3.49 (0.09) ***0.66
DSL24.19 (1.73)2.88 (0.08) ***0.52
DSL32.05 (1.34)1.89 (0.06) ***0.44
Digitalized acquisition of government information
AGI11.63 (1.03)2.23 (0.06) ***0.60
AGI21.31 (0.54)1.08 (0.03) ***0.54
AGI31.15 (0.52)0.98 (0.03) ***0.52
The political participation of digital citizen
DC11.14 (0.54)1.94 (0.06) ***0.84
DC21.15 (0.55)1.47 (0.05) ***0.62
Note. M (SD): Means (standard deviation); USF (SE): Unstandardized factor loadings (standard error); SFL: Standardized factor loadings. *** p < 0.001.
Table 5. Squared correlations for the complete sample and AVE (N = 8373).
ConstructCRAVECorrelation Coefficient
1234
1. DL0.680.520.72 a
2. AGI0.570.310.27 ***0.56
3. DC0.700.550.12 ***0.17 ***0.74
4. DSL0.560.300.42 ***0.32 ***0.20 ***0.55
Note. a: Diagonal elements (bold) are the square roots of AVE. Off-diagonal elements are correlations between constructs; CR: Composite reliability; AVE: Average variance extracted; DL: Digital literacy; AGI: Digitalized acquisition of government information; DC: Digital citizen; DSL: Digital social life. *** p < 0.001.
Table 6. Path coefficient of SEM.
Hypothesized PathCorrelational RelationsUnstandardized Coefficient (SE)Standardized CoefficientDecision
H1:DL→DSLPositive0.95 (0.03) ***0.69Supported
H2:DSL→AGIPositive0.52 (0.02) ***0.59Supported
H3: DSL→DC Positive0.14 (0.02) ***0.19Supported
H4: AGI→DCPositive0.14 (0.02) ***0.17Supported
Note. SE: Standard error; *** p < 0.001.
Table 7. Multi-group path coefficient of SEM.
Hypothesized PathCorrelational RelationsStandardized Coefficient Decision
H1LEB DL→DSLPositive0.71Supported
HEB 0.54
H2LEB DSL→AGIPositive0.56Supported
HEB 0.51
H3LEB DSL→DC Positive0.19Supported
HEB 0.21
H4LEB AGI→DC Positive0.18Supported
HEB 0.14
Note. HEB: Higher education background; LEB: Lower education background. *** p < 0.001.
Table 8. Multi-group analysis for path coefficient of SEM and z-score test.
Hypothesized PathLEB: B (SE)HEB: B (SE)z-Score Test
H1: DLDSL1.00 (0.04) ***0.63 (0.04) ***0.001 (n.s.)
H2: DSLAGI 0.48 (0.03) ***0.50 (0.04) ***0.000 (n.s.)
H3: DSLDC 0.13 (0.02) ***0.19 (0.03) ***0.000 (n.s.)
H4: AGIDC0.15 (0.03) ***0.13 (0.03) ***0.000 (n.s.)
Note. HEB: Higher education background; LEB: Lower education background; B (SE): Unstandardized coefficient (standard error); n.s.: no significance. *** p < 0.001

