Investigating the Effects of City Logistics Measures on the Economy of the City


1
Dipartimento di ingegneria dell’Informazione, delle Infrastrutture e dell’Energia Sostenibile, Mediterranea University of Reggio Calabria, 89100 Reggio Calabria, Italy
2
Department of Enterprise Engineering, University of Rome Tor Vergata, 00133 Rome, Italy
*
Author to whom correspondence should be addressed.
Sustainability 2020, 12(4), 1439; https://0-doi-org.brum.beds.ac.uk/10.3390/su12041439
Submission received: 31 December 2019
/
Revised: 5 February 2020
/
Accepted: 8 February 2020
/
Published: 15 February 2020
(This article belongs to the Special Issue City Logistics)
Abstract
:The paper deals with economic effects due to city logistics implementations. An analysis framework is proposed and the results of a survey, consisting of interviews with experts in city logistics, are presented. The survey was carried out to point out the level of benefits or costs expected by city logistics measure implementation. The results show that city users are expected to receive more benefits from environment-friendly vehicle measures, while transport and logistics operators can averagely obtain considerable benefits from demand management and public–private collaboration solutions.
1. Introduction
Although urban freight transport plays an essential role in meeting the needs of citizens, it significantly contributes to non-sustainable effects on the environment, economy, and society. The rapid growth of urban freight transportation due to changes in the supply chain (e.g., just-in-time, home deliveries, and e-shopping) has resulted in ever-increasing numbers of deliveries and light goods vehicles in residential areas, generating major impacts on city sustainability and livability (Baur et al. [1], Ducret [2], Thompson and Flores [3], Visser et al. [4]). This growing number of goods vehicles in urban areas (McKinnon et al. [5]) compromises sustainability in three major fields, namely environment, economy, and society [6]:
With a view to tackling the above problems in the context of city planning, the European Commission promotes the concept of sustainable urban mobility, supporting guidelines for developing sustainable urban mobility plans (Calabrò et al. [15], Kiba-Janiak amd Witkowski [16], SUMP [17], Russo and Pellicanò [18]). Subsequently, the research project ENCLOSE (energy efficiency in city logistics services for small and mid-sized European historic towns; Ambrosino et al. [19]) defined the guidelines for developing and implementing sustainable urban logistics plans (SULPs).
Importantly, sustainable development objectives can be pursued by means of measures that are sometimes conflicting, and generate impacts that depend on the acceptance of stakeholders as well as external factors (Gatta et al. [20], Holguín-Veras et al. [21], Kaszubowski [22], Katsela and Browne [23], Stathopoulos et al. [24], Vidal Viera et al. [25], Van Duin et al. [26]). For example, local government (e.g., public authorities and planners) seeks to reduce transport impacts to ensure cities are more attractive for end consumers (e.g., residents and visitors) alike (mainly environmental and social sustainability, entailing a reduction in congestion, pollutants, and accidents), while retailers (or producers) and private companies (e.g., carriers) seek to deliver and pick up goods at the lowest cost, performing high-quality transport operations and achieving short lead-times in order to fulfill user expectations (mainly economic sustainability).
A large body of literature has been developed to analyze city sustainability in terms of environmental and social effects. Besides, even if several studies have investigated the environmental issues arising from urban freight transport (e.g., Baumgartner et al. [27], Dablanc and Montenon [28], Hwang and Ouyang [29], Leonardi and Baumgartner [30], McKinnon et al. [31], Rizet et al. [32], Waygood et al. [10]), they have mainly referred to CO2 emissions on the part of operators (e.g., shippers, transporters, consumers), while only a few of them identified the visions of city planners or administrators (Marcucci et al. [33], McKinnon [5]). Subsequently, starting from these first literature results, Russo and Comi [8] investigated the contribution of city logistics measures to improve environmental sustainability in European urban areas in terms of pollutant emissions, presenting some empirical relationships (i.e., models to identify effects) among environmental/green revealed goal indicators (e.g., reduction in air pollutant emissions: CO, NOx, SOx, PM) and city logistics measures.
On the other hand, the costs due to urban road accidents involving freight vehicles have been studied, given that they can be referred both to the accident victims (social) and to the road accidents (economic). The former ones refer to human costs, such as the cost of human life (lost productivity, non-pecuniary damage—moral and biological) and health care costs (costs of medical treatment). The latter ones are general costs due to the accident, such as property damage (damage to vehicles, buildings, roads, and so on) or administrative costs (costs of the intervention of emergency services, litigation costs, and administration). Russo and Comi [14], through a statistic-descriptive methodology, extracted from a large available database of successive and more in-depth information. Starting from aggregated (at national level) data for accidents involving goods vehicles in urban areas, the urban junctions were identified as the main critical situation for accidents.
In this context, the question of what the impact is of city logistics measures on the city’s economy and, in particular, on retailing, has been asked many times. The answers that are usually offered fall into a pattern with just “qualitative” opinions. The local retailers are skeptical, the representatives of national chain stores are neutral or optimistic, residents (or, in general, city users and visitors) normally agree, and the local authority (or city planner) considers that the city logistics measures will bring about the total and long-dreamed transformation of the town-center and eventually the attraction of investment. However, the issues that determine the success or failure of these measures are complicated and success in relation to increasing a city’s economy has to also be more deeply investigated. Therefore, any city planner who wants to improve city sustainability and livability has to study the effects of city measures within the economic sphere, which can influence the results significantly.
Then, focusing on the effects due to city logistics, the main question is, can the benefits produced balance the increase of costs supported by retailers and transport operators? To answer this, a survey on experts in city logistics was carried out and the results are discussed below.
The paper is organized as follows. Section 2 recalls the city logistics measures that are usually implemented around the world for improving city sustainability. Then, the subsequent Section 3 focuses on the contribution to the city’s economy (i.e., benefits and costs—general positive and negative impacts—with respect to the objectives of the community, or rather of different groups in the community) that is expected to be produced by the implementation of city measures. Section 4 reports the analysis of data coming from a survey that involved an expert panel with experience in city logistics. Finally, some conclusions are drawn in Section 5.
2. City Logistics Measure Overview
An efficient urban logistics system allows freight at decreasing prices to be moved, while the effective system is expressed by the stakeholders’ capacity to ensure freight delivery in terms of quantity, place, time, and meeting the customers’ requirements. The difficulty in managing such a system concerns the various stakeholders involved and the constraints dictated by the urban structure and high sprawl level of retail activities, and the existence of a distribution process in which the recipient manages the last mile.
These objectives can be achieved by implementing different theoretical classes of city logistics measures, which can be organized in the following manner (Russo and Comi [34]):
- supply management measures, i.e., they try to push towards more optimized behaviors through the implementation of some mandatory regulations. Such a class includes time-window access (reservation of urban space for passengers for a limited time during working-days); vehicle dimension constraints (reservation of urban space for environmental-friendly vehicles); urban consolidation centers (UCC, transshipment point for linkage between long-distance transport and the last-mile performed through low impact vehicles with optimized loads); nearby delivery area (NDA, load consolidation and distribution through low impacting vehicles—generally, trolley);
- demand management, i.e., they force the aggregation of loads through mandatory cooperation, partnerships, and last-mile optimization (e.g., maximization of loads);
- infrastructure; they refer to the promotion of the development of new infrastructures for optimizing freight movements and more performing opportunities offered to operators that can use them for delivering within metropolitan/urban areas. Such a class includes delivery area networks (including booking) within a limited traffic zone (LTZ), a network of urban consolidation centers and nearby delivery areas (i.e., building of an urban freight network on two levels; 1st level—long-haulage with urban borders, e.g., UCC; 2nd level—urban borders to final receiver, e.g., NDA), pick-up points for new purchase patterns (e.g., lockers for e-purchases);
- use of information and communication technology (ICT) and intelligent transport system (ITS) may both improve effectiveness (in terms of high service levels) and efficiency (in terms of cost reduction) of logistics flows, and reduce negative externalities, also improving enforcement efficiency and broadening the scope of enforcement [35]. Such a class includes promotion of specific app or web-based services for communicating/controlling access to LTZ using existing telematics networks; specific app or services for booking delivery bays using existing telematics networks; traffic management and control providing suggestions on prescriptive or descriptive delivery tours (i.e., network of intelligent traffic lights); private operator freight transport management systems, possibly connected with the city telematics platform (e.g., private operators use their own management systems connected with the city platform to obtaining information on traffic, active regulations, and so on);
- environment-friendly vehicles, which limit the pollutant emissions from road vehicles. Such a class includes actions devote to strengthen the use of zero-emission vehicles or to provide access constraints according to environmental issues;
- public–private collaboration such as freight quality partnerships (fqp) or particular projects in which the public and private sector share interests and objectives and where there is often an element of shared risk and reward (Browne et al. [36]); different stakeholders can participate, and the public administration can lead it;
- reverse logistics (i.e., attention should be paid to all phases from product return to recycling), which can be disaggregated into reverse logistics only for recycling scrap (e.g., specific services are provided for collecting recycling scrap) and reverse logistics also for recycling scrap (e.g., vehicles after delivering can collect recycling scrap from the same/or not delivery points).
Above, for the sake of readability, the measures are recalled. For more details, refer to Russo and Comi [8,37], while for a practical/effective guideline for implementation, refer to Calabrò et al. [15,38] and Holguín-Veras et al. [39,40]. Focusing on the economic impacts that they generate, the above classes of measures produce benefits for city users (passengers) and operators (both transport and retailers). As discussed in the section below, some of them are mainly devoted to improving the urban experiences of city users, creating a more welcoming area environment for pushing an increase in retail sales, with benefits both for passengers and operators. On the other hand, most of them cause an increase in short time costs, impacting on the current organization of delivery. Besides, such measures merged with the other actions implemented for promoting sustainable urban development allow the transformation of the city’s streets from unwelcoming, traffic-dominated corridors to safer, more attractive public spaces that better accommodate all users. Generally, the aversion of city logistics actors to measures is caused by the fact that the effects that are not related to city logistics (e.g., in some cities, pedestrianization is implemented through time windows and access constraints) are associated with it.
3. Economy and City Logistics
The costs associated with freight transport represent a significant proportion of the total cost of production for some commodities. These are costs supported by the shipper, receiver (retailer), and transport and logistics operator, and include such components as drivers’ wages, vehicle operating costs, vehicle depreciation and registration charges, as well as the terminal costs of packaging, storing, loading, unloading, recording, and insuring the goods.
Urban freight involves a great variety of activities and vehicle operations, ranging from full truckloads to individual parcels and letters, and from large combination vehicles to small passenger-type vehicles. Inevitably, there are enormous variations in efficiency and productivity across different tasks and activities, particularly those involving pick-up and delivery rounds, capacity utilization, average truck speed, and average shipment size. This does not necessarily imply low levels of efficiency, as the particular firm may be utilizing its resources to the maximum extent possible given the operating environment, but it does imply that there is potential for productivity gains.
In this context, city logistics aim to minimize or at least to reduce transport operational costs. Of course, there are different aspects of transport costs to be considered when city logistics is implemented, which can be pushed to more efficient use of the resources: costs incurred en route (mainly due to congestion), costs incurred at customer point (loading and unloading operations), and energy issues.
Although a large body of literature on city logistics exists, values added services have not been studied. This is also one of the main limitations in the success of city logistics measures. In fact, city logistics measures implementation rarely deals with business models to show how such actions can create new value for involved stakeholders (i.e., city users, retailers, transport and logistics operators, public administrations). Gammelgaard et al. [41] proposed a framework for understanding how city logistics services co-creates value for users. They focused on the case of urban consolidation centers and proposed two cases of study. The case studies documented how delivery patterns and value-adding services affect in-store operations, especially in the areas of store management and employee resources, but also, to some extent, in relation to space usage.
The question of what the impacts of pedestrianization and some traffic limits on retailing are was mainly investigated under the point of view of passengers (city users). Although business owners, who eventually happily agreed to large-scale pedestrianization, and who had just been convinced that the action to limit motor-vehicle impact by introducing vehicle access limitations (e.g., pedestrianization) was not as damaging to their trade as had been assumed, become agitated about the threat of the implementation of a vehicle-free city, the most radical green transport policy so far suggested. Every town has started discussions along these lines and has experienced opposition from its traders. From the past, Hass-Klau [42] focused on such an impact, showing that such a measure, after a first objection, becomes very attractive and well accepted by almost all stakeholders (i.e., city users, retailers, transport, and logistics operators) if adequate and comprehensive measures are implemented. Some studies carried out in 10 German cities revealed that about 83% of retailing businesses within pedestrianization areas reported an increase in turnover, compared with only 20% of retailing businesses outside the pedestrian areas. The same pattern was seen for restaurants (63% compared with 25%), although the action advantage was much less marked for hotels. For each category of business, those inside the newly regulated areas were more successful than those outside. A recent study carried out in some districts of London claims that people walking, cycling, and using public transport spend more than motorists in local shops, i.e., city users not in cars spend 40% more than motorists (Carmona et al. [43]).
However, not only can turnover increase, costs increase as well, irrespective of whether the turnover increases or declines. Most importantly, costs in such areas increase more consistently than in the outside areas, but the important point is that profits increase and the firms trading inside the area are consistently favored. In fact, as emerged in London, Carmona [44] investigated the link between creating enjoyable spaces, where people want to spend time and the results for better business. In these areas improved, the number of people walking in the streets increased by 93%. People also spent more time in the street, with a 216% increase in activities such as going into shops and cafés.
4. A Survey for Assessing City Logistics Effects
The expected benefits/costs of each measure, recalled in an earlier section, were investigated through an experienced panel consisting of 54 of the highest skilled persons in the scientific world. Even if it is not easy to include persons with highest skills in only one class, the involved experts can be considered belonging to the following classes: technicians (11%), researchers (42%), and planners (47%) working/studying city logistics with full knowledge on the investigated city’s measures (i.e., 95% with an experience longer than three years). Each interviewee was asked to score city logistics measures according to his/her experience in creating benefits or costs to three classes of actors, i.e., city users (e.g., travelers, end consumers), retailers (receivers), and transport and logistics operators (Table 1). Each of the panel participants put a weight from −10 to −1 if a cost is expected, from +1 to +10 if a benefit, and 0 otherwise.
All measures recalled in Section 2 were checked, and the first results are synthesized in Table 1, which reports the aggregate score for classes of measures and actors. It emerges that, for the interviewees, all measures can averagely produce positive effects (last column of Table 1), varying from a lower value of environment-friendly vehicles, followed by supply management class, to the higher value of demand management class. Table 2 synthesizes the standard deviations revealed for each class of city logistics measures, showing that some of them have opposite trends with respect to the average score, e.g., supply management has one of the higher values and demand management the lower. Besides, the benefits expected are higher for city users than for retailers or transport and logistics operators. Again, where there is the maximum score (e.g., demand management), there is the minimum value of standard deviation, confirming that among the interviewees, a homogeneous opinion emerges. On the other hand, where the minimum score is given, the high value of standard deviation was revealed (e.g., environment-friendly vehicles), showing that a shared expectation has not yet reached.
- supply management is expected to produce averagely low positive results; in fact, they are, in general, easy to implement, while they could produce satisfactory results for city users that can be accepted indifferently by retailers, and negatively by transport and logistics operators, given that it is expected their business will change shortly for delivery; on the other hand, it presents one of the higher values of standard deviation (the average coefficient of variation (CV) is 4.99), showing the different expectations among the experts;
- the best results can be obtained by the implementation of the demand management class that also presents the lower value of the coefficient of variation, i.e., 0.83;
- the class of infrastructural actions obtained a high score but also a high value of standard deviation, with a subsequent CV equal to 1.31; differences were revealed among the three classes of actors: city users have the high score with a CV less than 1.00, while the transport and logistics operator class has a score similar to retailers but with a higher value of CV;
- good results are expected by ICT/ITS, too, which presents, as demand management class and public–private collaboration, the low value of dispersion (i.e., standard deviation); the CV is equal to 1.17;
- the environment-friendly vehicle measures are expected to produce an averagely low benefit, although the city users obtained a higher score. In fact, although the benefits for city users can be significant, and the retailers are quite indifferent (even if they can have subsequent benefits due to the increased turnover), the high costs are probably supported by transport and logistics operators (and by retailer transport on their own account) for renewal fleets; the high dispersion confirms that the experts do not fully agree on the impact that such actions can determine;
- the public–private collaboration class is expected to produce high benefit and, in particular, for retailers and transport and logistics operators; an average low CV, i.e., 0.91, was revealed, showing a homogeneous opinion among interviewees;
- the reverse logistics class reported a higher value for retailers with a low value of CV, i.e., 0.90; averagely, the value of dispersion is low with a high average score, i.e., 3.55.
Then, as it emerges from Table 1, although the average scores for the three investigated actors are quite positive (3.58, 2.40, and 1.55, respectively), the opposite trend emerges for supply management and environment-friendly vehicles by transport and logistics operators (−1.61 and −4.08, respectively). In fact, while high benefits are expected for city users, they expected to produce high costs for transport and logistics operators given that there is the need to revise their operations in order to meet the constraints introduced. On the other hand, the benefits for city users can increase the attractiveness of the city, as shown in London (Carmona [40]). Such a modification can hence determine an increase in retailers’ turnover.
This analysis tries to consider that generally, in an implemented plan, there is a city logistics scenario defined as a mix of the measures recalled above, and then the outputs and outcomes derive from the system of measures and there is not a one-to-one result. Besides, such an analysis belongs to the class of output-orientation, given that the implemented investment costs are not taken into consideration although they are one of the most important factors for city logistics measures assessments. Different analyses are in progress in order to study the relationships between city logistics expected results (outcomes) and investment costs that belong to the input-oriented ones. For example, comparing infrastructure actions and ITS measures, which have the higher costs of investment due to that both require to build physical infrastructures, it emerges that the class of infrastructure actions has the higher score while the ITS class has a lower value of CV, i.e., 1.17 vs. 1.31.
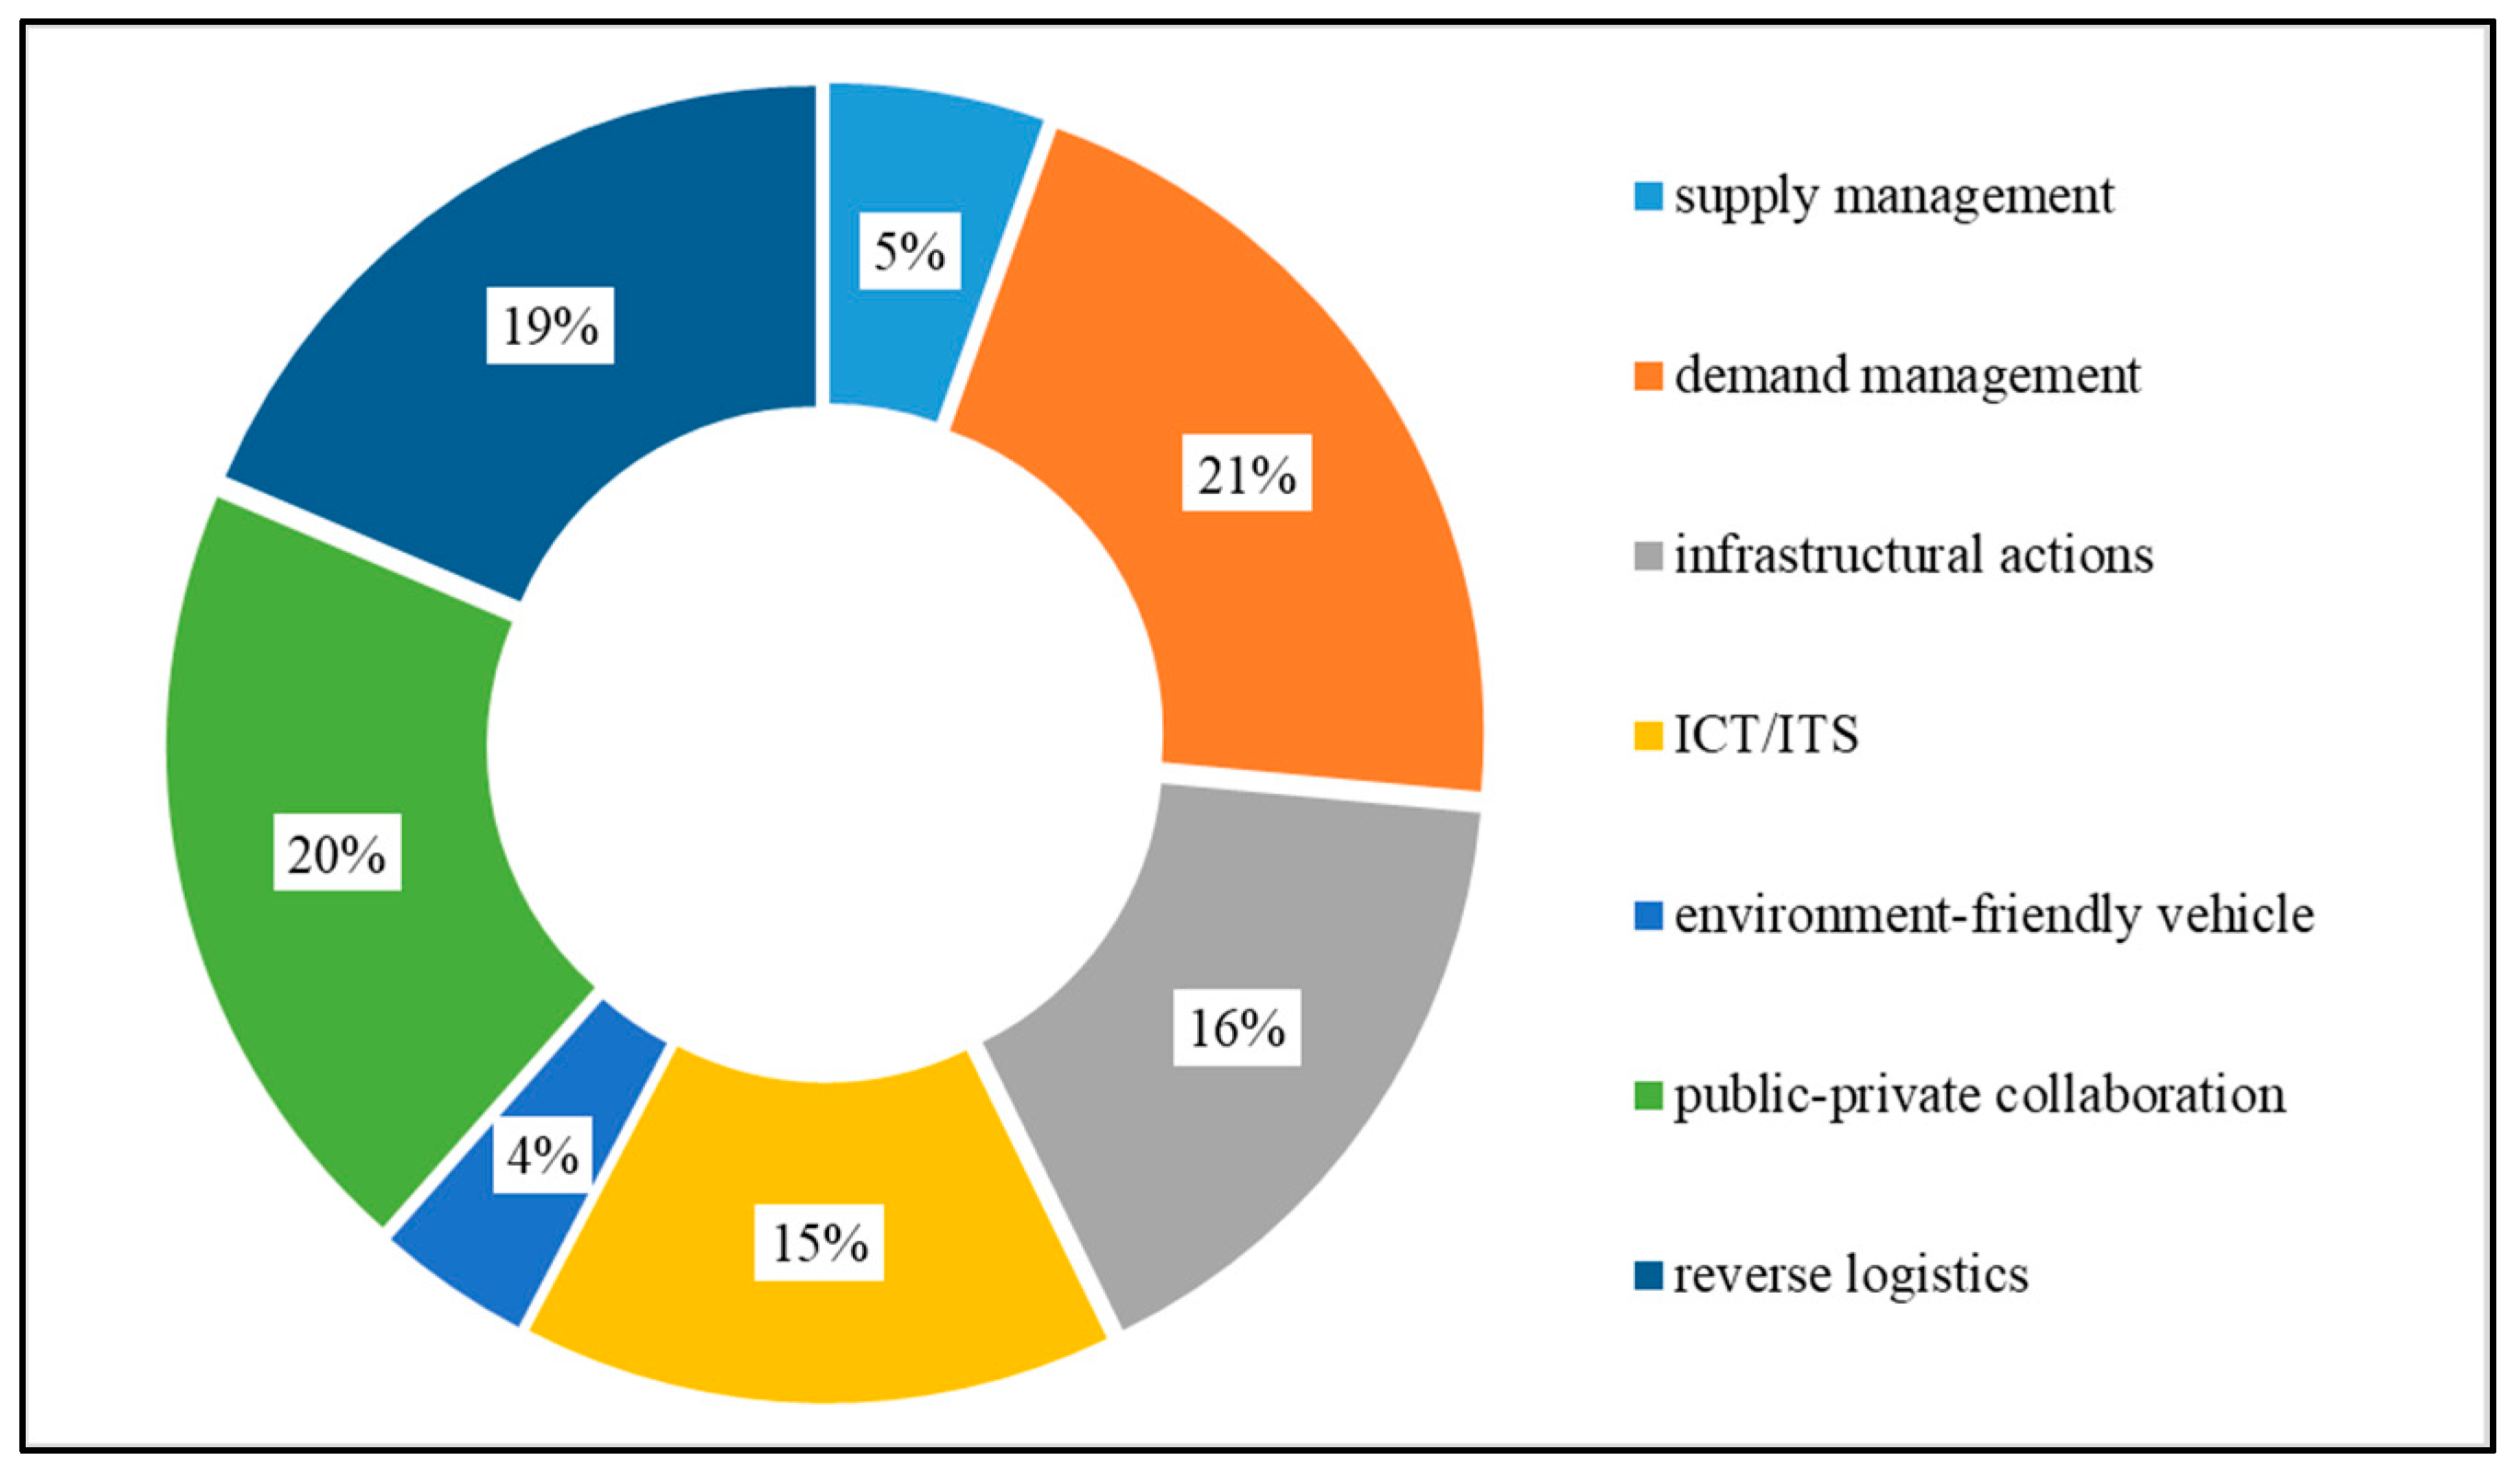
Figure 1 reports the survey results in terms of average score obtained and allows us to compare the eight classes of measures, showing how environmental-friendly vehicle measures are expected to produce not-so-high average results, i.e., 4% = 0.74/(1.03 + … + 3.55), which are poorer than the others. The planners from the results, pictured in Figure 1, have an overview of the expected outcomes of city logistics measures, which provides the average contribution of each class of measures in relation to the economic sustainability goals. It may be noted that the incidence of demand management and public–private collaboration to obtain benefits for all identified class of actors is always higher, and it is one of the high values obtained for the class transport and logistics operators (Table 1).
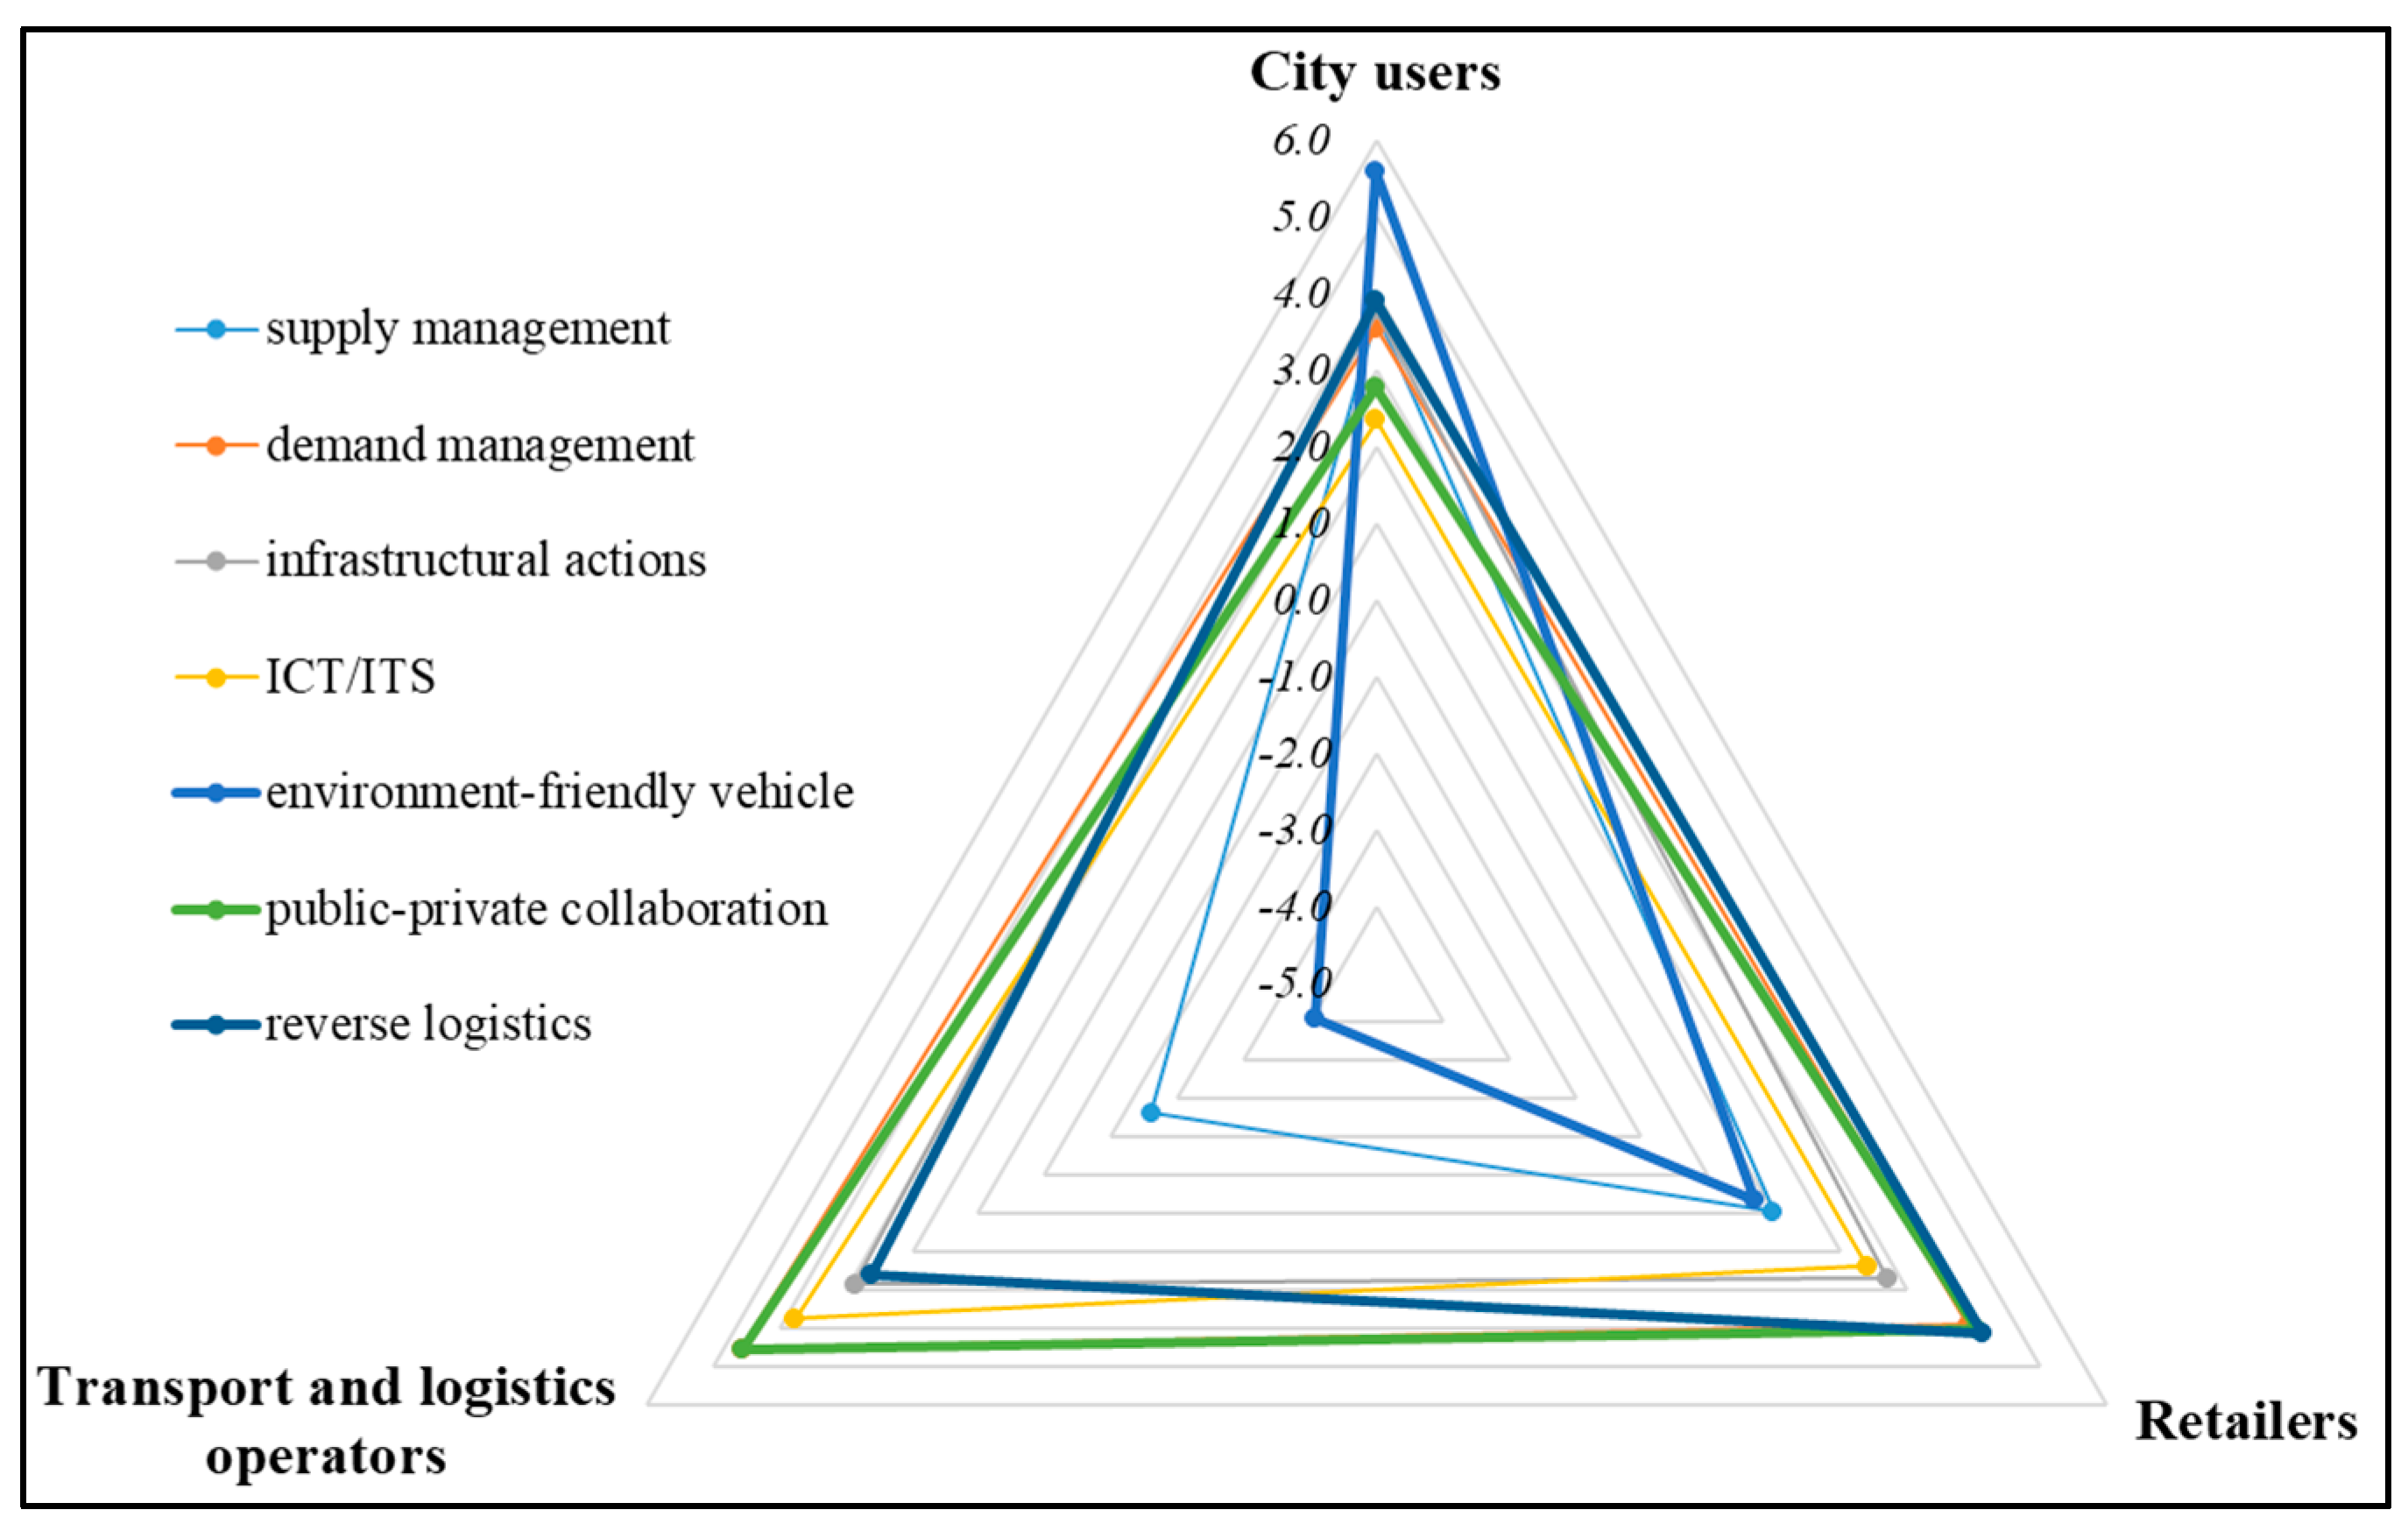
Subsequently, each class of measures can be analyzed with respect to actors (Figure 2). Given a city, the best results in terms of expected benefits could be obtained by
- environment-friendly vehicles for city users;
- public–private collaboration and reverse logistics for retailers;
- public–private collaboration as well as by ICT/ITS for transport and logistics operators.
The comparison analysis, plotted in Figure 2, also confirmed that the demand management measures have higher positive effects. In fact, they could push actors towards more efficient patterns, i.e., improving load factors, moving away from peak hours with a subsequent increase in commercial speed and reduction in interference with other mobility components.
Therefore, according to the results obtained from such a survey, the answer to the main question that guides the study can be provided. It emerges that city logistics measures averagely produce satisfactory and positive results for all the three classes of actors (2.66), even if there is not a balance between benefits and costs expected for supply and environment-friendly vehicle measures, as shown in Table 1, where benefits are not greater than costs. City users are expected to receive high benefits, while transport and logistics operators, who suffer the constraints of markets as well as of receivers, are foreseen to report a lower score with higher standard deviation.
5. Conclusions
The paper discusses the economic effects that can derive from city logistics. The paper aims to point out how city logistics can become a useful tool available to planners and city administrators for improving a city’s economy. In fact, from the survey, it emerged that the largest benefits are expected for city users because more sustainable and livable environments are foreseen to be built. As the London research proves, adapting city streets (i.e., through the implementation of city logistics for limiting the number of goods vehicles) to enable more people to walk and cycle, making the streets cleaner, healthier, and more welcoming, encourages more people to shop locally. Moreover, it is good for business and property values. We can use this knowledge when city logistics scenarios are being implemented. Or we can ignore it and suffer the consequences.
The results presented in the earlier sections could be improved by enlarging the panel to include more technicians from cities and involve stakeholders from the communities (e.g., association of consumers) as well as retailers, and transport and logistics operators. In fact, the results show the point of view from experts and do not take into consideration the benefits or costs directly expected by city logistics actors. On the other hand, they provide some indications of future research directions. In fact, although a large body of literature exists on demand management actions for urban/region contexts, few studies refer to city logistics. The opportunity offered by ICT/ITS should also be exploited in depth through the involvement of cities in testing some advanced solutions. Then, the ICT/ITS for demand management that should also be highlighted, according to the results of this study, are the class of actions with higher expected benefits.
In addition, the further development could focus on how much money city logistics measures bring to the city and to test with real cases how delivery patterns and the possible value-adding services affect in-store operations. Finally, further developments should be mainly addressed to assess the effects of city logistics plan and to investigate how operators (both retailers and transporters/distributors) have faced this new opportunities. A cost-benefit analysis could be also developed in order to point out the high relationship between costs and expected outcomes. In fact, the best results do not always derive from high costs of implementation, e.g., supply management, as well as environment-friendly vehicle measures, are expected to produce lowest benefits but they could support high costs due to the renewal of the fleet. Therefore, a detailed analysis of costs generated by the implementation of each measure should be pointed out. Finally, further analyses are in progress to extend in these first results to include data from panels consisting of users (also disaggregated for residence and shopping location), retailers, and stakeholders, and for taking into account the costs of implementation.
Author Contributions
F.R. coordinated the research and carried out the critical analysis of the results. A.C. reviewed the literature, delivered the survey and carried out the analysis of results. Both authors have read and approved the final manuscript. All authors have read and agreed to the published version of the manuscript.
Funding
This research received no external funding.
Acknowledgments
The authors wish to thank experts that collaborate to this research filling in the questionnaire, and to the participants of City Logistics Conferences 2019 for their suggestions on preliminary results, the anonymous reviewers for their suggestions, which were most useful in revising the paper. The researchers that would like to use the dataset can contact the authors who are delighted to share it (that will be anonymized to comply with respondents’ privacy).
Conflicts of Interest
The authors declare no conflict of interest.
References
- Baur, A.H.; Thess, M.; Kleinschmit, B.; Creutzig, F. Urban Climate Change Mitigation in Europe: Looking at and beyond the Role of Population Density. J. Urban Plan. Dev. 2014, 140, 04013003. [Google Scholar] [CrossRef] [Green Version]
- Ducret, R. Parcel deliveries and urban logistics: Changes and challenges in the courier express and parcel sector in Europe—The French case. Res. Transp. Bus. Manag. 2014, 11, 15–22. [Google Scholar] [CrossRef]
- Thompson, R.G.; Flores, G. Understanding Deliveries to Towers in Melbourne. Transp. Res. Procedia 2016, 16, 510–516. [Google Scholar] [CrossRef] [Green Version]
- Visser, J.; Nemoto, T.; Browne, M. Home Delivery and the Impacts on Urban Freight Transport: A Review. Procedia-Soc. Behav. Sci. 2014, 125, 15–27. [Google Scholar] [CrossRef] [Green Version]
- McKinnon, A. The Role of Government in Promoting Green Logistics. In Green Logistics—Improving the Environmental Sustainability of Logistics; McKinnon, A., Cullinane, S., Browne, M., Whiteing, A., Eds.; Kogan Page: London, UK, 2010. [Google Scholar]
- United Nations. Transforming Our World: The 2030 Agenda for Sustainable Development. Resolution Adopted by the General Assembly on 25 September 2015; United Nations: San Francisco, CA, USA, 2015. [Google Scholar]
- Coulombel, N.; Dablanc, L.; Gardrat, M.; Koning, M. The environmental social cost of urban road freight: Evidence from the Paris region. Transp. Res. Part D 2018, 63, 514–532. [Google Scholar] [CrossRef]
- Russo, F.; Comi, A. Urban Freight Transport Planning towards Green Goals: Synthetic Environmental Evidence from Tested Results. Sustainability 2016, 8, 381. [Google Scholar] [CrossRef] [Green Version]
- Taniguchi, E. City logistics for sustainable and liveable cities. In Green Logistics and Transportation: A Sustainable Supply Chain Perspective; Fahimia, B., Bell, M.G.H., Hensher, D.A., Sarkis, J., Eds.; Springer International Publishing: Cham, Switzerland, 2015; pp. 49–60. [Google Scholar]
- Waygood, E.O.D.; Chatterton, T.; Avineri, E. Comparing and presenting city-level transportation CO2 emissions using GIS. Transp. Res. Part D 2013, 24, 127–134. [Google Scholar] [CrossRef]
- Marcucci, E.; Le Pira, M.; Carrocci, C.S.; Gatta, V.; Pieralice, E. Connected shared mobility for passengers and freight: Investigating the potential of crowdshipping in urban areas. In Proceedings of the 5th IEEE International Conference on Models and Technologies, Naples, Italy, 26–28 June 2017; IEEE: Piscataway, NJ, USA, 2017. [Google Scholar]
- Taniguchi, E.; Fwa, T.F.; Thompson, R.G. Urban Transportation and Logistics: Health, Safety, and Security Concerns; CRC Press: Boca Raton, FL, USA, 2013. [Google Scholar]
- Elvik, R.; Vaa, T.; Erke, A.; Sorensen, M. The Handbook of Road Safety Measures; Emerald Group Publishing: Bingley, UK, 2009. [Google Scholar]
- Russo, F.; Comi, A. From the analysis of European accident data to safety assessment for planning: The role of good vehicles in urban area. Eur. Transp. Res. Rev. 2017, 9, 1–12. [Google Scholar] [CrossRef] [Green Version]
- Calabrò, T.; Cozza d’Onofrio, M.; Iritano, G.; Trecozzi, M.R. Regional Plan and Program linked to EU policy for city logistics: The case of Calabria Region. In WIT Transactions on the Built Environment; WIT Press: Southampton, UK, 2019; Volume 188. [Google Scholar]
- Kiba-Janiak, M.; Witkowski, J. Sustainable Urban Mobility Plans: How Do They Work? Sustainability 2019, 11, 4605. [Google Scholar] [CrossRef] [Green Version]
- SUMP. Guidelines. Developing and Implementing a Sustainable Urban Mobility Plan, 2nd ed.; European Commission: Brussels, Belgium, 2019. [Google Scholar]
- Russo, F.; Pellicanò, D.S. Planning and sustainable development of: Urban logistics: From international goals to regional realization. Wit Trans. Ecol. Environ. 2019, 238, 59–72. [Google Scholar]
- Ambrosino, G.; Liberato, A.; Pettinelli, I. Sustainable Urban Logistics Plans (SULP) Guidelines; CIVITAS Forum: Ljubljana, Slovenia, 2015. [Google Scholar]
- Gatta, V.; Marcucci, E.; Delle Site, P.; Le Pira, M.; Carrocci, C.S. Planning with stakeholders: Analysing alternative off-hour delivery solutions via an interactive multi-criteria approach. Res. Transp. Econ. 2019, 73, 53–62. [Google Scholar] [CrossRef]
- Holguín-Veras, J.; Wang, X.C.; Sánchez-Díaz, I.; Jaller, M.; Wojtowicz, J. Fostering unassisted off-hour deliveries: The role of incentives. Transp. Res. Part A: Policy Pract. 2017, 102, 172–187. [Google Scholar]
- Kaszubowski, D. A Method for the Evaluation of Urban Freight Transport Models as a Tool for Improving the Delivery of Sustainable Urban Transport Policy. Sustainability 2019, 11, 1535. [Google Scholar] [CrossRef] [Green Version]
- Katsela, K.; Browne, M. Importance of the Stakeholders’ Interaction: Comparative, Longitudinal Study of Two City Logistics Initiatives. Sustainability 2019, 11, 5844. [Google Scholar] [CrossRef] [Green Version]
- Stathopoulos, A.; Valeri, E.; Marcucci, E. Stakeholder reactions to urban freight policy innovation. J. Transp. Geogr. 2012, 22, 34–45. [Google Scholar] [CrossRef]
- Vidal Viera, J.G.; Veiga Mendes, J.; Suyama, S.S. Shippers and freight operator perceptions of sustainable initiative. Eval. Program Plan. 2016, 54, 173–181. [Google Scholar] [CrossRef] [PubMed]
- Van Duin, R.; Wiegmans, B.; Tavasszy, L.; Hendriks, B.; He, Y. Evaluating new participative city logistics concepts: The case of cargo hitching. Transp. Res. Procedia 2019, 39, 565–575. [Google Scholar] [CrossRef]
- Baumgartner, M.; Leonardi, J.; Krusch, O. Improving computerized routing and scheduling and vehicle telematics: A qualitative survey. Transp. Res. Part D 2008, 13, 377–382. [Google Scholar] [CrossRef]
- Dablanc, L.; Montenon, A. Impacts of environmental access restrictions on freight delivery activities example of low emissions zones in Europe. Transp. Res. Rec. 2015, 2478, 12–18. [Google Scholar] [CrossRef] [Green Version]
- Hwang, T.; Ouyang, Y. Urban Freight Truck Routing under Stochastic Congestion and Emission Considerations. Sustainability 2015, 7, 6610–6625. [Google Scholar] [CrossRef] [Green Version]
- Leonardi, J.; Baumgartner, M. CO2 efficiency in road freight transportation: Status quo, measures and potential. Transp. Res. Part D 2004, 9, 451–464. [Google Scholar] [CrossRef]
- McKinnon, A.; Cullinane, S.; Browne, M.; Whiteing, A. Green Logistics—Improving the Environmental Sustainability of Logistics; Kogan Page: London, UK, 2010. [Google Scholar]
- Rizet, C.; Browne, M.; Cornelis, E.; Leonardi, J. Assessing carbon footprint and energy efficiency in competing supply chains: Review—Case studies and benchmarking. Transp. Res. Part D 2012, 17, 293–300. [Google Scholar] [CrossRef]
- Marcucci, E.; Gatta, V.; Valeri, E.; Stathopoulos, A. Urban Freight Transport Modelling: An Agent-Specific Approach; FrancoAngeli: Milan, Italy, 2013. [Google Scholar]
- Russo, F.; Comi, A. From city logistics theories to city logistics planning. In City Logistics 3—Towards Sustainability and Liveable Cities; Taniguchi, E., Thompson, R.G., Eds.; ISTE Ltd., John Wiley and Sons: London, UK, 2018; pp. 329–348. [Google Scholar]
- Comi, A.; Buttarazzi, B.; Schiraldi, M. Smart urban freight transport: tools for planning and optimising delivery operations. In Simulation Modelling Practice and Theory 88; Elsevier: Oxford, UK, 2018; pp. 48–61. [Google Scholar] [CrossRef]
- Browne, M.; Nemoto, T.; Visser, J.; Whiteing, T. Urban Freight Movements and Public-Private Partnership. In Logistics Systems for Sustainable Cities; Elsevier: Oxford, UK, 2016; pp. 17–35. [Google Scholar] [CrossRef] [Green Version]
- Russo, F.; Comi, A. Measures for sustainable freight transportation at urban scale: Expected goals and tested results in Europe. J. Urban Plan. Dev. 2011, 137. [Google Scholar] [CrossRef]
- Calabrò, T.; Iritano, G.; Trecozzi, M.R. Activities training on city logistics: Case of Calabria region. Wit Trans. Ecol. Environ. 2019, 238, 161–171. [Google Scholar]
- Holguín-Veras, J.; Leal, J.A.; Sánchez-Diaz, I.; Browne, M.; Wojtowicz, J. State of the art and practice of urban freight management Part I: Infrastructure, vehicle-related, and traffic operations. Transp. Res. Part A 2019. [Google Scholar] [CrossRef]
- Holguín-Veras, J.; Leal, J.A.; Sánchez-Diaz, I.; Browne, M.; Wojtowicz, J. State of the art and practice of urban freight management Part II: Financial approaches, logistics, and demand management. Transp. Res. Part A 2019. [Google Scholar] [CrossRef]
- Gammelgaard, B.; Andersen, C.B.G.; Aastrup, J. Value co-creation in the interface between city logistics provider and in-store processes. Transp. Res. Procedia 2016, 12, 787–799. [Google Scholar] [CrossRef] [Green Version]
- Hass-Klau, C. Impact of pedestrianization and traffic calming on retailing. Transp. Policy 1993, 1, 21–31. [Google Scholar] [CrossRef]
- Carmona, M.; Gabrieli, T.; Hickman, R.; Laopoulou, T.; Livingstone, N. Street appeal: The value of street improvements. Prog. Plan. 2018, 126, 1–51. [Google Scholar] [CrossRef]
- Carmona, M. Place value: Place quality and its impact on health, social, economic and environmental outcomes. J. Urban Des. 2019, 24, 1–48. [Google Scholar] [CrossRef] [Green Version]
Figure 1.
The relative economic impact of each class of measures.

Figure 2.
The economic impact of each class of measures with respect to a class of actors.


Table 1.
Aggregate score for class of measures and actors.
| City Users | Retailers/Receivers | Transport and Logistics Operators | AVERAGE SCORE | |
|---|---|---|---|---|
| supply management | 3.73 | 0.99 | −1.61 | 1.03 |
| demand management | 3.55 | 3.92 | 4.56 | 4.01 |
| infrastructural actions | 3.77 | 2.70 | 2.86 | 3.11 |
| ICT/ITS | 2.35 | 2.40 | 3.76 | 2.84 |
| environment-friendly vehicle | 5.60 | 0.69 | −4.08 | 0.74 |
| public-private collaboration | 2.76 | 4.05 | 4.55 | 3.79 |
| reverse logistics | 3.90 | 4.13 | 2.61 | 3.55 |
| AVERAGE SCORE | 3.58 | 2.40 | 1.55 | 2.66 |
Table 2.
Aggregate standard deviation of scores for classes of measures and actors.
| City Users | Retailers/Receivers | Transport and Logistics Operators | AVERAGE SCORE | |
|---|---|---|---|---|
| supply management | 3.97 | 4.25 | 5.61 | 5.14 |
| demand management | 3.02 | 3.17 | 3.65 | 3.31 |
| infrastructural actions | 3.43 | 3.68 | 4.88 | 4.06 |
| ICT/ITS | 2.79 | 3.98 | 3.25 | 3.33 |
| environment-friendly vehicle | 4.33 | 3.73 | 4.07 | 5.66 |
| public-private collaboration | 3.17 | 3.27 | 3.53 | 3.46 |
| reverse logistics | 3.71 | 3.70 | 4.33 | 3.97 |
| AVERAGE SCORE | 3.63 | 3.89 | 5.45 | 4.43 |
© 2020 by the authors. Licensee MDPI, Basel, Switzerland. This article is an open access article distributed under the terms and conditions of the Creative Commons Attribution (CC BY) license (http://creativecommons.org/licenses/by/4.0/).
Share and Cite
MDPI and ACS Style
Russo, F.; Comi, A. Investigating the Effects of City Logistics Measures on the Economy of the City. Sustainability 2020, 12, 1439. https://0-doi-org.brum.beds.ac.uk/10.3390/su12041439
AMA Style
Russo F, Comi A. Investigating the Effects of City Logistics Measures on the Economy of the City. Sustainability. 2020; 12(4):1439. https://0-doi-org.brum.beds.ac.uk/10.3390/su12041439
Chicago/Turabian StyleRusso, Francesco, and Antonio Comi. 2020. "Investigating the Effects of City Logistics Measures on the Economy of the City" Sustainability 12, no. 4: 1439. https://0-doi-org.brum.beds.ac.uk/10.3390/su12041439
Note that from the first issue of 2016, this journal uses article numbers instead of page numbers. See further details here.