Flood Risk Assessment Based on Fuzzy Synthetic Evaluation Method in the Beijing-Tianjin-Hebei Metropolitan Area, China

 ,
, 
Abstract
:1. Introduction
2. Study Area and Data
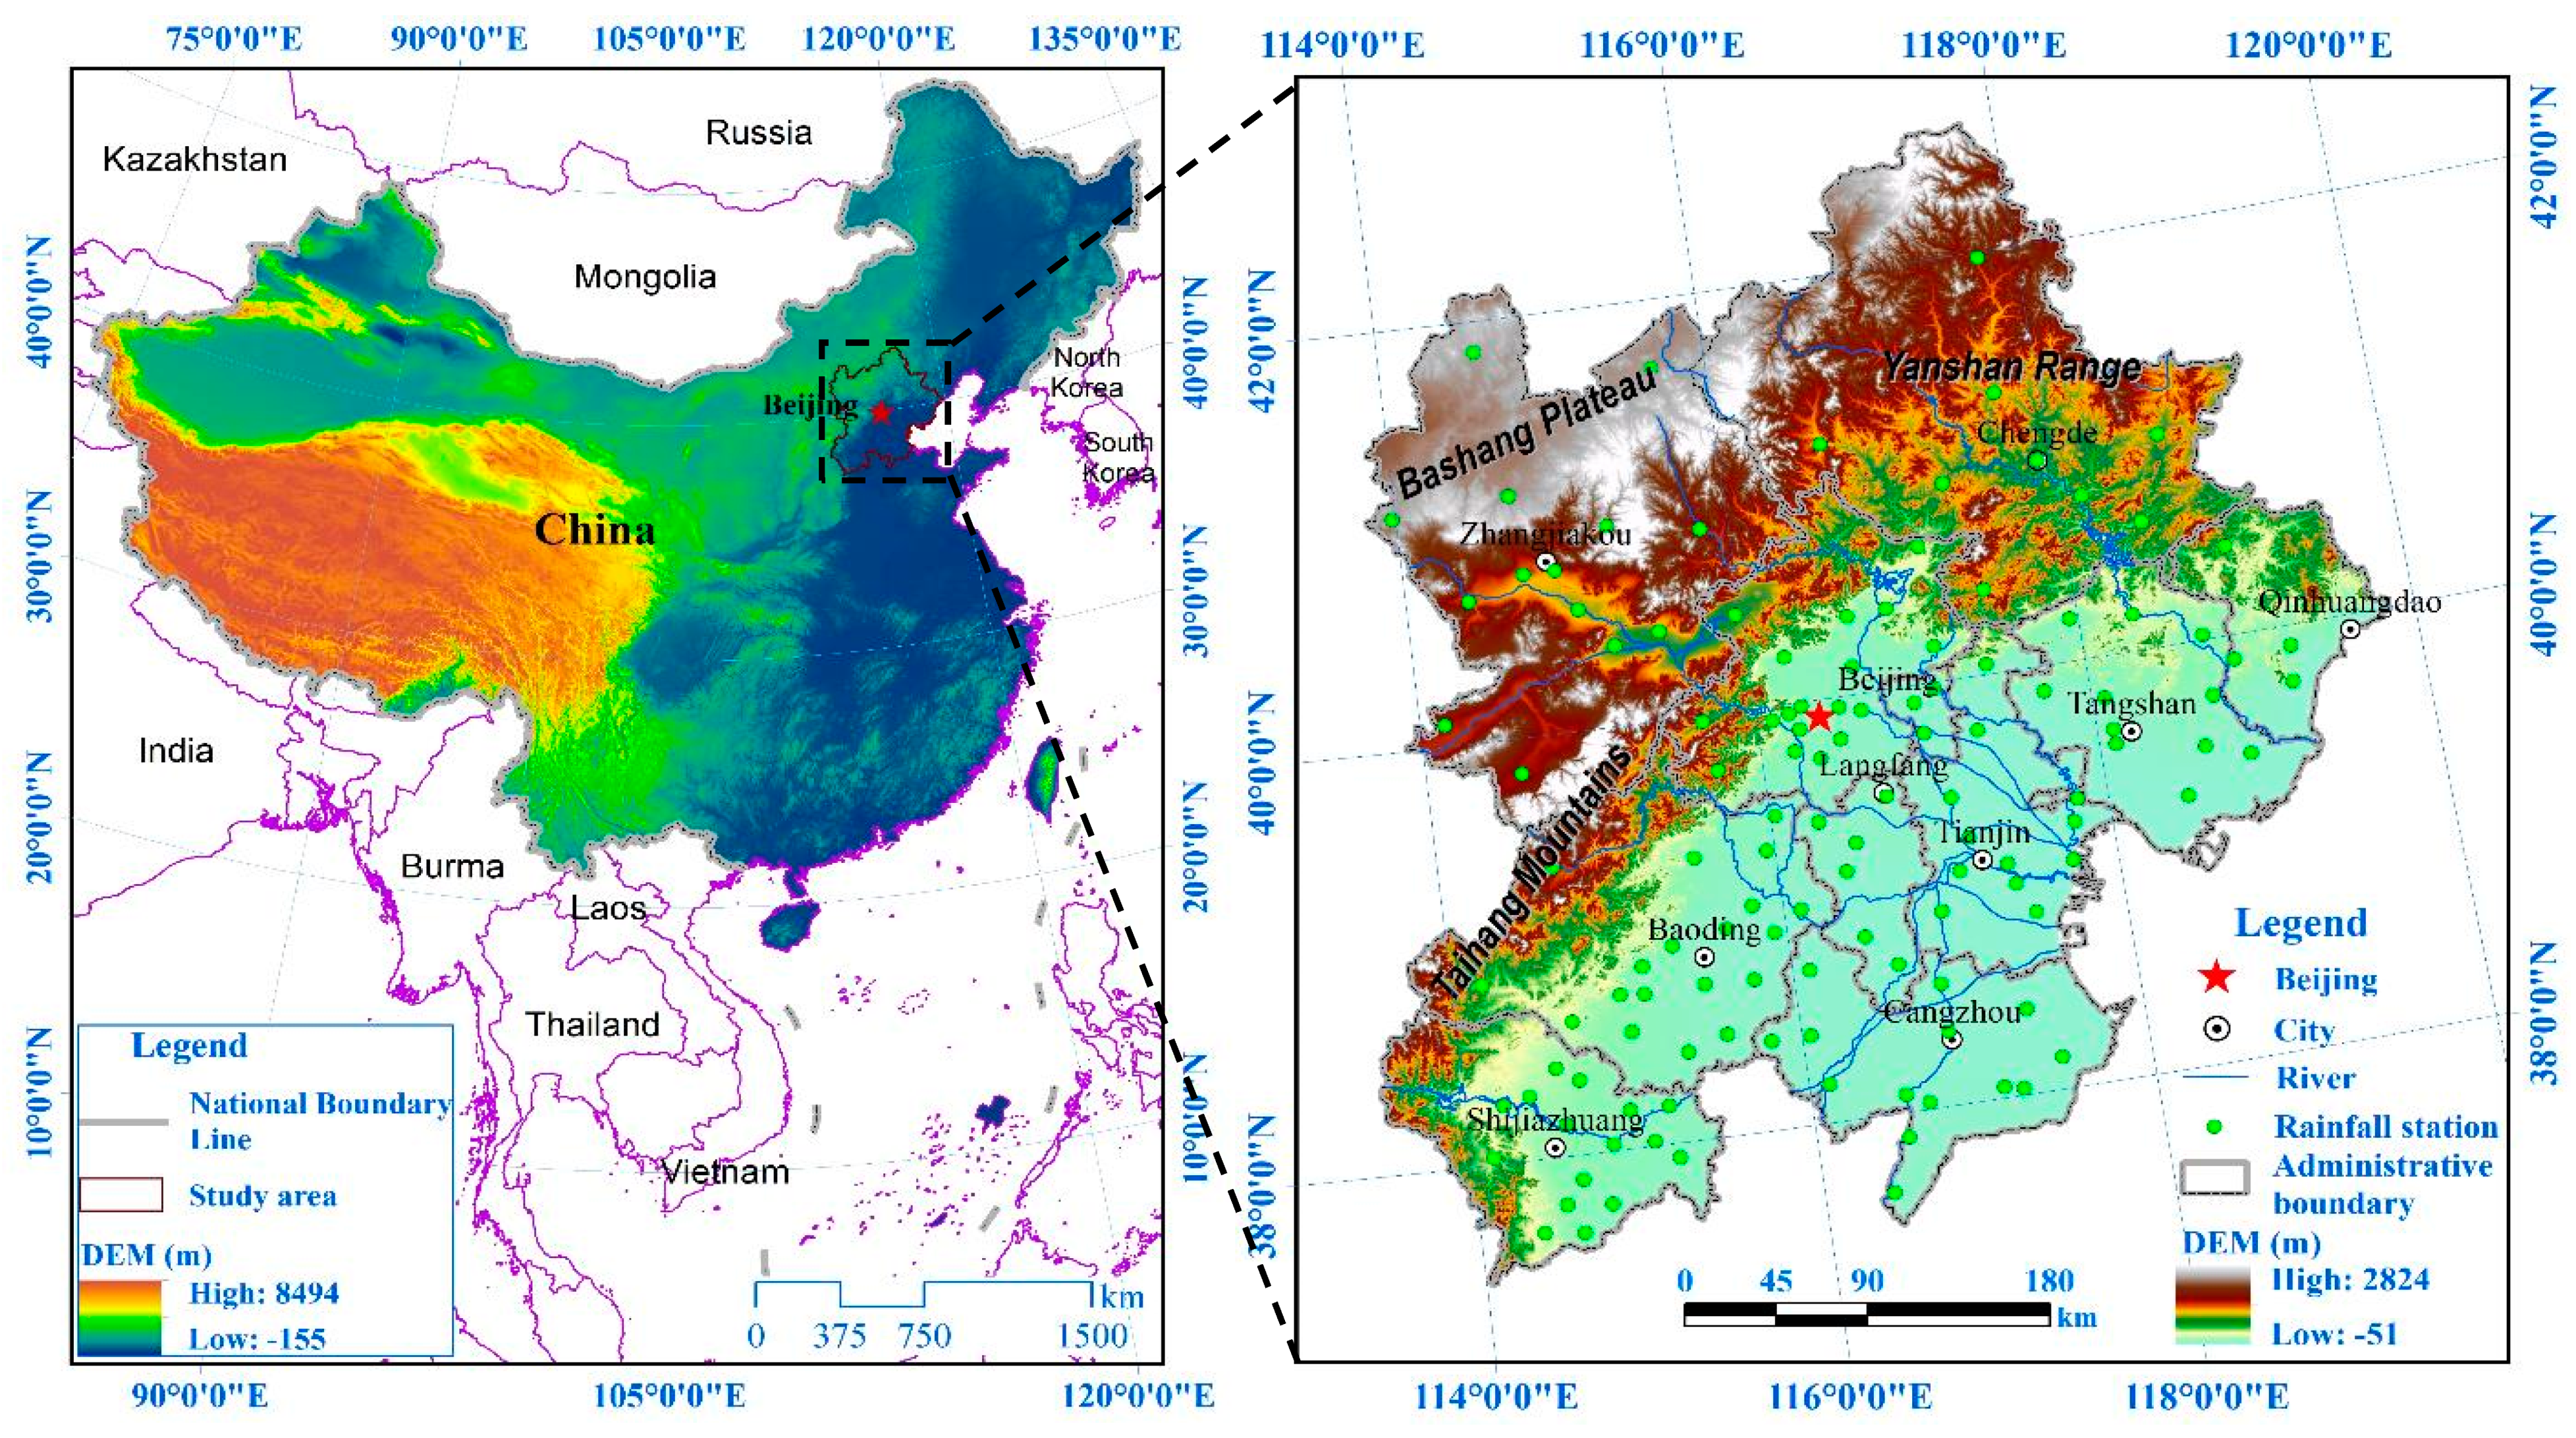
2.1. Study Area
2.2. Indicator Selection and Data Analysis
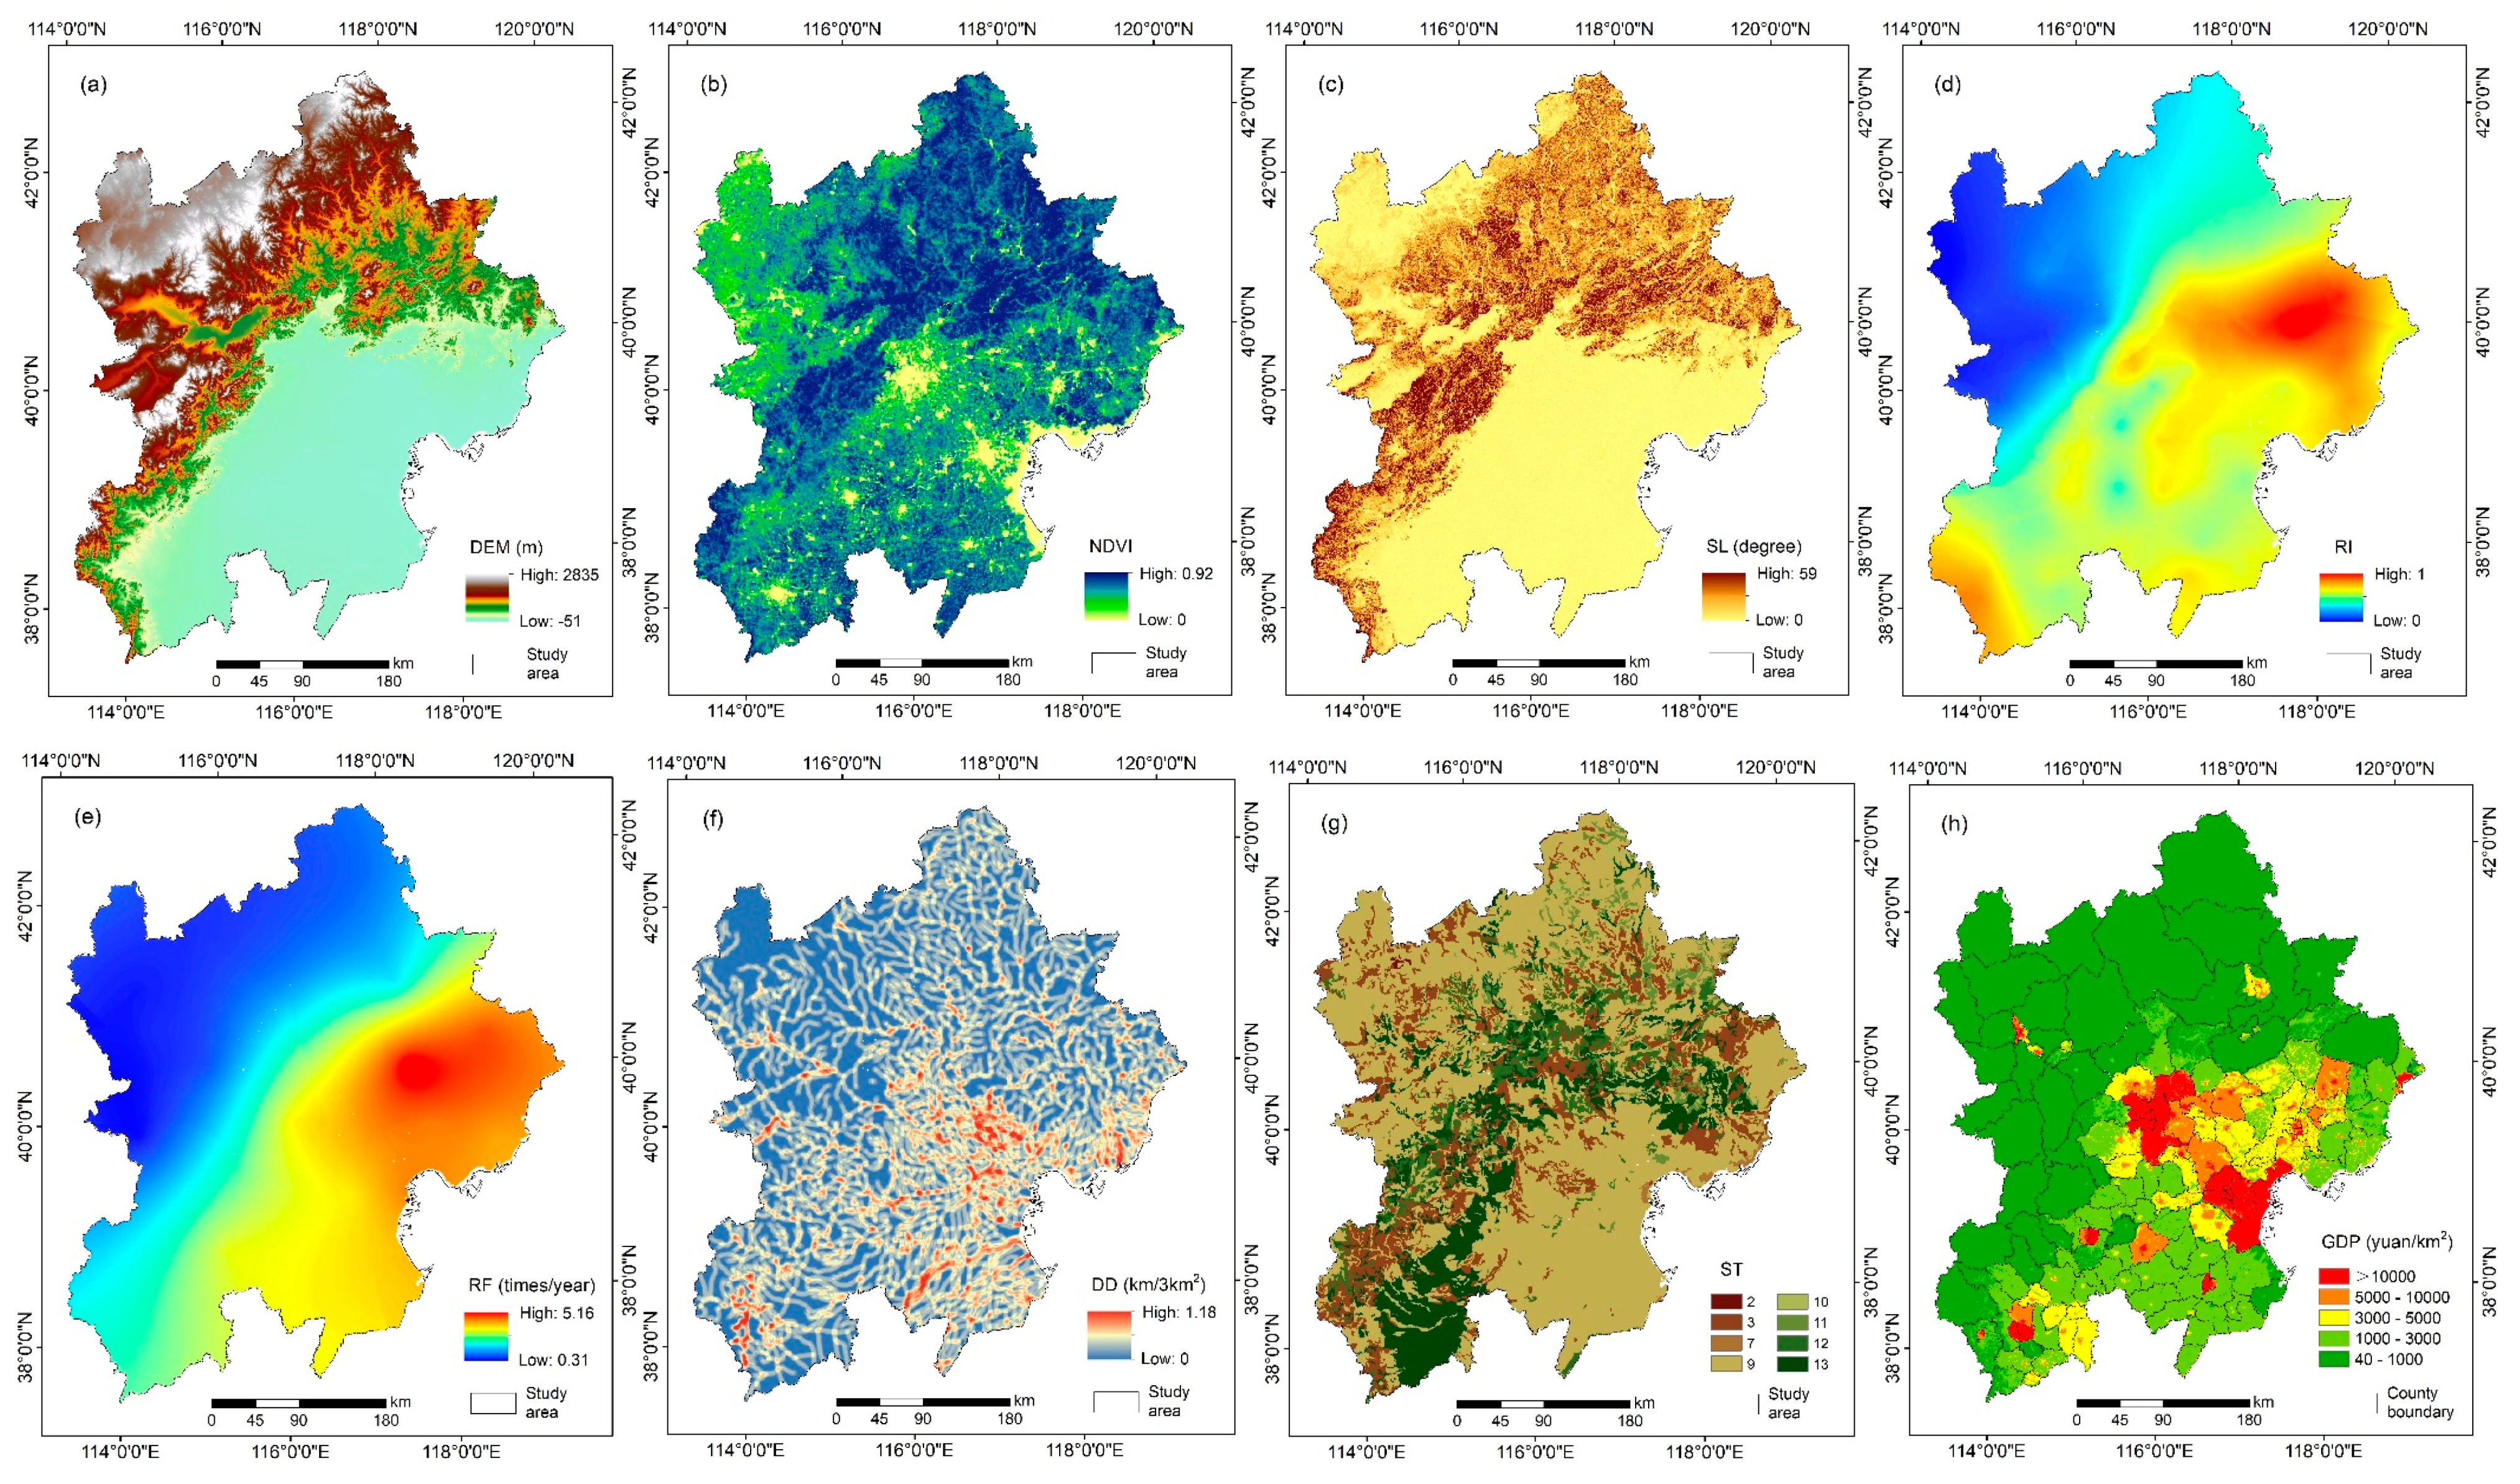
- Digital elevation model data (DEM, m): DEM can reflect the absolute elevation and topographic fluctuations of the study area. In general, flooding is more likely to occur at lower altitudes than at higher elevations. The original resolution of DEM is 90 × 90 m.
- Slope data (SL, degree): The slope reflects the topographic change and runoff velocity. In general, steep slopes of the mountain areas promote runoff generation, whereas low-lying level regions are prone to severe flooding and waterlogging due to poor drainage. SL was extracted from the DEM data using GIS technique.
- Rainfall intensity data (RI, normalized value): By analyzing the daily precipitation data of 126 precipitation stations in the study area from 1981 to 2010, the maximum three-day precipitation was calculated to characterize rainfall intensity [38]. Then, spatial interpolation was performed using Kriging interpolation and the RI was generated.
- Rainstorm frequency (RF, times/year): Rainstorm refers to a heavy rainfall event with precipitation of more than 50 mm within 24 hours in China. The rainfall frequency of each rain gauge station was calculated based on the daily precipitation data from 1981 to 2010.
- Drainage density (DD, km/3 km2): Based on the linear density analysis technology of ArcGIS, the drainage density was analyzed using the river vector data in the study area [16]. The search radius was 3 km and a data layer of 1 × 1 km was generated.
- Normalized difference vegetation index (NDVI): This indicator can effectively reflect the distribution of vegetation coverage on the spatial scale of the study area. The vegetation not only regulates the surface runoff but also prevents soil erosion [39].
- Soil texture (ST): Different soil textures have various infiltration capacities and a specific impact on surface runoff. In this study, we used the soil infiltration capacity according to the code values in the Harmonized World Soil Database (HWSD). The soil texture classification criteria in this database were divided into 13 categories by the US Department of Agriculture (USDA) [1]. As shown in Table 1, a large code value indicates a strong infiltration capacity.
- Gross domestic product (GDP, yuan/km2): GDP indicates the prosperity degree of the national economy of a country or region, which is an essential indicator of flood vulnerability. In this paper, we collected the GDP data from 2015 with a resolution of 1 × 1 km.
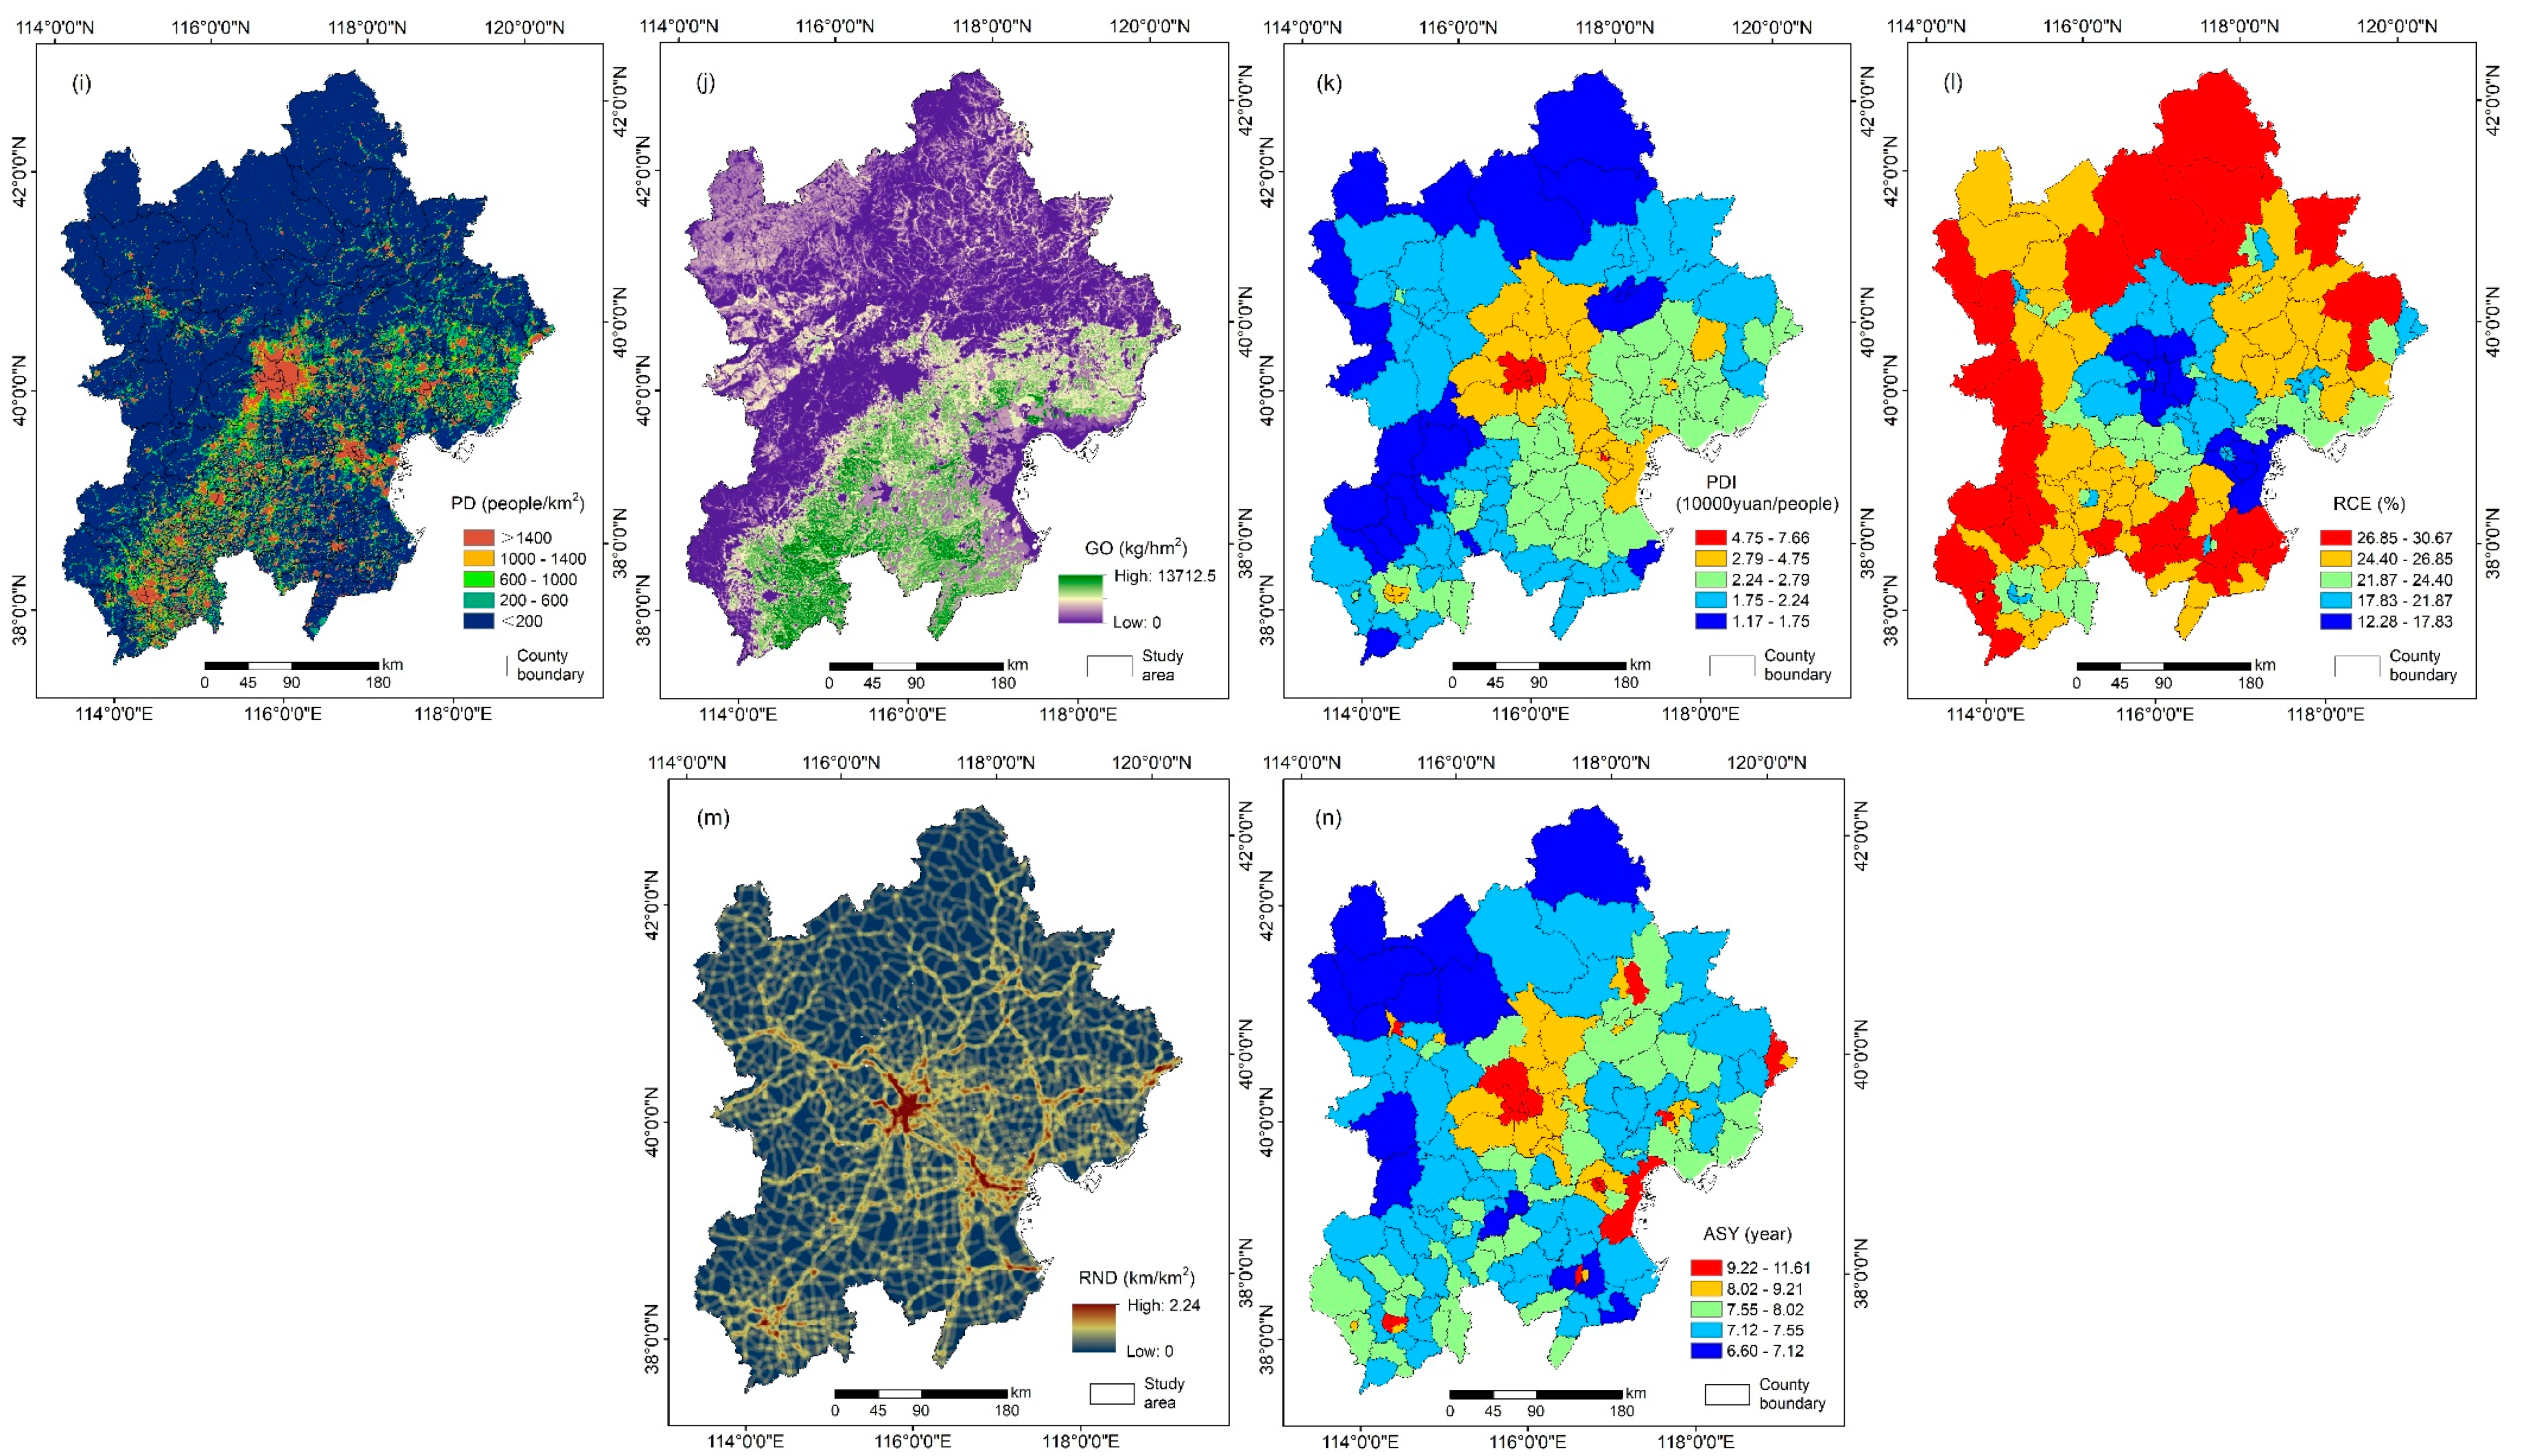
- Population density (PD, people/km2): This indicator reflects the spatial distribution of human exposure in the research area in 2015.
- Grain output (GO, kg/hm2): Food is a special commodity and an essential strategic reserve related to people’s livelihoods. This data mainly considers the grain yield of five crops (wheat, corn, rice, soybean, and potato) in the study area.
- Road network density (RND, km/km2): The strong hydrodynamic conditions during the flood will inevitably destroy roads. Furthermore, secondary geological disasters caused by floods, such as landslides and debris flows in mountainous areas, pose severe threats to road and rail network systems.
- Per capita disposable income (PDI, 10,000 yuan/people): PDI can reflect the overall socio-economic level of a region. The higher the PDI, the stronger the disaster resistance and the faster the post-disaster recovery and reconstruction.
- The ratio of children and the elderly (RCE, %): Children (0 to 14 years old) and older people (65 years and older) are more vulnerable to flooding due to age and some physiological reasons.
- Average schooling years (ASY, year): ASY is an important indicator to measure the degree of popularization of higher education in a country or region (over six years old). Generally, ASY is positively related to people’s awareness of disaster prevention and reduction.
3. Methodology
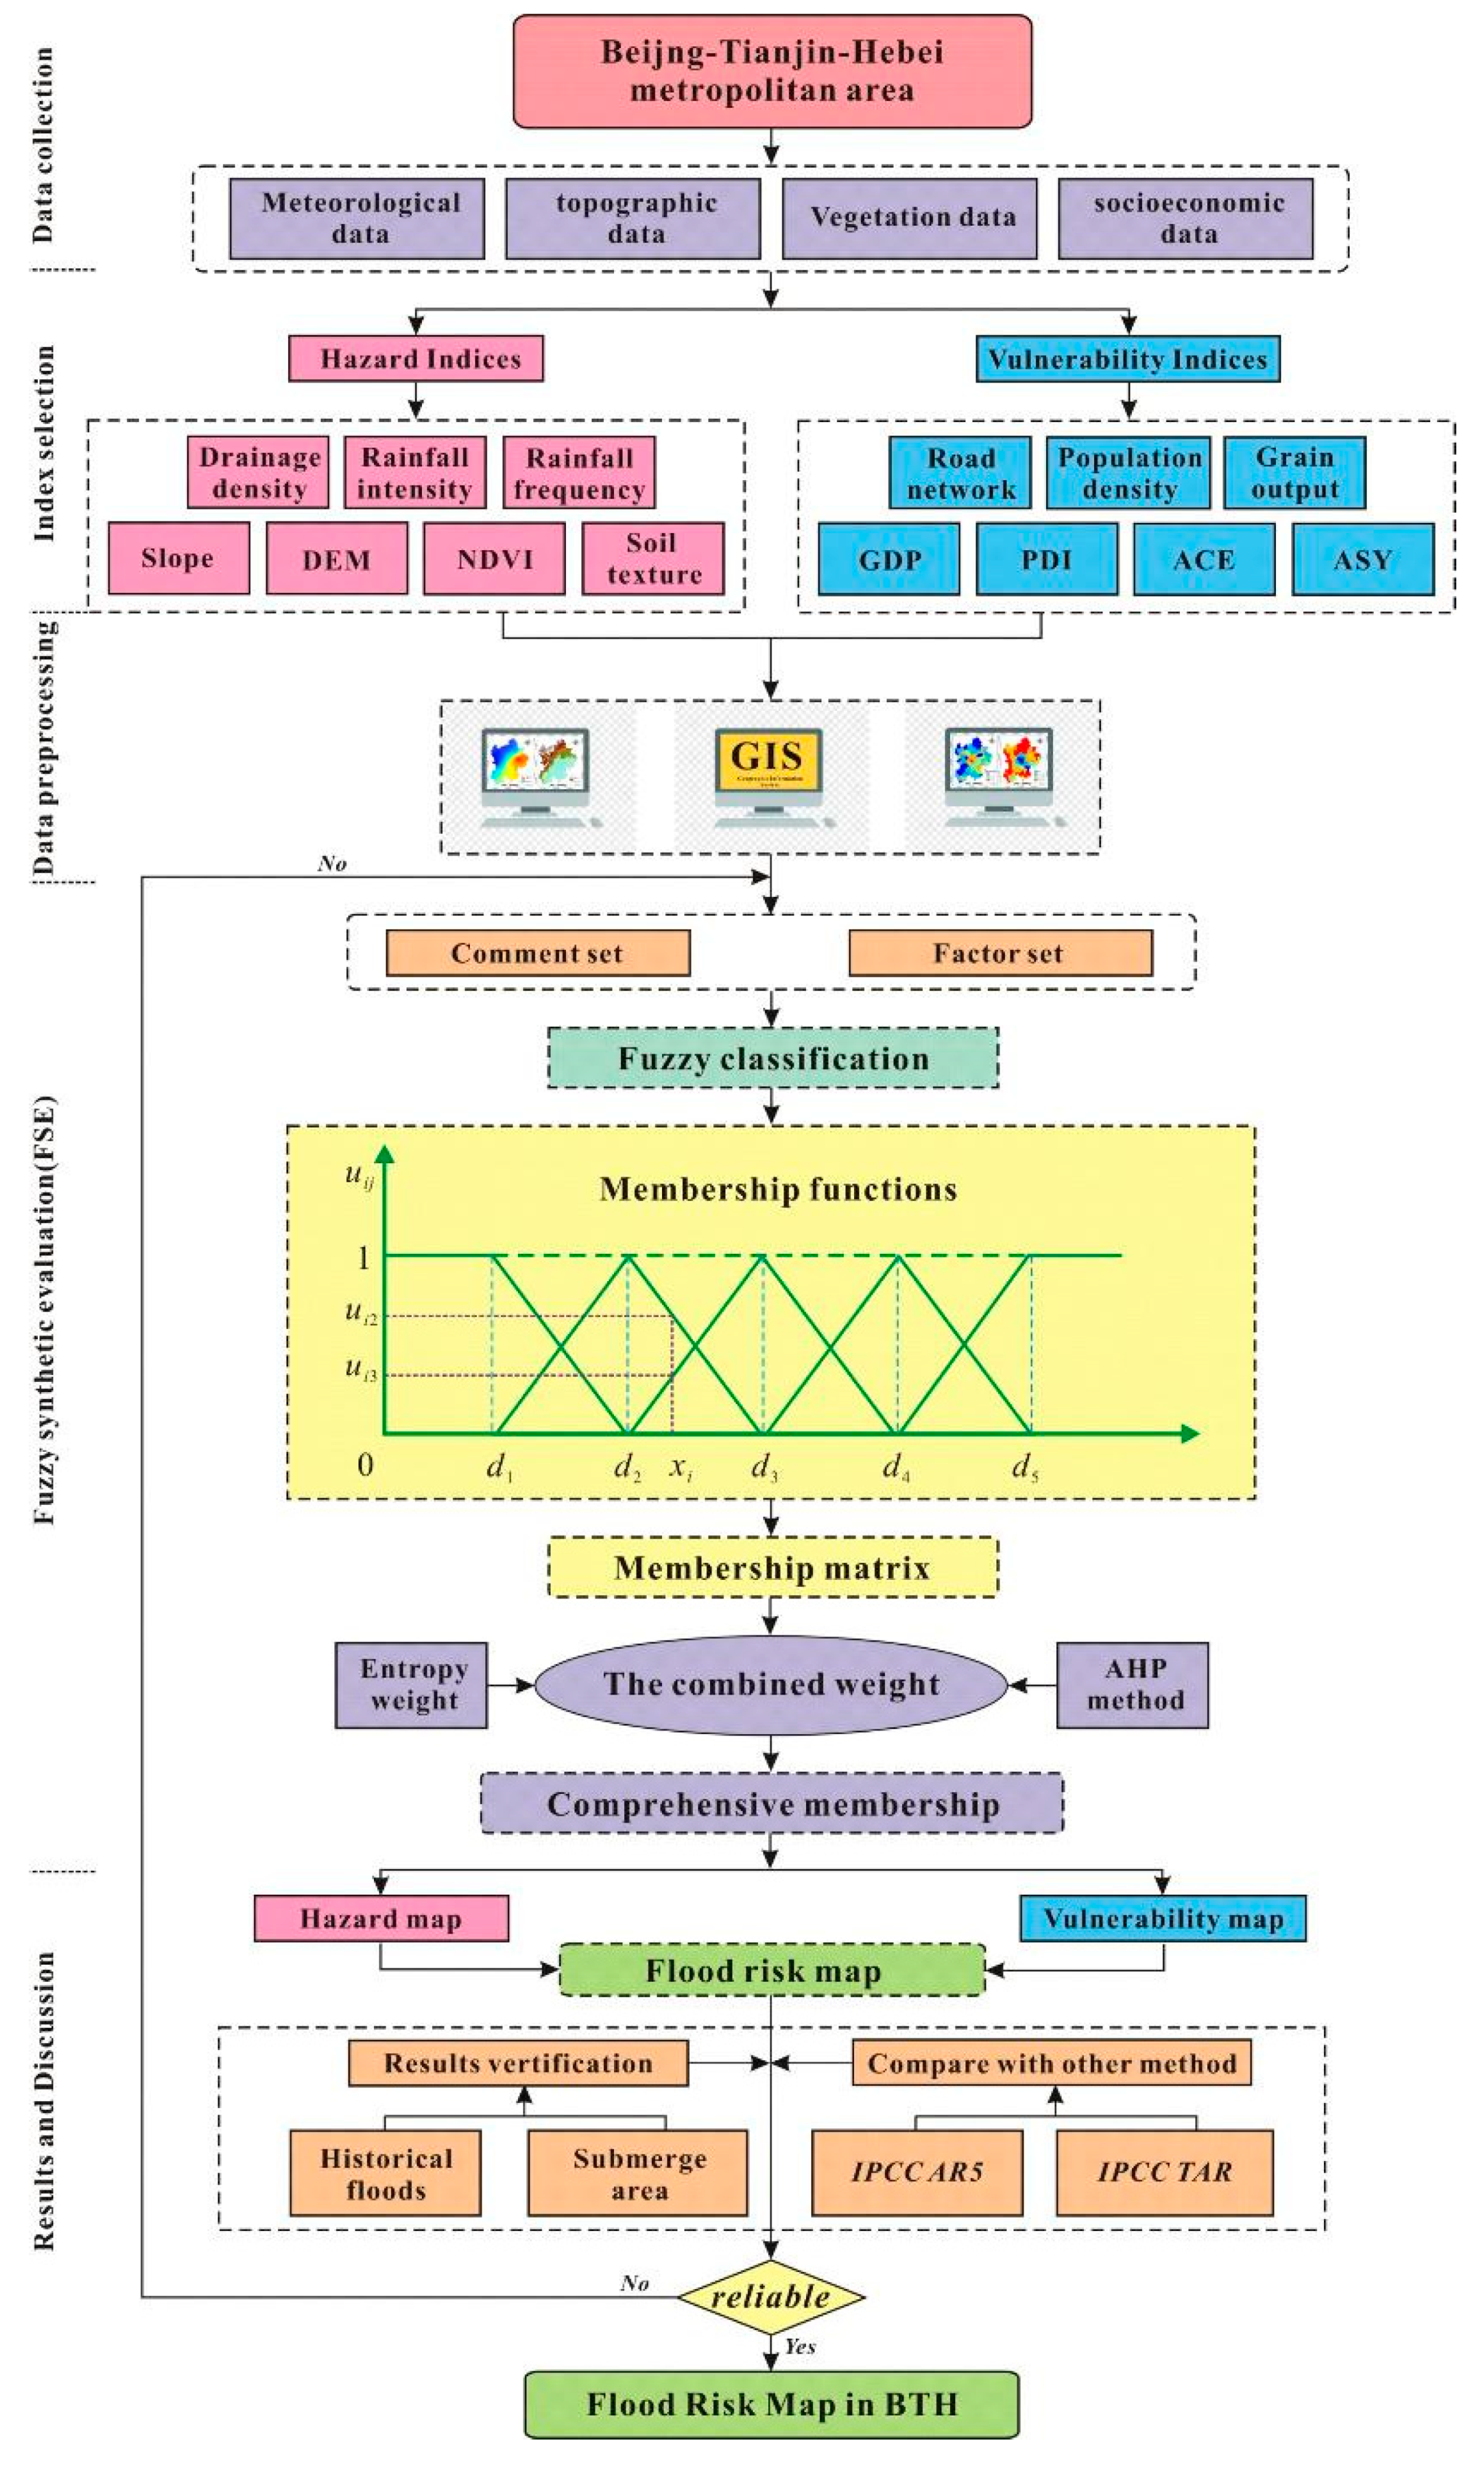
3.1. Overall Framework of the Evaluation Procedure
3.2. Fuzzy Synthetic Evaluation (FSE)
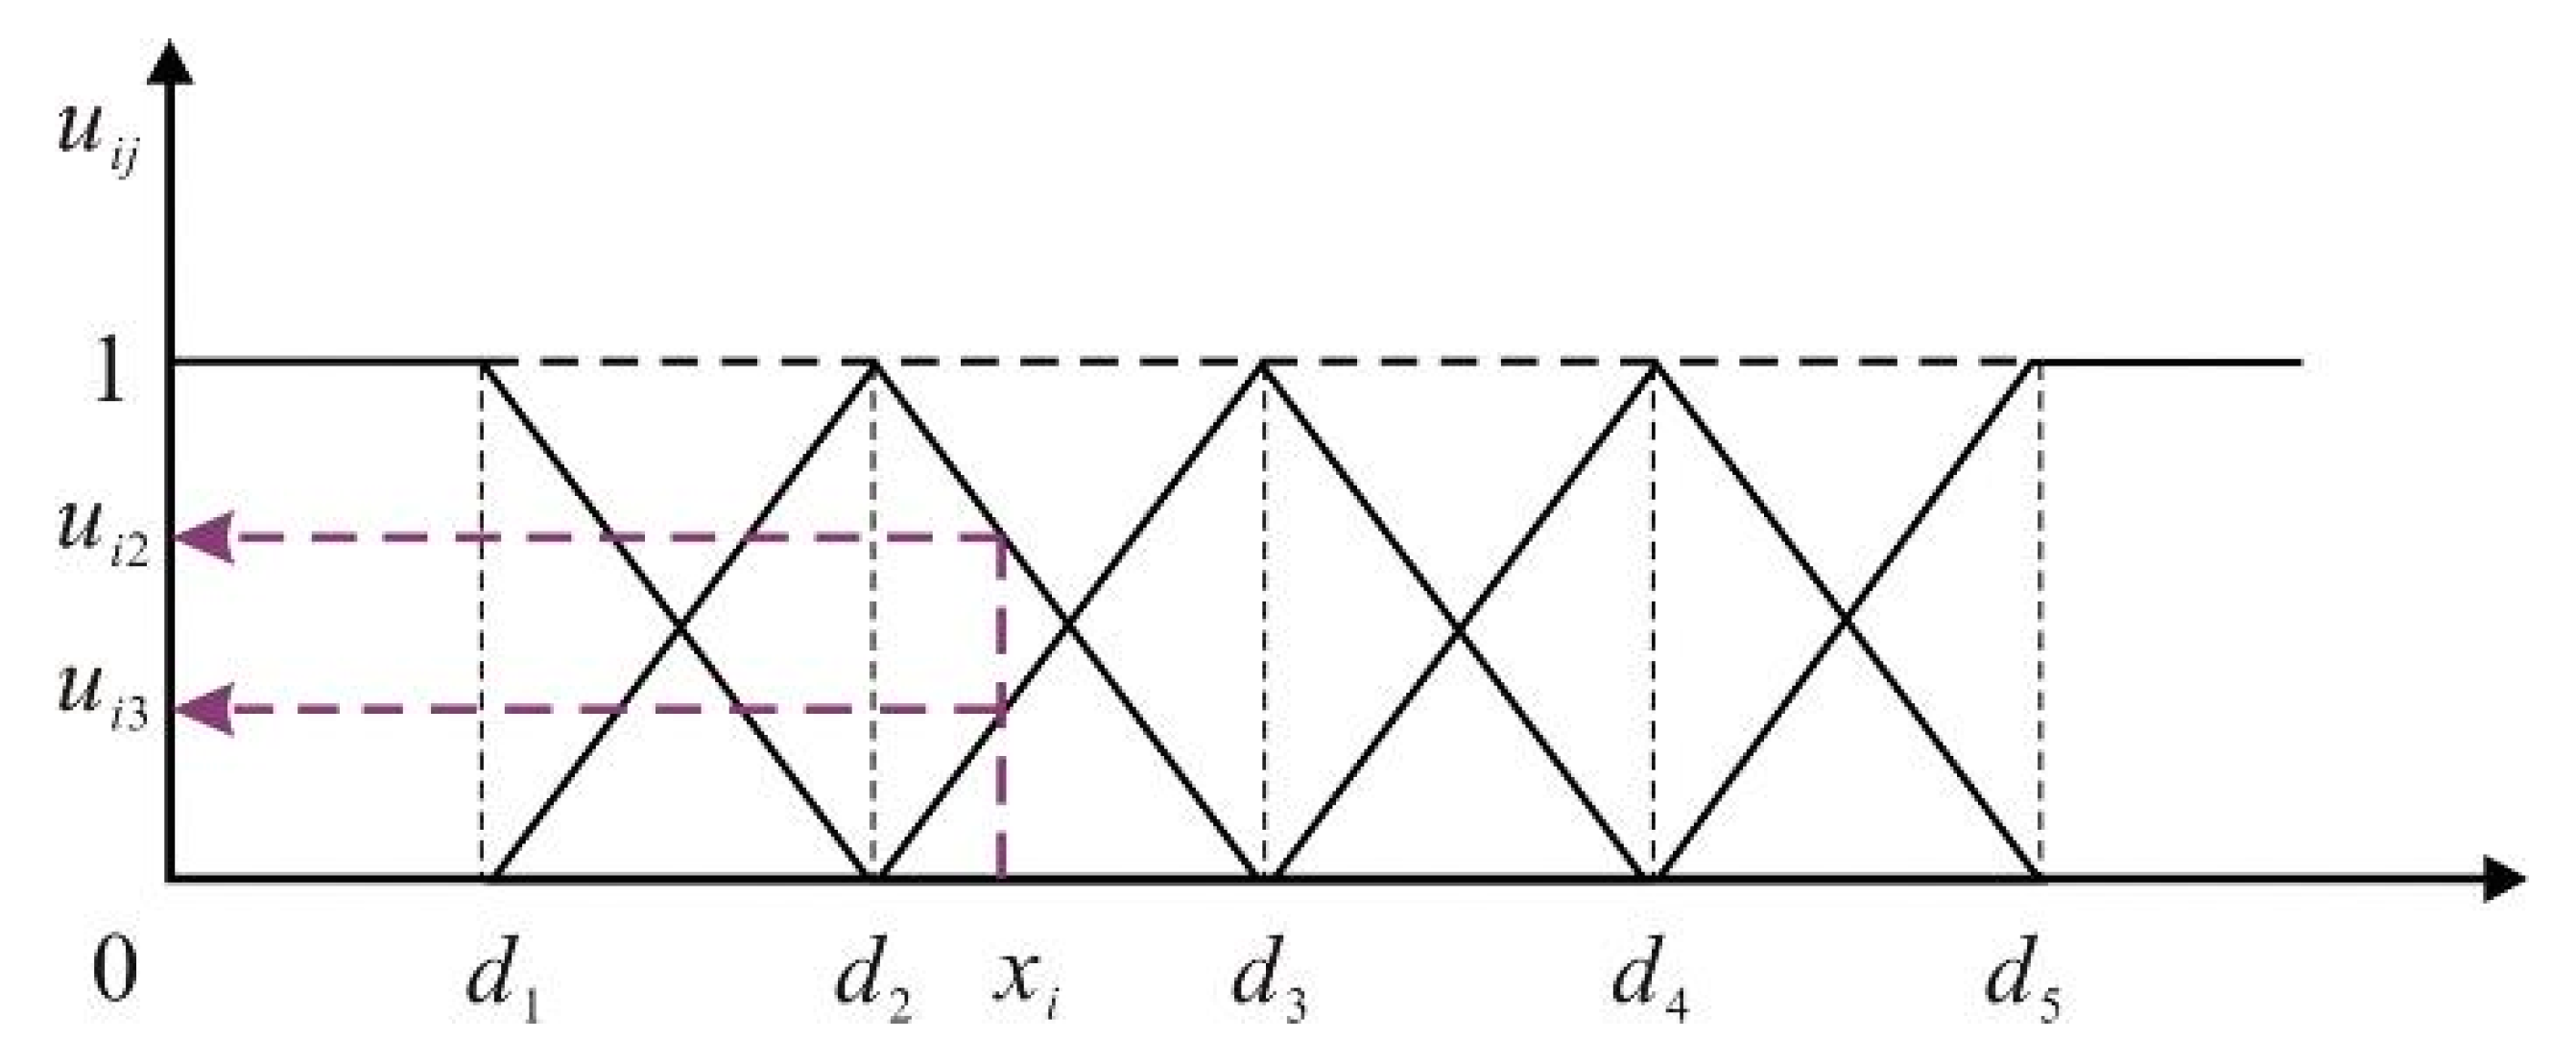
3.2.1. Fuzzy Classification
3.2.2. Membership Function and Comprehensive Evaluation
3.2.3. Comprehensive Evaluation
3.3. Calculation of the Weights for Indices Based on the CW Method
4. Results and Discussions
4.1. Weight Calculation Results
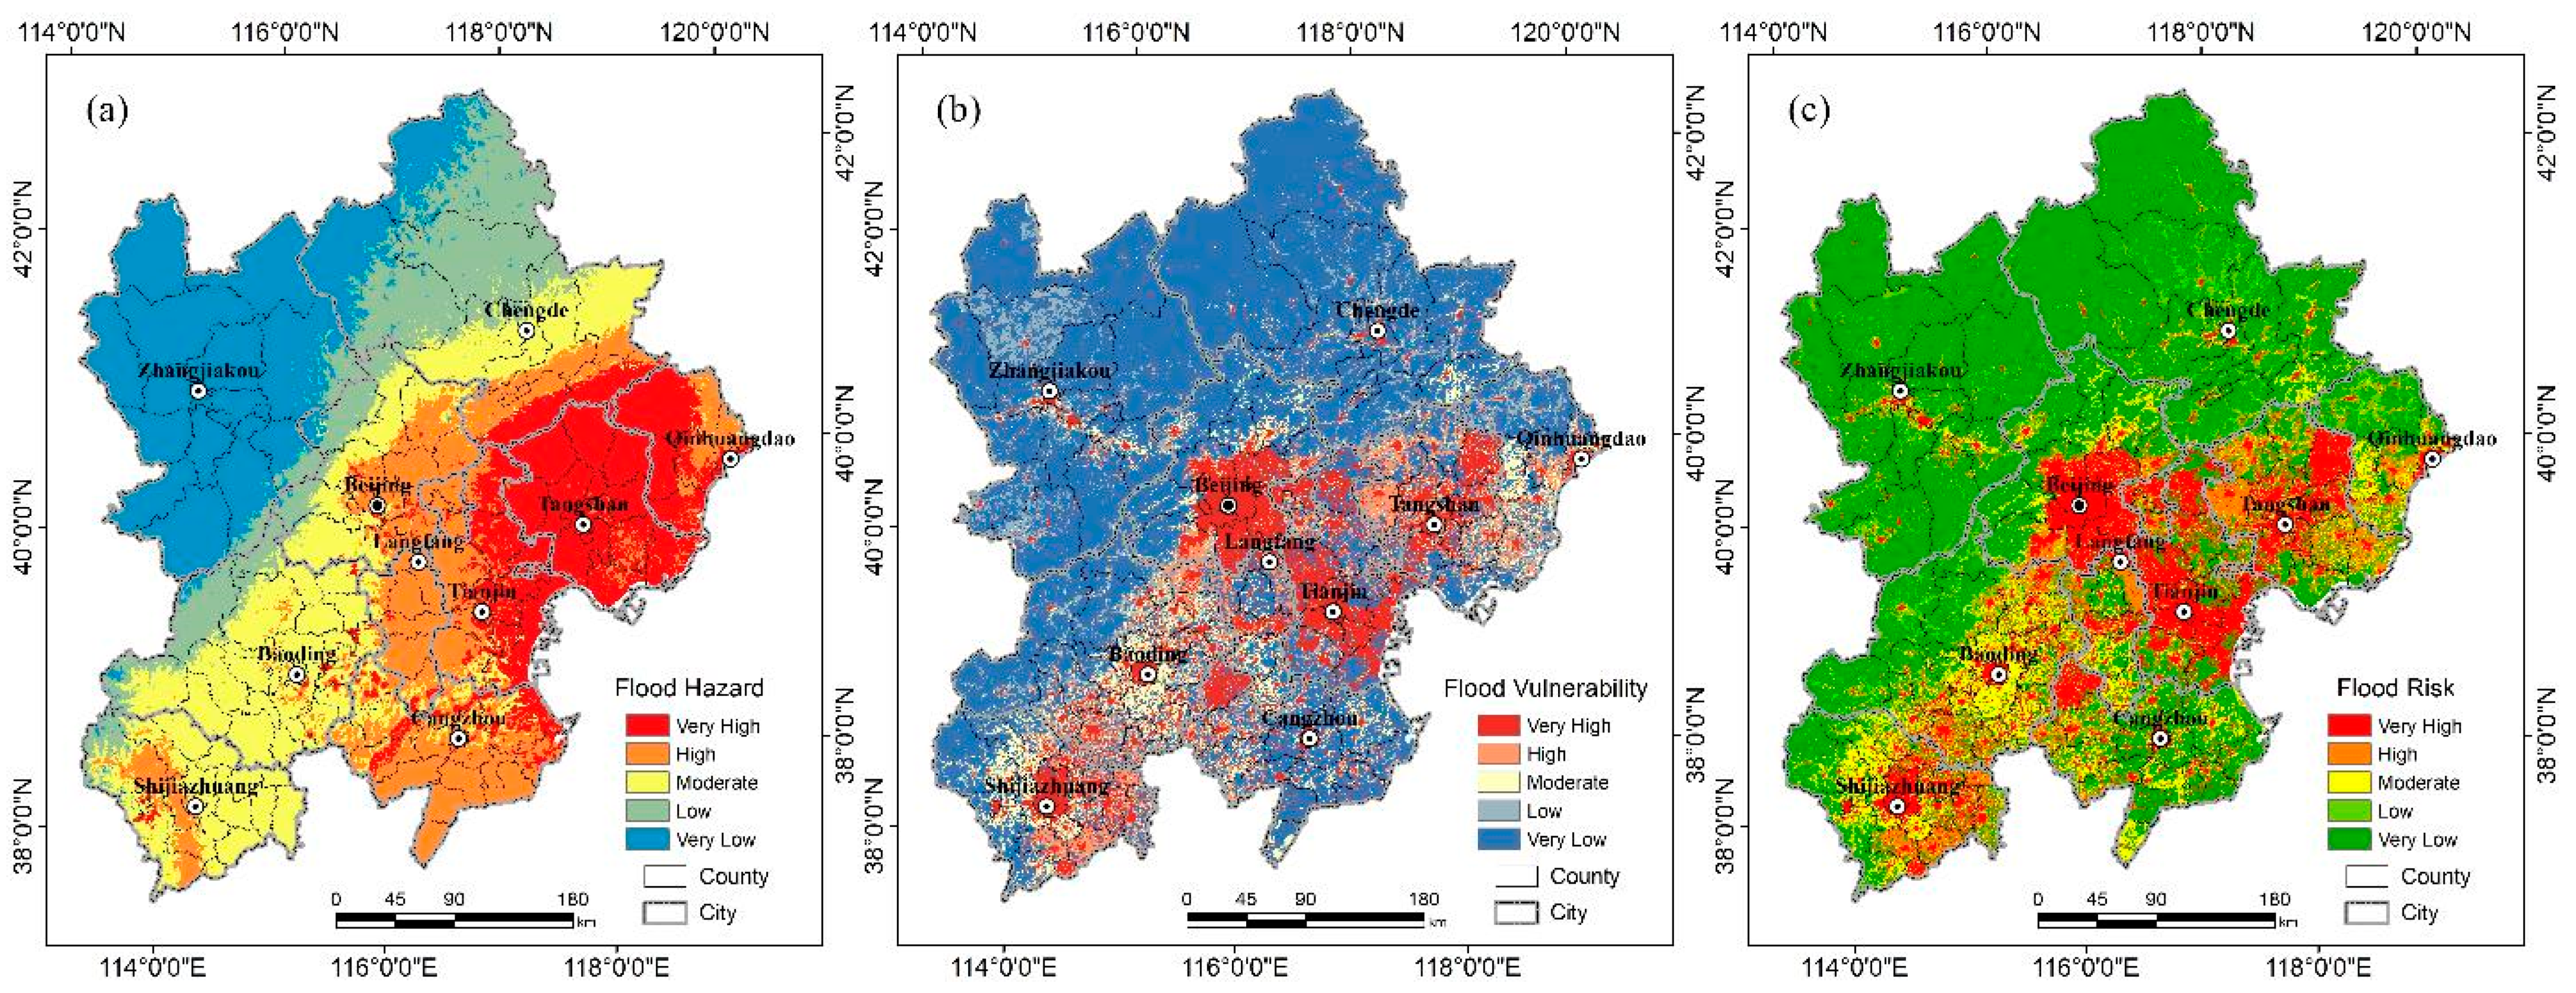
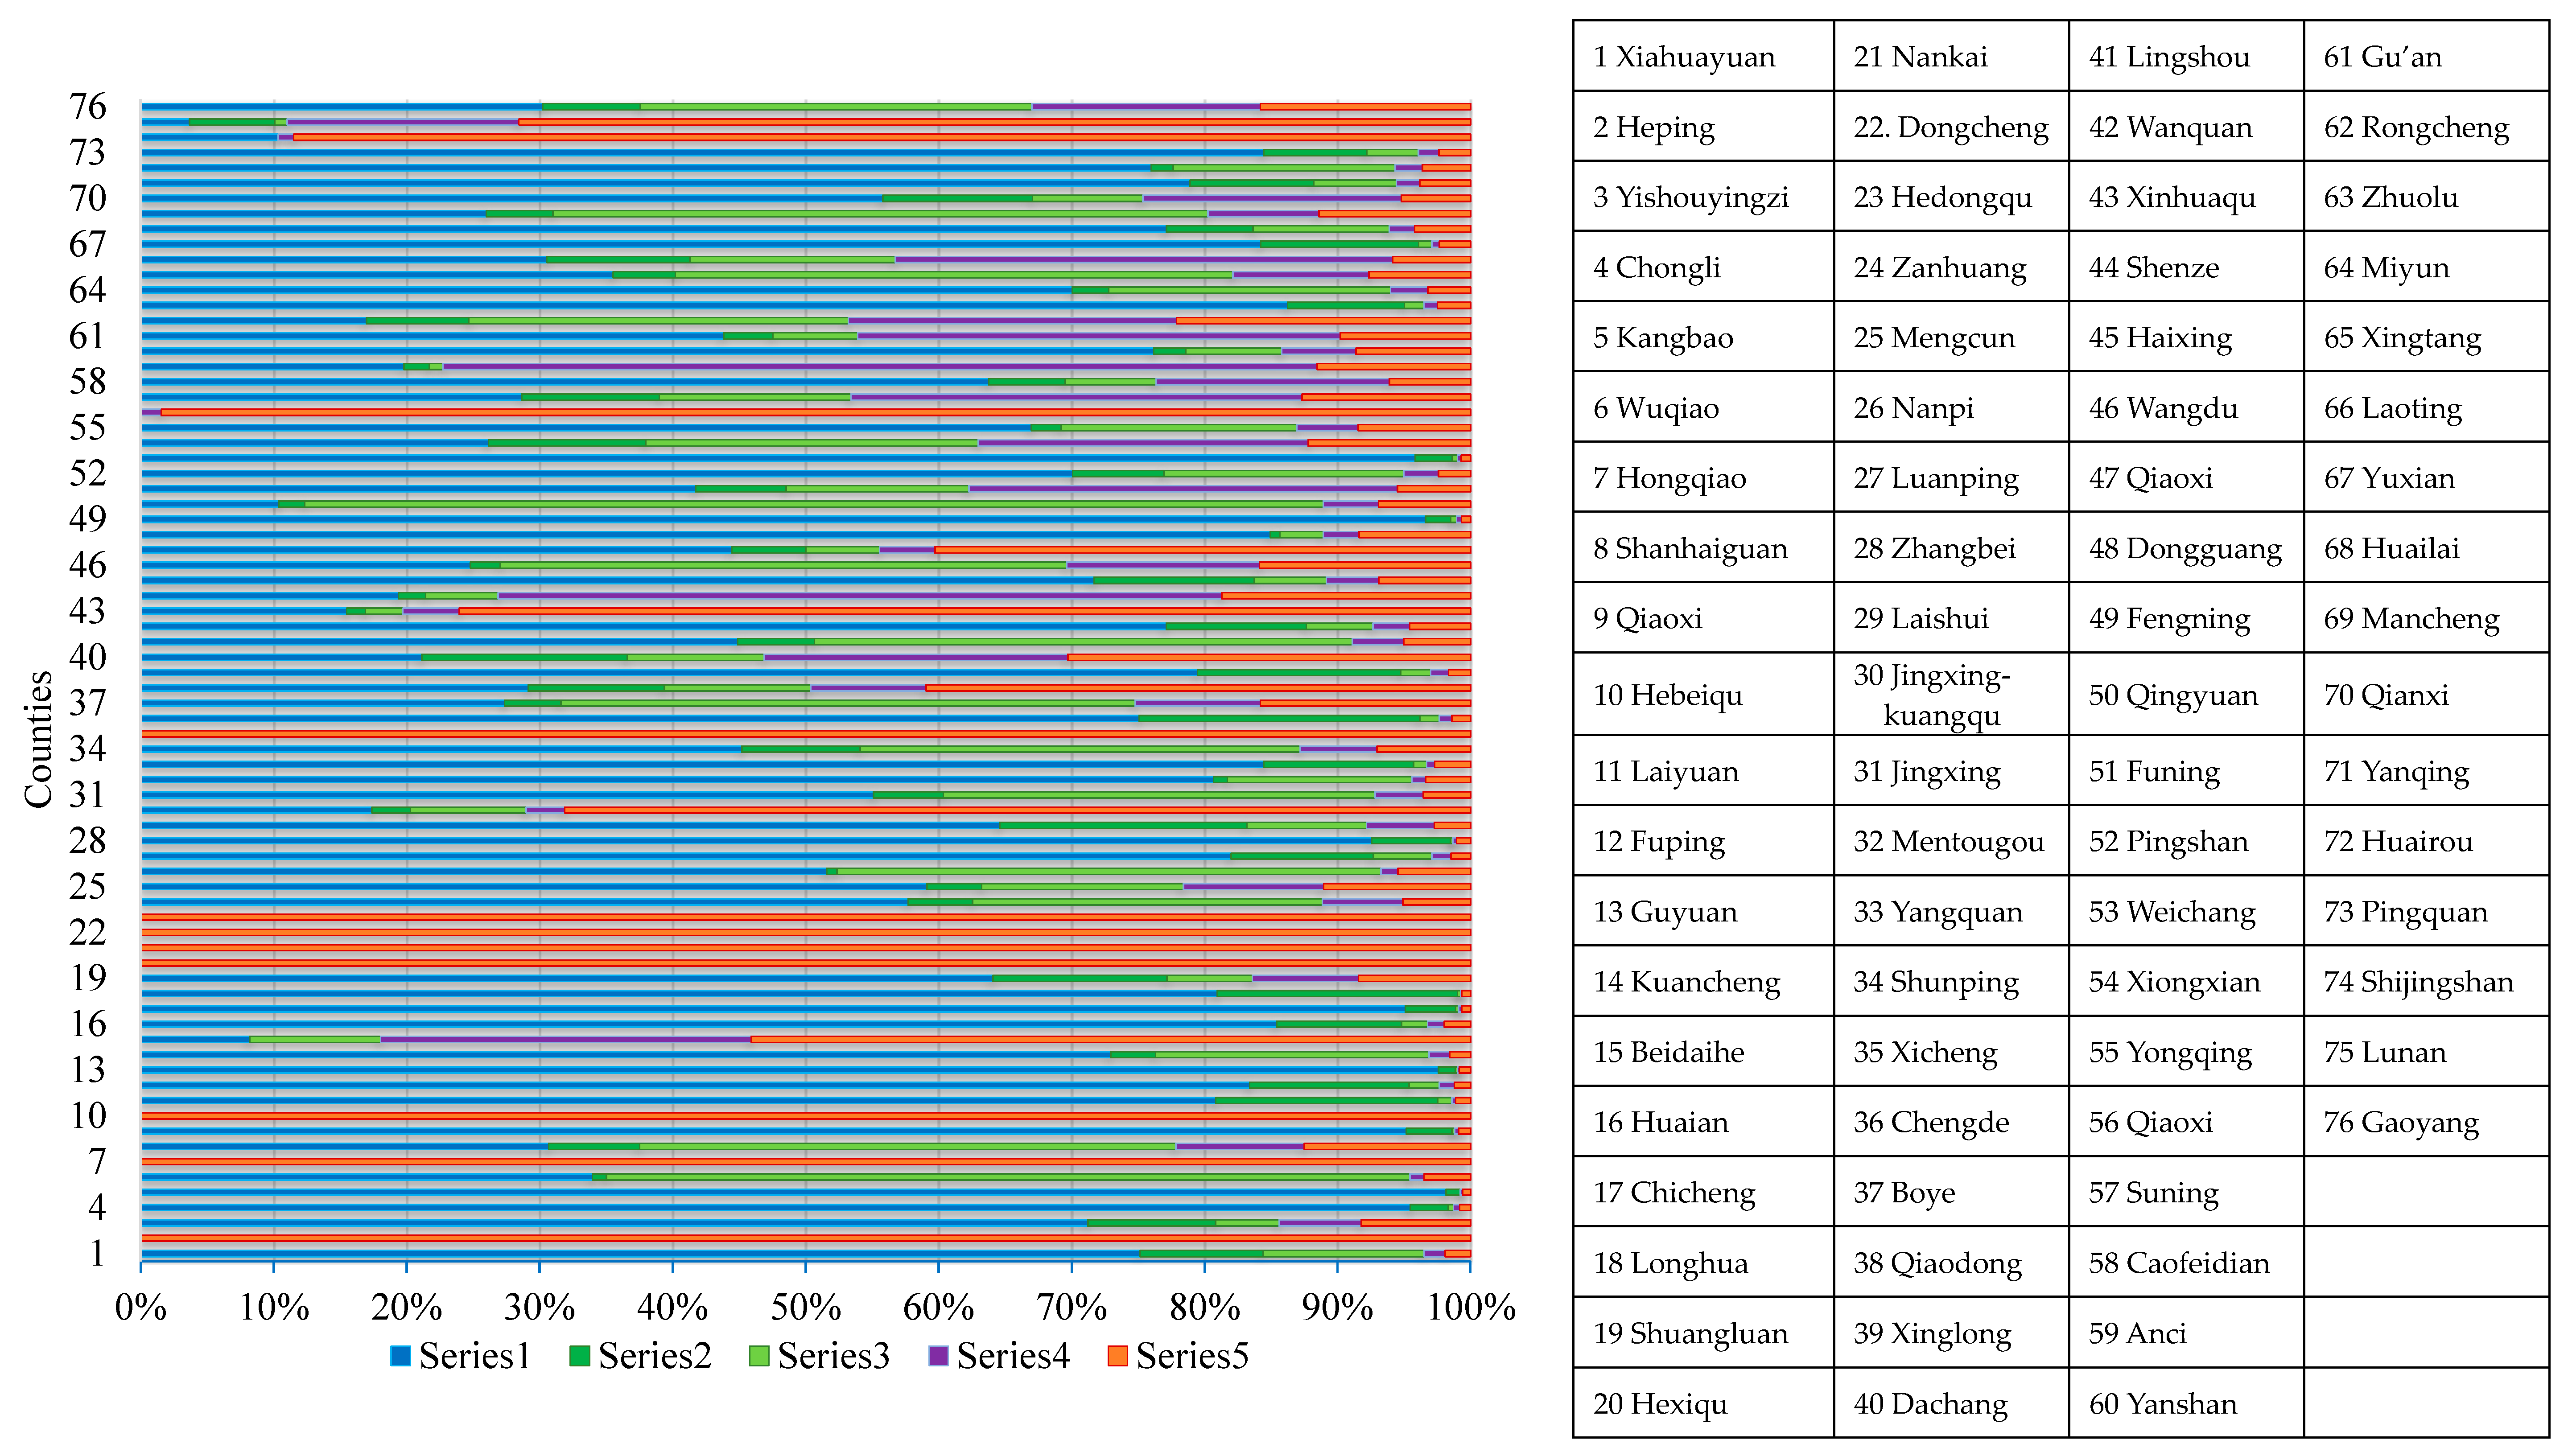
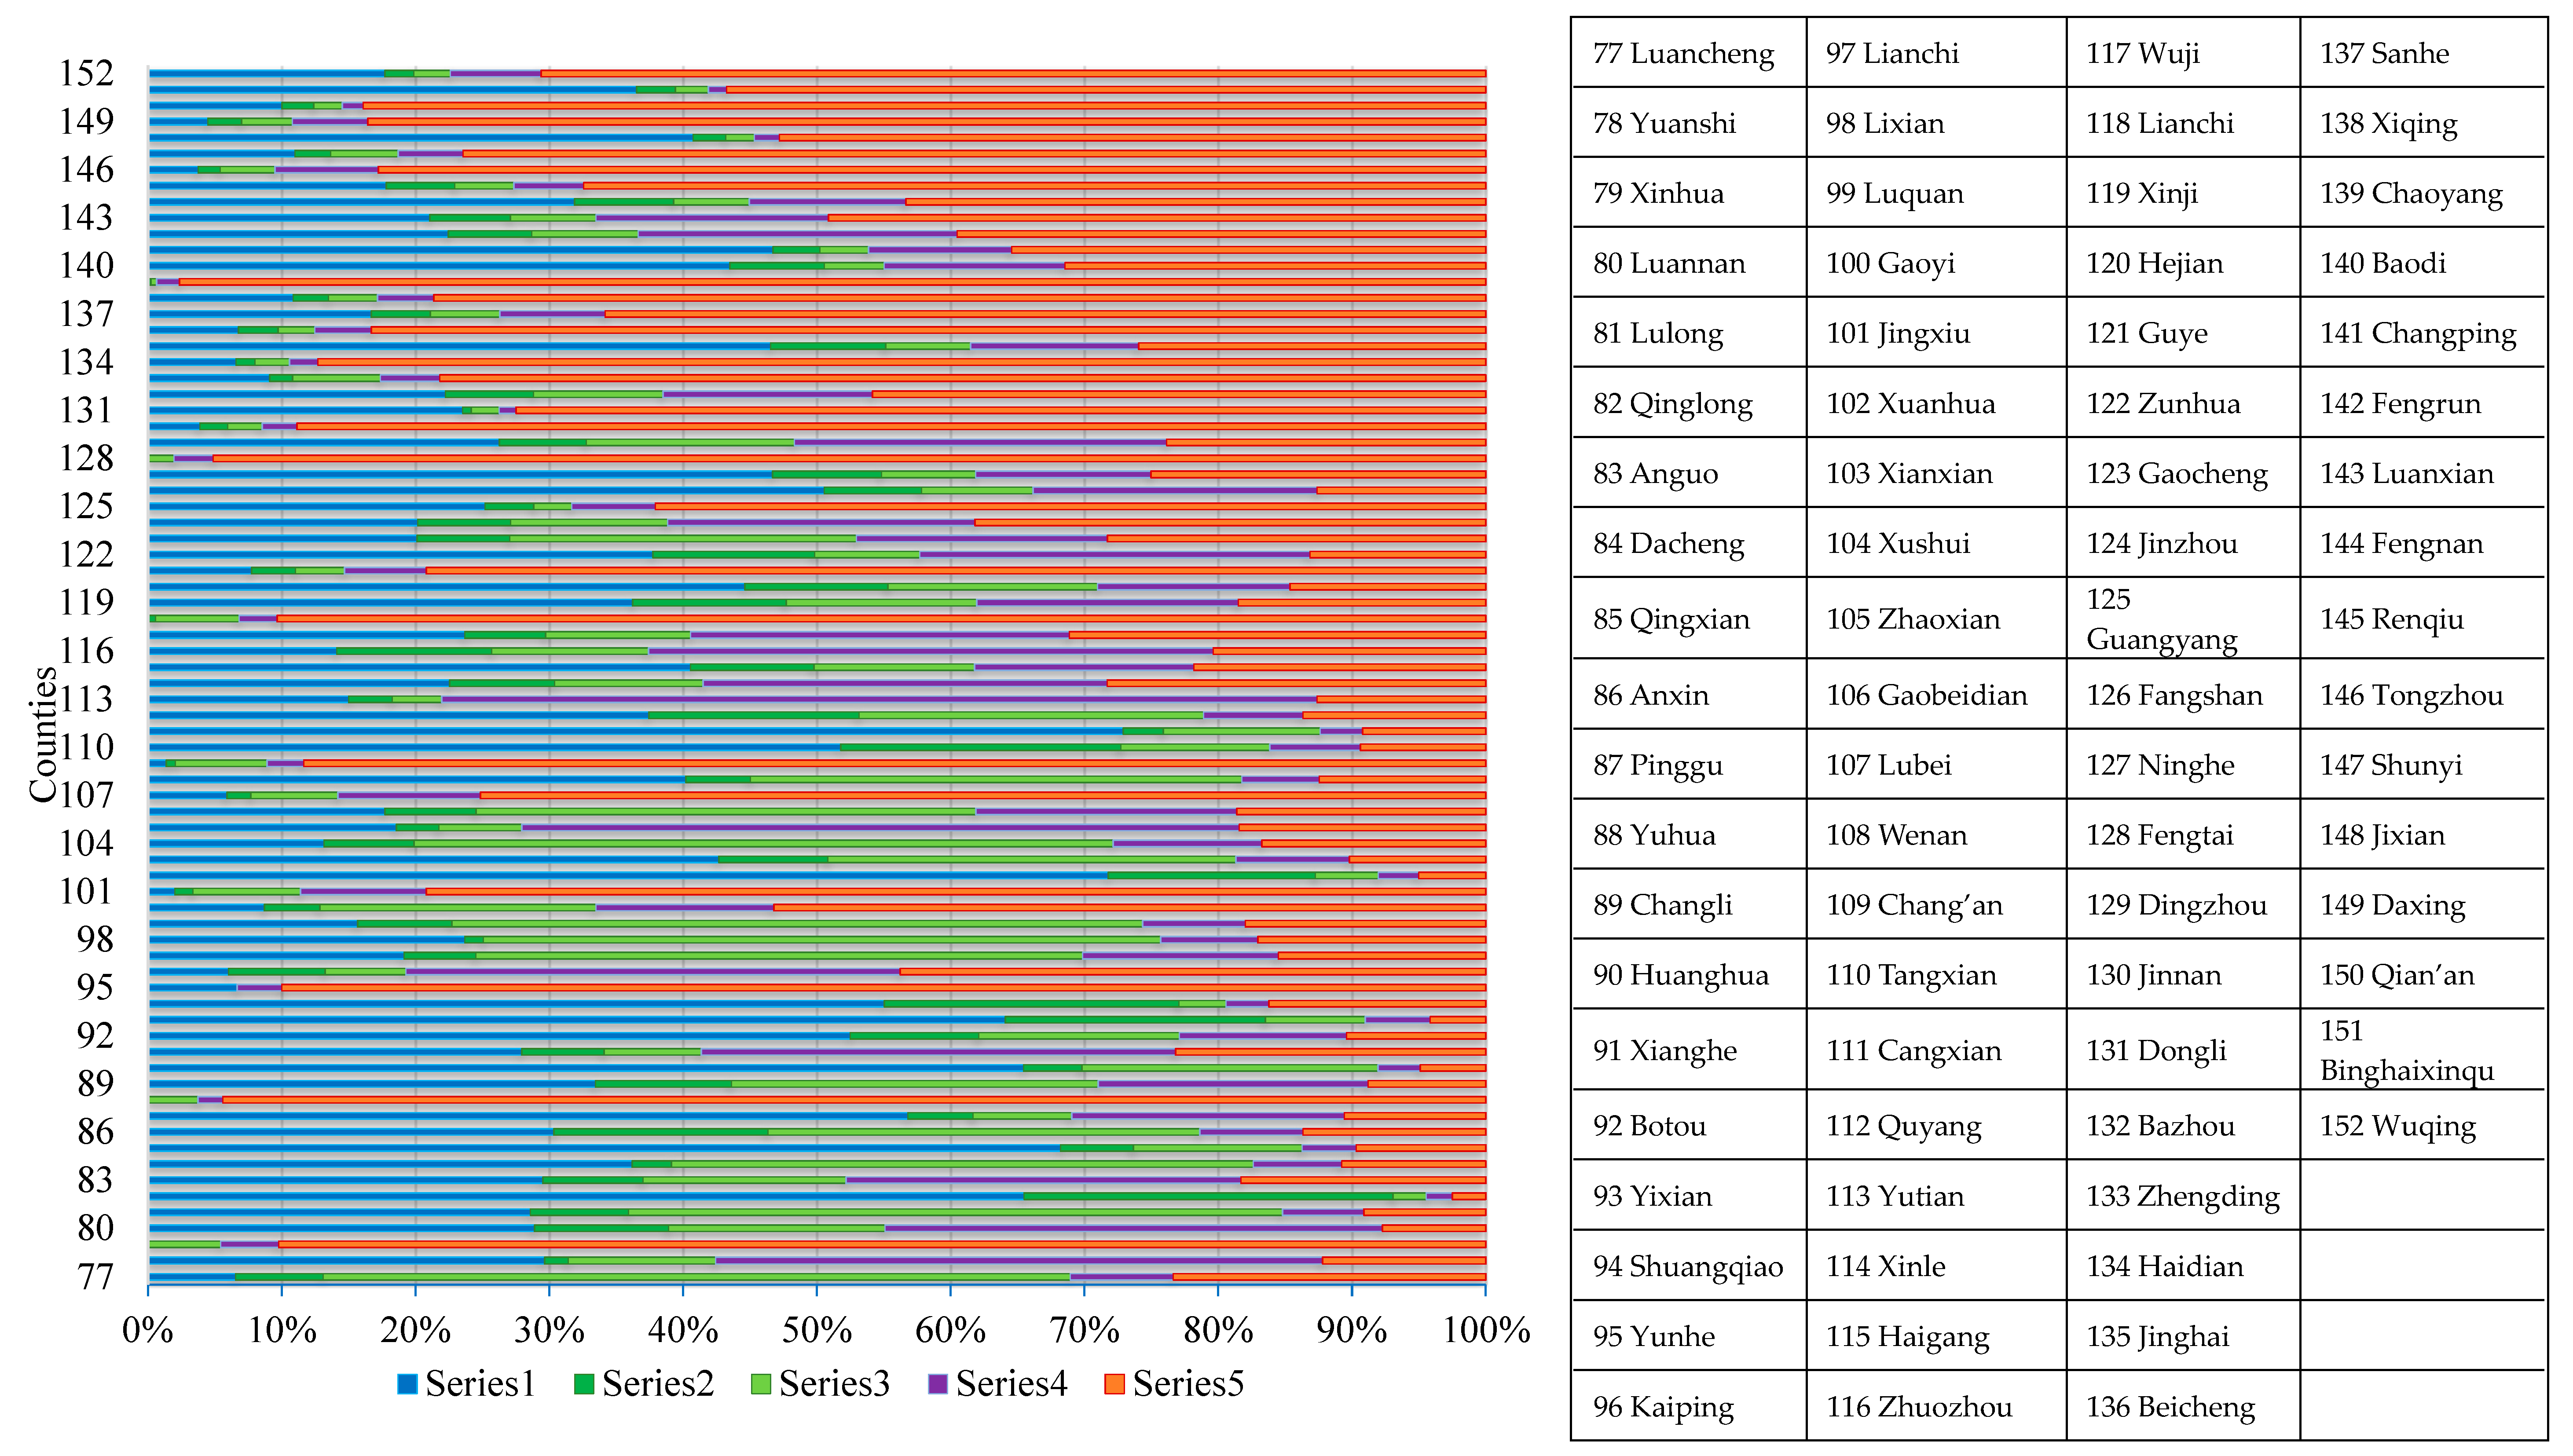
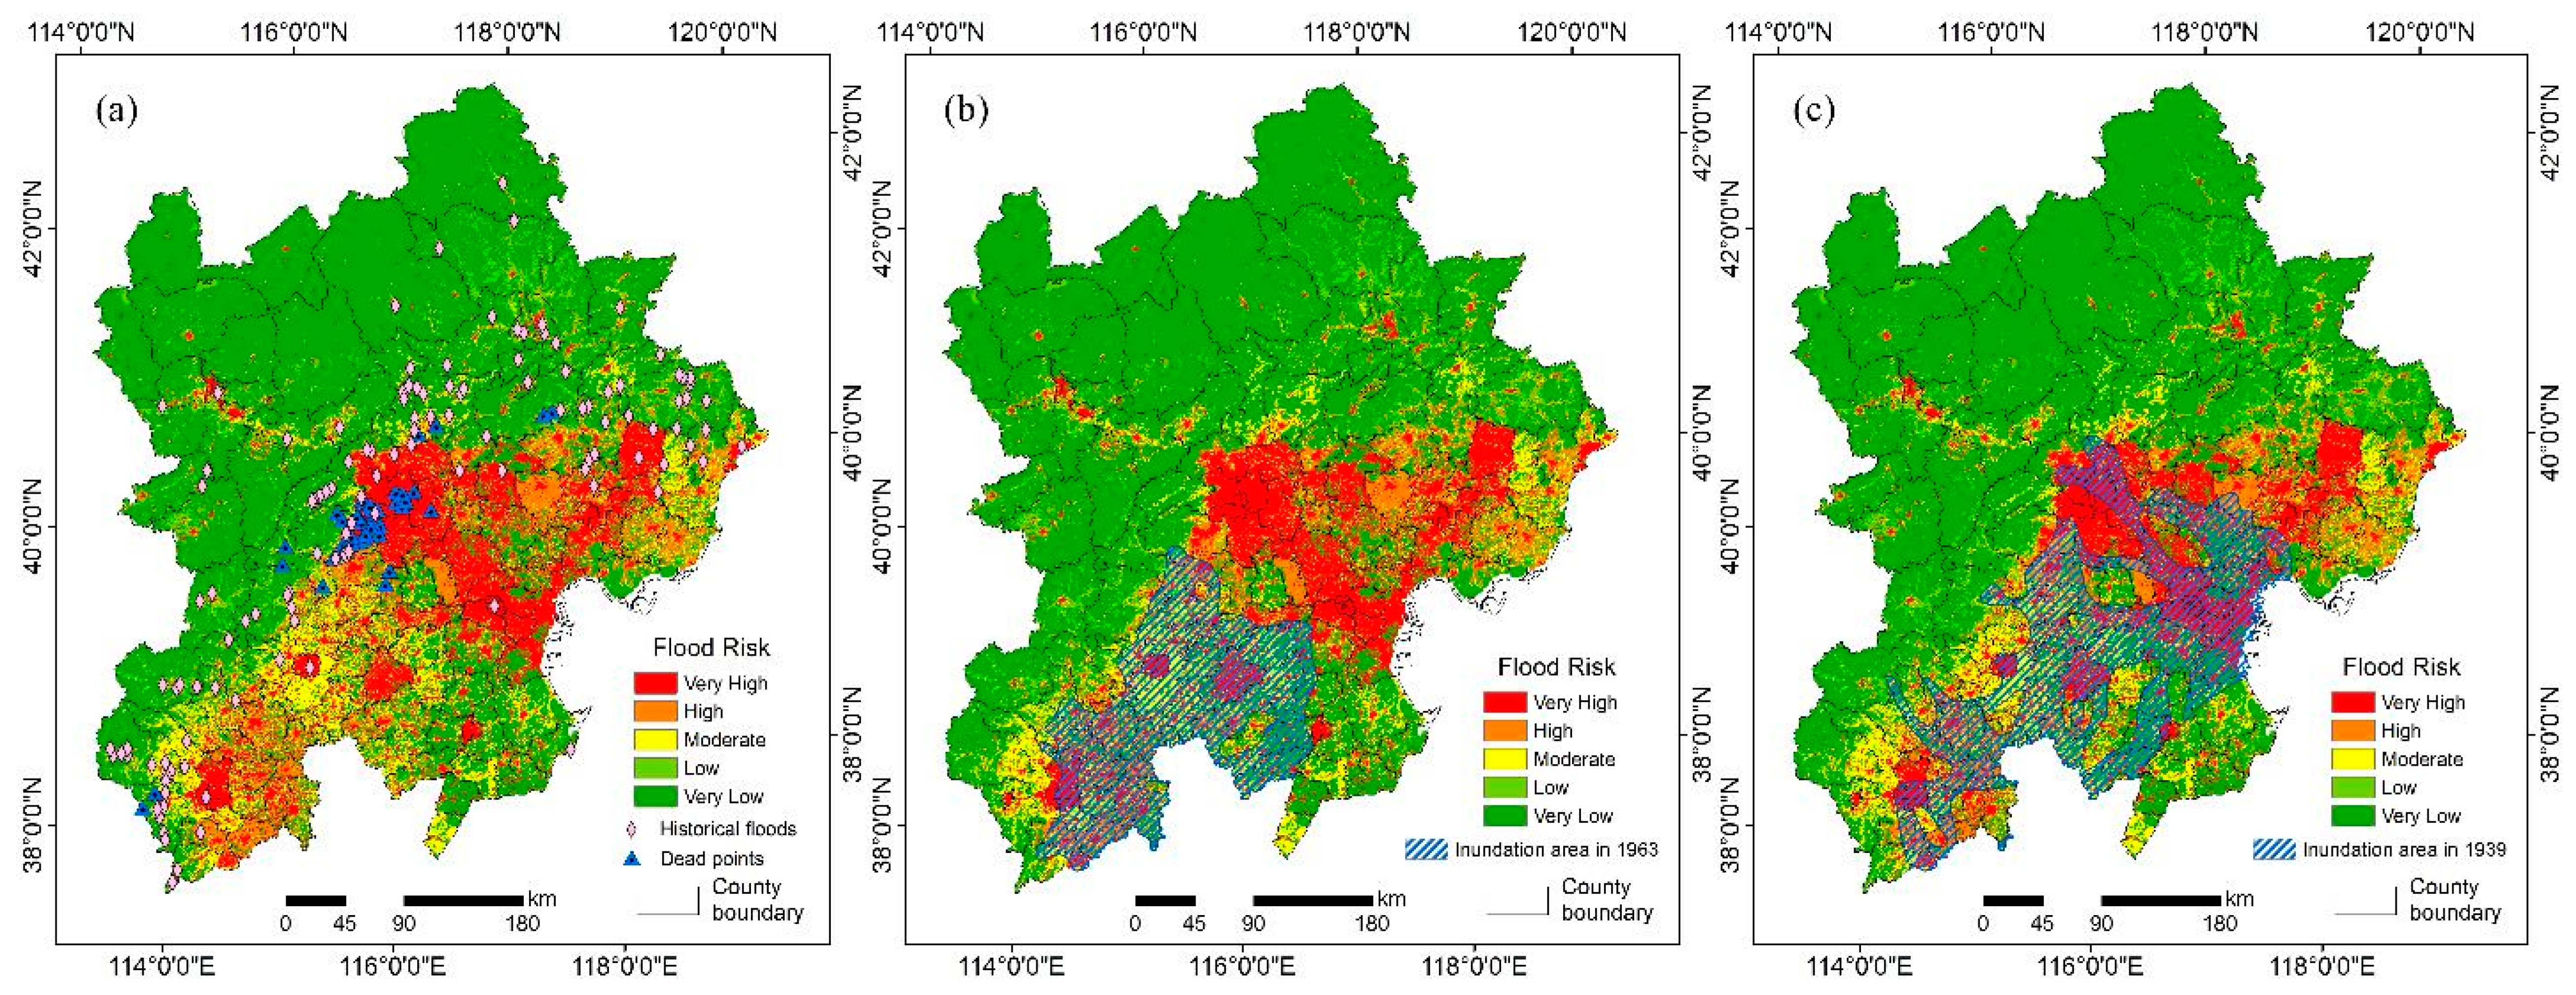
4.2. Distribution Characteristics of Flood Risk in the BTH Area
4.3. Results Validation
4.4. Comparison with other Methods
4.5. Flood Risk Mitigation
4.5.1. Engineering Measures
4.5.2. Non-Engineering Measures
5. Conclusions
Author Contributions
Funding
Conflicts of Interest
Appendix A. Membership Functions of Flood Risk Assessment in the BTH Area
Appendix B. Detailed Calculation Steps of Combined Weight for Risk Assessment
References
- Lai, C.; Shao, Q.; Chen, X.; Wang, Z.; Zhou, X.; Yang, B.; Zhang, L. Flood risk zoning using a rule mining based on ant colony algorithm. J. Hydrol. 2016, 542, 268–280. [Google Scholar] [CrossRef]
- Stefanidis, S.; Stathis, D. Assessment of flood hazard based on natural and anthropogenic factors using analytic hierarchy process (AHP). Nat. Hazards 2013, 68, 569–585. [Google Scholar] [CrossRef]
- The OFDA/CRED International Disaster Database. EM-DAT Disaster Profiles; The OFDA/CRED International Disaster Database: Brussels, Belgium, 2016. [Google Scholar]
- Temmerman, S.; Meire, P.; Bouma, T.J.; Herman, P.M.J.; Ysebaert, T.; De Vriend, H.J. Ecosystem-based coastal defence in the face of global change. Nature 2013, 504, 79–83. [Google Scholar] [CrossRef] [PubMed]
- Woodruff, J.D.; Irish, J.L.; Camargo, S.J. Coastal flooding by tropical cyclones and sea-level rise. Nature 2013, 504, 44–52. [Google Scholar] [CrossRef] [PubMed] [Green Version]
- Montanari, A.; Koutsoyiannis, D. Modeling and mitigating natural hazards: Stationarity is immortal! Water Resour. Res. 2014, 50, 9748–9756. [Google Scholar] [CrossRef]
- Du, S.; He, C.; Huang, Q.; Shi, P. How did the urban land in floodplains distribute and expand in China from 1992–2015? Environ. Res. Lett. 2018, 13, 034018. [Google Scholar] [CrossRef]
- Ward, P.J.; Bouwman, A.; Bierkens, M.F.P.; Ligtvoet, W.; Winsemius, H.C.; Jongman, B.; Weiland, F.S.; Van Beek, R. Assessing flood risk at the global scale: Model setup, results, and sensitivity. Environ. Res. Lett. 2013, 8, 044019. [Google Scholar] [CrossRef]
- Hall, J.W.; Sayers, P.B.; Dawson, R.J. National-scale Assessment of Current and Future Flood Risk in England and Wales. Nat. Hazards 2005, 36, 147–164. [Google Scholar] [CrossRef]
- Toosi, A.S.; Calbimonte, G.H.; Nouri, H.; Alaghmand, S. River basin-scale flood hazard assessment using a modified multi-criteria decision analysis approach: A case study. J. Hydrol. 2019, 574, 660–671. [Google Scholar] [CrossRef]
- Yin, J.; Yu, D.; Yin, Z.; Liu, M.; He, Q. Evaluating the impact and risk of pluvial flash flood on intra-urban road network: A case study in the city center of Shanghai, China. J. Hydrol. 2016, 537, 138–145. [Google Scholar] [CrossRef] [Green Version]
- Zeleňáková, M.; Fijko, R.; Labant, S.; Weiss, E.; Markovič, G.; Weiss, R. Flood risk modelling of the Slatvinec stream in Kružlov village, Slovakia. J. Clean. Prod. 2019, 212, 109–118. [Google Scholar] [CrossRef]
- Dou, X.; Song, J.; Wang, L.; Tang, B.; Xu, S.; Kong, F.; Jiang, X. Flood risk assessment and mapping based on a modified multi-parameter flood hazard index model in the Guanzhong Urban Area, China. Stoch. Environ. Res. Risk A 2018, 32, 1131–1146. [Google Scholar] [CrossRef]
- Jiang, Y.; Zevenbergen, C.; Ma, Y. Urban pluvial flooding and stormwater management: A contemporary review of China’s challenges and “sponge cities” strategy. Environ. Sci. Policy 2018, 80, 132–143. [Google Scholar] [CrossRef]
- Xu, H.; Ma, C.; Lian, J.; Xu, K.; Chaima, E. Urban flooding risk assessment based on an integrated k-means cluster algorithm and improved entropy weight method in the region of Haikou, China. J. Hydrol. 2018, 563, 975–986. [Google Scholar] [CrossRef]
- Mishra, K.; Sinha, R. Flood risk assessment in the Kosi megafan using multi-criteria decision analysis: A hydro-geomorphic approach. Geomorphology 2020, 350, 106861. [Google Scholar] [CrossRef]
- Mojaddadi, H.; Pradhan, B.; Nampak, H.; Ahmad, N.; Bin Ghazali, A.H. Ensemble machine-learning-based geospatial approach for flood risk assessment using multi-sensor remote-sensing data and GIS. Geomat. Nat. Hazards Risk 2017, 8, 1080–1102. [Google Scholar] [CrossRef] [Green Version]
- Barredo, J.I.; Engelen, G. Land Use Scenario Modeling for Flood Risk Mitigation. Sustainability 2010, 2, 1327–1344. [Google Scholar] [CrossRef] [Green Version]
- Adikari, Y.; Osti, R.; Noro, T. Flood-related disaster vulnerability: An impending crisis of megacities in Asia. J. Flood Risk Manag. 2010, 3, 185–191. [Google Scholar] [CrossRef]
- Shariat, R.; Roozbahani, A.; Ebrahimian, A. Risk analysis of urban stormwater infrastructure systems using fuzzy spatial multi-criteria decision making. Sci. Total Environ. 2019, 647, 1468–1477. [Google Scholar] [CrossRef]
- Rahmati, O.; Zeinivand, H.; Besharat, M. Flood hazard zoning in Yasooj region, Iran, using GIS and multi-criteria decision analysis. Geomat. Nat. Haz. Risk 2016, 7, 1000–1017. [Google Scholar] [CrossRef] [Green Version]
- Bates, P.D. Integrating remote sensing data with flood inundation models: How far have we got? Hydrol. Process. 2012, 26, 2515–2521. [Google Scholar] [CrossRef]
- Akter, M.; Jahan, M.; Kabir, R.; Karim, D.S.; Haque, A.; Rahman, M.; Salehin, M. Risk assessment based on fuzzy synthetic evaluation method. Sci. Total Environ. 2019, 658, 818–829. [Google Scholar] [CrossRef] [PubMed]
- Cai, T.; Li, X.; Ding, X.; Wang, J.; Zhan, J. Flood risk assessment based on hydrodynamic model and fuzzy comprehensive evaluation with GIS technique. Int. J. Disaster Risk Reduct. 2019, 35, 101077. [Google Scholar] [CrossRef]
- Lai, C.; Chen, X.; Chen, X.; Wang, Z.; Wu, X.; Zhao, S. A fuzzy comprehensive evaluation model for flood risk based on the combination weight of game theory. Nat. Hazards 2015, 77, 1243–1259. [Google Scholar] [CrossRef]
- Kazakis, N.; Kougias, I.; Patsialis, T. Assessment of flood hazard areas at a regional scale using an index-based approach and Analytical Hierarchy Process: Application in Rhodope–Evros region, Greece. Sci. Total Environ. 2015, 538, 555–563. [Google Scholar] [CrossRef]
- Yang, W.; Xu, K.; Lian, J.; Bin, L.; Ma, C. Multiple flood vulnerability assessment approach based on fuzzy comprehensive evaluation method and coordinated development degree model. J. Environ. Manag. 2018, 213, 440–450. [Google Scholar] [CrossRef]
- Zhao, N.; Jiao, Y.; Ma, T.; Zhao, M.; Fan, Z.; Yin, X.; Liu, Y.; Yue, T. Estimating the effect of urbanization on extreme climate events in the Beijing-Tianjin-Hebei region, China. Sci. Total Environ. 2019, 688, 1005–1015. [Google Scholar] [CrossRef]
- Wang, S.; Ma, H.; Zhao, Y. Exploring the relationship between urbanization and the eco-environment—A case study of Beijing–Tianjin–Hebei region. Ecol. Indic. 2014, 45, 171–183. [Google Scholar] [CrossRef]
- Han, B.; Liu, H.; Wang, R. Urban ecological security assessment for cities in the Beijing–Tianjin–Hebei metropolitan region based on fuzzy and entropy methods. Ecol. Model. 2015, 318, 217–225. [Google Scholar] [CrossRef]
- Huang, Y.; Chen, S.; Cao, Q.; Hong, Y.; Wu, B.; Huang, M.; Qiao, L.; Zhang, Z.; Li, Z.; Li, W.; et al. Evaluation of version-7 TRMM multi-satellite precipitation analysis product during the Beijing extreme heavy rainfall event of 21 July 2012. Water 2014, 6, 32–44. [Google Scholar] [CrossRef] [Green Version]
- Zhang, Y.; Hong, Y.; Wang, X.; Gourley, J.J.; Xue, X.; Saharia, M.; Ni, G.; Wang, G.; Huang, Y.; Chen, S.; et al. Hydrometeorological Analysis and Remote Sensing of Extremes: Was the July 2012 Beijing Flood Event Detectable and Predictable by Global Satellite Observing and Global Weather Modeling Systems? J. Hydrometeorol. 2015, 16, 381–395. [Google Scholar] [CrossRef]
- Kia, M.B.; Pirasteh, S.; Pradhan, B.; Mahmud, A.R.; Sulaiman, W.N.A.; Moradi, A. An artificial neural network model for flood simulation using GIS: Johor River Basin, Malaysia. Environ. Earth Sci. 2012, 67, 251–264. [Google Scholar] [CrossRef]
- UNDHA. Internationally Agreed Glossary of Basic Terms Related to Disaster Management; United Nations Department of Humanitarian Affairs (UNDHA): Geneva, Switzerland, 1992. [Google Scholar]
- Jiang, W.; Deng, L.; Chen, L.; Wu, J.; Li, J. Risk assessment and validation of flood disaster based on fuzzy mathematics. Prog. Nat. Sci. 2009, 19, 1419–1425. [Google Scholar] [CrossRef]
- Zou, Q.; Zhou, J.Z.; Zhou, C.; Song, L.X.; Guo, J. Comprehensive flood risk assessment based on set pair analysis-variable fuzzy sets model and fuzzy AHP. Stoch. Environ. Res. Risk Assess. 2013, 27, 525–546. [Google Scholar] [CrossRef]
- Yang, X.-L.; Ding, J.-H.; Hou, H. Application of a triangular fuzzy AHP approach for flood risk evaluation and response measures analysis. Nat. Hazards 2013, 68, 657–674. [Google Scholar] [CrossRef]
- Yang, T.-H.; Yang, S.-C.; Ho, J.-Y.; Lin, G.-F.; Hwang, G.-D.; Lee, C.-S. Flash flood warnings using the ensemble precipitation forecasting technique: A case study on forecasting floods in Taiwan caused by typhoons. J. Hydrol. 2015, 520, 367–378. [Google Scholar] [CrossRef]
- Kui, L.; Stella, J.C.; Lightbody, A.; Wilcox, A.C. Ecogeomorphic feedbacks and flood loss of riparian tree seedlings in meandering channel experiments. Water Resour. Res. 2014, 50, 9366–9384. [Google Scholar] [CrossRef] [Green Version]
- Li, Q.; Zhou, J.; Liu, D.; Jiang, X. Research on flood risk analysis and evaluation method based on variable fuzzy sets and information diffusion. Saf. Sci. 2012, 50, 1275–1283. [Google Scholar] [CrossRef]
- Li, Q. Fuzzy approach to analysis of flood risk based on variable fuzzy sets and improved information diffusion methods. Nat. Hazards Earth Syst. Sci. 2013, 13, 239–249. [Google Scholar] [CrossRef] [Green Version]
- Wu, Y.; Jia, W.; Li, L.; Song, Z.; Xu, C.; Liu, F. Risk assessment of electric vehicle supply chain based on fuzzy synthetic evaluation. Energy 2019, 182, 397–411. [Google Scholar] [CrossRef]
- Shannon, C.E. A Mathematical Theory of Communication. Bell Syst. Tech. J. 1948, 27, 379–423. [Google Scholar] [CrossRef] [Green Version]
- Orencio, P.M.; Fujii, M. A localized disaster-resilience index to assess coastal communities based on an analytic hierarchy process (AHP). Int. J. Disaster Risk Reduct. 2013, 3, 62–75. [Google Scholar] [CrossRef]
- Shi, P. Disaster Risk Science; Springer: Berlin/Heidelberg, Germany, 2019; pp. 51–98. [Google Scholar]
- IPCC. Summary for Policymakers. In Climate Change 2001: Impacts, Adaptation and Vulnerability; WMO: Geneva, Switzerland, 2001. [Google Scholar]
- IPCC. Climate Change 2001: Synthesis Report. In A Contribution of Working Groups I, II, and III to the Third Assessment Report of the Intergovernmental Panel on Climate Change; Watson, R.T., The Core Writing Team, Eds.; Cambridge University Press: Cambridge, UK; New York, NY, USA, 2001; p. 398. [Google Scholar]
- IPCC. Climate Change 2014: Synthesis Report. In Contribution of Working Groups I, II and III to the Fifth Assessment Report of the Intergovernmental Panel on Climate Change; Core Writing Team, Pachauri, R.K., Meyer, L.A., Eds.; IPCC: Geneva, Switzerland, 2014; p. 151. [Google Scholar]
- Nasiri, H.; Yusof, M.J.M.; Ali, T.A.M. An overview to flood vulnerability assessment methods. Sustain. Water Resour. Manag. 2016, 2, 331–336. [Google Scholar] [CrossRef] [Green Version]


| ST | Sand | Loamy Sand | Sandy Loam | Sandy Clay Loam | Loam | Sand Clay | Silt Loam |
|---|---|---|---|---|---|---|---|
| IC | 13 | 12 | 11 | 10 | 9 | 8 | 7 |
| ST | Silt | Clay loam | Silty clay loam | Clay | Silty clay | Clay (heavy) | |
| IC | 6 | 5 | 4 | 3 | 2 | 1 |
| Indices | Time | Original Resolution | Data Sources |
|---|---|---|---|
| DEM | / | 90 × 90 m | Computer Network Information Center of the Chinese Academy of Sciences (http://www.gscloud.cn/) |
| SL | / | 90 × 90 m | Same as above |
| RI | 1981–2010 | Vector data | National Meteorological Information Center (http://data.cma.cn/) |
| RF | 1981–2010 | Vector data | Same as above |
| DD | 2017 | Vector data | National Geomatics Center of China (http://www.ngcc.cn/ngcc/) |
| RND | 2017 | Vector data | Same as above |
| NDVI | 2018 | 1 × 1 km | Resource and Environment Data Cloud Platform of the Chinese Academy of Sciences (http://www.resdc.cn/) |
| GDP | 2015 | 1 × 1 km | Same as above |
| GO | / | 1 × 1 km | Same as above |
| ST | / | 1 × 1 km | Food and Agriculture Organization of the United Nations (http://www.fao.org/home/en/) |
| PD | 2015 | 1 × 1 km | Peking University Geographic Data Platform (https://geodata.pku.edu.cn/) |
| PDI | 2017 | County unit | Beijing Regional Statistical Yearbook (2018), Tianjin Statistical Yearbook (2018), Hebei Economic Yearbook (2018) |
| RCE | 2017 | County unit | Same as above |
| ASY | 2000 | County unit | Fifth population census data of the National Bureau of Statistics of the People’s Republic of China (2000) |
| Flood Disaster Risk | Indicators | Fuzzy Classification (Discontinuities) | Indicator Attributes | ||||
|---|---|---|---|---|---|---|---|
| d1 | d2 | d3 | d4 | d5 | |||
| Hazard | Digital elevation model data (DEM, m) | 1500.00 | 1000.00 | 500.00 | 50.00 | 5.00 | negative |
| Slope data (SL, degree) | 20.00 | 10.00 | 6.00 | 2.00 | 0.20 | negative | |
| Rainfall intensity data (RI, Normalized value) | 0.21 | 0.37 | 0.53 | 0.69 | 0.85 | positive | |
| Rainstorm frequency (RF, times/year) | 0.50 | 1.50 | 2.50 | 3.50 | 4.50 | positive | |
| Drainage density (DD, km/3 km2) | 0.00 | 0.12 | 0.24 | 0.36 | 0.48 | positive | |
| Normalized difference vegetation index (NDVI) | 0.90 | 0.81 | 0.72 | 0.63 | 0.54 | negative | |
| Soil texture (ST) | 13.00 | 12.00 | 11.00 | 9.00 | 7.00 | negative | |
| Vulnerability | Gross domestic product (GDP, yuan/km2) | 50.00 | 200.00 | 1000.00 | 3000.00 | 5000.00 | positive |
| Population density (PD, people/km2) | 1.00 | 200.00 | 400.00 | 800.00 | 1600.00 | positive | |
| Road network density (RND, km/km2) | 0.00 | 0.55 | 1.10 | 1.65 | 2.20 | positive | |
| Grain output (GO, kg/hm2) | 967.94 | 2581.17 | 4463.27 | 6668.02 | 8872.77 | positive | |
| Per capita disposable income (PDI, 10000 yuan/people) | 2.64 | 2.29 | 2.01 | 1.76 | 1.55 | negative | |
| Ratio of children and the elderly (RCE, %) | 23.00 | 25.00 | 26.00 | 27.00 | 28.00 | negative | |
| Average schooling years (ASY, year) | 9.40 | 8.80 | 8.20 | 7.60 | 7.20 | negative | |
| Indicator | Hazard | Vulnerability | |||||||
|---|---|---|---|---|---|---|---|---|---|
| Hazard | 1 | 4/3 | |||||||
| Vulnerability | 3/4 | 1 | |||||||
| λmax = 2; CI = 0; RI = 0; CR = 0 | |||||||||
| Indicator | RI | RF | DEM | DD | SL | NDVI | ST | ||
| RI | 1 | 1 | 2 | 2 | 3 | 4 | 5 | ||
| RF | 1 | 1 | 2 | 2 | 3 | 4 | 5 | ||
| DEM | 1/2 | 1/2 | 1 | 2 | 3 | 3 | 4 | ||
| DD | 1/2 | 1/2 | 1/2 | 1 | 2 | 3 | 4 | ||
| SL | 1/3 | 1/3 | 1/3 | 1/2 | 1 | 2 | 3 | ||
| NDVI | 1/4 | 1/4 | 1/3 | 1/3 | 1/2 | 1 | 3 | ||
| ST | 1/5 | 1/5 | 1/4 | 1/4 | 1/3 | 1/3 | 1 | ||
| λmax = 7.215; CI = 0.036; RI = 1.320; CR = 0.027 | |||||||||
| Indicator | GDP | PD | GO | RND | PDI | RCE | ASY | ||
| GDP | 1 | 1 | 3 | 4 | 5 | 7 | 8 | ||
| PD | 1 | 1 | 3 | 4 | 5 | 7 | 8 | ||
| GO | 1/3 | 1/3 | 1 | 3 | 4 | 5 | 7 | ||
| RND | 1/4 | 1/4 | 1/3 | 1 | 3 | 5 | 5 | ||
| PDI | 1/5 | 1/5 | 1/4 | 1/3 | 1 | 4 | 5 | ||
| RCE | 1/7 | 1/7 | 1/5 | 1/5 | 1/4 | 1 | 3 | ||
| ASY | 1/8 | 1/8 | 1/7 | 1/5 | 1/5 | 1/3 | 1 | ||
| λmax = 7.574; CI = 0.096; RI = 1.320; CR = 0.073 | |||||||||
| Indicator | AHP (Analytic Hierarchy Process) | EW (Entropy Weight) | CW (Combined Weight) |
|---|---|---|---|
| DEM | 0.0999 | 0.0062 | 0.0058 |
| SL | 0.0485 | 0.0024 | 0.0011 |
| RI | 0.1450 | 0.0224 | 0.0303 |
| RF | 0.1450 | 0.0192 | 0.0260 |
| DD | 0.0777 | 0.0224 | 0.0162 |
| NDVI | 0.0343 | 0.0496 | 0.0159 |
| ST | 0.0206 | 0.0504 | 0.0097 |
| GDP | 0.1313 | 0.3133 | 0.3843 |
| PD | 0.1313 | 0.3414 | 0.4188 |
| RND | 0.0438 | 0.0651 | 0.0266 |
| GO | 0.0712 | 0.0954 | 0.0635 |
| PDI | 0.0279 | 0.0018 | 0.0005 |
| RCE | 0.0142 | 0.0078 | 0.0010 |
| ASY | 0.0094 | 0.0028 | 0.0002 |
| Risk Levels | Very High | High | Moderate | Low | Very Low |
|---|---|---|---|---|---|
| Historical floods (%) | 34.13 | 15.87 | 38.10 | 8.73 | 3.17 |
| Risk Levels | Very High | High | Moderate | Low | Very Low |
|---|---|---|---|---|---|
| Dead points (%) | 77.50 | 11.70 | 6.30 | 2.70 | 1.80 |
| Historical Floods | Inundated Area (km2) | Percentage of Total Area (%) | Overlapping Ratio with Different Risk Levels (%) | ||||
|---|---|---|---|---|---|---|---|
| Very High | High | Moderate | Low | Very Low | |||
| 1939 | 31713 | 17.54 | 34.90 | 15.50 | 15.60 | 6.40 | 27.70 |
| 1963 | 24342 | 13.46 | 22.30 | 17.20 | 26.30 | 7.30 | 27.00 |
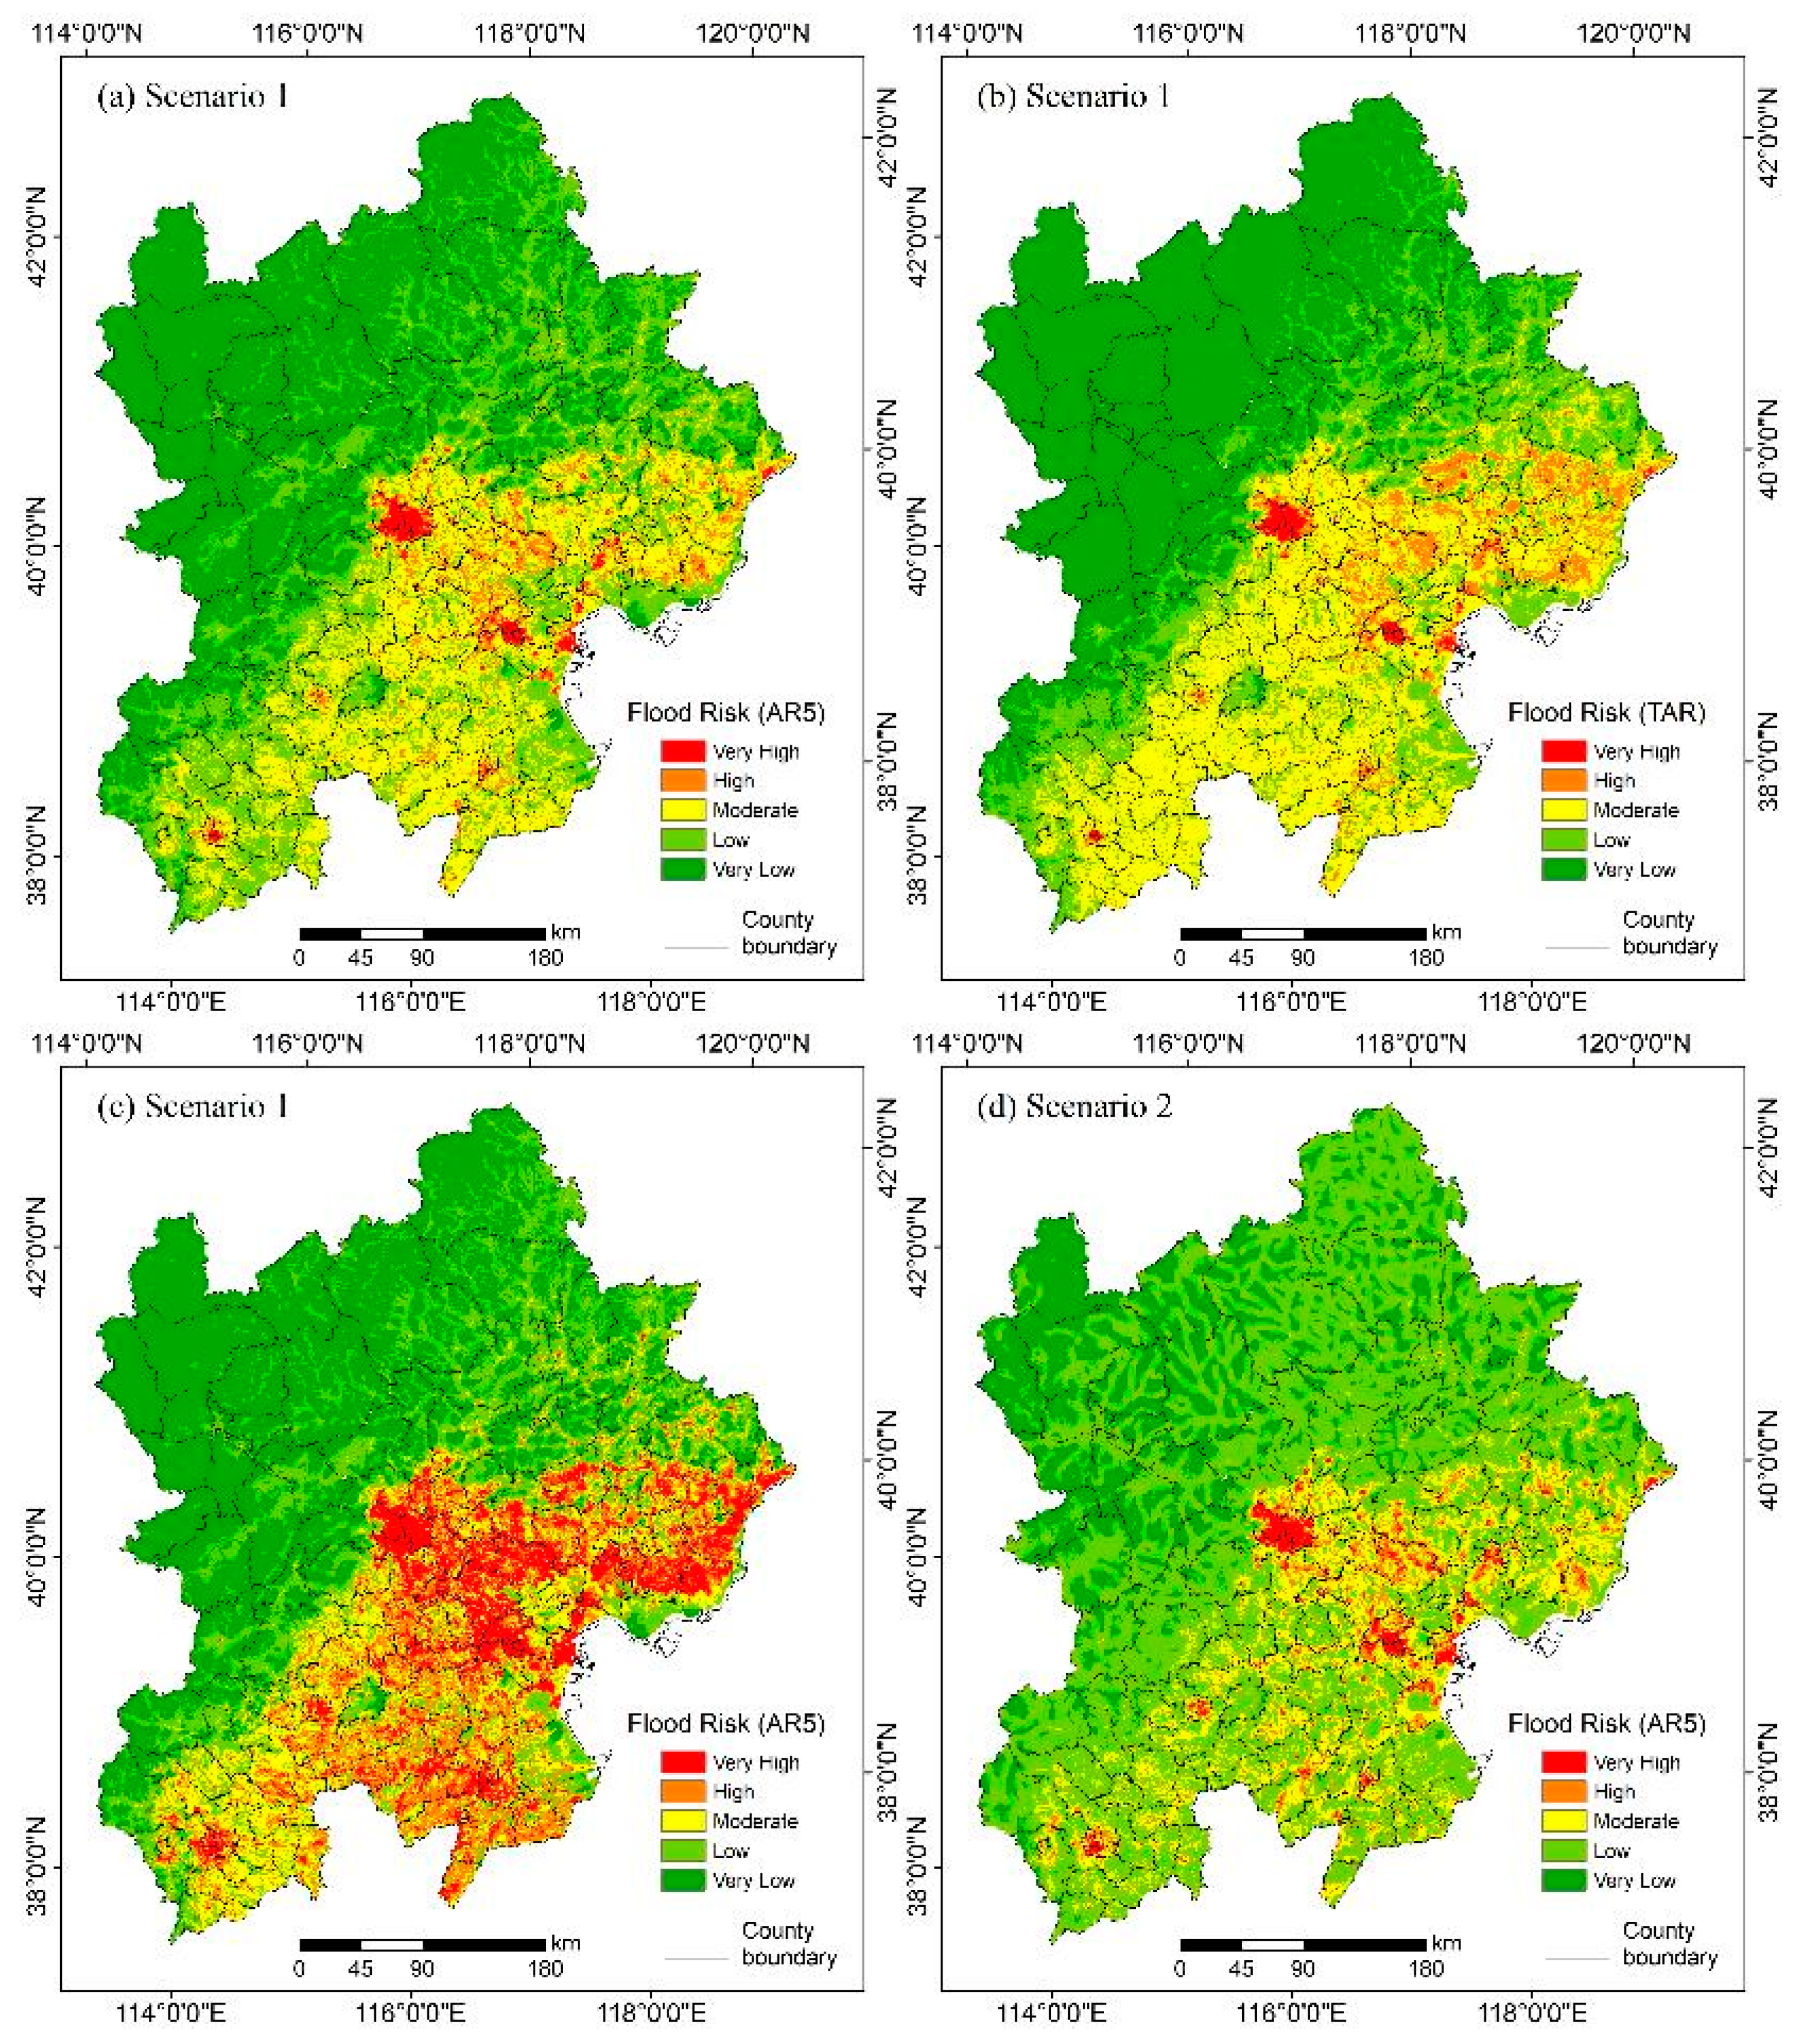
| Flood Risk | Scenario 1 | Scenario 2 |
|---|---|---|
| Index Distribution in TAR and AR5 | Index Distribution in AR5 | |
| Hazard | RI, RF | RI, RF |
| Exposure | GDP, PD, GO, RND | GDP, PD, RND |
| Sensitivity | DEM, SL, DD, NDVI, ST | GO, DEM, SL, DD, NDVI, ST |
| Adaptive Capacity | PDI, RCE, ASY | PDI, RCE, ASY |
© 2020 by the authors. Licensee MDPI, Basel, Switzerland. This article is an open access article distributed under the terms and conditions of the Creative Commons Attribution (CC BY) license (http://creativecommons.org/licenses/by/4.0/).
Share and Cite
Wang, G.; Liu, Y.; Hu, Z.; Lyu, Y.; Zhang, G.; Liu, J.; Liu, Y.; Gu, Y.; Huang, X.; Zheng, H.; et al. Flood Risk Assessment Based on Fuzzy Synthetic Evaluation Method in the Beijing-Tianjin-Hebei Metropolitan Area, China. Sustainability 2020, 12, 1451. https://0-doi-org.brum.beds.ac.uk/10.3390/su12041451
Wang G, Liu Y, Hu Z, Lyu Y, Zhang G, Liu J, Liu Y, Gu Y, Huang X, Zheng H, et al. Flood Risk Assessment Based on Fuzzy Synthetic Evaluation Method in the Beijing-Tianjin-Hebei Metropolitan Area, China. Sustainability. 2020; 12(4):1451. https://0-doi-org.brum.beds.ac.uk/10.3390/su12041451
Chicago/Turabian StyleWang, Guangpeng, Yong Liu, Ziying Hu, Yanli Lyu, Guoming Zhang, Jifu Liu, Yun Liu, Yu Gu, Xichen Huang, Hao Zheng, and et al. 2020. "Flood Risk Assessment Based on Fuzzy Synthetic Evaluation Method in the Beijing-Tianjin-Hebei Metropolitan Area, China" Sustainability 12, no. 4: 1451. https://0-doi-org.brum.beds.ac.uk/10.3390/su12041451