The State of Air Pollution as a Factor Determining the Assessment of a City’s Tourist Attractiveness—Based on the Opinions of Polish Respondents


Abstract
:1. Introduction
2. Theoretical Background
2.1. Urban Tourism and the Tourist Attractiveness of Cities
- Number and rank of tourist values: Natural and cultural,
- number and category of elements of tourist management, including the ability to service tourist facilities: Accommodation, catering, complementary facilities,
- the state of transport accessibility through particular branches of tourist transport: Rail, road, air, sea, and inland waterway, as well as local transport,
- the state of the natural environment and the results of measures to protect it:
- -
- Treated wastewater,
- -
- generated and managed waste,
- -
- devastated, degraded, and rehabilitated land,
- -
- emission and reduction of pollutants, including in particular those related to the state of the air.
- Obligatory departure: Private, business,
- the motive for the journey: Leisure, health, cognitive,
- accompanying persons: On their own, with their families, including children,
- departure time: During the season or outside the tourist season, especially during periods with more or less favourable air quality levels,
- way of organizing the trip: Independently or through a travel agency,
- detailed elements of the offer, e.g., the means of transport used, including local transport,
- scope of the offer, and tourist activities in the city—spending time mainly in closed facilities (e.g., cultural, sports, and tourist bases), or in places and facilities outside, in the so-called “open air”,
- health: The health status of participants, e.g., related to diseases (e.g., respiratory system, allergies) or susceptibility to malaise under poor air quality conditions.
2.2. Types of Air Pollution and Their Impacts on the Health of Residents and Tourists
2.3. Scope of Information on Air Pollution
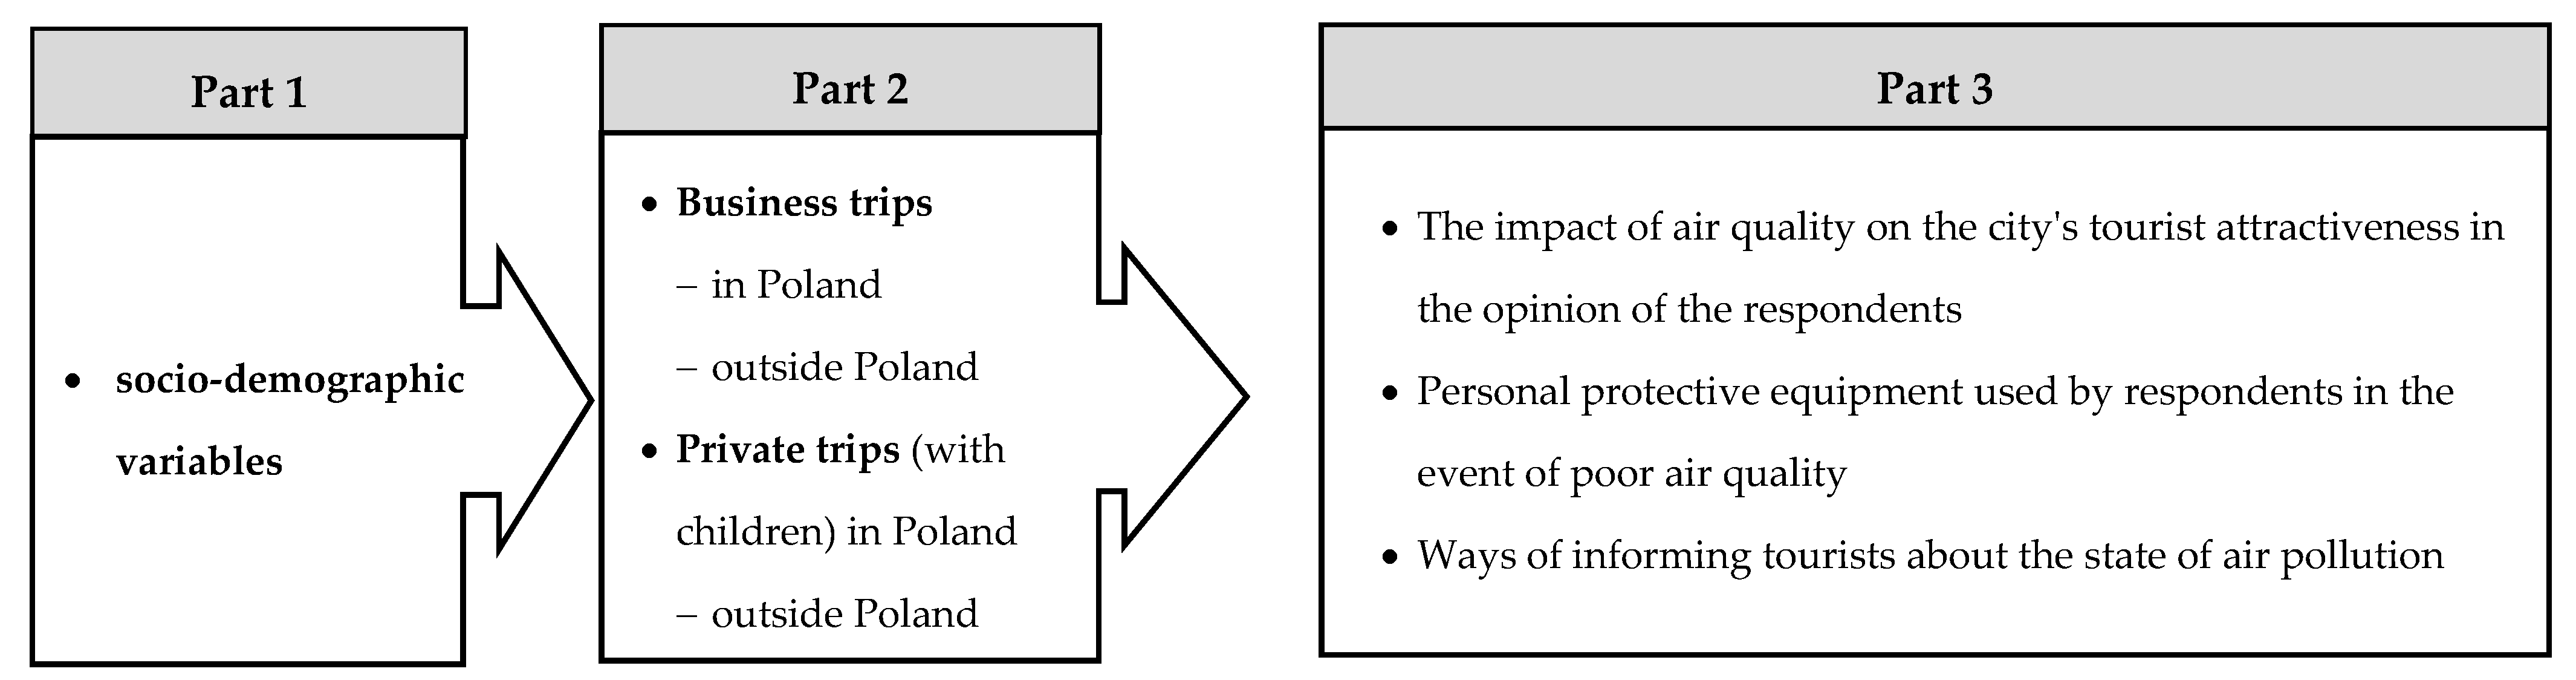
3. Materials and Methods
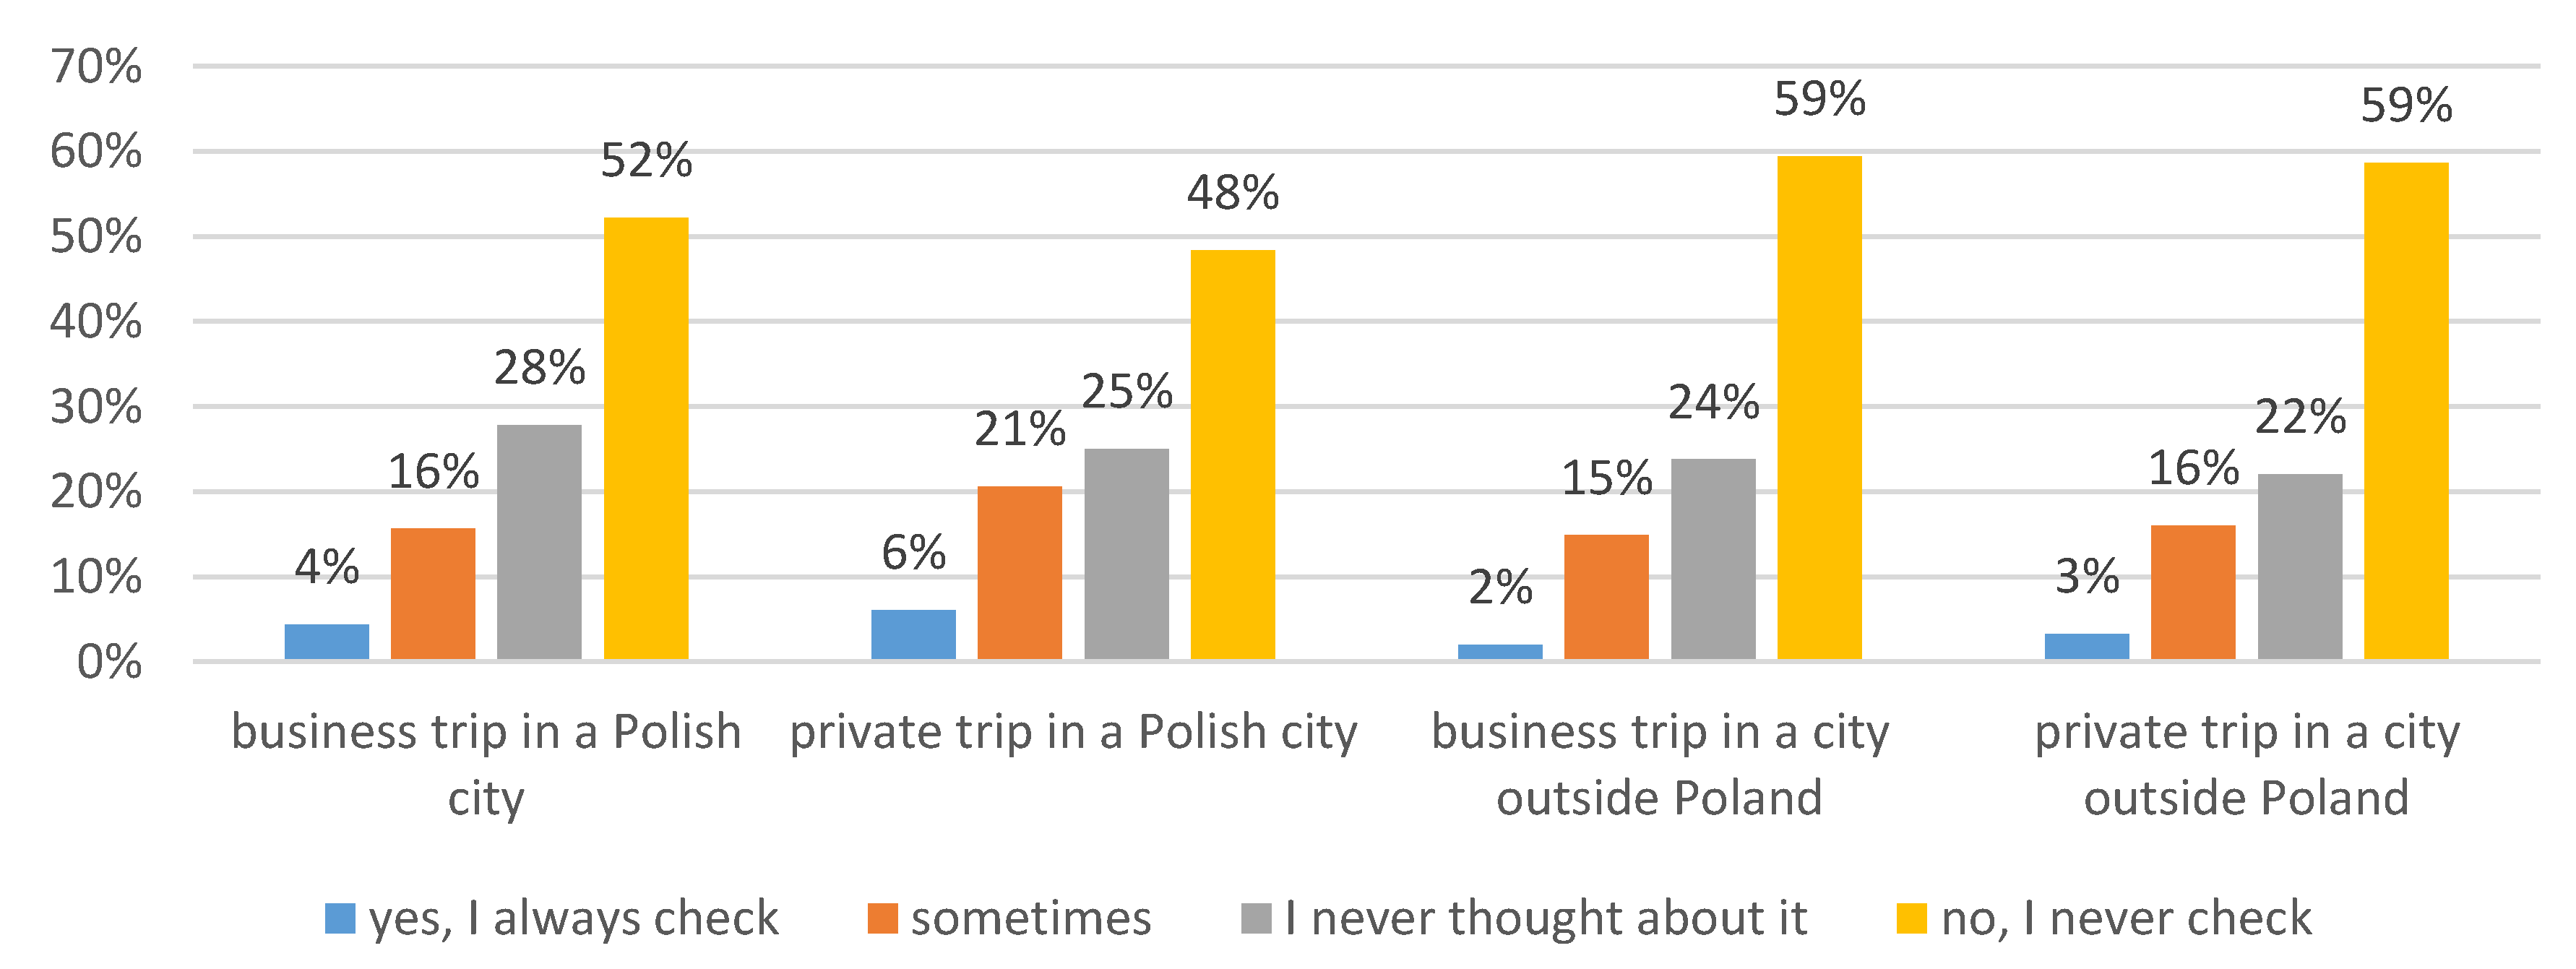
- Business trips:
- a)
- In Poland,
- b)
- outside Poland,
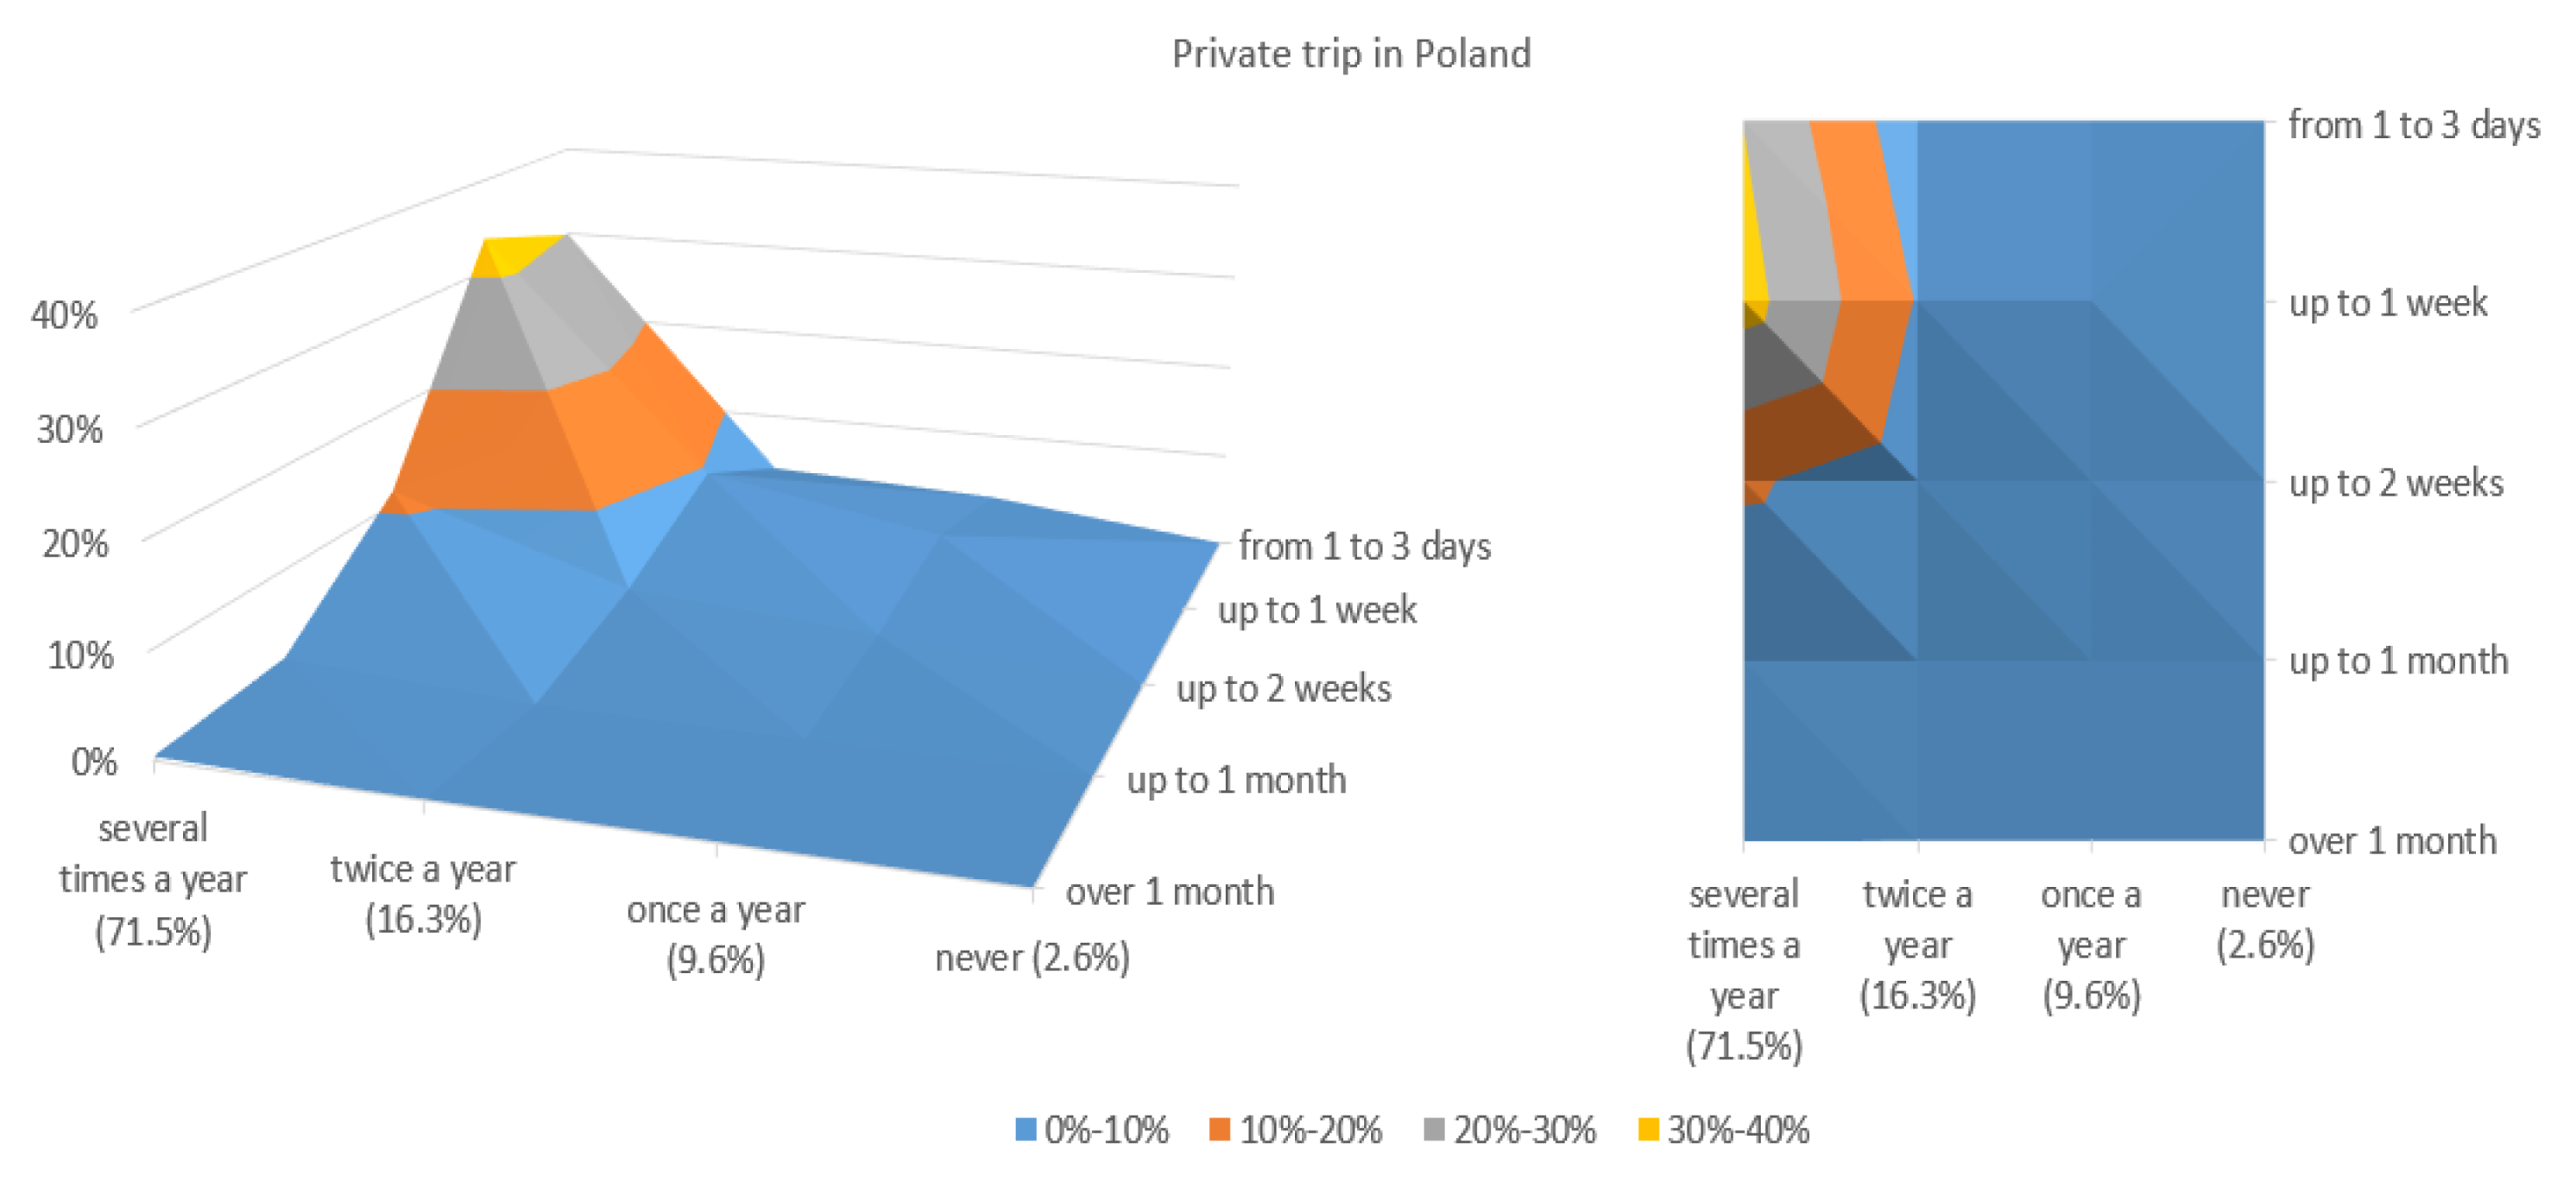
- Private trips:
- a)
- In Poland,
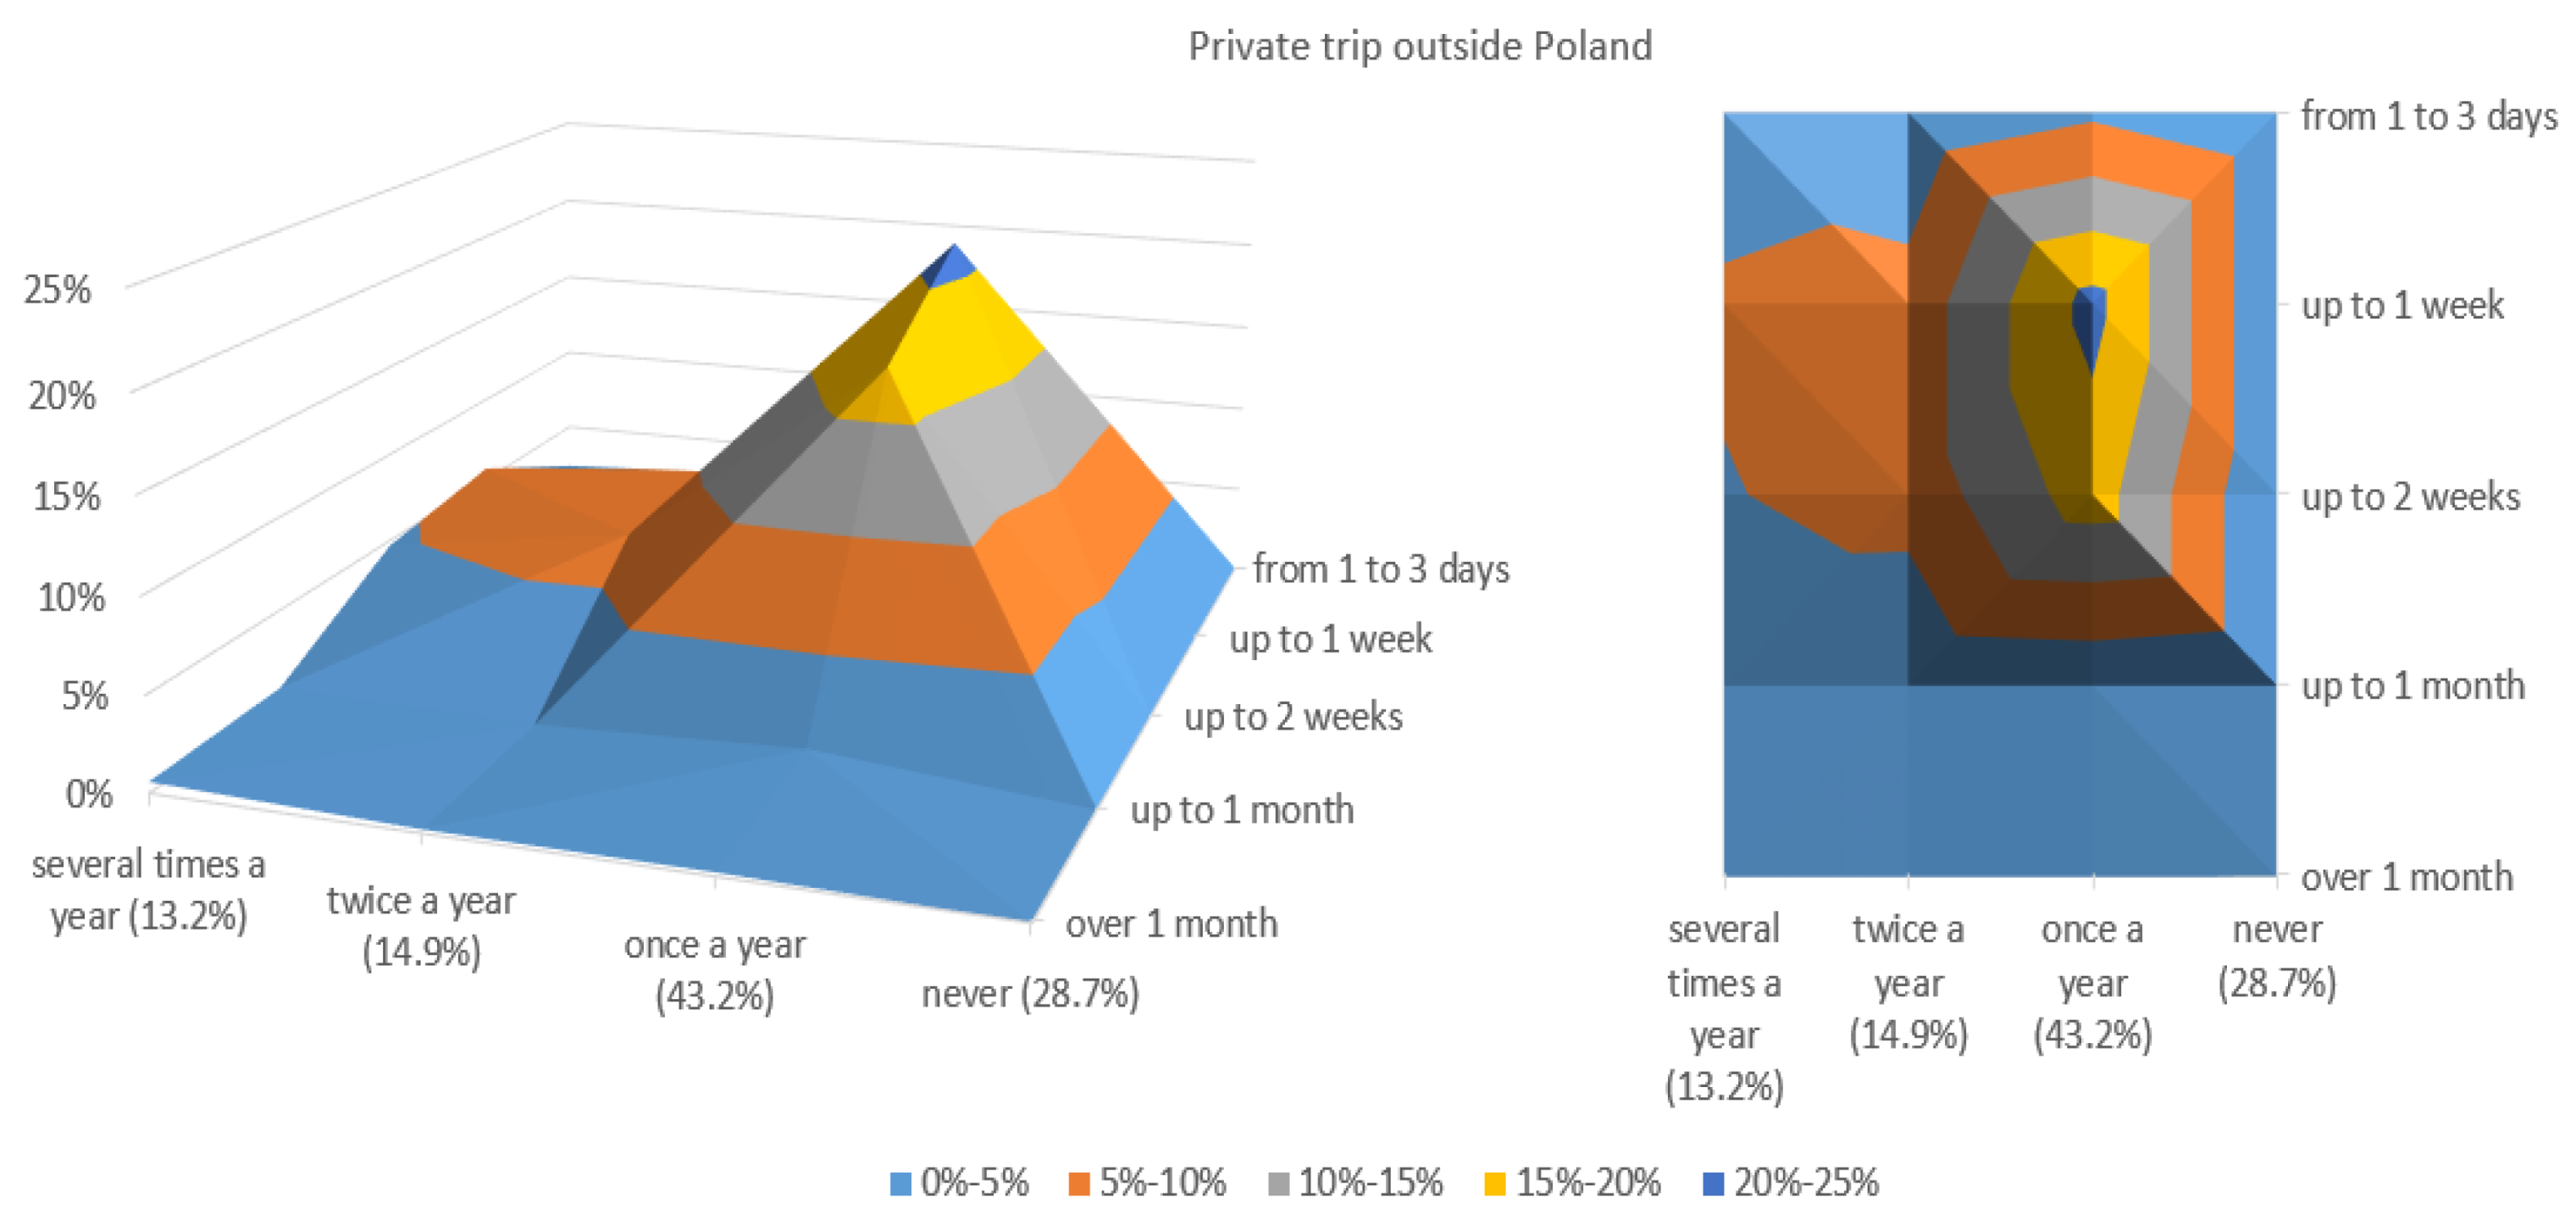
- b)
- outside Poland.
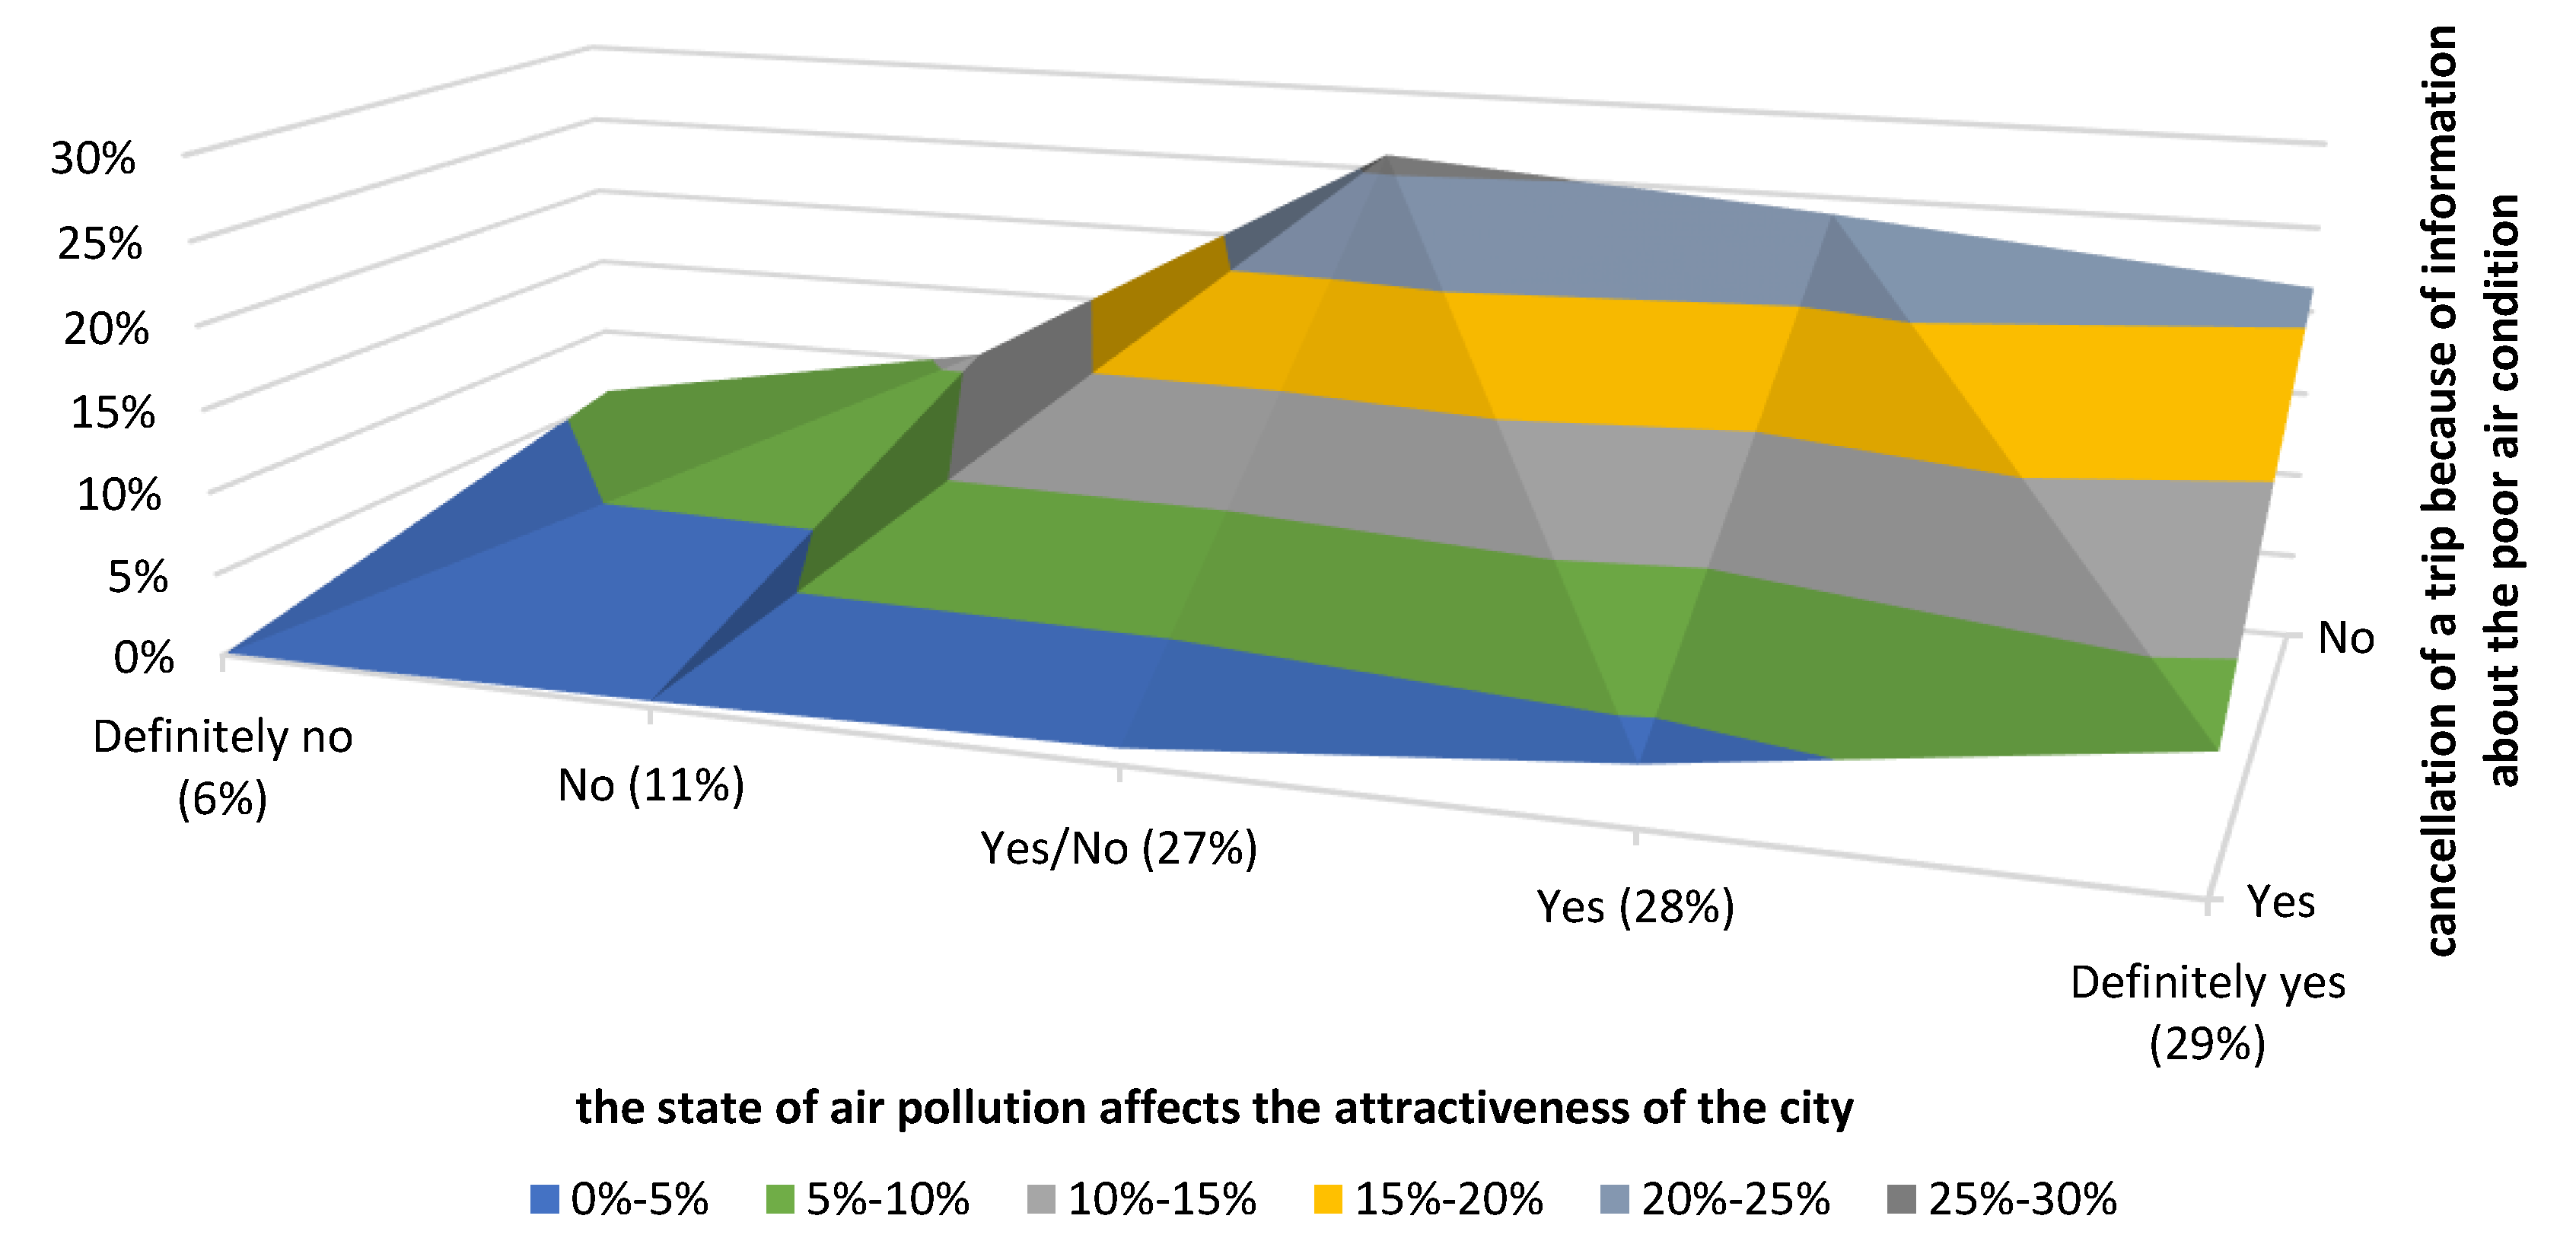
- The impact of air quality on the subjective assessment of the city’s tourist attractiveness in the opinion of respondents;
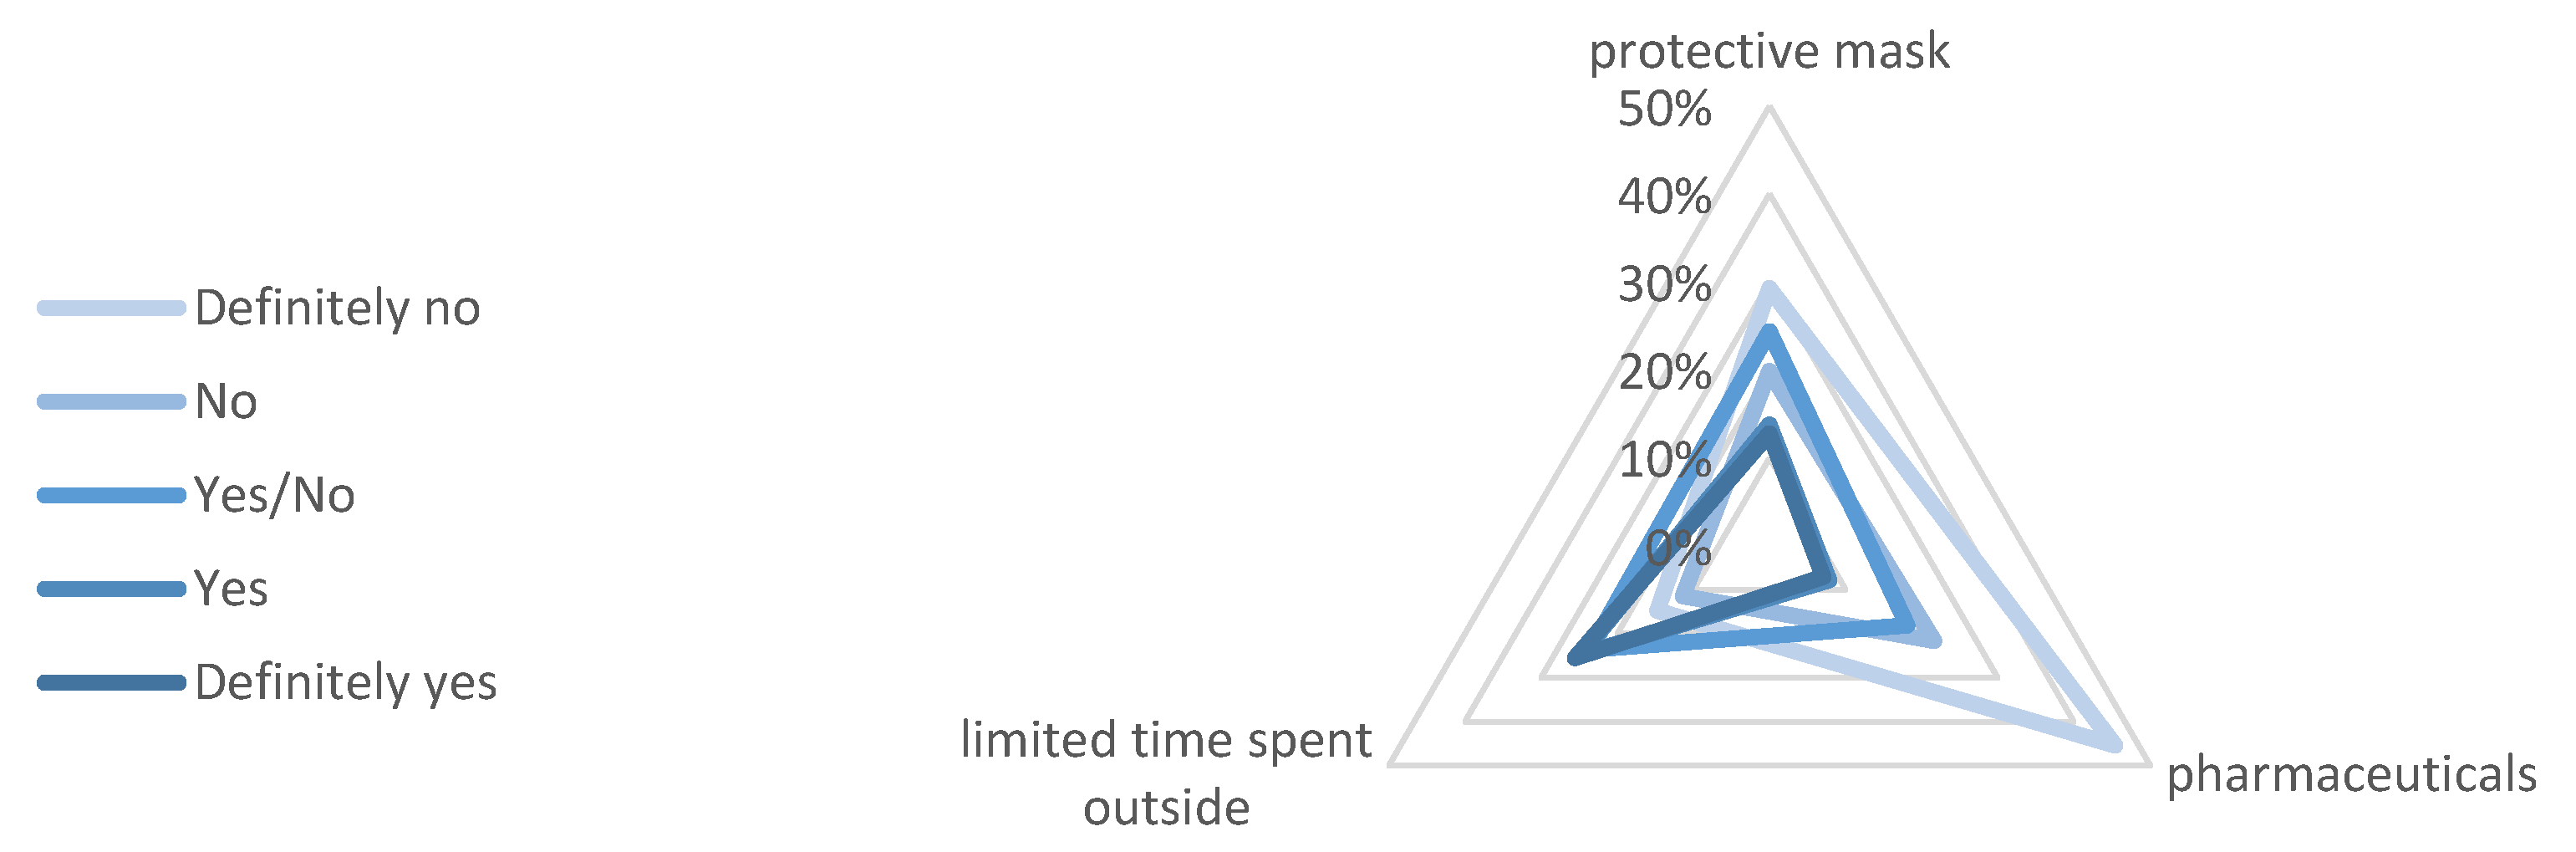
- personal protective equipment used by respondents in case of bad air condition;
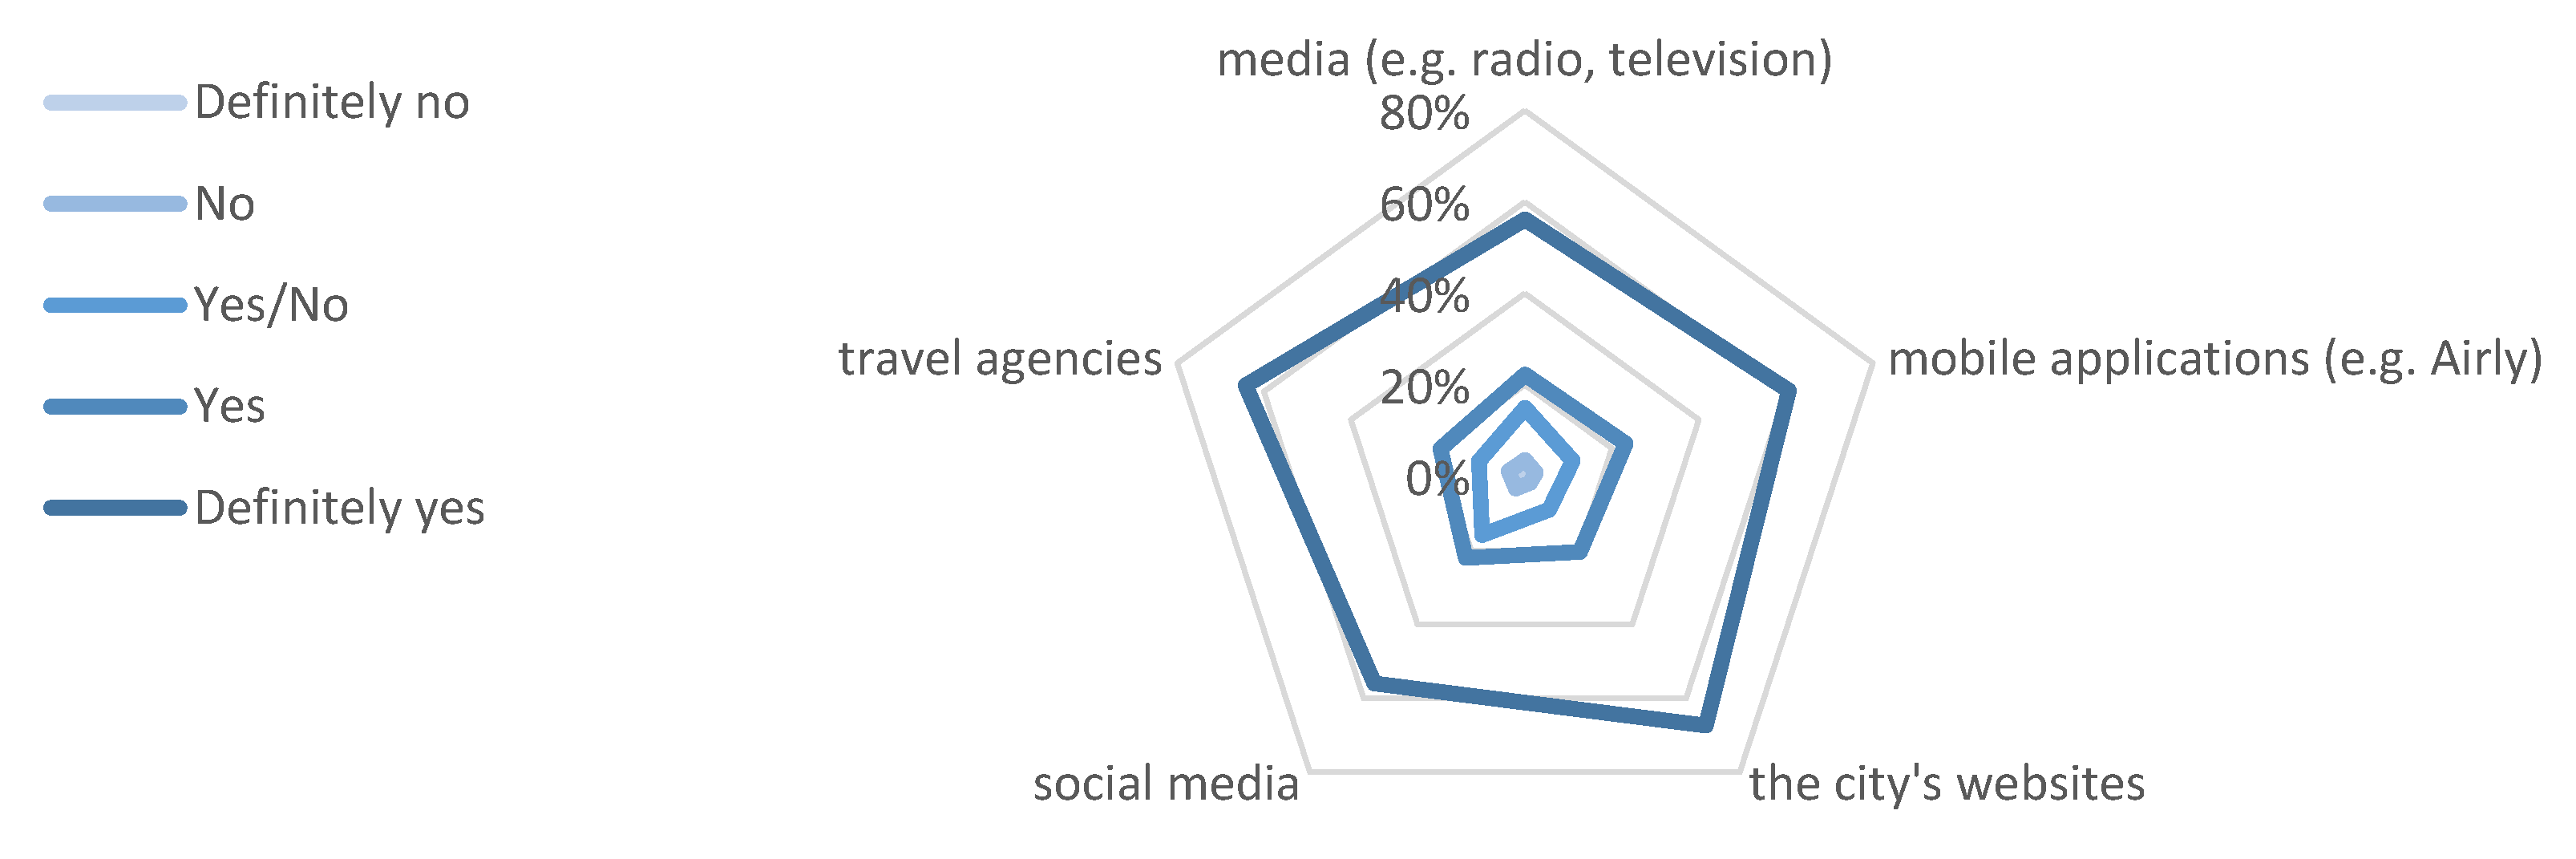
- ways of informing tourists about the state of air pollution.
4. Analysis of Results in the Context of Established Research Hypotheses
- -
- The length of the trip (distinguishing between business and private),
- -
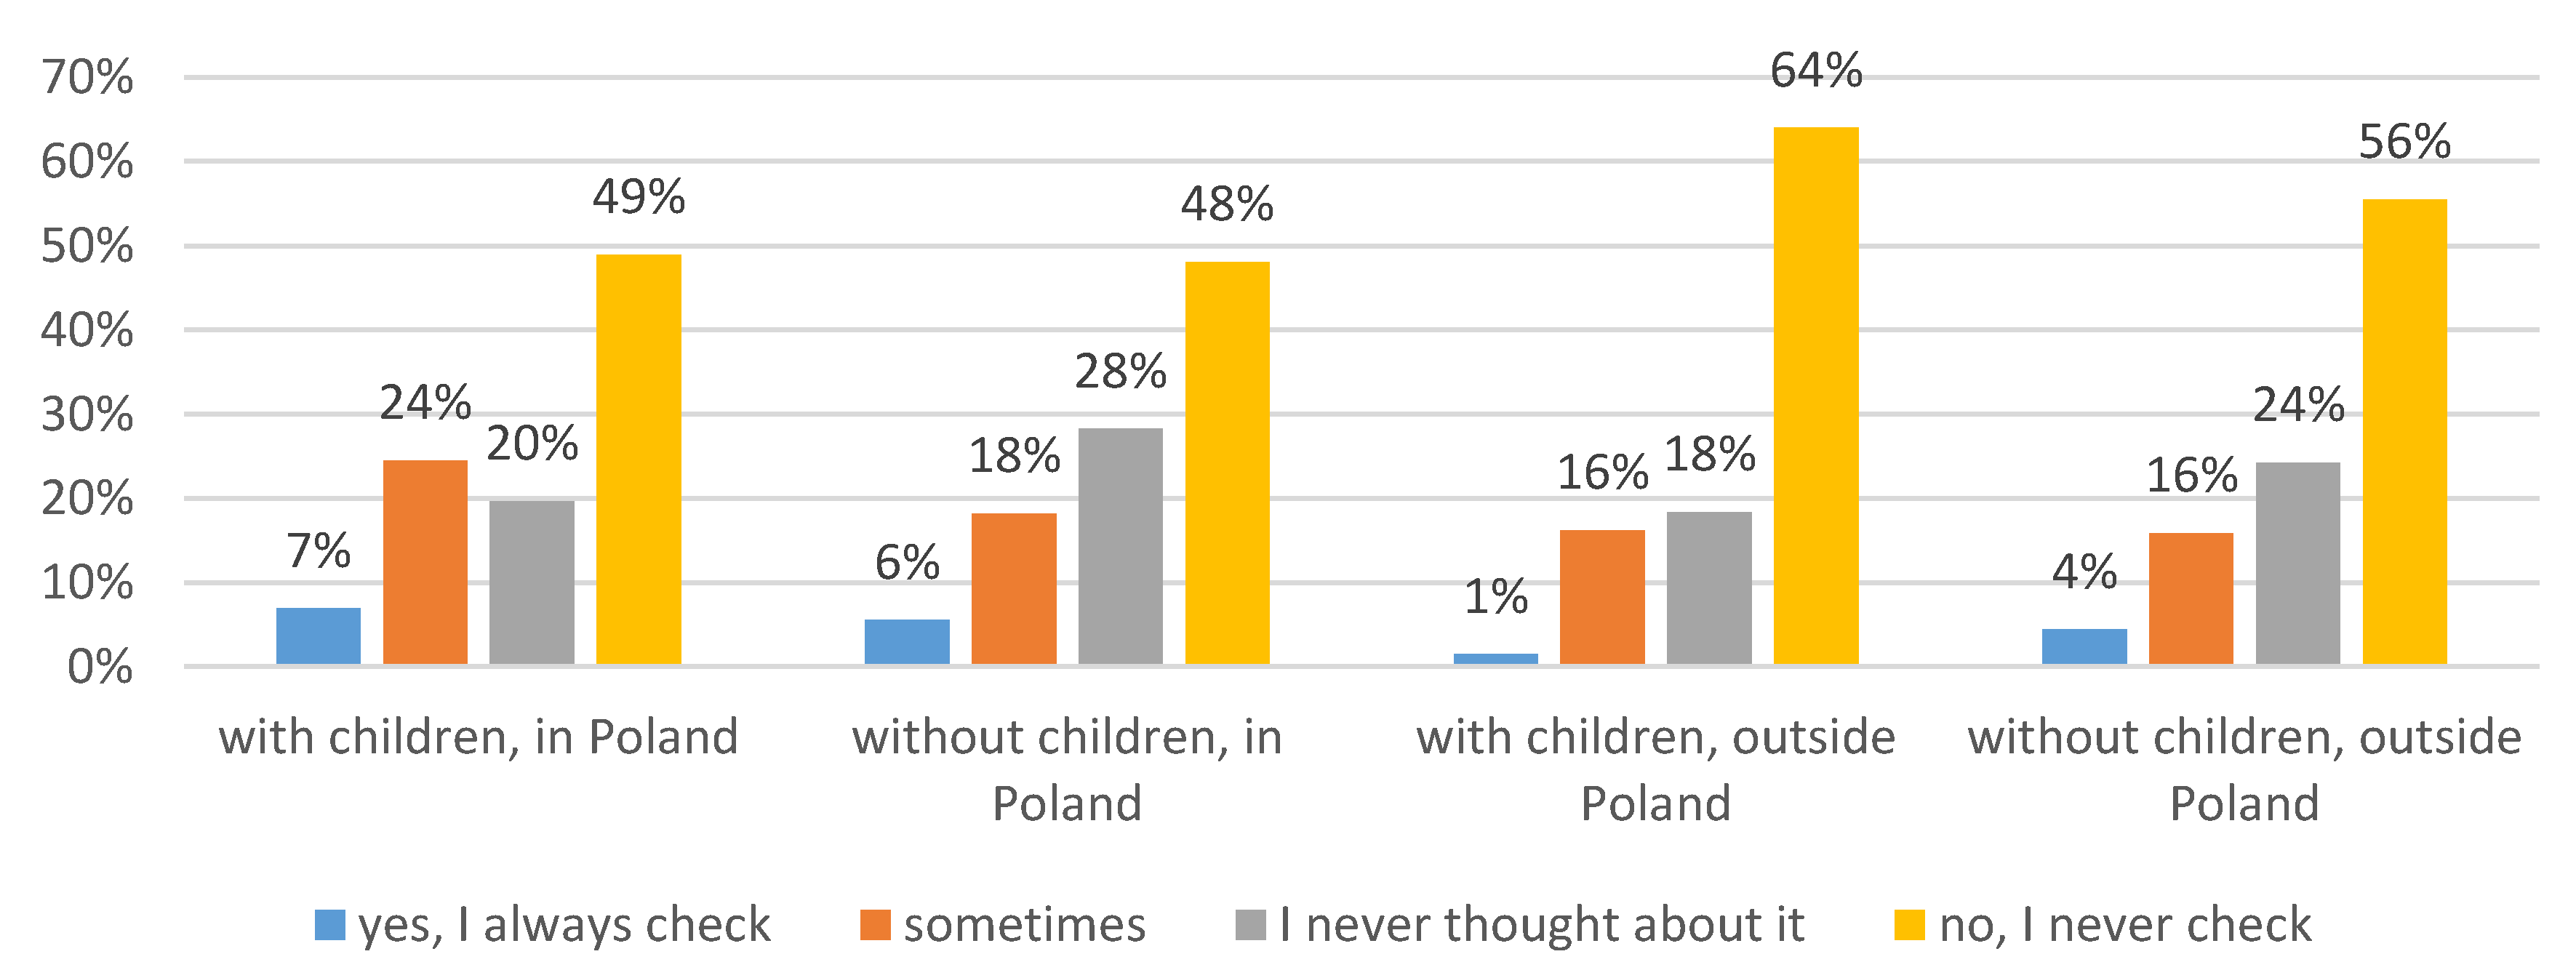
- travel with children (domestic and foreign),
- -
- the motive for the journey (including private or business, domestic or foreign).
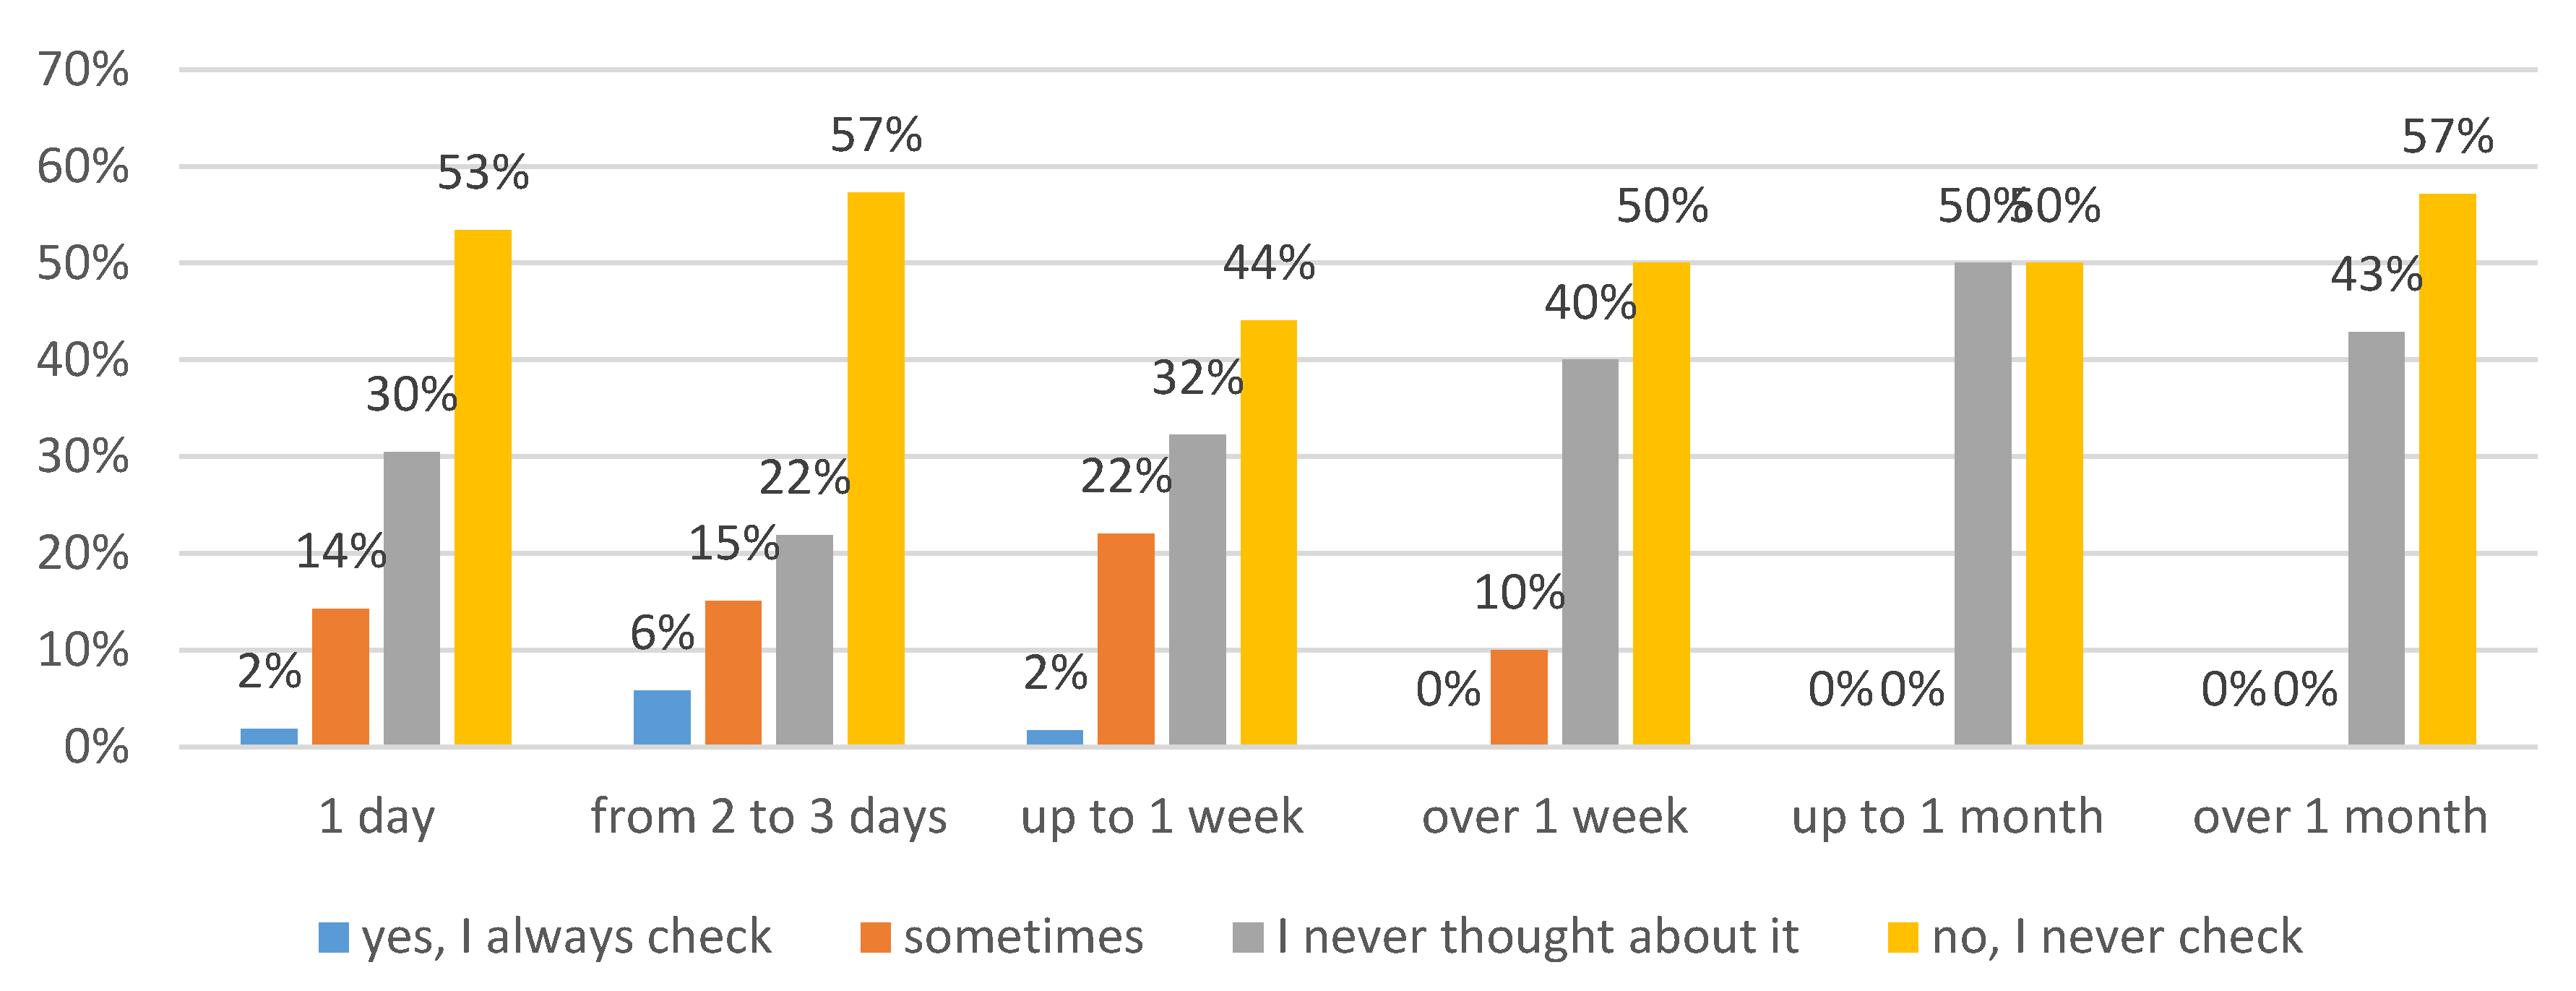
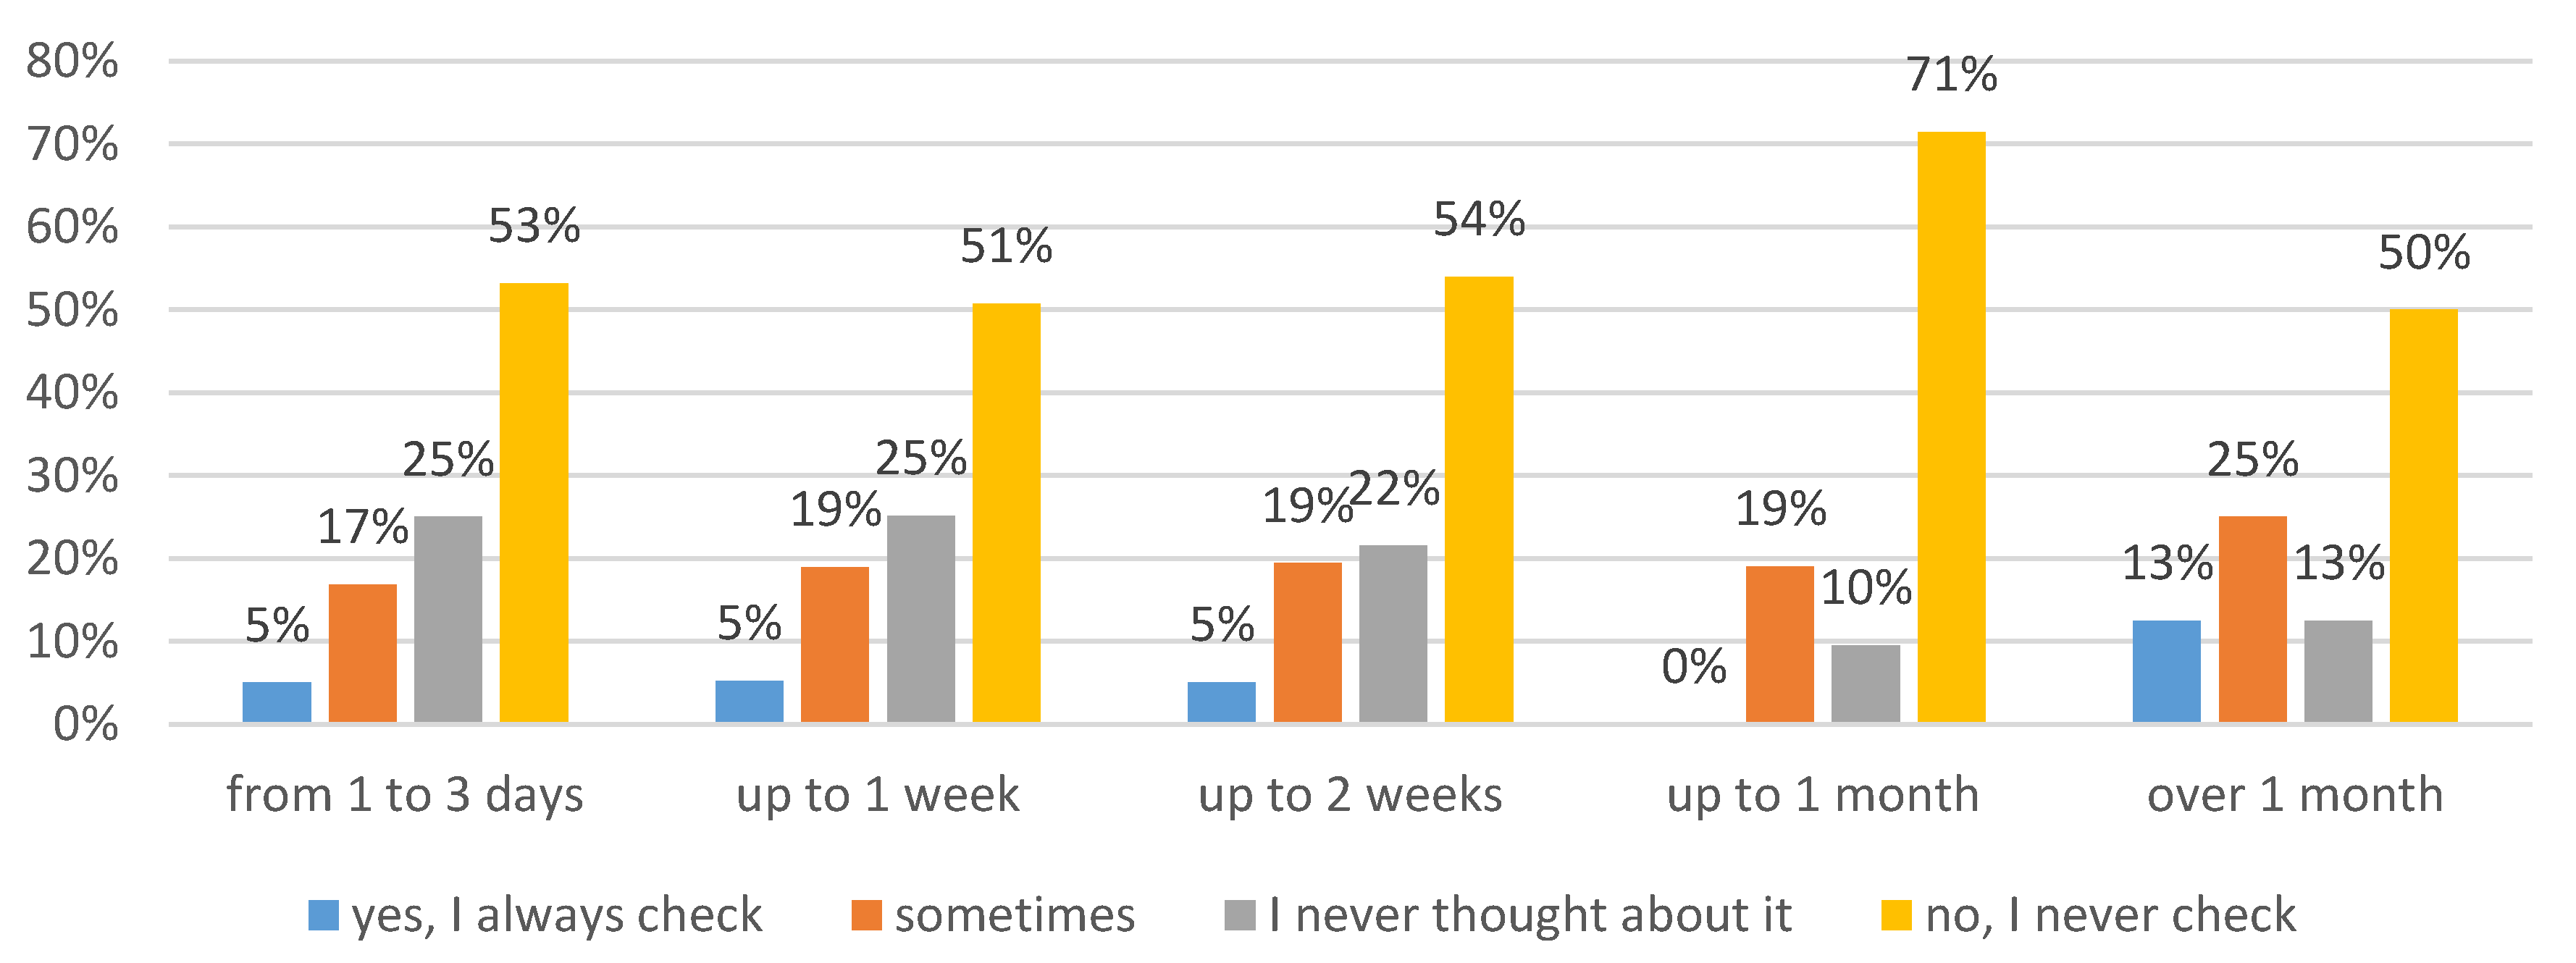
- Yes, I always check,
- I check sometimes,
- I never thought about it,
- No, I never check.
- I check sometimes,
- I never thought about it,
- -
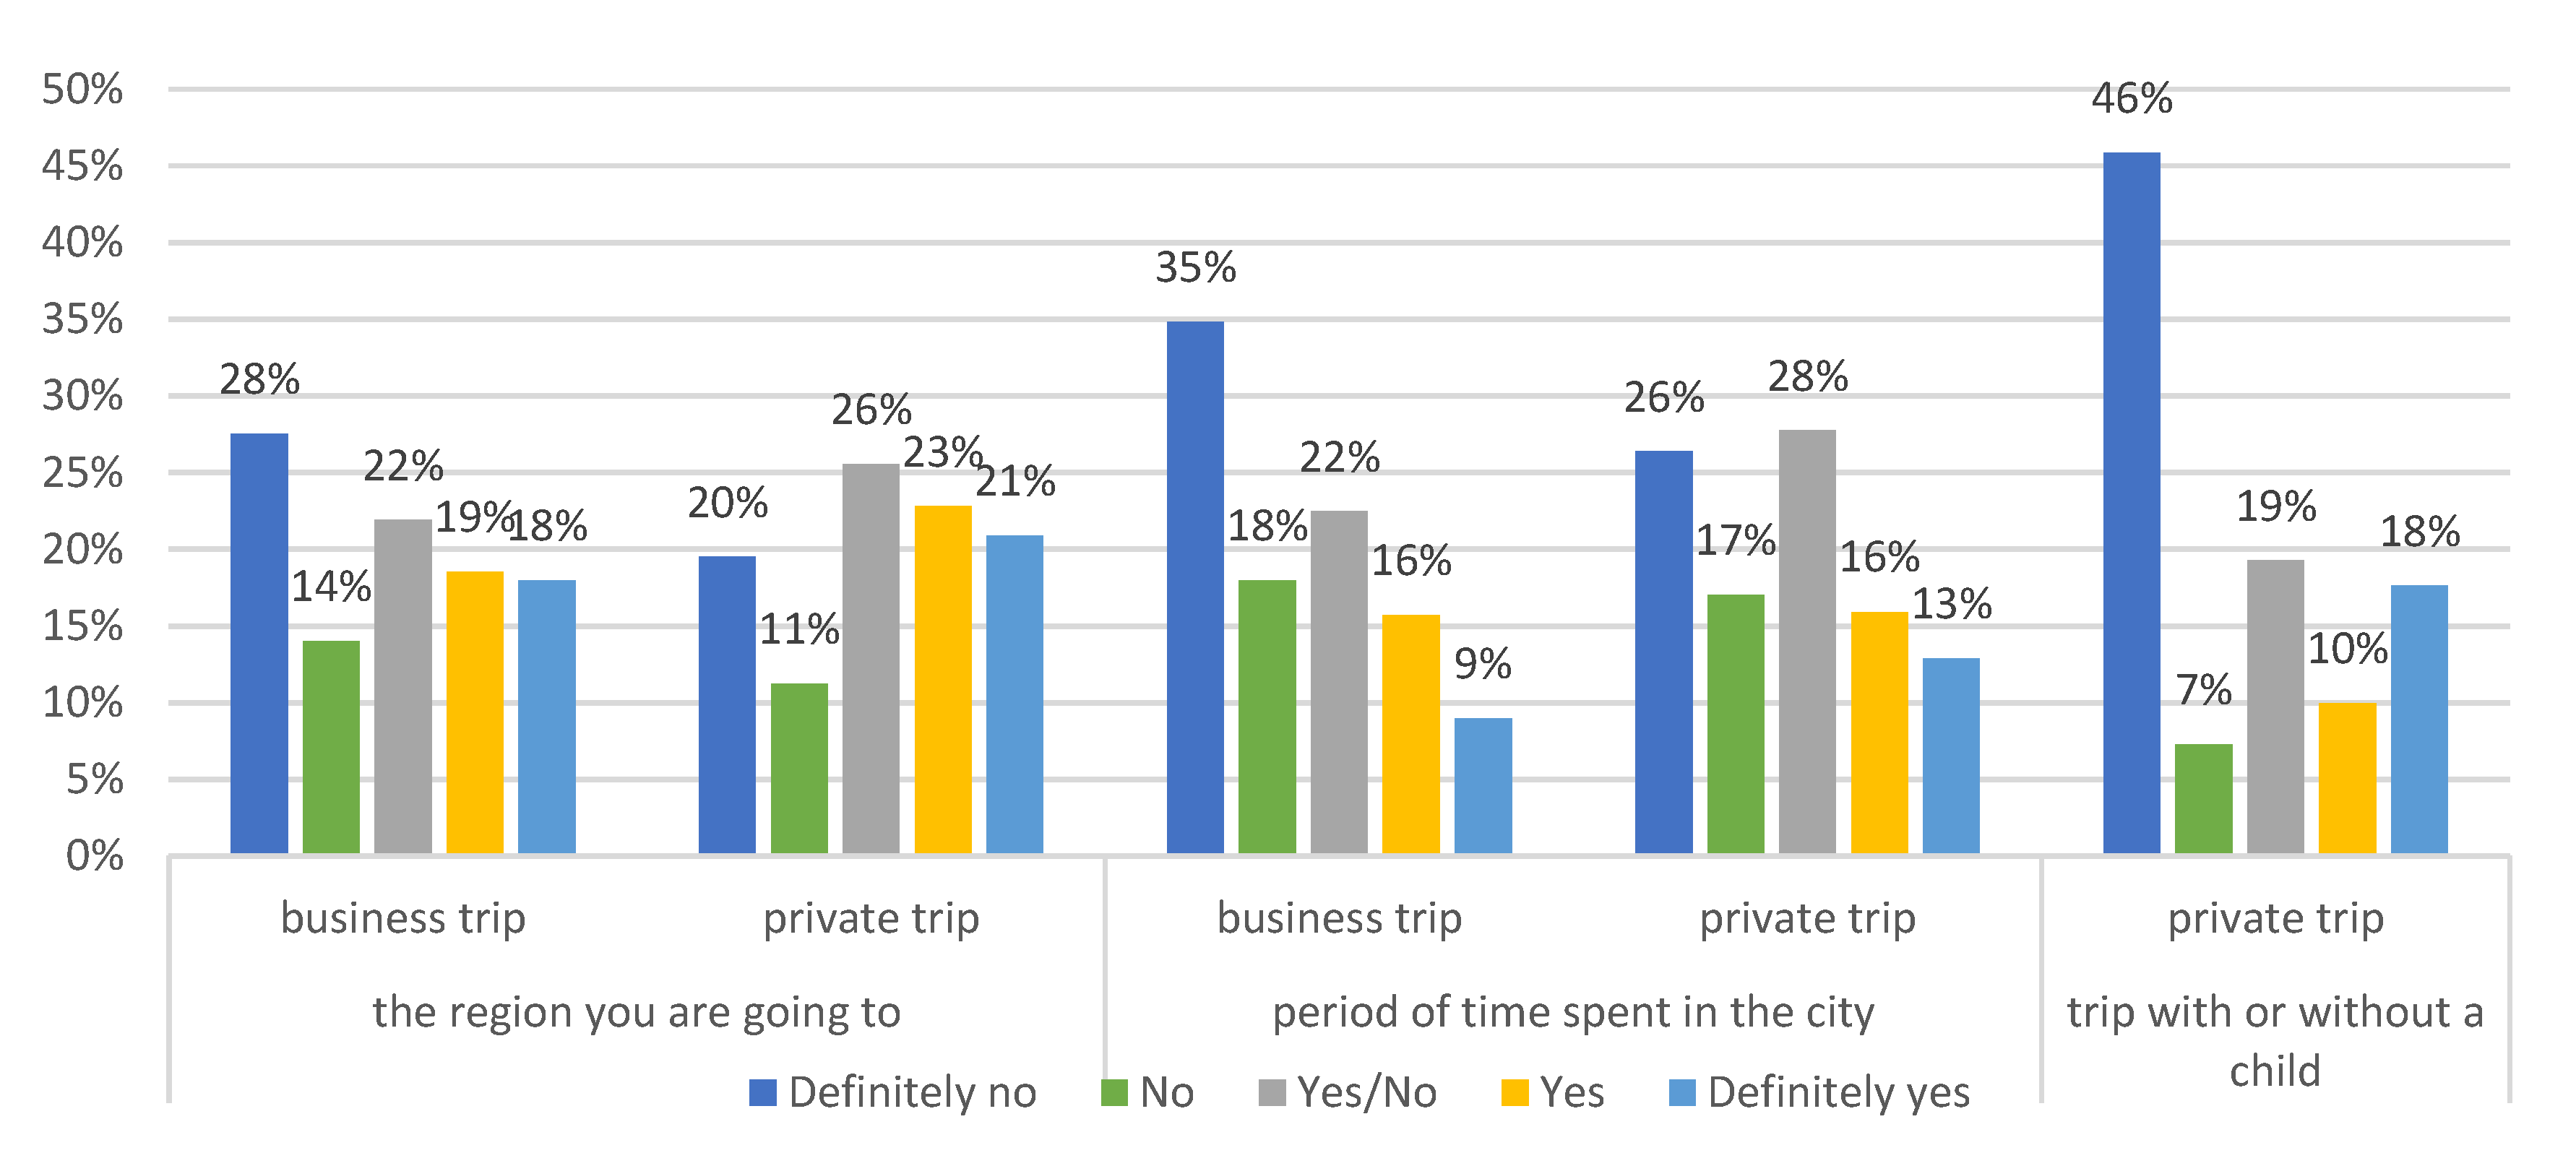
- Region of the destination,
- -
- time spent in the city,
- -
- children’s participation in the trip,
5. Conclusions and Recommendations Concerning the Management of a City’s Tourist Attractiveness
Author Contributions
Funding
Conflicts of Interest
References
- Bramwell, B. User satisfaction and product development in urban tourism. Tour. Manag. 1998, 19, 35–47. [Google Scholar] [CrossRef]
- Postma, A.; Buda, D.M.; Gugerell, K. The future of city tourism. J. Tour. Futures 2017, 3, 95–101. [Google Scholar] [CrossRef] [Green Version]
- Ashworth, G.; Page, S.J. Urban tourism research: Recent progress and current paradoxes. Tour. Manag. 2011, 32, 1–15. [Google Scholar] [CrossRef]
- Maitland, R.; Brent Ritchie, W. City Tourism: National Capitals Perspectives; CABI: Cambidge, UK, 2010. [Google Scholar]
- Karski, A. Urban Tourism: A Key to Urban Regeneration? Planner 1990, 76, 15–17. [Google Scholar]
- Bednarczyk, M. (Ed.) Przedsiębiorczość w Turystyce; CeDeWu: Warszawa, Poland, 2010. [Google Scholar]
- Douglas, N.; Derrett, R. Special Interest Tourism; John Wiley and Sons Australia, Ltd.: Milton, ON, Canada, 2001. [Google Scholar]
- Ladkin, A. Exploring tourism labor. Ann. Tour. Res. 2011, 38, 1135–1155. [Google Scholar] [CrossRef]
- Kim, K.; Uysal, M.; Sirgy, M.J. How does Tourism in a Community Impact the Quality of Life of Community Residents? Tour. Manag. 2013, 36, 527–540. [Google Scholar] [CrossRef]
- Andereck, K.; Jurowski, C. Tourism and Quality of Life. In Quality Tourism Experiences; Jennings, G., Nickerson, N.P., Eds.; Butterworth Heinemann: London, UK, 2006. [Google Scholar]
- Law, C.M. Urban Tourism: The Visitor Economy and the Growth of Large Cities; Cengage Learning Emea: London, UK, 2002. [Google Scholar]
- Edwards, D.; Griffin, T.; Hayllar, B. Urban tourism research: Developing an agenda. Ann. Tour. Res. 2008, 35, 1032–1052. [Google Scholar] [CrossRef]
- Gospodini, A. Urban design, urban space morphology, urban tourism: An emerging new paradigm concerning their relationship. Eur. Plan. Stud. 2001, 9, 925–934. [Google Scholar] [CrossRef]
- Pawlicz, A. Promocja Produktu Turystycznego: Turystyka Miejska; Difin SA Publishing House: Warszawa, Poland, 2008. [Google Scholar]
- Koppen, Y. The Potential of Cross-Marketing for the Destination Management Organizations of New York City and New York State; GRIN Verlag: Bonn, Germany, 2009. [Google Scholar]
- Hall, C.M. Tourism in capital cities. Tourism 2002, 50, 235–248. [Google Scholar]
- Panasiuk, A. Tourism Infrastructure as a Determinant of Regional Development. Ekonomika ir Vydba: Aktualijos ir Perspektyvos 2007, 1, 212–215. [Google Scholar]
- Rani, H.A. Determination of Tourism Infrastructure Development Priority in Weh Island–Aceh using Location Quotient. Int. J. Emerg. Technol. Adv. Eng. 2017, 7. [Google Scholar]
- Paunović, I. Branding Serbia as a tourist destination on the global market. Turizam 2014, 18, 59–71. [Google Scholar] [CrossRef]
- Page, S. Transport and Tourism: Global Perspectives; Pearson, Prentice Hall, Harlow: London, UK, 2005. [Google Scholar]
- Bieger, T.; Wittmer, A. Air transport and tourism–Perspectives and Challenges for Destinations, Airlines and Governments. J. Air Transp. Manag. 2006, 12, 40–46. [Google Scholar] [CrossRef]
- Łapko, A.; Panasiuk, A. Water Tourism as a Recipient of Transport Services on the Example Szczecin. Transp. Res. Procedia 2019, 39, 290–299. [Google Scholar] [CrossRef]
- Cooper, C.; Fletcher, J.; Gilbert, D.; Fyall, A.; Wanhill, S. Tourism: Principles and Practice; Pearson Education: London, UK, 2005. [Google Scholar]
- Weaver, D.; Lawton, L. Tourism Management, 4th ed.; John Wiley & Sons, Ltd.: Milton, ON, Canada, 2010. [Google Scholar]
- Cibinskiene, A.; Snieskiene, G. Evaluation of city tourism competitiveness, 20th International Scientific Conference Economics and Management. Procedia Soc. Behav. Sci. 2015, 213, 105–110. [Google Scholar] [CrossRef] [Green Version]
- Garbea, R.V. Tourist Attractiveness of the Urban Environment in Moldavia. Manag. Mark. 2014, 1, 84–90. [Google Scholar]
- Gołembski, G. (Ed.) Regionalne Aspekty Rozwoju Turystyki; PWN: Warszawa, Poland, 1999. [Google Scholar]
- Panasiuk, A. Rynek turystyczny. Struktura. Procesy. Tendencje; Difin: Warszawa, Poland, 2019. [Google Scholar]
- Panasiuk, A. Jakość produktu turystycznego jako instrument kształtowania konkurencyjności miast. In Konkurencyjność Miast I Regionów Na Globalnym Rynku Turystycznym; Sala, J., Ed.; PWE: Warszawa, Poland, 2010; pp. 218–236. [Google Scholar]
- Crouch, G.I.; Ritchie, J.R. Tourism, competitiveness, and societal prosperity. J. Bus. Res. 1999, 44, 137–152. [Google Scholar] [CrossRef]
- Hu, Y.; Brent Ritchie, J.R.B. Measuring Destination Attractiveness: A Contextual Approach. J. Travel Res. 1993, 32, 25–34. [Google Scholar]
- Cracolici, M.F.; Nijkamp, P. The Attractiveness and Competitiveness of Tourist Destination: A study of Southern Italian Regions. Tour. Manag. 2008, 30, 336–344. [Google Scholar] [CrossRef]
- Wodejko, S. Ekonomiczne Zagadnienia Turystyki; Wyższa Szkoła Handlu i Prawa: Warszawa, Poland, 1998. [Google Scholar]
- Milewski, D. Regionalne uwarunkowania rozwoju turystyki na przykładzie województwa zachodniopomorskiego; Wydawnictwo Naukowe Uniwersytetu Szczecińskiego: Szczecin, Poland, 2005; p. 132. [Google Scholar]
- Decrop, A. Tourists’ decision-making and behavior processes. In Consumer Behavior in Travel and Tourism; Pizam, A., Mansfeld, Y., Eds.; The Haworth Hospitality Press: New York, NY, USA; London, UK; Oxford, UK, 1999. [Google Scholar]
- Shianetz, K.; Kavanagh, L. Sustainability Indicators for Tourism Destination; A Complex Adaptive Systems Approach Using Systemic Indicator Systems. J. Sustain. Tour. 2008, 16, 601–628. [Google Scholar] [CrossRef]
- Paunovic, I. Serbian City Tourism: Benchmarking Indicators of Sustainable Tourism for Competitive and Sustainable Development. Известия Волгоградского Государственного Технического Университета 2016, 1, 56–64. [Google Scholar]
- Panasiuk, A. (Ed.) Ekonomika Turystyki i Rekreacji; Wydawnictwo Naukowe PWN: Warszawa, Poland, 2011; pp. 132–244. [Google Scholar]
- Anaman, K.A.; Looi, C.N. Economic Impact of Haze-Related Air Pollution on the Tourism Industry in Brunei Darussalam. Econ. Anal. Policy 2000, 30, 133–144. [Google Scholar] [CrossRef]
- Avgoustis, S.H.; Achana, F. A pratical approach to city tourism sustainability. In Proceedings of the 2002 Northestern Recreation Reserch Symposium; U.S. Department of Agriculture, Forest Service, Northeastern Research Station: Upper Darby, PA, USA, 2003. [Google Scholar]
- Echtner, C.M.; Ritchie, J.B. The meaning and measurement of destination image. J. Tour. Stud. 2002, 2, 2–12. [Google Scholar]
- Nawrocka, E. Wizerunek obszaru recepcji turystycznej. Ekon. Probl. Tur. 2008, 11, 127–140. [Google Scholar]
- Cooper, C.; Fletcher, J.; Gilbert, D.; Wanhill, S. Tourism. Principles & Practice; Pitman Publishing: London, UK, 1993. [Google Scholar]
- Muhoho-Minni, P.; Lubbe, B.A. The role of the media in constructing a destination image: The Kenya experience. Communication 2017, 43, 58–79. [Google Scholar] [CrossRef]
- Wójcik, K. Public Relations od A do Z; Agencja Wydawnicza Placet: Warszawa, Poland, 2001. [Google Scholar]
- Richards, G.; Wilson, J. The Impact of Cultural Events on City Image: Rotterdam, Cultural Capital of Europe 2001. Urban Stud. 2004, 41, 1931–1951. [Google Scholar] [CrossRef]
- Manczak, I. Wizerunek miasta turystycznego raz jego wymiar marketingowy. Studia Ekon. Reg. 2012, 5, 105–112. [Google Scholar]
- Kesić, T.; Pawlić, I. Tourism destination image formation. Case Dubrov. Croat. Tržište Univ. Zagreb Fac. Econ. Bus. 2001, 23, 7–25. [Google Scholar]
- Orfin, K.; Sidorkiewicz, M. Rola wizerunku krajowego produktu turystycznego w kreowaniu ruchu turystycznego. Studium przypadku na przykładzie Polski i Łotwy. Ekon. Probl. Tour. 2016, 3, 301–311. [Google Scholar]
- Arbulú, I.; Lozano, J.; Rey-Maquieira, J. Tourism and solid waste generation in Europe: A panel data assessment of the Environmental Kuznets Curve. Waste Manag. 2015, 46, 628–636. [Google Scholar] [CrossRef]
- Katircioglu, S.T.; Feridun, M.; Kilinc, C. Estimating tourism-induced energy consumption and CO2 emissions: The case of Cyprus. Renew. Sustain. Energy Rev. 2014, 29, 634–640. [Google Scholar] [CrossRef]
- Dong, D.; Xu, X.; Wong, Y.F. Estimating the Impact of Air Pollution on Inbound Tourism in China: An Analysis Based on Regression Discontinuity Design. Sustainability 2019, 11, 1682. [Google Scholar] [CrossRef] [Green Version]
- Zhang, A.; Zhong, L.; Xu, Y.; Wang, H.; Dang, L. Tourists’ Perception of Haze Pollution and the Potential Impacts on Travel: Reshaping the Features of Tourism Seasonality in Beijing. China. Sustainability 2015, 7, 2397–2414. [Google Scholar] [CrossRef] [Green Version]
- Xu, X.; Reed, M. Perceived pollution and inbound tourism for Shanghai. A panel VAR approach. Curr. Issues Tour. 2019, 22, 601–614. [Google Scholar] [CrossRef]
- Ahmad, F.; Draz, M.U.; Su, L.; Oztruk, I.; Rauf, A. Tourism and Environmental Pollution: Evidence form the One Belt One Road Provinces of Wester China. Sustainability 2018, 10, 3520. [Google Scholar] [CrossRef] [Green Version]
- Ng, T.H.; Lye, C.T.; Lim, Y.S. A decomposition analysis of CO2 emissions: Evidence from Malaysia’s tourism industry. Int. J. Sustain. Dev. World Ecol. 2016, 23, 266–277. [Google Scholar] [CrossRef]
- Hughes, M.; Weaver, D.; Pforr, C. (Eds.) The Practice of Sustainable Tourism: Resolving The Paradox; Routledge: Abingdon, UK, 2015. [Google Scholar]
- Broere, W. Urban underground space: Solving the problems of today’s cities. Tunn. Undergr. Space Technol. 2016, 55, 245–248. [Google Scholar] [CrossRef] [Green Version]
- Luck, G.W.; Davidson, P.; Boxall, D.; Smallbone, L. Relations between urban bird and plant communities and human well-being and connection to nature. Conserv. Biol. 2011, 25, 816–826. [Google Scholar] [CrossRef]
- International Agency for Research on Cancer. Outdoor air pollution. In IARC Monographs on the Evaluation of Carcinogenic Risks to Humans Lyon; International Agency for Research on Cancer WHO: Lion, France, 2016; Volume 109. [Google Scholar]
- Mohamad, N.S.; Deni, S.M.; Ul-Saufie, A.Z. Application of the First Order of Markov Chain Model in Describing the PM10 Occurrences in Shah Alam and Jerantut, Malaysia. Pertanika J. Sci. Technol. 2018, 26. [Google Scholar]
- Ramirez-Leal, R.; Cruz-Campas, M.; Estuardo-Moreno, H. Characterization of PM10 Particles by SEM-EDS. Microsc. Microanal. 2018, 24 (Suppl. 1), 1070. [Google Scholar] [CrossRef] [Green Version]
- Union, P. Directive 2008/50/EC of the European Parliament and of the Council of 21 May 2008 on ambient air quality and cleaner air for Europe. Off. J. Eur. Union 2008, 11, 152. [Google Scholar]
- SOER. EEA The European Environment–State and Outlook 2015. Synthesis Report. Copenhagen: European Environment Agency. Eur. Environ. Agency Cph. 2015. Available online: https://www.eea.europa.eu/soer#tab-synthesis-report (accessed on 26 July 2019).
- Signals, E.E.A. Towards clean and Smart mobility. Transport and environment in Europe. Eur. Environ. Agency 2015. [Google Scholar]
- Nitrogen Oxide (NOx) Pollution. Available online: http://www.icopal-noxite.co.uk/nox-problem/nox-pollution.aspx (accessed on 26 July 2019).
- Lin, C.A.; Chen, Y.C.; Liu, C.Y.; Chen, W.T.; Seinfeld, J.H.; Chou CC, K. Satellite-Derived Correlation of SO22019, NO2, and Aerosol Optical Depth with Meteorological Conditions over East Asia from 2005 to 2015. Remote Sens. 2016, 11, 1738. [Google Scholar] [CrossRef] [Green Version]
- Edwards, P.M.; Evans, M.J. A new diagnostic for tropospheric ozone production. Atmos. Chem. Phys. 2017, 17, 13669–13680. [Google Scholar] [CrossRef] [Green Version]
- Ozon-dobry i zły, Główny Inspektorat Ochrony Środowiska. Available online: http://www.gios.gov.pl/pl/aktualnosci/344-ozon-dobry-i-zly (accessed on 15 July 2019).
- Tropospheric ozone. Climate & Clean Air Coalition to Reduce Short-Lived Climate Polltants. Available online: https://www.ccacoalition.org/ru/slcps/tropospheric-ozone (accessed on 20 July 2019).
- World Health Organization. Ambient air Pollution: A Global Assessment of Exposure and Burden of Disease; World Health Organization: Geneva, Switzerland, 2016. [Google Scholar]
- Exceedance of air quality standards in urban areas. Eur. Environ. Agency. 2018. Available online: https://www.www.eea.europa.eu (accessed on 20 July 2019).
- European Environment Agency. Europe’s Urban Air Quality–Re-Assesing Implementation Challenges in Cities; EEA Report No 24/2018; European Environment Agency: Københavnk, Denmark, 2018. Available online: https://www. www.eea.europa.eu (accessed on 2 July 2019).
- Ocena Jakości Powietrza-Informacje Ogólne, Główny Inspektorat Ochrony Środowiska. Available online: https://powietrze.gios.gov.pl/pjp/content/measuring_air_assessment_rating_info# (accessed on 2 July 2019).
- Informacje o normach jakości powietrza pod kątem poziomów alertowych, Główny Inspektorat Ochrony Środowiska. Available online: https://powietrze.gios.gov.pl/pjp/content/annual_assessment_air_exposure_alarms_level_info (accessed on 9 July 2019).
- Air Pollution Emergency Schemes (Smog Alerts) in Europe, Budapest, March 2017. Available online: https://www.levego.hu/sites/default/files/smog_emergency_schemes_in_europe_201703.pdf (accessed on 8 June 2019).
- Poziomy Informowania i Alarmowe. Polski Alarm Smogowy. Available online: https://www.polskialarmsmogowy.pl/polski-alarm-smogowy/smog/szczegoly,poziomy-informowania-i-alarmowe,19.html (accessed on 7 July 2019).


| Type of Pollution | % Excess of EU Limit Value | % Excess of WHO Value |
|---|---|---|
| PM10 | 13–16 | 42–52 |
| PM2.5 | 6–8 | 74–85 |
| O3 | 7–10 | 95–98 |
| NO2 | 7–8 | 7–8 |
| No. | Country Name | Information Thresholds | Alert Thresholds |
|---|---|---|---|
| 1 | AUSTRIA | 50 µg/m3 | 75 µg/m3 |
| 2 | BELGIUM | 50 µg/m3 | 70 µg/m3 |
| 3 | CZECH REPUBLIC | no data available | 100 µg/m3 |
| 4 | FINLAND | 50 µg/m3 | 50 µg/m3 |
| 5 | FRANCE | 50 µg/m3 | 80 µg/m3 |
| 6 | GERMANY (Stuttgart) | no data available | 50 µg/m3 |
| 7 | GREAT BRITAIN | 76 µg/m3 | 101 µg/m3 |
| 8 | HUNGARY | 75 µg/m3 | 100 µg/m3 |
| 9 | ITALY (Lombardy) | 50 µg/m3 | 75 µg/m3 |
| 10 | MACEDONIA | 50 µg/m3 | 100 µg/m3 |
| 11 | POLAND * | 100 µg/m3 | 150 µg/m3 |
| 12 | SLOVAKIA | 100 µg/m3 | 150 µg/m3 |
| 13 | SPAIN (Catalonia) | 50 µg/m3 | 80 µg/m3 |
| 14 | SWITZERLAND | 75 µg/m3 | 100 µg/m3 |
| Type of Travel | Type of Response | Data Size (N) | Degrees of Freedom (Df) | Test Statistic (H) | Significance Level |
|---|---|---|---|---|---|
| Business travel in Poland and abroad | Six travel periods and four responses to air pollution checks | 445 | 15 | 15.398 | >0.05 |
| Private travel in Poland and abroad | Five travel periods and four responses to air pollution checks | 908 | 12 | 7.634 | >0.05 |
| Type of Travel | Type of Response | Data Size (N) | Degrees of Freedom (Df) | Test Statistic (H) | Significance Level |
|---|---|---|---|---|---|
| Travel in Poland and abroad with and without children | Four types of travel and four responses to air pollution checks | 859 | 9 | 21.023 | ≤0.05 |
| Type of Travel | Type of Response | Data Size (N) | Degrees of Freedom (Df) | Test Statistic (H) | Significance Level |
|---|---|---|---|---|---|
| Business or private travel in Poland and abroad | Four types of travel and four responses to air pollution checks | 1279 | 9 | 17.3895 | ≤0.05 |
© 2020 by the authors. Licensee MDPI, Basel, Switzerland. This article is an open access article distributed under the terms and conditions of the Creative Commons Attribution (CC BY) license (http://creativecommons.org/licenses/by/4.0/).
Share and Cite
Łapko, A.; Panasiuk, A.; Strulak-Wójcikiewicz, R.; Landowski, M. The State of Air Pollution as a Factor Determining the Assessment of a City’s Tourist Attractiveness—Based on the Opinions of Polish Respondents. Sustainability 2020, 12, 1466. https://0-doi-org.brum.beds.ac.uk/10.3390/su12041466
Łapko A, Panasiuk A, Strulak-Wójcikiewicz R, Landowski M. The State of Air Pollution as a Factor Determining the Assessment of a City’s Tourist Attractiveness—Based on the Opinions of Polish Respondents. Sustainability. 2020; 12(4):1466. https://0-doi-org.brum.beds.ac.uk/10.3390/su12041466
Chicago/Turabian StyleŁapko, Aleksandra, Aleksander Panasiuk, Roma Strulak-Wójcikiewicz, and Marek Landowski. 2020. "The State of Air Pollution as a Factor Determining the Assessment of a City’s Tourist Attractiveness—Based on the Opinions of Polish Respondents" Sustainability 12, no. 4: 1466. https://0-doi-org.brum.beds.ac.uk/10.3390/su12041466