Article

Multi-Criteria Evaluation of Railway Network Performance in Countries of the TEN-T Orient–East Med Corridor

1
Faculty of Transport, Technical University of Sofia, 8 Kl. Ohridski Blvd., 1000 Sofia, Bulgaria
2
Institute for the Management and Innovation of Knowledge (INGENIO), Polytechnic University of Valencia, Camí de Vera, s/n, 46022 València, Spain
3
Department of Railway Transport, University of Žilina, Univerzitná 1, 01026 Žilina, Slovakia
4
Department of Road and Urban Transport, University of Žilina, Univerzitná 1, 01026 Žilina, Slovakia
*
Author to whom correspondence should be addressed.
Sustainability 2020, 12(4), 1482; https://0-doi-org.brum.beds.ac.uk/10.3390/su12041482
Submission received: 28 January 2020 / Revised: 12 February 2020 / Accepted: 14 February 2020 / Published: 17 February 2020
(This article belongs to the Special Issue Multiple Criteria Decision Making for Sustainable Development)

Abstract

:
Railway networks have different levels of development, which affects the overall transport process and integrated sustainable development. This paper presents a methodology to assess and classify the railway network performance along the Trans-European Transport Network (TEN-T) core network corridor. The Orient–East Med corridor (OEM) has been examined. Twenty-two infrastructural, economic and technological criteria for assessment of railway transport have been proposed. The countries were ranked used multi-criteria decision making (MCDM), by applying the Sequential Interactive Modelling for Urban Systems (SIMUS). A sensitivity analysis was performed regarding each objective, and then, their allowable range of variation was determined without modifying the whole ranking of countries. The criteria weights have been determined on the basis of the output of using the SIMUS method. It was found that the main criteria for ranking the countries are: length of the connecting railway lines of the corridor in the country, length of the railway lines in the country, number of intermodal terminals, gross domestic product (GDP) per capita, passengers transport performance, freight transport performance for the railway network, corridor freight usage intensity. It was found that the railway transport in the area of the OEM corridor located in Central Europe is better developed than in the Southeast European area. A cluster analysis was performed to classify countries into groups to verify the results. The results show that the eight countries included in the OEM corridor can be classified into three groups. The methodology could be used to make decisions about transport planning and improvement of the connectivity and sustainability of the railway transport, considering their development.

1. Introduction

1.1. Background Information

The transport corridor connects different geographical European regions, which is essential for the mobility of people and goods, as well as for the development of connectivity and accessibility infrastructure. The favorable geographical location, combined with efficient infrastructures and transport services, is of key importance for the development of the transport corridors. The Trans-European Transport Network (TEN-T) core corridors are a powerful instrument of communication, cooperation, and coordination between different regions in Europe and focus on the most important connections and hubs. The TEN-T network includes all modes of transport (roads, railway lines, inland waterways, maritime shipping routes, ports, airports, and rail-road terminals) and aims at developing connections in the whole of Europe; it is of great importance for the competitiveness of national transport systems of member states. The transport corridor can play various functions such as: ensure mobility of persons and goods; make optimal use of existing infrastructure; facilitate the prioritization of investments in infrastructure, policy reform, and services; increase connections between different regions, improve the quality of service; influence transport planning and development in countries served.
The TEN-T network includes: 75,200 km of roads, 78,000 km of railway lines, 330 airports, 270 seaports, 210 inland ports [1]. TEN-T comprises two networks: the Core Network includes the most important connections, linking the most important nodes, and is to be completed by 2030; the Comprehensive Network covers all European regions and is to be completed by 2050 [2].
The economic-geographical situation of the transport corridors includes transport, commercial and tourist elements and could be improved. The objective of TEN-T network is improved use of infrastructure, reduced environmental impact of transport, enhanced energy efficiency, and increased safety.
The benefits of the TEN-T corridors have been analyzed by conducting an interview with 23 public authorities, infrastructure organizations/companies, private companies, and other organizations in the Baltic Sea region [3]. Determined as benefits are economic development, EU funding, visualization of goods flows, transport capacity, transport quality, environmentally friendly transport, competitive rail transport, connections to cities, and cross-border infrastructure planning. It was found that the increment of transport capacity and quality are the benefits from the corridor’s development; the harmonization of extensive transnational transport corridors is an opportunity for competitive rail transport.
The transport corridors were studied in [4] according to the economic development in the corridor region and connectivity of transport networks. The transport demand problem at the trans-European level for road, inland waterways, and rail with respect to a change of total cost of transport, transit time, and speed were studied in [5]. This is important for transport policy decisions. The model based on Box–Cox approach was elaborated on. The strategic management method STEEPLE analysis based on seven groups of factors (social, technological, economic, ecological, political, legal, and ethical) is applied in [6] to study the future development of transport corridors between Europe and Asia.
Four European neighborhood countries, Slovakia, Hungary, the Czech Republic, and Poland, named the Visegrad group were studied in [7] with the purpose of defining the importance of TEN-T corridors in the development of infrastructure connections. Five TEN-T corridors (Orient/East–Med, Baltic–Adriatic, Rhine–Danube, North Sea–Baltic and Mediterranean) pass through these countries. The following indices were used to compare the transport development: total area, population, GDP, GDP per capita, length of waterways, length of roadways, length of railways, and number of TEN-T corridors passing through country. It was found that the most developed corridor is the Baltic–Adriatic one.
The freight corridor performance for the North Sea Region comprising road, rail and maritime networks was evaluated in terms of 24 Key Performance Indicators [8]. For this purpose, the corridor was separated into a standard set of transport chains, which are assessed by defined indicators. The indicators were summarized into a more concise set, as follows: transport price (€/ton-km), transport time or speed, reliability, frequency of service, CO2 equivalent emissions (g/ton-km), and SOx emissions (g/ton-km).
Railway transport is an ecological type of moving passengers and freight, and has an impact on the development of commerce, tourism and business relations. It is therefore important to study rail transport along the corridors, and to classify the rail networks in order to determine their integrated position taking into account the impact of transport components.
As railway transport is environmentally friendly the European policy aims is to stimulate the modal shift from truck to rail freight transport in inland Trans-European corridors. A European Mega-Corridor which begins in the north in the Netherlands and Belgium and ends in southern Greece and Turkey is studied in [9] with the purpose to analyze the possibility to substitute trucks by rail freight trains. The following factors affecting transport were compared: energy consumption, emissions of greenhouse gases, noise, congestion, and traffic incidents/accidents. It was found that railway transport saves about 30% in total externalities arising.
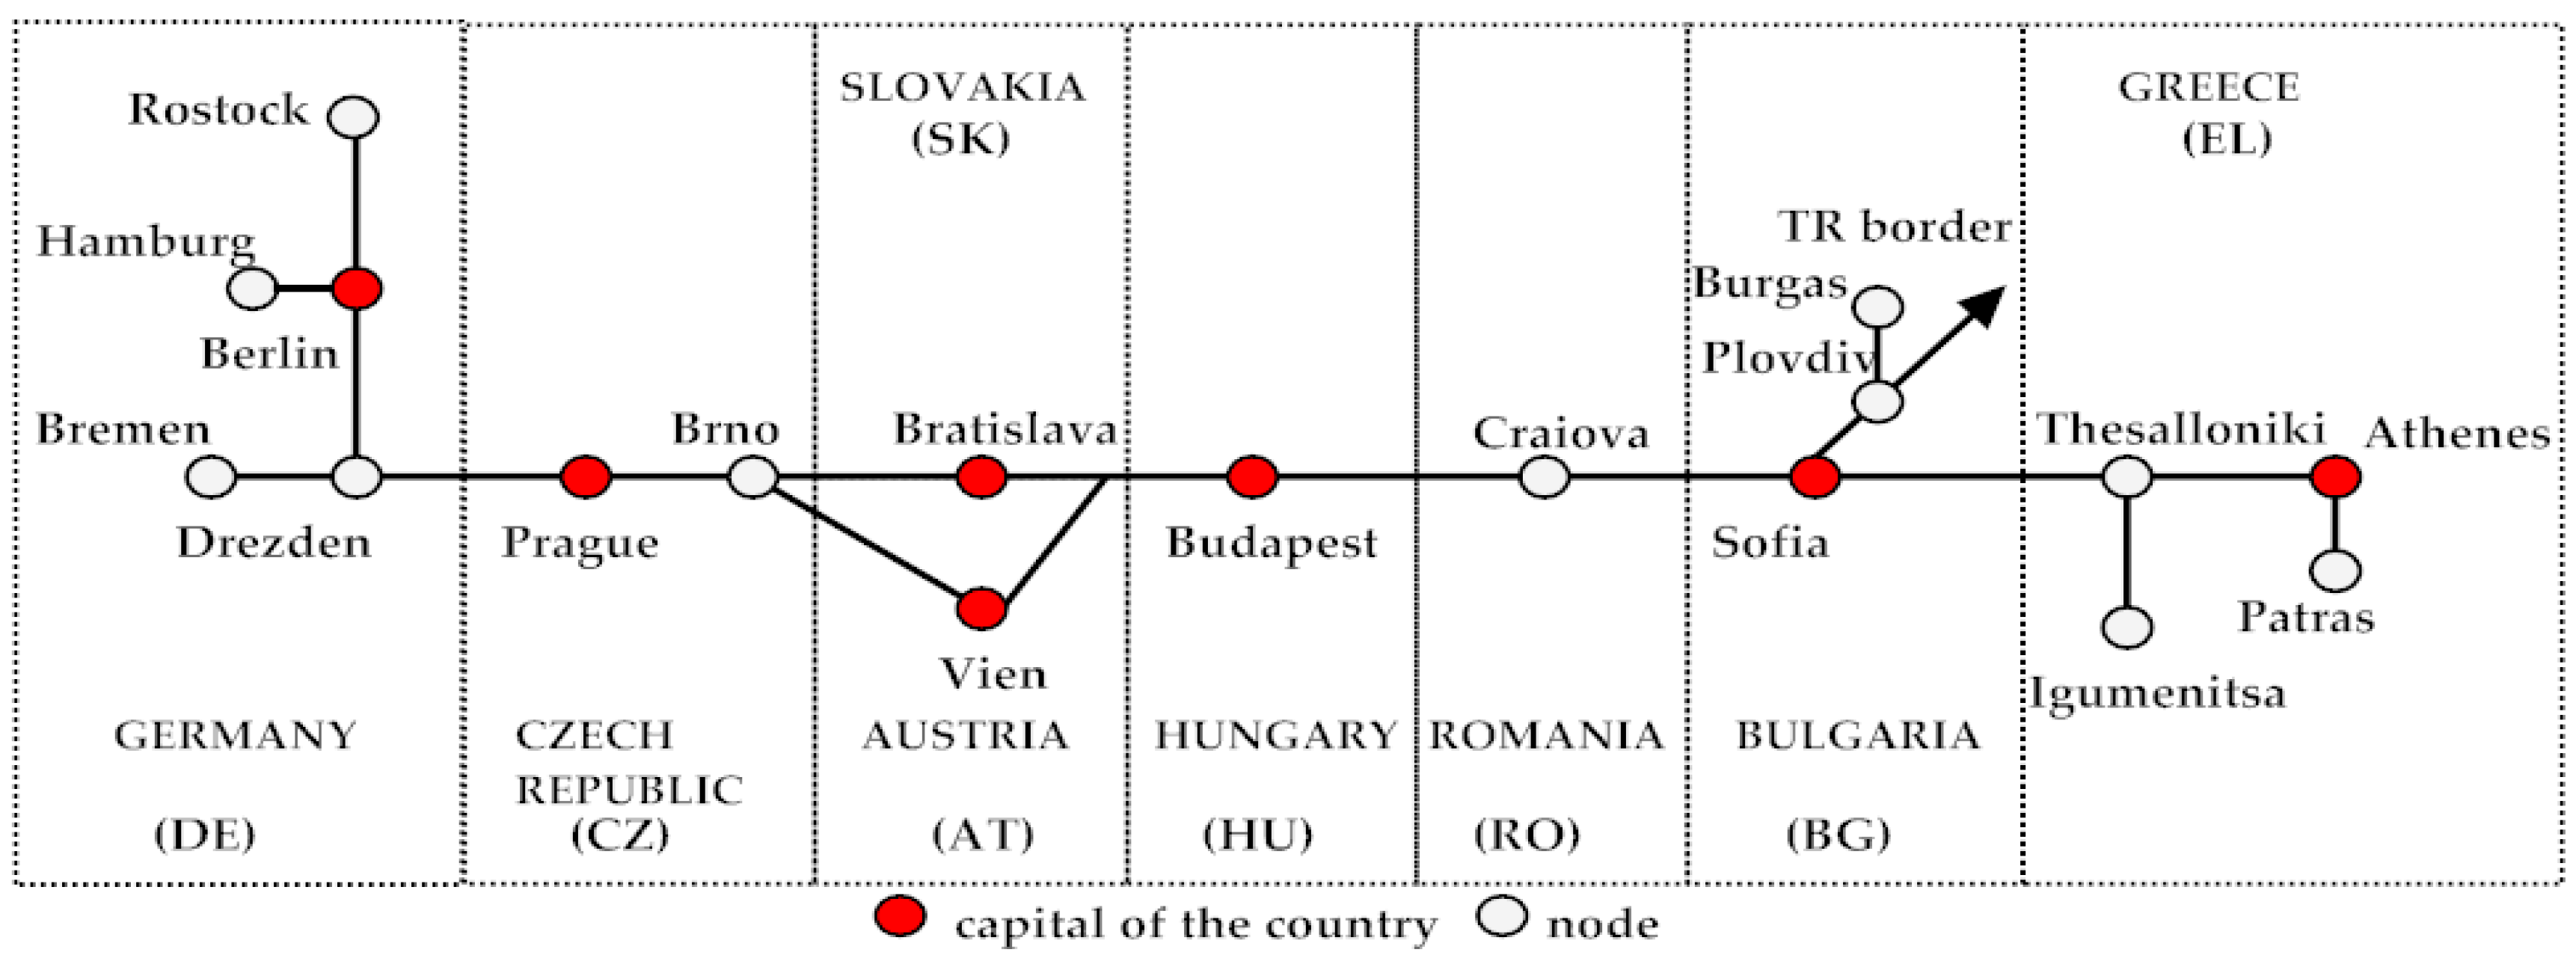
The Orient/East-Med Corridor (OEM) is one of the nine core TEN-T network corridors and in spatial terms connects large parts of Central Europe with the ports of the North, Baltic, Black and Mediterranean Seas. The geographical position of the corridor places it as a path between Europe, Asia and Africa. The OEM corridor includes transport infrastructure of eight countries: Germany, the Czech Republic, the Slovak Republic, Austria, Hungary, Romania, Bulgaria, and Greece.
The Orient/East-Med corridor has been investigated by the International Working Group Spatial and Transport Development in European Corridors [10]. Recommendations for various development aspects have been proposed, such as: enough capacity for freight and passenger transport, increasing speed as required, separation between freight and passenger transport in densely metropolitan regions, stepwise development of passenger transport, elaboration of a strategy for railway development, elaboration of a strategy for integrated development, and strategic planning.
The economic performances of the TEN-T core rail regions and road European networks have been compared with the economic performance of other regions without the core network, by statistical methods [11]. The 157 TEN-T regions and 87 non-TEN-T regions have been investigated according to their gross value. The authors found out that the TEN-T regions produce three times higher gross value, compared to the other regions.
The European rail freight corridors have been studied in terms of the following indicators: growth of rail freight performance; services of infrastructure managers; transport performance; capacity analysis; transit time; cost reduction for railway undertakings; and socio-economic effectiveness of the railway system [12]. The study on OEM corridor examines multimodal transport infrastructure, all types of transport, the project related to the OEM development, the potential for transport innovation, emission reduction, and climate-change related to focus on sustainability and sustainable development [13].
The Scandinavian–Mediterranean transport corridor was examined in detail, using the interview method. Four categories of interviewers were included: public authority, infrastructure companies, private companies, and other organizations. The research was conducted in order to support the sustainable development of the core network corridors.
A review of the TEN-T policy, high-speed train, and freight development in European corridors is made in [14]. The European Union transport policy documents and also the sustainability and sustainable development, regarding the Scandinavian–Mediterranean TEN-T corridor, are studied in [15]. In [16] the nine core corridors of TEN-T network are analyzed to assess growth, jobs, and climate impacts resulting from investments to be made between 2017 and 2030. The travel impact on the core TEN-T network has been studied by applying TRUS, the European multi-modal transport network model. Transport demand has been investigated by using a European integrated assessment model called ASTRA. An extensive data base of projects along the core network corridors has been obtained.
In the study [1], a capacity, traffic, and statistic survey of the OEM corridor has been made. The railway markets in the countries of OEM corridor have been investigated in terms of the following indicators: economy; GDP; technical parameters; transport performance in rail passenger and freight traffic on corridor lines and on all lines of member state; rail carriers; infrastructure indicators such as length of railway lines, intermodal terminals, capacity analysis and technical speed. It was found that the interest from the railway transport grows year by year, as the capacity utilization of the infrastructure increases.
The intermodal transport along the transport corridors in Europe is studied in [15,17,18]. The TEN-T East−West Transport Corridor in terms of the intermodal transport terminals has been investigated in [18] on the basis of literature analysis and questionnaire survey. The problems about the connectivity between railway hub cities in TEN-T network were analyzed in [19]. It identified the need for interconnectivity by an intermodal integration of rail hubs at three different levels: into the TEN-T system and into regional and local transport rail and non-rail systems. The inland ports are also important for the European transport corridors. An analysis of both sectoral and integrative policy for the Netherlands can be seen in [20].
The following criteria that have a most important effect on the operation efficiency of the TEN-T core network have been defined: corridor interaction and information flows (along the corridor), coordination of activities of infrastructure managers, and cooperative activities between intermodal terminals. An empirical analysis of intermodal connections in Europe has been made in [21]. The TEN-T Regulation has been analyzed, and criteria to determine the compliance of the sections of the TEN-T corridors of both core and extended network have been studied.
The Intermodal Freight Transport Market Structure model was elaborated in [22] and allows for an analysis of the market structure of intermodal freight transport submarkets to the network level. A mathematical model to allocate flows to nodes, links, and corridors according to their capacities has been prepared.
The European policy on the Trans-European Network for Transport (TEN-T) over the last 25 years describes and analyzes the role of technicians in the decision-making process [23]. The assessment of infrastructure projects of Trans-European Transport Networks (TEN-T) is made in [24]. The authors developed a methodology to determine the European added value generated by transport infrastructure projects. The Member States located in Central and Eastern Europe have been studied according to the EU funding invested in transport infrastructure [25].
The Hierarchical Cluster Analysis has been applied to investigate transport and logistics in the countries of the Baltic Sea Region [26,27]. The authors have analyzed cargo volume by railway, maritime, and road transport between 2004 and 2011 [27]. Ten criteria, including gross domestic product; export and import volumes; population; investments in road, rail, and port infrastructures; rail infrastructure density; and others have been used.
Freight traffic procedures on the border between Slovakia (TEN-T core network) and Ukraine have been studied in [28] by applying the critical path method.
The following measures are important to increment railway transport in the European market: efficient timetable planning, trains and vehicles with higher capacity, European Railway Traffic Management System (ERTMS) implementation, adaptation of Rail Freight Corridors, and high-speed rail [29].
A four-step methodology is proposed by the authors in [30] to define the geographic boundaries of the trans-shipment submarkets and provide a market analysis. It was found that the majority of corridors in the European Union are inside highly concentrated origin–destination markets. The nine Core Network Corridors of the Trans European Transport Network (TEN-T) have been analyzed regarding their infrastructure, modal integration, interoperability, and connectivity [31].
In [32] the authors have proposed the following indicators to examine the efficiency level of European railway companies: passengers, freight, kilometers of lines, the percentage of electrification, and the percentage of kilometres of double line.
It can be concluded that the previous studies are aimed at fostering sustainable development in the TEN-T network. The methods that have been used are based on statistical analysis [26,27,31,32], economic analysis [12,30,31], interviews [13,18], and networks models [12,22,28].
The previous studies show that the most important factors to investigate the development of rail transport along the corridors are gross domestic product [1,11,27], growth of rail freight performances, services of infrastructure managers, transport performances [1,12], infrastructure companies [12], population [27], rail infrastructures [1,27], rail infrastructure density [27], rail carriers [1], intermodal terminals [1], capacity analysis and technical speed [1], and ERTMS implementation [29].
Multi-criteria decision making (MCDM) is an appropriate method for ranking the alternatives subject to different criteria. This approach includes different ways of ranking and the method chosen depends on the decision maker and the problem. The MCDM approach as an evaluation tool for decision-making related to European Corridors is discussed in [33]. The MCDA method Analytic Network Process (ANP) was used in [34] to investigate infrastructural development strategy for the regions connected through the axis of TEN-T railway corridor Genoa–Rotterdam. Nine subregions are studied taking into account five clusters (namely, economic development, spatial development, rail operation, environment, and logistics).
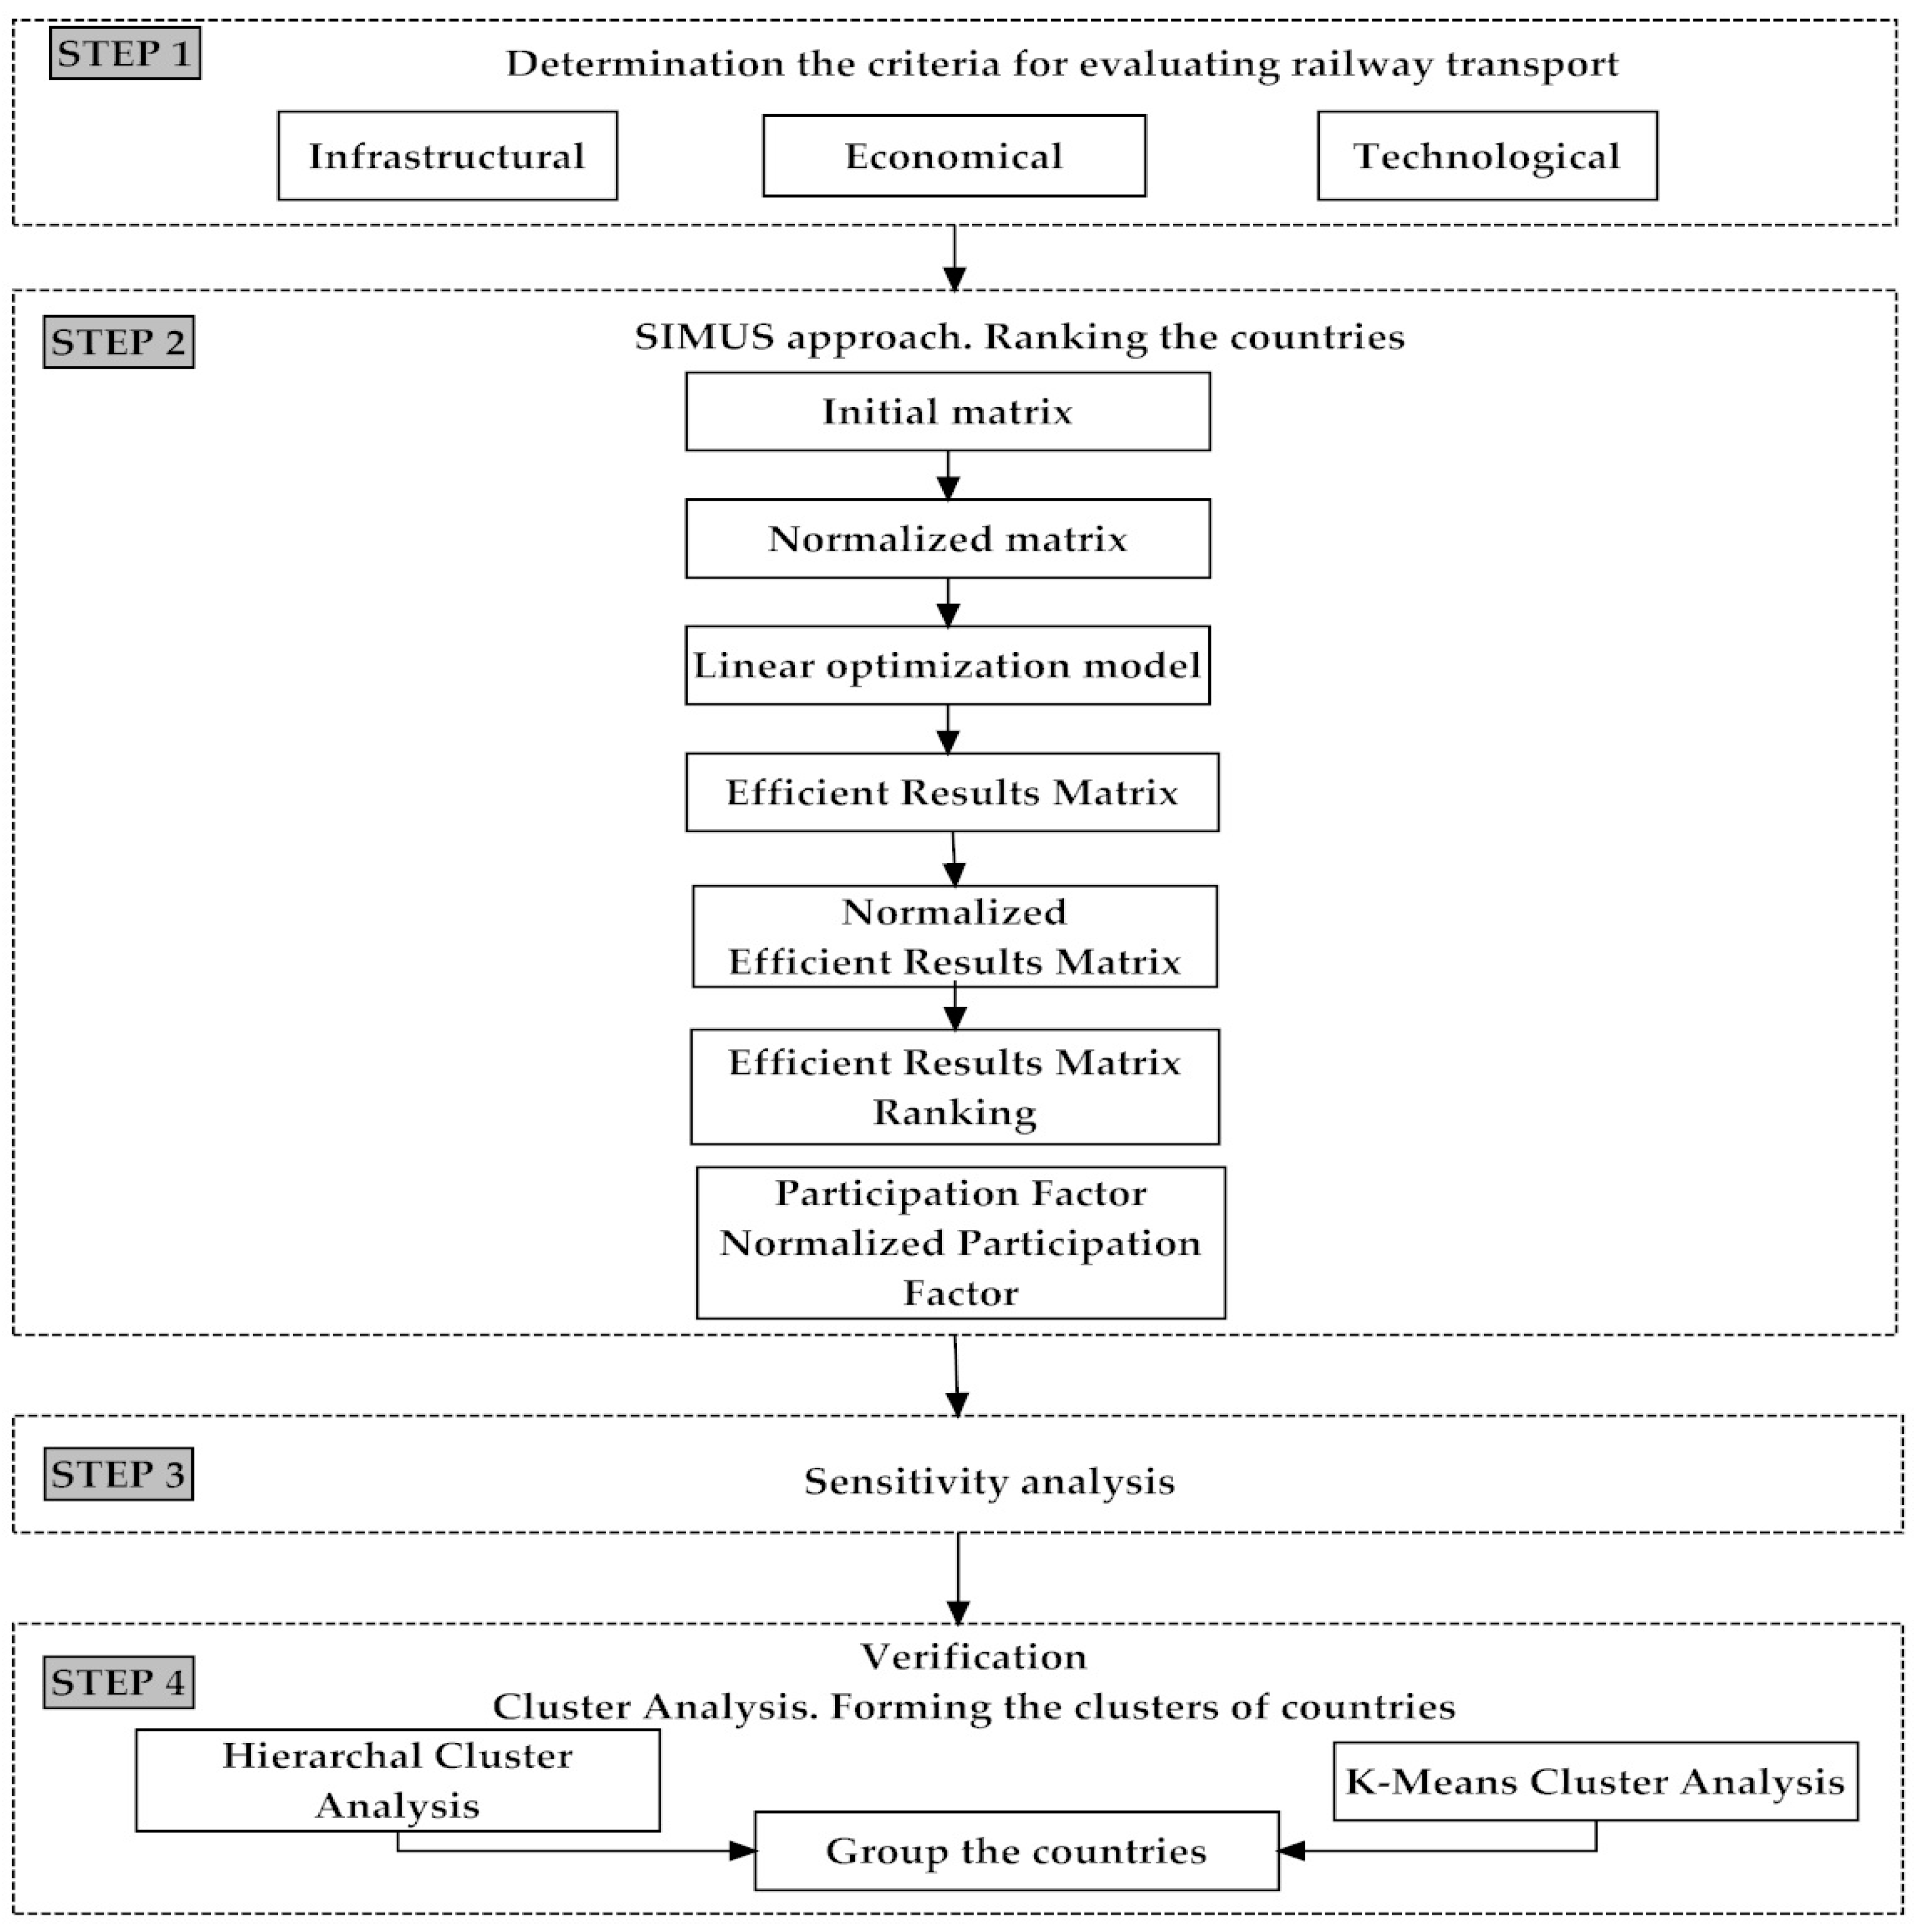
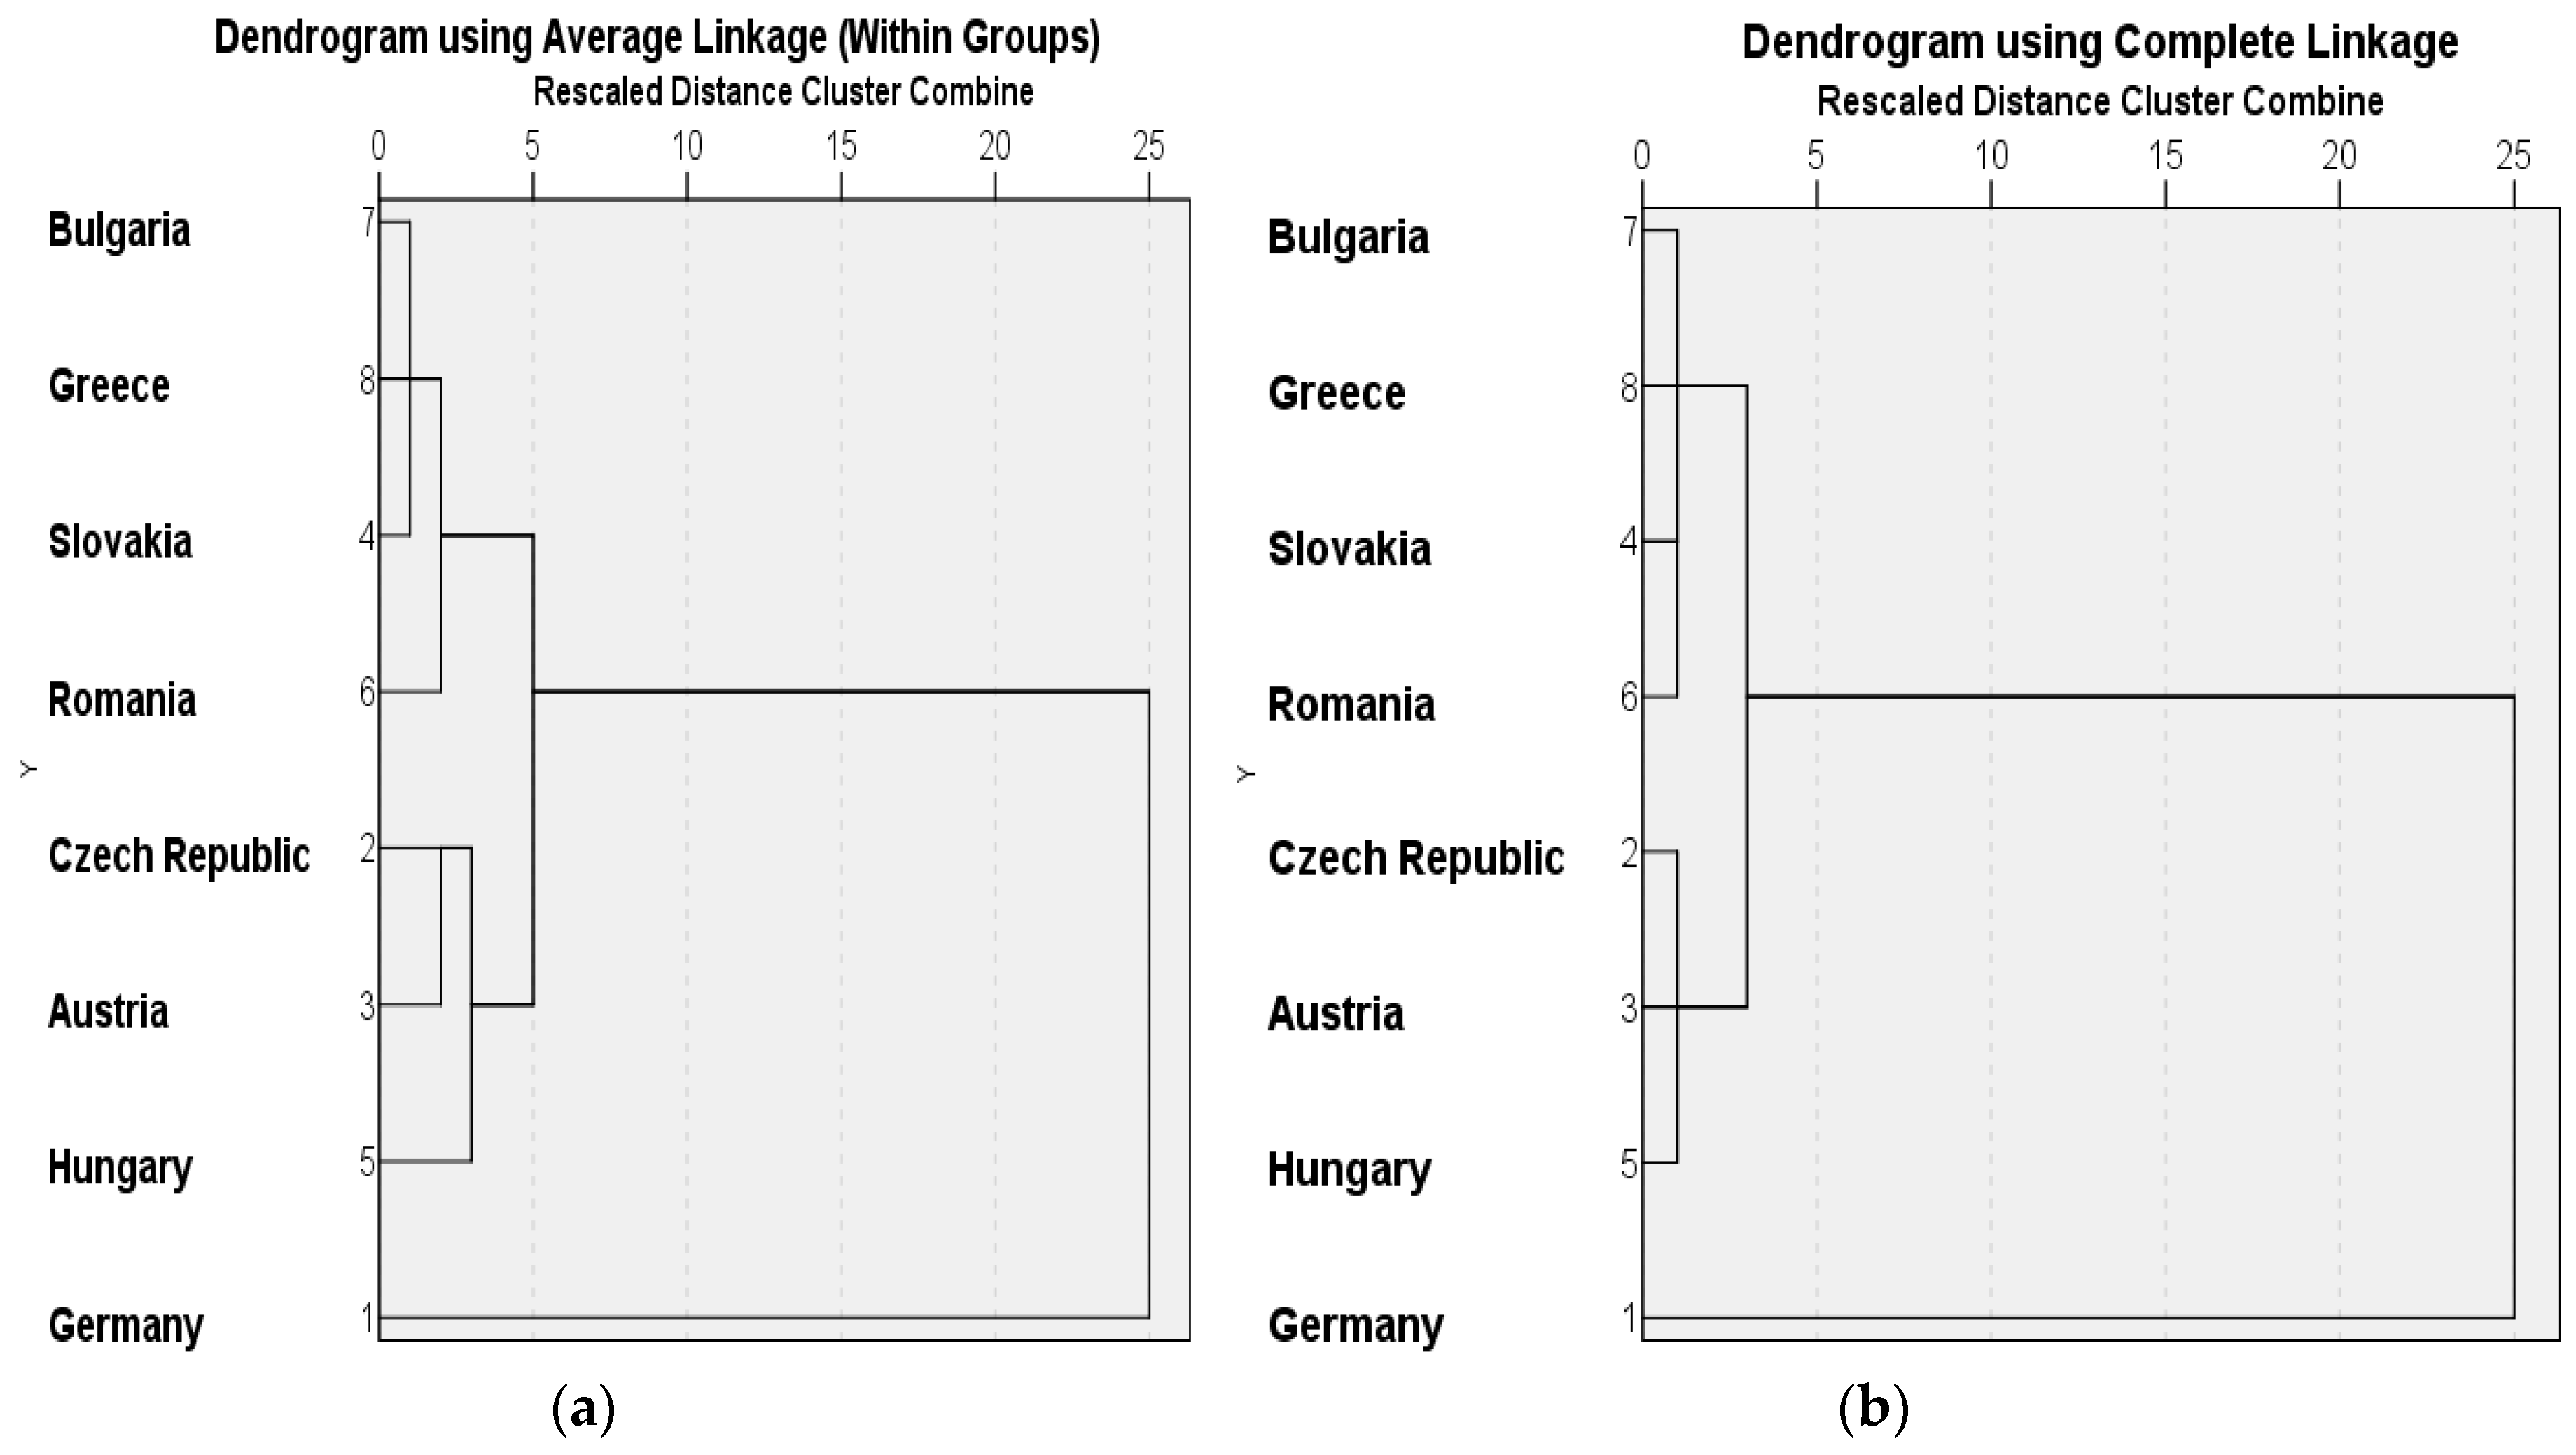
In the present study, the SIMUS method (Sequential Interactive Model for Urban Systems) [35,36,37] and the multi-measurable statistical method of Cluster Analysis are proposed to assess railway performance. These methods do not depend on experts’ assessment of the criteria. The Cluster Analysis allows for grouping the studied objects. The SIMUS method makes it possible to rank the countries according to multiple objectives. Since experts’ assessment and weights of criteria are not used, subjectivism is reduced when making a decision.

1.2. Current Situation

The development of rail transport on the TEN-T network covers the railway infrastructure of different countries with diverse geographical characteristics. Different railway networks have different levels of development, which affects the overall transport process and integrated geographical assessments. The geographical position expresses the spatial relation of countries to other geographical features and consists of interrelated and interdependent elements, as part of them, e.g., the economic-geographical and the political-geographical situation are variable, while others as the natural geographical positions are relatively constant.
The railway OEM corridor involving different parts of Europe includes eight countries and eight different levels of railway infrastructure development. The OEM corridor has the largest number of participating countries compared to other corridors. This demonstrates its strategic importance for rail transport in the Oriental/ Eastern-Mediterranean area with Central and Northern Europe. The railway OEM corridor has an important role in transporting goods to/from Turkey and third countries in Asia and/or to EU countries. At the same time, the corridor is also the longest in comparison to other TEN-T railway corridors, which also confirms its strategic importance in the EU’s transport infrastructure.
In German territory, the OEM railway infrastructure confirms connection of German ports and creates favourable conditions for intermodal transport. In the territory of the Czech Republic, the OEM railway corridor is connected to the Baltic–Adriatic corridor, Czech–Slovak/Rhine–Danube Corridor and North Sea–Baltic corridor. This creates favourable conditions for cooperation between corridors and improvement of transport effectiveness. The OEM corridor in Austria is connected to the Baltic–Adriatic corridor. OEM in the Slovak Republic, in its capital Bratislava, is connected to Baltic–Adriatic corridor. OEM is also connected to Mediterranean Corridor in the Hungarian capital Budapest. The Bulgarian parts of the OEM railway corridor realize the connection with Turkish railway network. The other connection with Turkey is possible through the Greek part of the railway corridor.
The railway OEM corridor involves states with different levels of economic performance in comparison with the developed Western European countries. The infrastructural network has also different levels of development in terms of technical speed, ERTMS Level, connections, double track, passenger transport performance, freight transport performance. The most developed economics, on the basis of GDP, are those of Austria and Germany. Both have nearly half of the GDP of all corridor countries. Germany and the Czech Republic have the largest number of terminals that interact with other modes of transport. Both countries have over 50% of the total number of intermodal terminals of the corridor. The performance of rail passenger and freight transport is the highest for Germany’s railway network compared to the other railway networks in the corridor. It is almost 69% of the total network performance of all countries of the corridor. Hungary has the highest railway passenger performance in terms of the sections of corridor that cross the countries. Hungary and Romania have the largest relative share with respect to the railway freight performance.
The level of railway performance in the OEM corridor countries impacts the economic development, transport mobility, and connectivity in the corridor itself and in Europe as a whole.

1.3. Objective of This Study

The objective of the study is to assess the development of railway transport performance in different countries that are part of the OEM TEN-T corridor. The working hypothesis is that the railway transport along the OEM corridor has different levels of development, and it could be ranked according to the complex impact of criteria related to the infrastructure, economics, and transportation activities.
The establishment of a basic classification of rail transport in the corridor will help to make an integrated assessment taking into account the impact of railway for developing the stability and connectivity of transport, as well as the financing of European projects for the development of transport infrastructure and carriage along the corridor.
This paper is organized as follows. First, Section 1 presents a problem and literature review; Section 2 constructs a research methodology by describing the application steps; Section 3 presents computational procedures and an analysis of the results; Section 4 draws a conclusion.

2. Materials and Methods

This study investigates both passenger and freight transport along the OEM corridor. The proposed methodology includes the following steps (Figure 1).
  • First. Determination of the criteria to assess the railway transport in corridor’s countries.
  • Second. Ranking the countries by a MCDM model, the SIMUS method.
  • Third. A sensitivity analysis regarding each objective. Determining their allowable range of variation without modifying the whole ranking of countries.
  • Fourth. Using cluster analysis for verification of result obtained by SIMUS.

2.1. Step 1: Determining the Criteria to Assess the Railway Transport in Corridor Countries

In the first step are proposed the infrastructural, economic, and technological criteria for assessment of the level of railway transport in the corridor. The infrastructural criteria address the level of development of the railway network and are important to ensure the capacity of the railway lines. The technological criteria indicate the transport performance and intensity of transportation. The economic criteria show the level of development of the state. Table 1 presents the studied criteria.
The criteria were selected on the basis of the most important indices determined in [1] connected to the development of the railway network performance in countries along the corridors, such as: GDP, number of railway carriers, transport performances in rail passenger and freight traffic on corridor lines in the countries and on all lines of member state, lengths of railway lines, number of intermodal terminals, number of railway carriers, and technical speed. The authors include also the following criteria on the basis of the literature review, which are important for assessment of railway performance: ERTMS level, intensity of railway lines, level of utilization of corridor by passengers and by freights, corridor passenger usage intensity and corridor freights usage intensity.
The criteria showing the length of railway lines (C1–C9) present the level of development of railway infrastructure. The number of intermodal terminals (C10) shows the level of development of intermodal transport, as well the connectivity and accessibility of transport network. The criterion maximum train technical speed (C11) indicates the possibilities of rail infrastructure and rail operators to ensure high-speed transport. The criterion ERTMS Levels (C12) indicates the level of the European Railway Traffic Management System (ERTMS)/European Train Control System (ETCS) application. There are three different levels of ERTMS/ETCS application, Level-1, Level-2 and Level-3, based on the need for existing railway infrastructure. The gross domestic product per capita (C13) indicates the level of economic development of a country. The number of railway carriers (C14) shows the level of liberalization of railway market. The passenger transport performance for railway network (C15) and for corridor (C19) as well the freight transport performance for the railway network (C16) and for the corridor (C20) indicate how the rail network is being used in the national passenger and freight markets. The criteria representing the level of utilization of the corridor by passengers (C17) and by freights (C18) are a measure of the use of railway transport. The criteria for corridor passenger usage intensity (C21) and corridor freight usage intensity (C22) are a measure of the productivity of railway transport.

2.2. Step 2: Brief Explanation of the SIMUS Method

This paper aims at measuring, by using a decision-making procedure (MCDM), the relative performance of the integrated railways network in eight countries, based on existing and objective data. There are a lot of MCDM methods available; however, most of them use a subjective approach to evaluate alternatives or options, by establishing preferences to rank criteria importance, which we understand is not applicable in this work.
For this reason, we chose to work with the SIMUS method (Sequential Interactive Model for Urban Systems), which does not use this subjective approach. It does not require to determine the criteria weights, because they are computed internally by the method using data from the initial decision matrix.
Using the subjective approach for any of the different methods most probably will produce different results from each country, when in reality they are integrated in a system, and then, the results of one may affect the results of another/others. Thus, using the subjective approach would make comparisons very difficult if not impossible.
Consequently, given an initial decision matrix, we need to work with a method such as SIMUS where the result is valid for all countries, no matter the country or the decision maker who makes the selection, since all of them will get the same result. That is, the goal is to obtain information that allows each country to take the necessary measures to improve their performance and then make a more balanced railway integrated network.
The goal of this paper is not only to find out the performance of each country but also to determine a way to improve the performance in those countries where it is worse than in other countries. It is important to achieve a level of performance as balanced as possible for the whole network.
With that aim, the criteria are in reality objectives to achieve that goal, and SIMUS makes it possible to determine in percentage the extent to which each objective target is met.
This relative importance of these objectives is computed in the paper. Once this country-wise performance is known, the method suggests which are the measures to improve it in each country.
The SIMUS method is a MCDM hybrid method based on Linear Programming, Weighted Sum, and Outranking [35,36,37]. Its main feature is that it considers the criteria and objectives to be mathematical equivalents, but with different purpose and meaning, depending whether they are input to the model or its output. In SIMUS, criteria in the input are objectives in the output.
Criteria are used as input to evaluate alternatives; they form the initial matrix, with alternatives in columns and criteria in rows. Using the Simplex algorithm of Linear Programming, it finds for each objective the optimal scores for the alternatives. These scores are saved in a matrix called “Efficient Result Matrix” (ERM).
For each problem, Linear Programming simultaneously yields two answers:
  • The first answer is called ‘Primal’ and corresponds to the scores in the ERM. In here, it shows for each objective the optimal values of the alternatives. The ERM can be considered as a new initial decision matrix but with optimal values. It is the base that SIMUS uses to process its information using two different Multi Criteria Decision Methods (MCDM):
    (a)
    The first method is the “Weighted Sum”, and it determines the best alternative (in our case, it shows the country that best satisfies the criteria) and also gives the ranking of alternatives or countries.
    (b)
    The second method is “Outranking”, and it produces a new matrix called “Project Dominance Matrix” (PDM), that also determines the best alternative (countries in this problem) and also the ranking of countries. However, PDM is not used in this study since we only need the normalized ERM (NERM).
    Both methods yield the same best selection and the same ranking. Since we start with the same data, use two different methods and obtain equal results; this can be considered as a SIMUS built-in mechanism for mutual validation of the two methods.
  • The second answer is called “Dual”, and it delivers the marginal utilities for each criterion, which are used to perform a sensitivity analysis, draw the total utility curve for each objective, and verify the robustness of the solution.
Section 3 of the study presents the application of SIMUS method: Table 2 shows the initial matrix, Table 3 depicts its normalization, Table 4 is the ERM, and Table 5 is the ERM normalized.
Observe at the bottom of Table 5 how the total scores of the alternatives as well as their ranking are obtained. Rows are now objectives, the constituent of the solution, and their values are the output of the method.

2.3. An Approach to Determine the Weights of Objectives Based on the SIMUS Method

In this study, an approach is proposed to determine mathematically the weights of the objectives. These weights are needed to evaluate the relative importance of each objective in making the ranking of the countries of the OEM corridor.
The weights of objectives can be determined using SIMUS normalized ERM matrix values ( N E R M i j ). Since the weights are computed using all objectives, they allow us to rank them. The ERM can give the relative weight of each objective and rank them. For this purpose, the maximum value ( max j N E R M i j ) of each row in normalized ERM matrix is determined. These values indicate the importance of each objective.
The weight of each objective is defined as follows:
w i S I M U S = max j N E R M i j i = 1 m N E R M i j ,
0 w i S I M U S 1 ,
i = 1 m w i S I M U S = 1 ,
The weights of sub-objectives for each main group are as follows:
w g k S I M U S = w i k S I M U S k = 1 K w i k S I M U S ,
where w i k S I M U S are the weighs of objectives in the main group g ; g = 1 , , G is the number of main group criteria; i = 1 , , m is the number of criteria; k = 1 , , K is the number of criteria in main group g .
The weights of the main group of objectives are determined by using the pre-determined weights of all objectives as follows:
w g S I M U S = w ¯ g S I M U S g = 1 G w ¯ g S I M U S ,
w ¯ g S I M U S = k = 1 K w i k S I M U S K ,
where w g S I M U S is the weight of main group g ; w ¯ g S I M U S is the average weight for criteria of main group g .

2.4. Step 3: Sensitivity Analysis of the Upper and Lower Limits of Criteria Marginal Utilities

In this study an approach is proposed to determine mathematically the weights of the objectives. The initial decision matrix in SIMUS is constructed with inequalities; the series of values or performance values on the left part for each inequality is called “Left Hand Side” (LHS), while the right term is called “Right Hand Side” (RHS), which normally are restrictions to a criterion and established by the decision maker. In our case, these can be, for instance, existent km in a network.
SIMUS works with the RHS for sensitivity analysis. In each case, increasing the RHS in one unit produces an increment in the corresponding objective equal to the marginal utility of such criterion. However, there is a limit for increasing or decreasing the RHS.
Both, marginal values and upper and lower limits are given by SIMUS and in the same screen as rankings.

2.5. Step 4: Cluster Analysis

The fourth step of the methodology includes validation of SIMUS results by applying the multi-measurable statistical analysis known as Hierarchal Cluster Analysis method, as a tool of producing a classification of the examined railway networks into groups called clusters by using different criteria [38,39]. The process is represented in a dendrogram that illustrates which clusters have been joined and the distance between clusters.
The average linkage within groups and complete linkage method are proposed as an agglomerative method to define the clusters. These methods are appropriate when the decision maker wants to receive clusters in the form of branched tree. We employ the Euclidean distance as a metric for distance, as it is the most commonly used distance between two points. To verify results, we use the non-hierarchical k-means clustering method. In that method, the desired number of clusters is specified in advance, so it uses the results for the number of clusters received by the hierarchal cluster analysis.

3. Results and Discussion

This study examines the railway OEM corridor that runs between the cities of Bremerhaven/Wilhelmshaven/Rostock/Hamburg–Prague–Vienna/Bratislava–Budapest–Bucuresti Constanta/Vidin–Sofia/Burgas/Svilengrad (Bulgarian–Turkish border)/Promachonas–Thessaloniki–Athenes–Patras. The corridor covers parts of the Carpathian states, the Alpine countries, and the Balkans. The eight different countries and the eight different levels of infrastructure development are the basis for railway transportation along the corridor and also a strategic connecting opportunity West–East. The Rail Freight Corridor RFC “Orient/East Med” has been adapted to the same alignment [40].
The current length of the OEM railway corridor is approximately 8921.6 km including principal, diversionary and connected railway lines. The length of the corridor sections among the involved countries is different. For example, Austria has the shortest section of the corridor with about 303km (i.e., 5% of the whole corridor); Romania has the longest part, about 2200 km corridor line (i.e., 28% of the total length) [41]. Bulgaria, Germany, and Greece have also long sections of the OEM corridor. The ERTMS system has different development level in OEM countries. Level 2 of the European Railway Traffic Management System (ERTMS) is applied in Germany, the Czech Republic, and Austria, [41]. The deployment of ERTMS is important for the development of international rail traffic.
Figure 2 illustrates the scheme of the OEM corridor.
Data from Table 2 are used to determine the values of the defined criteria for OEM railway corridor [1,2]. Table 2 presents the initial matrix with the values of the criteria for each investigated country along the OEM railway corridor.
Analyzing the various technical and operational parameters, different ranking of the countries could be obtained depending on the number of satisfied objectives (NPF) in the OEM corridor. The data in the initial matrix (Table 2) show that Germany is in the first position with NPF = 7, Austria, and Bulgaria with NPF = 4, the Czech Republic and Romania with NPF = 3, Greece with NPF = 2, Hungary with NPF = 1, Slovakia with NPF = 0.

3.1. SIMUS Method

The initial matrix that consists of the values of criteria for each of the investigated OEM railway networks is presented in Table 2, while Table 3 presents the values of the normalized matrix, using the sum of all values in each row. The last three columns indicate the type of optimization for each criterion, the type of operator, and the limits to each criterion.
The variables representing the score of each railway network for each optimization model are indicated by x1,…,x8 in Table 3.
For each objective, the type of optimization is set. Criteria C7, C8, and C8 are related to single-track railways. Single-track railways have less capacity and railway performance than double track ones. The railways with double track are considered to be more developed. Therefore, these criteria involve minimization.
The linear optimization model uses data given in Table 3. The objective function for the first optimization uses criterion C1 as follows:
0.23 x 1 + 0.11 x 2 + 0.03 x 3 + 0.056 x 4 + 0.09 x 5 + 0.24 x 6 + 0.13 x 7 + 0.12 x 8 Max ,
where x i are the alternatives affected by the respective coefficient.
The restrictive conditions are formed by the other rows of the matrix that presented criteria from C2 to C22. For example, the restrictive conditions for C2, C3, and C4 are:
0.07 x 2 + 0.05 x 4 + 0.12 x 5 + 0.09 x 6 + 0.31 x 7 + 0.19 x 8 0.31 ,
0.39 x 2 + 0.23 x 3 + 0.18 x 4 + 0.02 x 5 + 0.14 x 8 039 ,
0.15 x 1 + 0.11 x 2 + 0.03 x 3 + 0.06 x 4 + 0.09 x 5 + 0.25 x 6 + 0.16 x 7 + 0.14 x 8 0.25 ,
The final restrictive condition for the first optimization model is composed by criterion C22 as follows:
0.03 x 1 + 0.15 x 2 + 0.36 x 3 + 0.12 x 4 + 0.20 x 5 + 0.08 x 6 + 0.05 x 7 + 0.01 x 8 0.36 ,
For all variables the following condition applies:
0 x 1 , x 2 , x 3 , x 4 , x 5 , x 6 , x 7 , x 8 1 ,
Similar optimization is performed for all other criteria.
Table 4 shows the results of all linear optimizations. The last column in the table indicates the values of the objective functions for each linear model. Germany has the maximal score equal to 1 for four of the criteria (Z5, Z10, Z15, and Z16). The Czech Republic has one maximum score Z3, and Austria has also one maximum score Z13.
The table shows for each row the values of the scores of the countries according to the optimization models by using each criterion as an objective function. For example, the results illustrate that Germany has a score of 0.63, and Romania has a score of 0.61 by the first criterion. The scores for all others countries are equal to zero. When the second criterion is applied as objective function, the scores for Romania and Bulgaria are respectively 0.45 and 0.82. It can be seen that for the criteria C7, C8, and C9 representing single-track railway lines the scores for all countries are equal to zero.
Table 5 shows the normalized Efficient Results Matrix obtained by using the Efficient Results Matrix presented in Table 4. Table 5 consists of two parts. The first part presents the normalized Efficient Results Matrix by using the sum of the row method. The second part presents the results of ERM ranking.
The most important objectives or those that influence the ranking the most are shown in the ERM. Note that objectives Z7, Z8, and Z9 are not significant for ranking.
The results show that the railway transport in the section of the ORM corridor located in Central Europe is better developed compared to the section located in Southeast Europe. Romania has the best ranking position of the Balkan countries while Slovakia is in the last position of the Central European countries.

3.2. Determination of the Weights of Objectives

Irrespective of their importance for forming the ranking, it is interesting to find out the weights of the objectives that measure the relative importance of each one; they can be elicited from the ERM.
Table 6 shows the weights of objectives obtained from the ERM normalized values. It was found that the weights of the main group criteria—economic and technological—are close. These groups have a main importance in the ranking. The more significant objectives have a normalized value of 7%; they are as follows: (Z3) Length of the connecting railway lines of the corridor in the country, (Z5) Length of the railway lines in the country, (Z10) Number of intermodal terminals, (Z13) GDP per capita, (Z15) Passenger transport performance, (Z16) Freight transport performance for railway network, (Z22) Corridor freight usage intensity. They are shown in bold in Table 6.

3.3. Sensitivity Analysis Using SIMUS Method

A sensitivity analysis was performed regarding each objective and then determining their allowable range of variation without modifying the whole ranking of countries, with “U” indicating the upper limit and “L” the lower limit, and they are shown in Table 7. These limits are provided by SIMUS.
Each objective depends only on some criteria, and then, the other criteria are irrelevant. SIMUS makes it possible to determine which the significant criteria for each objective are.
Therefore, we analyze how each objective output reacts to variations in the respective inputs or criteria. Each significant criterion or binding criterion has a marginal utility. This means that every time we modify in one unit a criterion independent value, the corresponding objective increases/decreases lineally in an amount equal to the marginal utility of the criterion. However, there are limits for a criterion variation. Once those limits are surpassed, the objective utility function changes its slope, and then the final curve is composed of a series of straight lines that generate a convex utility function.
Some criteria have unlimited upper values. These are: (C7) Length of the single-track railway lines of the corridor in the country, (C8) Length of the single-track principal railway lines of the corridor in the country, and (C9) Intensity of single-track.
The unlimited value of the upper limit is only theoretical. The lower limits that have the value zero are also theoretical. The following conditions have to be taken into account:
  • The lower limit for the criterion expressing the length of the railway lines (C1–C8) can be assumed to be its given value, since the railway lines will not be dismantled. The upper limit depends on the area of the state and the infrastructure capacity.
  • The upper limit for criterion (C11) Maximal technical speed depends on railway infrastructure.
  • The upper limit for criterion ERTMS Level (C12) is 2 if the country has Level 2 of ERTMS. The lower limit for this criterion has a value of 0. This value must be taken into account only theoretically since the ERTMS cannot go to a lower level than the one operating on the railway network.
  • The upper limit for criterion GDP per capita (C13) depends on the total value of everything produced in the country and the number of residents.
  • The upper limits for criteria (C15) Passengers transport performance for railway network, (C16) Freight transport performance for railway network, (C19) Passengers transport performance for corridor, (C20) Freight transport performance for corridor, (C21) Corridor passenger usage intensity and (C22) Corridor freight usage intensity depend on the maximal capacity of railway lines.
  • The upper limits for criteria (C17) Level of utilization of corridor by passengers and (C18) Level of utilization of corridor by freights are 1, as these criteria are coefficients.
The study suggests that countries will seek to increase the shipment, which will increase the value of the criteria.
The results shown in Table 7 show the following limits in which the ranking remains unchanged:
  • Criterion (C10) Intermodal terminal has a wide limit of change for Germany, Austria, and Slovakia. The values of the criterion for the Czech Republic are close to the upper limit with 7% growth opportunities. Romania and Greece are also close to the upper limit, with 14% and 24% growth opportunities, respectively.
  • The values for criterion (C11) Maximal technical speed for Slovakia and Hungary are at the upper limit.
  • The values for criterion (C12) ERTMS Level are at the upper limit of the criterion change for Germany, Czech Republic, and Austria. This is ERTMS level 2.
  • Germany has a small limit of change to the upper limit of criterion (C13) GDP per capita (5.61%); for Greece the limits is 18.65%. For other countries, the criterion has wide limits of variation.
  • The value of criterion (C14) Number of railway carriers for the Czech Republic is near the upper limit (6.38%).
  • The Czech Republic is near the upper limit of criterion (C15) Passengers transport performance for railway network (12.45%). For other countries, the criterion has wide limits of variation.
  • Romania is near the upper limit of criterion (C16) Freight transport performance for railway network (16.9%).
  • The values for the criterion of the level of utilization of the corridor by passengers (C17) per year are near the upper limit of the change criterion C17 for Slovakia (2.83%) and Hungary (9.5%).
  • The values for criterion of level of utilization of the corridor by freights (C18) are near the upper limit of the change criterion for Hungary (1.24%) and Greece (3.25%).
  • The Czech Republic is near the upper limit of the criterion (C19) Passenger transport performance for the corridor (13.32%).
  • The value of the criterion of freight transport performance for the corridor (C20) for the Czech Republic is near the upper limit (3.7%). Hungary is 14.18% lower than the upper limit.
  • Hungary is near the upper limit of the criterion (C21) Corridor passenger usage intensity (3.76%).
  • Austria is near the upper limit of criterion (C22) Corridor freight usage intensity (0.13%). Slovakia is 16.42% away from the upper limit.
It could be concluded that most criteria have large limits of variation. Small limits to the upper values of criteria have the following countries: Hungary for 7 criteria; Czech Republic for 6 criteria; Germany, Slovakia, Austria, and Greece for 3 criteria; and Romania for 2 criteria. These criteria for Hungary are (C11) Maximal technical speed, (C12) ERTMS Level, (C14) Number of railway carriers, (C17) Level of utilization of the corridor by passengers, (C18) Level of utilization of the corridor by freights, (C20) Freight transport performance for corridor, (C21) Corridor passenger usage intensity. For the Czech Republic the criteria are (C11) Number of intermodal terminals, (C12) ERTMS Level, (C14) Number of railway carriers, (C15) Passenger transport performance for the railway network, (C19) Passenger transport performance for the corridor, and (C20) Freight transport performance for the corridor. For Germany the criteria are (C10) Number of intermodal terminals, (C12) ERTMS Level, and (C13) GDP per capita. For Slovakia the criteria are (C11) Maximal technical speed, (C17) Level of utilization of the corridor by passengers, and (C22) Corridor freight usage intensity. For Austria the criteria are (C10) Number of intermodal terminals, (C12) ERTMS Level, and (C22) Corridor freight usage intensity. For Greece the criteria are (C10) Number of intermodal terminals, (C13) GDP per capita, and (C18) Level of utilization of the corridor by freights. For Romania the criteria are (C10) Number of intermodal terminals and (C16) Freight transport performance for the railway network. It can also be said that the criteria that are near the upper limit are (C10) Number of intermodal terminals (for 5 countries) and (C12) ERTMS Level (4 countries). Bulgaria has large limits of variation of criteria.

3.4. Cluster Analysis

A cluster analysis was performed to classify countries into groups to verify the results.
SPSS (Statistical Package for Social Science) software has been applied for performing the study with Cluster Analysis. The dendrograms of the formed clusters, obtained by using the methods of average linkage within group and complete linkage with the Euclidean distance, are shown in Figure 3.
It can be seen that the results by average linkage within group and complete linkage methods are similar.
The results of the cluster analysis indicate that the railway network in the OEM corridor could be classified into three clusters:
  • Cluster 1: Germany.
  • Cluster 2: It consists of two sub-clusters—one by Czech Republic and Austria, and the other includes Hungary.
  • Cluster 3: It is formed also by two sub-clusters—one that includes three countries: Bulgaria, Greece, and Slovakia, and the other includes Romania.
The Complete linkage method forms the clusters with equal distance between them.
The results of K-means clustering are presented in Table 8. This method does not involve the formation of sub-clusters. It can be seen that the number of clusters and the railway networks included in them is equal to that obtained through Hierarchal Cluster analysis.
The first cluster consists of the railway network of Germany with big values for passenger railway performance and freight railway performance. The countries in the third cluster have small railway performance. The countries in the first and second clusters have a small part of the OEM railway corridor (up to 11%, Table 8). The third cluster includes countries with a large length of OEM railway corridor (over 14%). It can be seen that the first and the second cluster include railway transport in the section of the ORM corridor located in Central Europe, while the third cluster comprises the section located in Southeast Europe. It can be concluded also that the transport along the OEM railway corridor in the Alpine countries of Germany and Austria and in part of the Carpathian states of the Czech Republic and Hungary is at a higher level of development than in the Balkan countries. It could be summarized that to increase the economic–geographical situation of the OEM transport corridor, the development of the railway transport in the Southeast Europe has to be improved. This can be achieved by improving the infrastructure and the commercial, touristic, and business carriage between railway networks in the countries in Southeast Europe, and the transportation East–West along the OEM corridor.

4. Conclusions

This paper proposes a methodology for assessment of railway transport performance along the TEN-T corridor, involving 8 countries.
Twenty-two criteria have been defined including infrastructural, economic, and technological indices. Two approaches have been explored, one by applying multi-criteria decision-making analysis and using the SIMUS method and the other by using Hierarchical Cluster analysis and K-means Cluster analysis as main multi-measurable statistical method.
Criteria weights have been determined based on the output of the SIMUS method. It was found that the main important criteria for ranking the countries are Length of the connecting railway lines of the corridor in the country (C3); Length of the railway lines in the country (C5); Number of intermodal terminal (C10); GDP per capita (C13); Passenger transport performance (C15); Freight transport performance for railway network (C16); Corridor freight usage intensity (C22).
A sensitivity analysis was performed regarding each objective, and then, their allowable range of variation was determined without modifying the whole ranking of countries. This study not only has found out the performance of each country but has also determined a way to improve those countries whose performance is worse than in other countries. The relative importance of these objectives is computed in the paper. Once this performance is known, the method suggests which are the measures to improve it in each country. It is important to achieve a level of performance as balanced as possible for the whole OEM corridor.
Most criteria have large limits of variation. Small limits to the upper values of criteria have the following countries: Hungary for 7 criteria; Czech Republic for 6 criteria; Germany, Slovakia, Austria, and Greece for 3 criteria; and Romania for 2 criteria. It can be seen that the criteria that are near the upper limit are (C10) Number of intermodal terminals (for 5 countries) and (C12) ERTMS Level (for 4 countries).
It was also established that the classification based on Cluster analysis gave similar results as the SIMUS method. The countries of the OEM corridor have been classified into three clusters, and also a rating has been done.
Analyzing the results given by both approaches, it could be concluded that the railway transport along the OEM corridor in the Alpine countries and in part of the Carpathian states as the Czech Republic and Hungary is at a higher level of development compared to the Balkan countries.
Other important findings drawn from the analytical results show that railway transport in the area of the ORM corridor located in Central Europe is better developed than in the Southeast European area.
An important conclusion is that the stability of the transport corridors could be improved through the development of railway transport in Southeast Europe.
The main output of this study was obtaining a ranking regarding railway transport on the railway corridor that is part of the TEN-T railway network. The novelty of the proposed methodology is the identification of objectives that are responsible for the ranking and the possibility to measure their relative significance.
The identification of these objectives makes it possible to analyse and determine measures that can be taken to improve performance in any country of the corridor.
The methodology could be used to make decisions about transport planning and to improve the integrated transport position of the countries concerned, taking into account activities of transport development. The results could be used to compare the level of development of the rail transport along the corridor, taking into account the impact of transport components, and could help railway companies in their analysis of the stability and connectivity of transport. The elaborated methodology also could be applied to the investigation of the other TEN-T corridors or other transport corridors worldwide.
The results of this paper and the proposed methodology could be used by the authors in further research to investigate measures to improve railway network performance in each country of the OEM corridor.

Author Contributions

Conceptualization, S.S.; methodology, S.S.; literature review, S.S., M.K., and T.S.; validation, S.S., M.K., and T.S.; formal analysis, S.S. and N.M.; data curation, S.S., M.K., and T.S.; investigation, S.S., M.K., T.S., and N.M.; writing—original draft preparation, S.S.; writing—review and editing, S.S. and N.M. All authors have read and agreed to the published version of the manuscript.

Funding

This work was supported by the National Science Fund of the Ministry of Education and Science of Bulgaria [project number No.KП-06-H27/12 of 11.12.2018 “Modelling and elaboration of complex system for selection of transport technology in transport network”].

Conflicts of Interest

The authors declare no conflict of interest.

References

  1. REC 7 Orient/East-Med. Yearly Activity and Performance Report 2017. Available online: http://www.rfc7.eu/ckfinder/userfiles/files/20180620/RFC7%20report%202017.pdf (accessed on 15 December 2019).
  2. Delivering TEN-T. Facts & Figures. 2017. Available online: http://www.connectingeu.eu/documents/Delivering_TEN_T.pdf (accessed on 15 December 2019).
  3. Öberg, M.; Nilsson, K.L.; Johansson, C.M. Expected benefits and drawbacks of Baltic Sea European transport corridors—Implications for complementary governance of TEN-T Core network corridors. Cogent Bus. Manag. 2018, 5, 1423870. [Google Scholar] [CrossRef]
  4. Quium, A.S.M.A. Transport Corridors for Wider Socio–Economic Development. Sustainability 2019, 11, 5248. [Google Scholar] [CrossRef] [Green Version]
  5. Jourquin, B.; Beuthe, M. Cost, transit time and speed elasticity calculations for the European continental freight transport. Transp. Policy 2019, 83, 1–12. [Google Scholar] [CrossRef]
  6. Sładkowski, A.; Cieśla, M. Analysis and Development Perspective Scenarios of Transport Corridors Supporting Eurasian Trade. In Transport Systems and Delivery of Cargo on East–West Routes. Studies in Systems, Decision and Control; Sładkowski, A., Ed.; Springer: Cham, Switzerland, 2018; Volume 155, pp. 70–120. [Google Scholar] [CrossRef]
  7. Khúlová, L.; Šprochová, L. Importance of TEN-T Corridors in the Development of Infrastructure Example of Visegrad Group Countries. Studia Commer. Bratisl. 2016, 9, 49–57. [Google Scholar] [CrossRef] [Green Version]
  8. Panagakos, G.; Psaraftis, H.N. Model-based corridor performance analysis—An application to a European case. Eur. J. Transp. Infrastruct. Res. 2017, 17, 225–247. [Google Scholar]
  9. Janic, M.; Vleuge, J. Estimating potential reductions in externalities from rail–road substitution in Trans-European freight transport corridors. Transp. Res. Part D 2012, 17, 154–160. [Google Scholar] [CrossRef]
  10. Beckmann, K. Spatial and Transport Development in European Corridors—Example Corridor: Orient/East-Med. Connecting and Competing in Spaces of European Importance. Position Paper of the ARL, No. 112, 2019, Hannover. Available online: https://www.econstor.eu/bitstream/10419/191636/1/1047130947.pdf (accessed on 15 December 2019).
  11. Miljković, M.; Gavrilović, B.; Vujačić, J. The Trans-European Transport Corridors: Contribution to Economic Performances of European Regions. Industrija 2018, 46, 173–185. [Google Scholar] [CrossRef]
  12. Transport Market Study Rail Freight Corridor Orient/East-Med. 2017. Available online: http://www.rne.eu/rail-freight-corridors/corridor-information-documents (accessed on 15 December 2019).
  13. Öberg, M.; Nilsson, K.; Johansson, C. Major transport corridors: The concept of sustainability in EU documents. Transp. Res. Procedia 2017, 25, 3694–3702. [Google Scholar] [CrossRef]
  14. Otsuka, N.; Günther, F.; Tosoni, I.; Braun, C. Developing trans-European railway corridors: Lessons from the Rhine-Alpine Corridor. Case Stud. Transp. Policy 2017, 5, 527–536. [Google Scholar] [CrossRef]
  15. Öberg, M.; Nilsson, K.; Johansson, C. Complementary governance for sustainable development in transport: The European TEN-T Core network corridors. Case Stud. Transp. Policy 2018, 6, 674–682. [Google Scholar] [CrossRef]
  16. Schade, W.; Hartwig, J.; Schäfer, S.; Welter, S.; Maffii, S.; de Stasio, C.; Fermi, F.; Zani, L.; Martino, A.; Bellodi, L. The Impact of TEN-T Completion on Growth, Jobs and the Environment. Methodology and Results. Final Report. European Commission, Luxembourg: Publications Office of the European Union. 2019. Available online: https://op.europa.eu/en/publication-detail/-/publication/71e25029-55d6-11e9-a8ed-01aa75ed71a1 (accessed on 15 December 2019). [CrossRef]
  17. Leeuw Van Weenen, R.; Burgess, A.; Francke, J. Study on the implementation of the TEN-T regulation—The Netherlands case. Transp. Res. Procedia 2016, 14, 484–493. [Google Scholar] [CrossRef] [Green Version]
  18. Šakalys, R.; Batarlienė, N. Research on Intermodal Terminal Interaction in International Transport Corridors. Procedia Eng. 2017, 187, 281–288. [Google Scholar] [CrossRef]
  19. Oszter, V.; Kövesdi, I. Railway Hub Cities and TEN-T network (RAILHUC Project)—How to improve connectivity around several Central European railway hub cities? Transp. Res. Procedia 2014, 4, 505–520. [Google Scholar] [CrossRef] [Green Version]
  20. Witte, P.; Wiegmans, B.; van Oort, F.; Spit, T. Governing inland ports: A multi-dimensional approach to addressing inland port–city challenges in European transport corridors. J. Transp. Geogr. 2014, 36, 42–52. [Google Scholar] [CrossRef]
  21. Langen, P.W.; Lases Figuero, D.M.; van Donselaar, K.H.; Bozuwa, J. Intermodal connectivity in Europe, an empirical exploration. Res. Transp. Bus. Manag. 2017, 23, 3–11. [Google Scholar] [CrossRef]
  22. Saeedi, H.; Wiegmans, B.; Behdanib, B.; Zuidwijk, R. European intermodal freight transport network: Market structure analysis. J. Transp. Geogr. 2017, 60, 141–154. [Google Scholar] [CrossRef]
  23. Aparicio, A. The changing decision-making narratives in 25 years of TEN-T policies. Transp. Res. Procedia 2017, 25, 3715–3724. [Google Scholar] [CrossRef]
  24. Gutierrez, J.; Condeco-Melhorado, A.; Lopez, E.; Monzon, A. Evaluating the European added value of TEN-T projects: A methodological proposal based on spatial spillovers, accessibility and GIS. J. Transp. Geogr. 2011, 19, 840–850. [Google Scholar] [CrossRef]
  25. Schade, W.; Rothengatter, W.; Mader, S. Connectivity and Accessibility of Transport Infrastructure in Central and Eastern European Member States. Note on Behalf of the European Parliament. Brussels, Karlsruhe, 2016. Available online: http://www.europarl.europa.eu/RegData/etudes/IDAN/2016/573419/IPOL_IDA (accessed on 15 December 2019).
  26. Nežerenko, O.; Koppel, O. Formal and informal macro-regional transport clusters as a primary step in the design and implementation of cluster. Transp. Telecommun. J. 2015, 16, 207–216. [Google Scholar] [CrossRef]
  27. Nežerenko, O.; Koppel, O.; Tuisk, T. Cluster approach in organization of transportation in the Baltic Sea region. Transport 2017, 32, 167–179. [Google Scholar] [CrossRef] [Green Version]
  28. Abramović, B.; Zitricky, V.; Bišku, V. Organisation of railway freight transport: Case study CIM/SMGS between Slovakia and Ukraine. Eur. Transp. Res. Rev. 2016, 8, 27. [Google Scholar] [CrossRef] [Green Version]
  29. Islam, D.M.Z.; Ricci, S.; Nelldal, B. How to make modal shift from road to rail possible in the European transport market, as aspired to in the EU Transport White Paper 2011. Eur. Transp. Res. Rev. 2016, 8, 18. [Google Scholar] [CrossRef] [Green Version]
  30. Saeedi, H.; Wiegmans, B.; Behdani, B.; Zuidwijk, R. Analyzing competition in intermodal freight transport networks: The market implication of business consolidation strategies. Res. Transp. Bus. Manag. 2017, 23, 12–20. [Google Scholar] [CrossRef] [Green Version]
  31. Rothengatter, W.; Schade, W.; Mader, S.; Rothengatter, W.; Mader, S. Logistics in the TEN-T Corridors. Note on Behalf of the European Parliament. Brussels, 2016, Karlsruhe. Research for Tran Committee—Logistics in the TEN-T Corridors. Available online: http://www.europarl.europa.eu/RegData/etudes/STUD/2016/573429/IPOL_STU(2016)573429_EN.pdf (accessed on 15 December 2019).
  32. Justo, J.; Suarez, C. Has the efficiency of European railway companies been improved? Eur. Bus. Rev. 2003, 15, 213–220. [Google Scholar] [CrossRef]
  33. Lami, I.M. Evaluation Tools to Support Decision-Making Process Related to European Corridors. In Analytical Decision-Making Methods for Evaluating Sustainable Transport in European Corridors; Lami, I., Ed.; SxI-Springer for Innovation/SxI-Springer per l’Innovazione, Springer: Cham, Switzerland, 2014; Volume 11, pp. 85–101. [Google Scholar] [CrossRef]
  34. Abastante, F.; Günther, F.; Lami, I.M.; Masala, E.; Pensa, S.; Tosoni, I. Analytic Network Process, Interactive Maps and Strategic Assessment: The Evaluation of Corridor24 Alternative Development Strategies. In Analytical Decision-Making Methods for Evaluating Sustainable Transport in European Corridors; Lami, I., Ed.; SxI-Springer for Innovation/SxI-Springer per l’Innovazione, Springer: Cham, Switzerland, 2014; Volume 11, pp. 205–232. [Google Scholar] [CrossRef]
  35. Munier, N. A Strategy for Using Multi-Criteria Analysis in Decision-Making; Springer: Berlin/Heidelberg, Germany, 2011. [Google Scholar] [CrossRef]
  36. Munier, N. A new approach to the rank reversal phenomenon in MSDM with the SIMUS method. Mult. Criteria Decis. Mak. 2016, 11, 137–152. [Google Scholar] [CrossRef]
  37. Munier, N.; Hontoria, E.; Jimenez-Saez, F. Strategic Approach in Multi-Criteria Decision Making. In A Practical Guide for Complex Scenarios; Springer Nature: Basel, Switzerland, 2019. [Google Scholar] [CrossRef]
  38. Hair, J.F.; Black, W.C.; Babin, B.J.; Anderson, R.E. Multivariate Data Analysis, 7th ed.; Prentice Hall: Upper Saddle River, NJ, USA, 2010. [Google Scholar]
  39. Tan, P.; Steinbach, M.; Kumar, U. Introduction to Data Mining; University of Minnesota: Minnesota, MN, USA, 2006. [Google Scholar]
  40. Grosch, M. Orient East Med Work Plan of the European Coordinator. 2015. Available online: http://ec.europa.eu/transport/themes/infrastructure/news/doc/2015-05-28-coordinator-work-plans/wp_rhine-d_final.pdf (accessed on 15 December 2019).
  41. Study on Orient/East-Med TEN-T Core Network Corridor. 2017. Available online: https://ec.europa.eu/transport/sites/transport/files/oemstudy2017_execsummary_en.pdf (accessed on 15 December 2019).
Figure 1. Scheme of methodology.
Sustainability 12 01482 g001
Figure 2. Scheme of the Orient–East Med (OEM) railway corridor.
Sustainability 12 01482 g002
Figure 3. Dendrograms of clusters of railway network in OEM corridor: (a) average linkage within groups; (b) complete linkage.
Sustainability 12 01482 g003
Table 1. Criteria for assessing the railway transport.
CriteriaDescription
TypeName
InfrastructuralC1Length of principal railway lines of the corridor in the country, km.
C2Length of diversionary railway lines of the corridor in the country, km.
C3Length of connecting railway lines of the corridor in the country, km.
C4Total length of railway lines of the corridor in the country, km.
C5Length of railway lines in the country, km.
C6Intensity of railway lines in the corridor representing the proportion of the total railway lines of the corridor in the country to the length of the railway lines in the country.
C7Length of single-track railway lines of the corridor in the country, km.
C8Length of single-track principal railway lines of the corridor in the country, km.
C9Intensity of single-track principal railway lines representing the proportion of the length of the single-track principal railway lines of the corridor in the country to the length of the principal railway lines in the corridor in the country.
C10Number of intermodal terminals.
C11Maximal technical speed, km/h.
C12ERTMS Level. This indicator can take values of 0, 1 or 2. C12 = 2 if the country has Level 2 of ERTMS; C12 = 1 if the country has Level 1 of ERTMS, C12 = 0 otherwise.
Economics C13GDP per capita, $.
C14Number of railway carriers.
TechnologicalC15 Passenger transport performance of the railway network, 1000 train-km/year. It is determined as the number of passenger train-km in thousands for the railway network per year.
C16Freight transport performance of the railway network, 1000 train-km/year. It is determined as the number of freight train-km in thousands for the railway network per year.
C17Level of utilization of the corridor by passengers. It represents the proportion of the number of passenger train-km realized by corridor in the country in thousands per year and the number of passenger train-km in thousands for the railway network per year.
C18Level of utilization of the corridor by freights. It is realized by the proportion of the number of freight train-km realized by corridor in the country in thousands per year and the number of freight train-km in thousands for the railway network per year.
C19Passenger transport performance for the corridor. It is determined as the number of passenger train-km realized by the corridor in thousands per year, 1000 train-km/year.
C20 Freight transport performance for the corridor. It is determined as the number of freight train-km realized by the corridor in thousands per year, 1000 train-km/year.
C21Corridor passenger usage intensity. It represents the proportion of the number of passenger train-km realized by corridor in thousands per year to the length of the corridor in the country, 1000 train.km/km per year.
C22Corridor freight usage intensity. It represents the proportion of the number of freight train-km realized by corridor in thousands per year to the length of the corridor in the country, 1000 train-km/km per year.
Table 2. Initial matrix.
CriteriaGermanyCzech Republic AustriaSlovakiaHungaryRomania BulgariaGreece
DECZATSKHYROBGEL
C11351.70616.70170.80289.90491.001387.90767.70680.40
C20.00195.000.00136.40320.50817.20700.80495.50
C30.00194.00132.1092.0012.400.000.0069.60
C41351.701005.70302.90518.30823.902205.101468.501245.50
C538,594.009567.005527.003526.007945.0010,774.004030.002240.00
C60.040.110.030.140.100.200.360.56
C7119.500.0088.10244.10327.00784.20980.90841.50
C80.000.0014.0056.40151.50428.90451.40285.00
C90.000.000.080.190.310.310.590.42
C108.006.001.001.003.003.002.003.00
C11200.00160.00160.00160.00160.00120.00160.00100.00
C122.002.002.001.001.001.001.001.00
C1349.6924.3952.4820.5916.9112.679.5020.90
C1463.0094.0041.0050.0043.0024.0012.001.00
C15923,618.00123,339.0095,600.0034,590.0083,952.5054,868.0020,904.009990.00
C16298,951.0036,503.0043,936.0014,673.0023,818.0017,998.207658.00838.00
C170.000.170.060.180.340.230.570.53
C180.010.220.080.230.520.390.570.78
C191361.0020,882.006082.006093.0028,272.3012,557.0012,000.005290.00
C202261.008096.883438.003311.009277.609390.004360.00653.00
C211.0120.7635.6111.7634.325.698.174.25
C221.678.0520.136.3911.264.262.970.52
The maximum values of the criteria are shown in bold
Table 3. Normalized matrix using the Sum Method.
DECZATSKHYROBGELActionOperatorLimit
Criteriax1x2x3x4x5x6x7x8
C10.230.110.030.050.090.240.130.12max0.24
C20.000.070.000.050.120.310.260.19max0.31
C30.000.390.260.180.020.000.000.14max0.39
C40.150.110.030.060.090.250.160.14max0.25
C50.470.120.070.040.100.130.050.03max0.47
C60.030.070.020.090.060.130.230.36max0.36
C70.040.000.030.070.100.230.290.25min0.00
C80.000.000.010.040.110.310.330.21min0.00
C90.000.000.040.100.160.160.310.22min0.00
C100.300.220.040.040.110.110.070.11max0.30
C110.160.130.130.130.130.100.130.08max0.16
C120.180.180.180.090.090.090.090.09max0.18
C130.240.120.250.100.080.060.050.10max0.25
C140.190.290.130.150.130.070.040.00max0.29
C150.690.090.070.030.060.040.020.01max0.69
C160.670.080.100.030.050.040.020.00max0.67
C170.000.080.030.080.160.110.280.25max0.28
C180.000.080.030.080.180.140.200.28max0.28
C190.010.230.070.070.310.140.130.06max0.31
C200.060.200.080.080.230.230.110.02max0.23
C210.010.170.290.100.280.050.070.03max0.29
C220.030.150.360.120.200.080.050.01max0.36
Table 4. Efficient Results Matrix (ERM).
Objective DECZATSKHYROBGELObjective Function Value
Z10.630.000.000.000.000.610.000.000.30
Z20.000.000.000.000.000.450.820.000.35
Z30.001.000.000.000.000.000.000.000.53
Z40.000.430.000.000.000.480.070.580.27
Z51.000.000.000.000.000.000.000.000.47
Z60.500.000.000.000.000.000.000.990.37
Z70.000.000.000.000.000.000.000.000.00
Z80.000.000.000.000.000.000.000.000.00
Z90.000.000.000.000.000.000.000.000.00
Z101.000.000.000.000.000.000.000.000.30
Z110.000.000.001.440.000.000.560.000.26
Z120.000.810.440.000.000.000.000.000.23
Z130.000.001.000.000.000.000.000.000.25
Z140.000.750.000.500.000.000.000.000.29
Z151.000.000.000.000.000.000.000.000.69
Z161.000.000.000.000.000.000.000.000.67
Z170.000.000.110.000.000.000.970.280.34
Z180.040.000.000.000.500.460.000.570.32
Z190.000.000.000.000.990.000.000.350.32
Z200.000.050.010.000.630.740.000.000.33
Z210.000.000.680.000.570.000.000.000.36
Z220.000.001.000.000.000.000.000.000.36
Z1–Z22 are the objectives equivalent to criteria C1–C22, when the latter are used as objective functions in the SIMUS model
Table 5. Normalized Efficient Results Matrix.
ObjectiveDECZATSKHYROBGEL
Z10.510.000.000.000.000.490.000.00
Z20.000.000.000.000.000.360.640.00
Z30.001.000.000.000.000.000.000.00
Z40.000.280.000.000.000.310.050.37
Z51.000.000.000.000.000.000.000.00
Z60.340.000.000.000.000.000.000.66
Z70.000.000.000.000.000.000.000.00
Z80.000.000.000.000.000.000.000.00
Z90.000.000.000.000.000.000.000.00
Z101.000.000.000.000.000.000.000.00
Z110.000.000.000.720.000.000.280.00
Z120.000.650.350.000.000.000.000.00
Z130.000.001.000.000.000.000.000.00
Z140.000.600.000.400.000.000.000.00
Z151.000.000.000.000.000.000.000.00
Z161.000.000.000.000.000.000.000.00
Z170.000.000.080.000.000.000.710.21
Z180.030.000.000.000.320.290.000.36
Z190.000.000.000.000.740.000.000.26
Z200.000.030.010.000.440.520.000.00
Z210.000.000.550.000.450.000.000.00
Z220.000.001.000.000.000.000.000.00
SC 4.872.562.991.121.951.971.681.87
PF75624545
NPF0.320.230.270.090.180.230.180.23
SC x NPF1.550.580.820.100.350.450.310.42
Ranking DE – AT – CZ – RO – EL – HY – BG – SK
SC = Sum of all scores in each column, PF = Participation Factor, or how many times each alternative satisfies each objective, NPF = Normalized Participation Factor, obtained as a ratio between the PF and total number of objectives
In bold are presented the most important objectives; they have value 1 in the table.
Table 6. Weights of objectives by using the Sequential Interactive Modelling for Urban Systems (SIMUS) method.
Main GroupObjective max j N E R M i j w i S I M U S k = 1 K w i k S I M U S w g k S I M U S K w ¯ g S I M U S SIMUS Main Group Weigh
w g S I M U S
InfrastructuralZ10.510.04 0.08
Z20.640.05 0.10
Z31.000.07 0.15
Z40.370.03 0.06
Z51.000.07 0.15
Z60.660.05 0.10
Z70.000.00 0.00
Z80.000.00 0.00
Z90.000.00 0.00
Z101.000.07 0.15
Z110.720.05 0.11
Z120.650.050.480.10120.040.28
EconomicZ131.000.07 0.72
Z140.400.030.100.2820.050.36
TechnologicalZ151.000.07 0.17
Z161.000.07 0.17
Z170.710.05 0.12
Z180.360.03 0.06
Z190.740.05 0.13
Z200.440.03 0.08
Z210.550.04 0.09
Z221.000.070.420.1780.050.37
Total 13.751.001.003.00220.141.00
In bold are presented the more significant objectives.
Table 7. Upper (U) and lower (L) limits for the criteria.
CriteriaDECZATSKHYROBGEL
C1U2313.171050.05704.56848.36974.822205.11241.56911.57
L903.870.000.000.000.00822.150.000.00
C2U 449.15396.6980.48237.46398.731052.322048.35610.41
L0.000.000.000.000.00279.58579.900.00
C3U 175.536542.40162.4398.7894.6183.376.1597.00
L0.00181.250.000.000.000.000.002.06
C4U 1639.901192.71373.44520.61893.682226.091536.171484.44
L0.001000.320.000.000.002018.121443.981230.45
C5U 109,851.0114,743.1015,334.7913,005.3813,270.0723,156.412,446.967465.06
L17,956.660.000.000.000.007028.660.000.00
C6U 1.120.180.080.1850.380.290.423.89
L0.010.000.0000.000.000.000.47
C7U
L0.000.0084.38200.410.00327622.35443.03
C8U 18.9823.74
L0.000.000.0033.2554.2554.25103.2573.5
C9U 0.040.56
L0.000.000.010.040.100.000.320.20
C10U 16.006.006.006.006.003.005.004.00
L7.005.000.000.000.000.000.003.00
C11U 320.00320.00320.00160.00160.00160.00296.00160.00
L0.000.000.001600.000.001600.00
C12U 2.002.002.002.002.001.002.001.00
L0.002.002.000.000.000.000.000.00
C13U 52.4850.65280.8725.6826.42125.3625.1624.79
L42.150.0049.690.000.000.000.000.00
C14U 95.00100.0094.0094.0050.0048.0050.0047.00
L0.0050.000.0047.000.000.000.000.000
C15U 1,232,974.60138,751.90160,763.6074,105.39738,894.493,523.6853,331.4521,639.97
L693,356.920.000.000.0067,132.280.000.000.00
C16U 424,477.8352,354.14239,160.825,420.8940,401.2627,843.8821,267.5112,359.00
L54,920.000.0038,749.110.000.000.000.000.00
C17U 0.050.210.380.180.370.560.760.71
L0.000.000.060.000.000.000.520.49
C18U 0.040.270.100.260.520.600.860.80
L0.0060.000.000.000.4990.3570.000.769
C19U 6368.0223,663.609975.5010,277.3775,158.5128,049.5014,739.3114,373.17
L0.000.000.000.0025,161.890.000.001989.93
C20U 5413.098353.426029.174334.2310,592.9618,508.858148.215424.49
L0.007206.922405.860.008841.938206.800.000.00
C21U 41.1033.8557.7333.6135.6125.1333.1120.50
L0.000.0034.320.0024.700.000.000.00
C22U 12.2310.2520.167.4417.989.194.015.95
L0.000.0016.610.0011.204.250.000.00
In bold are the criteria with small limits to the upper values.
Table 8. Cluster Membership by K-mean Cluster Analysis.
Country CodeDECZATSKHYROBGEL
Cluster12232333

