Quantifying Uncertainty in Machine Learning-Based Power Outage Prediction Model Training: A Tool for Sustainable Storm Restoration

 ,
,
Abstract
:1. Introduction
2. Materials
2.1. Weather
- Maximum values during the storm event for selected variables (MaxWind10m, MaxGust, MaxPreRate, MaxSoilMst, MaxTemp, MaxSpecHum, and MAXAbsVor);
- Mean values of selected variables calculated for a 4-h window centered on the highest sustained winds during the event (MeanWind10m, MeanGust, MeanPreRate, MeanSoilMst, and MeanTemp);
- Duration (in hours) of sustained winds at a height of 10 m exceeding 5 m/s and 9 m/s (wgt5 and wgt9);
- Duration (in hours) of wind gusts above 13 m/s (ggt13);
- Continuous duration of sustained winds at a height of 10 m exceeding 5 m/s and 9 m/s (Cowgt5 and Cowgt9).
2.2. Utility Infrastructure
2.3. Land Cover
2.4. Vegetation
2.5. Historical Power Outages
3. Outage Prediction Model
4. Methods
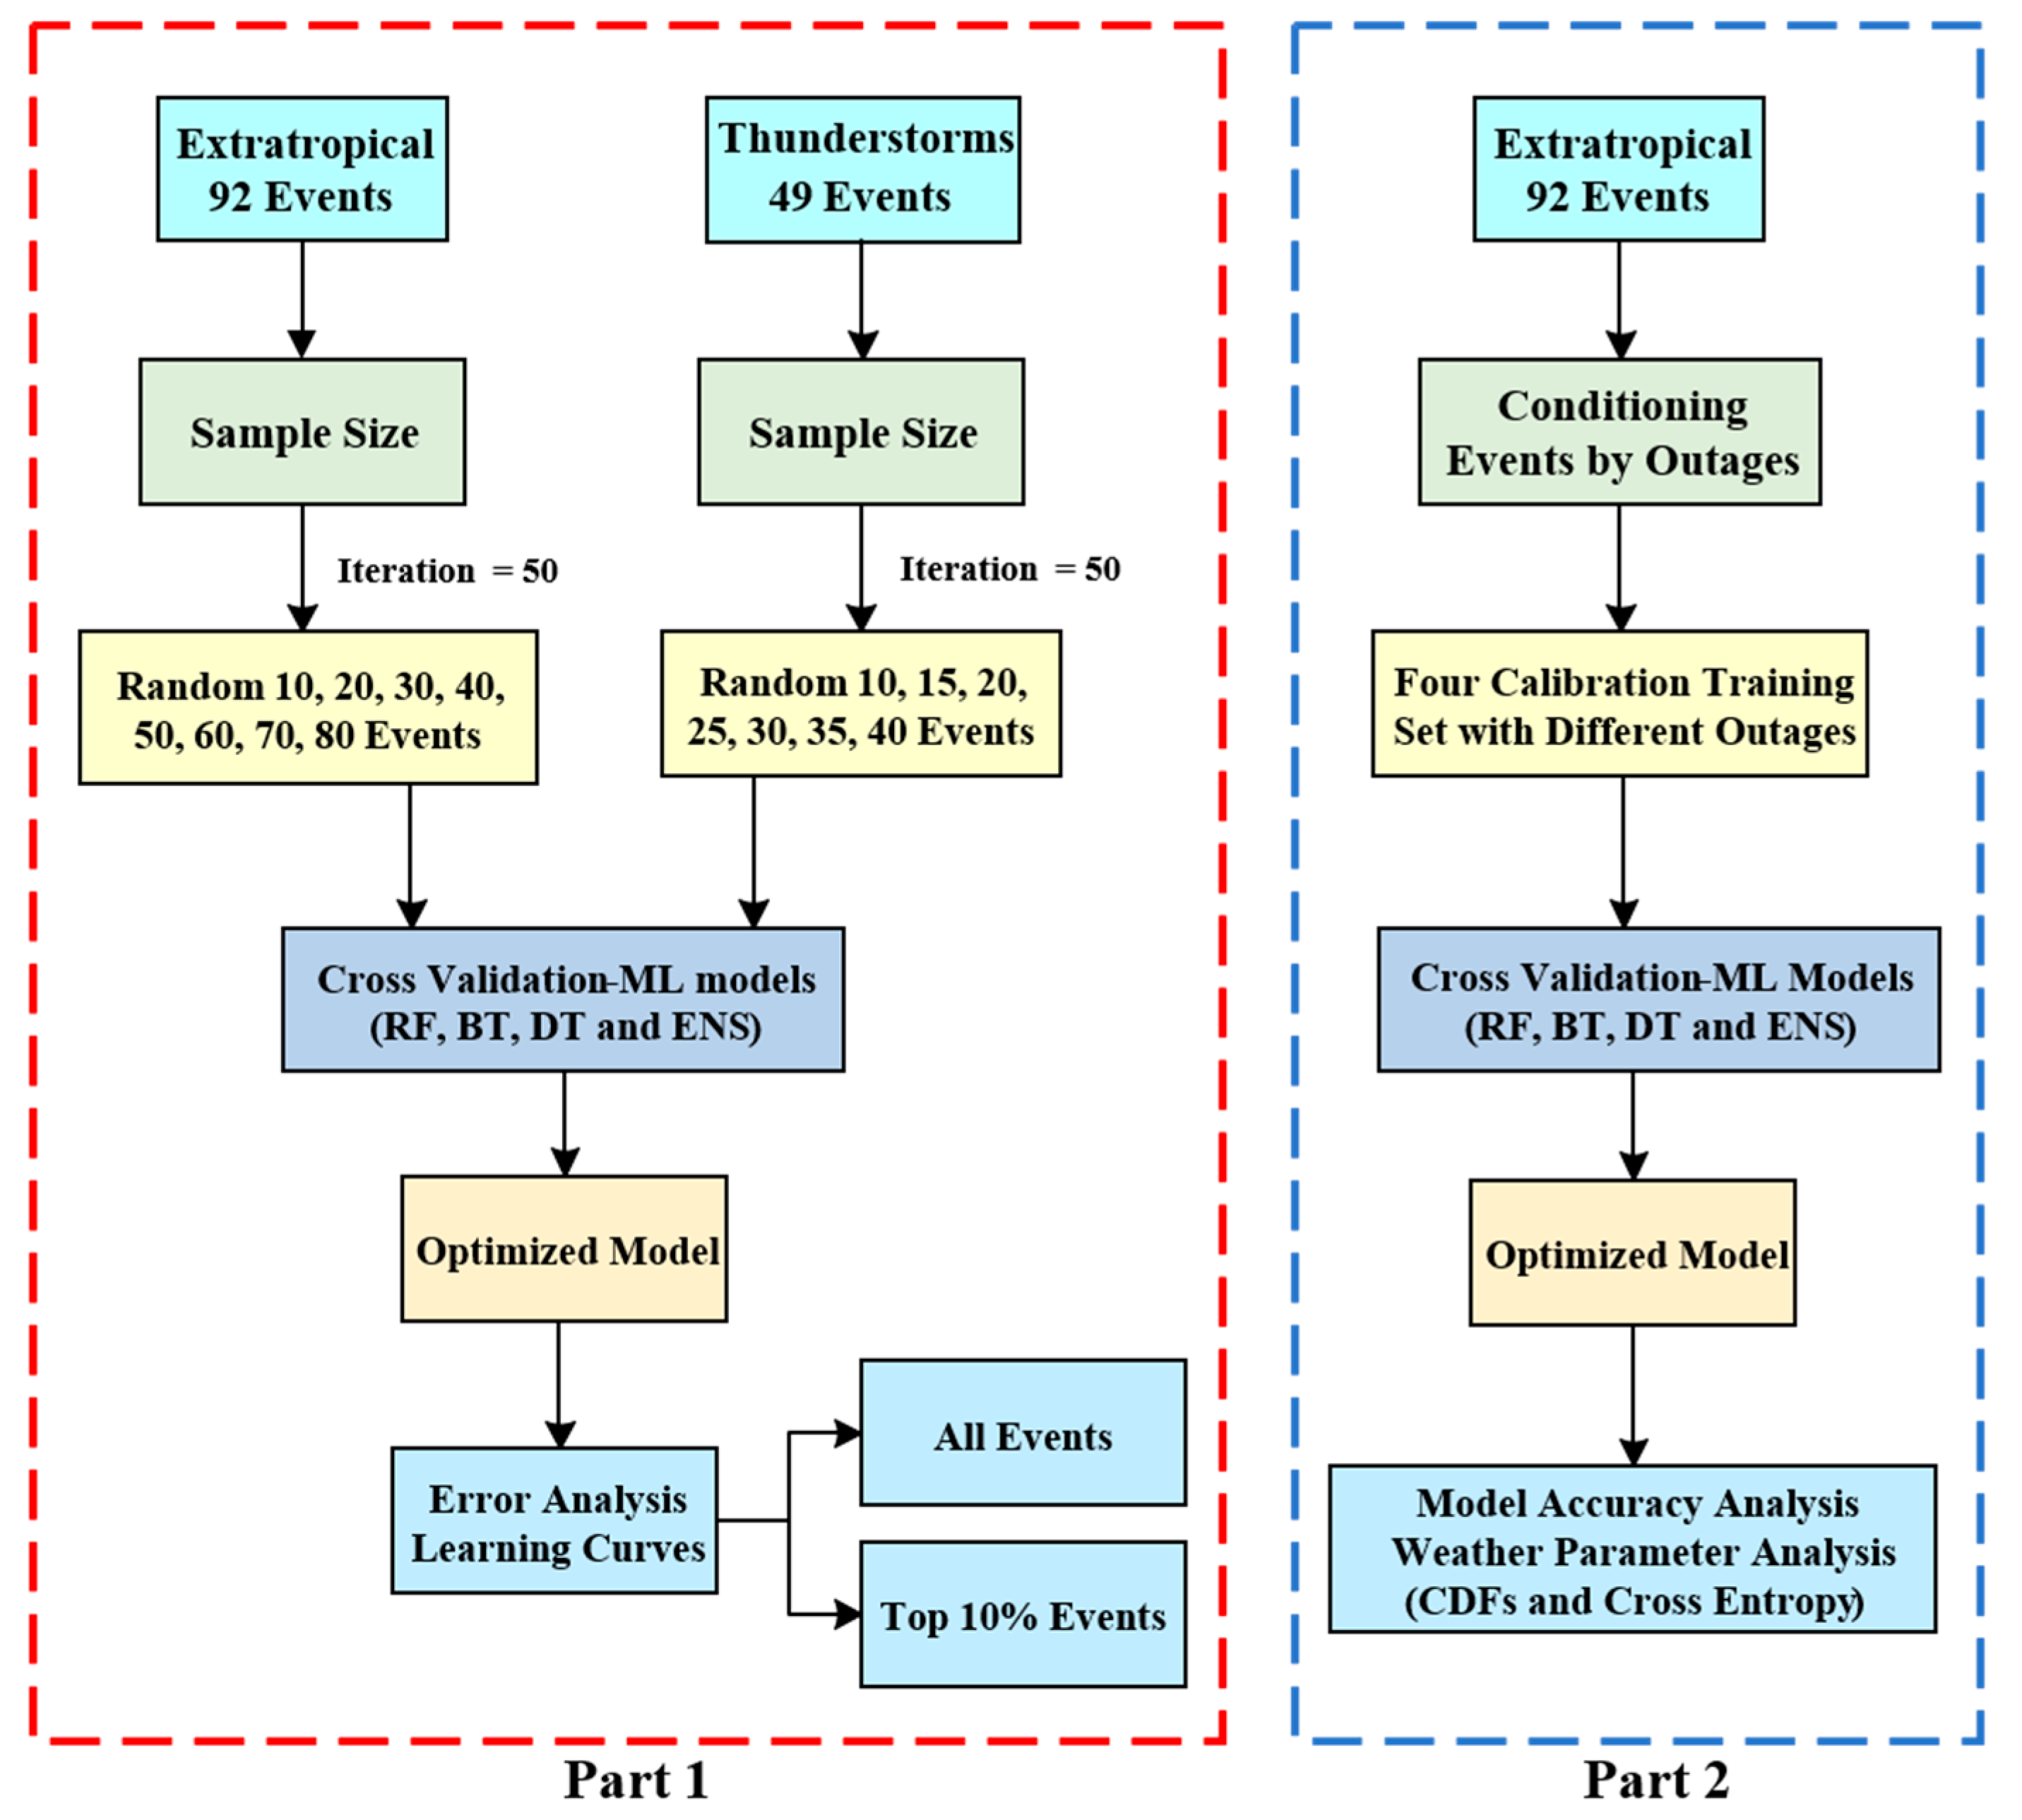
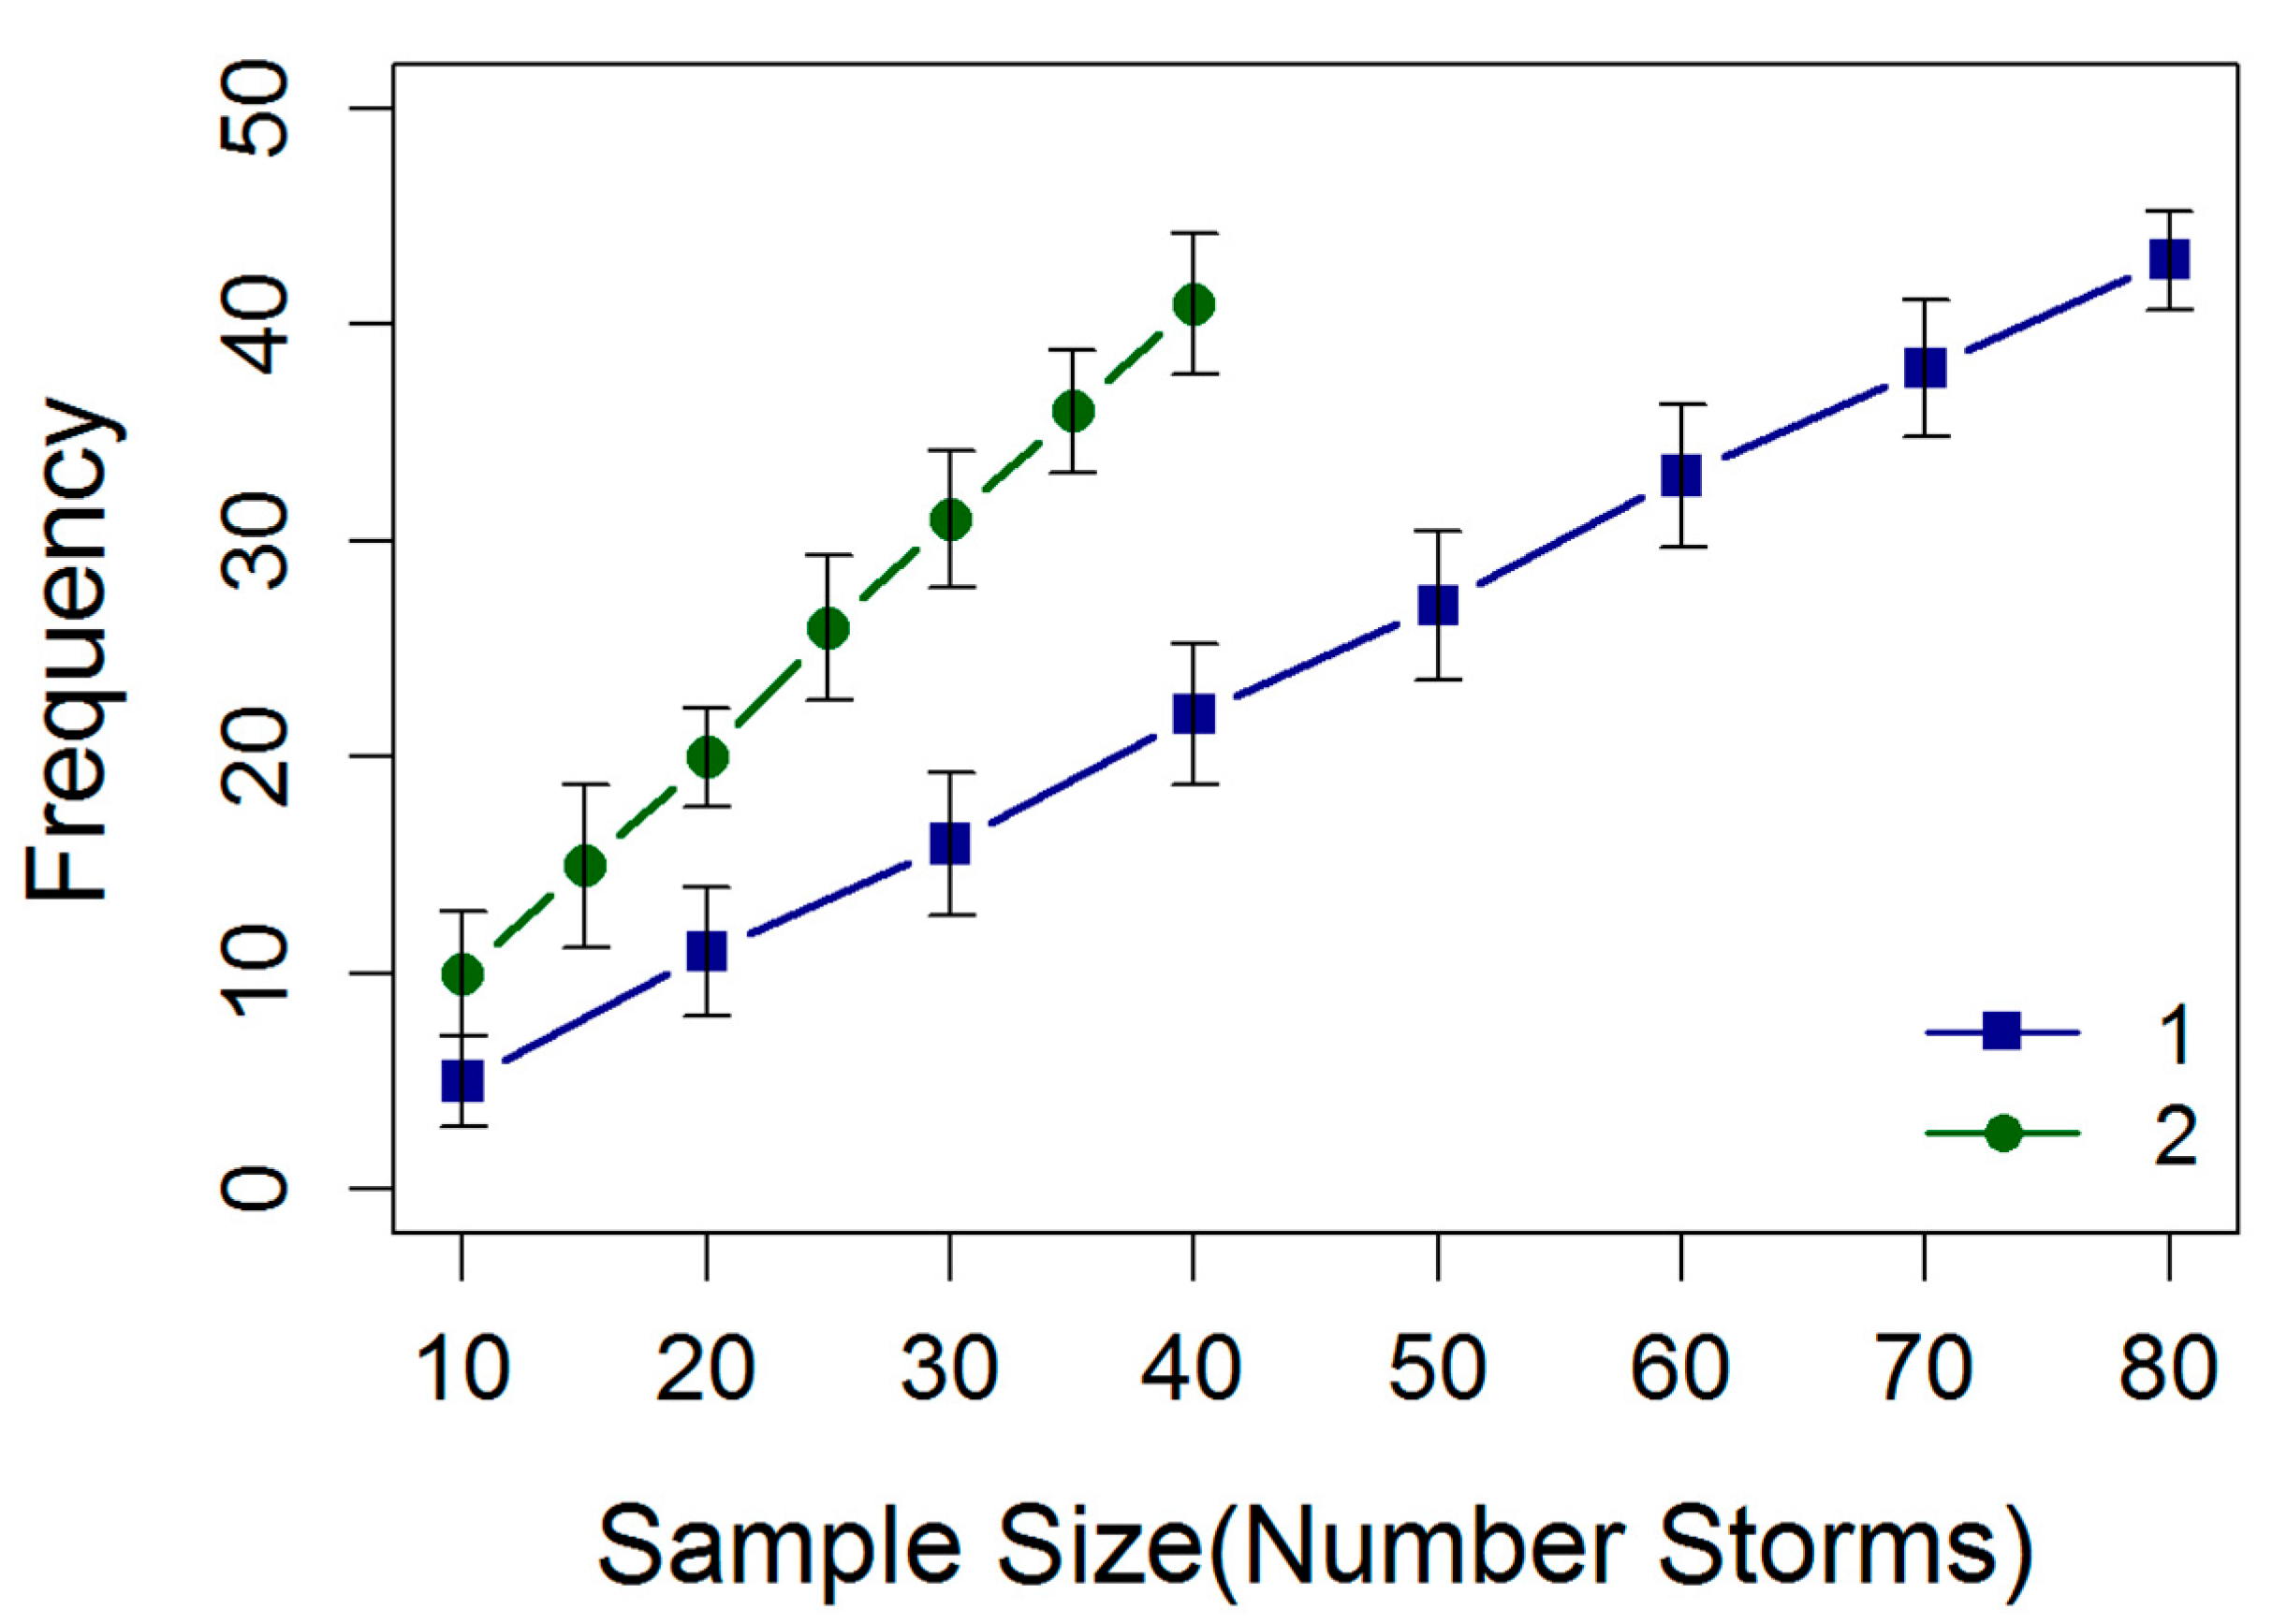
4.1. Experiment
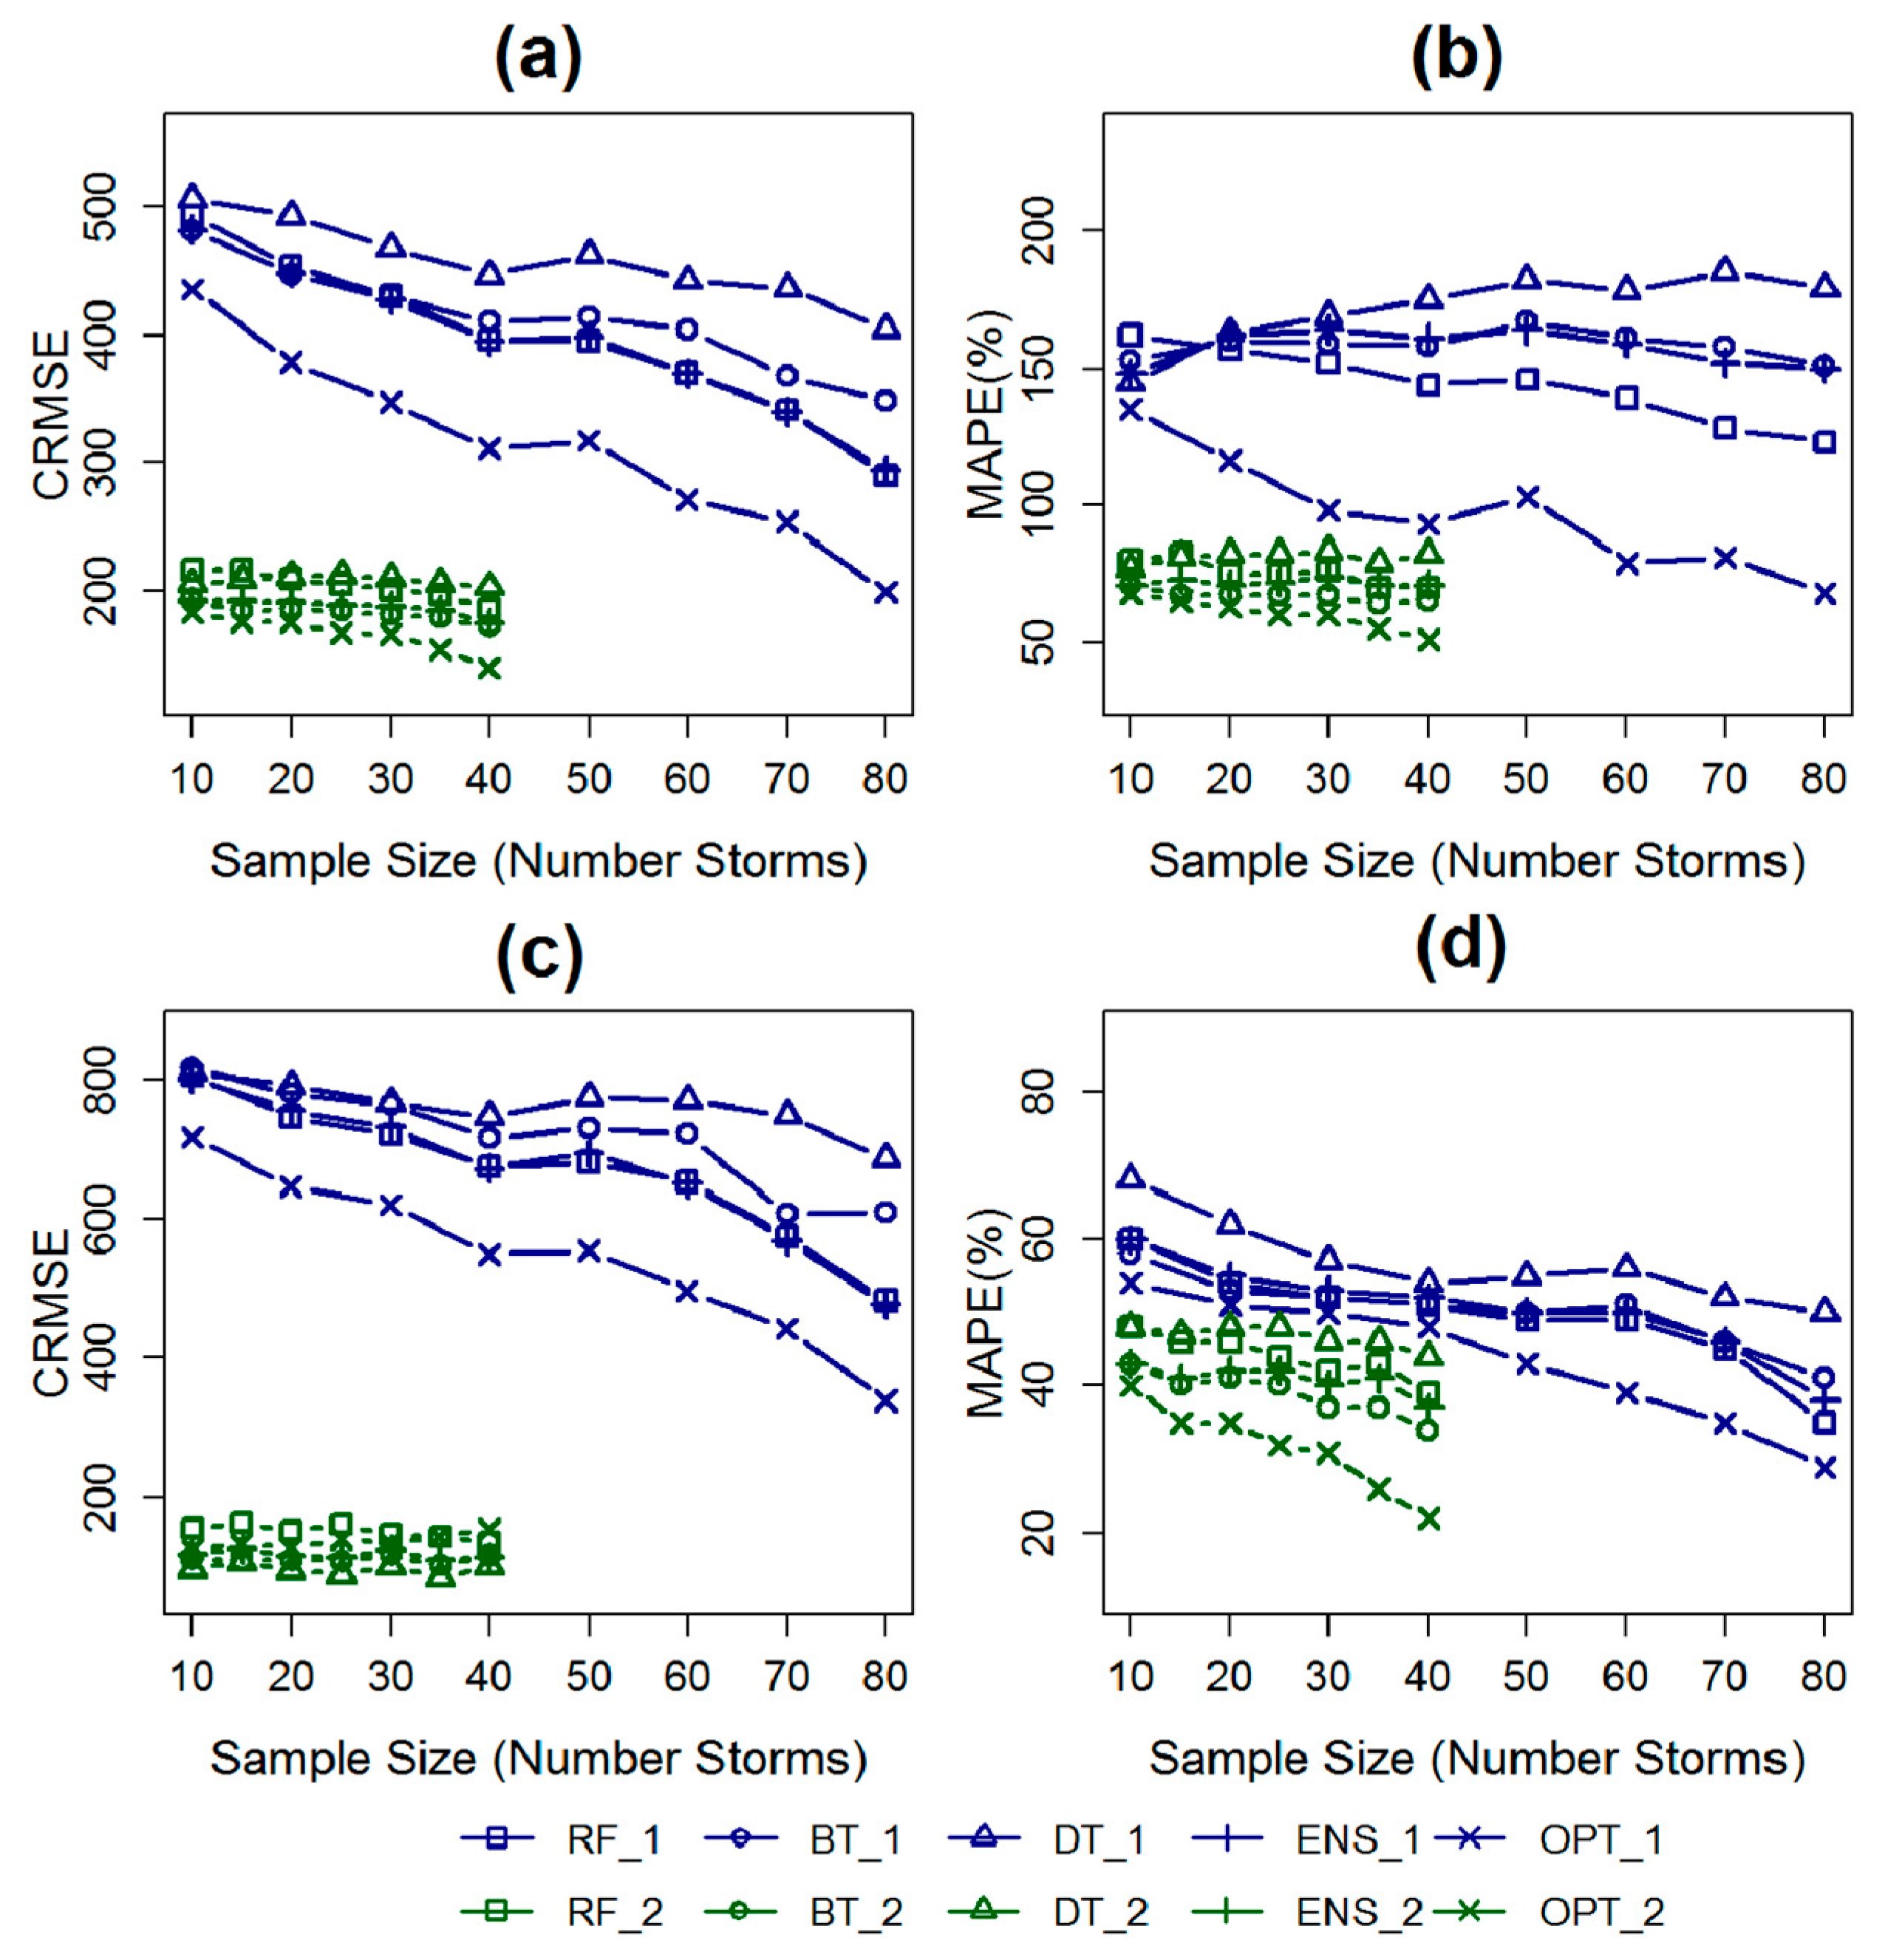
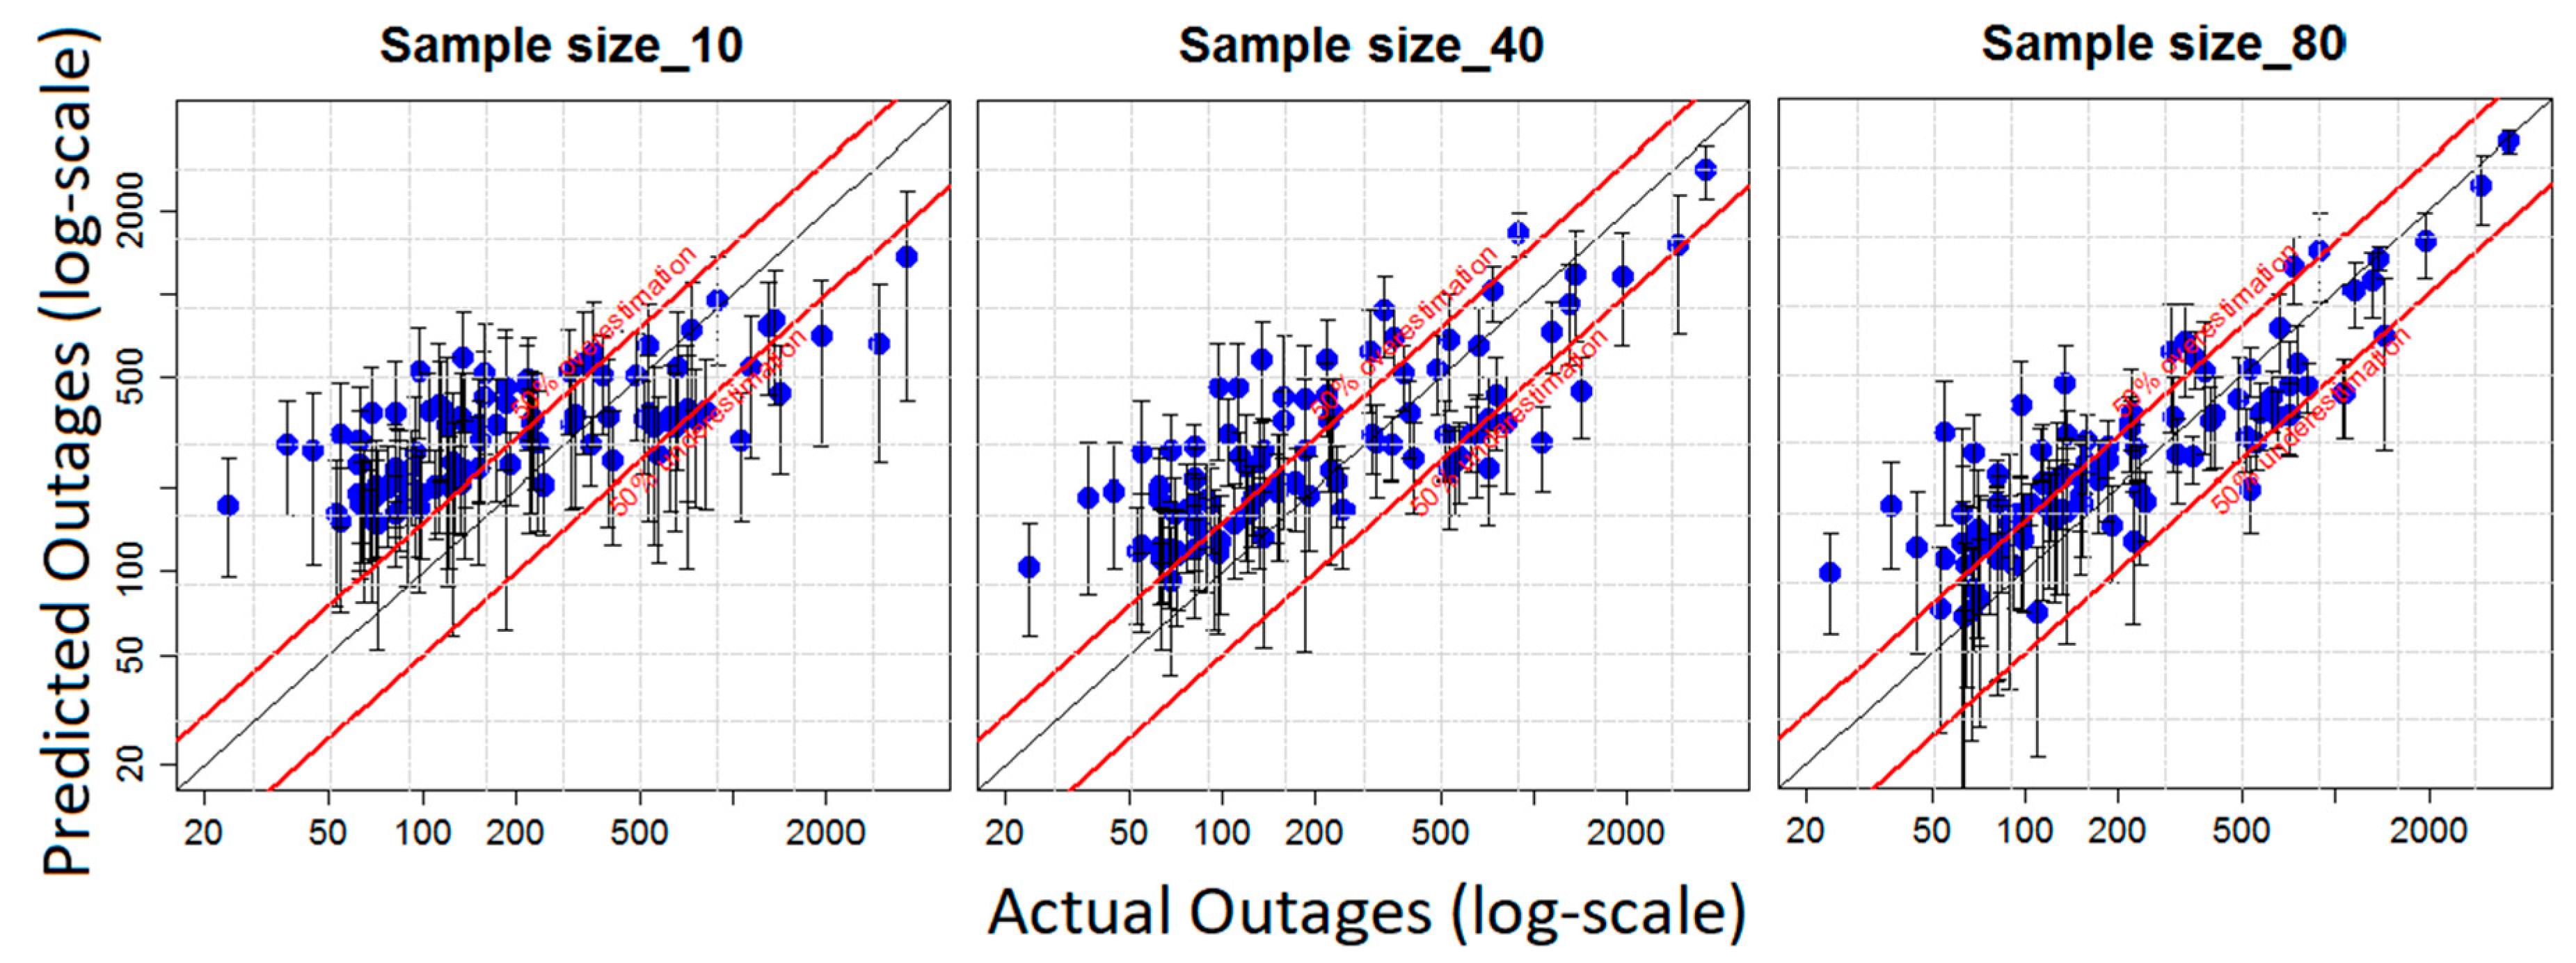
4.2. Evaluation Metrics
5. Results and Discussions
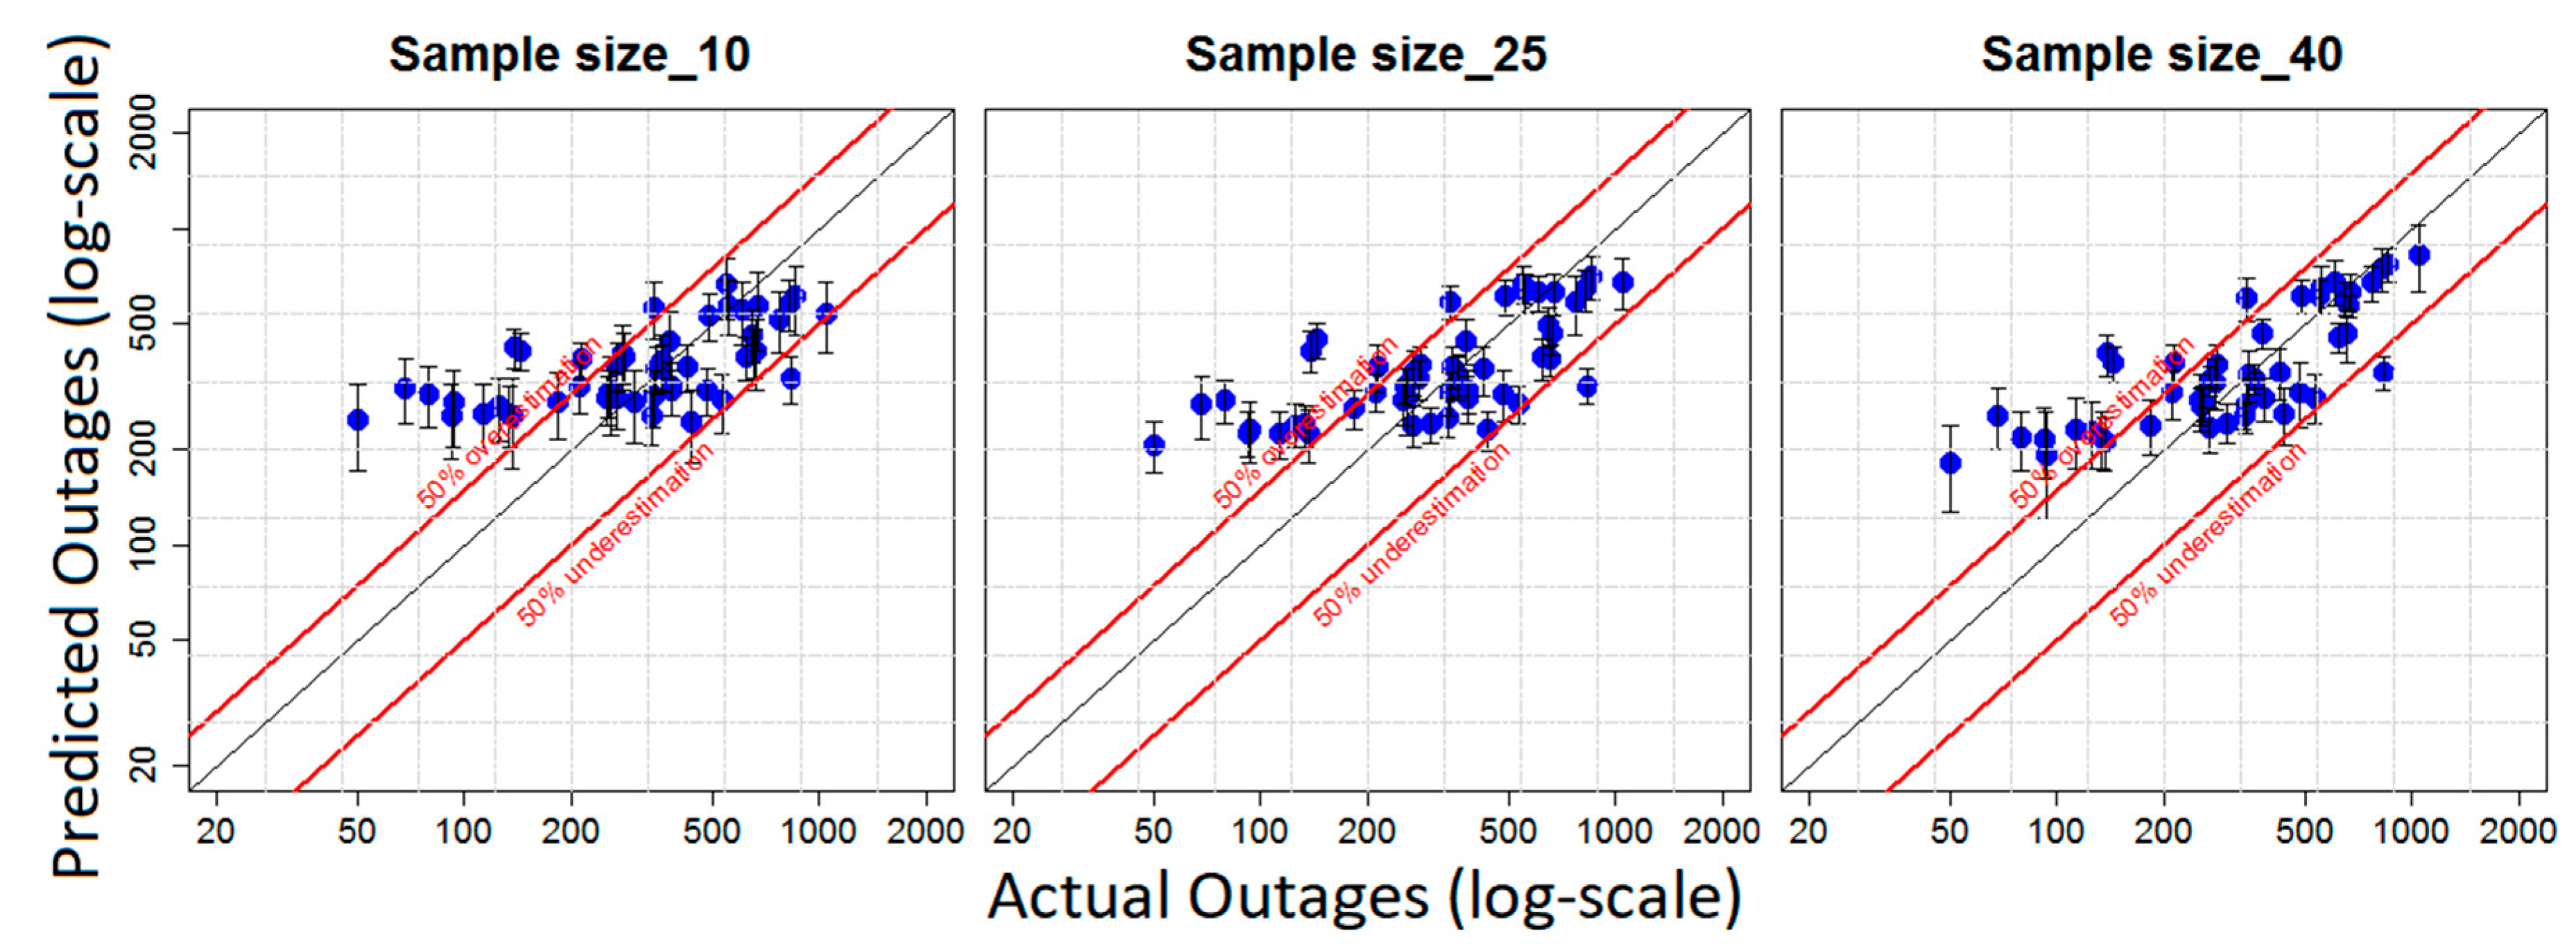
5.1. Part One: Quantify the Uncertainty of the OPM Associated with Varying Sample Sizes
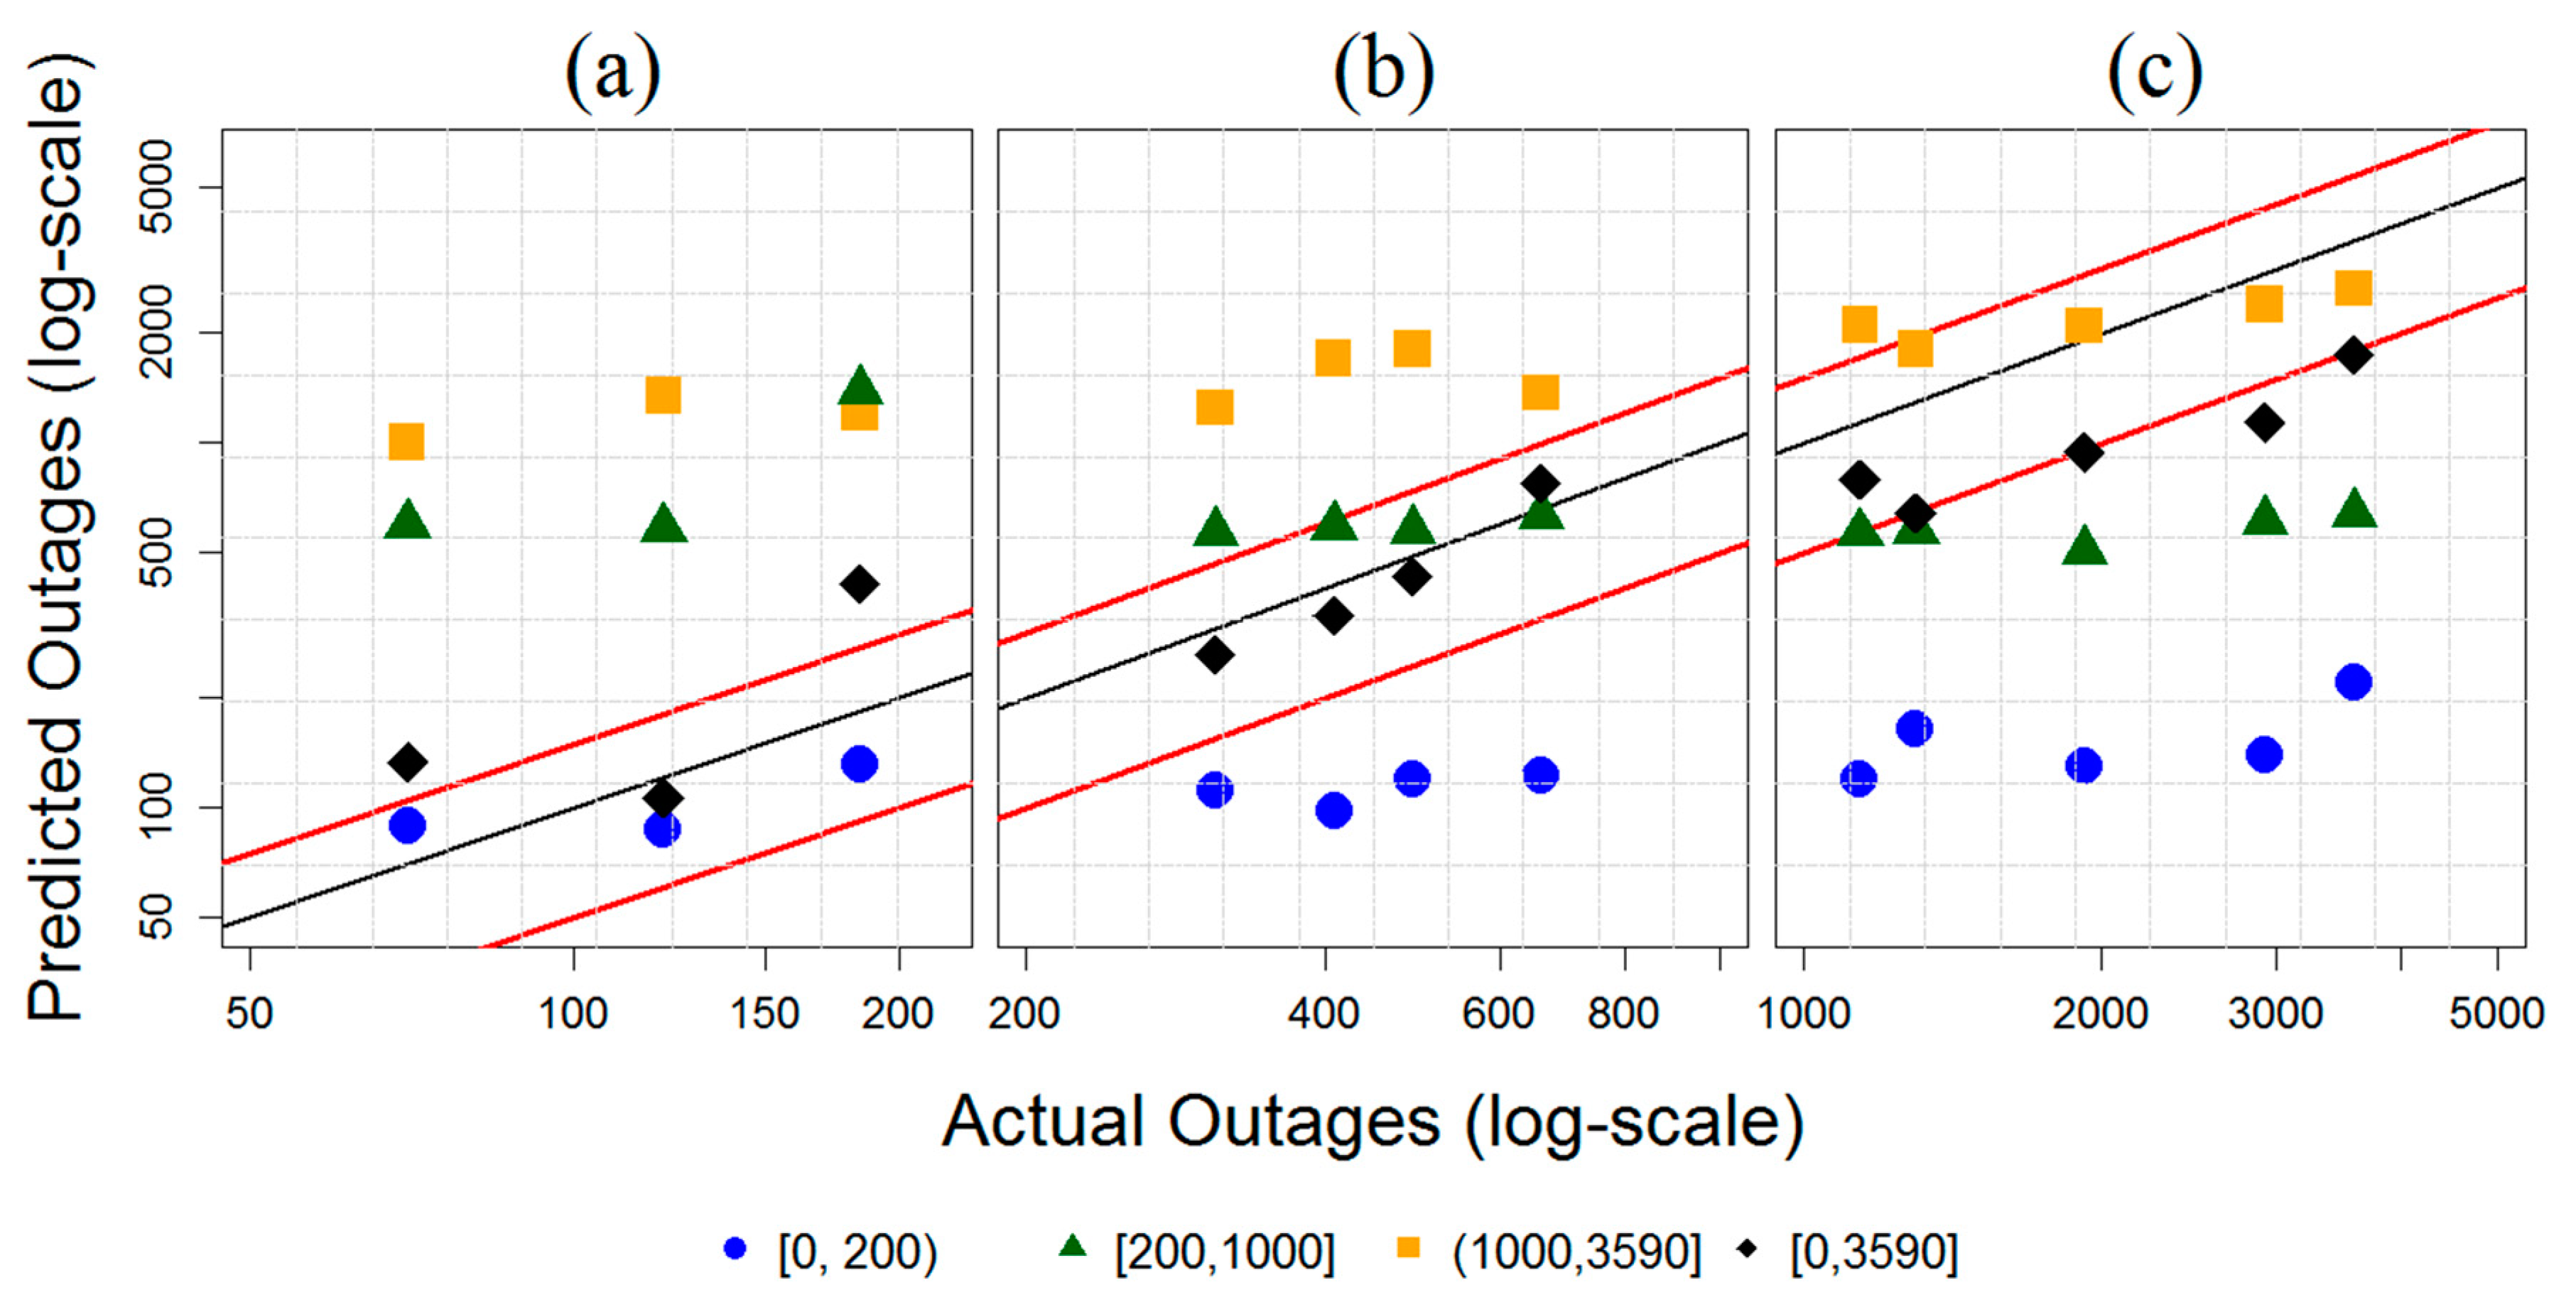
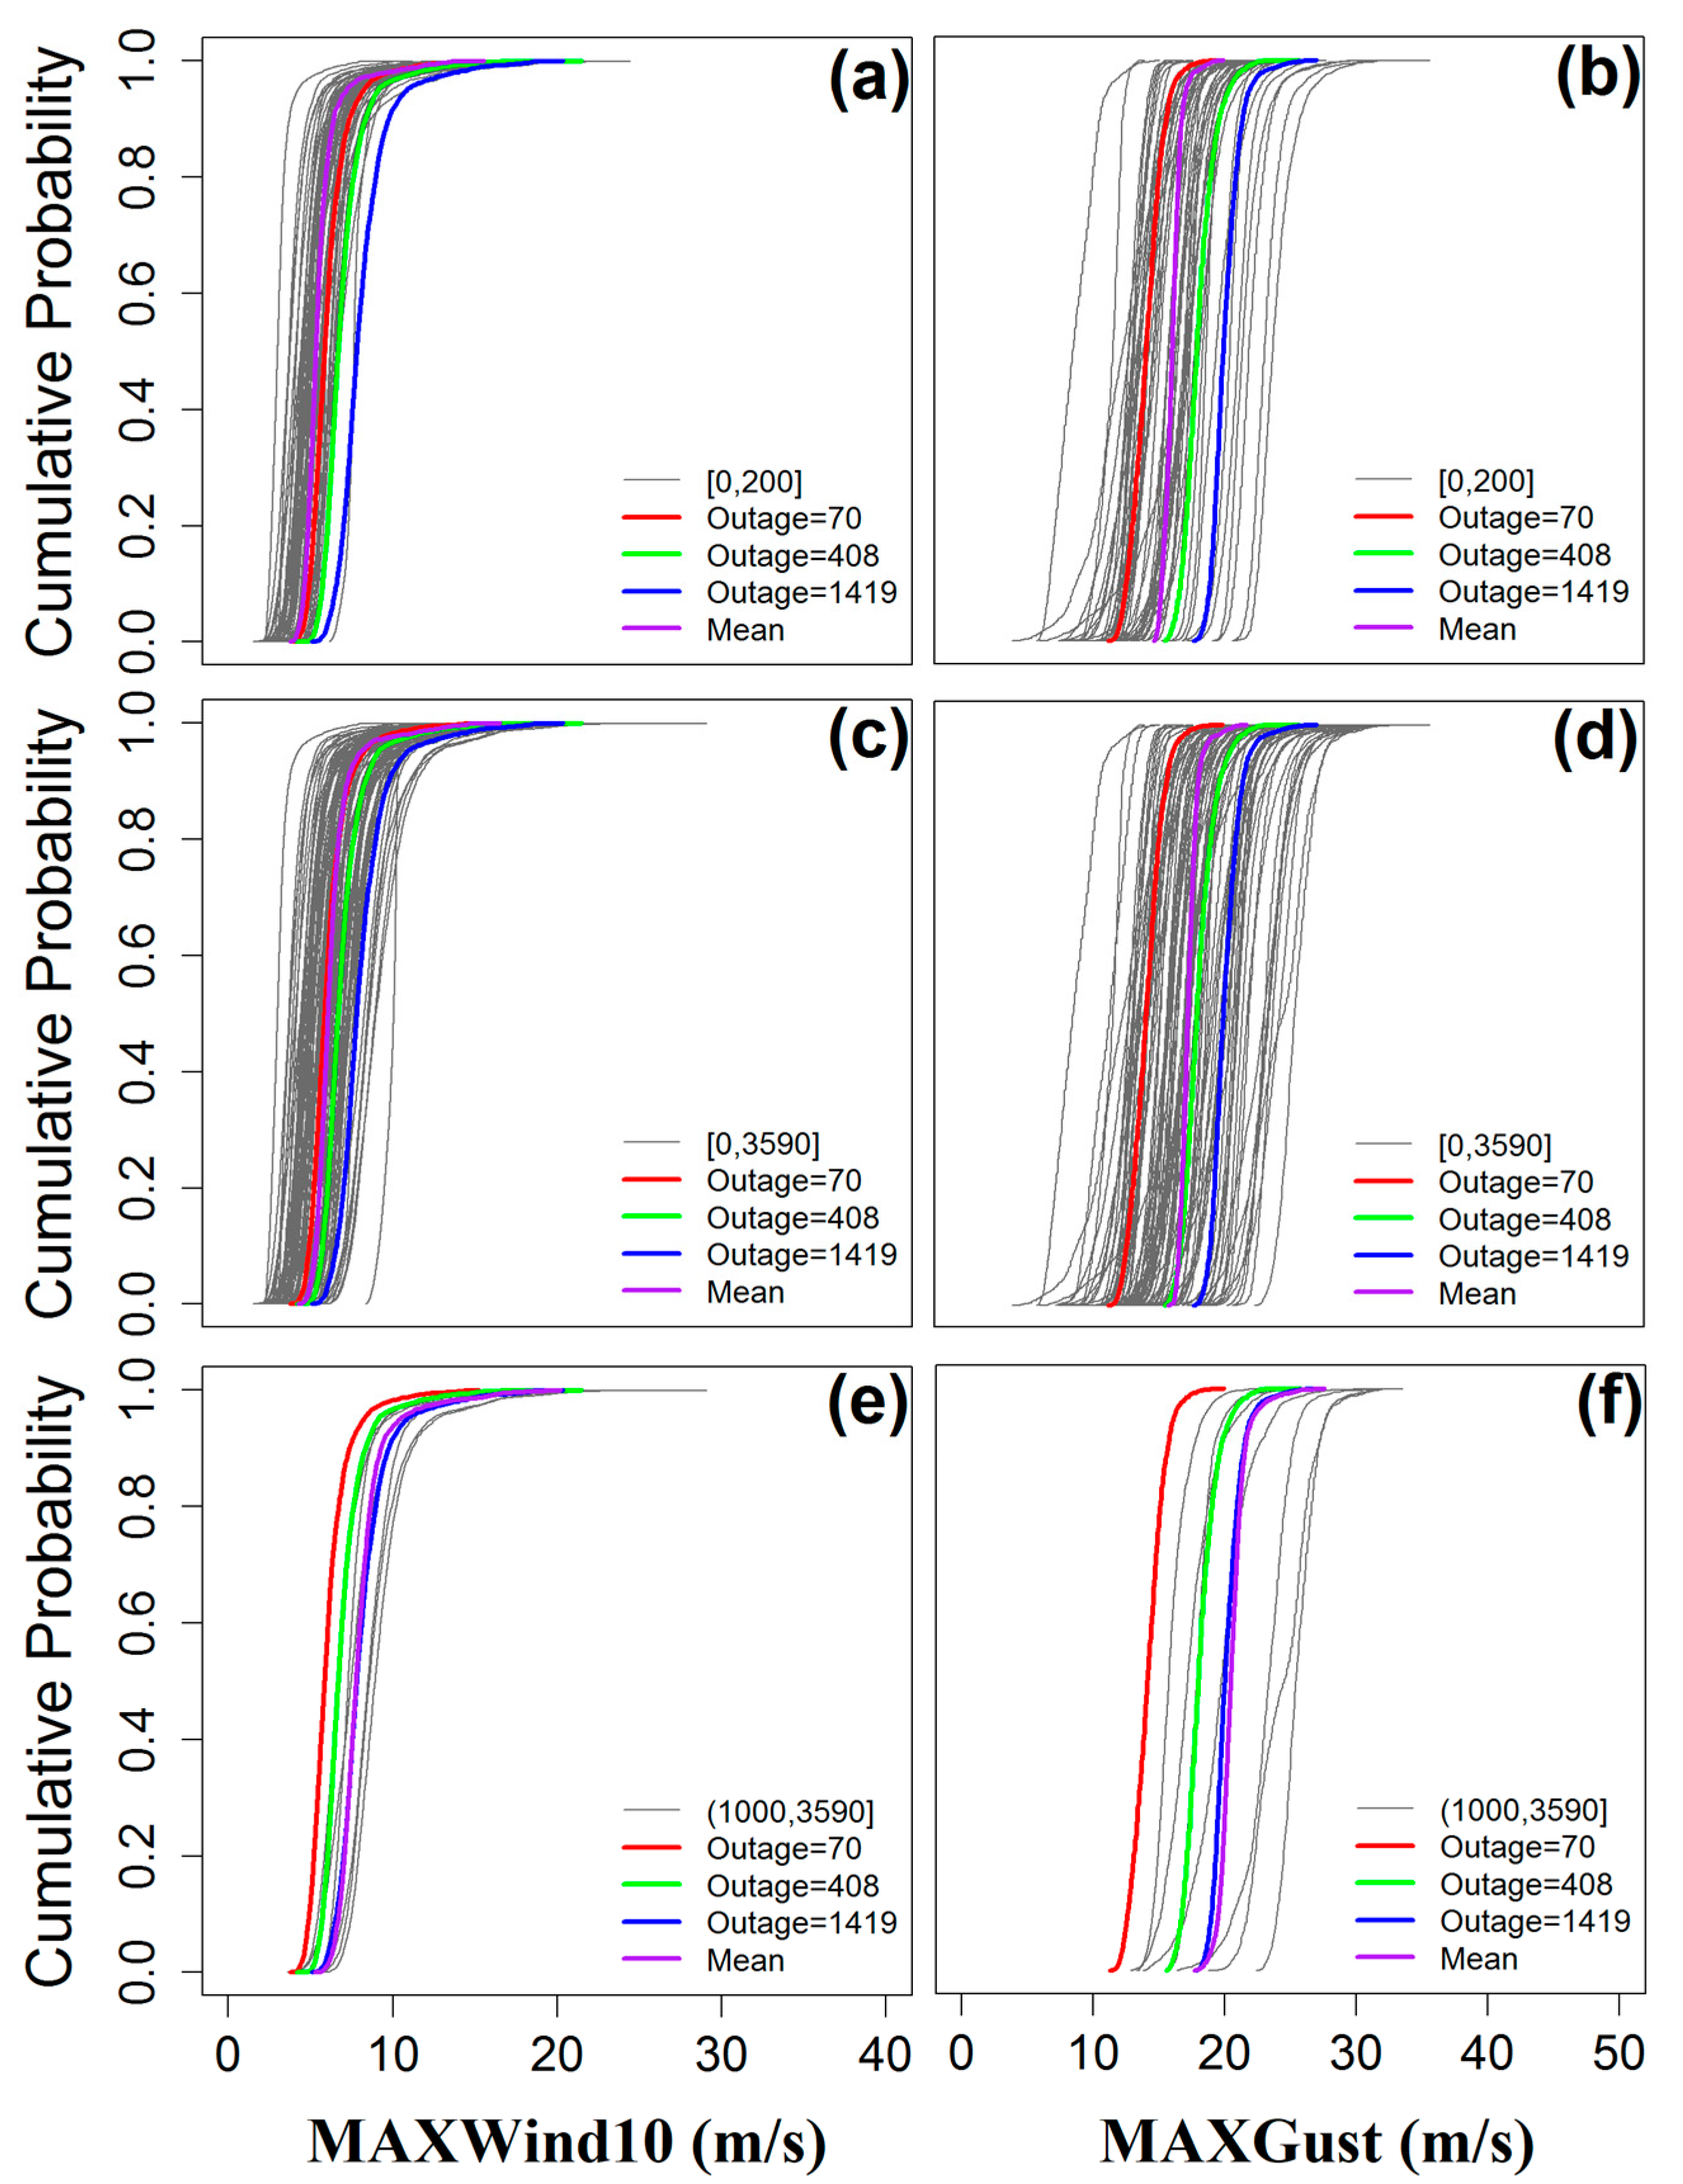
5.2. Part Two: Sub-setting the Training Dataset to Events Representative of the Severity of the Predicted Event
6. Conclusions
Author Contributions
Funding
Acknowledgments
Conflicts of Interest
References
- Executive Office of the President. Economic Benefits of Increasing Electric Grid Resilience to Weather Outage. August 2013. Available online: https://www.energy.gov/sites/prod/files/2013/08/f2/Grid%20Resiliency%20Report_FINAL.pdf (accessed on 17 February 2020).
- Han, S.R.; Guikema, S.D.; Quiring, S.M. Improving the predictive accuracy of hurricane power outage forecasts using generalized additive models. Risk Anal. Int. J. 2009, 29, 1443–1453. [Google Scholar] [CrossRef] [PubMed]
- Han, S.-R.; Guikema, S.D.; Quiring, S.M.; Lee, K.-H.; Rosowsky, D.; Davidson, R.A. Estimating the spatial distribution of power outages during hurricanes in the Gulf coast region. Reliabil. Eng. Syst. Saf. 2009, 94, 199–210. [Google Scholar] [CrossRef]
- Nateghi, R.; Guikema, S.; Quiring, S.M. Power outage estimation for tropical cyclones: Improved accuracy with simpler models. Risk Anal. 2014, 34, 1069–1078. [Google Scholar] [CrossRef] [PubMed]
- Guikema, S.D.; Nateghi, R.; Quiring, S.M.; Staid, A.; Reilly, A.C.; Gao, M. Predicting hurricane power outages to support storm response planning. IEEE Access 2014, 2, 1364–1373. [Google Scholar] [CrossRef]
- Wanik, D.; Anagnostou, E.; Hartman, B.; Frediani, M.; Astitha, M. Storm outage modeling for an electric distribution network in Northeastern USA. Nat. Hazards 2015, 79, 1359–1384. [Google Scholar] [CrossRef]
- He, J.; Wanik, D.W.; Hartman, B.M.; Anagnostou, E.N.; Astitha, M.; Frediani, M.E. Nonparametric Tree-Based Predictive Modeling of Storm Outages on an Electric Distribution Network. Risk Anal. 2017, 37, 441–458. [Google Scholar] [CrossRef]
- Cerrai, D.; Wanik, D.W.; Bhuiyan, M.A.E.; Zhang, X.; Yang, J.; Frediani, M.E.; Anagnostou, E.N. Predicting Storm Outages Through New Representations of Weather and Vegetation. IEEE Access 2019, 7, 29639–29654. [Google Scholar] [CrossRef]
- Figueroa, R.L.; Zeng-Treitler, Q.; Kandula, S.; Ngo, L.H. Predicting sample size required for classification performance. BMC Med. Inf. Decis. Mak. 2012, 12, 8. [Google Scholar] [CrossRef] [Green Version]
- Nuchitprasittichai, A.; Cremaschi, S. An algorithm to determine sample sizes for optimization with artificial neural networks. AIChE J. 2013, 59, 805–812. [Google Scholar] [CrossRef]
- Tang, X.-S.; Li, D.-Q.; Cao, Z.-J.; Phoon, K.-K. Impact of sample size on geotechnical probabilistic model identification. Comput. Geotech. 2017, 87, 229–240. [Google Scholar] [CrossRef]
- van Proosdij, A.S.; Sosef, M.S.; Wieringa, J.J.; Raes, N. Minimum required number of specimen records to develop accurate species distribution models. Ecography 2016, 39, 542–552. [Google Scholar] [CrossRef]
- Shashaani, S.; Guikema, S.D.; Zhai, C.; Pino, J.V.; Quiring, S.M. Multi-Stage Prediction for Zero-Inflated Hurricane Induced Power Outages. IEEE Access 2018, 6, 62432–62449. [Google Scholar] [CrossRef]
- Bhuiyan, M.A.E.; Nikolopoulos, E.I.; Anagnostou, E.N.; Quintana-Seguí, P.; Barella-Ortiz, A. A nonparametric statistical technique for combining global precipitation datasets: Development and hydrological evaluation over the Iberian Peninsula. Hydrol. Earth Syst. Sci. 2018, 22, 1371. [Google Scholar] [CrossRef] [Green Version]
- University of Connecticut Center for Land Use Education and Research (CLEAR), Connecticut′s Changing Landscape. Available online: http://clear.uconn.edu/projects/landscape/ (accessed on 17 February 2020).
- NASA EARTH OBSERVATIONS, LEAF AREA INDEX (8 DAY—TERRA/MODIS). Available online: https://neo.sci.gsfc.nasa.gov/view.php?datasetId=MOD15A2_E_LAI&date=2017-02-01 (accessed on 17 February 2020).
- Perlich, C. Learning curves in machine learning. In Encyclopedia of Machine Learning; Springer: Berlin/Heidelberg, Germany, 2011; pp. 577–580. [Google Scholar]
- Samala, R.K.; Chan, H.-P.; Hadjiiski, L.; Helvie, M.A.; Richter, C.D.; Cha, K.H. Breast Cancer Diagnosis in Digital Breast Tomosynthesis: Effects of Training Sample Size on Multi-Stage Transfer Learning using Deep Neural Nets. IEEE Trans. Med. Imaging 2019, 38, 686–696. [Google Scholar] [CrossRef]
- Kim, S.-J.; Giannakis, G.B. An online convex optimization approach to real-time energy pricing for demand response. IEEE Trans. Smart Grid 2017, 8, 2784–2793. [Google Scholar] [CrossRef]
- Perlich, C.; Provost, F.; Simonoff, J.S. Tree induction vs. logistic regression: A learning-curve analysis. J. Mach. Learn. Res. 2003, 4, 211–255. [Google Scholar]
- Vandael, S.; Claessens, B.; Ernst, D.; Holvoet, T.; Deconinck, G. Reinforcement learning of heuristic EV fleet charging in a day-ahead electricity market. IEEE Trans. Smart Grid 2015, 6, 1795–1805. [Google Scholar] [CrossRef] [Green Version]
- Ng, W.; Dash, M. An evaluation of progressive sampling for imbalanced data sets. In Proceedings of the Data Mining Workshops, 2006. ICDM Workshops 2006. Sixth IEEE International Conference on Data Mining, Hong Kong, China, 18–22 December 2006; IEEE: Piscataway, NJ, USA, 2006; pp. 657–661. [Google Scholar]
- He, K.; Zha, R.; Wu, J.; Lai, K.K. Multivariate EMD-based modeling and forecasting of crude oil price. Sustainability 2016, 8, 387. [Google Scholar] [CrossRef] [Green Version]
- Kearns, M.; Ron, D. Algorithmic stability and sanity-check bounds for leave-one-out cross-validation. Neural Comput. 1999, 11, 1427–1453. [Google Scholar] [CrossRef]
- Cawley, G.C. Leave-one-out cross-validation based model selection criteria for weighted LS-SVMs. In Proceedings of the 2006 IEEE International Joint Conference on Neural Network Proceedings, Vancouver, BC, Canada, 16–21 July 2006; IEEE: Piscataway, NJ, USA, 2006; pp. 1661–1668. [Google Scholar]
- Abbas, A.E.; Cadenbach, H.A.; Salimi, E. A Kullback–Leibler View of Maximum Entropy and Maximum Log-Probability Methods. Entropy 2017, 19, 232. [Google Scholar] [CrossRef] [Green Version]
- Gu, Y.; Wylie, B.K.; Boyte, S.P.; Picotte, J.; Howard, D.M.; Smith, K.; Nelson, K.J. An optimal sample data usage strategy to minimize overfitting and underfitting effects in regression tree models based on remotely-sensed data. Remote Sens. 2016, 8, 943. [Google Scholar] [CrossRef] [Green Version]
- Yu, L.; Lai, K.K.; Wang, S.; Huang, W. A bias-variance-complexity trade-off framework for complex system modeling. In Proceedings of the International Conference on Computational Science and Its Applications, Glasgow, UK, 8–11 May 2006; Springer: Berlin/Heidelberg, Germany, 2006; pp. 518–527. [Google Scholar]
- Cucker, F.; Smale, S. Best choices for regularization parameters in learning theory: On the bias-variance problem. Found. Comput. Math. 2002, 2, 413–428. [Google Scholar] [CrossRef] [Green Version]
- Doswell, C. Severe Convective Storms; Springer: Berlin/Heidelberg, Germany, 2015. [Google Scholar]
- Chen, P.-C.; Kezunovic, M. Fuzzy logic approach to predictive risk analysis in distribution outage management. IEEE Trans. Smart Grid 2016, 7, 2827–2836. [Google Scholar] [CrossRef]


| Variable | Description | Unit |
|---|---|---|
| wgt5 | Duration of wind at 10 m height above 5 m/s | hr |
| wgt9 | Duration of wind at 10 m height above 9 m/s | hr |
| Cowgt5 | Continuous hours of wind above 5 m/s | hr |
| Cowgt9 | Continuous hours of wind above 9 m/s | hr |
| ggt13 | Duration of wind gusts above 13 m/s | hr |
| MAXWind10m | Maximum wind at 10 m height | m/s |
| MEANWind10m | Mean wind at 10 m height | m/s |
| MAXGust | Maximum wind gust | m/s |
| MEANGust | Mean wind gust | m/s |
| MAXPreRate | Maximum precipitation rate | mm/hr |
| MEANPreRate | Mean precipitation rate | mm/hr |
| MAXSoilMst | Maximum soil moisture | mm/mm |
| MEANSoilMst | Mean soil moisture | mm/mm |
| MAXTemp | Maximum temperature | K |
| MEANTemp | Mean temperature | K |
| TotPrec | Total accumulated precipitation | mm |
| MAXSpecHum | Maximum specific humidity | kg/kg |
| MAXAbsVor | Maximum absolute vorticity | 10−5/s |
| PercConif | Percent of coniferous forest | % |
| PercDecid | Percent of deciduous forest | % |
| PercDeveloped | Percent of developed area | % |
| SumAssets | Count of assets | count |
| LAI | Leaf area index = leaf area / ground area | m2/m2 |
| Training Dataset | Outage Ranges in Training Dataset | Event Frequency in Calibration |
|---|---|---|
| Low severity events | [0, 200) | 53 |
| Moderate severity events | [200, 1000) | 31 |
| High severity events | [1000, 3590] | 8 |
| All events | [0, 3590] | 92 |
| Tested Events | Actual Outages | Min (m/s) | Max (m/s) | Mean (m/s) | Standard Deviation | P10 (m/s) | P25 (m/s) | P50 (m/s) | P75 (m/s) |
|---|---|---|---|---|---|---|---|---|---|
| Event 1 | 70 | 3.76 | 15.22 | 6.09 | 1.24 | 4.93 | 5.32 | 5.87 | 6.49 |
| Event 2 | 121 | 4.05 | 16.20 | 6.61 | 1.19 | 5.50 | 5.92 | 6.41 | 7.03 |
| Event 3 | 184 | 2.85 | 15.28 | 5.09 | 1.27 | 3.90 | 4.27 | 4.82 | 5.59 |
| Event 4 | 310 | 2.85 | 15.28 | 5.09 | 1.27 | 3.90 | 4.27 | 4.82 | 5.59 |
| Event 5 | 408 | 3.94 | 20.46 | 6.09 | 1.43 | 4.96 | 5.33 | 5.79 | 6.35 |
| Event 6 | 490 | 4.14 | 21.48 | 6.97 | 1.41 | 5.75 | 6.15 | 6.69 | 7.38 |
| Event 7 | 659 | 3.35 | 21.64 | 6.98 | 1.94 | 5.08 | 5.78 | 6.72 | 7.68 |
| Event 8 | 1141 | 3.98 | 20.13 | 7.51 | 1.56 | 6.10 | 6.65 | 7.25 | 7.93 |
| Event 9 | 1299 | 3.84 | 29.07 | 7.73 | 2.00 | 5.74 | 6.50 | 7.47 | 8.47 |
| Event 10 | 1921 | 3.56 | 22.26 | 6.96 | 1.65 | 5.47 | 6.00 | 6.65 | 7.46 |
| Event 11 | 2918 | 5.41 | 23.37 | 9.00 | 2.03 | 7.24 | 7.80 | 8.58 | 9.59 |
| Event 12 | 3590 | 5.39 | 22.54 | 9.31 | 2.03 | 7.51 | 8.09 | 8.93 | 9.92 |
| Sample Size | AE q25 | AE q50 | AE q75 | MAPE | CRMSE | R2 | NASH |
|---|---|---|---|---|---|---|---|
| 10 | 98 | 152 | 270 | 135% | 435 | 0.55 | 0.39 |
| 20 | 76 | 125 | 269 | 116% | 379 | 0.61 | 0.54 |
| 30 | 58 | 113 | 278 | 98% | 347 | 0.65 | 0.61 |
| 40 | 55 | 116 | 284 | 93% | 311 | 0.71 | 0.69 |
| 50 | 63 | 104 | 284 | 103% | 317 | 0.69 | 0.68 |
| 60 | 42 | 81 | 230 | 79% | 271 | 0.78 | 0.77 |
| 70 | 34 | 94 | 234 | 81% | 253 | 0.8 | 0.79 |
| 80 | 45 | 75 | 166 | 68% | 199 | 0.88 | 0.87 |
| Sample Size | AE q25 | AE q50 | AE q75 | MAPE | CRMSE | R2 | NASH |
|---|---|---|---|---|---|---|---|
| 10 | 55 | 123 | 221 | 68% | 183 | 0.44 | 0.41 |
| 15 | 62 | 121 | 200 | 65% | 176 | 0.47 | 0.45 |
| 20 | 62 | 111 | 207 | 63% | 175 | 0.47 | 0.46 |
| 25 | 63 | 113 | 182 | 60% | 167 | 0.52 | 0.51 |
| 30 | 61 | 113 | 194 | 60% | 166 | 0.52 | 0.52 |
| 35 | 64 | 98 | 172 | 55% | 154 | 0.59 | 0.58 |
| 40 | 58 | 90 | 139 | 51% | 139 | 0.66 | 0.66 |
| Sample Size I | ||||
|---|---|---|---|---|
| 10 | 99% | 119% | 86% | 112% |
| 20 | 71% | 90% | 76% | 91% |
| 30 | 44% | 74% | 72% | 83% |
| 40 | 37% | 56% | 66% | 62% |
| 50 | 51% | 59% | 48% | 64% |
| 60 | 16% | 36% | 34% | 47% |
| 70 | 19% | 27% | 21% | 30% |
| 80 | 0% | 0% | 0% | 0% |
| Sample Size I | ||||
|---|---|---|---|---|
| 10 | 33% | 32% | 82% | −19% |
| 15 | 27% | 27% | 59% | −14% |
| 20 | 24% | 26% | 59% | −18% |
| 25 | 18% | 20% | 45% | −9% |
| 30 | 18% | 19% | 41% | −14% |
| 35 | 8% | 11% | 18% | −7% |
| 40 | 0% | 0% | 0% | 0% |
| Outage Events | Training [0, 200) | Training [200, 1000] | Training (1000, 3590] | All Events | ||||
|---|---|---|---|---|---|---|---|---|
| W | G | W | G | W | G | W | G | |
| Low-severity event (outages = 70) | 3.8 | 9.1 | 4.7 | 11.3 | 6.3 | 11.4 | 3.6 | 10.9 |
| Moderate-severity event (outages = 408) | 4.4 | 6.2 | 3.2 | 5.1 | 4.1 | 7.6 | 3.5 | 4.5 |
| High-severity event (outages = 1419) | 5.9 | 9.6 | 4.0 | 5.4 | 3.6 | 3.9 | 5.0 | 7.6 |
© 2020 by the authors. Licensee MDPI, Basel, Switzerland. This article is an open access article distributed under the terms and conditions of the Creative Commons Attribution (CC BY) license (http://creativecommons.org/licenses/by/4.0/).
Share and Cite
Yang, F.; Wanik, D.W.; Cerrai, D.; Bhuiyan, M.A.E.; Anagnostou, E.N. Quantifying Uncertainty in Machine Learning-Based Power Outage Prediction Model Training: A Tool for Sustainable Storm Restoration. Sustainability 2020, 12, 1525. https://0-doi-org.brum.beds.ac.uk/10.3390/su12041525
Yang F, Wanik DW, Cerrai D, Bhuiyan MAE, Anagnostou EN. Quantifying Uncertainty in Machine Learning-Based Power Outage Prediction Model Training: A Tool for Sustainable Storm Restoration. Sustainability. 2020; 12(4):1525. https://0-doi-org.brum.beds.ac.uk/10.3390/su12041525
Chicago/Turabian StyleYang, Feifei, David W. Wanik, Diego Cerrai, Md Abul Ehsan Bhuiyan, and Emmanouil N. Anagnostou. 2020. "Quantifying Uncertainty in Machine Learning-Based Power Outage Prediction Model Training: A Tool for Sustainable Storm Restoration" Sustainability 12, no. 4: 1525. https://0-doi-org.brum.beds.ac.uk/10.3390/su12041525