Rethinking the Identification of Urban Centers from the Perspective of Function Distribution: A Framework Based on Point-of-Interest Data

Abstract
:1. Introduction
2. Literature Review
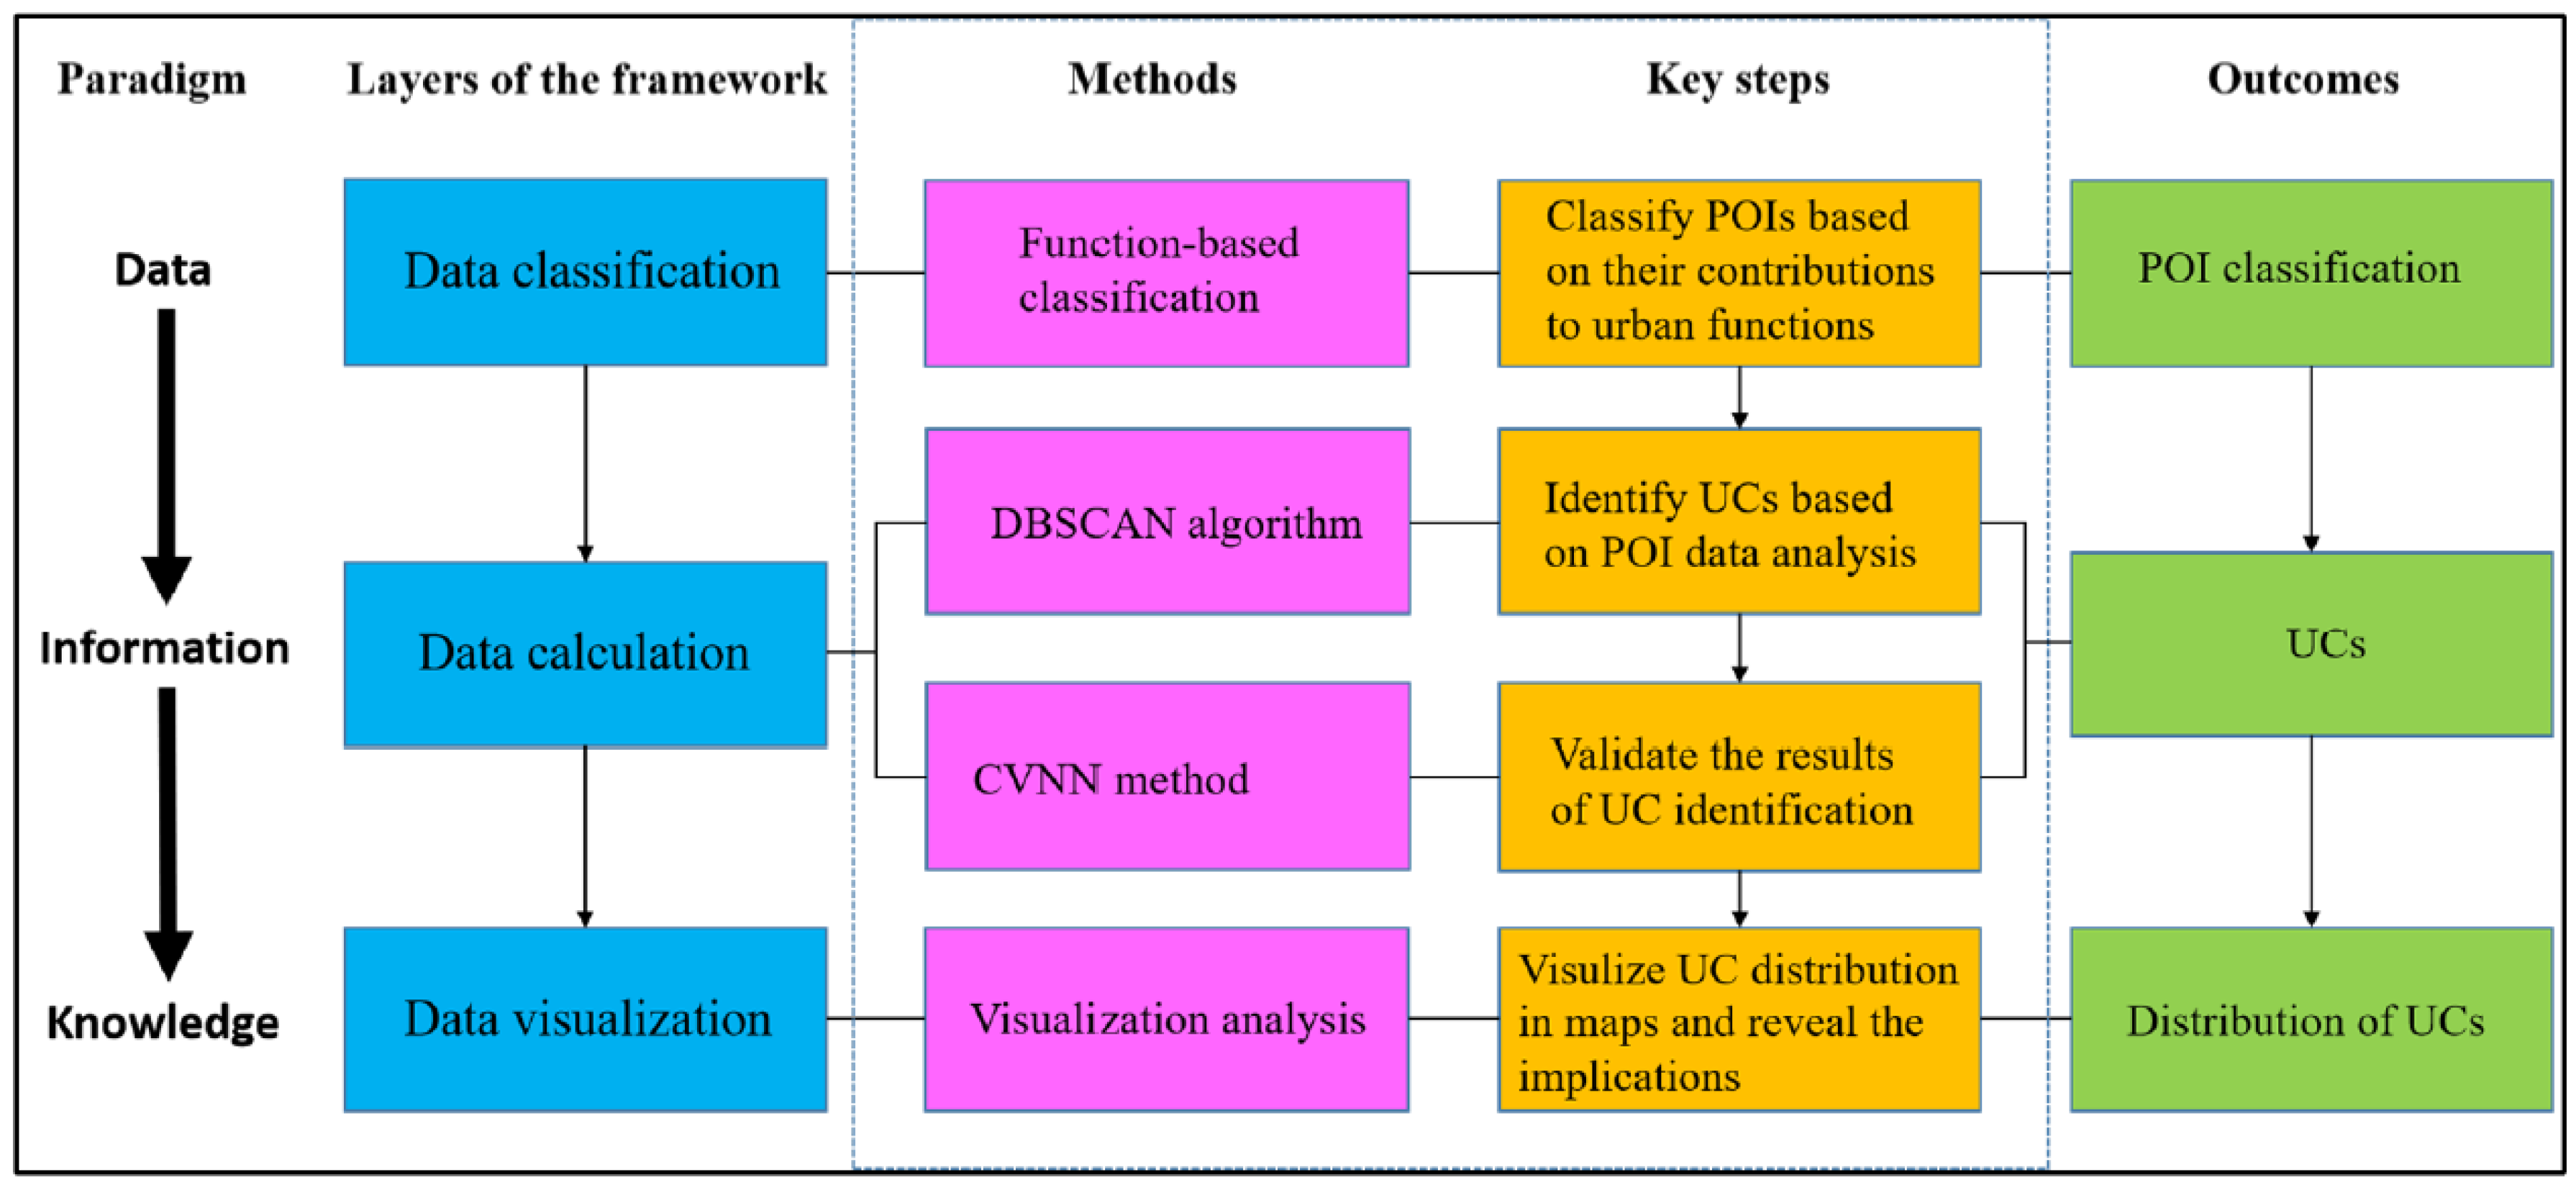
3. Model Development
3.1. Points-of-Interest (POIs) and Their Links with Urban Functions
3.2. Data Classification Layer
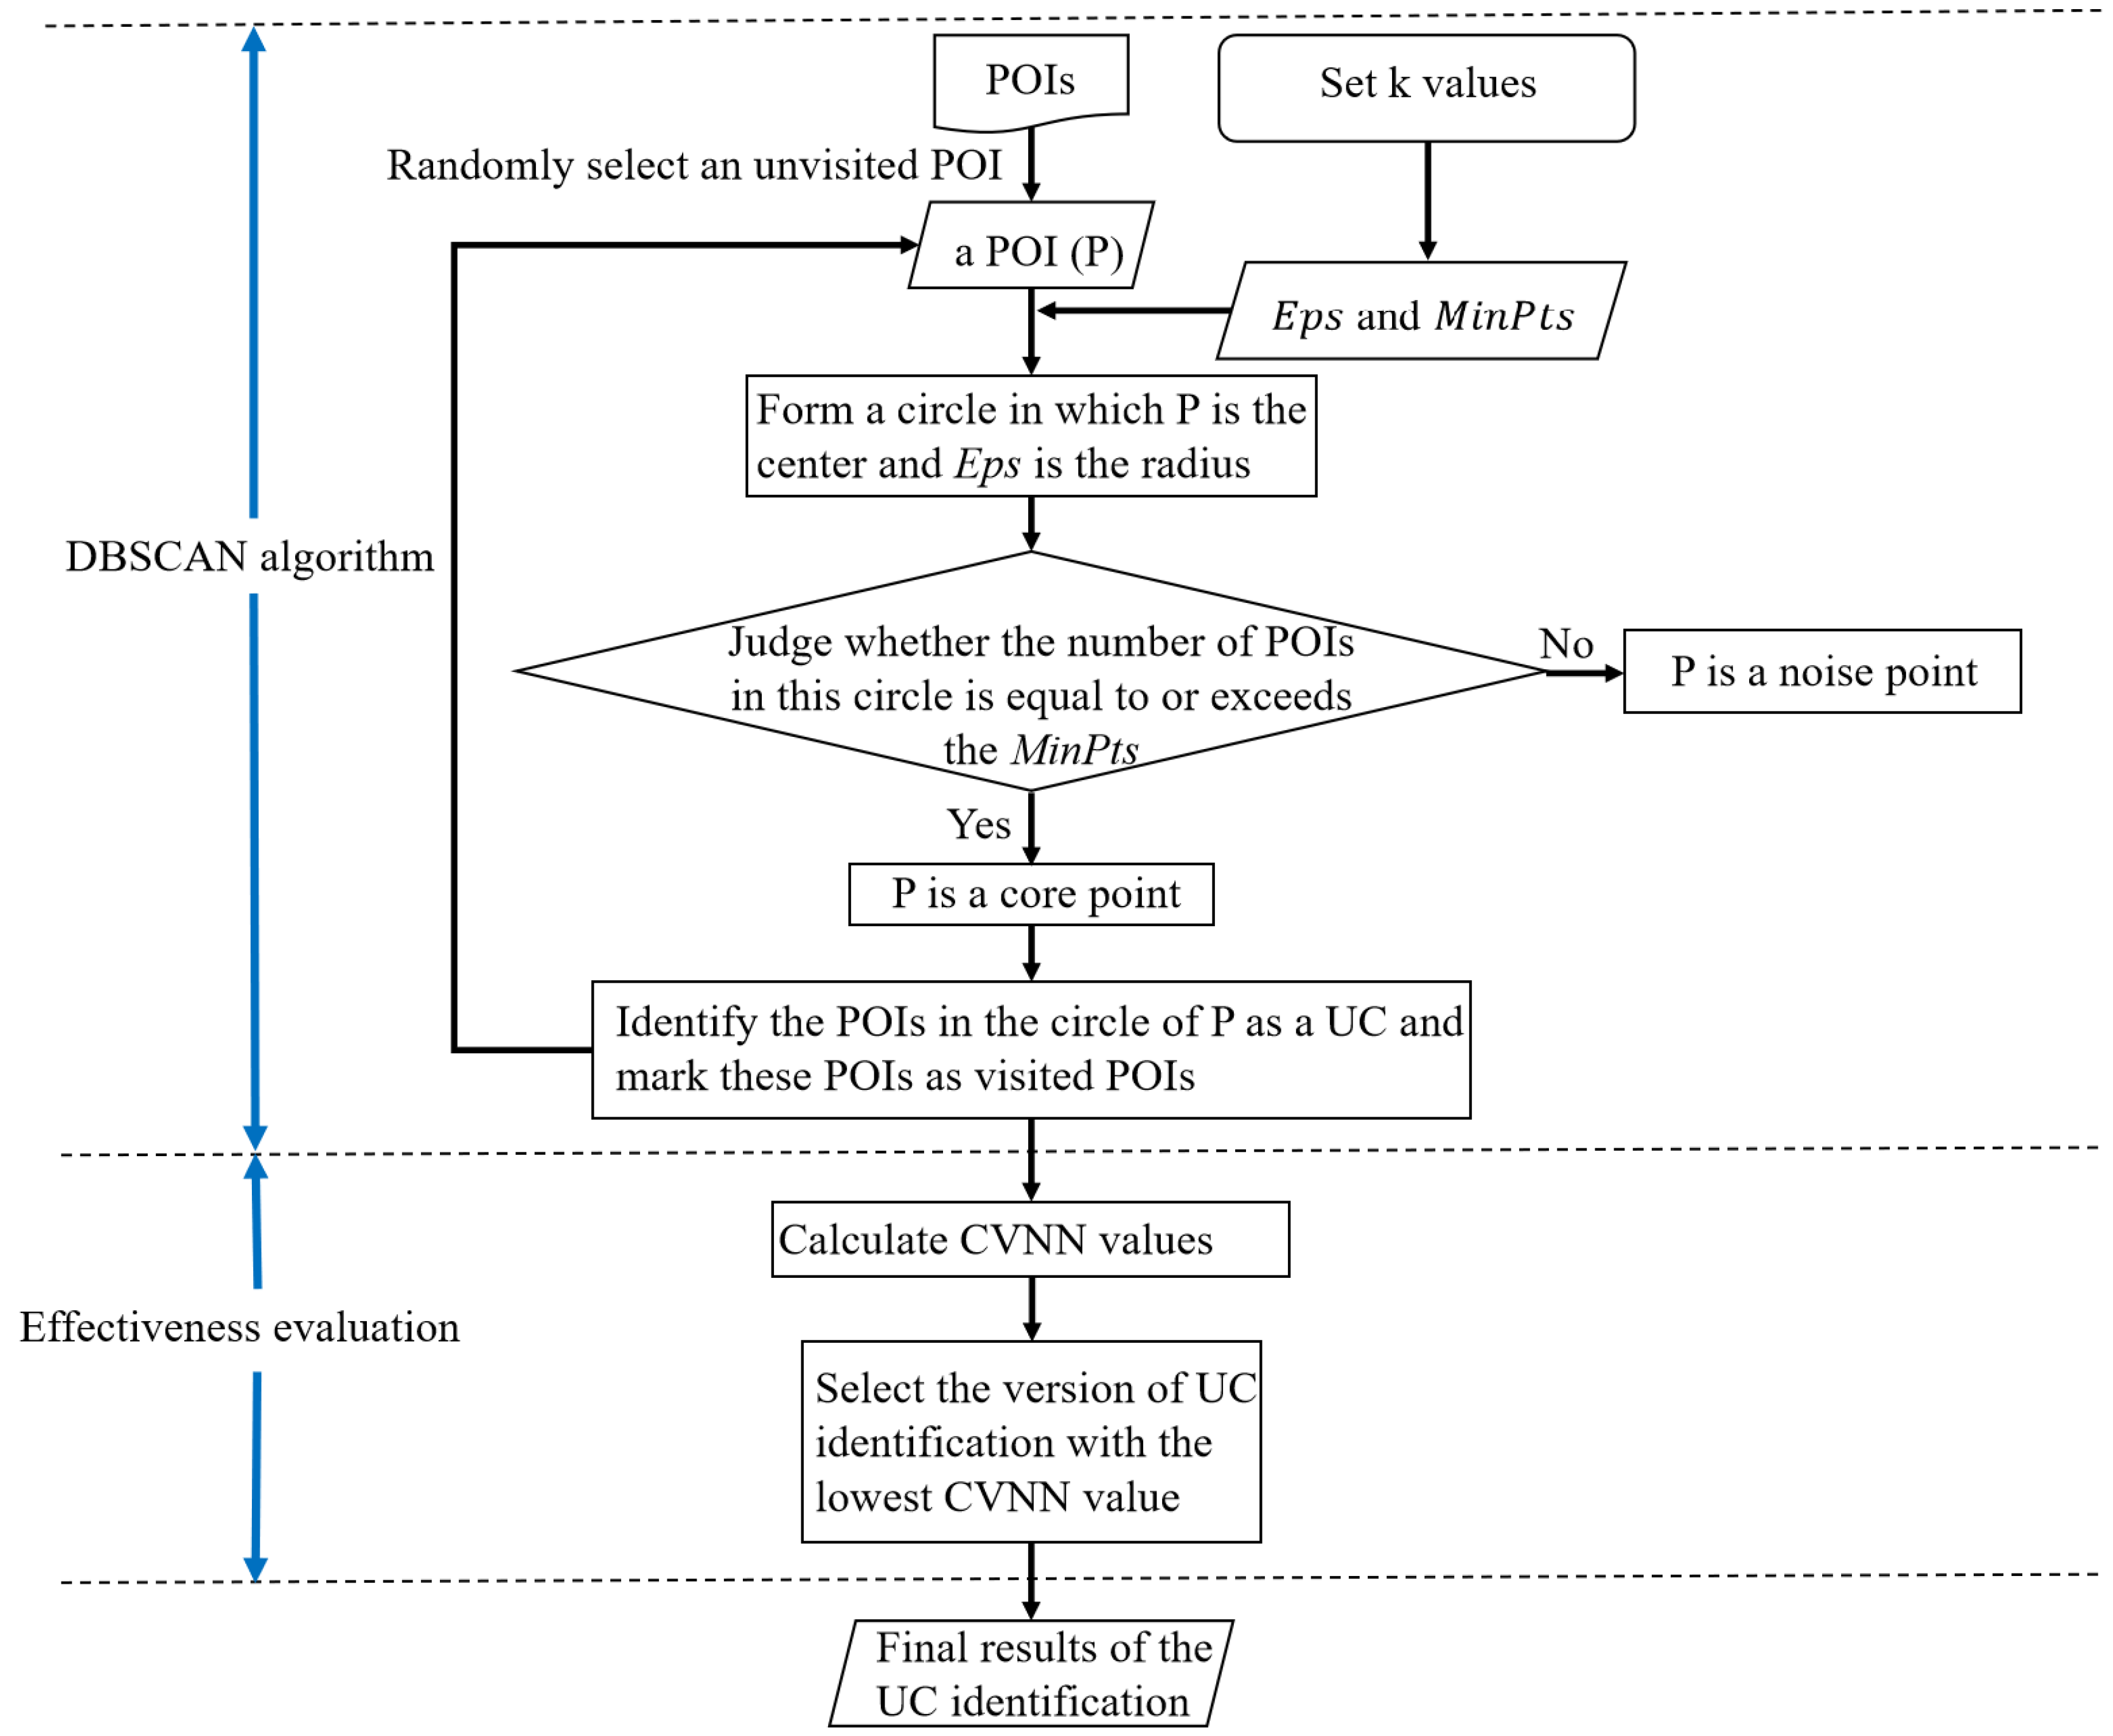
3.3. Data Calculation Layer
3.4. Data Visualization Layer
4. Case Study
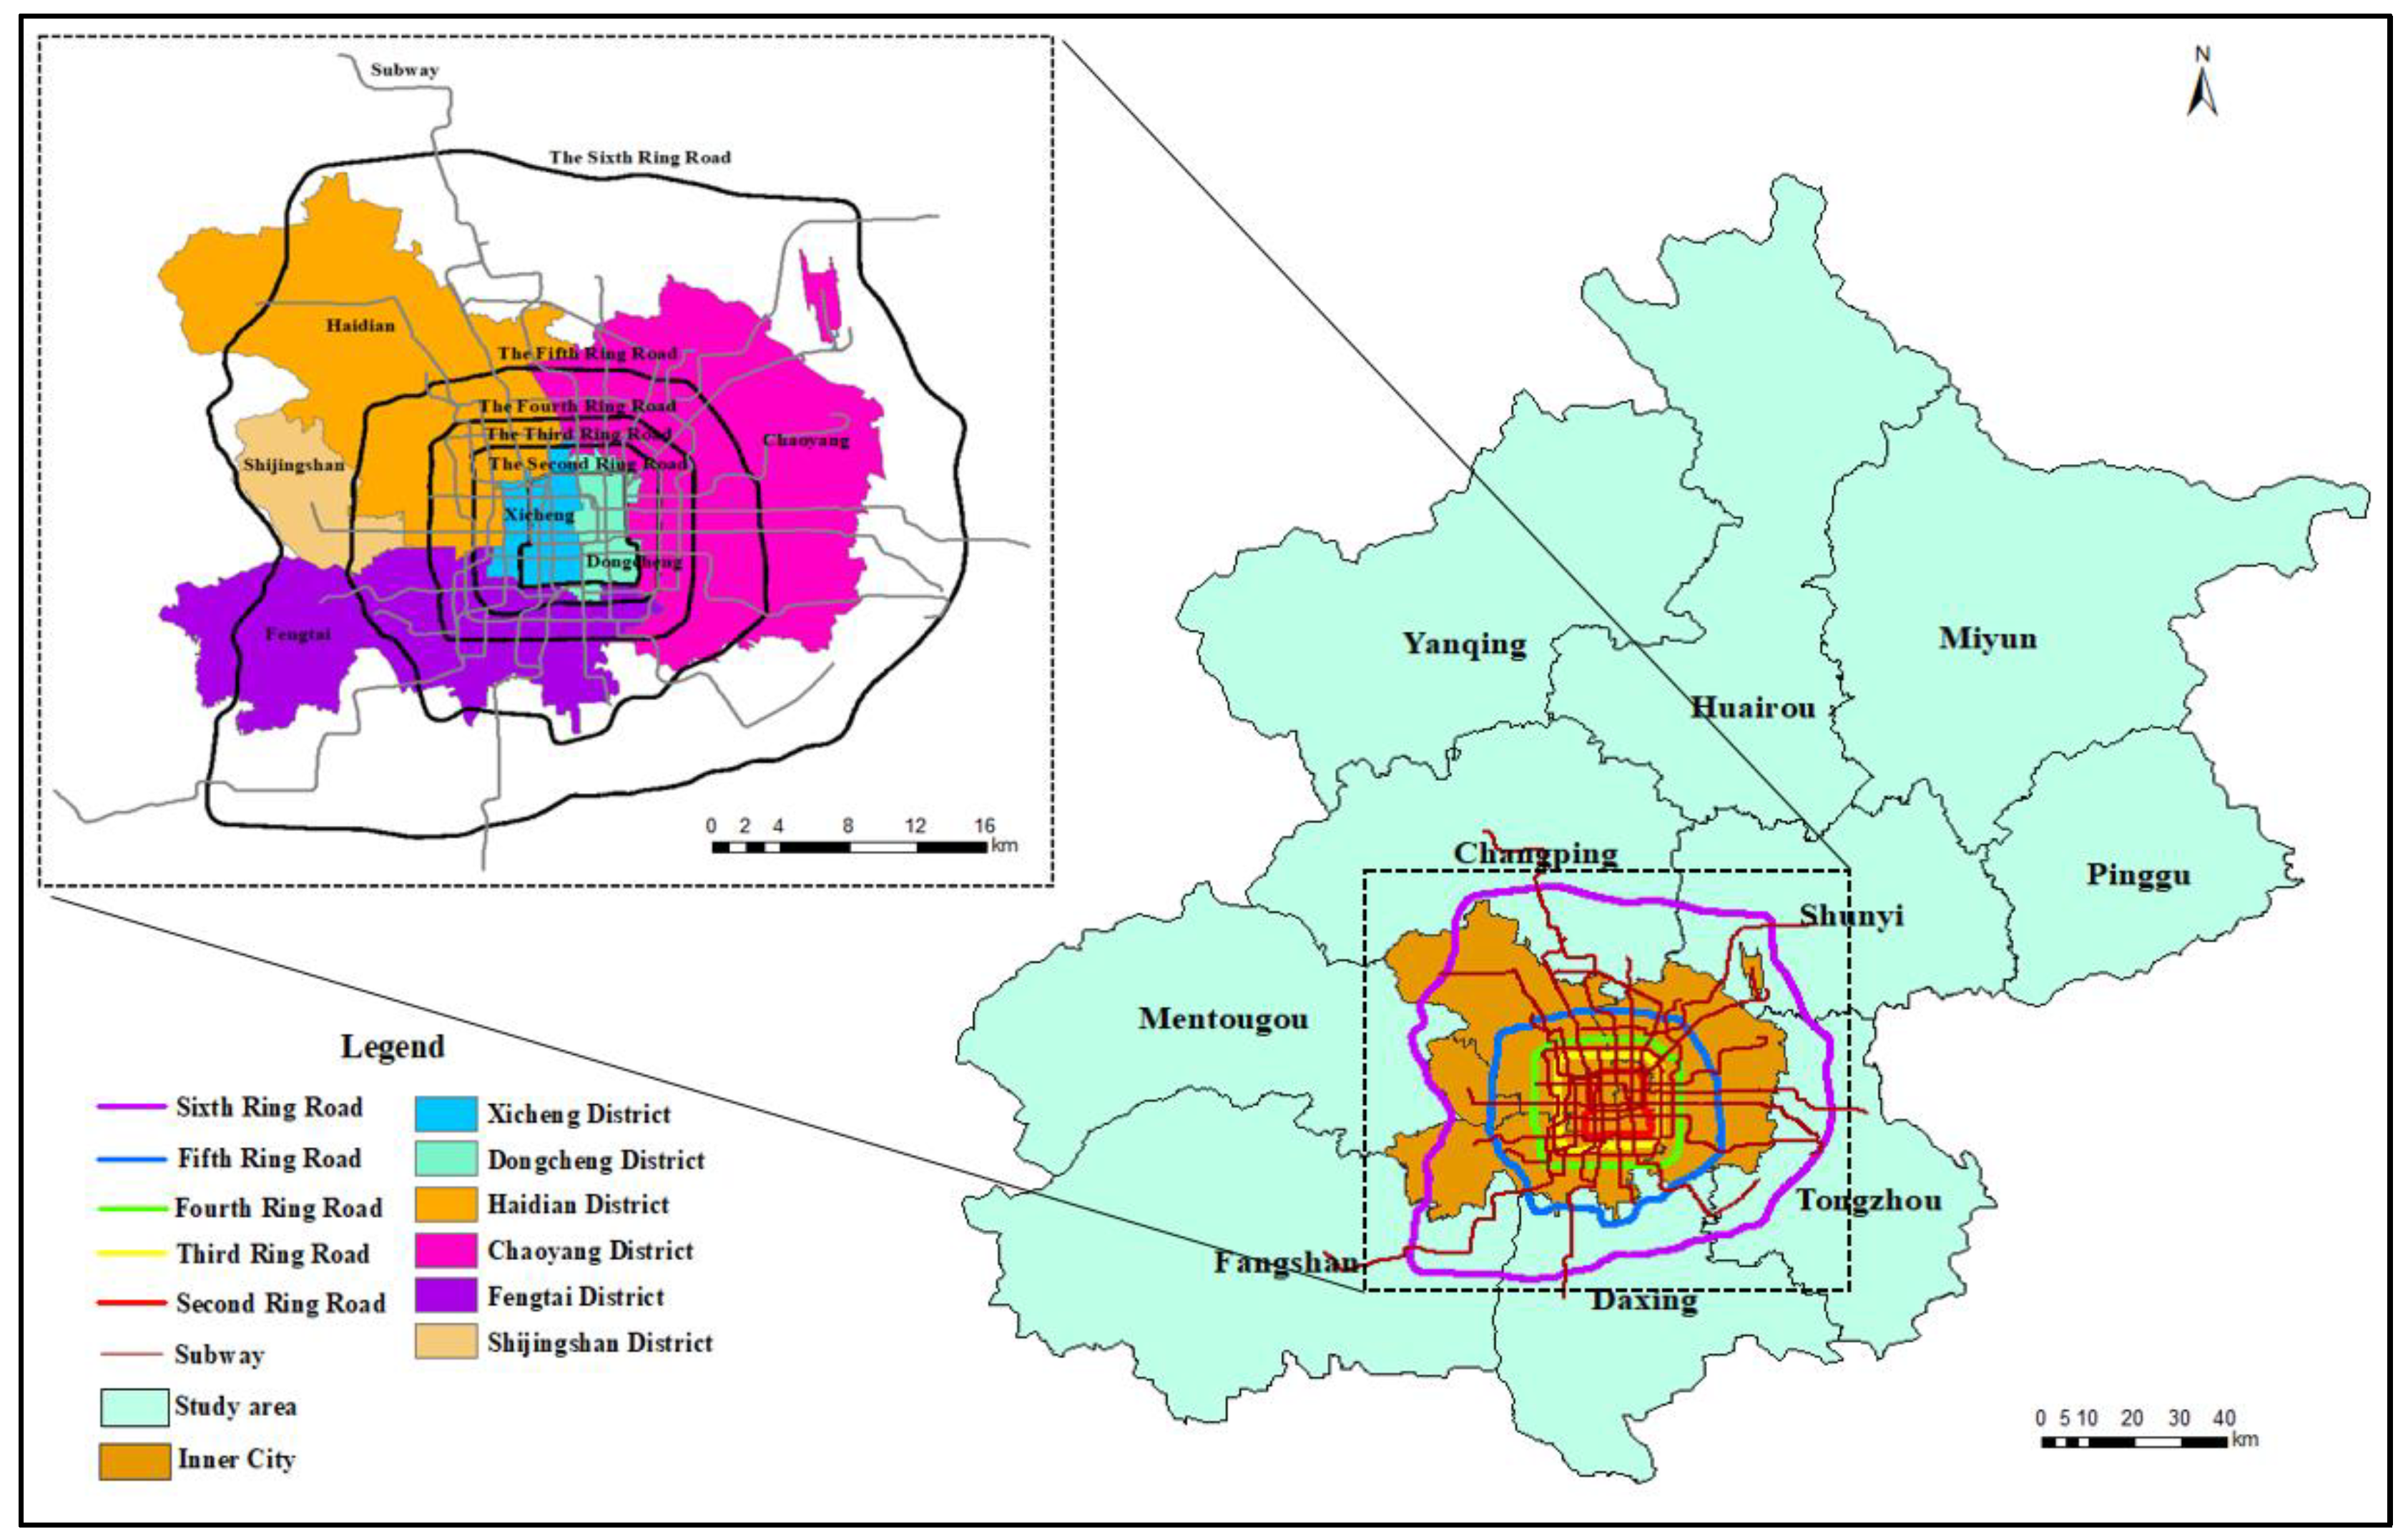
4.1. Study Area
4.2. Data
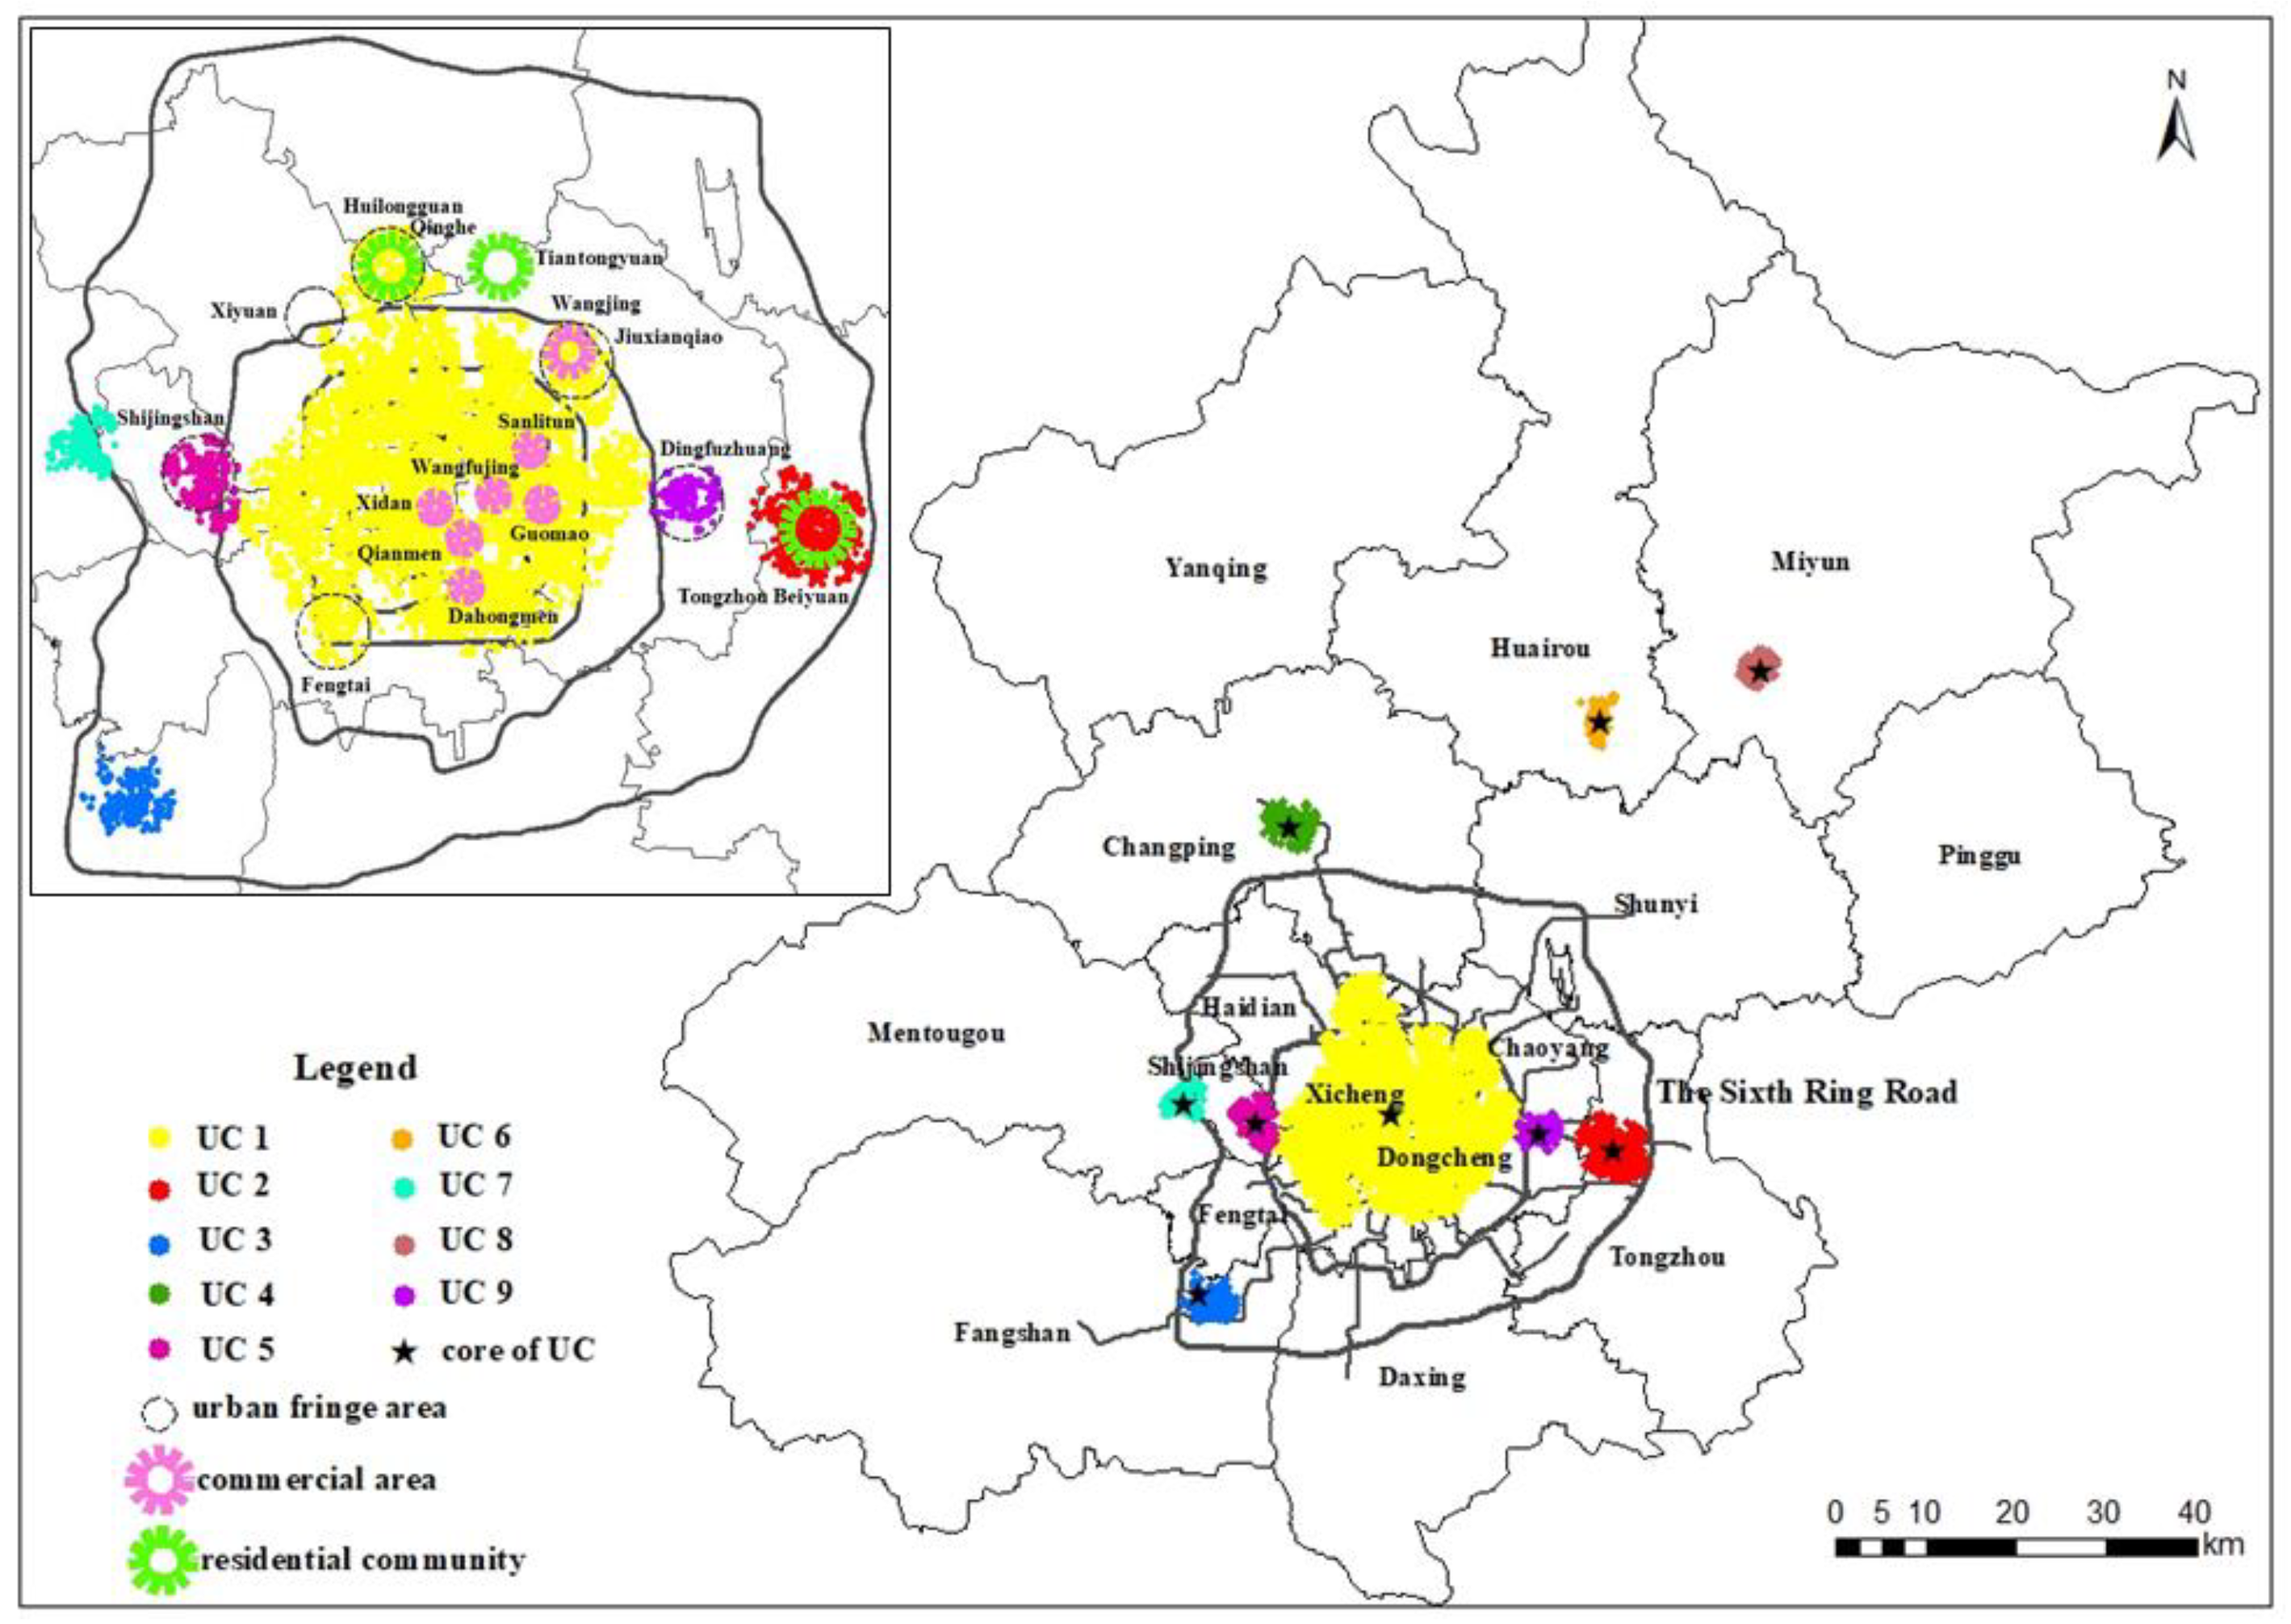
4.3. Results of Urban Center (UC) Identification
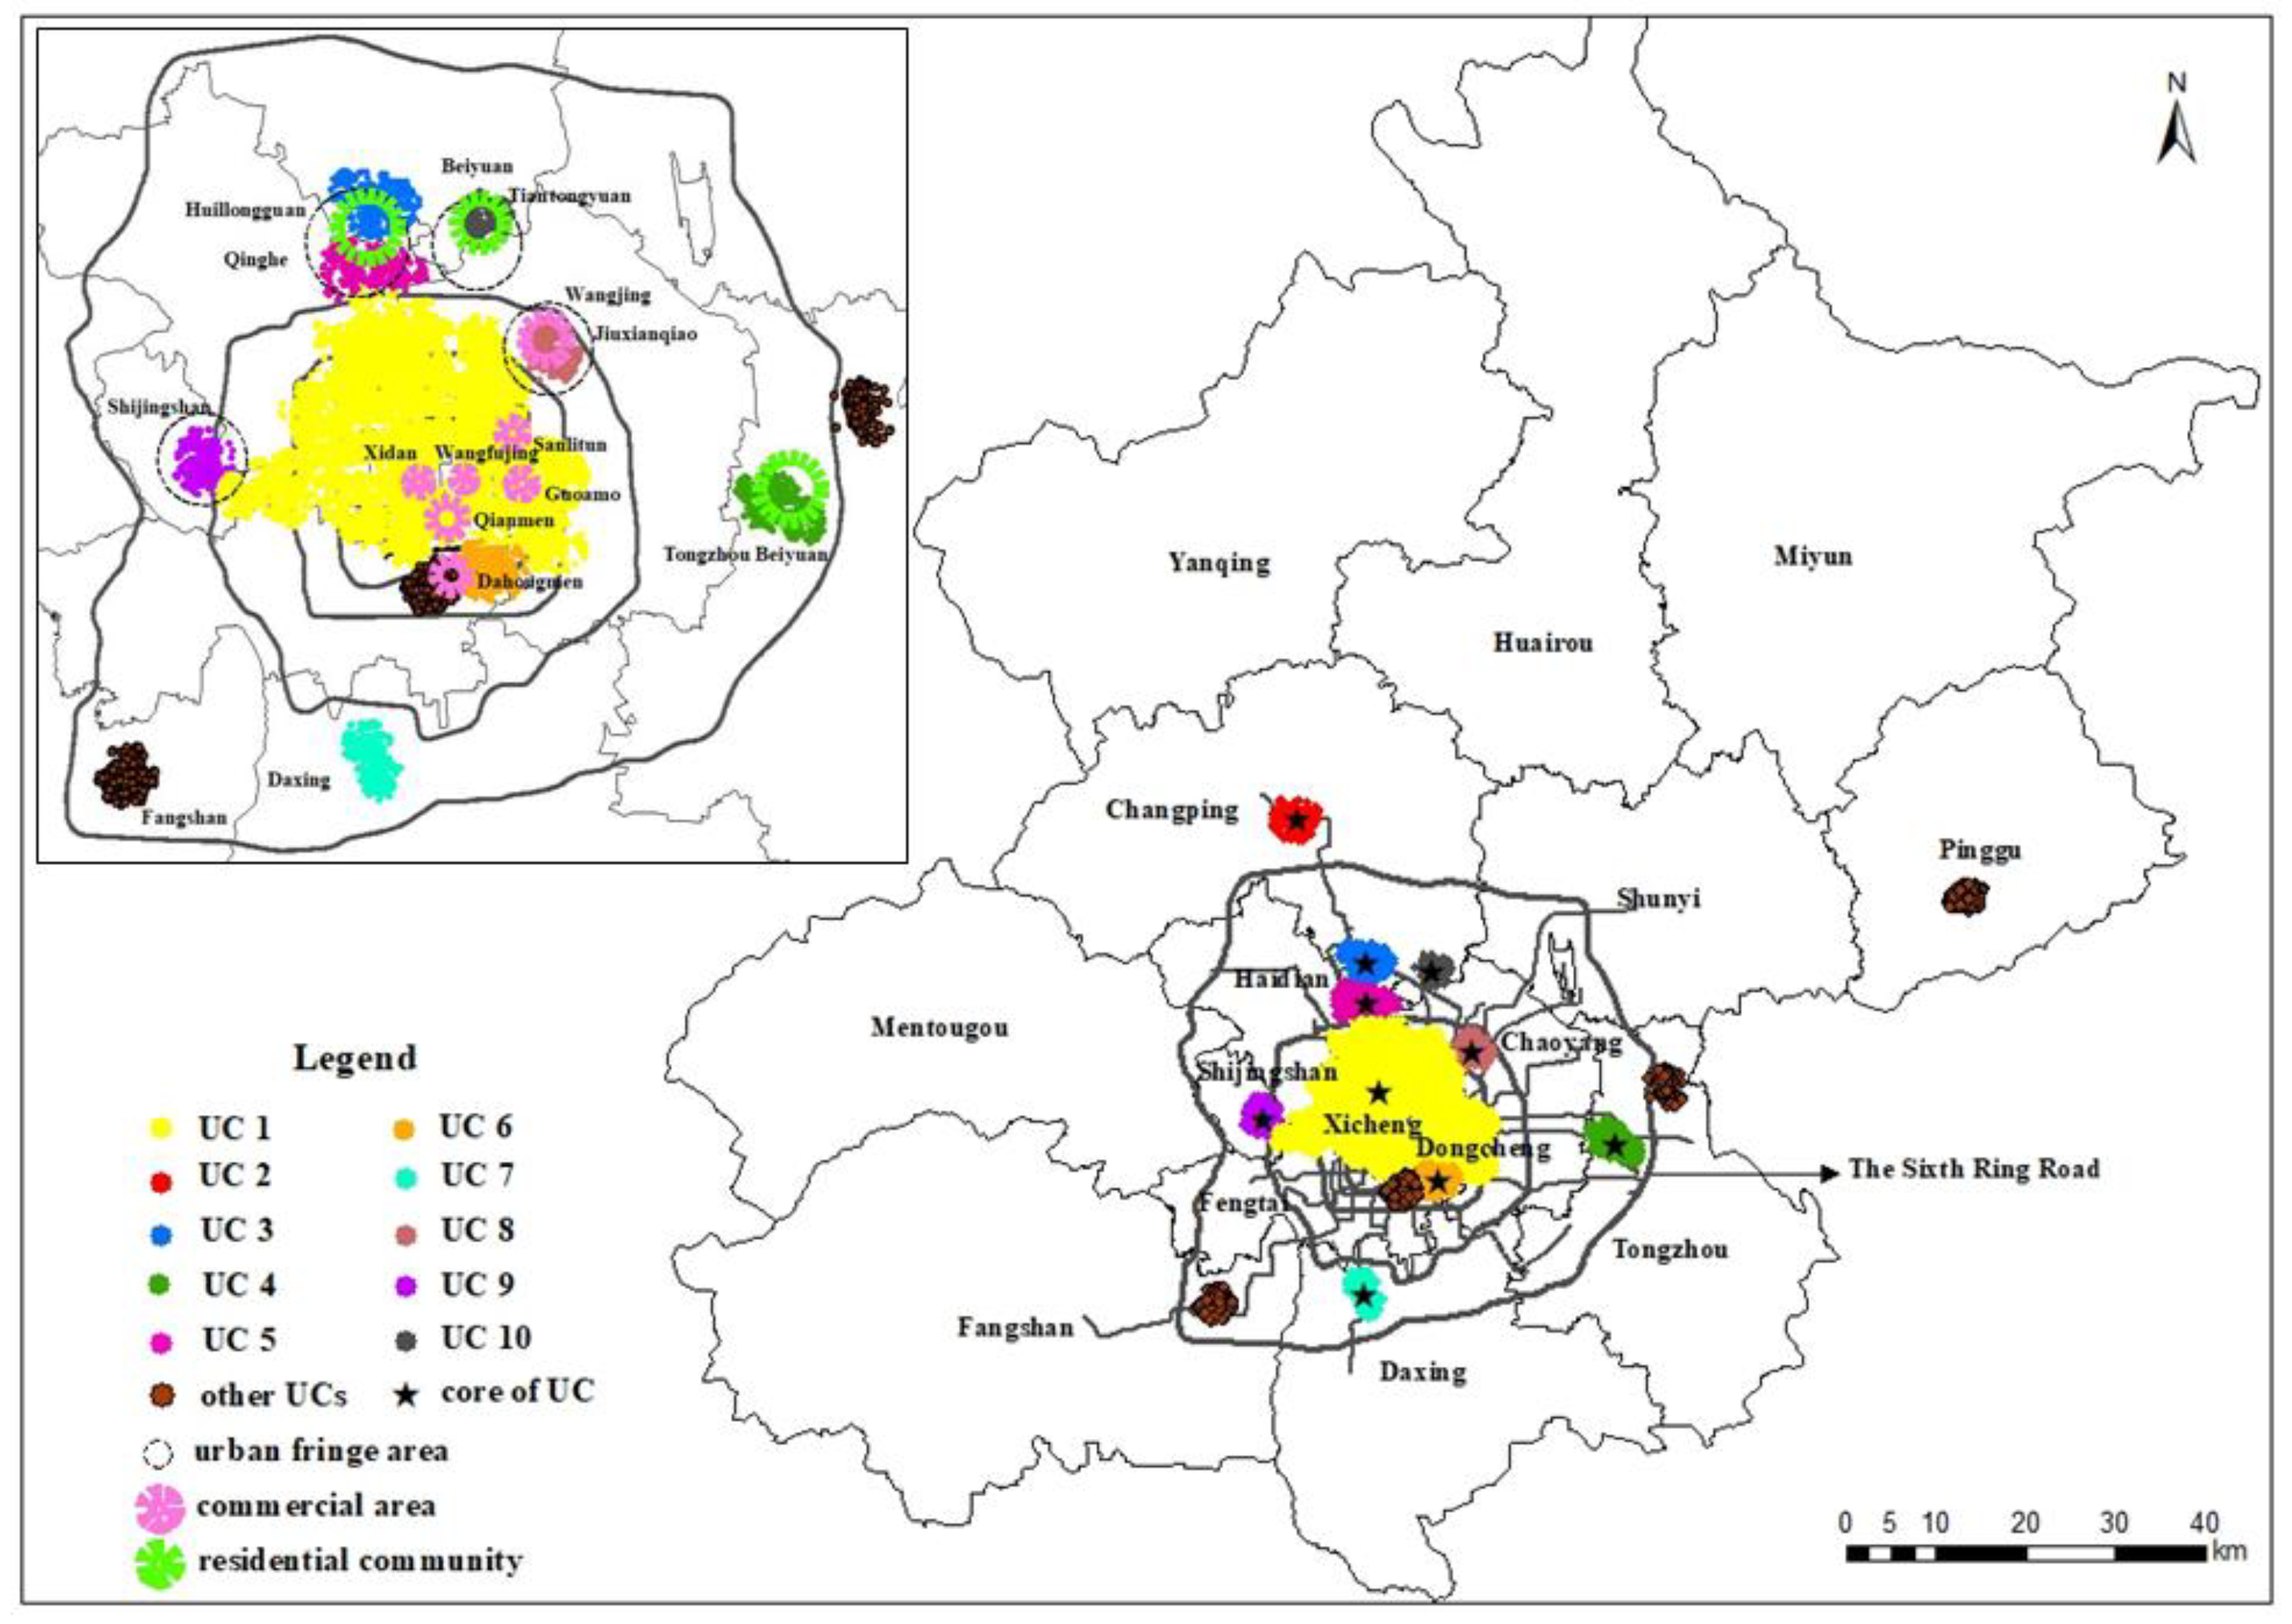
4.3.1. Residential UCs
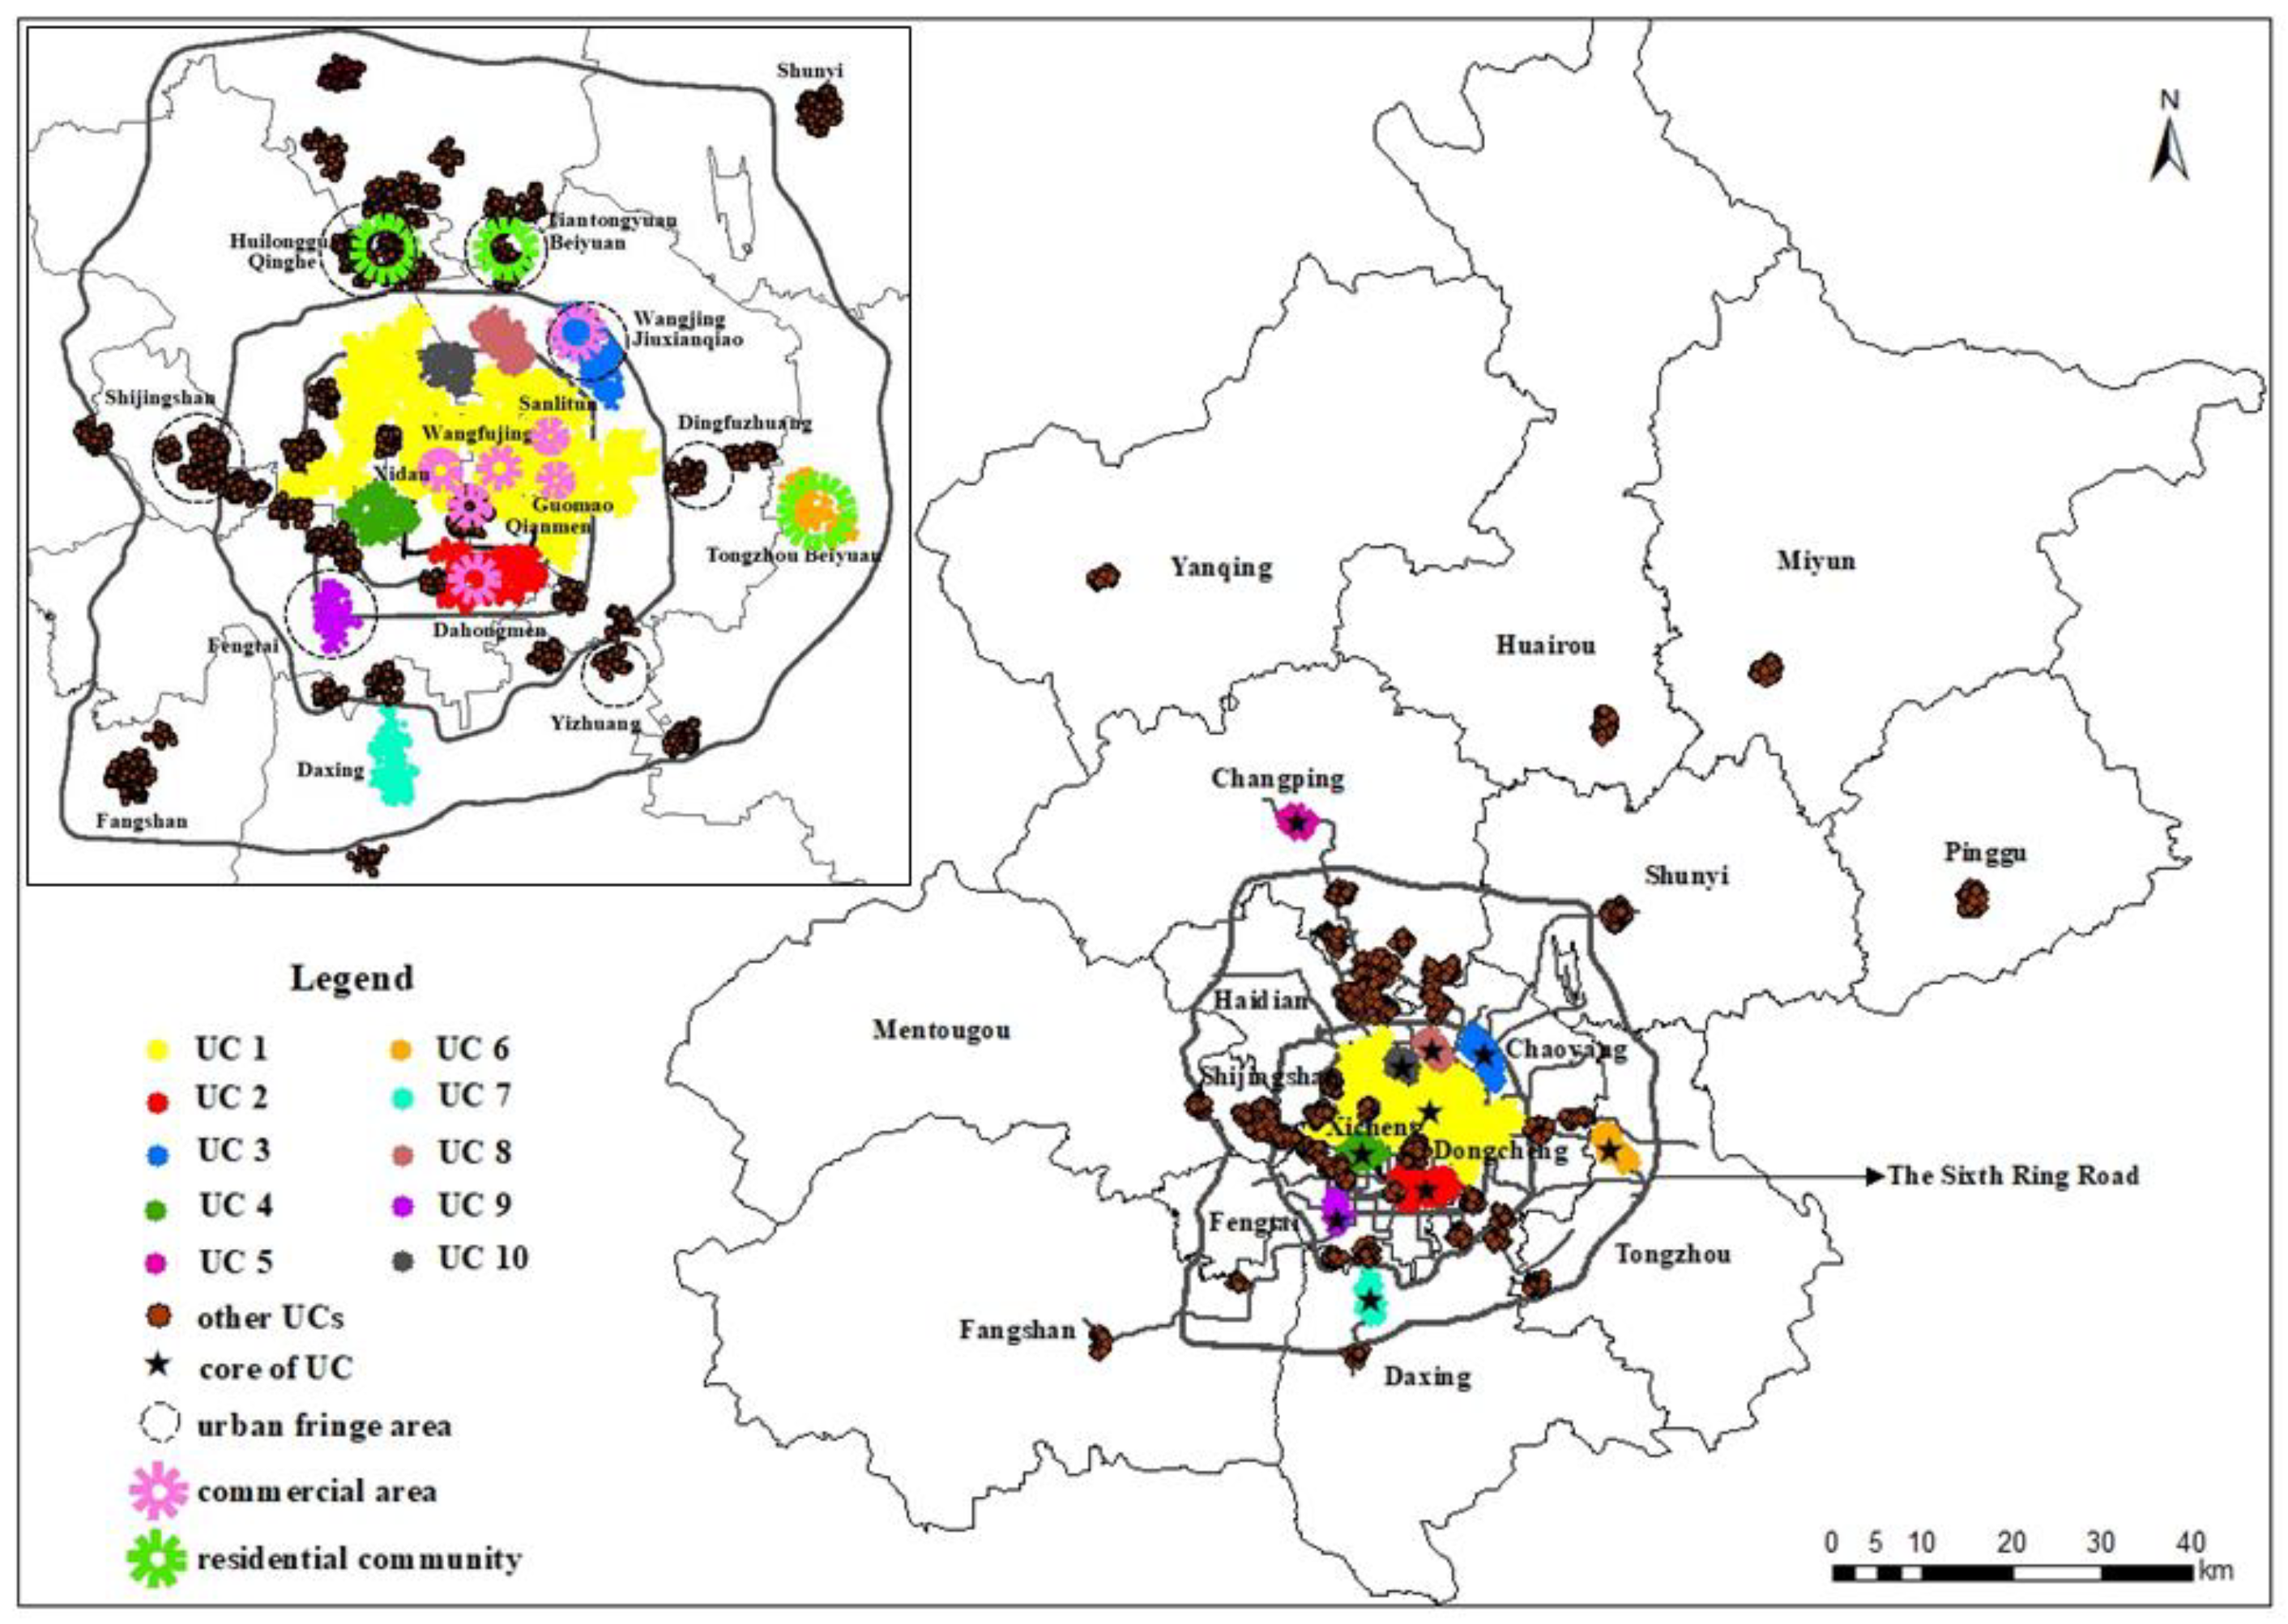
4.3.2. Educational UCs
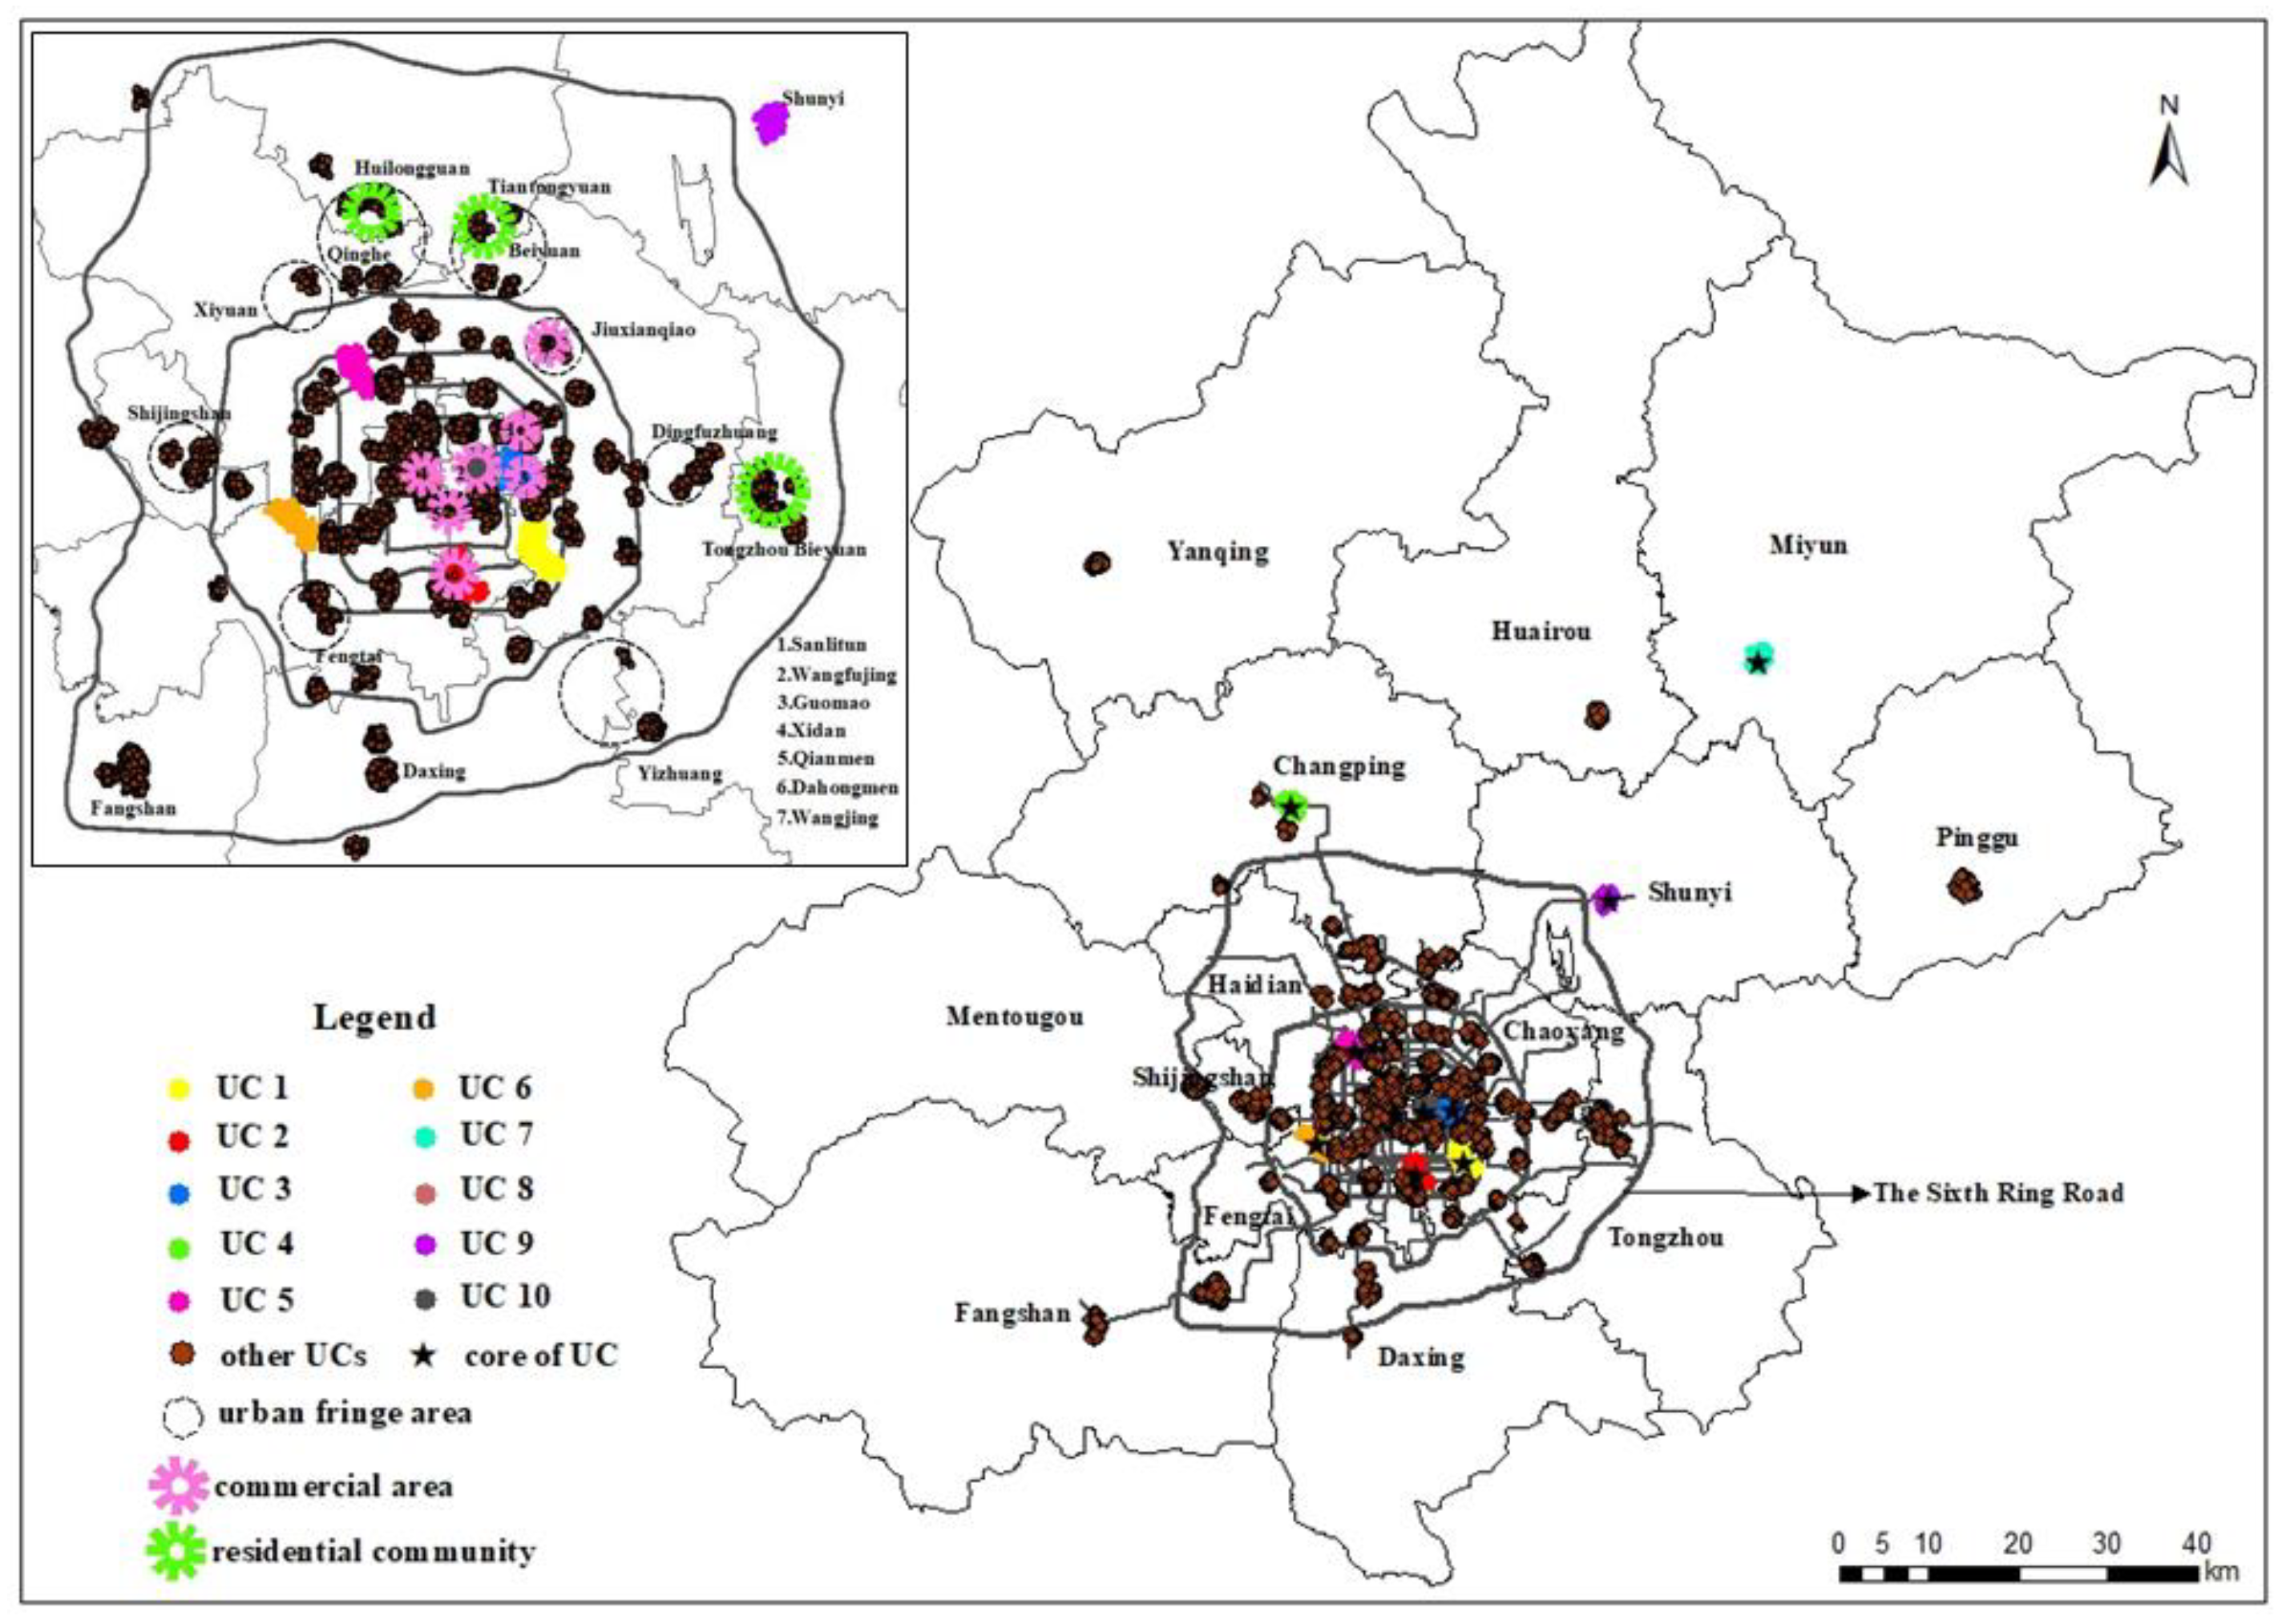
4.3.3. Catering UCs
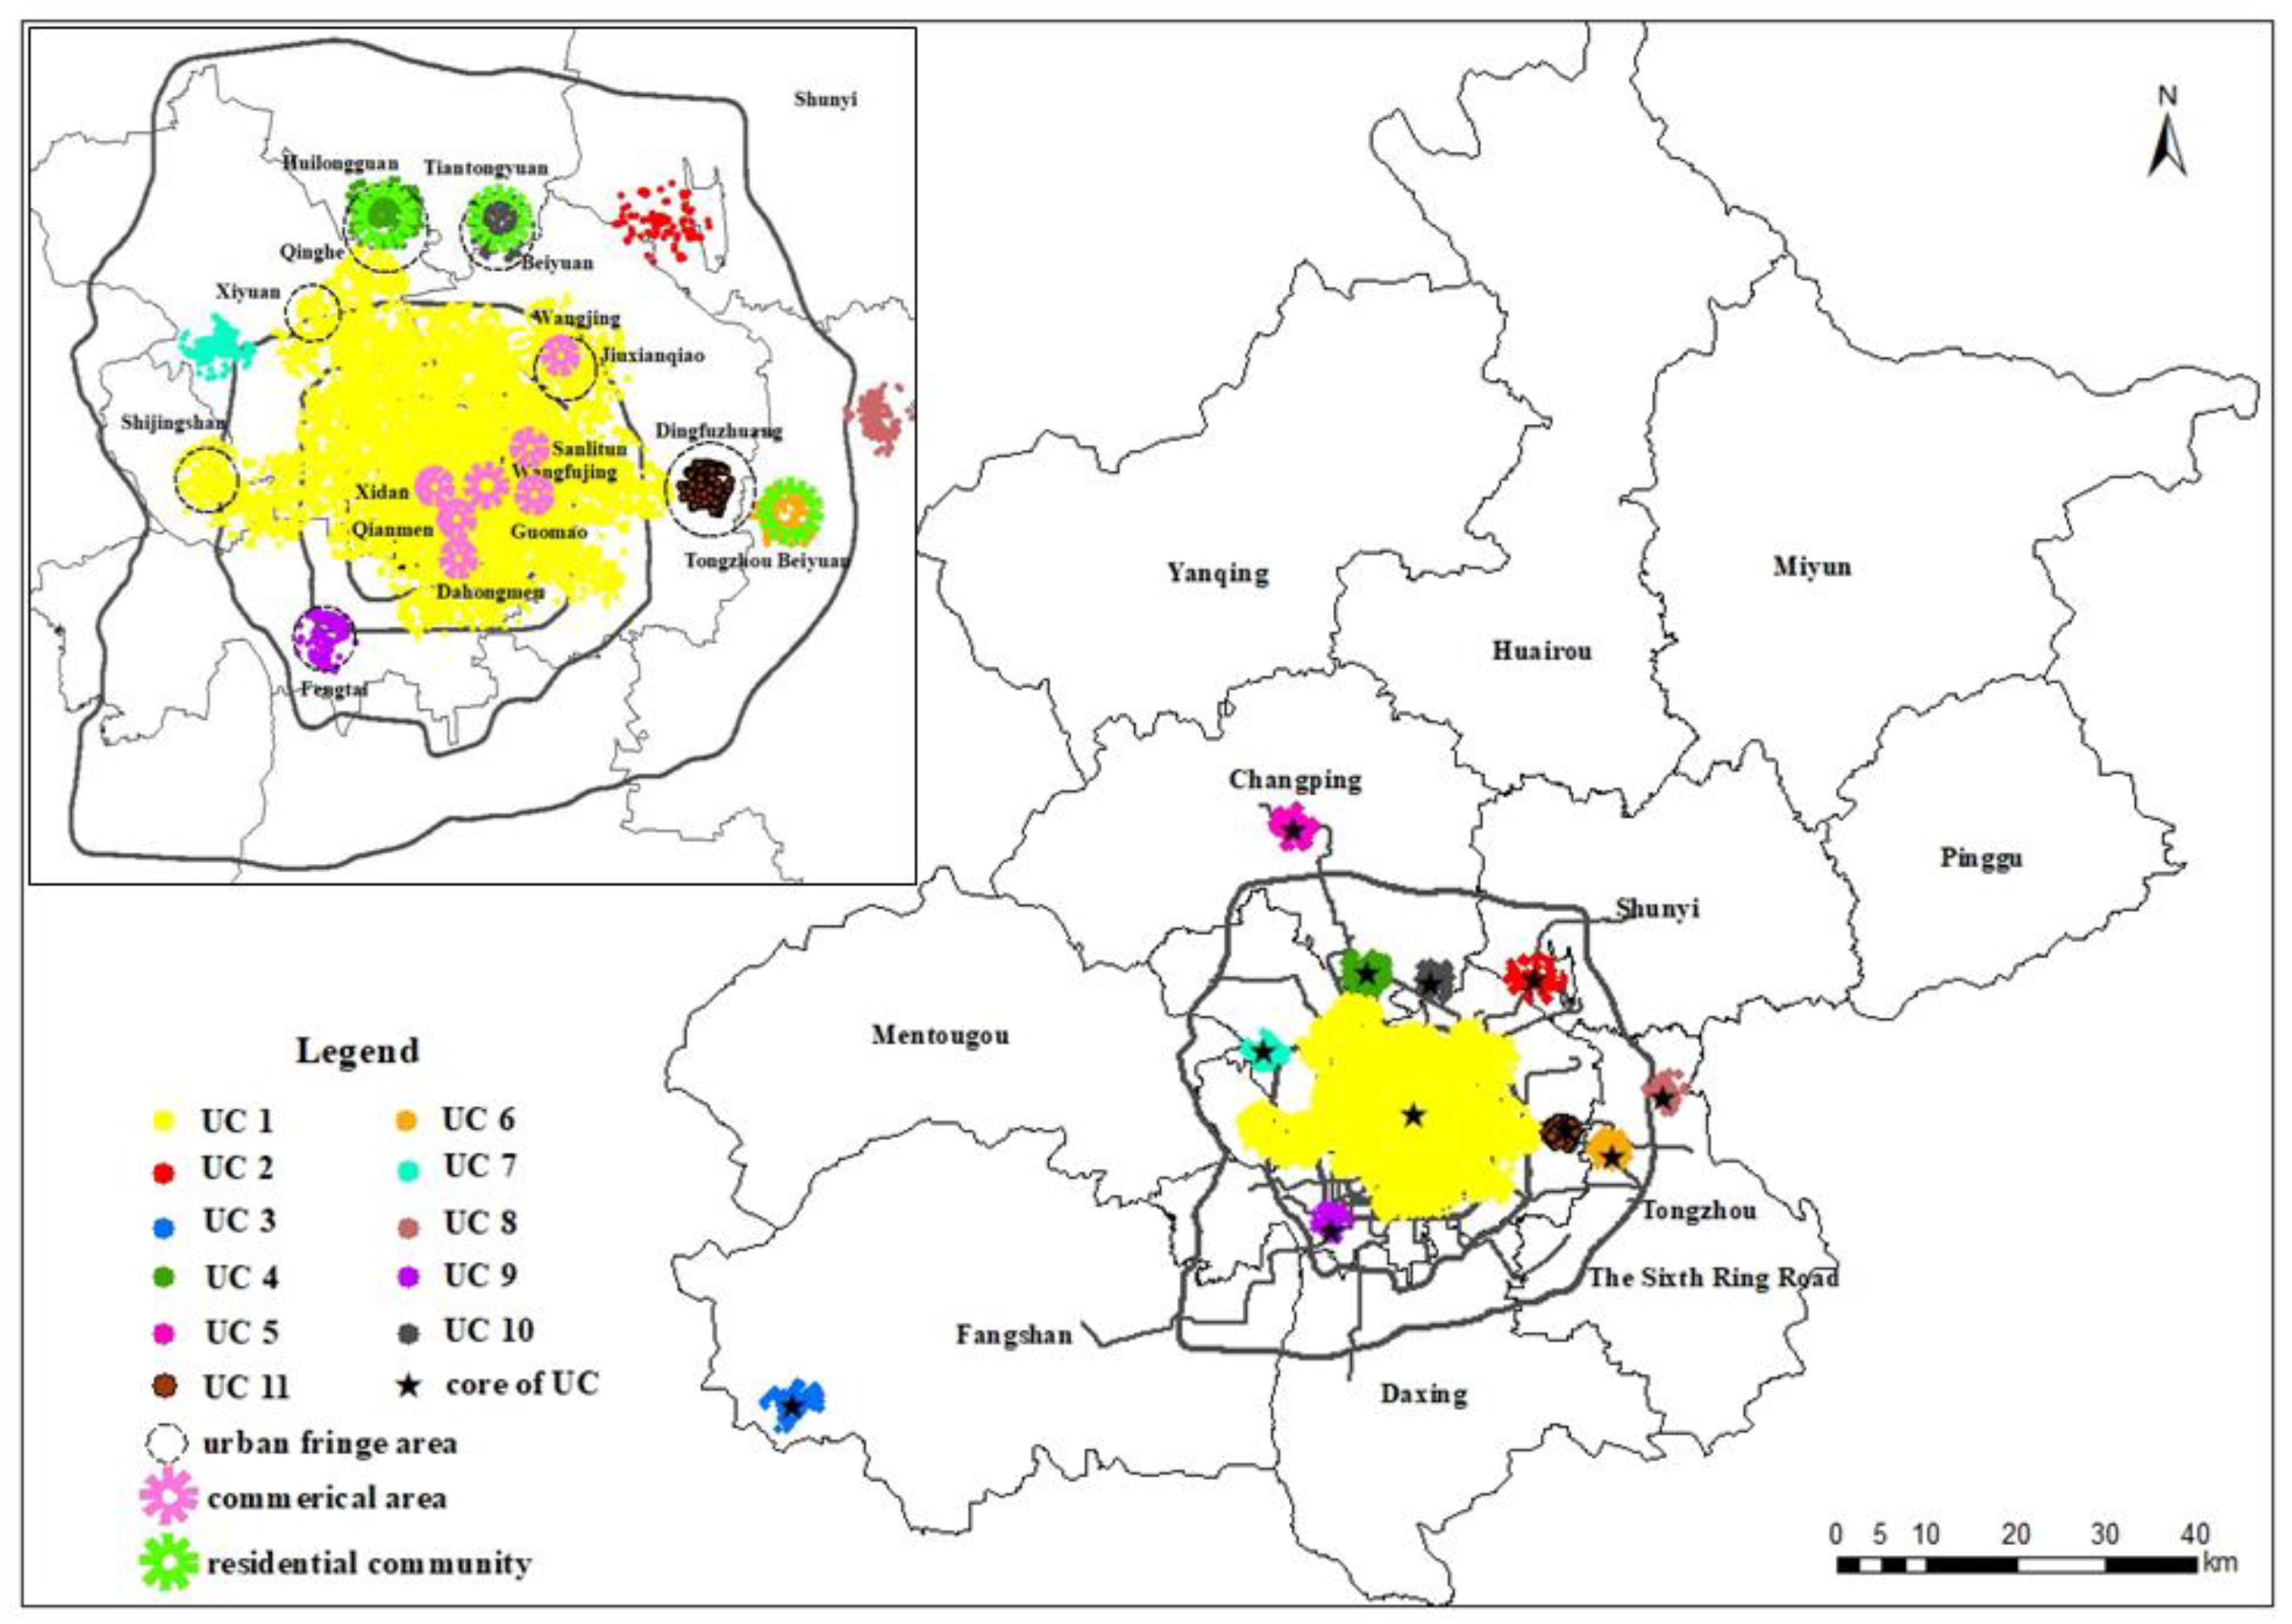
4.3.4. Shopping UCs
4.3.5. Leisure and Recreation UCs
4.3.6. Summary of UCs in Different Urban Planning Zones
5. Discussion
5.1. Insights Generated from UC Distribution of Beijing
5.2. Theoretical and Practical Implications
6. Conclusions
6.1. Key Findings
6.2. Limitations
Author Contributions
Funding
Acknowledgments
Conflicts of Interest
References
- Tan, Y.; Xu, H.; Zhang, X. Sustainable urbanization in China: A comprehensive literature review. Cities 2016, 55, 82–93. [Google Scholar] [CrossRef]
- National Bureau of Statistics of China. China Statistical Yearbook-2019; China Statistical Press: Beijing, China, 2019.
- Huang, J.; Levinson, D.; Wang, J.; Jin, H. Job-worker spatial dynamics in Beijing: Insights from Smart Card Data. Cities 2019, 86, 83–93. [Google Scholar] [CrossRef]
- Huang, D.; Liu, Z.; Zhao, X. Monocentric or Polycentric? The Urban Spatial Structure of Employment in Beijing. Sustainability 2015, 7, 11632–11656. [Google Scholar] [CrossRef] [Green Version]
- Ren, X. Urban China; John Wiley & Sons: Hoboken, NJ, USA, 2013. [Google Scholar]
- Li, J.; Long, Y.; Dang, A. Live-Work-Play Centers of Chinese cities: Identification and temporal evolution with emerging data. Comput. Environ. Urban Syst. 2018, 71, 58–66. [Google Scholar] [CrossRef]
- Sun, Y.; Fan, H.; Li, M.; Zipf, A. Identifying the city center using human travel flows generated from location-based social networking data. Environ. Plan. B Plan. Des. 2016, 43, 480–498. [Google Scholar] [CrossRef]
- Tian, G.; Wu, J.; Yang, Z. Spatial pattern of urban functions in the Beijing metropolitan region. Habitat Int. 2010, 34, 249–255. [Google Scholar] [CrossRef]
- Burger, M.; Meijers, E. Form Follows Function? Linking Morphological and Functional Polycentricity. Urban Stud. 2012, 49, 1127–1149. [Google Scholar] [CrossRef]
- Huang, D.; Liu, Z.; Zhao, X.; Zhao, P. Emerging polycentric megacity in China: An examination of employment subcenters and their influence on population distribution in Beijing. Cities 2017, 69, 36–45. [Google Scholar] [CrossRef]
- Veneri, P. The identification of sub-centres in two Italian metropolitan areas: A functional approach. Cities 2013, 31, 177–185. [Google Scholar] [CrossRef] [Green Version]
- Cai, J.; Huang, B.; Song, Y. Using multi-source geospatial big data to identify the structure of polycentric cities. Remote Sens. Environ. 2017, 202, 210–221. [Google Scholar] [CrossRef]
- United Nations. 2018 Revision of the World Urbanization Prospects; United Nations: New York, NY, USA, 2018. [Google Scholar]
- Clark, W.A.V. Monocentric to polycentric: New urban forms and old paradigms. In A Companion to the City; Bridge, G., Watson, S., Eds.; Wiley-Blackwell: Malden, MA, USA, 2000; pp. 141–154. [Google Scholar]
- Craig, S.G.; Ng, P.T. Using Quantile Smoothing Splines to Identify Employment Subcenters in a Multicentric Urban Area. J. Urban Econ. 2001, 49, 100–120. [Google Scholar] [CrossRef] [Green Version]
- McDonald, J.F.; Prather, P.J. Suburban Employment Centres: The Case of Chicago. Urban Stud. 1994, 31, 201–218. [Google Scholar] [CrossRef]
- McMillen, D.P. Nonparametric Employment Subcenter Identification. J. Urban Econ. 2001, 50, 448–473. [Google Scholar] [CrossRef]
- McMillen, D.P.; McDonald, J.F. A Nonparametric Analysis of Employment Density in a Polycentric City. J. Reg. Sci. 1997, 37, 591–612. [Google Scholar] [CrossRef]
- Qin, B.; Han, S.S. Emerging Polycentricity in Beijing: Evidence from Housing Price Variations, 2001–05. Urban Stud. 2013, 50, 2006–2023. [Google Scholar] [CrossRef]
- Wen, H.; Tao, Y. Polycentric urban structure and housing price in the transitional China: Evidence from Hangzhou. Habitat Int. 2015, 46, 138–146. [Google Scholar] [CrossRef]
- Zou, Y.; Mason, R.; Zhong, R. Modeling the polycentric evolution of post-Olympic Beijing: An empirical analysis of land prices and development intensity. Urban Geogr. 2015, 36, 735–756. [Google Scholar] [CrossRef]
- Feng, J.; Wang, F.; Zhou, Y. The Spatial Restructuring of Population in Metropolitan Beijing: Toward Polycentricity in the Post-Reform ERA. Urban Geogr. 2009, 30, 779–802. [Google Scholar] [CrossRef]
- Liu, X.; Wang, M. How polycentric is urban China and why? A case study of 318 cities. Landsc. Urban Plan. 2016, 151, 10–20. [Google Scholar] [CrossRef]
- Zhong, C.; Schläpfer, M.; Müller Arisona, S.; Batty, M.; Ratti, C.; Schmitt, G. Revealing centrality in the spatial structure of cities from human activity patterns. Urban Stud. 2017, 54, 437–455. [Google Scholar] [CrossRef] [Green Version]
- McDonald, J.F. The identification of urban employment subcenters. J. Urban Econ. 1987, 21, 242–258. [Google Scholar] [CrossRef]
- Giuliano, G.; Small, K.A. Subcenters in the Los Angeles region. Reg. Sci. Urban Econ. 1991, 21, 163–182. [Google Scholar] [CrossRef] [Green Version]
- Giuliano, G.; Redfearn, C.; Agarwal, A.; Li, C.; Zhuang, D. Employment Concentrations in Los Angeles, 1980–2000. Environ. Plan. A Econ. Space 2007, 39, 2935–2957. [Google Scholar] [CrossRef]
- Leslie, T.F. Identification and Differentiation of Urban Centers in Phoenix Through a Multi-Criteria Kernel-Density Approach. Int. Reg. Sci. Rev. 2010, 33, 205–235. [Google Scholar] [CrossRef]
- Zhong, C.; Huang, X.; Arisona, S.M.; Schmitt, G. Identifying Spatial Structure of Urban Functional Centers Using Travel Survey Data: A Case Study of Singapore. In Proceedings of the First ACM SIGSPATIAL International Workshop on Computational Models of Place, Orlando, FL, USA, 5–8 November 2013; pp. 28–33. [Google Scholar]
- Hu, Y.; Gao, S.; Janowicz, K.; Yu, B.; Li, W.; Prasad, S. Extracting and understanding urban areas of interest using geotagged photos. Comput. Environ. Urban Syst. 2015, 54, 240–254. [Google Scholar] [CrossRef]
- Yuan, J.; Zheng, Y.; Xie, X. Discovering regions of different functions in a city using human mobility and POIs. In Proceedings of the 18th ACM SIGKDD international conference on Knowledge discovery and data mining, Beijing, China, 12–16 August; pp. 186–194.
- Gao, S.; Janowicz, K.; Couclelis, H. Extracting urban functional regions from points of interest and human activities on location-based social networks. Trans. Gis 2017, 21, 446–467. [Google Scholar] [CrossRef]
- Yao, Y.; Li, X.; Liu, X.; Liu, P.; Liang, Z.; Zhang, J.; Mai, K. Sensing spatial distribution of urban land use by integrating points-of-interest and Google Word2Vec model. Int. J. Geogr. Inf. Sci. 2017, 31, 825–848. [Google Scholar] [CrossRef]
- Zhai, W.; Bai, X.; Shi, Y.; Han, Y.; Peng, Z.-R.; Gu, C. Beyond Word2vec: An approach for urban functional region extraction and identification by combining Place2vec and POIs. Comput. Environ. Urban Syst. 2019, 74, 1–12. [Google Scholar] [CrossRef]
- Long, Y.; Shen, Z. Discovering Functional Zones Using Bus Smart Card Data and Points of Interest in Beijing. Geospat. Anal. Support Urban Plan. Beijing 2015, 10, 193–217. [Google Scholar]
- Zhou, X.; Zhang, L. Crowdsourcing functions of the living city from Twitter and Foursquare data. Cartogr. Geogr. Inf. Sci. 2016, 43, 393–404. [Google Scholar] [CrossRef]
- Jiang, S.; Alves, A.; Rodrigues, F.; Ferreira, J.; Pereira, F.C. Mining point-of-interest data from social networks for urban land use classification and disaggregation. Comput. Environ. Urban Syst. 2015, 53, 36–46. [Google Scholar] [CrossRef] [Green Version]
- Zhi, Y.; Li, H.; Wang, D.; Deng, M.; Wang, S.; Gao, J.; Duan, Z.; Liu, Y. Latent spatio-temporal activity structures: A new approach to inferring intra-urban functional regions via social media check-in data. Geo-Spat. Inf. Sci. 2016, 19, 94–105. [Google Scholar] [CrossRef]
- Liu, X.; Long, Y. Automated identification and characterization of parcels with OpenStreetMap and points of interest. Environ. Plan. B Plan. Des. 2016, 43, 341–360. [Google Scholar] [CrossRef]
- Halkidi, M.; Batistakis, Y.; Vazirgiannis, M. On Clustering Validation Techniques. J. Intell. Inf. Syst. 2001, 17, 107–145. [Google Scholar] [CrossRef]
- Liu, P.; Zhou, D.; Wu, N. VDBSCAN: Varied Density Based Spatial Clustering of Applications with Noise. In Proceedings of the 2007 International Conference on Service Systems and Service Management, Chengdu, China, 9–11 June 2007; pp. 1–4. [Google Scholar]
- Parimala, M.; Lopez, D.; Senthilkumar, N.C. A Survey on Density Based Clustering Algorithms for Mining Large Spatial Databases. Int. J. Adv. Sci. Technol. 2011, 31, 59–66. [Google Scholar]
- Khan, K.; Rehman, S.U.; Aziz, K.; Fong, S.; Sarasvady, S. DBSCAN: Past, present and future. In Proceedings of the Fifth International Conference on the Applications of Digital Information and Web Technologies (ICADIWT 2014), Bangalore, India, 17–19 February 2014; pp. 232–238. [Google Scholar]
- Gaonkar, M.N.; Sawant, K. AutoEpsDBSCAN: DBSCAN with Eps Automatic for Large Dataset. Int. J. Adv. Comput. Theory Eng. 2013, 2, 11–16. [Google Scholar]
- Starczewski, A.; Cader, A. Determining the Eps Parameter of the DBSCAN Algorithm. In Proceedings of the International Conference on Artificial Intelligence and Soft Computing (ICAISC 2019), Zakopane, Poland, 16–20 June 2019; pp. 420–430. [Google Scholar]
- Zhou, H.; Wang, P.; Li, H. Research on Adaptive Parameters Determination in DBSCAN Algorithm. J. Inf. Comput. Sci. 2012, 9, 1967–1973. [Google Scholar]
- Ester, M.; Kriegel, H.P.; Sander, J.; Xu, X. A Density-Based Algorithm for Discovering Clusters in Large Spatial Databases with Noise. In Proceedings of the International Conference on Knowledge Discovery & Data Mining (KDD-96), Oregon, Portland, 2–4 August 1996; pp. 226–231. [Google Scholar]
- Karami, A.; Johansson, R. Choosing DBSCAN Parameters Automatically using Differential Evolution. Int. J. Comput. Appl. 2014, 91, 1–11. [Google Scholar] [CrossRef]
- Maulik, U.; Bandyopadhyay, S. Performance evaluation of some clustering algorithms and validity indices. IEEE Trans. Pattern Anal. Mach. Intell. 2002, 24, 1650–1654. [Google Scholar] [CrossRef] [Green Version]
- Liu, Y.; Li, Z.; Xiong, H.; Gao, X.; Wu, J. Understanding of Internal Clustering Validation Measures. In Proceedings of the 2010 IEEE International Conference on Data Mining, Sydney, Australia, 14–17 December 2010; pp. 911–916. [Google Scholar]
- Liu, Y.; Li, Z.; Xiong, H.; Gao, X.; Wu, J.; Wu, S. Understanding and enhancement of internal clustering validation measures. IEEE Trans. Cybern. 2013, 43, 982–994. [Google Scholar] [CrossRef]
- Beijing Statistics Bureau. Beijing Statistics Yearbook in 2018; Chinese Statistics Press: Beijing, China, 2018.
- Beijing Municipal Commission of Planning and Natural Resources. The 2016–2035 Urban Master Plan of Beijing; Resources, B.M., Ed.; Beijing Municipal Commission of Planning and Natural Resources: Beijing, China, 2018.
- Sina Education. New Campus Opened in Suburbs of Several Universities in Beijing. Available online: http://edu.sina.com.cn/ (accessed on 26 March 2019).
- Zheng, S.; Kahn, M.E. Land and residential property markets in a booming economy: New evidence from Beijing. J. Urban Econ. 2008, 63, 743–757. [Google Scholar] [CrossRef]


| NO. | Category of POI | POI | POI Implication | Reference |
|---|---|---|---|---|
| 1 | Residence | Residence | Residential area, villa, dormitory, etc. | [6,8,31,33,34,39] |
| 2 | Education | Research and education | University, college, middle school, kindergarten, research institution, vocational school, primary school, training center, private school, etc. | [6,8,31,33,34,36,39] |
| 3 | Catering | Catering service | Chinese restaurant, foreign restaurant, fast-food restaurant, bakery, café, tea house, pub, bar, etc. | [6,8,31,33,35,36] |
| 4 | Shopping | Shopping service | Shopping mall, convenience store, supermarket, household appliance store, electronic product store, furniture and hardware store, etc. | [6,8,31,33,34,35,36] |
| 5 | Leisure and recreation | Sport and leisure service | Stadium, golf, swimming pool, bowling, gym, fitness, entertainment venue, leisure facility, movie theater, art gallery, etc. | [6,8,31,33,34,35,36] |
| Place of interest | Park, square, zoo, church, scenic spot, etc. | [33,34,35,36] |
| Category | Count | Proportion |
|---|---|---|
| Residence | 18,506 | 5.35% |
| Education | 40,546 | 11.72% |
| Catering | 79,624 | 23.02% |
| Shopping | 164,352 | 47.51% |
| Leisure and Recreation | 42,897 | 12.40% |
| POI Category | k-value | Parameters of DBSCAN | Number of UCs (POI Clusters) | CVNN | |
|---|---|---|---|---|---|
| Eps | MinPts | ||||
| Residence | 3 | 1227.60 | 77 | 19 | 2.0000 |
| 4 | 1673.10 | 132 | 9 | 0.9364 | |
| 5 | 1379.20 | 94 | 14 | 1.6941 | |
| 6 | 1706.10 | 136 | 9 | 0.9249 * | |
| Education | 3 | 903.43 | 136 | 30 | 1.9840 |
| 4 | 808.36 | 114 | 35 | 1.9751 | |
| 5 | 1056.40 | 176 | 20 | 1.3962 | |
| 6 | 1315.5 | 254 | 14 | 0.7927 * | |
| Catering | 3 | 293.32 | 51 | 263 | 2.0000 |
| 4 | 681.31 | 154 | 57 | 1.1139 | |
| 5 | 896.94 | 229 | 57 | 1.2145 | |
| 6 | 694.97 | 158 | 55 | 1.0997 * | |
| Shopping | 3 | 198.76 | 105 | 188 | 1.3885 |
| 4 | 446.54 | 228 | 104 | 1.3467* | |
| 5 | 580.45 | 301 | 84 | 2.0000 | |
| 6 | 718.92 | 382 | 62 | 1.9796 | |
| Leisure and Recreation | 3 | 720.98 | 76 | 46 | 1.6182 |
| 4 | 971.78 | 108 | 25 | 1.5098 | |
| 5 | 1674.10 | 232 | 11 | 1.2369 * | |
| 6 | 1942.9 | 293 | 10 | 1.5562 | |
| Urban Planning Zone | UCs with Different Functions | |||||
|---|---|---|---|---|---|---|
| Residence | Education | Catering | Shopping | Leisure and Recreation | ||
| Urban fringe areas | Qinghe | √ | √ | √ | √ | √ |
| Beiyuan | × | √ | √ | √ | √ | |
| Xiuxianqiao | √ | √ | √ | √ | √ | |
| Dongba | × | × | × | × | × | |
| Dingfuzhuang | √ | × | √ | √ | √ | |
| Fatou | × | × | × | × | × | |
| Nanyuan | × | × | × | × | × | |
| Fengtai | √ | × | √ | √ | √ | |
| Shijingshan | √ | √ | √ | √ | √ | |
| Xiyuan | √ | √ | × | √ | √ | |
| New towns | Changping | √ | √ | √ | √ | √ |
| Shunyi | × | × | √ | √ | √ | |
| Tongzhou | √ | √ | √ | √ | √ | |
| Yizhuang | × | × | √ | √ | × | |
| Daxing | × | √ | √ | √ | × | |
| Fangshan | √ | √ | √ | √ | √ | |
| Mentougou | √ | × | √ | √ | × | |
| Yanqing | × | × | √ | √ | × | |
| Huairou | √ | × | √ | √ | × | |
| Miyun | √ | × | √ | √ | × | |
| Pinggu | × | √ | √ | √ | × | |
© 2020 by the authors. Licensee MDPI, Basel, Switzerland. This article is an open access article distributed under the terms and conditions of the Creative Commons Attribution (CC BY) license (http://creativecommons.org/licenses/by/4.0/).
Share and Cite
Yu, L.; Yu, T.; Wu, Y.; Wu, G. Rethinking the Identification of Urban Centers from the Perspective of Function Distribution: A Framework Based on Point-of-Interest Data. Sustainability 2020, 12, 1543. https://0-doi-org.brum.beds.ac.uk/10.3390/su12041543
Yu L, Yu T, Wu Y, Wu G. Rethinking the Identification of Urban Centers from the Perspective of Function Distribution: A Framework Based on Point-of-Interest Data. Sustainability. 2020; 12(4):1543. https://0-doi-org.brum.beds.ac.uk/10.3390/su12041543
Chicago/Turabian StyleYu, Lu, Tao Yu, Yongxiang Wu, and Guangdong Wu. 2020. "Rethinking the Identification of Urban Centers from the Perspective of Function Distribution: A Framework Based on Point-of-Interest Data" Sustainability 12, no. 4: 1543. https://0-doi-org.brum.beds.ac.uk/10.3390/su12041543