Article

Applying a Multi-Criteria Project Portfolio Tool in Selecting Energy Peat Production Areas

1
Natural Resources Institute Finland (Luke), FI-80100 Joensuu, Finland
2
Natural Resources Institute Finland (Luke), FI-90014 Oulu, Finland
3
Department of Forest Sciences, University of Helsinki, FI-00100 Helsinki, Finland
4
Faculty of Science and Forestry, School of Forest Sciences, University of Eastern Finland, FI-80100 Joensuu, Finland
5
Forestry Centre Finland, FI-90100 Oulu, Finland
6
Natural Resources Institute Finland (Luke), FI-00790 Helsinki, Finland
*
Author to whom correspondence should be addressed.
Sustainability 2020, 12(5), 1705; https://0-doi-org.brum.beds.ac.uk/10.3390/su12051705
Submission received: 4 December 2019 / Revised: 19 February 2020 / Accepted: 22 February 2020 / Published: 25 February 2020
(This article belongs to the Special Issue Multiple Criteria Decision Making for Sustainable Development)

Abstract

:
This study demonstrates the characteristics of the new generic project portfolio selection tool YODA (“Your Own Decision Aid”). YODA does not include a mathematical aggregation model. Instead, the decision maker’s preferences are defined by the interactive articulation of acceptance thresholds of project-level decision criteria. Transparency and ease of adopting the method in participatory planning are sought using the method’s simple preference input. The characteristics of the YODA tool are introduced by presenting how it has been applied in participatory land use planning in northern Finland in selecting a combination of peat production sites to attain the goals defined at municipal level. In this process, each stakeholder first constructed a project portfolio that best met his or her preferences. In doing this, acceptance thresholds for project-level decision criteria were defined. In total, eight decision criteria were related to economic value, biodiversity, social impacts, and ecosystem services. Subsequently, the portfolios of different stakeholders were combined in line with the principles of robust portfolio modelling. Core projects were accepted by all stakeholders, while exterior projects were not accepted, and borderline projects by some of the stakeholders. Although the land use planning situation at hand was highly sensitive, because it was related to various aspects of sustainability, the use of YODA provided useful results. The first meeting with stakeholders identified 52 out of 99 sites that none of the stakeholders would use for energy peat production, due to their characteristics, whereas, in the second meeting, a smaller stakeholder group found 18 core projects and 26 borderline projects which could be potential areas for energy peat production. We conclude that YODA—as a generic project portfolio tool—can be used in various planning situations.

1. Introduction

Participatory land use planning is often a sensitive and complex process where multiple and often controversial objectives have to be taken into account [1]. Although achieving full consensus is a true challenge, the creation of feasible land use alternatives, their impact and trade-off analyses and comparisons may increase the possibilities of finding acceptable solutions and avoiding and/or solving conflicts [2,3,4]. As the awareness of immaterial benefits from nature is increasing, the emerging challenge is to develop new participatory methods that visualise the impacts of land-use alternatives and their trade-offs on various ecosystem services in an easily understandable way.
Peatlands are globally important wetland ecosystems, due to their high biodiversity values and the provision of multiple ecosystem services, such as timber, peat, carbon sequestration, water retention and recreation opportunities [5]. Energy peat production is an intensive way to use peatlands, and it is, therefore, coordinated at the national and regional level planning and regulated through environmental permits. Peat production is practiced in countries rich in peatlands, such as Finland, which accounts for 59% of the annual energy peat use in the European Union [6]. The opinions towards peat production are highly controversial, due to its positive impacts on the local economy and employment, but negative impacts on the environment and recreation [2].
Multi-objective planning related to the selection of peat production sites is typically carried out at different spatial scales in the context of land use planning. To increase the general acceptability of energy peat production, considerable efforts should be put to the larger planning levels (e.g. landscape, municipality and region), where the planning problem typically involves the selection of energy peat production sites among a large group of potential sites. At these levels, environmental, as well as social impacts, can properly be considered in the participatory planning processes, in addition to the conventional assessment of the peat production potential of the sites.
Land-use planning at larger spatial scales can be facilitated with various kinds of decision support tools [3,7]. From a methodological perspective, the search of an optimal set of peat production sites is a project portfolio selection problem [8,9], which deals with questions where to allocate the resources optimally, while simultaneously considering constraints and/or objectives related to the entire planning area [10]. When compiling efficient project portfolios, optimisation techniques and consideration of uncertainties related for example to stakeholder preferences and project benefits and costs are generally applied. In these stochastic approaches, uncertainty is explicitly included, e.g., into the estimation of outcomes of the decision alternatives and the stakeholders’ preferences, and thus, also in the optimal portfolio selection phase. Recent developments of project portfolio selection methods also consider project interdependencies [11], multiple decision makers [12], and interactive visualisation techniques [13].
The challenge of participatory land use planning processes is that the optimisation methods should not contradict too much with the participants’ preferred ways of grasping and processing information [14]. The requirements of a too complicated goal analysis technique and the participant’s preferred ways examining results from applied tools can be in conflict [15]. Contradictions may also be related to the selection between prior and progressive (interactive) articulations of preferences [16].
In participatory land-use planning, the impacts on various ecosystem services need to be considered simultaneously using multi-criteria methods that are simple enough to be used for stakeholders with different backgrounds [17]. Although several techniques have been developed to assess impacts of different land uses with aims to communicate information into participatory land use planning, the bridge between research and decision making is yet being built [18,19,20]. It is evident that in the participatory land-use planning process, both the process and its end result are important. A good participatory process enables the communication between participants and mutual learning, which increases the possibility of finding an acceptable solution. Previous studies have emphasised the importance of iterative stakeholder engagement to enable a more informed dialogue for decision making [21]. In addition, social land-use planners’ involvement in participatory planning processes can be seen as the key factor in finding solutions that do not result in trade-offs that are too severe, caused by alternative land use or management choices [22]. When making decisions on how peatlands are used, their multiple uses and functions, including climate change mitigation and biodiversity need to be considered carefully.
To support such challenging planning processes, we contribute to the existing methodology by presenting the new multi-criteria project portfolio selection decision support tool “YODA” (“Your Own Decision Aid”) through a real-life land use planning case from northern Finland. Its use affects the contents of the planning process by requesting the participants to concentrate on aspects essential in the search for a land-use solution for the planning area. In addition, it supports the identification of a commonly acceptable solution. In doing so, it integrates the knowledge co-produced with stakeholders directly into land-use planning. It also keeps the preference input required from stakeholders very simple.
In the case study, the focus is on low-productive drained peatlands. These are peatlands that have been drained for forestry, but that is currently being left aside from active forestry use, due to poor profitability. The results of this study provide information that can be used to improve the participatory land-use planning processes to ensure the characteristics of the planning process itself and its end result are simultaneously considered.

2. Materials and Methods

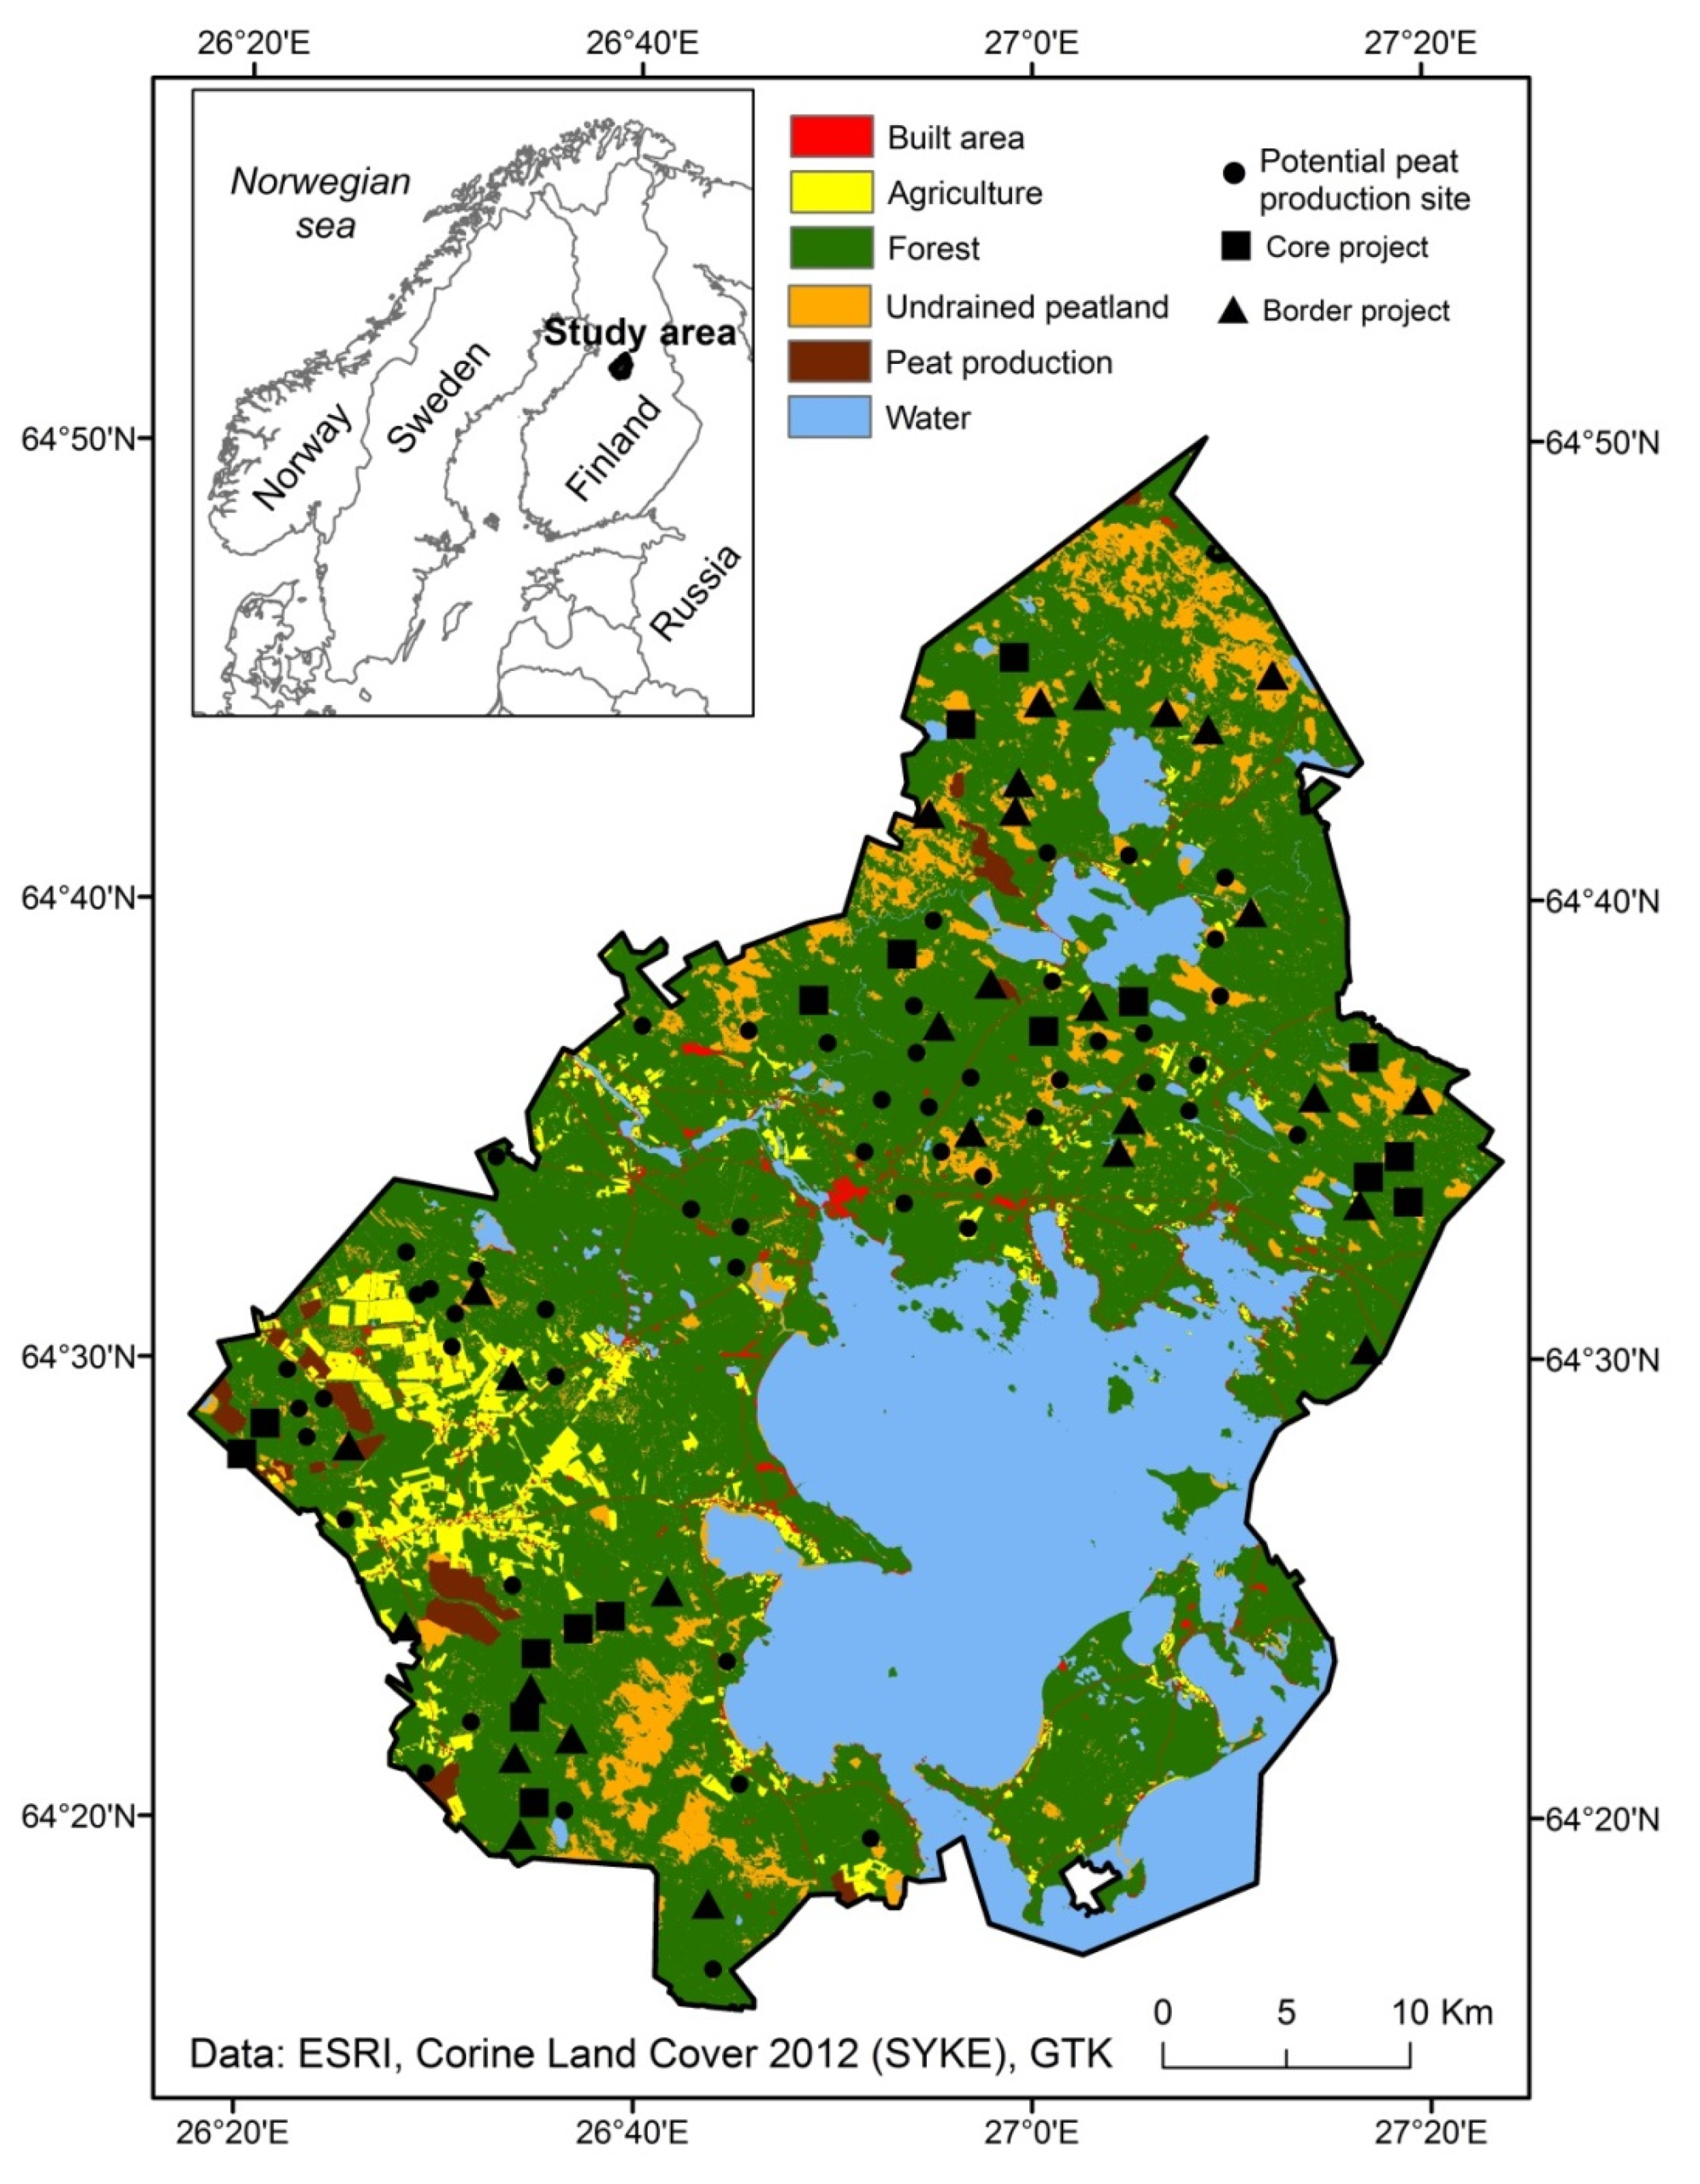
2.1. Potential Energy Peat Production Sites and Applied Decision Criteria

The Finnish Government Program on the sustainable use of mires and peatlands [23] states that all activities that considerably change the function of peatlands, such as peat production, should be allocated to drained or otherwise degraded peatlands. In the use of peatlands, the European Community also emphasises the obligations of the Water Framework Directive and the river basin-based planning for water pollution prevention. In Finland, regional councils are responsible for drawing up Regional Master Plans, which set out a framework for all local land use planning. Regional planning also obligates and limits the use of peatlands. The objectives of the Regional Master Plans are to reconcile the conflicting demands of peat production and to safeguard nationally and provincially valuable natural resources and biodiversity.
The Regional Master Plan of Northern Ostrobothnia in northern Finland was updated during 2010–2018 by the Council of the Oulu Region, which is the administrative unit for the plan. The third and last phase of the plan was in the proposal phase when this case study was carried out in 2016-2017. In the last phase, particular emphasis was placed on the maintenance and increase of the carbon stocks and sinks of peatlands and forests, and the reduction of climate impact and water pollution caused by the use of peatlands [24].
The case study area was the Vaala municipality, located within the boundaries of the above Regional Master Plan. The area of the municipality is 1764 km², of which 746 km² are peatland (Figure 1), and it has about 3,000 inhabitants. The municipality is located within one of the most paludified regions in Finland. Peatland drainage for agricultural use and forestry began decades ago, and there are several peat production sites, as well as mire conservation areas in the municipality. Based on geological surveys, there are plenty of thick-peat areas in the municipality that could be suitable for peat production. The earlier Master Plan of the municipality did not contain peatland site-specific planning, which provided an ideal opportunity to test YODA in a real and truly challenging land use planning case.
From the case study area, altogether 99 potential peat production areas were identified by the Geological Survey of Finland (GTK). The identification of these areas was based on two criteria: Mean peat thickness (≥ 1.5 meters) and the size of the peatland site basin (≥ 10 ha).
For these potential peat production sites, the various impacts from implementing energy peat production on the site were calculated by applying empirical models, various data sources and GIS routines. The basis for calculating the values are shown in Table 1 for the variables that were used as decision criteria during the participatory process. The pilot version of YODA was introduced to the most relevant stakeholders (representatives from GTK, The Council of Oulu Region and The Council of Kainuu Region) in June 2016. In this meeting, it was agreed that YODA would be used in the planning process.

2.2. Methodological Background of the YODA Tool
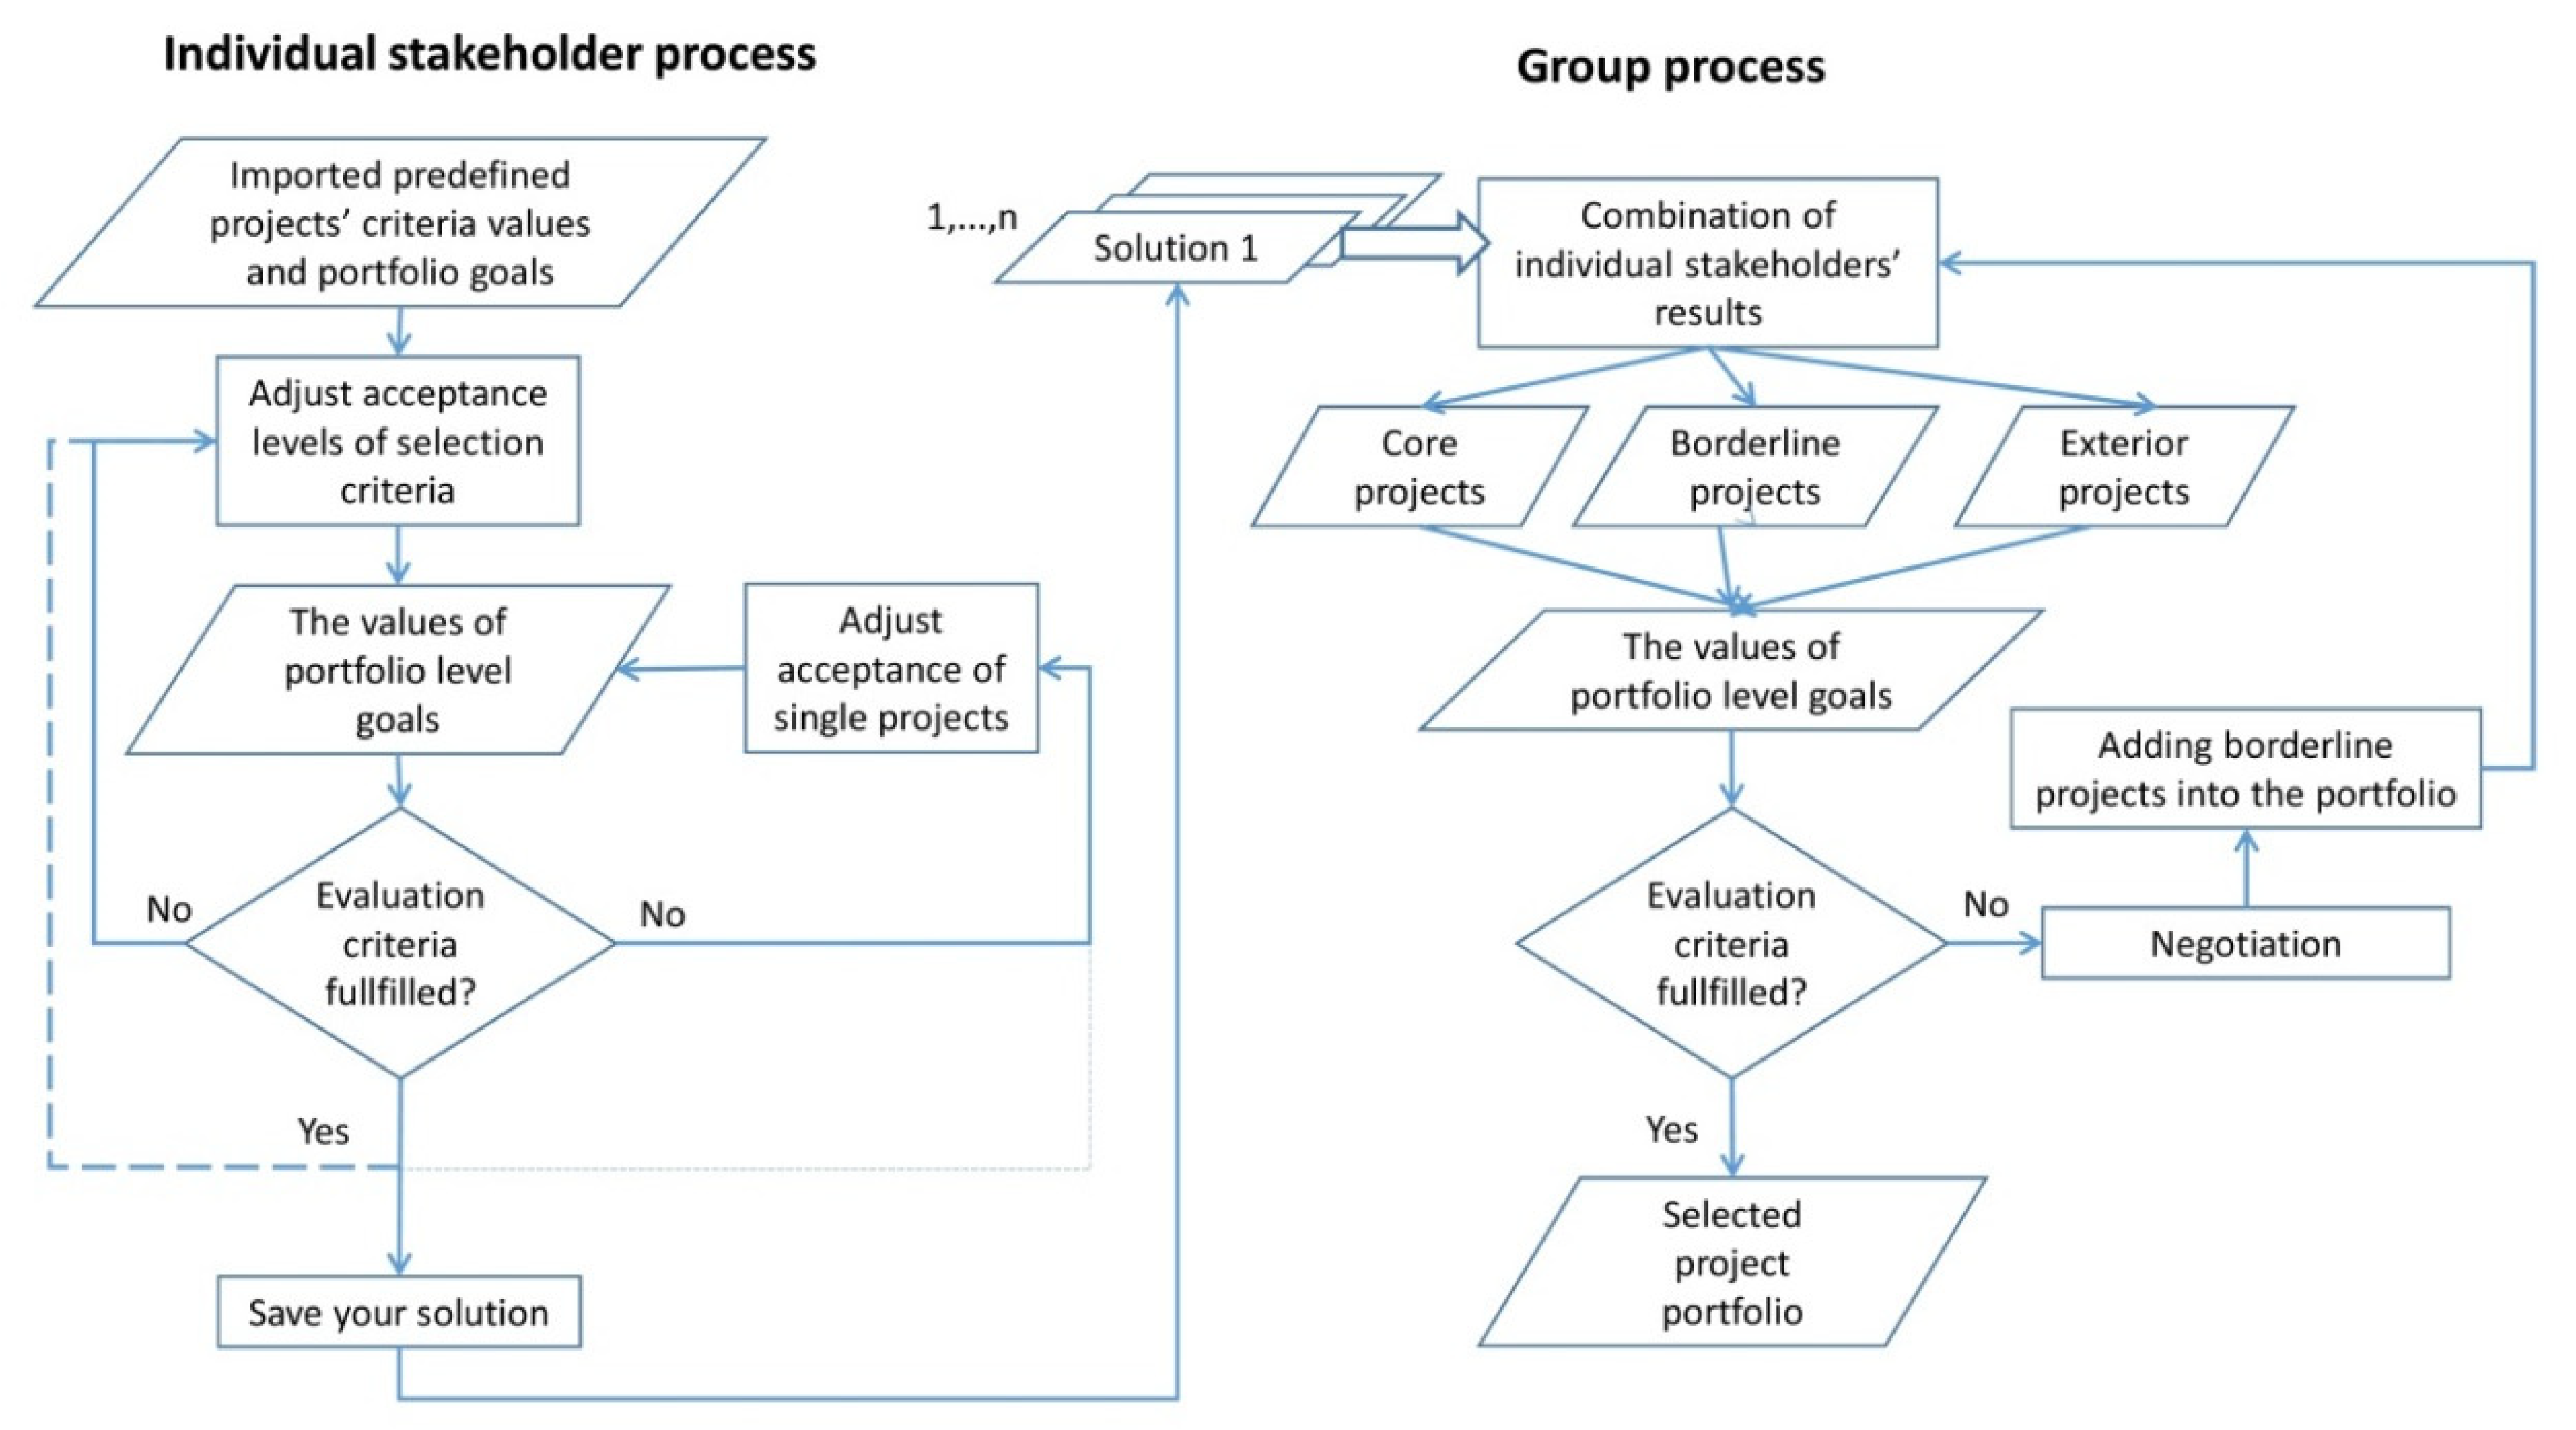
There are many multi-criteria analysis (MCA) methods which apply a weighting of decision criteria when analysing decision makers’ preferences. Correspondingly, the methods typically produce cardinal scale information that considers the priorities of the decision alternatives. For example, AHP [25], TOPSIS [26] and VIKOR [27] are traditional methods which belong to this category. However, some other MCA methods do not utilise cardinal-scale preference information in deriving the weights of the decision criteria. Correspondingly, these methods do not directly offer cardinal-scale priorities for the decision alternatives either. For example, the ELECTRE (Roy 1968, see Kangas et al. [3]) method offers potential for ranking and sorting, without resulting in priorities measured by using a cardinal scale. Most of the voting methods, e.g., plurality voting [28], approval voting [29], the Borda count method (de Borda 1781, e.g., Kangas et al. [3]), and Multi-criteria Approval [30]—also belong to this category. The main advantages of voting methods compared to methods utilising a cardinal scale are their ability to utilise the information at both the nominal and ordinal scales, and to provide decision support with less information than methods based on a cardinal scale. These characteristics may be valuable in participatory planning situations. However, the use of, e.g., ordinal scale information decreases the potential to analyse the results, for example, for performing sensitivity analyses.
The YODA method (www.luke.fi/YODA) applied in this study is based on the application of a voting method and interactive visualisation technique [13]. Originally, the method was developed to support a selection of single decision alternative [17,31]. In this selection, it utilises decision makers’ acceptance thresholds for decision criteria as an instrument of preference analysis. When applied to project portfolio selection problems with several decision makers, YODA also applies concepts from the robust portfolio modelling method [10] and allocates projects to different classes, based on their acceptance by the decision makers.
The theoretical background of YODA at individual user level resembles multi-criteria approval (MA) and multi-criteria approval voting (MAV) methods [3,30], because it utilises the principle of criteria-level approval/disapproval of decision alternatives. According to Fraser and Hauge [30], the approval border for each criterion is the average impact of alternatives. In using YODA, stakeholders subjectively define their acceptance thresholds for all criteria included in the decision problem (see also [17,31]). In YODA, there is no need to define the weights or even the importance order of criteria, which excludes the majority outcome of MA. This is because the alternatives in YODA need to be accepted with respect to all decision criteria simultaneously. YODA is interactive in the sense that it requests the individual user to continue the acceptance threshold definition until a unanimous result (when only one acceptable decision alternative should be identified) or project portfolio that is feasible with respect to portfolio-level constraints is achieved.
In the participatory energy peat production planning process, the YODA tool was first used independently by each stakeholder. Then, the results were combined and examined at the group level together with all stakeholders. The goal of using YODA was to select a combination of peat production sites (project portfolio) that attains the goals defined on the municipal level (portfolio level). The tool can, however, be used in any selection process with multiple criteria for which the impacts have been defined at least in an ordinal scale.
The use of YODA includes the following steps (Figure 2):
i.
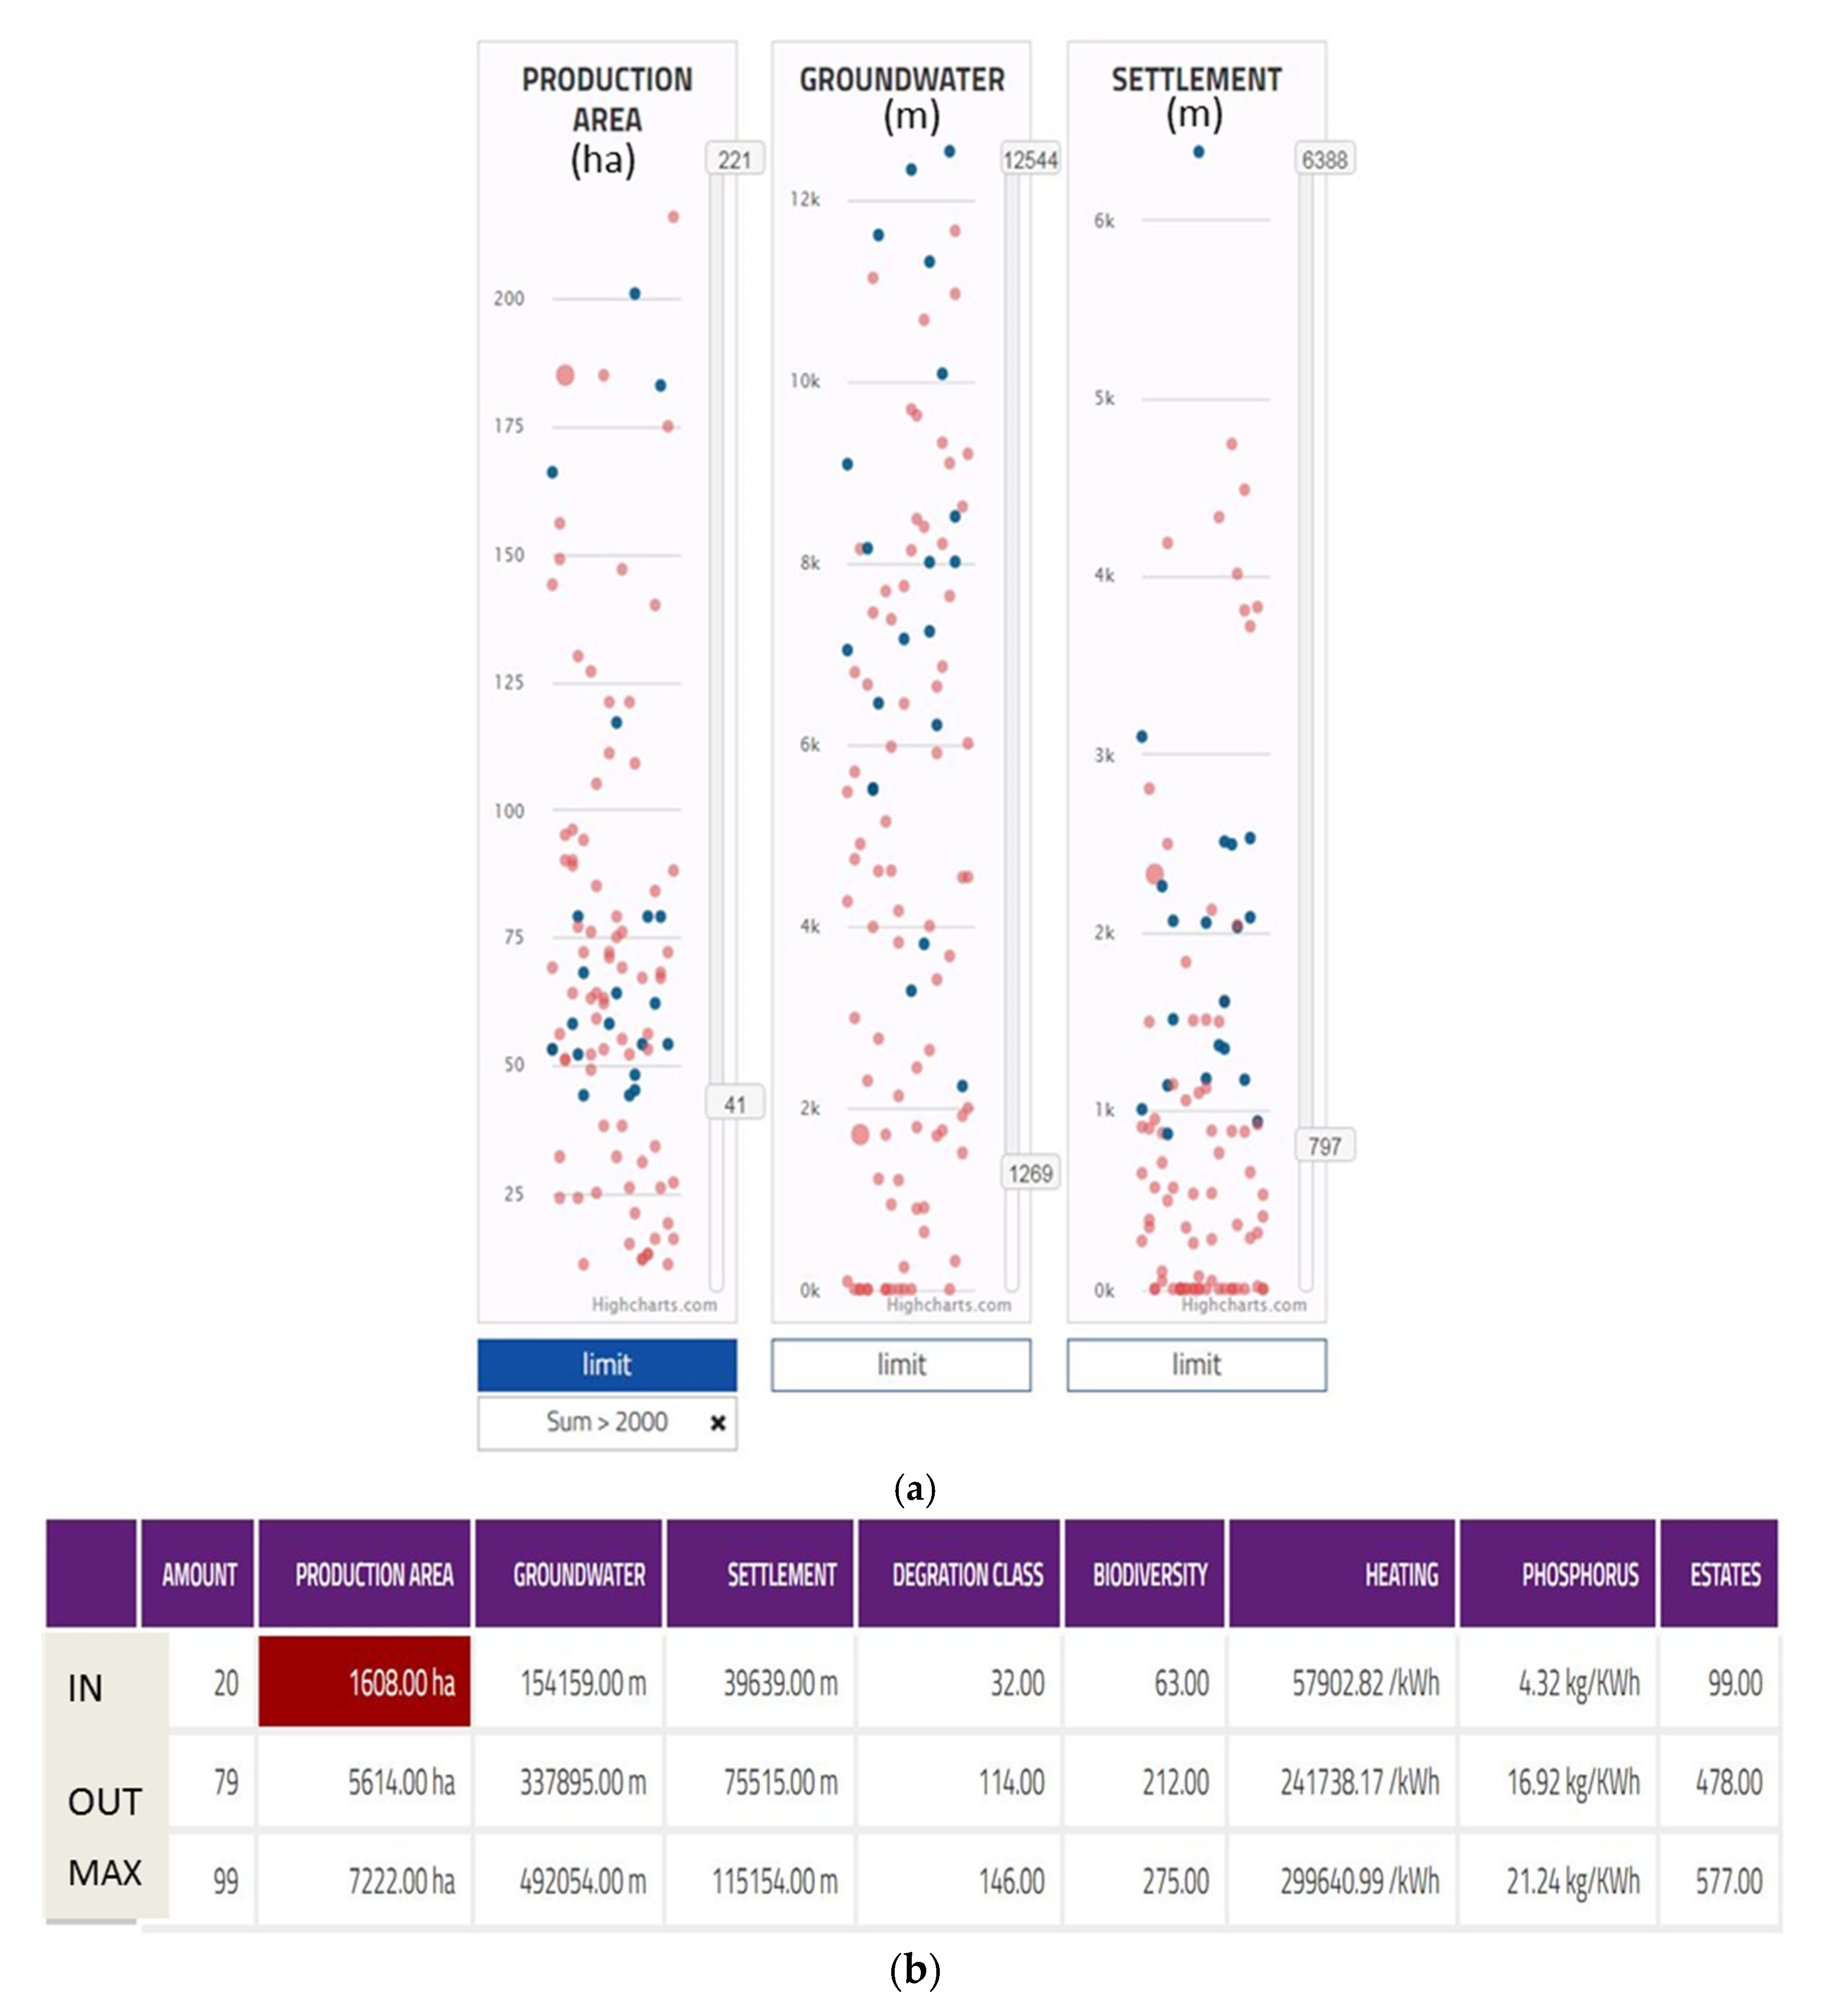
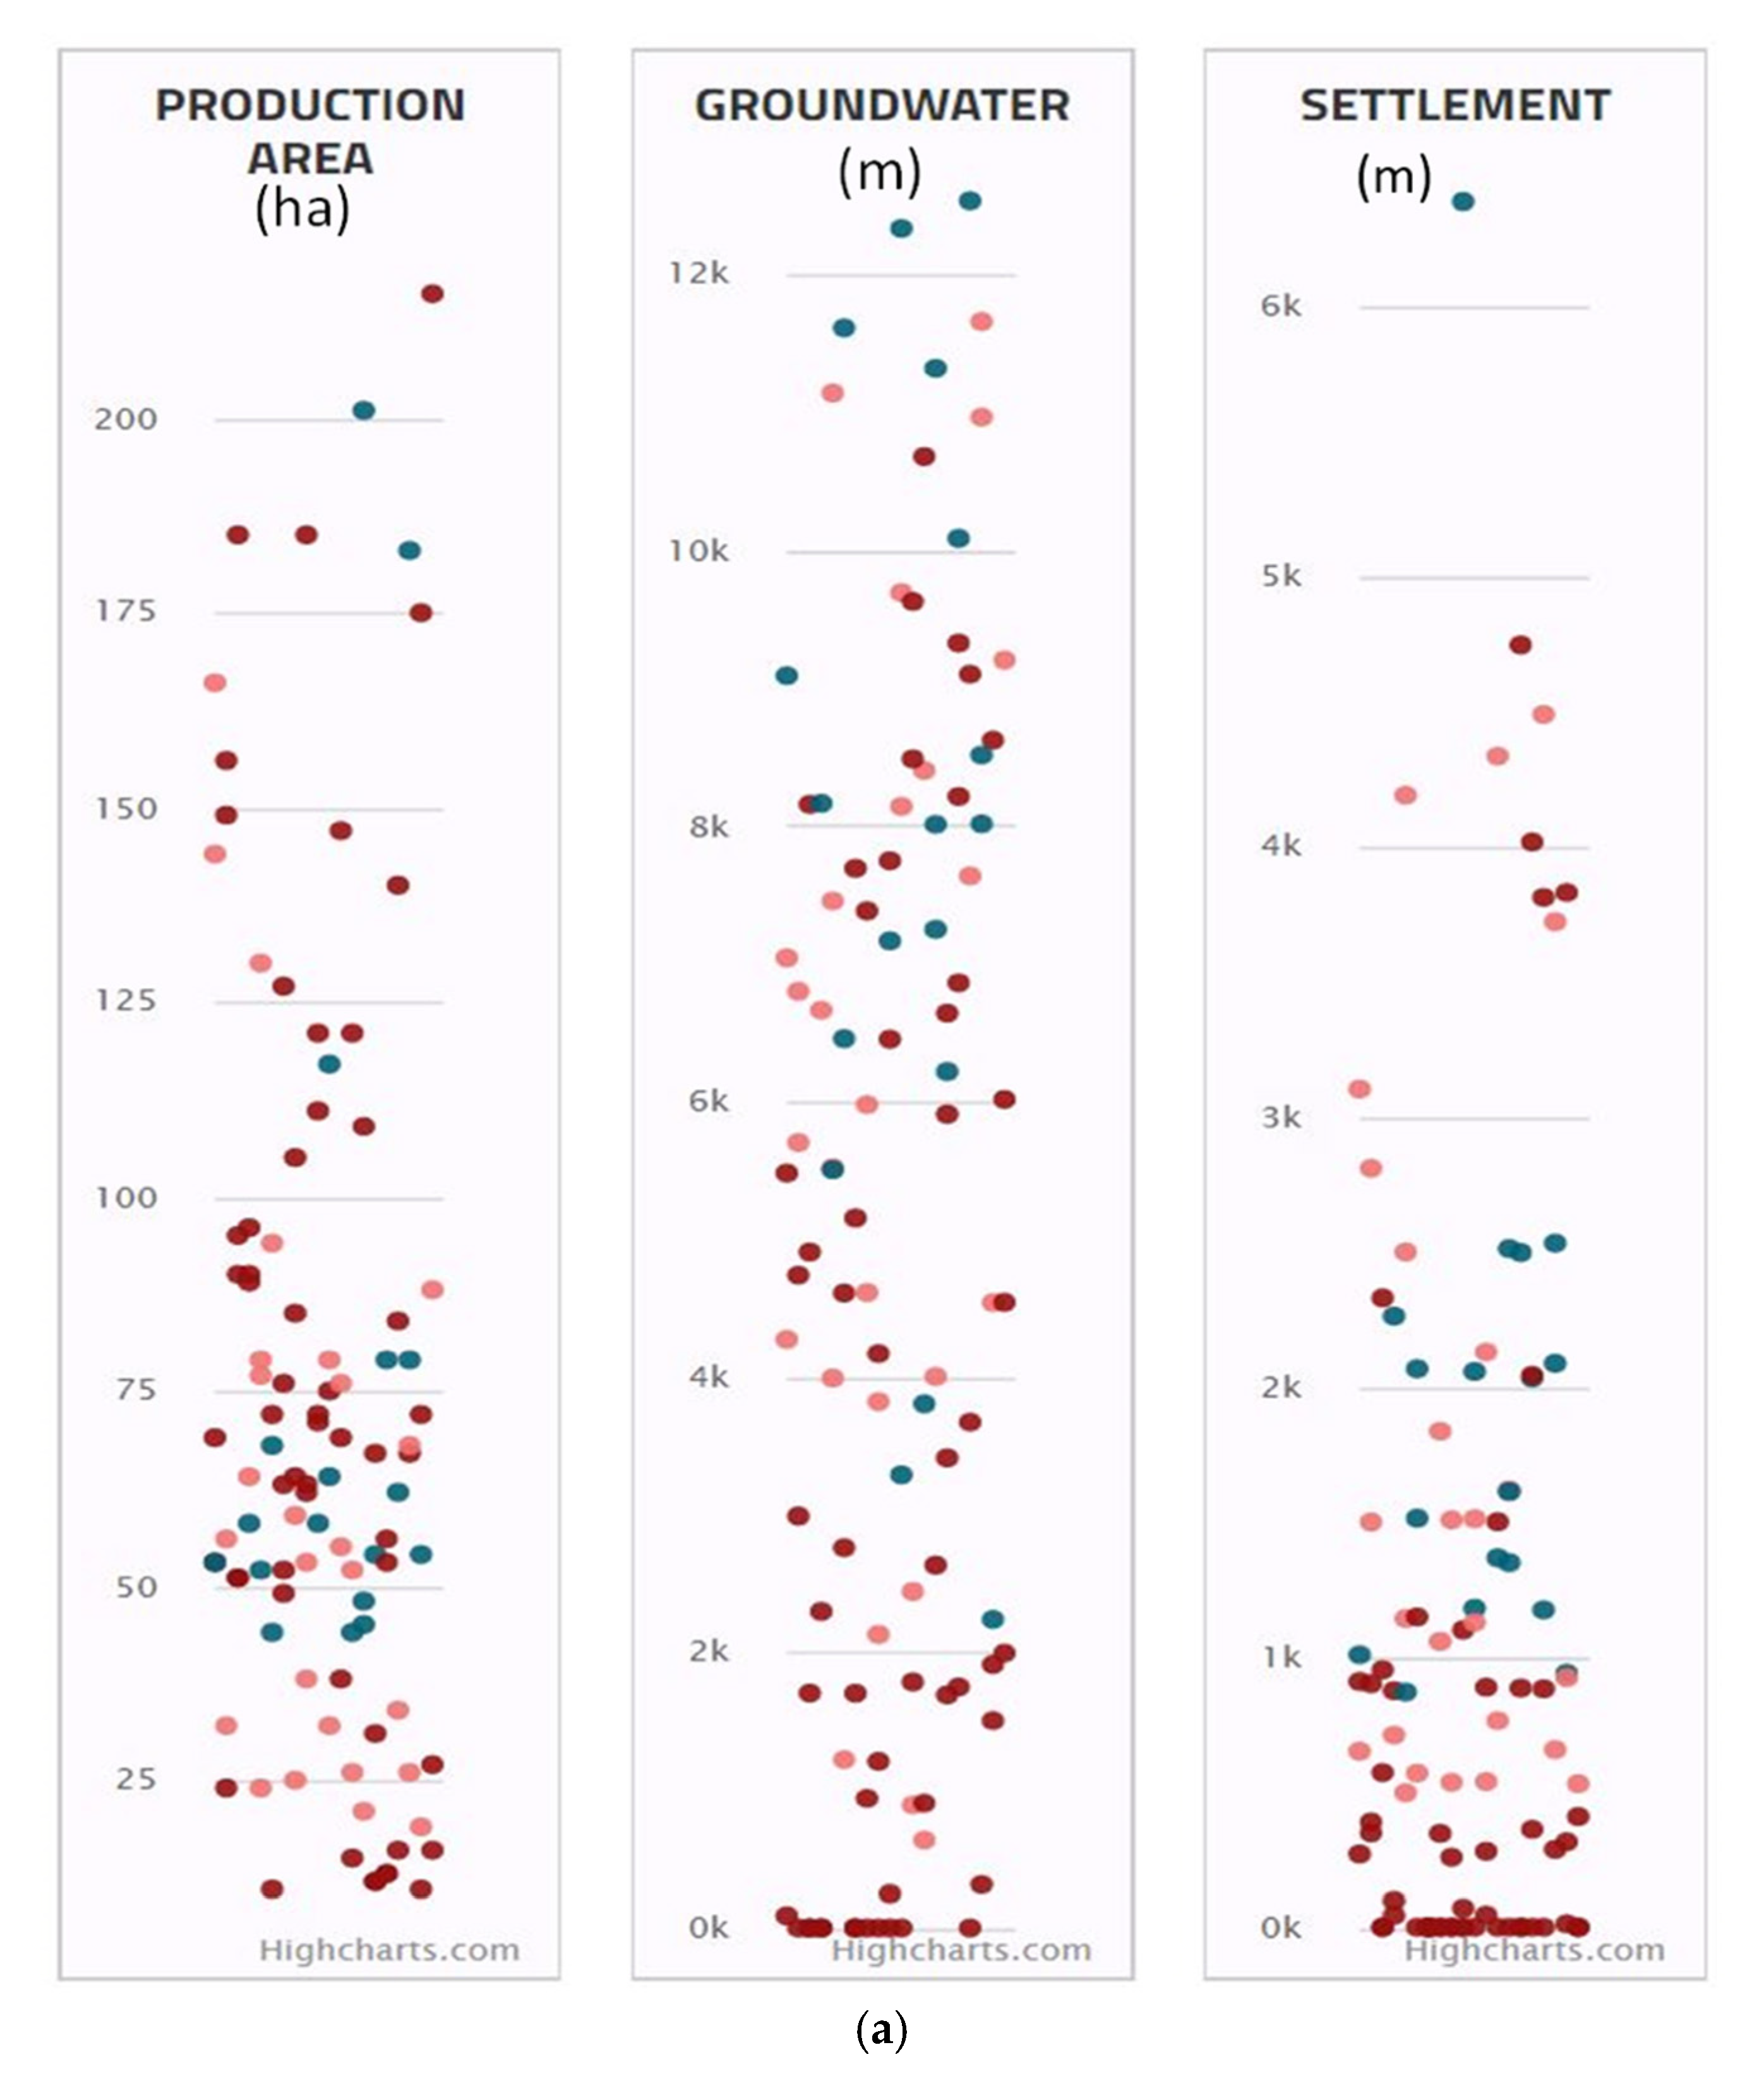
Define the acceptance thresholds for all decision criteria. In this step, each participating stakeholder is separately defining which project alternatives (in this case, the potential peat production sites) are acceptable with respect to the impacts they have on the selected decision criteria (e.g., biodiversity, energy peat production capacity). The visual interactive user interface of YODA (Figure 3) enables the user to interact with data through the parallel coordinate visualisation method [32].
ii.
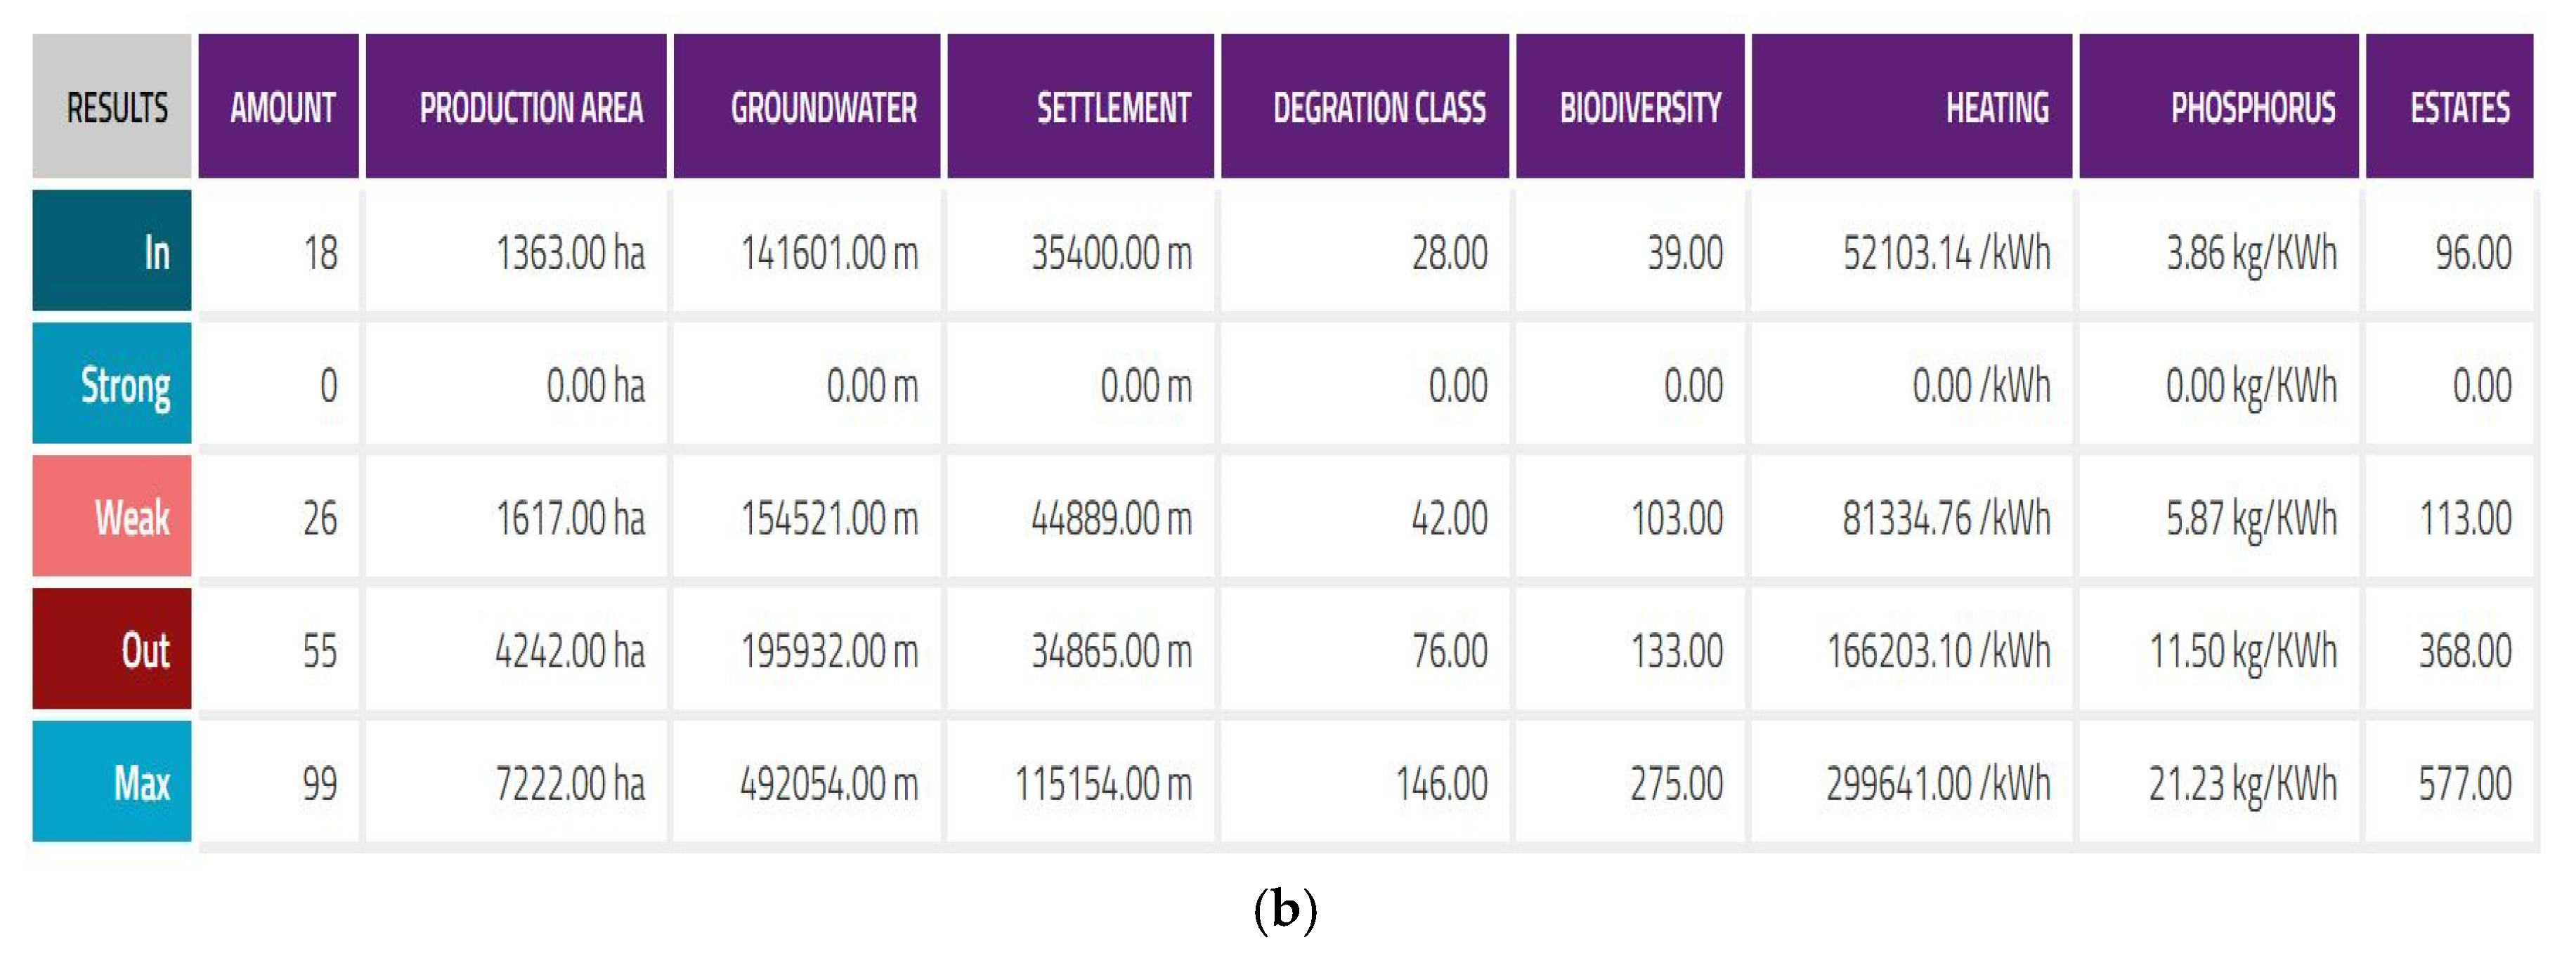
After individual stakeholders have defined the acceptance thresholds for all criteria, the result can be obtained. At individual level, two project-level outcomes are possible: (i) The project has been accepted with respect to all evaluation criteria (in Figure 3, projects calculated in “In” row); and ii) the project has not been accepted with respect all evaluation criteria (in Figure 3, projects calculated in “Out” row). In addition to the use of acceptance thresholds, the stakeholders are also able to subjectively include or exclude projects from the portfolio directly from the project database or from the interactive user interface. In project portfolio selection situations, constraints or goals regarding, e.g., annual budget and demanded outputs—measured on the level of the whole portfolio – are common and affect how many projects can/must be selected to the project portfolio [8]. Therefore, the selected portfolio may not meet the goal(s). In this situation, the stakeholders are requested to continue the acceptance threshold definition process until the constraints are met.
iii.
After individual level evaluations, the results are combined. Three different outcomes are possible: (i) The project is accepted by each stakeholder (being called “a core project”, see Liesiö et al. [10]); (ii) the project is accepted by some, but not all stakeholders (“a borderline project”); iii) the project is not accepted by any of the stakeholders (“an exterior project”). In addition, YODA allows the division of borderline projects into two sub-groups: Strong borderline projects (at least a certain number or proportion of stakeholders has accepted the project (e.g., 80% of stakeholders) and weak borderline projects (less than a specified number or proportion of stakeholders has accepted the project) (Figure 3).
iv.
The combined result forms the basis for the final construction of the project portfolio. Typically, the combined result shows that some core projects can be found, but they do not meet the goals set for the entire portfolio. Therefore, it is necessary to start adding some (strong) borderline projects to the portfolio. This can take place in a negotiation process which is facilitated through the YODA interface. The projects which are closest to become core projects can be identified, and the stakeholders can evaluate whether these could be accepted in the portfolio.
v.
Finally, the end result of this process should be the selected project portfolio that has been accepted by all stakeholders and fulfils the defined portfolio level goals.

3. Results

Before stakeholder participation, a planning session between project researchers and The Council of Oulu Region and The Council of Kainuu was organised in November 2016. In this session, the most relevant variables, which were to be used as decision criteria in the first meeting, were agreed upon (Table 1). It was also agreed that at the end of the planning process, there should be at least 2000 hectares of potential peat production sites identified for the master plan. This was, thus, specified as the portfolio level goal that the composed project portfolios should meet. This area is about two times larger than the area that will actually be allocated for peat production in the future. The reason for the use of larger portfolio level goal was that the use of the selected areas for energy peat production may not be possible in practice, due to various reasons. In particular, the controversies behind peat energy production, because its environmental impacts (Tolvanen et al., 2013) indicate that companies may not be able to start the production in some of the assigned sites, due to resistance by the general public and local and summer house owners.
The first meeting with a larger group of stakeholders was organised in January 2017. Thirteen stakeholders representing the Municipality of Vaala, the Regional Center for Economic Development, Transport and the Environment, the GTK, Turveruukki and Vapo peat production companies, Metsähallitus Forestry, The Central Union of Agricultural Producers and Forest Owners, The Finnish Association for Nature Conservation and the Councils of Kainuu and Oulu Region participated in this meeting. After the introduction of the planning situation and general framing, guidance to the use of YODA application was given to them. In addition, the contents and justifications for the pre-selected eight decision criteria were presented and discussed. Based on the discussions, the original data was restricted so that 31 potential peat production projects with the distance to the nearest nature protection area under 0.5 kilometres and the distance to the nearest groundwater area under 0.5 kilometres were excluded from data prior to the use of YODA. As a result of this decision, the final data set contained 68 potential energy peat production projects. Moreover, the portfolio level goal of finding at least 2000 hectares of potential energy peat production sites was justified to the stakeholders.
The stakeholders independently carried out their acceptance threshold definition processes through the YODA user interface during this meeting (Figure 3). Although all data were spatial, the locations and names of the preselected peat production sites were not revealed to the stakeholders to avoid the selection to be influenced by other than the eight decision criteria.
The calculation routines of YODA enabled to present the combined results to the stakeholders as early as at the end of the meeting. It became apparent that there were no core projects, i.e., none of the energy peat production projects was commonly accepted by all stakeholders’ independent evaluations. One reason was that one stakeholder kept the selected peatland area well below 2,000 ha, so that there were few projects to be agreed upon. Overall, 21 sites were defined as exterior projects (in addition to 31 peat production sites that were excluded beforehand). They were, thus, considered unsuitable for energy peat production by all stakeholders. The result of the first round was 47 borderline peat production sites. In the final discussion, comments for further development of the criterion variables were given. In addition, next meeting in which the second evaluation round with the same data would take place was agreed upon.
The second meeting was organized in February 2017. The four participants in this meeting represented the owner of the land use planning process, i.e., The Council of Oulu Region. For this meeting, a slightly modified set of decision criteria was used (Table 1) based on the feedback from the first meeting. The combined solution from these two evaluations can be seen in Figure 3. In total, there were 18 core projects and 26 borderline projects; the area of core projects still fell below the portfolio level goal of 2000 ha (Figure 4).
After the second meeting, the evaluation results from both meetings were used in the definition of the final portfolio of energy peat production sites. The core projects from the second meeting were used as the basis. The most potential borderline projects from the second meeting were examined with respect to their distance to settlements, their water bodies, groundwater areas and recreational use values, biodiversity values, as well as their peat production potential. In addition, 21 exterior projects of the first meeting were re-examined by the representatives of the administrative organisation. As a result, 29 peat production sites (2600 ha) were selected for the preliminary land use plan. However, the final, ratified Regional Master Plan included 17 peat production sites (1432 ha), due to discussions and decisions that took place later in the land use planning process [33].

4. Discussion

4.1. Characteristics and Future Development of YODA

The need to address multiple values in the use of natural resources and land use planning related decision making is evident, along with the growing knowledge about the impacts of economic activities on biodiversity and ecosystem services [34]. However, there is a gap between research and practical decision making: Different tools and scientifically sound results are available to support the multi-objective participatory decision processes, but they are rarely utilized extensively in real-life processes [18,35,36]. For this gap, a new portfolio selection tool, YODA, was developed and used with a sensitive real-life land use planning situation.
The developed tool is based on a disaggregated portfolio selection approach allowing the visualisation of impacts of a large number of projects with respect to multiple decision criteria through a novel graphical user interface. It does not demand the determination of criteria weights or an importance order for the applied decision criteria, because it is based solely on the evaluation of the acceptability of the criteria values of decision alternatives. In such an approach, conclusions regarding the criteria weights cannot be made without seeking this information directly from stakeholders. As a result, the method offers no potential for mathematical multi-objective optimisation [37]. Similarly, comparisons with other MCA methods would be difficult to perform. The fundamental aim when using YODA can, therefore, be considered to promote finding a commonly acceptable project portfolio instead of a mathematically optimal project portfolio. The benefit of YODA is that full control is given to the participating stakeholders’ evaluation, although the owners of the decision process can guide the evaluations through, e.g., setting portfolio level goals or constraints or preselection of the projects.
The fundamental approach of YODA can be considered as “optimisation by human judgement”, where the definition of acceptance levels is supported by interactive visualisation and immediate graphical and numeric feedback considering the currently selected project portfolio. As such, this approach seems to be easy to be understood by the stakeholders. The application of YODA may, therefore, enhance the legitimacy of the planning process and the acceptability of the result from the process. This is of particular importance in the selection of peat production sites. In addition, the characteristics of YODA respond to challenges presented by Olander et al. [36] regarding the relevance of research results for the practical ecosystem services-related decision making.
An essential component of portfolio selection methods is their ability to deal with stochastic aspects [9]. The current version of YODA is deterministic as it does not enable considerations related to project outcomes, for example. YODA only acknowledges the variation in the preferences of stakeholders through the application of the robust portfolio modelling based approach where the projects are assigned to different classes according to their membership in portfolios of individual stakeholders. However, it would be interesting to test an approach similar to fuzzy membership functions [38] to express the uncertainty related to individual stakeholders’ acceptance levels. In addition, the acceptance thresholds could be defined separately in different future scenarios, and the analysis of results would reveal which project should be implemented in different future conditions.
YODA can be used in multi-criteria decision support processes that use various kinds of data from an ordinal scale onwards. In this study, YODA was applied in a land use planning situation where the data were by its nature spatial. For example, the proximities of the potential peat production sites to various elements within the landscape were incorporated in the analysis. Technically, it would be possible to develop YODA so that the evaluation result is automatically visualised on a map too.

4.2. Participatory Planning Process with YODA

In the participatory planning process of this study, the use of YODA served both the organization of the process itself, as well as the finding the end-result [39]. The selection of energy peat production areas was known to be a very sensitive topic already when the process was planned. The use of YODA throughout the process forced the participants to concentrate on the selection of potential peat energy production sites instead of discussions related to topics that were not essential for the end-result. For the needs of the planning process, impacts of peat production were calculated with novel models and GIS analyses for several social, environmental and economic criteria (Table 1). The decision criteria were justified and discussed with the stakeholders. The process was adaptive, as the applied decision criteria were modified during the process, and therefore, the needs of the participatory process were acknowledged.
In the first stakeholder meeting, it was not possible to locate commonly acceptable peat production sites. However, the achieved results were valuable and used later in the process. The stakeholders were allowed to submit their answers also in a situation where the portfolio-level goal was not met. It is technically straightforward to force the stakeholders to continue the project selection as long as the constraints or goals are satisfied. In the present case, this was not considered to be a good option, as in web-based surveys that force the respondents to answer to every question or to choose between undesired options, the end result may be invalid data, frustration or the abandonment of the survey [40,41]. In public land use planning, all answers and opinions, also those that may be regarded as protests, need to be considered. On the other hand, forcing the stakeholders to fulfil the goals increases the number of core projects when the results are combined, and therefore, makes the search of a commonly acceptable solution easier.
For the success of the process, it was crucial not to reveal the exact locations of the potential peat production sites, since NIMBYism (“Not In My Back Yard”) indicates that people express preferences for positive environmental conditions closer to home and negative conditions further from home [42]. By hiding the locations of peat production sites, the stakeholders needed to make their evaluations based on the selected decision criteria only, instead of considering the locations of particular sites which may have subjective relevance. In addition, by excluding the sites located in the proximity of settlements prior to the evaluation process, it was possible to prevent the most severe impacts before the evaluations.
No formal feedback was collected in stakeholder meetings. However, the role of YODA was emphasised in the ratified Regional Master Plan [33]. Particularly, the owners of the decision process, i.e., the representatives of the Council of Oulu Region, gave positive feedback on the method and process organised around it. They also emphasised its potential use in various other land use planning processes.
In addition, informal feedback after the first stakeholder meeting clearly indicated that the stakeholders were interested in the use of YODA in the present conflict-sensitive multi-criteria land use planning process. In the meetings, stakeholders concentrated on the definition of their acceptance thresholds and arrived at an end result that was in line with their preferences. The stakeholders also identified several other potential application possibilities where YODA could be useful. For example, the restoration of formerly drained peatlands is a very similar decision situation. In addition, YODA could be applied when selecting timber harvesting areas, conservation areas and forest road construction areas, just to give some examples from a land use planning and natural resources management perspective.

5. Conclusions

A success of participatory land use planning can be evaluated from the perspective of the outcome and process [39]. The decision support tools that are applied in these processes should serve both of these perspectives. The new portfolio selection tool, YODA, was able to tackle some of the challenges of these processes by visualising information that is relevant in decision making in an easily comprehensible format. It offered an interactive visual user-interface through which the participants of the planning process could articulate their preferences in a straightforward manner by utilizing an approach based on a voting method. The end result is immediately available for individual participants, as well as for the whole group. In this way, the transparency of the process was improved. The YODA tool helped the stakeholders to concentrate on the evaluation of potential peat production sites at the planning area level and raised new ideas among the participants on its future application possibilities, for example, by illustrating the results from approval border evaluations through maps and even making the maps interactive.
We conclude that YODA can be used in demanding real-life land use planning situations which involve multiple projects, criteria, and participants. In addition to land-use planning, it can be applied in various other fields. It is suitable, for example, to support candidate selection where the candidates need to meet certain criteria [43], and it could be directly used in the evaluation of research proposals or case studies that need to respond to certain (pre-)specified criteria [44], and in many other multi-criteria project portfolio selection situations with portfolio-level constraints. The MCA method of YODA could also be studied and further developed. In particular, using the decision criteria weights or rankings might be an interesting direction. In addition to using this information when a commonly acceptable solution is sought with stakeholders [17], information might be used in a similar manner to MA, in which the majority of result alternative(s) are approved with respect to the majority of criteria in the (commonly agreed) importance order. This might help to find a commonly acceptable solution in challenging situations, such as this.

Author Contributions

Conceptualization of the study was done by M.K., A.J. and A.T. calculation of criteria values was done mainly by M.S., but with the help of all authors; YODA software was developed by A.H., M.K. and J.P. and writing of the manuscript was done jointly by all authors. All authors have read and agreed to the published version of the manuscript.

Funding

This work was carried out as a part of the LIFEPeatLandUse project (LIFE12 ENV/FI/000150).

Acknowledgments

The cooperation with the Council of Oulu Region and other stakeholders enabled the testing of the YODA tool in a real land use planning process. The authors want to thank also Kari Minkkinen and Timo Penttilä, whose unpublished data were used in calculations of climate warming effects.

Conflicts of Interest

The authors declare no conflict of interest. The funders had no role in the design of the study; in the collection, analyses, or interpretation of data; in the writing of the manuscript, or in the decision to publish the results.

Appendix A. Descriptions of Decision Criteria in the Potential Energy Peat Production Sites

Production area (ha): area of the potential energy peat production site. Data from the Geological Survey of Finland (GTK).
Energy content (GWh): energy content of peat in the potential peat production site. The variable was calculated by multiplying the dry matter of peat by the calorific value of milled peat (20.9 MJ/kg). Data on dry matter of peat at each site was provided by GTK.
Monetary value (€): the monetary value of the tree stand in the potential peat production site project. The value of the growing stock was calculated by multiplying the volume (m3/ha) of saw logs, pulpwood, and energy wood by tree species stumpage prices. The volume of energy wood was assessed as a residual by subtracting the volumes of sawn logs and pulpwood from the total stem volume. If the total stem volume was less than 30 m3/ha, the value of the growing stock was set to zero, because it is not economically feasible to harvest low density stands, due to harvesting costs. If the aggregated volume of sawn logs and pulpwood was less than 30 m3/ha, the total volume (>30 m3/ha) was multiplied by the stumpage price of energy wood. The stumpage prices (€/m3) were 49.54, 15.28, 49.42, 15.08, 36.11, 16.75, and 2.76 for pine sawn logs, pine pulpwood, spruce sawn logs, spruce pulpwood, birch and other deciduous tree sawn logs, birch and other deciduous tree pulpwood, and energy wood respectively. The value of the growing stock was first calculated for each grid (16 x 16 m) and then aggregated for peat production areas. Data on the growing stock was obtained from Multi-Source National Forest Inventory (MS-NFI 2013) data (16 x 16 m). Data on stumpage prices were obtained from Natural Resources Institute Finland (Luke) statistics.
Groundwater (m): distance of the potential peat production site to the nearest groundwater area. Data on ground water areas from the Finnish Environment Institute.
Settlement (m): distance of the potential peat production site to the nearest settlement. Data on settlements from the National Land Survey of Finland.
Degradation class: the degradation level of the potential peat production site based on the impact of drainage on the site. The classification was based on the drainage stage of peatlands and aerial photographs. Guidelines of the Ministry of the Environment concerning the sustainable use of mires and peatlands in land use planning [45] were used. The values used in this study varied from 0 to 3: 0 = irrevocably changed (profound hydrological and vegetation changes); 1 = changed (hydrological and vegetation changes clear); 2 = both drained and undrained parts occur in the peatland area; 3 = most of the peatland area is undrained. Data on the drainage stage of peatlands (resolution 25 x 25 m) from the Finnish Environment Institute, classification of degradation level made by the regional environmental authority.
Biodiversity of the potential peat production site. The index was assessed by applying the guidelines of the Ministry of the Environment concerning sustainable use and planning of peatlands [45]. In the guideline, six criteria that are expected to capture the most important determinants of biodiversity values of peatlands were used: (1) habitat types (mire site types, water formations); (2) peatland complex types and geomorphological formations; (3) presence of threatened plant and bird species; (4) habitat connectivity; (5) coverage of undrained peatland area; (6) habitat suitability predictions for threatened mire plant species using the habitat suitability modelling method Maxent v3.3.3k. The formula was: 0.3 × total points of habitat types + 0.1 × total points of mire complex types and geomorphological formations + 0.2 × total points of species + 0.15 × total points of connectivity + 0.1 × points of the proportion of undrained peatland area + 0.15 × total points of habitat suitability modelling. Drainage stage data on peatlands (resolution 25 x 25 m) from the Finnish Environment Institute, occurrence records of threatened mire plant and bird species from the Finnish Environment Institute, data on stand volumes (m3/ha) (MS-NFI-data) from Luke, data on topography and digital elevation model (DMI) (resolution 10 x 10 m) from National Land Survey of Finland. For further details of calculations, see Juutinen et al. [37].
Heating (Mg CO2 equivalents/m2/year): climate-warming effect if energy peat production takes place at the potential peat production site. The variable was based on total emissions of CO2, CH4, and N2O, which were converted to CO2 equivalents by multiplying them by respective global warming potentials for a 100-year time interval (GWP100, 34 for methane, 298 for nitrous oxide). Emissions included carbon storage of the current tree biomass (based on MS-NFI-data) emitted into the atmosphere as CO2 during the first year, soil emissions during the preparation and production period (for emission factors, see Juutinen et al. [37]), and CO2 emissions from burning peat for energy (data on dry matter of peat from GTK). For further details on calculations, see Juutinen et al. [37].
Phosphorus (kg/ha): phosphorus load to watercourses if energy peat production takes place in the potential peat production site. The phosphorus exports of peat production were estimated as the product runoff and “specific” concentrations [46]. Daily runoffs were first simulated by the FEMMA-model [47], and values were added to estimate the total annual runoffs. The runoff simulations were performed for one calendar year representing an average year with respect to air temperature and precipitation conditions during the last 30-year period (1981–2010) in the study area. Daily weather data from the Finnish Meteorological Institute was utilised as input data in runoff modelling. For more details on calculations, see Juutinen et al. [37].
State-owned land (%): percentage of state-owned land in the potential peat production site. Data from the National Land Survey of Finland.
Estates (number): number of landowners in the potential peat production site. Data from the National Land Survey of Finland.

References

  1. Webler, T.; Tuler, S.; Krueger, R. What is a Good Public Participation Process? Five Perspectives from the Public. Environ. Manag. 2001, 27, 435–450. [Google Scholar]
  2. Tolvanen, A.; Juutinen, A.; Svento, R. Preferences of Local People for the use of Peatlands; the Case of the Richest Peatland Region in Finland. Ecol. Soc. 2013, 18. [Google Scholar] [CrossRef] [Green Version]
  3. Kangas, A.; Kurttila, M.; Hujala, T.; Eyvindson, K.; Kangas, J. Decision Support for Forest Management, 2nd ed.; Springer: Berlin/Heidelberg, Germany, 2015; p. 307. [Google Scholar]
  4. Triviño, M.; Pohjanmies, T.; Mazziotta, A.; Juutinen, A.; Podkopaev, D.; Le Tortorec, E.; Mönkkönen, M. Optimizing Management to Enhance Multifunctionality in a Boreal Forest Landscape. J. Appl. Ecol. 2017, 54, 61–70. [Google Scholar] [CrossRef]
  5. Zedler, J.B.; Kercher, S. Wetland Resources: Status, Trends, Ecosystem Services, and Restorability. Annu. Rev. Environ. Resour. 2005, 30, 39–74. [Google Scholar] [CrossRef] [Green Version]
  6. Gadonneix, P.; Kim, Y.D.; Meyers, K.; Ward, G.; Frei, C. Chapter 6: Peat. In World Energy Resources 2013; World Energy Council: London, UK, 2013. [Google Scholar]
  7. Keeney, R.L.; Raiffa, H. Decisions with Multiple Objectives: Preferences and Value Tradeoffs; Wiley: New York, NY, USA, 1976. [Google Scholar]
  8. Kleinmuntz, D.N. Resource Allocation Decisions. In Advances in Decision Analysis: From Foundations to Applications; Edwards, W., Miles, R.F., Jr., von Winterfeldt, D., Eds.; Cambridge University Press: Cambridge, UK, 2007; pp. 400–418. [Google Scholar]
  9. Salo, A.; Keisler, J.; Morton, A. (Eds.) Portfolio Decision Analysis: Improved Methods for Resource Allocation; Springer International Series in Operations Research & Management Science; Springer: New York, NY, USA, 2011; p. 409. [Google Scholar]
  10. Liesiö, J.; Mild, P.; Salo, A. Preference Programming for Robust Portfolio Modeling and Project Selection. Eur. J. Oper. Res. 2007, 181, 1488–1505. [Google Scholar] [CrossRef]
  11. Liesiö, J.; Mild, P.; Salo, A. Robust Portfolio Modeling with Incomplete Cost Information and Project Interdependencies. Eur. J. Oper. Res. 2008, 190, 679–695. [Google Scholar] [CrossRef]
  12. Salo, A.; Liesiö, J. A Case Study in Participatory Priority Setting for a Scandinavian Research Program. Int. J. Inf. Technol. Decis. Mak. 2006, 5, 65–88. [Google Scholar] [CrossRef]
  13. Haara, A.; Pykäläinen, J.; Tolvanen, A.; Kurttila, M. Use of Interactive Data Visualization in Multi-Objective Forest Planning. J. Environ. Manag. 2018, 210, 71–86. [Google Scholar] [CrossRef]
  14. Kolb, D.A. Experiential Learning: Experience as the Source of Learning and Development; Prentice-Hall: Upper Saddle River, NJ, USA, 1984; p. 256. [Google Scholar]
  15. Turban, E. (Ed.) Decision Support and Expert Systems. Managerial Perspectives; Macmillan Publishing Company: New York, NY, USA, 1988; p. 482. [Google Scholar]
  16. Pykäläinen, J. Defining Forest Owner’s Forest-Management Goals by Means of a Thematic Interview in Interactive Forest Planning. Silva Fenn. 2000, 34, 47–59. [Google Scholar] [CrossRef] [Green Version]
  17. Hiltunen, V.; Kurttila, M.; Leskinen, P.; Pasanen, K.; Pykäläinen, J. Mesta: An Internet-Based Decision-Support Application for Participatory Strategic-Level Natural Resources Planning. For. Policy Econ. 2009, 11, 1–9. [Google Scholar] [CrossRef]
  18. Primmer, E.; Furman, E. Operationalising Ecosystem Service Approaches for Governance: Do Measuring, Mapping and Valuing Integrate Sector-Specific Knowledge Systems? Ecosyst. Serv. 2012, 1, 85–92. [Google Scholar] [CrossRef] [Green Version]
  19. Bagstad, K.J.; Semmens, D.; Waage, S.; Winthrop, R. A Comparative Assessment of Tools for Ecosystem Services Quantification and Valuation. Ecosyst. Serv. 2013, 5, 27–39. [Google Scholar] [CrossRef]
  20. Tammi, I.; Mustajärvi, K.; Rasinmäki, J. Integrating Spatial Valuation of Ecosystem Services into Regional Planning and Development. Ecosyst. Serv. 2017, 26, 329–344. [Google Scholar] [CrossRef] [Green Version]
  21. Rosenthal, A.; Verutes, G.; McKenzie, E.; Arkema, K.K.; Bhagabati, N.; Bremer, L.L.; Olwero, N.; Vogl, A.L. Process Matters: A Framework for Conducting Decision-Relevant Assessments of Ecosystem Services. Int. J. Biodivers. Sci. Ecosyst. Serv. Manag. 2015, 11, 190–204. [Google Scholar] [CrossRef]
  22. Turkelboom, F.; Leone, M.; Jacobs, S.; Kelemen, E.; García-Llorente, M.; Baró, F.; Termansen, M.; Barton, D.N.; Berry, P.; Stange, E.; et al. When we Cannot have it all: Ecosystem Services Trade-Offs in the Context of Spatial Planning. Ecosyst. Serv. 2018, 29, 566–578. [Google Scholar] [CrossRef]
  23. Ministry of Agriculture and Forestry. Government Decision on the Sustainable use and Protection of Mires and Peatlands; Ministry of Agriculture and Forestry: Helsinki, Finland, 2012. (In Finnish)
  24. Pohjois-Pohjanmaan Maakuntakaavan Uudistaminen 3. Vaihemaakuntakaavan Ehdotuksen Lausuntoaineisto 2017a. Kaavaehdotus. Maakuntahallitus 16.10.2017. 2017, pp. 1–154. Available online: https://www.pohjois-pohjanmaa.fi/aluesuunnittelu/maakuntakaavoitus/3_vaihemaakuntakaava_voimaan (accessed on 24 February 2020). (In Finnish).
  25. Saaty, R.W. The Analytic Hierarchy Process—What it is and how it is Used. Math. Model. 1987, 9, 161–176. [Google Scholar] [CrossRef] [Green Version]
  26. Hwang, C.L.; Yoon, K. Multiple Attribute Decision Making: Methods and Applications; Springer: New York, NY, USA, 1981; p. 259. [Google Scholar]
  27. Duckstein, L.; Opricovic, S. Multiobjective Optimization in River Basin Development. Water Resour. Res. 1980, 16, 14–20. [Google Scholar] [CrossRef]
  28. Cranor, L.F. Declared_Strategy Voting: An Instrument for Group Decision Making. Ph.D. Thesis, Washington University, St. Louis, MO, USA, 1996; pp. 1–151. [Google Scholar]
  29. Roush, F.W. Approval Voting: S.J. Brams and P.C.; Fishburn, Boston: Birkhauser, 1983, 198 Pages. Math. Soc. Sci. 1983, 6, 123–124. [Google Scholar]
  30. Fraser, N.M.; Hauge, J.W. Multicriteria Approval: Application of Approval Voting Concepts to MCDM Problems. J. Multi-Crit. Decis. Anal. 1998, 7, 263–273. [Google Scholar] [CrossRef]
  31. Pasanen, K.; Kurttila, M.; Pykäläinen, J.; Kangas, J.; Leskinen, P. MESTAa—Non-Industrial Private Forest Owners’ Decision-Support Environment for the Evaluation of Alternative Forest Plans Over the Internet. Int. J. Inf. Technol. Decis. Mak. (IJITDM) 2005, 4, 601–620. [Google Scholar] [CrossRef]
  32. Inselberg, A.; Dimsdale, B. Parallel Coordinates: A Tool for Visualizing Multi-Dimensional Geometry. In Proceedings of the First IEEE Conference on Visualization: Visualization ’90, San Francisco, CA, USA, 23–26 October 1990; pp. 361–378. [Google Scholar]
  33. Pohjois-Pohjanmaan Maakuntakaavan Uudistaminen. Pohjois-Pohjanmaan Maakuntakaavan Uudistaminen, 3. Vaihemaakuntakaava, Kaavaselostus Hyväksytty 11.6.2018. 2018. Available online: https://www.pohjois-pohjanmaa.fi/aluesuunnittelu/maakuntakaavoitus/3_vaihemaakuntakaava_voimaan (accessed on 24 February 2020). (In Finnish).
  34. Tolvanen, A.; Aronson, J. Ecological Restoration, Ecosystem Services, and Land use: A European Perspective. Ecol. Soc. 2016, 21, 47. [Google Scholar] [CrossRef] [Green Version]
  35. Leskinen, P.; Hujala, T.; Tikkanen, J.; Kainulainen, T.; Kangas, A.; Kurttila, M.; Pykäläinen, J.; Leskinen, L. Adaptive Decision Analysis in Forest Management Planning. For. Sci. 2009, 55, 95–108. [Google Scholar]
  36. Olander, L.; Polasky, S.; Kagan, J.; Johnston, R.; Wainger, L.; Saah, D.; Maguire, L.; Boyd, J.; Yoskowitz, D. So You Want Your Research to be Relevant? Building the Bridge between Ecosystem Services Research and Practice. Ecosyst. Serv. 2017, 26, 170–182. [Google Scholar] [CrossRef]
  37. Juutinen, A.; Saarimaa, M.; Ojanen, P.; Sarkkola, S.; Haara, A.; Karhu, J.; Nieminen, M.; Minkkinen, K.; Penttilä, T.; Laatikainen, M.; et al. Trade-Offs between Economic Returns, Biodiversity, and Ecosystem Services in the Selection of Energy Peat Production Sites. Ecosyst. Serv. 2019, 40, 101027. [Google Scholar] [CrossRef]
  38. Zadeh, L.A. Fuzzy Sets. Inf. Control 1965, 8, 338–353. [Google Scholar] [CrossRef] [Green Version]
  39. Chess, C.; Purcell, K. Public Participation and the Environment: €‰ do we Know what Works? Environ. Sci. Technol. 1999, 33, 2685–2692. [Google Scholar] [CrossRef] [Green Version]
  40. Schonlau, M.; Fricker, R.D.J.; Elliott, M.N. (Eds.) Conducting Research Surveys via E-Mail and the Web; RAND Corporation: Santa Monica, CA, USA, 2002; p. 409. [Google Scholar]
  41. Sue, V.M.; Ritter, L.A. (Eds.) Conducting Online Surveys; Sage Publications: London, UK, 2012; p. 244. [Google Scholar]
  42. Brown, G.; Kangas, K.; Juutinen, A.; Tolvanen, A. Identifying Environmental and Natural Resource Management Conflict Potential using Participatory Mapping. Soc. Nat. Resour. 2017, 30, 1458–1475. [Google Scholar] [CrossRef]
  43. Alguliyev, R.; Aliguliyev, R.; Yusifov, F. Multi-Criteria Evaluation + Positional Ranking Approach for Candidate Selection in E-Voting. Decis. Mak. Appl. Manag. Eng. 2019, 2. [Google Scholar] [CrossRef]
  44. Tikkanen, J.; Haara, A.; Dinnie, L.; Reusser, D.; Hujala, T.; Kajanus, M.; Kangas, J.; Kurttila, M.; Leskinen, P. Stochastic Cognitive Mapping to Build Common Ground for Selecting Cases in Research Projects. Reg. Environ. Chang. 2019, 19, 913–926. [Google Scholar] [CrossRef]
  45. Ympäristöministeriö Rakennetun ympäristön osasto. Suot Ja Turvemaat Maakuntakaavoituksessa. Suom. Ympäristö 2015, 7, 1–112. (In Finnish) [Google Scholar]
  46. Palviainen, M.; Finér, L.; Laurén, A.; Mattsson, T.; Högbom, L. A Method to Estimate the Impact of Clear-Cutting on Nutrient Concentrations in Boreal Headwater Streams. Ambio 2015, 44, 521–531. [Google Scholar] [CrossRef] [PubMed] [Green Version]
  47. Koivusalo, H.; Ahti ELaurén, A.; Karvonen, T.; Nevalainen, R.; Finér, L. Impacts of Ditch Cleaning on Hydrological Processes in a Drained Peatland Forest. Hydrol. Earth Syst. Sci. 2008, 12, 1211–1227. [Google Scholar] [CrossRef]
Figure 1. The location of the case study area in Finland, main land cover classes and the investigated 99 potential energy peat production sites. The symbols describe the situation after the second meeting, where 18 core projects, 26 weak borderline projects and 65 exterior projects (marked with • symbol).
Sustainability 12 01705 g001
Figure 2. The use of YODA system in single stakeholder and group level described as a flowchart.
Sustainability 12 01705 g002
Figure 3. YODA’s graphical and interactive user interface from an individual stakeholder’s perspective (a) and summary table (b). The numbers at the right hand side of each bar show the acceptance borders defined by the stakeholder, in the above situation he/she has excluded projects with small criteria values (e.g., distance to groundwater area and settlement) from project portfolio. Blue dots indicate that the stakeholder has accepted the site with respect to all criteria, whereas the red dots show that the site has not been accepted with respect to at least one criterion. The table below the bars shows the up-to-date summed criterion values for sites that are included (IN) or excluded (OUT) from the current portfolio. Amount and estates refer to the number of peatlands and estates, respectively, whereas, degradation class and biodiversity do not have units. As the total production area in the stakeholder’s current project portfolio was below 2000 ha, the criterion value is shown in red in the YODA user interface. For the units of decision criteria, see Table 1.
Sustainability 12 01705 g003
Figure 4. The combined solution from the four answers of the four stakeholders in the graphical user interface of YODA (a, shown only partially) and in summary table (b). Peat production sites accepted by all four answerers (core projects) are shown in dark blue in the criteria bars; strong borderline projects are shown in light blue (accepted by three stakeholders), weak borderline projects in light red (accepted by one or two stakeholders) and exterior projects in dark red. The table below the bars shows summarised criteria values for four project classes, in which the first line shows the results for the currently selected project portfolio, including only core projects. For the units of decision criteria, see Table 1 and Figure 3 explanation.
Sustainability 12 01705 g004aSustainability 12 01705 g004b
Table 1. Decision criteria used in the two meetings (1 = first meeting; 2 = second meeting) and their definitions. For more details on the calculation principles, see Appendix A.
Criteria AbbreviationDefinition Meeting
Production area (ha)Area of the potential energy peat production site1, 2
Energy content (GWh)Energy content of peat1
Monetary value (€)The monetary value of tree stands in the potential peat production project1
Groundwater (m)Distance to the nearest groundwater area 2
Settlement (m)Distance to the nearest settlements 2
Degradation class (no unit)Varies from 0 (irrevocably changed) to 3 (undrained)1, 2
Biodiversity (no unit)Biodiversity indicator based on habitat type, peatland complex type and geomorphological formations, presence of threatened plant and bird species, habitat connectivity, coverage of undrained peatland area, and habitat suitability predictions for threatened mire plant species.1, 2
Heating (Mg CO2 equivalent/m2/year)Climate-warming effect if energy peat production takes place, based on CO2, CH4 and N2O.1, 2
Phosphorus (kg/ha)Phosphorus load to the water courses if energy peat production takes place1, 2
State-owned land (%)Share (%) of state-owned land within the potential peat production project1
Estates (n)Number of land owners within the potential peat production project2

