Article

Analysis of Barriers to Transitioning from a Linear to a Circular Economy for End of Life Materials: A Case Study for Waste Feathers

1
Dyson School of Design Engineering, Imperial College London, London, SW7 2DB, UK
2
Centre for Environmental Policy, Imperial College London, London, SW7 1NE, UK
3
Department of Civil and Environmental Engineering, Imperial College London, London, SW7 2BB, UK
*
Author to whom correspondence should be addressed.
Sustainability 2020, 12(5), 1725; https://0-doi-org.brum.beds.ac.uk/10.3390/su12051725
Submission received: 20 December 2019 / Revised: 21 February 2020 / Accepted: 22 February 2020 / Published: 25 February 2020

Abstract

:
This research aimed to develop a simple but robust method to identify the key barriers to the transition from a linear to a circular economy (CE) for end of life products or material. Nine top-tier barrier categories have been identified that influence this transition. These relate to the basic material properties and product characteristics, the availability of suitable processing technology, the environmental impacts associated with current linear management, the organizational context, industry and supply chain issues, external drivers, public perception, the regulatory framework and the overall economic viability of the transition. The method provides a novel and rapid way to identify and quantitatively assess the barriers to the development of CE products. This allows mitigation steps to be developed in parallel with new product design. The method has been used to assess the potential barriers to developing a circular economy for waste feathers generated by the UK poultry industry. This showed that transitioning UK waste feathers to circularity faces significant barriers across numerous categories and is not currently economically viable. The assessment method developed provides a novel approach to identifying barriers to circularity and has potential to be applied to a wide range of end of life materials and products.

1. Introduction

Many industries and governments are promoting the transition to a circular economy as a way to achieve improved and long-term sustainability and human development [1]. An essential part of a circular economy involves the re-use of materials and products at the end of life. Despite the well-documented benefits of a circular economy, the vast majority of materials and products used by society remain part of a linear economy. The transition from a linear to a circular economy (CE) has, therefore, become a key challenge of the 21st century [2]. A linear economy is one that involves resource extraction from the environment, material production, product manufacturing, with the product use phase followed by disposal. This depletes natural resources and is, in the long-term, fundamentally unsustainable. An alternative is a circular economy, which involves keeping material resources within the economic cycle by developing reuse and recycling and industrial symbiosis. As part of this effort, it is crucial to identify the barriers that exist to achieving a circular economy so that appropriate mitigating steps to overcome these barriers can be implemented. The potential economic benefits associated with moving to a circular economy business model have been widely reported [3,4].
Despite the benefits of a transition to a CE, the vast majority of materials and products remain part of a linear economy [5]. However, calculating global circularity is challenging due to the lack of appropriate metrics [6]. Research has quantified the extent of circular material use by society, and this is reported to be between 6 to 37% globally, indicating that 63 to 94% of all the materials and products we currently use are managed linearly [5,7]. Identifying the barriers to moving to a more circular economy is a vital first step to enable changes to be made to core practices, materials management scenarios and business and public perception. Extensive research has focussed on improving waste recovery systems in general without considering more specific barriers to circularity [8,9,10,11,12]. Many businesses do not currently take into account the full environmental impacts of the materials they use, and they continue to rely on resource extraction, material consumption and the production of waste materials at the end of life.
Different practical approaches can be used to promote circularity and reduce waste creation in the value chain. These can be reactive interventions that deal with waste after it has been generated, or proactive solutions that attempt to avoid waste generation. Proactive strategies occur during the product design stage, where, in many cases, the majority of the environmental impacts associated with a product are determined [13]. Eco-design and sustainable design strategies vary in approach from those focussed on supporting decision making, such as design for recycling, design for material avoidance and design to provide life extension, to those focussed on supporting analysis, such as the material input per unit of service [14].
Analysis tools are useful to map the material resources associated with a product and assess impacts to enable the re-design of systems and products. These include life cycle assessment (LCA) [15], material flow analysis (MFA) [16], multi-criteria assessments and decision support systems [17,18], all of which can promote circularity. However, these depend on the reliability of assumption-based inventory data and the selected system boundaries [19]. Trade-offs between environmental benefits and financial feasibility are not included, as this requires alternative approaches such as cost-benefit analysis (CBA) [20]. Conducting an effective LCA or an MFA is highly dependent on the skills and knowledge of the assessor [21]. These analysis tools provide information on the environmental impacts of product systems. However, they do not identify the barriers to circularity that are inhibiting the transition from a linear to a circular economy for a specific waste or end-of-life product.
The aim of this research was to develop an assessment method to determine the major barriers to circularity for end-of-life products and materials. The framework has been used by selected industry experts to assess the barriers to developing a circular economy for waste feathers produced by the UK poultry industry. Limitations of the method and the potential for future development are discussed.

2. Literature Review of Research on Barriers to A Circular Economy

The incentive to achieve circularity for a particular material or end of life product is significantly influenced by the value of the material involved [22]. The value is influenced by the value of the material but is also by a combination of economic, regulatory and perception factors [23,24,25]. A practical way to achieve more sustainable use of materials involves assessing the value of resources that can be recovered from a waste [26]. An assessment method to determine the potential for circularity has been proposed that relates the amount of waste generated to the availability of viable re-use technologies [27]. This was used to assess if a material is a “waste” or a “resource” from a technological context. The recycling potential has also been assessed using four quantitative factors to make informed decisions on re-use or disposal [28]. Reasons that can justify linear disposal have also been discussed [29]. The inherent value in materials can be lost in a linear economy because of inadequate recycling capacity, poor awareness of the benefits of a circular economy or low consumer acceptance of recycled materials [3].
Six barriers to a circular economy have been identified from industry guidance reports, policy white papers and academic research [30]. These barriers were related to financial, structural, regulatory, operational, attitudinal and technological issues. Motivational drivers can also influence the adoption of a circular economy [23,24]. However, economic viability, either through a direct return on investment or some other financial support mechanism, is fundamental to the transition from linear to circular in any business [31]. Without a clear positive business case, the transition is unlikely to happen. Financial viability is therefore often the primary barrier to circularity, although this is influenced by underlying technical, operational and regulatory issues. Determining and demonstrating the financial benefits and economic viability of the transition to circularity is a crucial step required to make the change happen. A systematic review of circular economy barriers also concluded that a lack of awareness of circular economy practices and how this can influence corporate performance was a significant barrier to developing a circular economy [32].
The design of products also has a key role in determining the potential for circularity. A qualitative study analysed the design of fifty different products and assessed their potential for circularity [33]. This identified issues associated with maintaining product quality throughout the life cycle, the quality of products made from recovered materials and issues related to ownership of products as the significant barriers.
Circular economy barriers related to specific industrial sectors have been identified. The lack of circularity in the construction industry was reported to be due to a lack of awareness of a circular economy and concern over the effect this could have on financial performance [34]. A metric system using numerical performance indicators has been proposed for use in the biotechnology sector to increase employer motivation to recycle [35]. A broad range of barriers was identified in the educational sector including a conservative approach to decision-making, lack of knowledge on waste solutions, misunderstandings about materials and their environmental impacts and a tendency to avoid risk [36].
Research has investigated the CE barriers influencing small and medium-sized enterprises (SMEs). Forty-four different types of CE barriers that were relevant to SMEs were identified [37]. However, the primary barriers were reported to be a lack of financial resources to make circularity happen, and this was related to the financial vulnerability of SMEs and a lack of managerial, design and sustainability competencies. Work has also identified the barriers to circular business models influencing companies in The Netherlands [38]. The barriers were different depending on the business model of the company, with internal and external barriers identified and critical challenges related to corporate externalities. Developing a more circular approach to waste management in China identified key barriers such as a lack of regulatory pressure, lack of environmental education, lack of concern for environmental protection and low market pressures and demand for circularity [39]. Other research has also confirmed that the primary barrier to developing a circular economy is uncertainty over the potential financial and operational effects on a company [40].
The literature review has shown that CE barriers are not sector or product-specific and that a range of different approaches to identifying CE barriers have been used. However, the studies to date have generally identified generic barriers that are vague, general, and too imprecise to be used to identify the real barriers inhibiting the linear to circular transition for specific materials or end of life products. What is needed is more specific guidance on appropriate questions to ask that relate to a particular waste or end of life product scenario. The method described in the following section takes the types of generic barriers identified in the literature and produces assessment guidance using more specific questions to assess the scale of the barriers in a case-specific but relatively simple way. The result is an assessment method that can identify barriers inhibiting the transition from a linear to a circular economy. This is critically important because understanding the barriers is an essential step to enable appropriate actions to be taken to achieve the transition.

3. Methodology to Identify Barriers to the Linear to Circular Transition

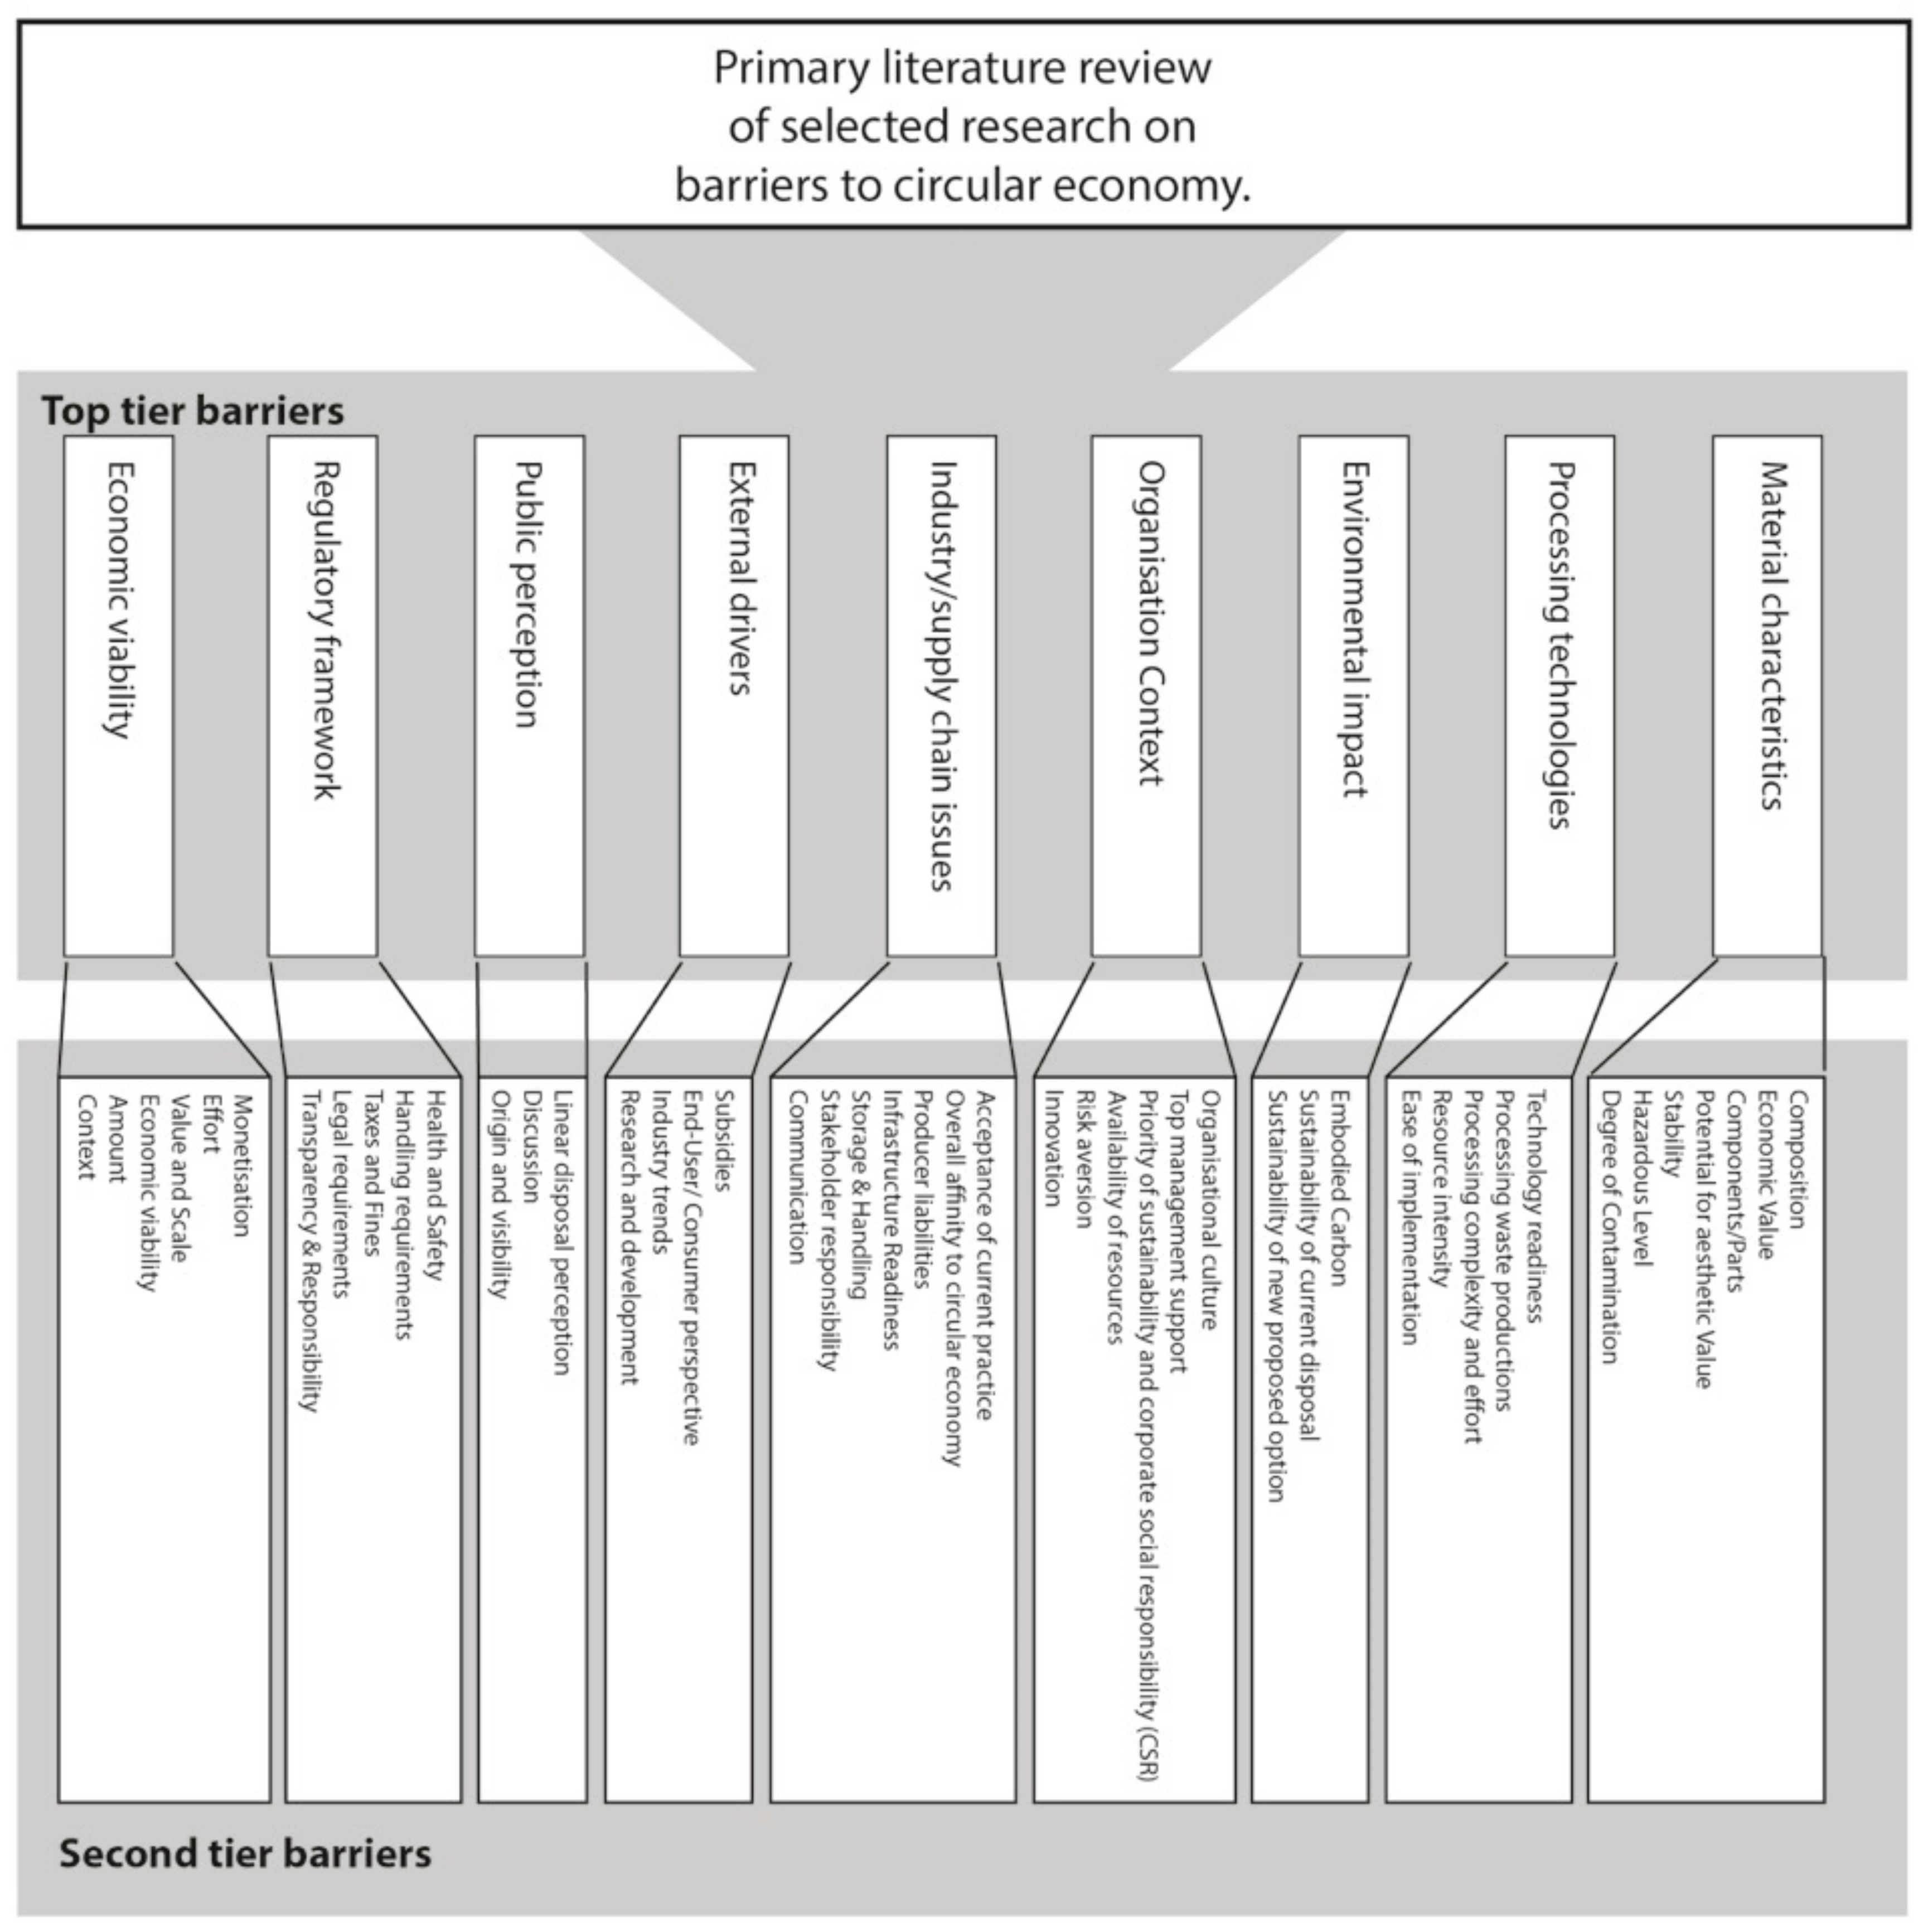
3.1. Development of Barrier Criteria

The method to assess the barriers to the transition to a CE was developed following analysis of the literature concerned with barriers. Most assessment schemes have defined top tier barriers associated with financial, regulatory, societal and organisational issues, with “financial” as the most widely reported barrier category. Regulatory, technological barriers and supply chain issues were also highlighted and used in almost all assessments, while cultural, societal and organisational barriers were also included in some assessments.
Based on this previous recent work and from analysing the barriers to specific materials and end of life products, the barriers identified by other workers have been re-grouped thematically [29,37,39,40,41,42]. This has produced a set of nine primary barriers, and these have been used in the assessment method developed in this work. These nine top-tier barriers have sufficient granularity to avoid generalisation, but cover the key aspects relevant to defining the CE potential of materials and end of life products. The primary barrier categories selected are:
i)
Material characteristics,
ii)
The availability and suitability of appropriate processing technologies,
iii)
The environmental impact of the current disposal/management method,
iv)
Relevant industry and supply chain issues that can influence the transition,
v)
Organizational factors and characteristics that can influence the transition,
vi)
The existence of various external drivers for change,
vii)
Public perception of the current situation,
viii)
The relevant regulatory framework and how that influences change and
ix)
The overall economic and business viability of the change.
The development of these key barrier criteria is shown in Figure 1.

3.2. Detailed Descriptions of Specific Barriers

3.2.1. Material Characteristics

This category assesses the inherent physical and chemical characteristics of the material and how these influence the transition to circularity. Material properties control the value, processing and future use scenarios. Possible 2nd tier material characteristics are given in Table 1, and these include composition, economic value, component/parts, potential to have aesthetic value, stability, hazardousness and degree of contamination. For example, a contaminated product containing many different components that are difficult to separate is likely to require expensive and challenging processing. Under these conditions, the second-tier barrier material characteristics (composition) would be ranked as a Level 0 assessment.
An example would be disposable coffee cups that consist of high-quality cellulose fibres with a thin polyethene coating. The base-materials, the cellulose fibre and polyethene, are relatively low value and difficult to separate, and because of this, the inherent material characteristics currently have a low potential for circularity. Complex products, including composites [29] and alloys [43], or materials that are contaminated [44] also have less potential for circularity. A material that is homogenous, clean and stable would have a Level 3 assessment. Examples would be waste wax from candles, leather off-cuts from the car industry, and clean and dry sawdust collected from timber mills. These tend to be mono-materials, with some value and potential for reuse, and they can easily be collected/sorted and have potential for further processing.

3.2.2. Processing Technologies

The availability of appropriate processing technology is often a key barrier to transitioning to a circular economy. This category depends on material characteristics. Technology availability and readiness, the state of current infrastructure, processing technology location, the ease of processing and relevant costs needs to be assessed. Possible 2nd tier processing technology characteristics are given in Table 2, and these include technology readiness, processing complexity and effort, resource intensity, waste generation and ease of implementation. Examples of a Level 0 assessment in the second-tier category processing technologies (technology readiness) would be carbon fibre reinforced polymers (CFRP). This material has high inherent value but is difficult to transition to a circular economy because the processing technology to reuse/recycle CFRP is not currently readily available in industry. Another example would be a material, which can be processed using equipment with low energy requirements in which case the assessment would be Level 3, indicating a high potential to transition to circularity. An example of a Level 3 assessment in Processing Technologies would be waste textiles for which shredding technology exist that can be used to produce fibres with minimal production of problematic residues.

3.2.3. Environmental Impact of Current Disposal

This category assesses the environmental impact of the current linear management of an end of life product or material. A high environmental impact is likely to drive the transition, as it is more critical to rethink the current linear model in this situation. This is a critical assessment parameter because the environmental impact is a key driver for the transition. The environmental impact relates to the embodied carbon and embodied energy inherent to the material or end of life product. If the material has high-embodied carbon/energy, then there should be greater incentive to transition from linear to circular. Low carbon/low embodied energy materials do not have the same environmental drivers to transition. Possible 2nd tier environmental impacts of current disposal characteristics are given in Table 3, and these include embodied carbon, the sustainability of the current disposal method and the sustainability of the new proposed option. An example of a Level 0 assessment for the second-tier category environmental impact would be glass-bottles, which can currently achieve material recovery rates of ~100%. The assessment in the case of used mobile phones would result in Level 3, as the recovery of rare earths would be highly beneficial for the overall carbon footprint of mobile phone production.

3.2.4. Organisational Context

This category aims to assess if the organisation involved in current material management would be willing to change the current processes and management practices to increase circularity. This is heavily dependent on management support, the organisational culture, and if the resource can be made available to test new ideas to transition to circularity. Possible 2nd tier organisational context characteristics are given in Table 4, and these include the organisational culture, the level of support from management, the priority of sustainability and corporate social responsibility, the availability of resources, the level of risk aversion and the innovation culture. A Level 0 assessment in Organisational context would be a venture, which does not consider innovators and change-makers as important drivers within the company and discourages attempts to change existing methods. A Level 3 assessment would be a company where innovation and ideas are rewarded, especially when they are related to circularity and sustainability.

3.2.5. Industry and Supply Chain Issues

This category involves qualitative assessment of industry and supply chain characteristics and attitudes [45]. Possible 2nd tier industry and supply chain issues are given in Table 5, and these include the Level of acceptance of the current practice, the affinity to achieving a circular economy, producer liabilities, infrastructure readiness, storage and handling problems, distribution issues, stakeholder responsibilities and potential communication problems. Practical and logistical considerations associated with transforming to a circular economy are also relevant, as highlighted in the questions in Table 5. This category considers the physical and temporal distribution of the material. Assessment involves asking if the creation of an effective and efficient infrastructure to transition is likely to happen, given the characteristics of the industry and the supply chain [46,47]. In a situation where material characteristics are appropriate, processing technologies are available, and the environment would improve from the transition. Stakeholders will be motivated and operational challenges will be solved. A Level 0 assessment, in second-tier category supply chain, would correspond to products or materials that are widely distributed. An example could be household food waste. This is widely distributed, difficult to collect economically and waste management companies who collect the waste are reluctant to invest in effective food waste recycling. An example of a Level 3 assessment for this parameter could be industrially generated waste limestone, as it is produced at centralised manufacturing locations.

3.2.6. External Drivers

This category assesses the external drivers and incentives to change from linear to circular. Possible 2nd tier external drivers are given in Table 6, and these include the availability of subsidies, end-user/consumer perspectives, industry trends and drivers for research and development. External drivers can have a significant impact, particularly when public perception of an industry becomes an issue or there are governmental subsidies, grants or tax incentives to make changes. These can be driven by the media, governments, industry or consumers [25].
An example of a Level 0 assessment for external drivers would be takeaway food packaging. There are currently no significant external drivers for this to transition from linear to circular, and it is broadly accepted as an established part of the throwaway society. An example of a Level 3 assessment in the second-tier external drivers category would be waste concrete, as many research groups are working in this area [48,49,50].

3.2.7. Public Perception

This category assesses how public opinion influences the transition to circularity for the specific material or end of life product under consideration. Public perception can induce rapid change to an industry or make politicians aware of the need for change. Possible 2nd tier public perception issues are given in Table 7, and these include public perception of the current linear disposal, the level of public discussion/interest and the visibility of the current linear system. A Level 0 assessment in public perception would be associated with no or low media interest with little or no public engagement or interest. In this case, public perception is not going to drive change. Examples of such material include industrially generated food waste, which is not generally visible to the general public. A Level 3 assessment would be a material that is extensively discussed on all Levels by the public and media, an example of which would be single-use coffee cups.

3.2.8. Regulatory Framework

Regulations can influence the transition from linear to circular for a specific material or end of life product. Possible 2nd tier issues related to the regulatory framework are given in Table 8, and these include health and safety, material handling requirements, taxes and fines, legal requirements, transparency and responsibility. This may include issues such as traceability of the material [51], transparency in the value chain [52] and public health and safety considerations [53]. The current regulatory framework needs to be assessed to understand if it will allow the transition from linear to circular. This is important because it forms the basis for the legal transition to circularity. A Level 0 assessment would be associated with materials that are inherently problematic and/or hazardous. Low transparency in defining the material origin, missing certification systems or lack of responsibility would further contribute a Level 0 assessment. An example would be contaminated soil. This has the potential to be reused, but in reality, the regulatory framework makes this particularly challenging and as such it remains linearly managed. A Level 3 assessment, in regulatory framework, would be associated with clear documentation of material ownership. An example could be waste vinyl canvases from heavy goods vehicles, which are typically branded with company logos.

3.2.9. Economic Viability

The linear to circular transition has to make good business sense and needs to be financially attractive/beneficial. Possible 2nd tier issues that influence the economic viability are given in Table 9, and these include monetisation (Can the material be processed into a new product or raw material for which there is a viable market?), Value and Scale (Economic viability can be achieved but will this require major investment in research, development and processing to make it happen?), Amount (Are the total quantities of the material available appropriate for the potential application(s)?) Context (Can the material be used directly without incurring excessive transport costs). Economic viability is influenced and dependent on all the other assessment parameters. Materials and end of life products assessed at Level 0 for other barriers are likely to be Level 0 for economic viability. Examples would include materials, which are only available in small volumes. A Level 3 assessment for economic viability means there is immediate demand to convert the material into value. An example would be copper pipes arising from the construction and demolition industry.

3.3. Barrier Assessment Methodology

The procedure to assess the overall scale of the barriers to transitioning from a linear to a circular economy involves assigning a Level of between 0 and 3 to each barrier category. These Levels are defined in Table 10.
Level 0 assessment for a specific barrier corresponds to material or end of life product where that category is a major issue. As a result, there is little or no potential to transition from a linear to a circular economy because of this factor. This means that the existing linear management system will remain in use unless major changes to address this particular barrier category are taken.
Level 1 assessment corresponds to the situation where that specific barrier characteristic has significant potential to inhibit the transition from a linear to a circular economy. The transition is possible, but issues exist that need to be addressed.
Level 2 assessment for a specific barrier corresponds to a material/waste where there is good potential to transition from a linear to a circular economy. The transition is probable, and many of the necessary aspects are in place to make this happen.
Level 3 assessment corresponds to a specific barrier where the material/waste that has a very high potential to transition from a linear to a circular economy. All aspects are in place to make this material/product circular, and there are no major reasons why it is not happening.
This assignment of appropriate levels is required for all the nine barriers categories identified to complete an assessment. This will then allow specific barriers to being identified that are a particular issue. In addition, the scoring system quantifies the overall scale of the barriers to circularity. Each barrier category is assigned a score on a scale of 0 to 3. Assessing the nine categories then produces an overall score that can range from 0 to 27 for the overall assessment. Once this assessment procedure is complete, the barriers that are of particular concern can be identified and appropriate steps can then be taken to allow the transition to circularity to be achieved.

4. Barriers to a Circular Economy: A Case Study of Waste Feathers in the UK

Feathers are primarily made from the protein keratin but have a complex structure consisting of a hollow shaft (quill) and rachis, with vanes made up of barbs and barbules. The chemical composition combined with the structure produces the unique combination of properties of feathers, and these include high tensile strength and toughness, extremely low density and excellent thermal insulating properties. Exploiting these characteristics in new materials manufactured from waste feathers has been the subject of increased research in recent years [54,55,56,57,58,59,60,61,62]. Although down feathers are used for filling duvets, clothes and upholstery, only a very small percentage of the waste feathers produced and available from the poultry industry are beneficially reused.
The European poultry industry currently generates approximately 3.1 Million tonnes per year of wet, soiled feather filter cake [58]. Typical feather waste material is displayed in Figure 2. This is a Category III Waste Product that is usually either rendered to produce feather meal, a low-grade animal feed or it, of to landfill. The current management of waste feathers is therefore categorised as predominantly linear with a low-grade circular (feather meal) application. There are opportunities to develop higher-value applications that exploit the inherent properties of this natural material in, for example, thermal insulation and sound insulation products; feather fibre textiles and materials that can be used for oil spill remediation. A circular economy for feathers is therefore possible, but barriers to this exist. These are likely to be representative of the barriers to similar materials, including other animal by-products [59].
Understanding the barriers to a circular economy for waste feathers would be highly beneficial because feathers are a high volume of problematic waste material. Greenhouse gases are emitted from the current rendering process to produce feather meal and these could be saved if an alternative circular economy application could be developed. However, to date, there have not been any significant developments that have produced a circular economy for waste feathers.
The analytical framework developed above was used to assess UK feather waste. The results were obtained from a series of interviews and an expert survey. Purposive and snowball sampling was used to identify practitioners in the UK poultry and textile processing industries. Structured interviews and a survey were conducted to evaluate whether the Levels 0-3 used for the analytical framework were broadly correct and could be appropriately applied from an industrial perspective. The framework was presented in the form of tables with tick-boxes for the interviewees to conduct their assessment. The interviewees were selected following contact with industrial network groups, from Environment Agency recommendations and from talking to leading industry stakeholders. Efforts were made to select a representative sample of companies dealing with feather waste as a potential recycling service or producer of the material.
Table 11 shows the function, expertise and position in the feather waste processing supply chain of the interviewees. They were initially introduced to the concept, the idea of barriers to a circular economy and the Level assessment system used in the method. The interviews started with a broad discussion of their personal experiences with feather waste and understanding of the circular economy. In order to create comparable assessments, the interviewees were asked to consider typical feather waste filter cake, as produced by UK abattoirs, as the starting point for their assessment. An average-sized UK abattoir produces 100-200 tonnes of waste feather filter cake with 50% moisture content per week. The interviewees then responded to barrier relevant questions by giving a Level indication related to the perceived significance of each barrier, as outlined above. They were informed about the meaning of Levels 0-3 and possible features promoting or inhibiting CE development. The assessment took on average 60 minutes (+/−10min) to complete, and interviewees were asked about their impression on the suitability of the assessment conducted, particularly with regards to the description and assignments of Levels 0-3. The averages for all categories were calculated. Total scores per interviewee, per category and overall Level score result were derived.
The feather waste analysis using the CE barriers method achieved an overall score of 6.6 out of 27, as shown in Table 12.
It is concluded that waste feathers have some potential aesthetic value, but they are heavily contaminated in the as-produced form. This was assessed to cause significant issues in attempting to move towards circularity. The required technology to reuse feathers requires washing and disinfection, and possibly mechanical, chemical and thermal processing. These processes are available and relatively easy to use by industry but are associated with costs. The material needs only basic sorting and conversion into a product, and this requires limited use of other resources. The relevant materials processing technologies do exist but cannot always work effectively with the volumes of waste feathers currently available. The overall scoring of 6.6/27 indicates that there are significant barriers to the transition to a CE associated with many of the different categories. The most severe barriers related to regulation and organisational context, which achieved Level 0 scores. The least barriers were found in the area of material characteristics and processing, which indicated that the materials have inherently exploitable properties and the technology is available to generate novel and valuable products.
The results of the interviews were reasonably consistent, as all interviewees identified significant regulatory and financial barriers influencing the transition of feather waste to a circular economy. Some interviewees were not aware of the current state of processing technologies available to convert feather waste into suitable products, and the results for organisational context appeared to be inconclusive, as the position of the interviewee in the supply chain influenced the scoring.
The novel method for barrier assessment provided detailed and structured insights into the transition of materials to a CE. The expertise, position and attitude of the assessor need to be considered, and an informed decision must be taken when weighting the results, and this depends on the assessor. A possible solution could be to use separate experts to assess the individual barrier categories. A consolidated assessment might then provide a more realistic insight into the current barriers to material cycles.
It is not clear how the assessor should operate if they lack relevant knowledge and experience and it may be more appropriate and effective for a panel of people with a range of experience and knowledge to complete the assessment. Responding to questions with incorrect assessments can lead to incorrect barrier assessment and underestimating barriers can lead to an over-optimistic assessment. Assessors ideally need to have an advanced level of understanding of the material to use the method, and they should have experience with relevant to other materials and products. This would help make informed decisions based on referencing, comparison and experience when assessing using Levels 0–3.
The scale used to assess the scale of barriers was 0 to 3. This could potentially be reduced to 0 to 1 or expanded to 0 to 5. The view of the authors is that 0 to 3 represents a reasonable compromise, although the optimum range to use is not apparent and could be scenario dependent. Most interviewees thought that a more polarising scale without intermediate Levels would deliver more meaningful results because the intermediate values are selected when there is some uncertainty. In the assessment tool presented, no efforts were made to introduce weightings to the categories and the nine themes were considered to have equal importance. However, this could be varied, depending on the availability of resources to overcome specific barriers.
Clustering barriers into nine categories has the risk that some key issues may not be covered and the methodology will not give a complete barrier assessment. Each category covers a relatively broad area and their development has involved consultation with a wide range of academic and industrial experts. There is clearly further scope to test and modify the methodology using other EOL materials and to iteratively improve the method. A limitation is that the methodology aims to identify and assess the severity of barriers rather than identifying barrier mitigation strategies, which are needed to overcome the CE transition barriers. Potential future work to achieve this will be case specific. A smart system, which utilises the knowledge generated on barriers and suggests strategies to overcome them would be beneficial to supplement the novel barrier identification method outlined in this research. The current method can identify barriers to the circular economy and help raise awareness in industry and amongst regulatory bodies, supply chain stakeholders and the public. It can provide an easy way for companies and other organisations to identify quick wins and avoid long delays on the journey towards developing a CE and it has the potential to contribute to achieving a circular economy on a larger scale.

5. Conclusions

The proposed methodology defines potential barriers to circularity and assesses the scale of these barriers in a particular scenario. Each potential barrier is assessed against different Levels (0–3). This allows potential barriers to circularity to be identified and the total barrier to be quantified on a scale of 0 to 27. This then indicates the potential for transitioning to circularity. The different barrier categories are materials characteristics, processing technologies, environmental impact, industry and supply chain issues, organisation context, external drivers, public perception, the regulatory framework and economic viability. The method is relatively simple and does not require energy-flow calculations, carbon footprint assessments or cost analysis. However, it does require a detailed understanding of the material being assessed from an industry perspective and a broader perspective of key issues.
The novel framework has been used to assess the barriers to transitioning to circularity for waste feathers generated by the UK poultry industry. This showed that there are major non-technical barriers for waste feathers to transition to circularity. Industry expert analysis produced an average overall score of 6.6/27, indicating that major barriers to circularity exist. These are related to industry and supply chain issues, lack of external drivers, public perception, the existing regulation and health and safety concerns. The economic viability of transitioning waste feathers to circularity is uncertain. Failure to address these barriers will mean feathers will continue to be used in low-grade applications or landfilled despite the exceptional inherent properties of this material.

Author Contributions

Conceptualization, C.C.; Formal analysis, E.D., M.T. and R.M.; Methodology, L.S. All authors have read and agreed to the published version of the manuscript.

Funding

This research received no external funding.

Acknowledgments

The Dyson Foundation is acknowledged for supporting the research. We also acknowledge the help and support provided by Stephen Woodgate on issues associated with waste feathers in the UK poultry industry.

Conflicts of Interest

The authors declare no conflict of interest.

References

  1. Schröder, P.; Lemille, A.; Desmond, P. Making the circular economy work for human development. Resour. Conserv. Recycl. 2020, 156, 104686. [Google Scholar]
  2. Ellen McArthur Foundation. Recycling and the circular economy. Available online: https://www.ellenmacarthurfoundation.org/news/recycling-and-the-circular-economy (accessed on 11 September 2018).
  3. Bocken, N.; De Pauw, I.; Bakker, C.; Van Der Grinten, B. Product design and business model strategies for a circular economy. J. Ind. Prod. Eng. 2016, 33, 308–320. [Google Scholar] [CrossRef] [Green Version]
  4. Murray, A.; Skene, K.R.; Haynes, K. The Circular Economy: An Interdisciplinary Exploration of the Concept and Application in a Global Context. J. Bus. Ethic. 2015, 140, 369–380. [Google Scholar] [CrossRef] [Green Version]
  5. Haas, W.; Krausmann, F.; Wiedenhofer, D.; Heinz, M. How Circular is the Global Economy?: An Assessment of Material Flows, Waste Production, and Recycling in the European Union and the World in 2005. J. Ind. Ecol. 2015, 19, 765–777. [Google Scholar] [CrossRef]
  6. Haupt, M.; Vadenbo, C.; Hellweg, S. Do We Have the Right Performance Indicators for the Circular Economy?: Insight into the Swiss Waste Management System. J. Ind. Ecol. 2016, 21, 615–627. [Google Scholar] [CrossRef]
  7. De Wit, M.; Hoogzaad, J.; Ramkumar, S.; Friedl, H.; Douma, A. The Circularity Gap Report. How the Linear Economy is Failing People and the Planet and What We Can do to Close the Global Circularity Gap. Available online: https://www.circularity-gap.world/report?fbclid=IwAR2KIp1kl9SL9qNw6y4Vx56FPjv7nzp19mmFkHRtZ0cTu1x12riIb5WZ11E%0Ahttps://docs.wixstatic.com/ugd/ad6e59_733a71635ad946bc9902dbdc52217018.pdf (accessed on 10 November 2019).
  8. Smol, M.; Kulczycka, J.; Henclik, A.; Gorazda, K.; Wzorek, Z. The possible use of sewage sludge ash (SSA) in the construction industry as a way towards a circular economy. J. Clean. Prod. 2015, 95, 45–54. [Google Scholar] [CrossRef]
  9. Islam, T.; Huda, N. E-waste in Australia: Generation estimation and untapped material recovery and revenue potential. J. Clean. Prod. 2019, 237, 117787. [Google Scholar] [CrossRef]
  10. Khoo, H.H. LCA of plastic waste recovery into recycled materials, energy and fuels in Singapore. Resour. Conserv. Recycl. 2019, 145, 67–77. [Google Scholar] [CrossRef]
  11. Ruwona, W.; Danha, G.; Muzenda, E. A Review on Material and Energy Recovery from Waste Tyres. Procedia Manuf. 2019, 35, 216–222. [Google Scholar] [CrossRef]
  12. Inghels, D.; Dullaert, W.; Aghezzaf, E.-H.; Heijungs, R. Towards optimal trade-offs between material and energy recovery for green waste. Waste Manag. 2019, 93, 100–111. [Google Scholar] [CrossRef]
  13. Lewis, H. Design and Environment: A Global Guide to Designing Greener Goods; Greenleaf Pub.: Sheffield, UK, 2001; ISBN 1874719438 9781874719434. [Google Scholar]
  14. Sheldrick, L.; Rahimifard, S. Evolution in Ecodesign and Sustainable Design Methodologies. In Proceedings of the Re-engineering Manufacturing for Sustainability; Springer Science and Business Media LLC: Berlin, Germany, 2013; pp. 35–40. [Google Scholar]
  15. Bisinella, V.; Götze, R.; Conradsen, K.; Damgaard, A.; Christensen, T.H.; Astrup, T.F. Importance of waste composition for Life Cycle Assessment of waste management solutions. J. Clean. Prod. 2017, 164, 1180–1191. [Google Scholar] [CrossRef] [Green Version]
  16. Brunner, P.H. 3. Case Studies. In Handbook of Material Flow Analysis; CRC Press: Boca Raton, FL, USA, 2016. [Google Scholar]
  17. Nesticò, A.; Somma, P. Comparative Analysis of Multi-Criteria Methods for the Enhancement of Historical Buildings. Sustainability 2019, 11, 4526. [Google Scholar]
  18. Nesticò, A.; Sica, F. The sustainability of urban renewal projects: a model for economic multi-criteria analysis. J. Prop. Invest. Finance 2017, 35, 397–409. [Google Scholar] [CrossRef]
  19. Qi, Y.; Chen, X.; Wang, W. Improved life cycle assessment of recycling organic wastes for practice. J. Clean. Prod. 2018, 195, 1558–1571. [Google Scholar] [CrossRef]
  20. Mishan, E.J. Cost-Benefit Analysis; Routledge: Abingdon, UK, 2007; ISBN 9780203695678. [Google Scholar]
  21. Rebitzer, G.; Ekvall, T.; Frischknecht, R.; Hunkeler, D.; Norris, G.; Rydberg, T.; Schmidt, W.P.; Suh, S.; Weidema, B.P.; Pennington, D.W. Life cycle assessment Part 1: Framework, goal and scope definition, inventory analysis, and applications. Environ. Int. 2004, 30, 701–720. [Google Scholar] [CrossRef] [PubMed]
  22. Zacho, K.O.; Mosgaard, M.; Riisgaard, H. Capturing uncaptured values—A Danish case study on municipal preparation for reuse and recycling of waste. Resour. Conserv. Recycl. 2018, 136, 297–305. [Google Scholar] [CrossRef]
  23. Boons, F. Freedom versus Coercion in Industrial Ecology: Mind the Gap! Econ. J. Watch 2012, 9, 100–111. [Google Scholar]
  24. Desrochers, P. Freedom versus coercion in industrial ecology: A reply to boons. Econ. J. Watch 2012, 9, 78–99. [Google Scholar]
  25. Baxter, W.; Aurisicchio, M.; Childs, P. Contaminated Interaction: Another Barrier to Circular Material Flows. J. Ind. Ecol. 2017, 21, 507–516. [Google Scholar] [CrossRef]
  26. Iacovidou, E.; Velis, C.A.; Purnell, P.; Zwirner, O.; Brown, A.; Hahladakis, J.; Millward-Hopkins, J.; Williams, P.T. Metrics for optimising the multi-dimensional value of resources recovered from waste in a circular economy: A critical review. J. Clean. Prod. 2017, 166, 910–938. [Google Scholar] [CrossRef]
  27. Park, J.; Chertow, M. Establishing and testing the “reuse potential” indicator for managing wastes as resources. J. Environ. Manag. 2014, 137, 45–53. [Google Scholar] [CrossRef] [PubMed]
  28. Zeng, X.; Wang, F.; Li, J.; Gong, R. A simplified method to evaluate the recycling potential of e-waste. J. Clean. Prod. 2017, 168, 1518–1524. [Google Scholar] [CrossRef]
  29. Yang, M.; Evans, S.; Vladimirova, D.; Rana, P. Value uncaptured perspective for sustainable business model innovation. J. Clean. Prod. 2017, 140, 1794–1804. [Google Scholar] [CrossRef] [Green Version]
  30. Ritzén, S.; Sandström, G. Ölundh Barriers to the Circular Economy – Integration of Perspectives and Domains. Procedia CIRP 2017, 64, 7–12. [Google Scholar] [CrossRef]
  31. Teece, D.J. Business Models, Business Strategy and Innovation. Long Range Plan. 2010, 43, 172–194. [Google Scholar] [CrossRef]
  32. Govindan, K.; Hasanagic, M. A systematic review on drivers, barriers, and practices towards circular economy: a supply chain perspective. Int. J. Prod. Res. 2018, 56, 278–311. [Google Scholar] [CrossRef]
  33. Singh, J.; Ordoñez, I. Resource recovery from post-consumer waste: important lessons for the upcoming circular economy. J. Clean. Prod. 2016, 134, 342–353. [Google Scholar] [CrossRef]
  34. Mahpour, A. Prioritizing barriers to adopt circular economy in construction and demolition waste management. Resour. Conserv. Recycl. 2018, 134, 216–227. [Google Scholar] [CrossRef]
  35. Veleva, V.; Bodkin, G.; Todorova, S. The need for better measurement and employee engagement to advance a circular economy: Lessons from Biogen’s “zero waste” journey. J. Clean. Prod. 2017, 154, 517–529. [Google Scholar] [CrossRef]
  36. Mendoza, J.M.F.; Schmid, A.G.; Azapagic, A. Building a business case for implementation of a circular economy in higher education institutions. J. Clean. Prod. 2019, 220, 553–567. [Google Scholar] [CrossRef] [Green Version]
  37. Pacheco, D.; Caten, C.S.T.; Jung, C.F.; Sassanelli, C.; Terzi, S. Overcoming barriers towards Sustainable Product-Service Systems in Small and Medium-sized enterprises: State of the art and a novel Decision Matrix. J. Clean. Prod. 2019, 222, 903–921. [Google Scholar] [CrossRef]
  38. Vermunt, D.; Negro, S.; Verweij, P.; Kuppens, D.; Hekkert, M. Exploring barriers to implementing different circular business models. J. Clean. Prod. 2019, 222, 891–902. [Google Scholar] [CrossRef] [Green Version]
  39. Zhang, A.; Venkatesh, V.; Liu, Y.; Wan, M.; Qu, T.; Huisingh, D. Barriers to smart waste management for a circular economy in China. J. Clean. Prod. 2019, 240, 118198. [Google Scholar] [CrossRef] [Green Version]
  40. Werning, J.P.; Spinler, S. Transition to circular economy on firm level: Barrier identification and prioritization along the value chain. J. Clean. Prod. 2020, 245, 118609. [Google Scholar] [CrossRef]
  41. Hart, J.; Adams, K.; Giesekam, J.; Tingley, D.D.; Pomponi, F. Barriers and drivers in a circular economy: the case of the built environment. Procedia CIRP 2019, 80, 619–624. [Google Scholar] [CrossRef]
  42. Kirchherr, J.; Piscicelli, L.; Bour, R.; Kostense-Smit, E.; Muller, J.; Huibrechtse-Truijens, A.; Hekkert, M. Barriers to the Circular Economy: Evidence From the European Union (EU). Ecol. Econ. 2018, 150, 264–272. [Google Scholar] [CrossRef] [Green Version]
  43. Stahel, W. The Circular Economy - A User’s Guide; Routledge: London, UK, 2019; ISBN 978-0-367-20014-5 (hbk) 978-0-367-20017-6 (pbk). [Google Scholar]
  44. Chancerel, P.; Meskers, C.E.; Hagelüken, C.; Rotter, V.S. Assessment of Precious Metal Flows During Preprocessing of Waste Electrical and Electronic Equipment. J. Ind. Ecol. 2009, 13, 791–810. [Google Scholar] [CrossRef]
  45. Josserand, E.; Kaine, S.; Nikolova, N. Delivering sustainability in supply networks: Achieving networked multi-stakeholder collaborations. Bus. Strat. Environ. 2018, 27, 605–611. [Google Scholar] [CrossRef]
  46. Brennan, G.; Tennant, M. Sustainable value and trade-offs: Exploring situational logics and power relations in a UK brewery’s malt supply network business model. Bus. Strat. Environ. 2018, 27, 621–630. [Google Scholar] [CrossRef]
  47. Pagell, M.; Shevchenko, A. Journal of Supply Chain Management. J. Supply Chain Manag. 2010, 46, 72. [Google Scholar]
  48. Gyurkó, Z.; Jankus, B.; Fenyvesi, O.; Nemes, R. Sustainable applications for utilization the construction waste of aerated concrete. J. Clean. Prod. 2019, 230, 430–444. [Google Scholar] [CrossRef]
  49. Letelier, V.; Henríquez-Jara, B.I.; Manosalva, M.; Moriconi, G. Combined use of waste concrete and glass as a replacement for mortar raw materials. Waste Manag. 2019, 94, 107–119. [Google Scholar] [CrossRef] [PubMed]
  50. Awoyera, P.O.; Ndambuki, J.M.; Akinmusuru, J.O.; Omole, D. Characterization of ceramic waste aggregate concrete. HBRC J. 2018, 14, 282–287. [Google Scholar] [CrossRef] [Green Version]
  51. Jurgilevich, A.; Birge, T.; Kentala-Lehtonen, J.; Korhonen-Kurki, K.; Pietikäinen, J.; Saikku, L.; Schösler, H. Transition towards Circular Economy in the Food System. Sustainability 2016, 8, 69. [Google Scholar] [CrossRef] [Green Version]
  52. Carter, C.R.; Rogers, D.S. A framework of sustainable supply chain management: moving toward new theory. Int. J. Phys. Distrib. Logist. Manag. 2008, 38, 360–387. [Google Scholar] [CrossRef]
  53. Park, J.; Sarkis, J.; Wu, Z. Creating integrated business and environmental value within the context of China’s circular economy and ecological modernization. J. Clean. Prod. 2010, 18, 1494–1501. [Google Scholar] [CrossRef]
  54. Sharma, S.; Gupta, A.; Kumar, A.; Kee, C.G.; Kamyab, H.; Saufi, S. An efficient conversion of waste feather keratin into ecofriendly bioplastic film. Clean Technol. Environ. Policy 2018, 20, 2157–2167. [Google Scholar] [CrossRef]
  55. Lasekan, A.; Abu Bakar, F.; Hashim, D. Potential of chicken by-products as sources of useful biological resources. Waste Manag. 2013, 33, 552–565. [Google Scholar] [CrossRef]
  56. Tesfaye, T.; Sithole, B.; Ramjugernath, D.; Chunilall, V. Valorisation of chicken feathers: Characterisation of physical properties and morphological structure. J. Clean. Prod. 2017, 149, 349–365. [Google Scholar] [CrossRef]
  57. Tesfaye, T.; Sithole, B.; Ramjugernath, D. Valorisation of waste chicken feathers: Optimisation of decontamination and pre-treatment with bleaching agents using response surface methodology. Sustain. Chem. Pharm. 2018, 8, 21–37. [Google Scholar] [CrossRef]
  58. Dieckmann, E.; Eleftheriou, K.; Audic, T.; Lee, K.-Y.; Sheldrick, L.; Cheeseman, C. New sustainable materials from waste feathers: Properties of hot-pressed feather/cotton/bi-component fibre boards. Sustain. Mater. Technol. 2019, 20, e00107. [Google Scholar] [CrossRef]
  59. Al-Asheh, S.; Banat, F.; Al-Rousan, D. Beneficial reuse of chicken feathers in removal of heavy metals from wastewater. J. Clean. Prod. 2003, 11, 321–326. [Google Scholar] [CrossRef]
  60. Molins, G.; Álvarez, M.D.; Garrido, N.; Macanás, J.; Carrillo, F. Environmental Impact Assessment of Polylactide (PLA)/Chicken Feathers Biocomposite Materials. J. Polym. Environ. 2018, 26, 873–884. [Google Scholar] [CrossRef]
  61. Aranberri, I.; Montes, S.; Azcune, I.; Rekondo, A.; Grande, H.-J. Fully Biodegradable Biocomposites with High Chicken Feather Content. Polymers 2017, 9, 593. [Google Scholar] [CrossRef] [PubMed] [Green Version]
  62. Flyvbjerg, B. Five Misunderstandings about Case-Study Research. Qual. Inq. 2006, 12, 219–245. [Google Scholar] [CrossRef] [Green Version]
Figure 1. Methodology to develop novel barrier assessment framework for CE transition.
Sustainability 12 01725 g001
Figure 2. Waste feather filter cake as typically produced at poultry processing facilities in the UK. This is contaminated and typically contains ~50% by weight of water.
Sustainability 12 01725 g002
Table 1. Detailed features of materials characteristics prohibiting or supporting CE transition. Each feature is associated with the different characterization levels 0–3.
Material Characteristics that Influence the Linear to Circular TransitionNo Potential
(Level 0)
Some Possibility
(Level 1)
Good Potential
(Level 2)
High Potential
(Level 3)
Composition:
Is the complexity or heterogeneity of the material expected to stop the transition to circularity?
Highly complex and heterogeneous,
Components are very difficult to separate.
Complex composition.
However components can be separated with effort.
Simple composition.
Composite structure, which can be disassembled at designated joints.
Homogeneous and simple composition.
Different components do not need to be separated.
Economic value:
Is the inherent value of the material likely to stop the transition to circularity?
No value.Low value.Intermediate value.Potential to have high relative value.
 
Components/Parts:
Does the material contain many different components that are difficult to separate and will this stop the transition to circularity?
Composite material with many different components.Composite material with limited amount of different components.Material has very few components that have potential to be separated.Single material with no impurities or compatible mixed materials.
 
Potential for aesthetic Value:
Does the material possess aesthetic value that can be beneficial to the transition to circularity?
No possible aesthetic value.Material has little aesthetic value.Material has some aesthetic value.Material has significant aesthetic value.
Stability:
Do the properties of the material degrade in ways that will stop the transition to circularity?
Volatile and/or odorous and properties degrade rapidly.Material does degrade, but stability can be achieved with some processing.Material does not rapidly degrade and is stable.Material is completely inert.
Hazardous Level:
Is the material hazardous and will this stop the transition to circularity?
Hazardous wasteProblematic waste with some potential for adverse health and environmental impactsStable, neutral waste that is unlikely to cause adverse health or environmental impacts if correctly handledSafe, inert material with no potential health or environmental concerns.
Degree of Contamination:
Is the material contaminated by components that will stop the transition to circularity?
The material is extensively contaminated.The material has intermediate levels of contamination.Material is relatively consistent.Material is consistent, uncontaminated and comparable to virgin sources.
Table 2. Detailed features of processing technologies prohibiting or supporting CE transition. Each feature was associated with the different characterization levels 0–3.
Processing Technologies that Allow the Transition from Linear to CircularNo Potential
(Level 0)
Some Possibility
(Level 1)
Good Potential
(Level 2)
High Potential
(Level 3)
Technology readiness:
Is the processing technology readily available that allows the transition to circularity?
Technology to reuse the material does not exist.Technology to reuse the material does exist in a different technical contexts and analogous processing is possible.There is a variety of technical options available to make this material circular.
 
All required technology is standard and freely accessible.
 
Processing waste productions: Are there resulting processing wastes, which would be prohibitive for transition to circularity?Residues generated by reprocessing are likely to be highly problematic requiring expensive linear disposal.Residues generated are problematic but can be managed effectively. Residues can be managed and disposal is unlikely to cause problems.Only minor or no residues are created.
Processing complexity and effort: Is the processing simple to allow the transition to circularity?The material needs a combination of mechanical thermal and chemical treatments.The material needs significant amounts of processing, using at least mechanical/ thermal, chemical/ mechanical or chemical/thermal treatments.The material needs either mechanical or thermal or chemical treatment. The material does not need any processing to be circular.
 
Resource intensity: Are the suggested processes resource efficient to allow the transition to circularity?Transition to a circular economy requires significant use of other resources.The conversion of the products requires resources. The conversion of the products requires only very limited use of other resources. The conversion of the products requires no resources.
Ease of implementation:
Is it easy to implement the processing which allows the transition to circularity?
The processing technology is difficult to implement.The processing technology exists and can be implemented with effort. The processing technology can be integrated easily.The processing technology is standard in most cases.
Table 3. Detailed feature analysis of environmental impacts prohibiting or supporting CE transition. Each feature was associated with the different characterization levels 0–3.
Environmental Impact and Consequences of the Current Linear Disposal No Potential
(Level 0)
Some Possibility
(Level 1)
Good Potential
(Level 2)
High Potential
(Level 3)
Embodied Carbon:
What is the embodied carbon in the materials being considered?
Material has low embodied carbon and energy and therefore the consequences of linear disposal are considered minor.Material has intermediate embodied carbon and energy.
 
Material has higher levels of embodied carbon and energy.Material has very high levels of embodied carbon and energy.
Sustainability of current disposal:
Is the current disposal option having significant adverse effects on the environment?
The current linear disposal produces no adverse environmental impacts.The current linear disposal is associated with some adverse environmental impacts.
 
Linear disposal could cause significant adverse environmental impacts.
 
Linear disposal causes drastic, irreversible and long term damages and impacts environment dramatically.
 
Sustainability of new proposed option:
Does the new proposed option significantly reduce the environmental impact of the material?
Changes to the current linear disposal management methods may adversely impact the environment.
 
Changes to the current management methods are likely to reduce the environmental impact of the material only minimally.
 
Circular management would reduce the environmental impacts associated with this material.
 
Circular management would significantly reduce the environmental impacts associated with this material.
 
Table 4. Detailed feature analysis of the organizational context prohibiting or supporting CE transition. Each feature was associated with the different characterization levels 0–3.
Organizational Context and Its Consequences on Transition from Linear to CircularNo Potential
(Level 0)
Some Possibility
(Level 1)
Good Potential
(Level 2)
High Potential
(Level 3)
Organizational culture: Does the organization owning the material encourage development and change?The organization does not promote new ideas and is highly reliant on staying in within given constraints. The organization does allow some flexibility and new ideas, however the main business is always in focus. The organization is agile to some degree and regularly tests new processes and ideas.The organization is very agile and seeks constant adaption and change.
Top management support: Are the senior management in the organization supportive of the change to a CE?Senior management does not support new ideas. Senior management is not against new ideas but stresses the importance of business as usual. Senior management supports and rewards new ideas, as long as they do not conflict with the overall business strategy.Senior management is very flexible and adaptive to trying new things and testing even if there is uncertainty.
Priority of sustainability and corporate social responsibility (CSR)Sustainability is not important for the vision and there is no CSR policy.Sustainability is included in the company vision, but not actively executed.Sustainability is important and measures are implemented.Sustainability is the core value of the organization and there is a high level of CSR.
Availability of resources: Are the resources available to support the transition to a CE?There is no room for resources to be diverted, resources are scarce.There are resources available; however accessing them needs extensive justification.There are resources available and they are accessed easily.There are resources available and they are accessed easily, and can be increased with minimal effort.
Risk aversion: How does the organization view risk? The company/ entity is highly risk averse.The company is taking measures to manage risks, however risks are ideally avoided.The company is used to taking risks to some degree. The company is not risk averse, can effectively manage risks and often takes risks.
Innovation: How important is innovation to the organization?The company does not promote innovation, especially when related to sustainability.The company does promote innovation, but it is not a main driver for the business.The company rewards innovators and encourages innovation. The company rewards innovators highly and seeks innovation and innovation/research is a priority.
Table 5. Detailed feature analysis of the industry and supply chain prohibiting or supporting CE transition. Each feature was associated with the different characterization levels 0–3.
Industry and Supply Chain Issues that Influence Transition from Linear to Circular No Potential
(Level 0)
Some Possibility
(Level 1)
Good Potential
(Level 2)
High Potential
(Level 3)
Acceptance of current practice: Industry and supply chain issues that influence transition from linear to circularCurrent linear disposal is acceptable to the industry.Some participants of the supply chain show interest in engaging in new activities related to the material.Most partners in the value chain would contribute to find better solutions and transition to CE.All organizations in the supply chain want to see the material transition to a circular economy.
Overall affinity to circular economy: Does the industry show willingness to change and do they want to transition this material to a circular economy?The industry has no interest for circular economy.Current linear disposal is being questioned as viable in the long-term.A linear model is considered as problematic and change requested.The status quo is considered total unacceptable.
Producer liabilities: Do the people who control the material consider the current linear disposal model to be acceptable?Producers consider the current situation as acceptable and are not liable for any damages/ inefficiencies.Product/ material owners/users face problems with the current situation.The material owner is clearly identifiable.
 
The material owner is clearly identifiable and subject to strict regulations for sustainability standards.
Infrastructure readiness: Does the nature of the industry allow sufficient quantities of the material to be collected?No existing infrastructure to handle the material. There is some infrastructure to collect and transport the material, but requires significant amount of additional resources.The material can be transported in a variety of modalities without problems with existing infrastructure.
 
The material can be reprocessed in-situ or does not need to be transported/ A fully established infrastructure is built up to manage the material.
Storage and handling: Can the material be easily stored and handled?The material storage is extremely problematic, time-sensitive, and condition-critical and requires significant space.The material storage requires space and needs constant monitoring. The material storage is not problematic and requires only limited space.The material can be stored indefinitely, with minimal space usage.
Distribution issues:
Is the material highly distributed and difficult to locate/ access?
The material is widely distributed and therefore difficult to collect.The material is distributed, but central hubs of collection can be organized/ is available.The material is available from well-defined locations or collected in few central locations.It is very easy to collect the material and locations are accessible.
Stakeholder responsibility: Is it clear who can be held responsible for the material and disposal impacts?It is not clear who is responsible for the material at end of life (EOL).Someone is responsible for the EOL of the material.There is a chain of responsibility available for inputs and outputs of the value chain.There is a chain of responsibility available for each step of the supply chain.
Communication: Is the supply chain well connected to accommodate increased communication effort to transition to circularity? The supply chain is not connected and exchange of information is not possible or difficult.Communication measures could be implemented with some effort.The supply chain is well connected and communication is possible if requested.All partners in the supply chain are connected, they can easily communicate digitally and have access to storage/information about processes and materials.
Table 6. Detailed feature analysis of external drivers and incentives prohibiting or supporting CE transition. Each feature was associated with the different characterization levels 0–3.
External Drivers and Incentives to Change from a Linear to a Circular EconomyNo Potential
(Level 0)
Some Possibility
(Level 1)
Good Potential
(Level 2)
High Potential
(Level 3)
Subsidies: Are there significant drivers and incentives for the industry to change the current linear lifecycle of this material?No government drivers to re-use or rethink the current material life cycle.Some drivers from government available to re-use or rethink the current material lifecycle.Government offers subsidies and support to transition to CE.
 
Government heavily subsidizes and gives incentives to develop a circular economy for this material.
 
End-User/ Consumer perspective: Is the material holder/ producer aware of the importance of moving towards a circular economy?No end-user drivers to re-use or rethink the current material lifecycle.End-users are somewhat motivated to re-use or rethink the current material lifecycle.End-users are motivated to re-use or rethink the current material lifecycle.End-user is highly motivated to re-use and rethink the current material lifecycle.
Industry trends: Are there overall industrial trends and drivers, which impact the transition to circularity? No industrial drivers to re-use or rethink the current material lifecycle.Some drivers for industry to re-use or rethink the current material lifecycle.Drivers/incentives for the industry to re-use or rethink the current material lifecycle.Significant drivers/incentives for the industry to re-use or rethink the current material lifecycle.
Research and development: Is the material currently part of a research and development programs? No scientific or technical development to re-use or rethink the current material lifecycle.Some scientific and technical development to re-use or rethink the current material lifecycle.The scientific and technical development exists.
 
Main research area at universities and companies.
Table 7. Detailed feature analysis related to public perception that are prohibiting or supporting CE transition. Each feature was associated with the different characterization levels 0–3.
Public Perception of the Material and the Transition from Linear to CircularNo Potential
(Level 0)
Some Possibility
(Level 1)
Good Potential
(Level 2)
High Potential
(Level 3)
Linear disposal perception: What is the public perception of the current linear disposal of this material?The current end-of-life scenario is accepted by the public, media and government.The end of life issues associated with the material have a very low or no profile with the public, media and government.Most of the public has a neutral perception towards re-using the material in a novel context.Most of the public has a positive perception towards re-using the material in a novel context.
Discussion: What is the level of public discussion and concern associated with this material?Discussion on the current management of this material is avoided and not encouraged.There is no discussion on the current management of this material.The material has some coverage in the media and the public is aware of issues.The material has a lot of public interest and the current end of life options are widely discussed.
Origin and visibility: Are the public aware of this material and where it comes from?The origin of the material is not clear and the issues are not known to the general public.The origin of the material is traceable, and the public is aware of the current issues. The public may be aware of the end-of-life issues associated with this material.Organizations associated with the material are known and the public is generally aware of the adverse impacts of linear disposal.
Table 8. Detailed feature analysis of the regulatory framework prohibiting or supporting CE transition. Each feature was associated with the different characterization levels 0-3.
Regulatory Framework and Health and Safety ConsiderationNo Potential
(Level 0)
Some Possibility
(Level 1)
Good Potential
(Level 2)
High Potential
(Level 3)
Health and Safety:
Are there any are significant health and safety issues associated with this material that could stop the transition to circularity?
There are significant health and safety issues associated with this material, which are far-reaching, irreversible with lasting impact.There are issues associated with the material, but they are localized, time-constraint or not severe.
 
There are no issues associated with the material.There are no issues associated with the material, if any, they are of positive nature.
Handling requirements:
Does the material require rigorous handling requirements?
The material is dangerous and major requirements needs to be met to access the materialComponents of the material may be hazardous under certain conditions however can be mitigated with personal protection equipment.The material can be handled without many precautions; some basic training may be required.The material can be handled without precautions, no training required.
Taxes and Fines:
Are there penalties associated with the material, if standard procedures are not adhered to?
Fines for wrongful handling and disposal of the materials are very high and it is strictly controlledFines can be imposed but they are usually not enforced.Fines are associated with the mismanagement of this material.Fines are associated with the mismanagement of this material and these can be substantial.
Legal requirements:
Are there are any regulations that will stop the transition to a circular economy?
There are relevant regulations in place that will make the move to other disposal/ re-use ideas very problematic.There are some regulatory barriers but there are components related to the material that may become an issue.There is little to no regulation with regards to the material.The material is not impacted by any regulation.
Transparency and Responsibility:
Is it clear who is legally responsible for the material at end of life?
It is not clear who is legally responsible for the material at end of life.It is clear who is legally responsible for the material at end of life, but there is not much documentation about it.It is clear who is legally responsible for the material at end of life and there is documentation in place.It is not relevant/ necessary to define responsibilities for the material.
Table 9. Detailed feature analysis of the economic viability prohibiting or supporting CE transition. Each feature was associated with the different characterisation levels 0–3.
Economic Viability and Markets to Support the Transition from Linear to CircularNo Potential
(Level 0)
Some Possibility
(Level 1)
Good Potential
(Level 2)
High Potential
(Level 3)
Monetization: Can the material be processed into a new product or raw material for which there is a viable market?The material has no or very low inherent value, which could be monetized with no market/ demand existent. The material low inherent value, which could be monetized immediately, there is little demand.The material has a certain monetary value, which can be realized even without processing and there is certain demand.The material has significant monetary value, which can be realized even without processing with strong demand of a thriving market.
Value and Scale:
Economic viability can be achieved but this will require major investment in scale, research, development and processing to make it happen?
The value creation can only be realized on large scale, requiring major investment.The value creation can be realized only at scale, but can be grown successively to size.The value creation can be realized already on medium sizes scale requiring small investment.
 
The value creation can be realized already on very small scale, existing infrastructure can be used without any investment.
Amount: Are the total quantities of material available appropriate to the potential application(s)?The total amount of waste is very low compared to potential applications.The total amount of waste is medium compared to potential applications.There is a significant amount of material available to allow production of more than one product type.There is sufficient material available to be used in a wide range of applications.
 
Context: Can the material be used directly without much transport and in a local context? The material/ product cannot be re-used for in a local context and needs to be transported far. The material/ product cannot be re-used for in a local context but transport can be organized within reason.The material/ product can be used within a smaller radius and does not require long transports.The material can be re-used on spot and no transport is involved.
 
Table 10. Material/product characterisation levels used to assess the potential to transition from linear to circular.
Material/Product Characterisation Levels Assessed for Each Category
Level 0Material/Product at end of life has no potential to transition from a linear to a circular economy. It is likely to remain linear without major changes in materials selection or product design.
Level 1Material/Product has some characteristics that make the transition from a linear to circular economy a possibility. There is a small potential but clear barriers and issues exist that may require changes in material selection or product design.
Level 2Material/Waste has a good chance and potential of transitioning from a linear to a circular economy. Many aspects are in place to make this material/product part of a circular economy and it should happen.
Level 3Material/Waste has a very high chance and potential of transitioning from a linear to a circular economy. All aspects are in place to make this material/product part of a circular economy and it should happen.
Note: For simplicity the term ‘material’ is used to indicate ‘end of first life object or product’. This ‘material’ may be formed from a single material such as a glass bottle or it may be a complex product that contains many different materials such as a mobile phone.
Table 11. Overview Interviewees by company function and experience.
IntervieweeCompany CategoryRoleExperience with Feather WasteInterview Type
1Animal-by-Product ConsultancyCEOLong-Term Advisor for DEFRA and several poultry processors Face to face
2Circular Economy Start-UpCEOExperience with feather products and marketing of waste-derived productsFace to face
 
3Rendering Service ProviderResearcherDay-to-Day operations and tests with material and research for new applicationsTelephone
 
4Poultry Processing FacilityCOOProducer of material, organizes logistics in accordance with regulation Face to face
 
5Textile Processor SalesConversion of ABP into textile products, aware of finance and public perceptionFace to face
 
Table 12. Average scores of assessments (0–3) by barrier category, conducted by five industry experts, for UK feather waste filter cake.
Assessment ResultsAverage of All Assessments
Interviewee
No. 1
Interviewee
No. 2
Interviewee
No. 3
Interviewee
No. 4
Interviewee
No. 5
Material characteristics230031.6
Processing technologies121131.6
Environmental impact010110.6
Organisation Context000010.2
Industry/supply chain001110.6
External drivers000220.8
Public perception110121
Regulatory framework000000
Economic viability010000.2
TOTAL for each Interviewee/274826136.6

