An Integrated Sensor Data Logging, Survey, and Analytics Platform for Field Research and Its Application in HAPIN, a Multi-Center Household Energy Intervention Trial

 on behalf of the HAPIN Investigators
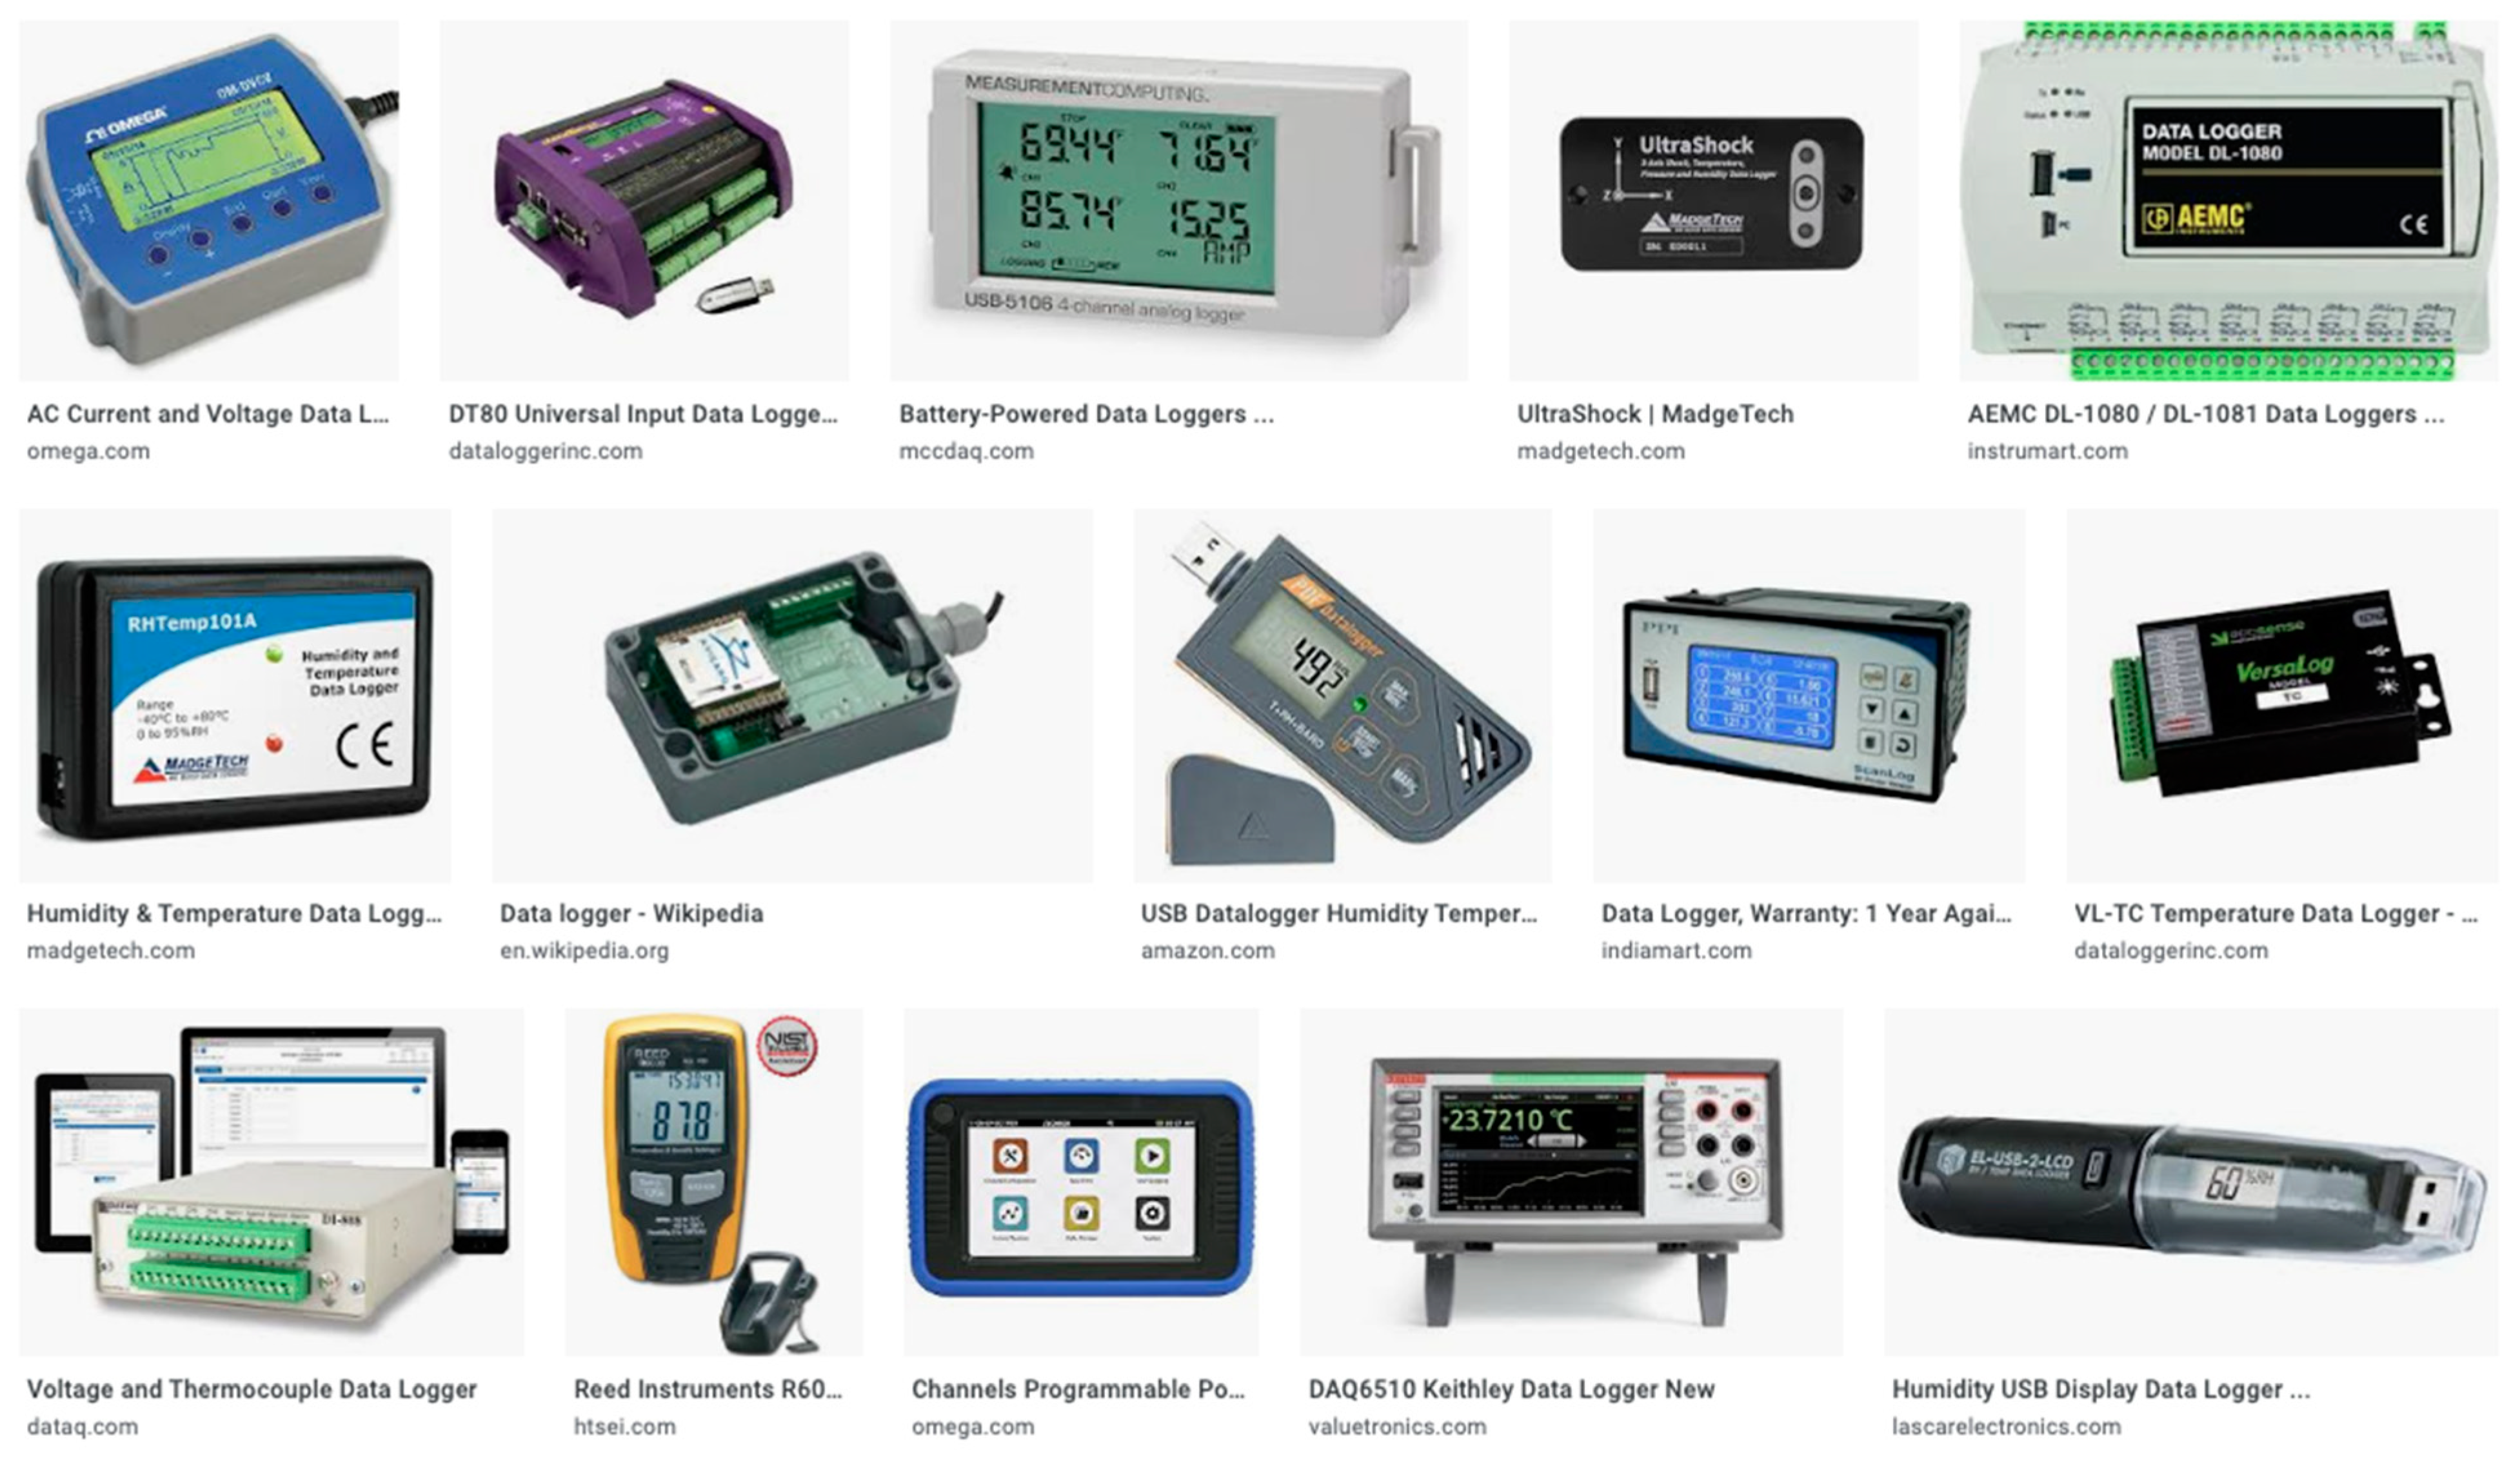
Abstract
:1. Introduction
2. Materials and Methods
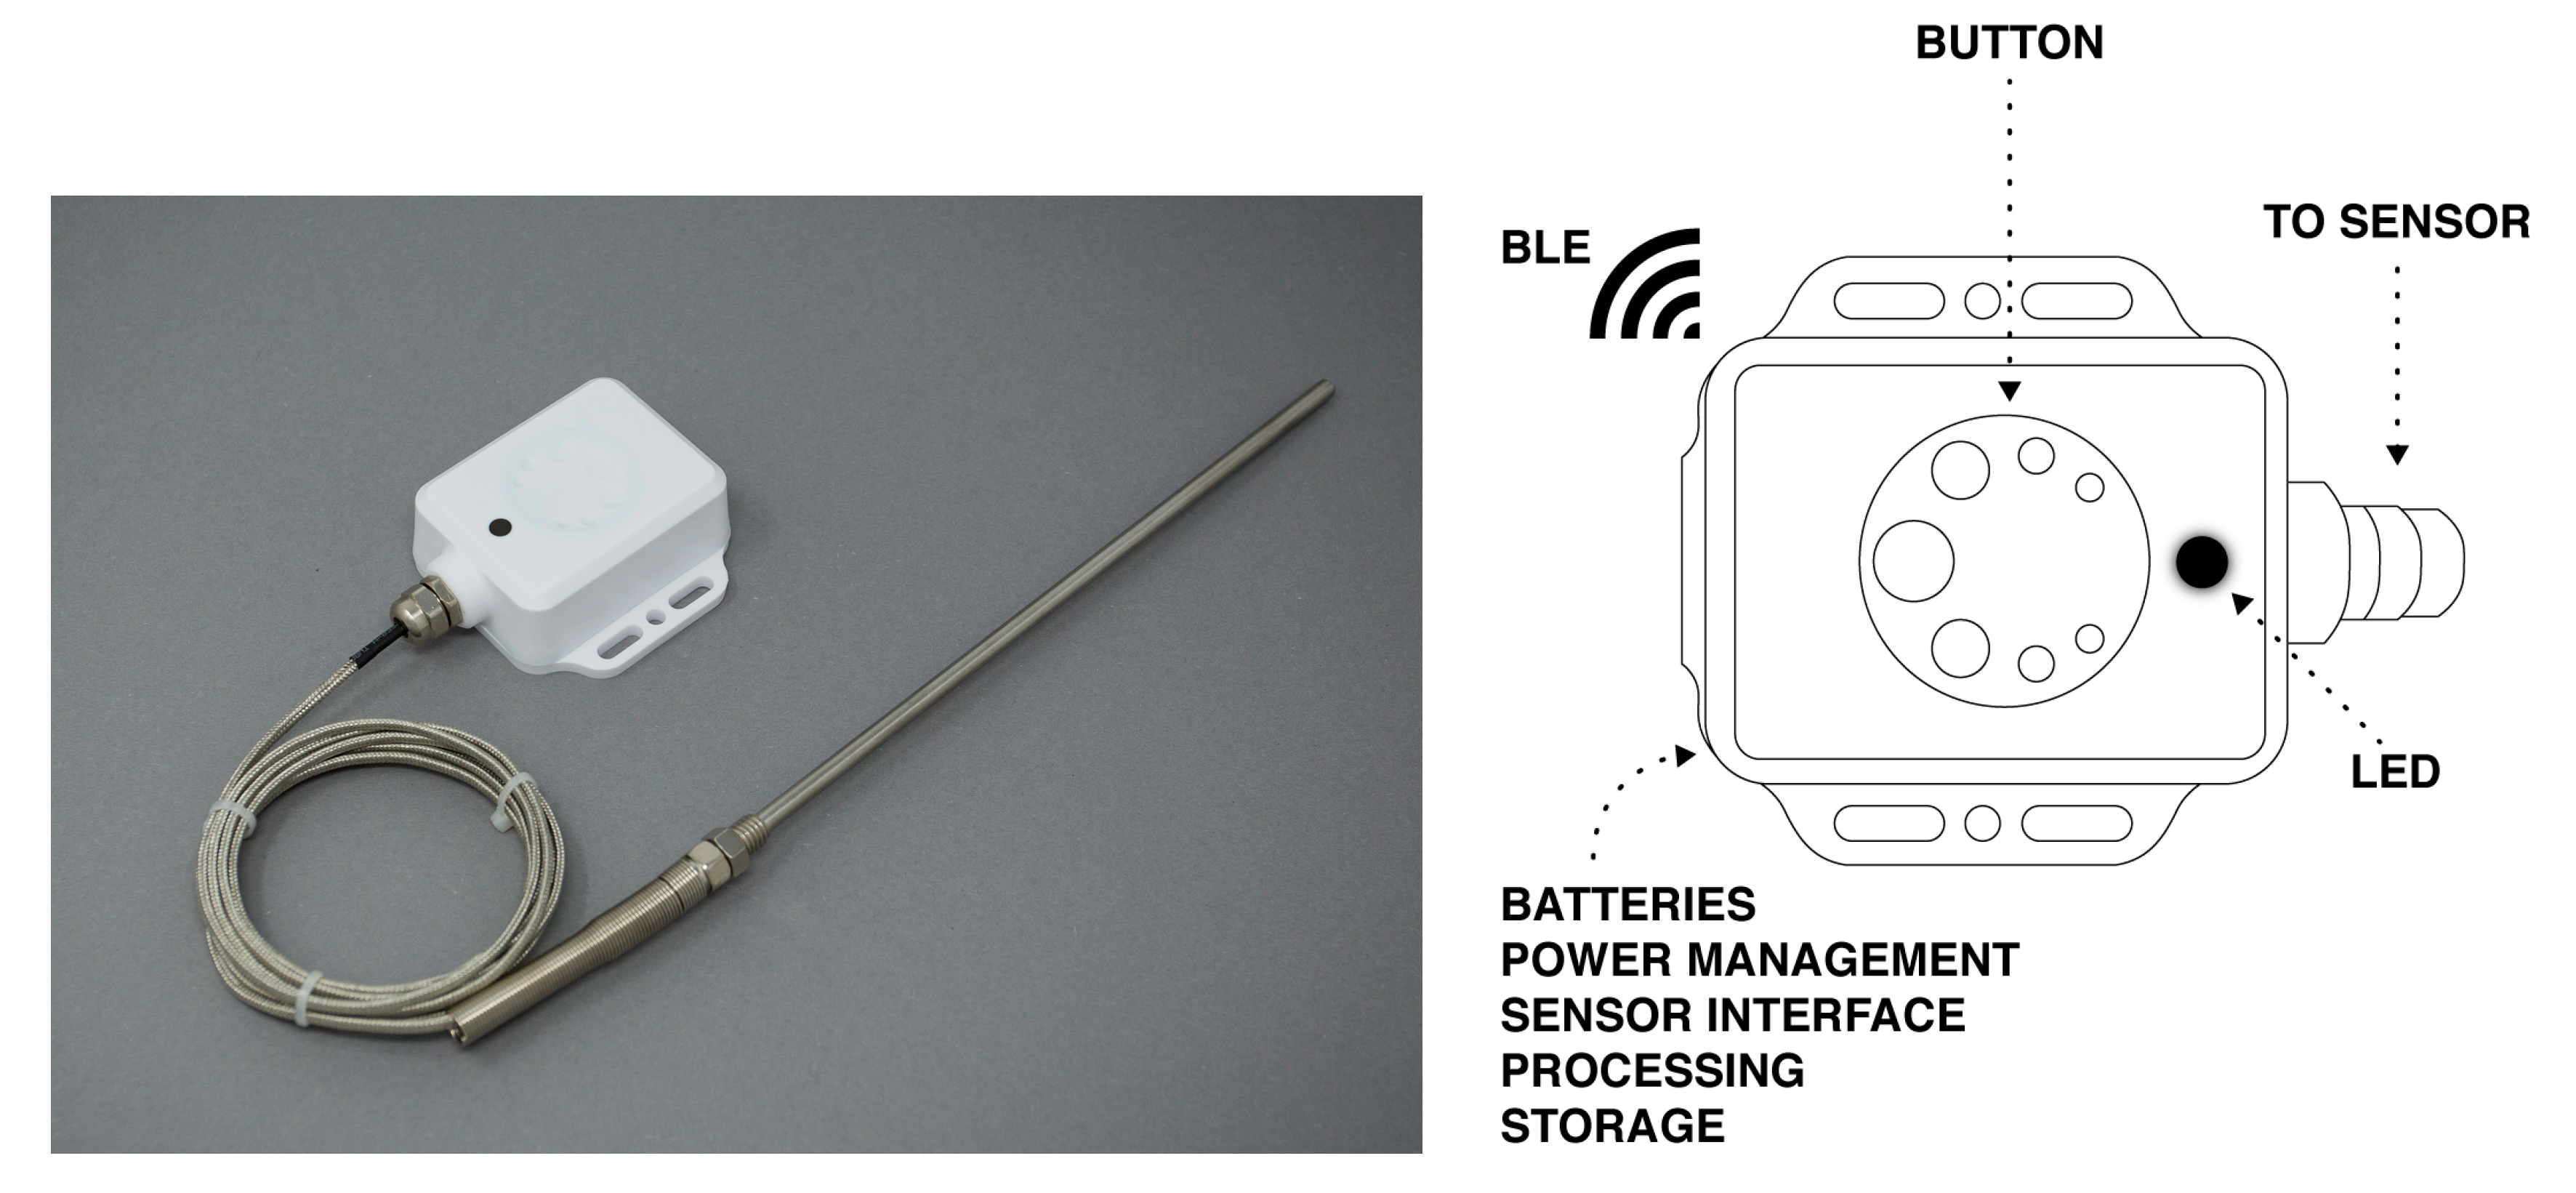
2.1. Hardware
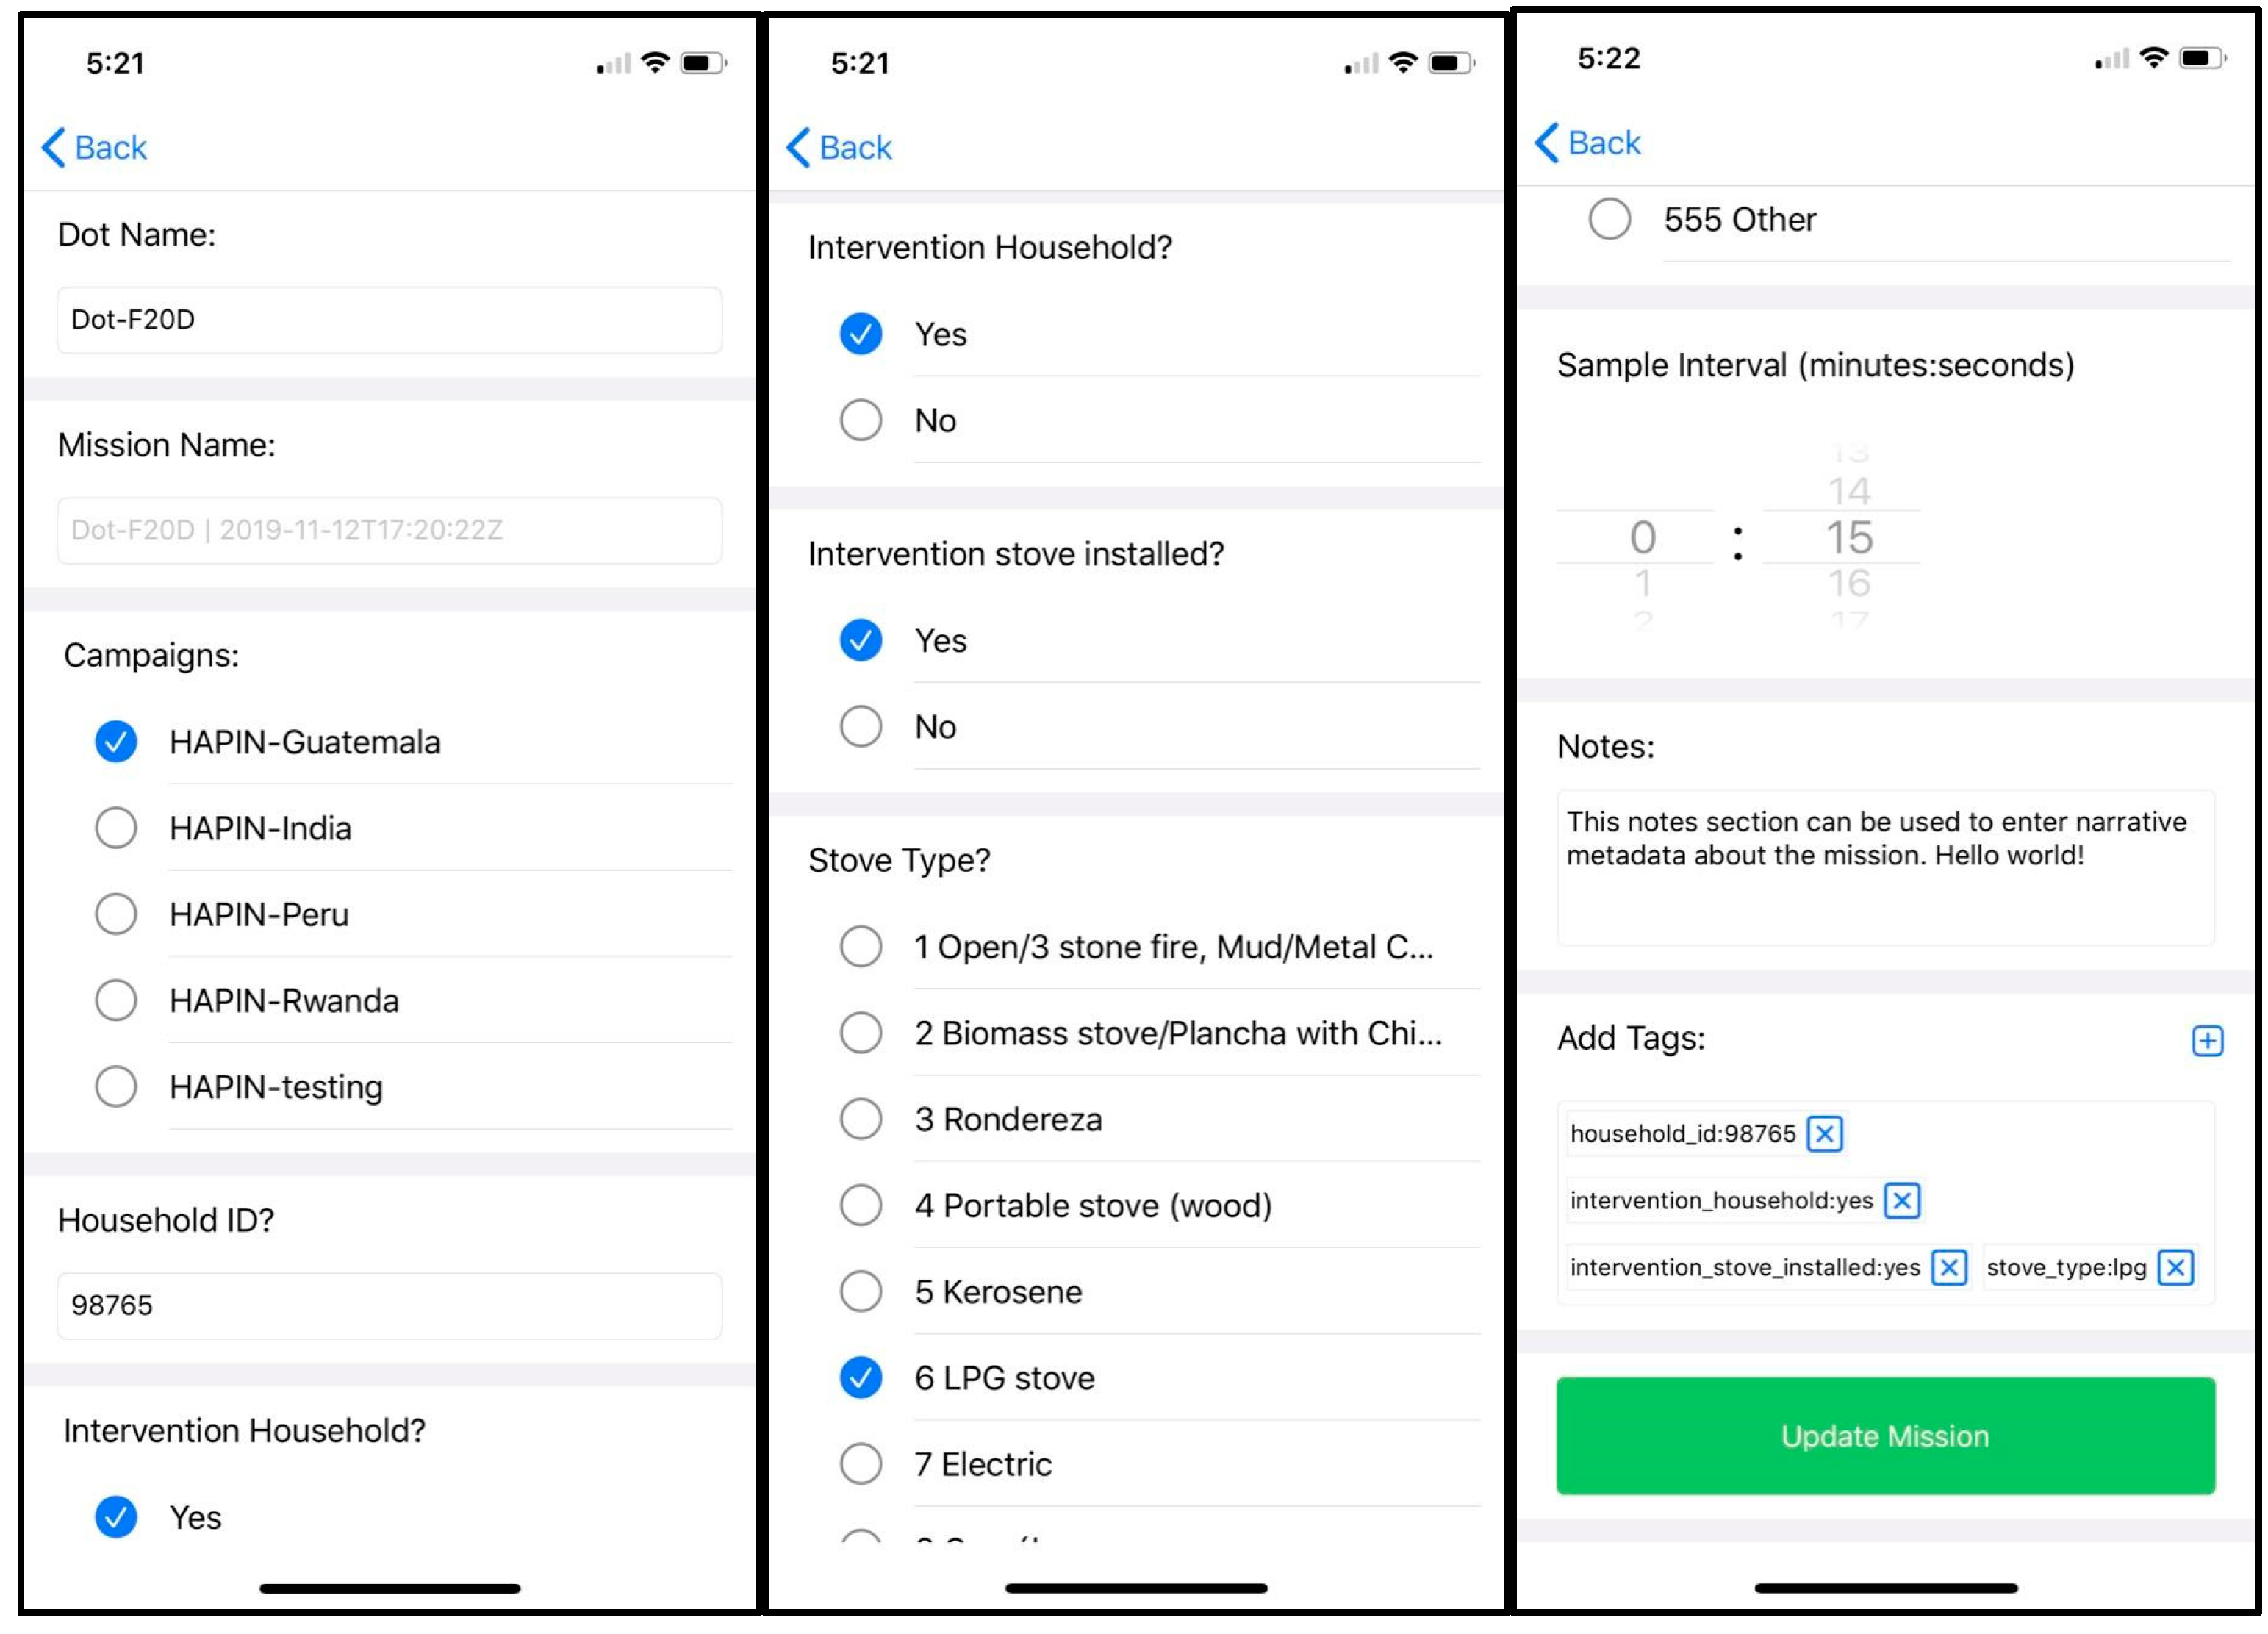
2.2. Provisioning, Surveying and Metadata Management
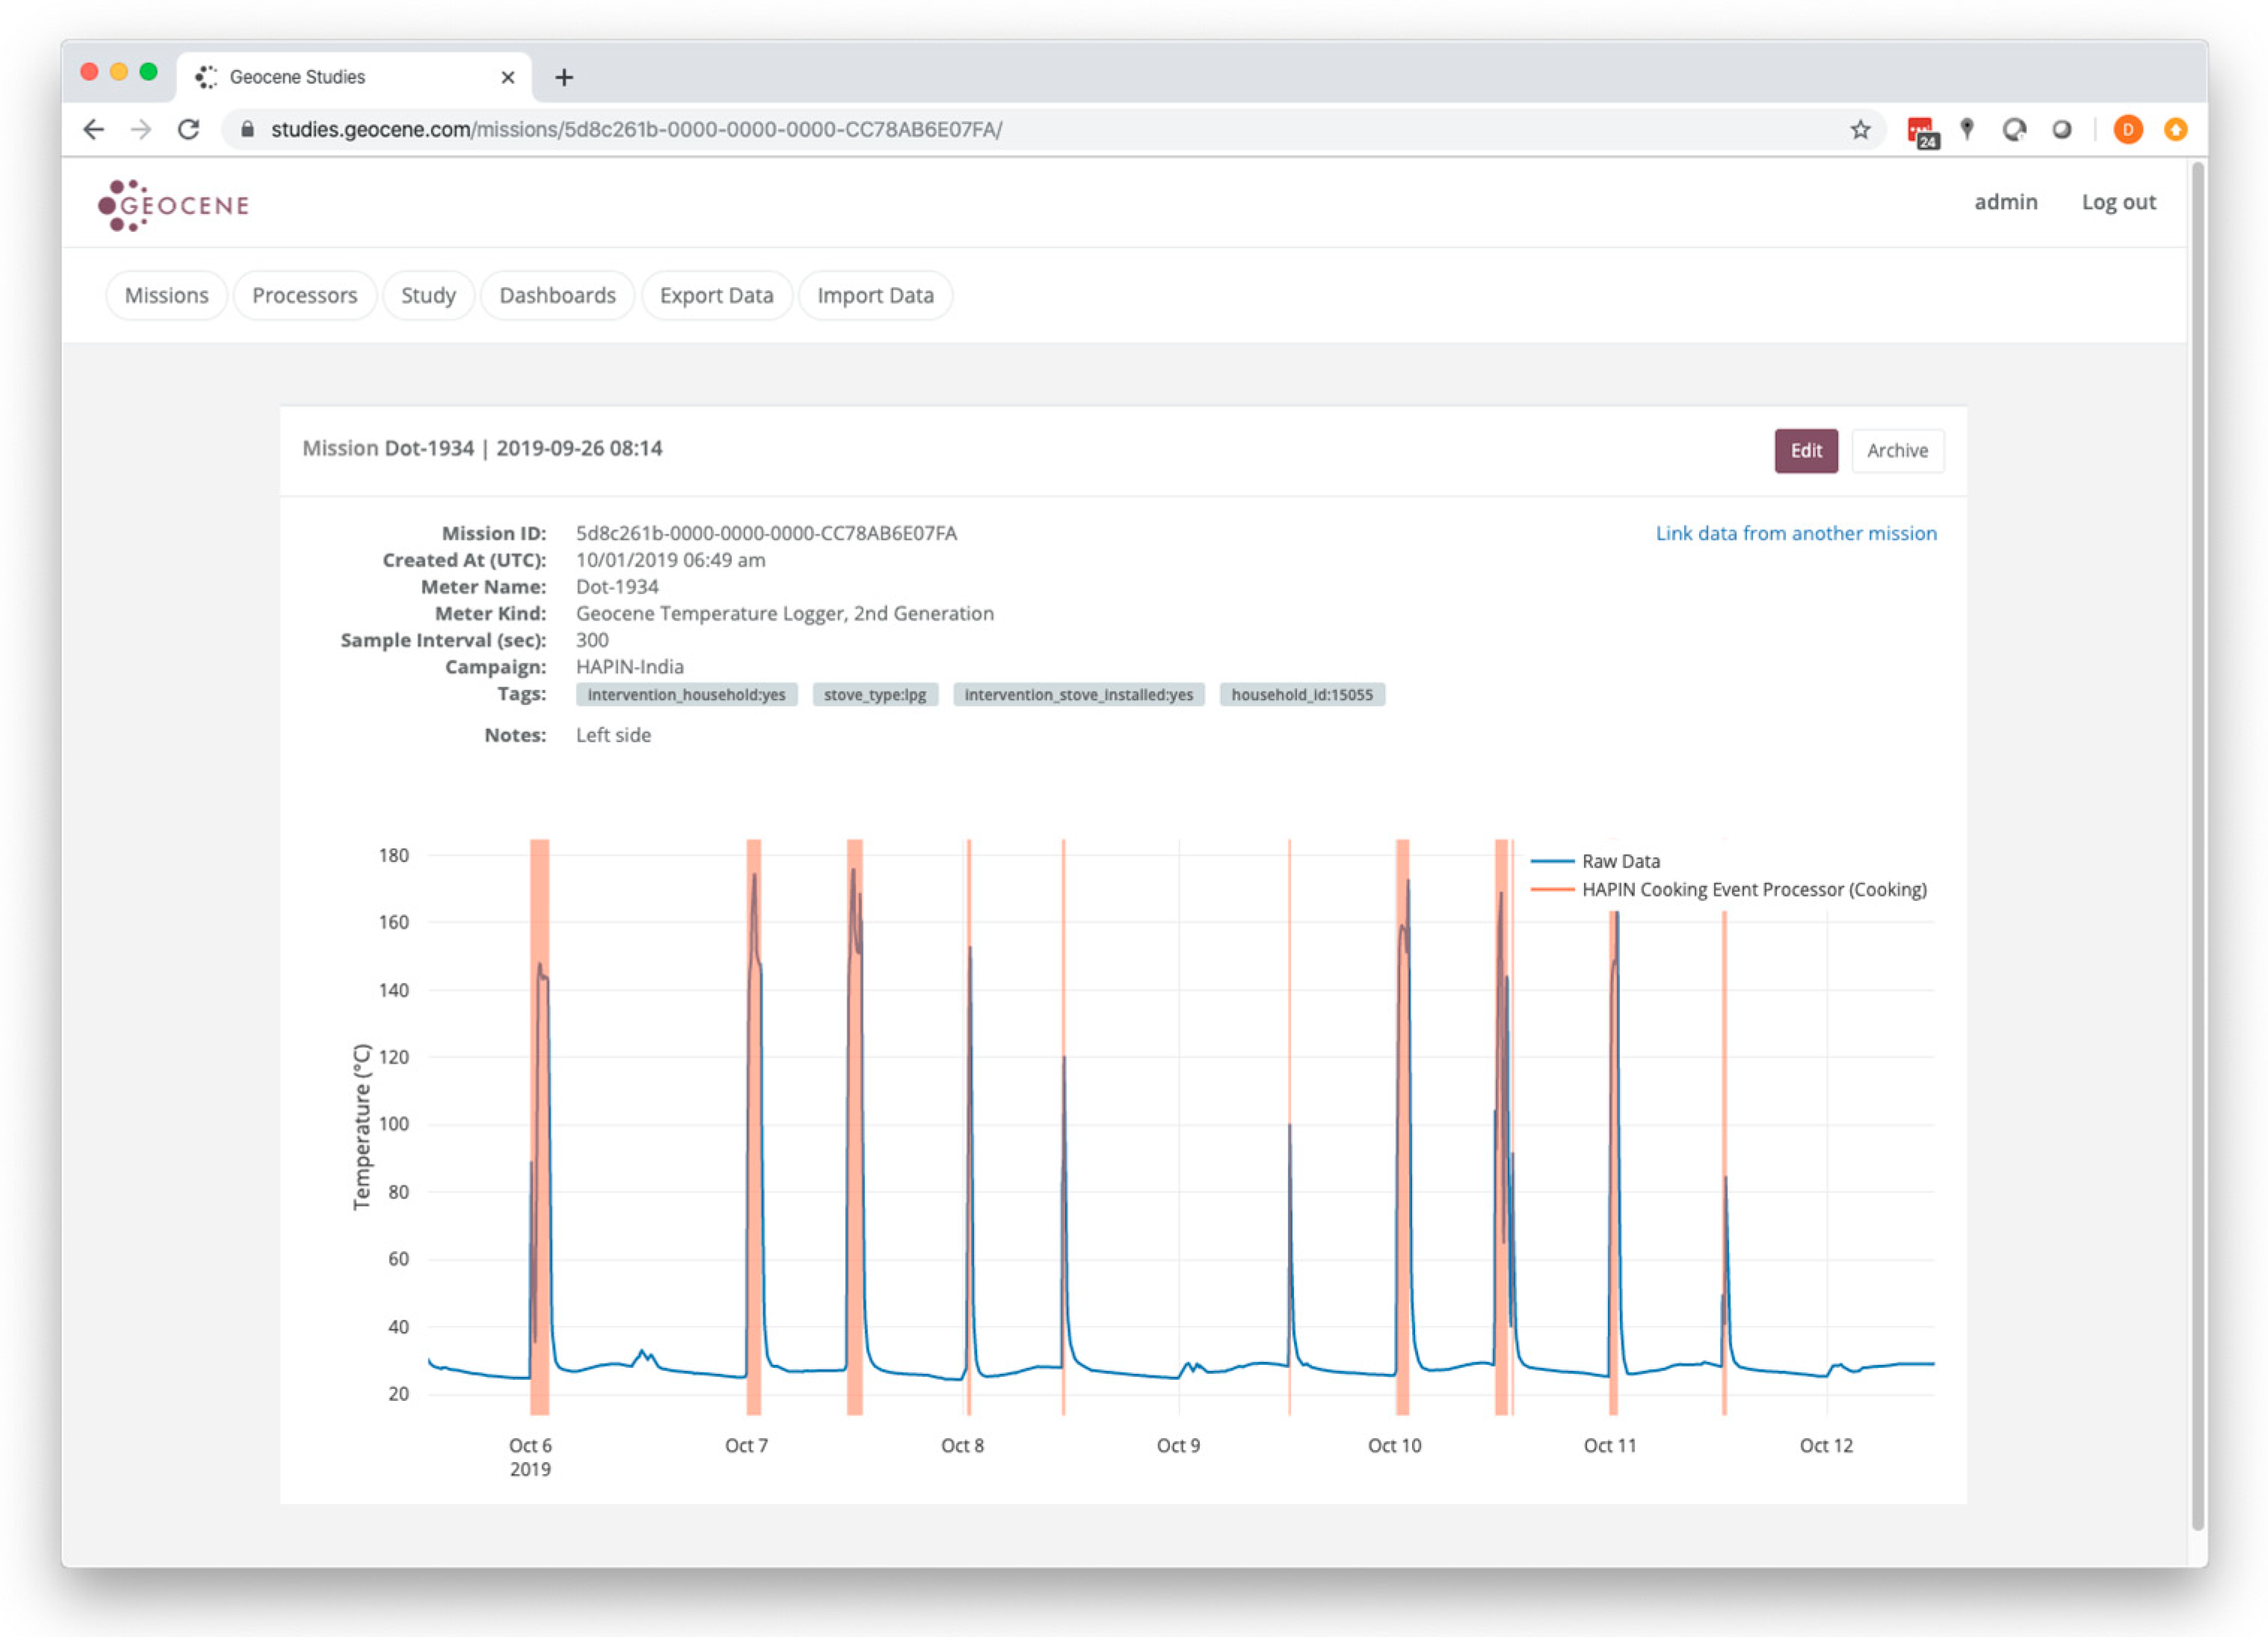
“Temperature data was collected by the logger named ‘ABCD’ at a sampling rate of 2 minutes. The logger was installed on a traditional cookstove within home 12345 in the intervention group.”
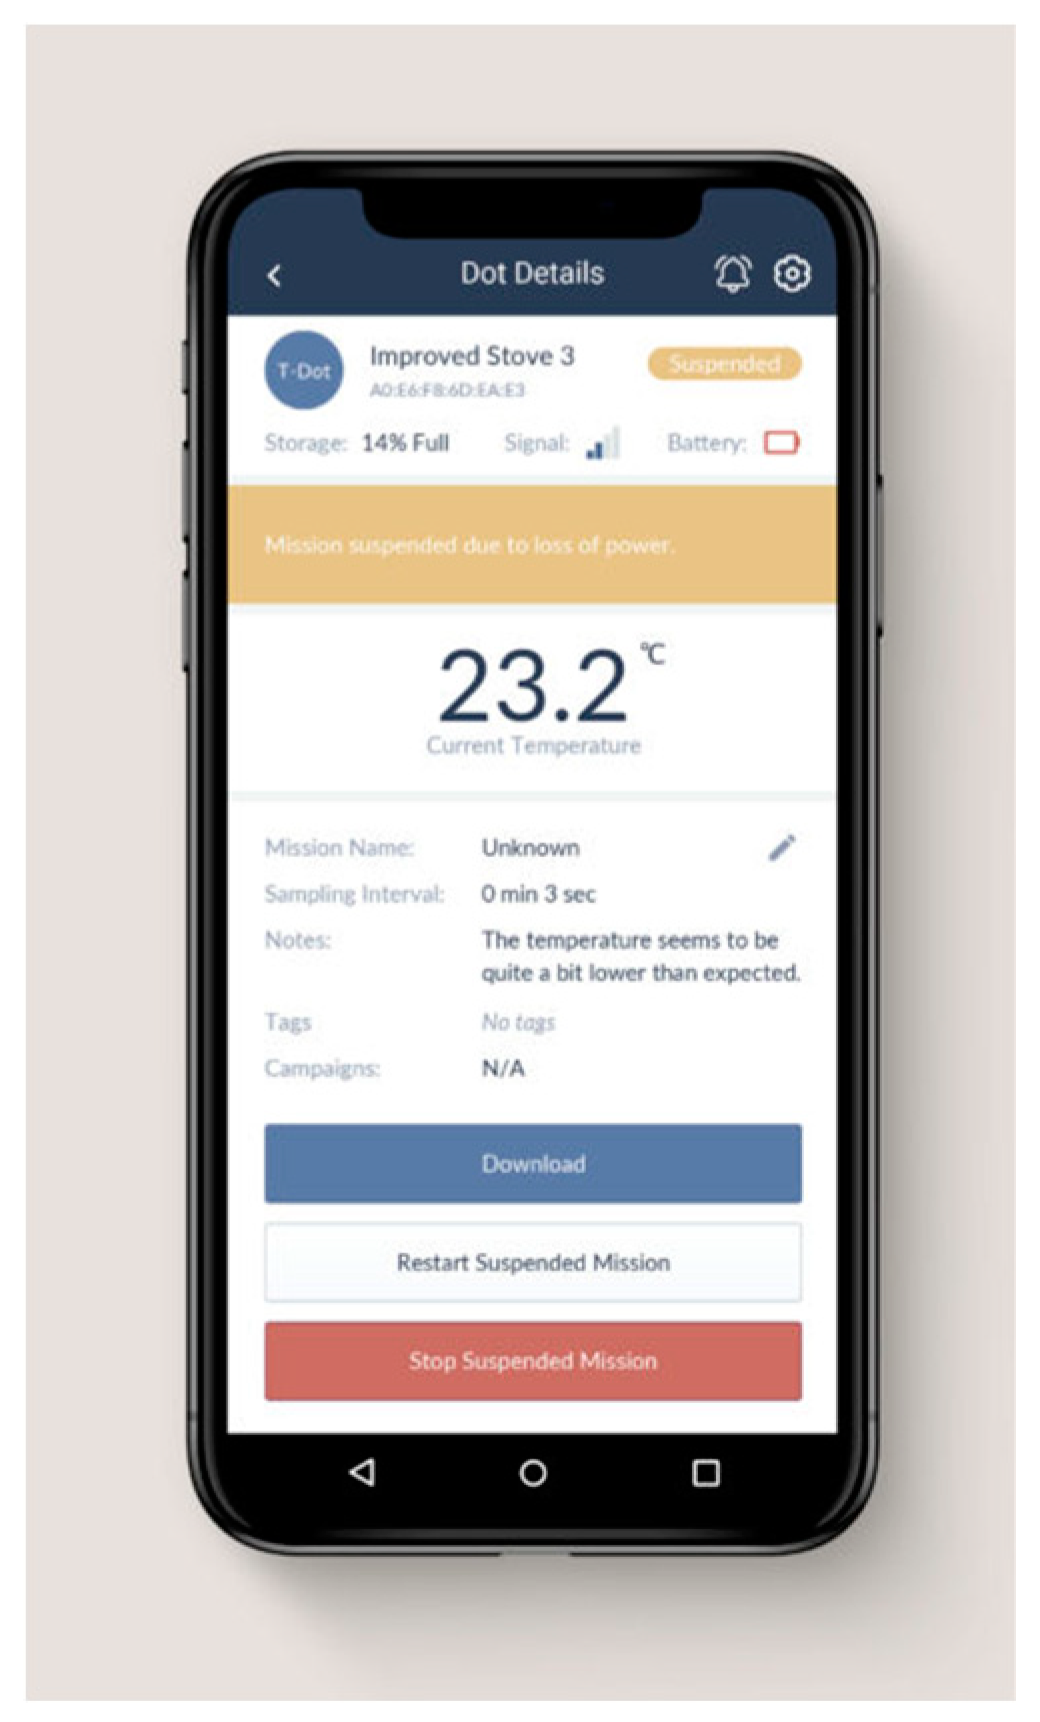
2.3. Ongoing In-App Data Collection and Data Management
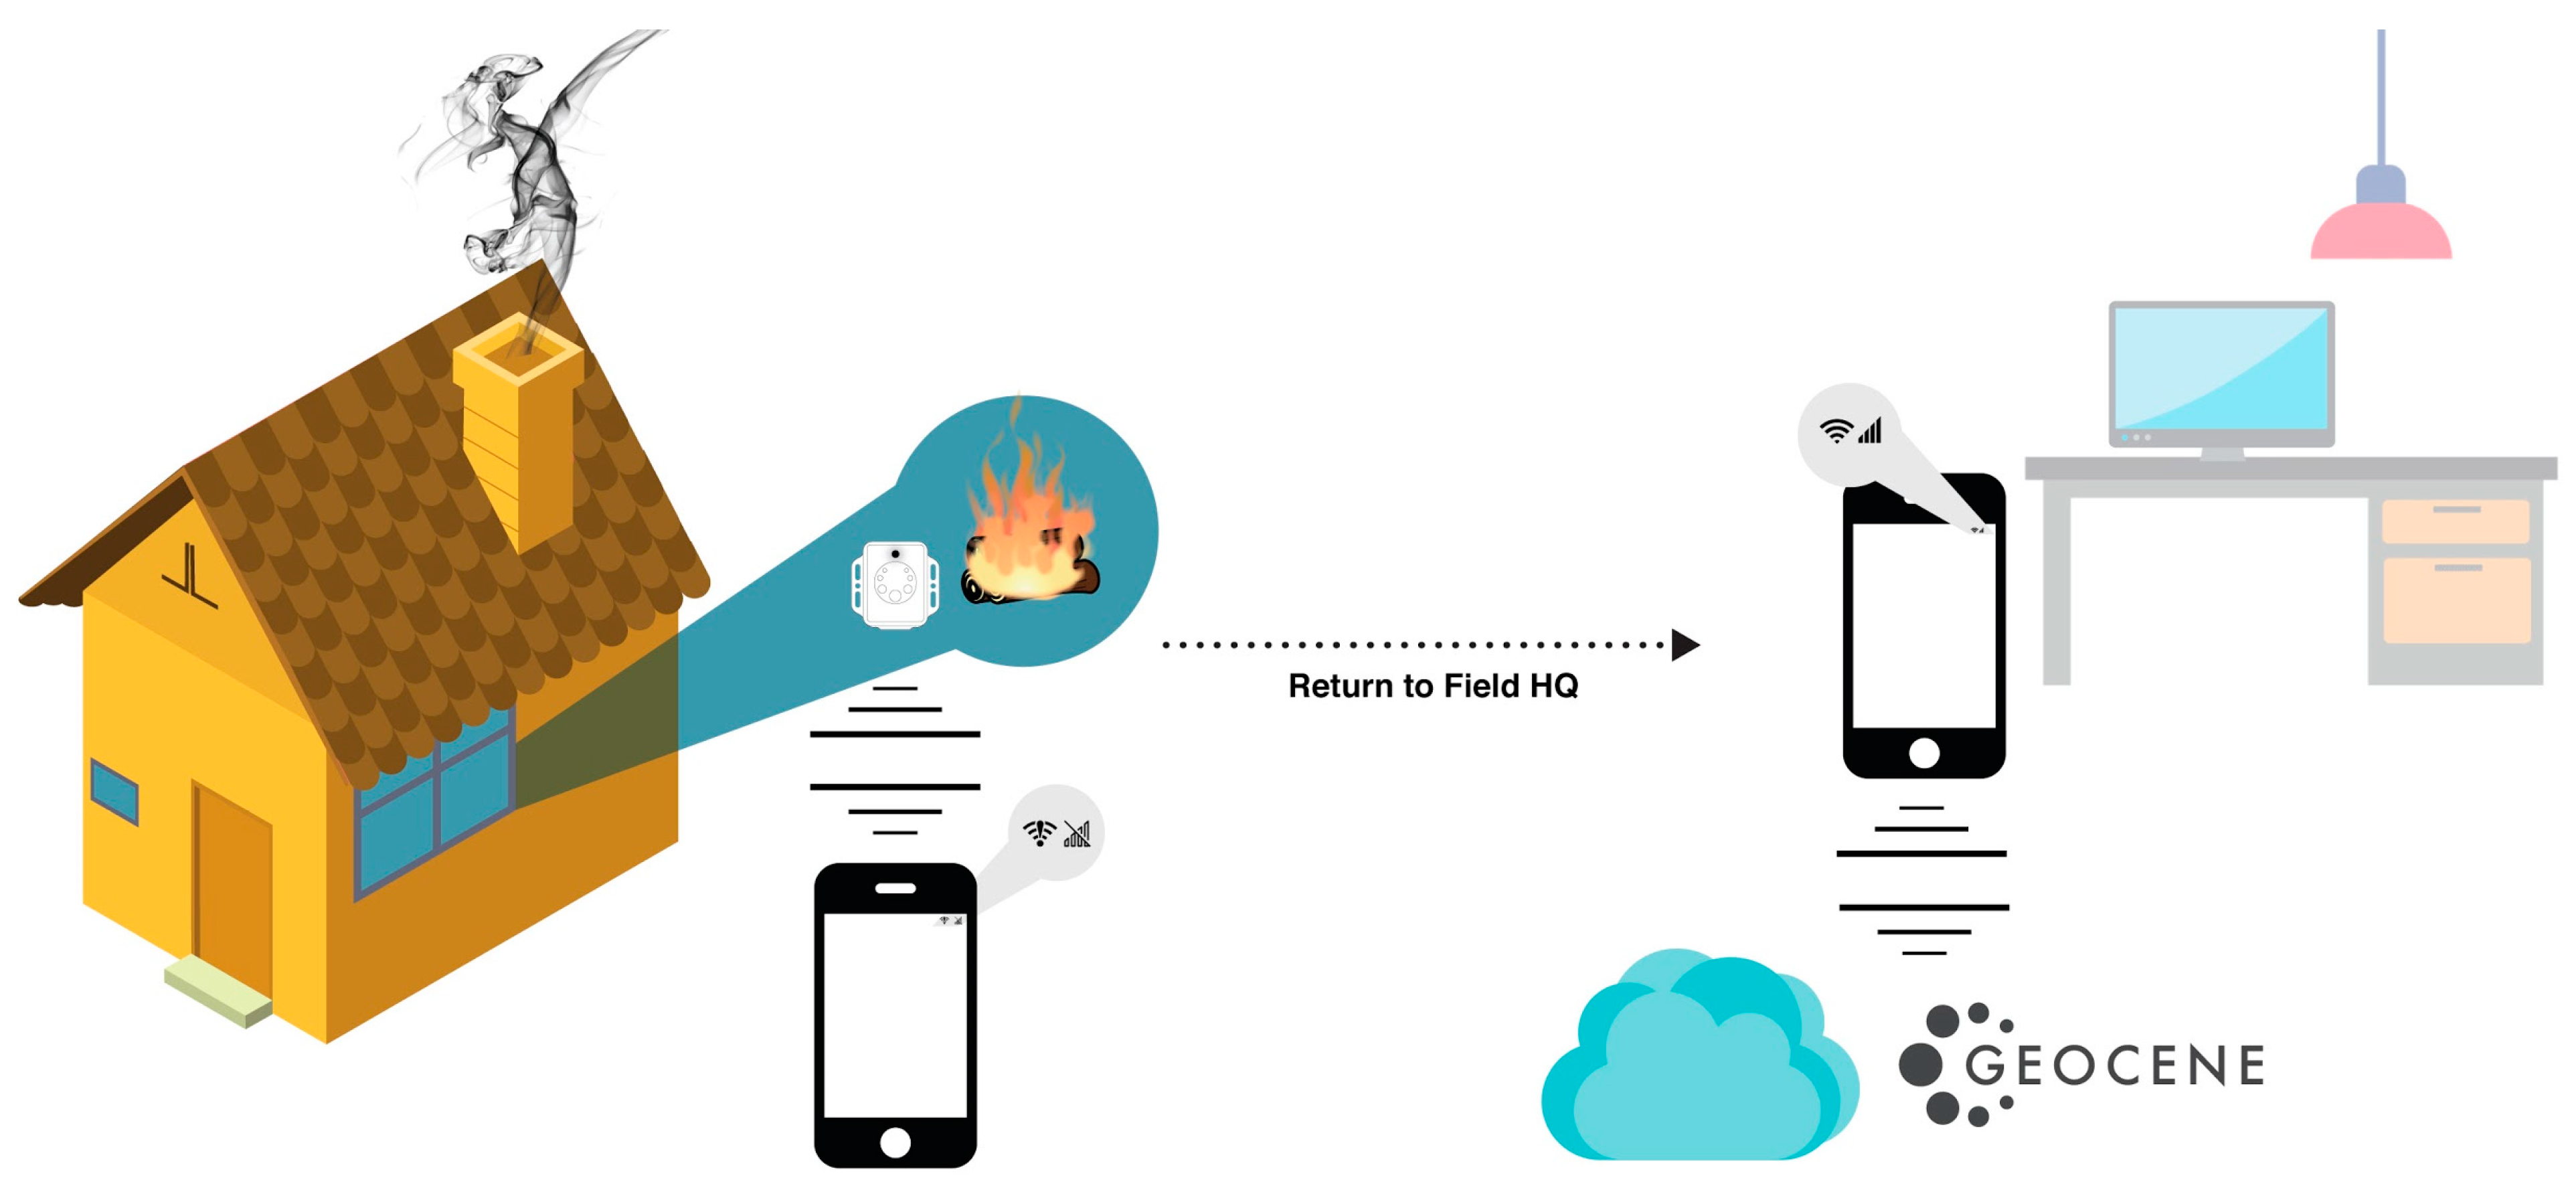
2.4. Networking and Data Transfer to the Cloud
2.5. Cloud Ingress for Dots and Third Party Data Loggers
2.6. Data Warehousing and Viewing
2.7. Cloud Analytics: Models and Processors
2.7.1. Custom Ensemble Machine Learning
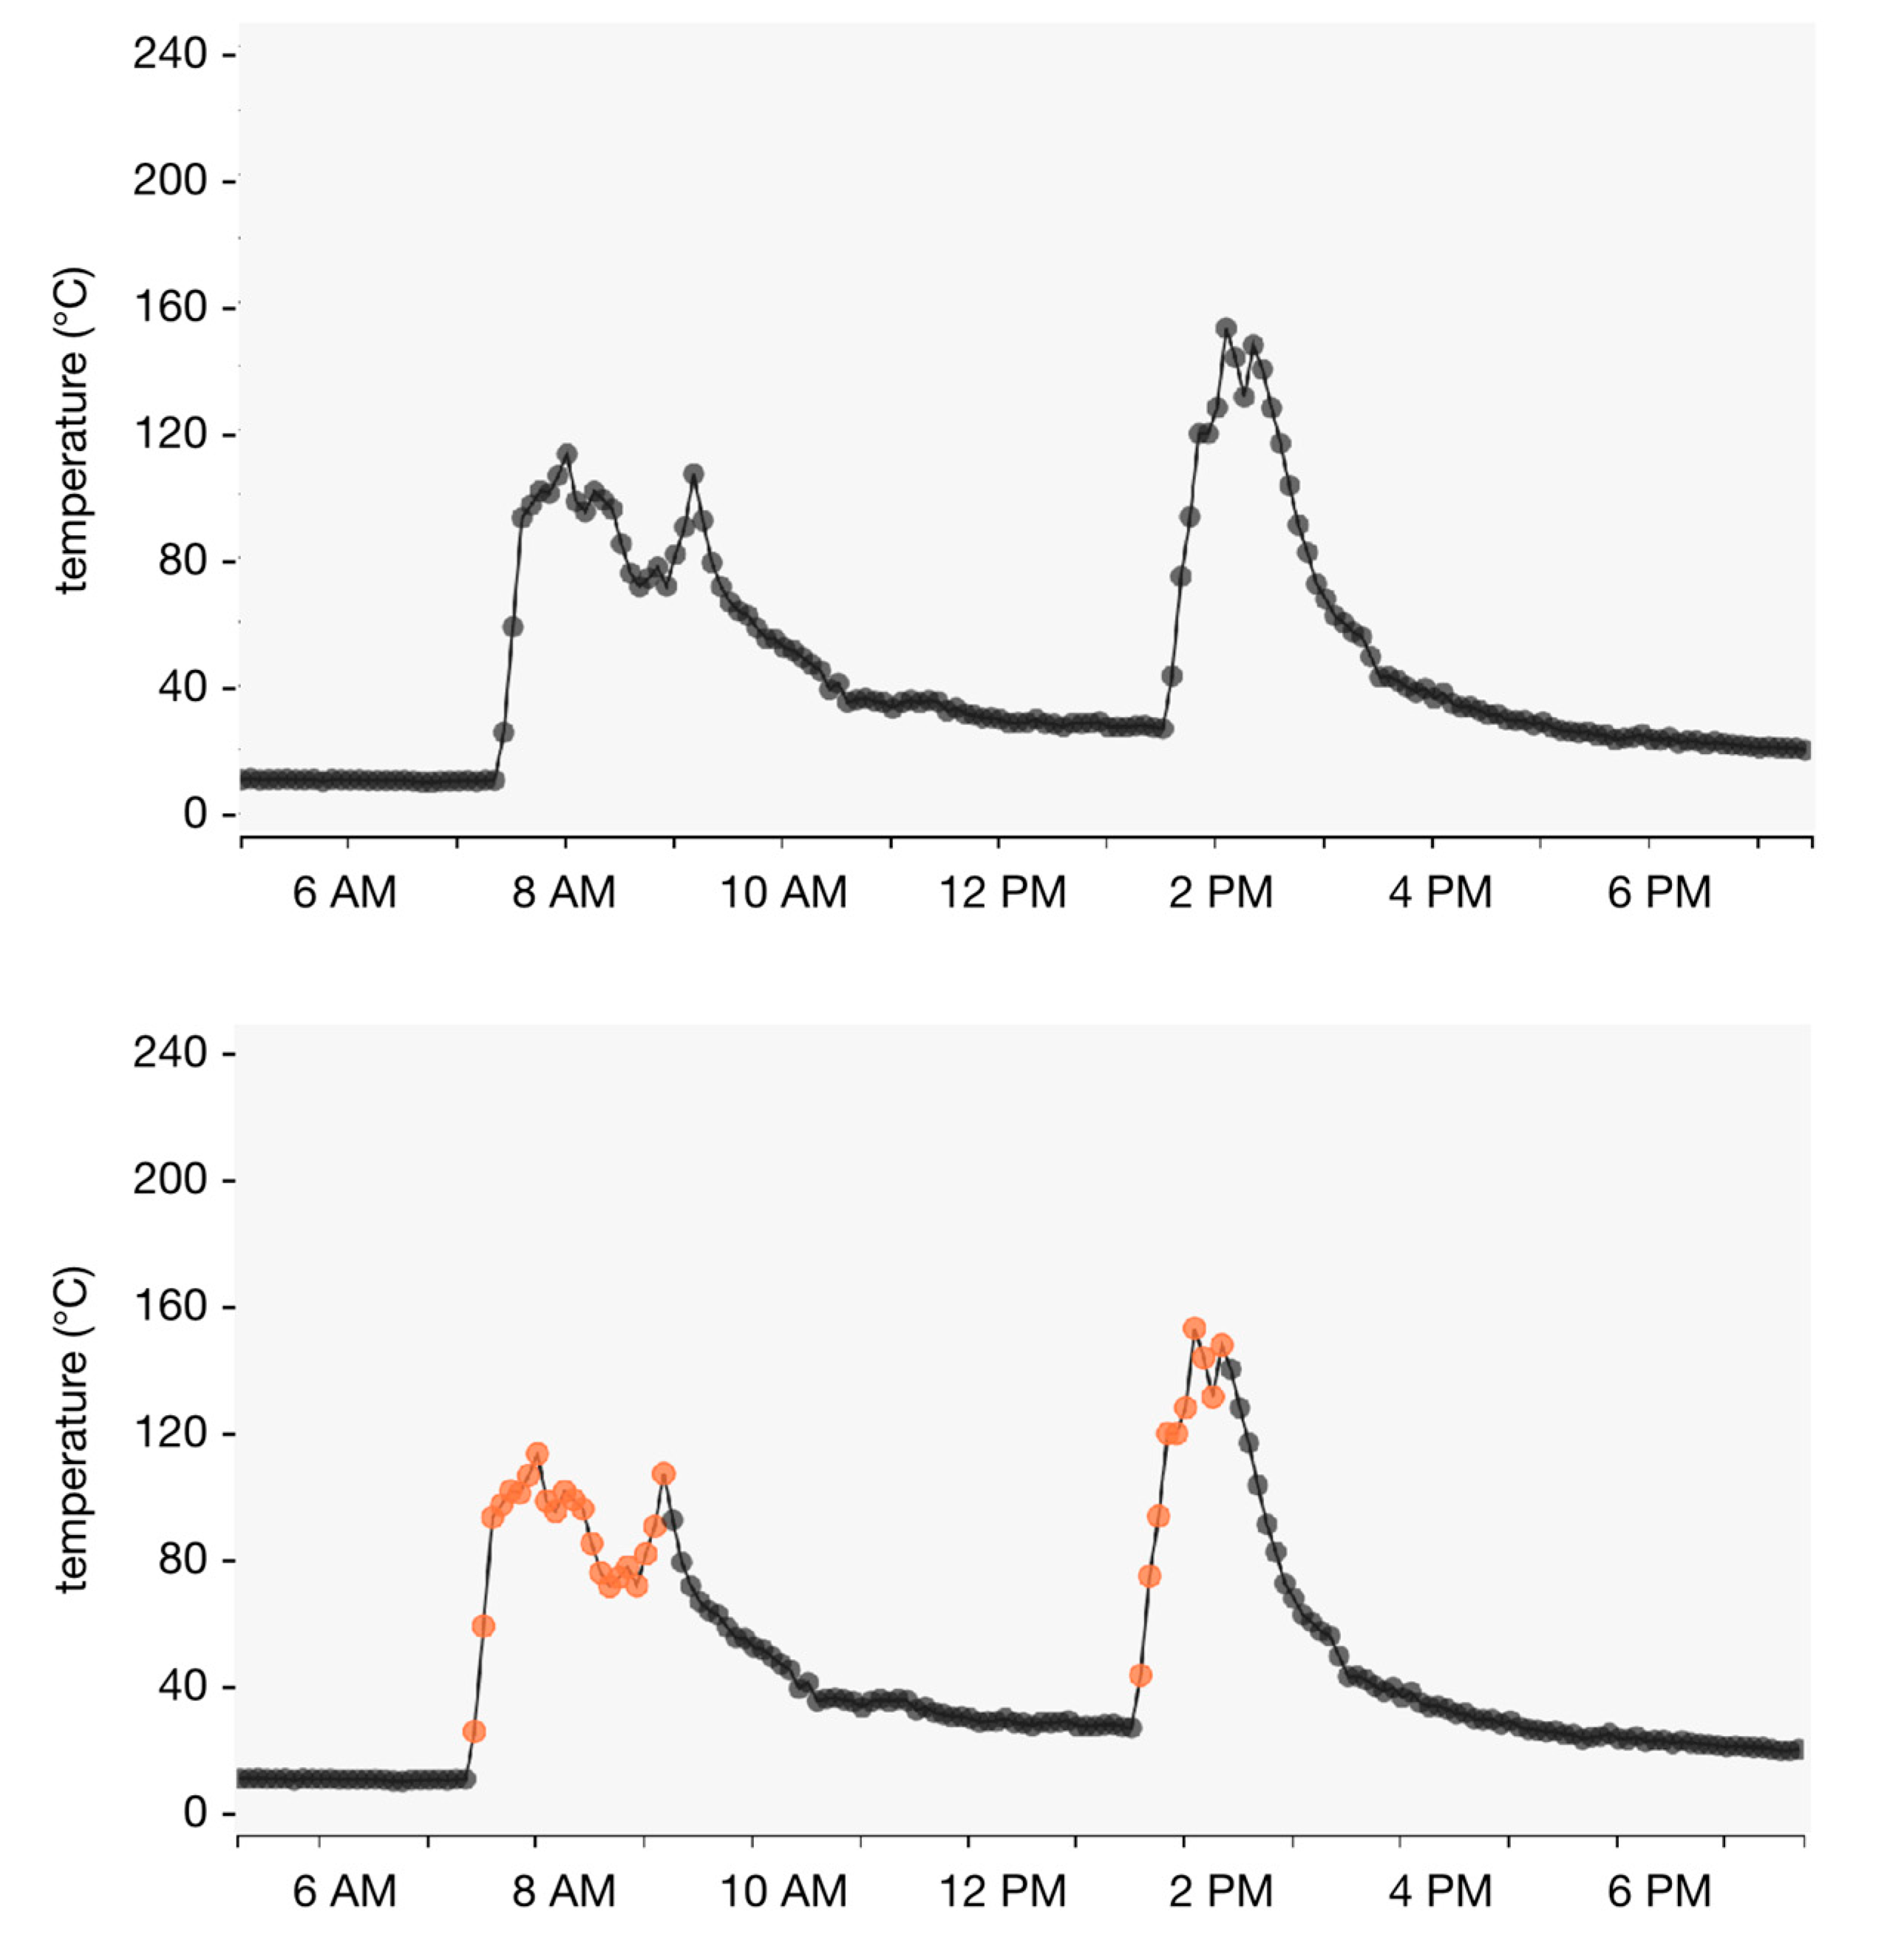
2.7.2. FireFinder
- Assume no points are cooking.
- Assume all points above a user-set primary threshold are cooking—this is a first pass at identifying periods of stove usage.
- Assume points with long runs of negative slopes are not cooking, because the stove is cooling off.
- Assume points with very positive slopes are cooking, because the stove is heating up.
- Assume points with very negative slopes are not cooking because the stove is quickly cooling off.
- Ignore points with inter-sample gaps greater than sample interval—these gaps are due to paused missions.
- Smooth identified events by applying a user-set minimum event length, minimum inter-event gap, and minimum event temperature.
2.7.3. Threshold
2.7.4. Constant
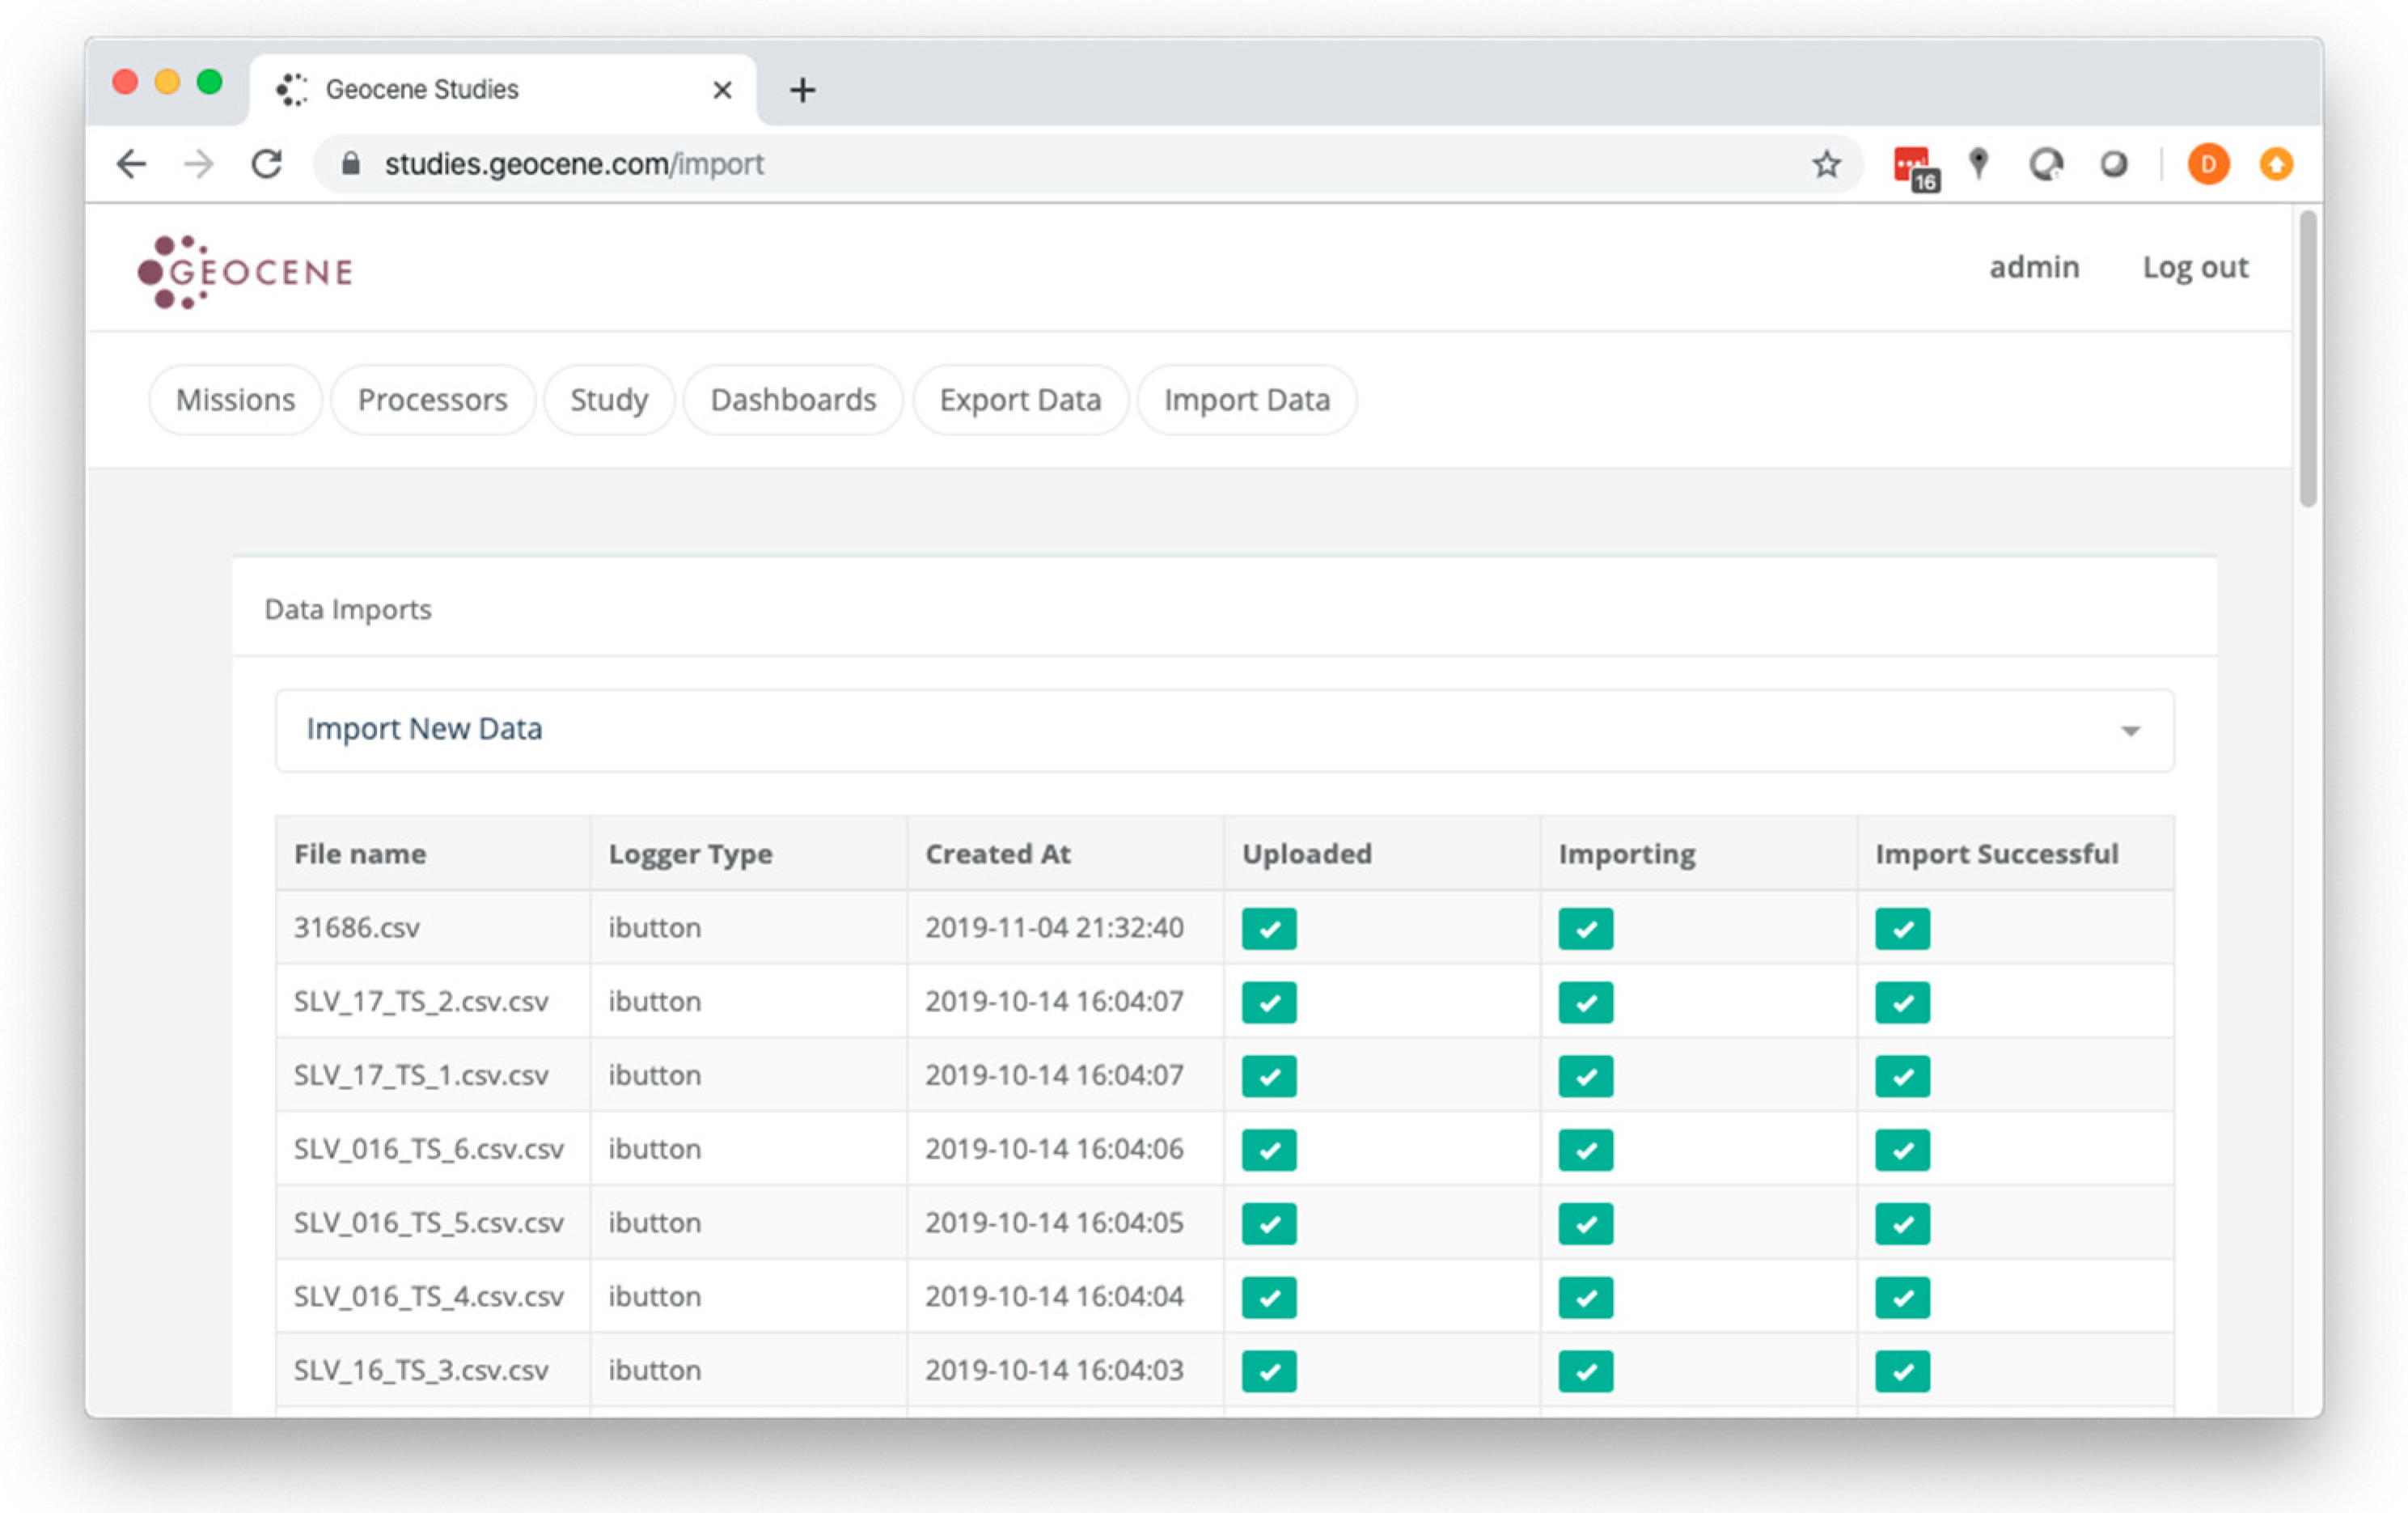
2.8. Exports
2.9. Platform Usage
3. HAPIN: A Case Study
3.1. Overview
3.2. Hardware and Provisioning, Surveying, and Metadata Management
3.3. Date Warehousing and Viewing
3.4. Analytics
3.5. Administration
3.6. Field Benefits and Challenges
4. Discussion and Conclusions
Author Contributions
Funding
Acknowledgments
Conflicts of Interest
References
- Barnes, B.R. The Hawthorne Effect in community trials in developing countries. Int. J. Soc. Res. Methodol. 2010, 13, 357–370. [Google Scholar] [CrossRef]
- Zwane, A.P.; Zinman, J.; Van Dusen, E.; Pariente, W.; Null, C.; Miguel, E.; Kremer, M.; Karlan, D.S.; Hornbeck, R.; Giné, X.; et al. Being surveyed can change later behavior and related parameter estimates. Proc. Natl. Acad. Sci. USA 2011, 108, 1821–1826. [Google Scholar] [CrossRef] [PubMed] [Green Version]
- Clasen, T.; Fabini, D.; Boisson, S.; Taneja, J.; Song, J.; Aichinger, E.; Bui, A.; Dadashi, S.; Schmidt, W.-P.; Burt, Z.; et al. Making sanitation count: Developing and testing a device for assessing latrine use in low-income settings. Environ. Sci. Technol. 2012, 46, 3295–3303. [Google Scholar] [CrossRef] [PubMed]
- Wilson, D.L.; Coyle, J.R.; Thomas, E.A. Ensemble machine learning and forecasting can achieve 99% uptime for rural handpumps. PLoS ONE 2017, 12, e0188808. [Google Scholar] [CrossRef] [PubMed] [Green Version]
- Pillarisetti, A.; Allen, T.; Ruiz-Mercado, I.; Edwards, R.; Chowdhury, Z.; Garland, C.; Hill, L.D.; Johnson, M.; Litton, C.D.; Lam, N.L.; et al. Small, Smart, Fast, and Cheap: Microchip-Based Sensors to Estimate Air Pollution Exposures in Rural Households. Sensors 2017, 17, 1879. [Google Scholar] [CrossRef]
- Holstius, D.M.; Pillarisetti, A.; Smith, K.R.; Seto, E. Field calibrations of a low-cost aerosol sensor at a regulatory monitoring site in California. Atmos. Meas. Tech. 2014, 7, 1121–1131. [Google Scholar] [CrossRef] [Green Version]
- Gao, M.; Cao, J.; Seto, E. A distributed network of low-cost continuous reading sensors to measure spatiotemporal variations of PM2.5 in Xi’an, China. Environ. Pollut. 2015, 199, 56–65. [Google Scholar] [CrossRef] [Green Version]
- Ruiz-Mercado, I.; Canuz, E.; Walker, J.L.; Smith, K.R. Quantitative metrics of stove adoption using Stove Use Monitors (SUMs). Biomass Bioenergy 2013, 57, 136–148. [Google Scholar] [CrossRef] [Green Version]
- Wilson, D.L.; Coyle, J.; Kirk, A.; Rosa, J.; Abbas, O.; Adam, M.I.; Gadgil, A.J. Measuring and Increasing Adoption Rates of Cookstoves in a Humanitarian Crisis. Environ. Sci. Technol. 2016, 50, 8393–8399. [Google Scholar] [CrossRef]
- Weinstein, J.R.; Diaz-Artiga, A.; Benowitz, N.; Thompson, L.M. Reductions in urinary metabolites of exposure to household air pollution in pregnant, rural Guatemalan women provided liquefied petroleum gas stoves. J. Expo. Sci. Environ. Epidemiol. 2020, 30, 362–373. [Google Scholar] [CrossRef]
- Majumder, S.; Mondal, T.; Deen, M. Wearable Sensors for Remote Health Monitoring. Sensors 2017, 17, 130. [Google Scholar] [CrossRef] [PubMed]
- Kirby, M.A.; Nagel, C.L.; Rosa, G.; Zambrano, L.D.; Musafiri, S.; de Dieu Ngirabega, J.; Thomas, E.A.; Clasen, T. Effects of a large-scale distribution of water filters and natural draft rocket-style cookstoves on diarrhea and acute respiratory infection: A cluster-randomized controlled trial in Western Province, Rwanda. PLOS Med. 2019, 16, e1002812. [Google Scholar] [CrossRef] [PubMed] [Green Version]
- Lozier, M.J.; Sircar, K.; Christensen, B.; Pillarisetti, A.; Pennise, D.; Bruce, N.; Stanistreet, D.; Naeher, L.; Pilishvili, T.; Farrar, J.L.; et al. Use of Temperature Sensors to Determine Exclusivity of Improved Stove Use and Associated Household Air Pollution Reductions in Kenya. Environ. Sci. Technol. 2016, 50, 4564–4571. [Google Scholar] [CrossRef] [PubMed]
- Liao, J.; McCracken, J.P.; Piedrahita, R.; Thompson, L.; Mollinedo, E.; Canuz, E.; De Léon, O.; Díaz-Artiga, A.; Johnson, M.; Clark, M.; et al. The use of bluetooth low energy Beacon systems to estimate indirect personal exposure to household air pollution. J. Expo. Sci. Environ. Epidemiol. 2019, 1–11. [Google Scholar]
- Pillarisetti, A.; Vaswani, M.; Jack, D.; Balakrishnan, K.; Bates, M.N.; Arora, N.K.; Smith, K.R. Patterns of stove usage after introduction of an advanced cookstove: The long-term application of household sensors. Environ. Sci. Technol. 2014, 48, 14525–14533. [Google Scholar] [CrossRef] [Green Version]
- Pillarisetti, A.; Ghorpade, M.; Madhav, S.; Dhongade, A.; Roy, S.; Balakrishnan, K.; Sankar, S.; Patil, R.; Levine, D.I.; Juvekar, S.; et al. Promoting LPG usage during pregnancy: A pilot study in rural Maharashtra, India. Environ. Int. 2019, 127, 540–549. [Google Scholar] [CrossRef]
- Wilson, D.L.; Monga, M.; Saksena, A.; Kumar, A.; Gadgil, A. Effects of USB port access on advanced cookstove adoption. Dev. Eng. 2018, 3, 209–217. [Google Scholar] [CrossRef]
- Kipf, A.; Brunette, W.; Kellerstrass, J.; Podolsky, M.; Rosa, J.; Sundt, M.; Wilson, D.; Borriello, G.; Brewer, E.; Thomas, E. A proposed integrated data collection, analysis and sharing platform for impact evaluation. Dev. Eng. 2016, 1, 36–44. [Google Scholar] [CrossRef] [Green Version]
- Clasen, T.; Checkley, W.; Peel, J.L.; Balakrishnan, K.; McCracken, J.; Rosa, G.; Thompson, L.; Barr, D.B.; Clark, M.L.; Johnson, M.; et al. Design and Rationale of the HAPIN Study: A Multicountry Randomized Controlled Trial to Assess the Effect of Liquefied Petroleum Gas Stove and Continuous Fuel Distribution. Environ. Health Perspect. (in press).
- Piedrahita, R.; Dickinson, K.L.; Kanyomse, E.; Coffey, E.; Alirigia, R.; Hagar, Y.; Rivera, I.; Oduro, A.; Dukic, V.; Wiedinmyer, C.; et al. Assessment of cookstove stacking in Northern Ghana using surveys and stove use monitors. Energy Sustain. Dev. 2016, 34, 67–76. [Google Scholar] [CrossRef] [Green Version]
- Johnson, M.A.; Chiang, R.A. Quantitative Guidance for Stove Usage and Performance to Achieve Health and Environmental Targets. Environ. Health Perspect. 2015, 123, 820–826. [Google Scholar] [CrossRef] [PubMed] [Green Version]


© 2020 by the authors. Licensee MDPI, Basel, Switzerland. This article is an open access article distributed under the terms and conditions of the Creative Commons Attribution (CC BY) license (http://creativecommons.org/licenses/by/4.0/).
Share and Cite
Wilson, D.L.; Williams, K.N.; Pillarisetti, A., on behalf of the HAPIN Investigators. An Integrated Sensor Data Logging, Survey, and Analytics Platform for Field Research and Its Application in HAPIN, a Multi-Center Household Energy Intervention Trial. Sustainability 2020, 12, 1805. https://0-doi-org.brum.beds.ac.uk/10.3390/su12051805
Wilson DL, Williams KN, Pillarisetti A on behalf of the HAPIN Investigators. An Integrated Sensor Data Logging, Survey, and Analytics Platform for Field Research and Its Application in HAPIN, a Multi-Center Household Energy Intervention Trial. Sustainability. 2020; 12(5):1805. https://0-doi-org.brum.beds.ac.uk/10.3390/su12051805
Chicago/Turabian StyleWilson, Daniel Lawrence, Kendra N. Williams, and Ajay Pillarisetti on behalf of the HAPIN Investigators. 2020. "An Integrated Sensor Data Logging, Survey, and Analytics Platform for Field Research and Its Application in HAPIN, a Multi-Center Household Energy Intervention Trial" Sustainability 12, no. 5: 1805. https://0-doi-org.brum.beds.ac.uk/10.3390/su12051805