Nonlinear Effects of Human Capital and R&D on TFP: Evidence from European Regions


Faculty of Economics, Maria Curie-Sklodowska University, 20-031 Lublin, Poland
*
Author to whom correspondence should be addressed.
Sustainability 2020, 12(5), 1808; https://0-doi-org.brum.beds.ac.uk/10.3390/su12051808
Submission received: 19 January 2020
/
Revised: 22 February 2020
/
Accepted: 26 February 2020
/
Published: 28 February 2020
(This article belongs to the Special Issue Spatial Econometrics Analysis of Sustainability)
Abstract
:The aim of the paper is to study the impact of human capital and R&D on Total Factor Productivity (TFP) from a nonlinear perspective. In the spirit of the theory of innovation-driven growth and models with thresholds in human capital and low-growth equilibria, we hypothesize that the impact of human capital and R&D on TFP is nonlinear. We also make an attempt to explain complementarities between R&D expenditures and human capital, applying developments in the R&D-based growth models. We use spatial panel data models to estimate the link among R&D, human capital, and TFP across the European regions between 2009 and 2014. Empirical evidence shows that there are decreasing returns to human capital and R&D in the European regional space. Moreover, R&D and human capital turn out to be strategic complements. Finally, regional TFP is found to be positively affected by TFP of neighboring regions.
1. Introduction
The economic performance of regions has not only drawn much attention from scholars but also becomes a primary policy issue [1]. A region’s total factor productivity (TFP) is perhaps the most suitable indicator of economic performance and is most associated with technological complexity and production effectiveness. TFP, measured as a ratio of aggregated outputs and aggregated inputs, has an advantage over labour productivity, which is the most frequently used proxy for regional performance in empirical analyses [2,3]. This results from the fact that TFP captures productivity conditional on the combination of different production inputs and is directly attributable to innovation and technological progress.
As far as the determinants of TFP at the regional level are taken into account, many studies analyze the role played by R&D and human capital contribution to cross-regional productivity differentials and growth [4,5,6]. On the one hand, investments in R&D are supposed to spur the creation of inventions and, as a result of their commercialization, to increase the TFP level of the region where these investments are realized. On the other hand, human capital affects the level of capacity of technological activities (including R&D) and the ability of the region to absorb the inventions discovered in other regions. It is worth noting that empirical evidence contradicts to some extent the theoretical expectations in the relation between human capital and TFP [7,8,9]. The effect of R&D upon TFP does not empirically go straight with the theory either [10]. In light of inconclusive empirical evidence, our study tries to contribute to the existing literature in the following aspects. Firstly, we go beyond the mainstream approach by explicitly accounting for nonlinearities in the relationships between research and development, human resources, and TFP at the regional level. Given the nonlinearity in this relation, we resist the common assumption that R&D is the panacea for the low productivity gap. Instead of this, we suggest that there are strong complementarities and synergies between R&D and human capital that cannot be revealed using the standard linear approach. Secondly, we extend our analyses by incorporating the spatial dimension of knowledge spillovers into our empirical model. It gives a new insight into the role of geography in explaining regional TFP differences.
Our article is organized in the following way. Part 2 includes the literature review and hypotheses development. Part 3 presents data and empirical models. Part 4 shows empirical findings and discussion, and Section 5 concludes and indicates directions for future research.
2. Literature Review and Hypotheses Development
2.1. The Link Between R&D and TFP: Some Stylised Facts about Possible Nonlinearities
As generally accepted, R&D expenditures are targeted toward increasing the stock of knowledge so as to discover new applications and inventions [11]. According to the possibility of the research commercialization into commercial applications, there is a distinction between fundamental research, applied research, and development. Similarly, a distinction is made between R&D directed toward process R&D (the introduction of new methods of production) and product R&D (the invention of new and modified goods). As such, the impact of R&D on productivity is twofold. Firstly, process R&D may increase productivity by enhancing the quality or lowering the average production costs of existing goods. Secondly, product R&D may widen the range of intermediate inputs or final goods available [12].
The association between R&D investments and TFP has a conceptual basis in the literature on R&D-based stream of endogenous growth models, which is rooted in the neoclassical growth theory. According to the neoclassical theory, total factor productivity reflects a shift in the production function resulting from technical progress [13]. Since technical progress is closely related to the knowledge stemming from research and development activities, endogenous technical change is regarded to be generated by formal R&D investments. The first generation of R&D-based models assumes that more R&D labor should result in more TFP growth. In other words, the growth rate of knowledge stock is proportional to the number of researchers. This assumption strengthens the role of increasing returns to scale in the economy and may be explained by the so-called standing on shoulders effect, in which past inventions may deliver a knowledge base that makes future discoveries easier. At the same time, knowledge flows among researchers and knowledge complementarities may be beneficial enough in R&D to allow for the possibility of increasing returns. For example, in the representative R&D-based growth model by Romer [14], profit-maximizing agents make intentional investment decisions about the inventions of intermediate good designs. The final result of the increase in the labour R&D input and total stock of designs and knowledge is TFP growth. It is worth noting that the Romer-type technology function considers knowledge accumulation and spillovers. As noticed by Kuwahara [15], who modifies the Romer model by uniting it with capital accumulation as an input in R&D activities, the economy grows with high growth rate by both efficient R&D with globally increasing returns and capital accumulation. In the same line, Aghion and Howitt [16] introduce a model where innovations represent technological progress. These new methods enhance the quality of current capital goods, which allows for rendering the existing line of goods obsolete. In this model, each researcher generates a constant number of ideas, but the pool of ideas is growing over time. As a result, each new idea leads to a proportional increase in productivity.
On the other hand, the second generation of R&D-based models relaxes the knife-edge assumption of strong scale effect. This group of models consists of semi-endogenous models and fully endogenous “Schumpeterian” models [17]. The former include inter alia the model by Jones [18]. This model allows for weak scale effects, where the productivity of R&D decreases as new ideas are invented. The idea behind the so-called fishing out effect is that the most obvious inventions are discovered first and it is increasingly hard to find out the next inventions. The possibility of decreasing productivity of R&D activities is also recognized by the fully-endogenous “Schumpeterian” models [19,20,21]. The main reason for this situation is the proliferation of R&D effects in the form of intermediate good varieties within many sectors, which results in lower productivity of R&D quality improvement activities. Summing up, the idea that the impact of R&D on TFP is linear seems to be far-fetched.
In a regional context, the issue of productivity growth initiated by technical progress stemming from R&D investments is theoretically addressed by Nijkamp et al. [22]. The authors introduce a nonlinear dynamic model of spatial economic development and R&D. According to the model, R&D expenditures result in an increase of capital productivity through a change in the coefficient of capital. If the impact of a unit of R&D expenditures on productivity is constant, it will generate a steady increase of capital and output productivity. However, there may be a lack of scale effects in R&D activity, which implies that additional R&D investments have no effect on productivity. This situation may result from technological uncertainty. What is more, it may also be expected that there are growth limits, which arise from blockage and some external diseconomies. Therefore, it gets harder and harder to find and implement additional inventions.
Although R&D activities are territorially embedded and a region is regarded as a platform upon which new economic knowledge can be created, harnessed, and commercialized into innovations [23], the new economic geography theory suggests that inter-regional knowledge externalities make a major contribution to explaining regional economic growth [24]. The beginning of knowledge diffusion can have a local character, but it may diffuse behind the boundaries of the region, because of the presence of various modes of inter-regional proximities [25]. It should be noted that the economic exploitation of external R&D requires a minimal level of regional innovation potential generated by internal R&D. Griffith et al. [26] present the theoretical framework to regard R&D not only as a means to stimulate innovation but also as a factor that improves technology transfer. It should be noted that some authors argue that knowledge spillovers are subject to negative externalities. For example, Dietzenbacher and Los [27] apply the idea of forward multipliers from the input–output studies to explain the undesirable externalities of research and development. Although their arguments seem to be logical, the exact mechanism of knowledge spillovers is still unknown and is regarded as an open question for further studies.
The above considerations can be summarized by the hypothesis:
H1:
Internal R&D is nonlinearly related to regional TFP.
2.2. Nonlinearities in the Impact of Human Capital on TFP
Human capital is a complex category that has been investigated from a variety of perspectives by economists. The seminal works of Schultz [28] and Becker [29] point the way to a systematic research of the role of human capital in economic growth processes [30,31,32]. In the traditional growth accounting methodology, human capital, with other reproducible factors, enters into the aggregate production function as an input. Moreover, the aggregate production function usually has decreasing returns to the reproducible inputs, including human capital. From the pragmatic point of view, human capital is accumulated by “changing persons so as to give them skills and capabilities that make them able to act in new ways.” [33]. This approach to human capital formation is adapted by endogenous growth models. As mentioned previously, R&D-growth-based models assume that the growth rate of TFP depends on the number of researchers [14,16,34]. On the other hand, human capital differs from knowledge generated by R&D activities, since it is a rival good and is almost perfectly excludable. Theoretical justification for the central role of human capital in the TFP growth process is provided by Benhabib and Spiegel [35]. In line with the standard approach to growth accounting, the authors model the output growth through the accumulation of inputs and total factor productivity. The originality of their model is that human capital is not the input into the aggregate production function, but contributes to the TFP growth. This impact is twofold. Firstly, human capital allows a follower country/region to reduce its distance to the technology leader in a way that determines the speed of the catch-up effect. Secondly, human capital forms a country/region ability to imitate foreign technologies and at the same time has an impact on the pace of the imitation.
As regards the link between human resources and aggregate productivity, some models allow for the possibility of nonlinearity in this relationship [36]. The nonlinear effect of human capital on aggregate productivity typically arises from the presence of thresholds in the levels of human capital. As suggested by Azariadis and Drazen [37], a threshold means “radical differences in dynamic behavior arising from local variations in social returns to scale”. This means that a critical mass of human capital is necessary for attaining threshold externalities, when possibilities of aggregate production may increase in a rapid manner. Nonlinearities that are formed by the existence of threshold externalities in the creation of human capital, may result in multiple steady-state growth paths (regimes). In case of a low-growth path, low levels of human capital lead to a low return to investment in human capital. Consequently, Becker et al. [38] suggest that in the situation of a low level of human capital, there may be either increasing or decreasing returns to human capital accumulation, but the former are more probable than the latter. On the other hand, a high-growth path shows that high levels of human capital result in a high return to investment in human capital.
Taking into account the possibility of getting stuck in low-growth traps by a country/region, Redding [39] suggests that the changes in human capital productivity may lead to a switch from the low- to high-growth path of the country/region. What is important in his theoretical model is that human capital investments and R&D expenditures are strategic complements. The complementarity between human capital and R&D allows for a possible offset between decreasing returns to R&D and higher investments in human capital and vice versa. In the same vein, Batabyal and Nijkamp [40] introduce a theoretical model of multiregional economic growth which addresses human resources and negative externalities. Their model shows that if R&D becomes more and more expensive, there will be endogenous growth only in a region with increasing level of human capital stock. At the inter-regional or country level, there may exist positive or negative human capital externalities. The former may result from the exchange of knowledge and experience between employees from neighboring regions [25]. For example, Saxenian [41] argues that highly qualified immigrants may keep their professional links to the home countries/regions, which allows for the brain-circulation process. The latter may be explained by competitive processes on the labour markets, where the growth of human capital stock of a particular region arises primarily from a relocation of the skilled workers between adjacent regions [42].
The presented arguments can lead to the following two hypotheses:
H2:
Human capital is nonlinearly related to regional TFP.
H3:
Human capital and R&D are complementary determinants of regional TFP.
3. Data and Methods
We use regional data provided by the Eurostat. Due to missing data, we exclude the regions of Cyprus, Croatia, Greece, Malta, Slovenia, Spain, Portugal and French islands (N = 218) and select 2009-2014 as the research period (T = 6).
We employ a spatial model to describe total factor productivity (TFP) in NUTS2 regions. The spatial models are used to reveal the spatial dependencies in the regional data [43]. As mentioned previously, total factor productivity is the measure of technology and is calculated as the ratio of a sum of weighted outputs to a sum of weighted inputs. For the TFP estimation using the Eurostat regional database, we apply the multiplicatively complete Färe–Primont index, where the inputs are employment in thousand hours worked and Gross Fixed Capital Formation. The output variable is Gross Value Added.
The output-input aggregator functions used for the Färe–Primont index calculation have the following forms [44]:
where and are vectors of representative input and output quantities, is a representative time period, and and are output and input distance functions.
Given the aggregator functions (1) and (2), the Färe-Primont index measuring TFP of region in period relative to TFP of region in period is as follows:
It is worth noting that the Färe-Primont index, which satisfies all economically relevant properties, has the advantage over other more commonly used productivity indices (e.g., the Malmquist index) [45]. Moreover, Van Biesebroeck [46] argues that the nonparametric methods applied to TFP estimation, including the TFP index, should be preferred over the parametric and semiparametric ones when technology is heterogeneous and returns to scale are not constant.
The first step in this kind of analysis is the model specification. It is related to both the selection of explanatory variables and the identification of their impact on the dependent variable. Intramural R&D expenditure and human resources, as well as control variables reflecting the individual characteristics of the regions, are employed as independent variables. In line with some previous studies on TFP determinants at the regional level [3], we initially apply tertiary educational attainment, unemployment rate, adult participation in learning, and population density as control variables. Finally, according to their statistical significance (p < 0.05), only the second variable is used in the models (see supplementary: Annex 1). Our findings confirm the presented theoretical argumentation that the main drivers of regional TFP are R&D and human capital. It should be noted that the role of other variables, besides science and technology indicators, in explaining TFP is weakly supported in theoretical and empirical literature. Significantly, some authors do not include the control variables in their studies on the link between human capital, R&D, and TFP [10], which may result from the problems with the availability of other data on science and technology at the regional level.
Table 1 presents general information on dependent and independent variables. Following the arguments provided by Bronzini and Piselli [4], our study focuses on the variable levels rather than growth rates.
For TFP explanation, the spatial models for panel data are applied. The most complex specification of the spatial model is as follows:
This model is the complete second-order model, which is hierarchically well formulated. It describes TFP variable with spatially lagged endogenous variable (W TFP), exogenous variables (RD and HR), their squares (RD2, HR2) and interaction (RD HR), control variable (UNR), and spatially lagged exogenous variables (W RD, W HR). The inclusion of nonlinearities for explanatory input variables and their interaction allows for the verification of the research hypotheses, which indicate the nonlinear effects of these variables on TFP. Originally, we also considered models that included both the linear and quadratic terms in the interactions, but we could not find any theoretical or statistical support for such a specification (i.e., the likelihood ratio test preferred the model without quadratic terms in the interactions, p = 0.007).
The spatial matrix contains inverse economic distance spatial weights. It arises from the premise that technological diffusion across NUTS 2 regions is influenced by geographical and economic similarity. The measure of economic distance is based on GDP per inhabitant. The spatial weight between region i and region j is calculated as:
where econi is the value of economic variable in region i and dij is the distance between region i and region j.
4. Results and Discussion
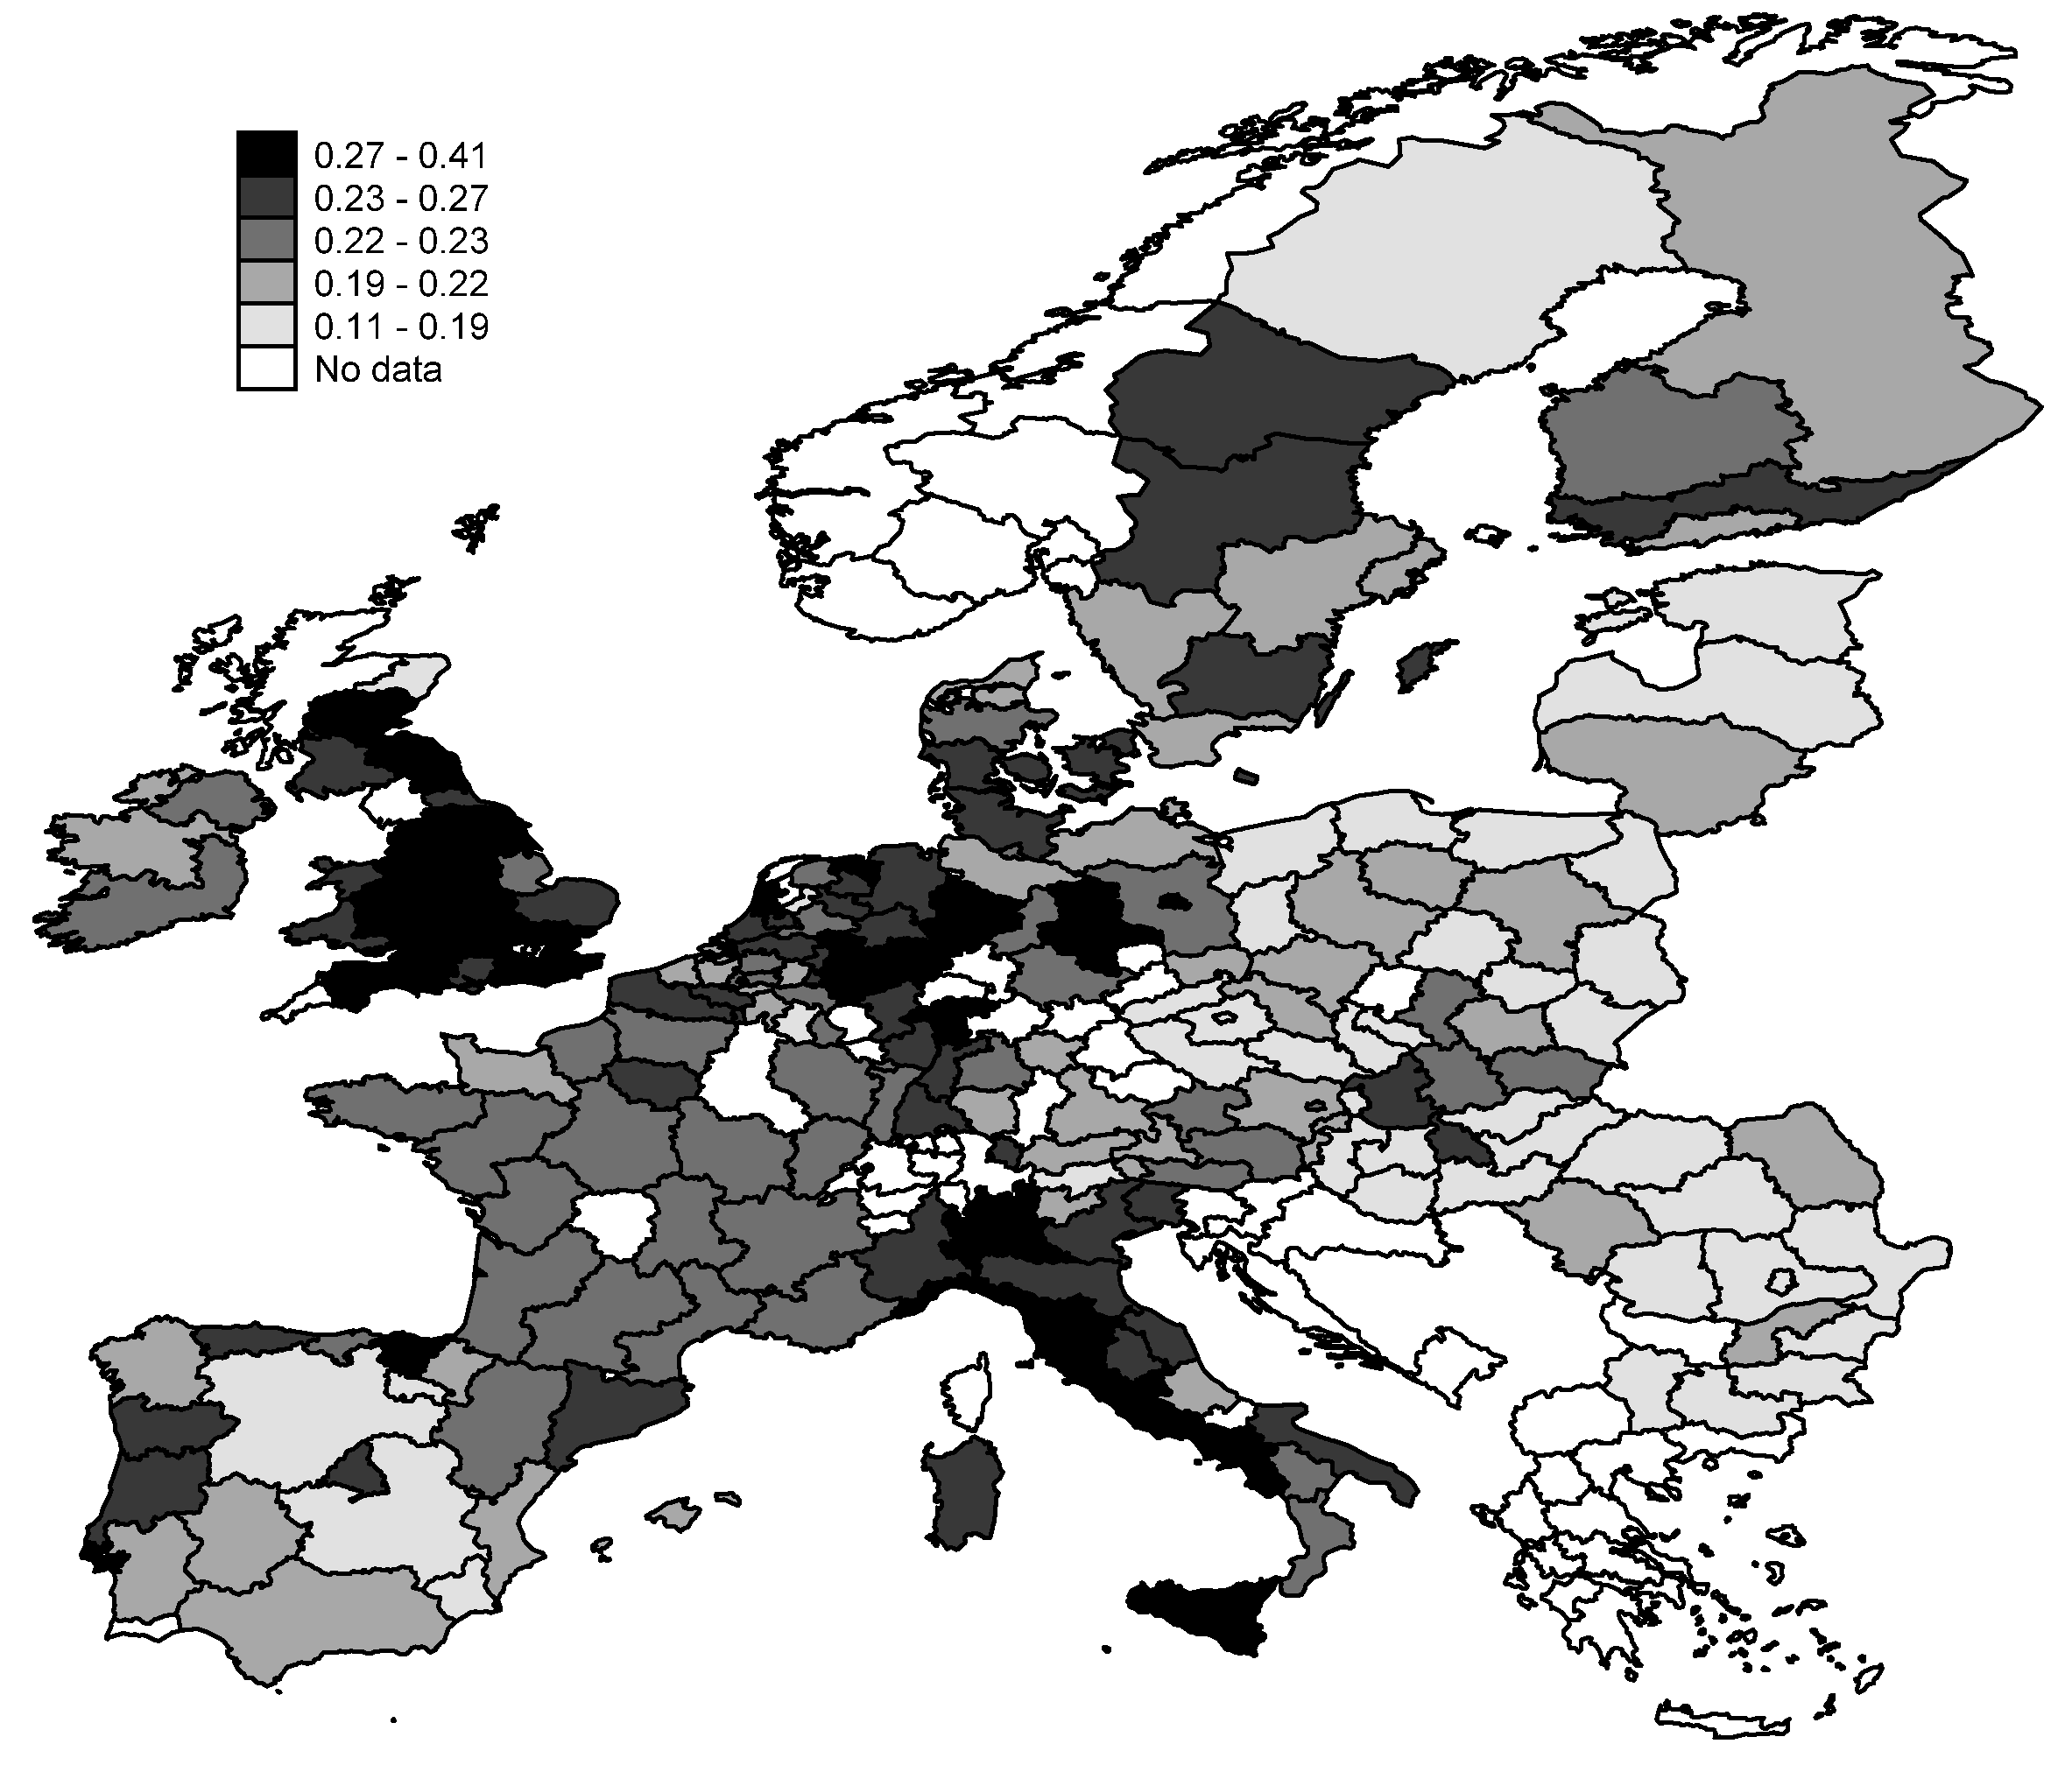
We calculated the level of TFP in NUTS2 regions using Färe–Primont index. The intensities of TFP are shown in Figure 1. As can be seen, UK regions, Groningen, and Düsseldorf achieve the highest levels of TFP, while the lowest-performing regions are the Eastern Europe regions, two Spanish regions (Castilla-La Mancha, Región de Murcia), and Flevoland. According to Dettori et al. [47], intangible assets, including human capital, social capital, and R&D capital, significantly affect TFP diversification within the European regional space.
Table 2 presents the descriptive statistics and correlation coefficients among explanatory variables. The pairwise correlations do not exceed a commonly used threshold (0.7). Therefore, the collinearity is not a problem in our analyses.
Before the spatial model parameters estimation, the spatial dependence of TFP was verified. A very high value of chi2 statistic (270.23) in the Moran test for spatial dependence and a p-value equal to 0 give strong evidence to use spatial models for explaining TFP. We employed the most comprehensive specification of the Model (4), called General Nesting Spatial Model (GNS), to estimate a model with random individual effects (GNSr) and fixed individual effects (GNSf). To choose the most appropriate specification, we applied the Hausman test (chi2 = 66.92, p-value = 0). It prefers a fixed-effect model over random-effects model, which indicates the existence of significant specific factors influencing TFP for regions not included in the model. We used the quasi-maximum likelihood (QML) estimator derived by Lee and Yu [48] for estimation of parameters in the spatial autoregressive model with fixed effects. The comprehensive discussion on strengths and weaknesses of different estimation methods of spatial panel models is provided by Elhorst [49]. The fixed-effect approach, advocated by Mundlak [50], Wooldridge [51], and Hsiao [52], is a very effective means of managing endogeneity in a variety of situations, inter alia, such as the omitted variable bias caused by time-invariant covariates. However, the limitation of panel data is that time-varying omitted-variable bias is still present.
The inclusion of nonlinearities in input variables and their interaction in the model is strongly supported by the high significance of parameters at quadratic and interaction terms. Then, we estimated the parameters of spatial panel models with fixed effects—Spatial Durbin Model (SDMf), Spatial Lag of X Model (SLXf), and Spatial Autoregressive Model (SARf)—and performed the likelihood ratio tests for nested models to choose appropriate spatial specification. The outcomes of the models’ estimation are shown in Table 3.
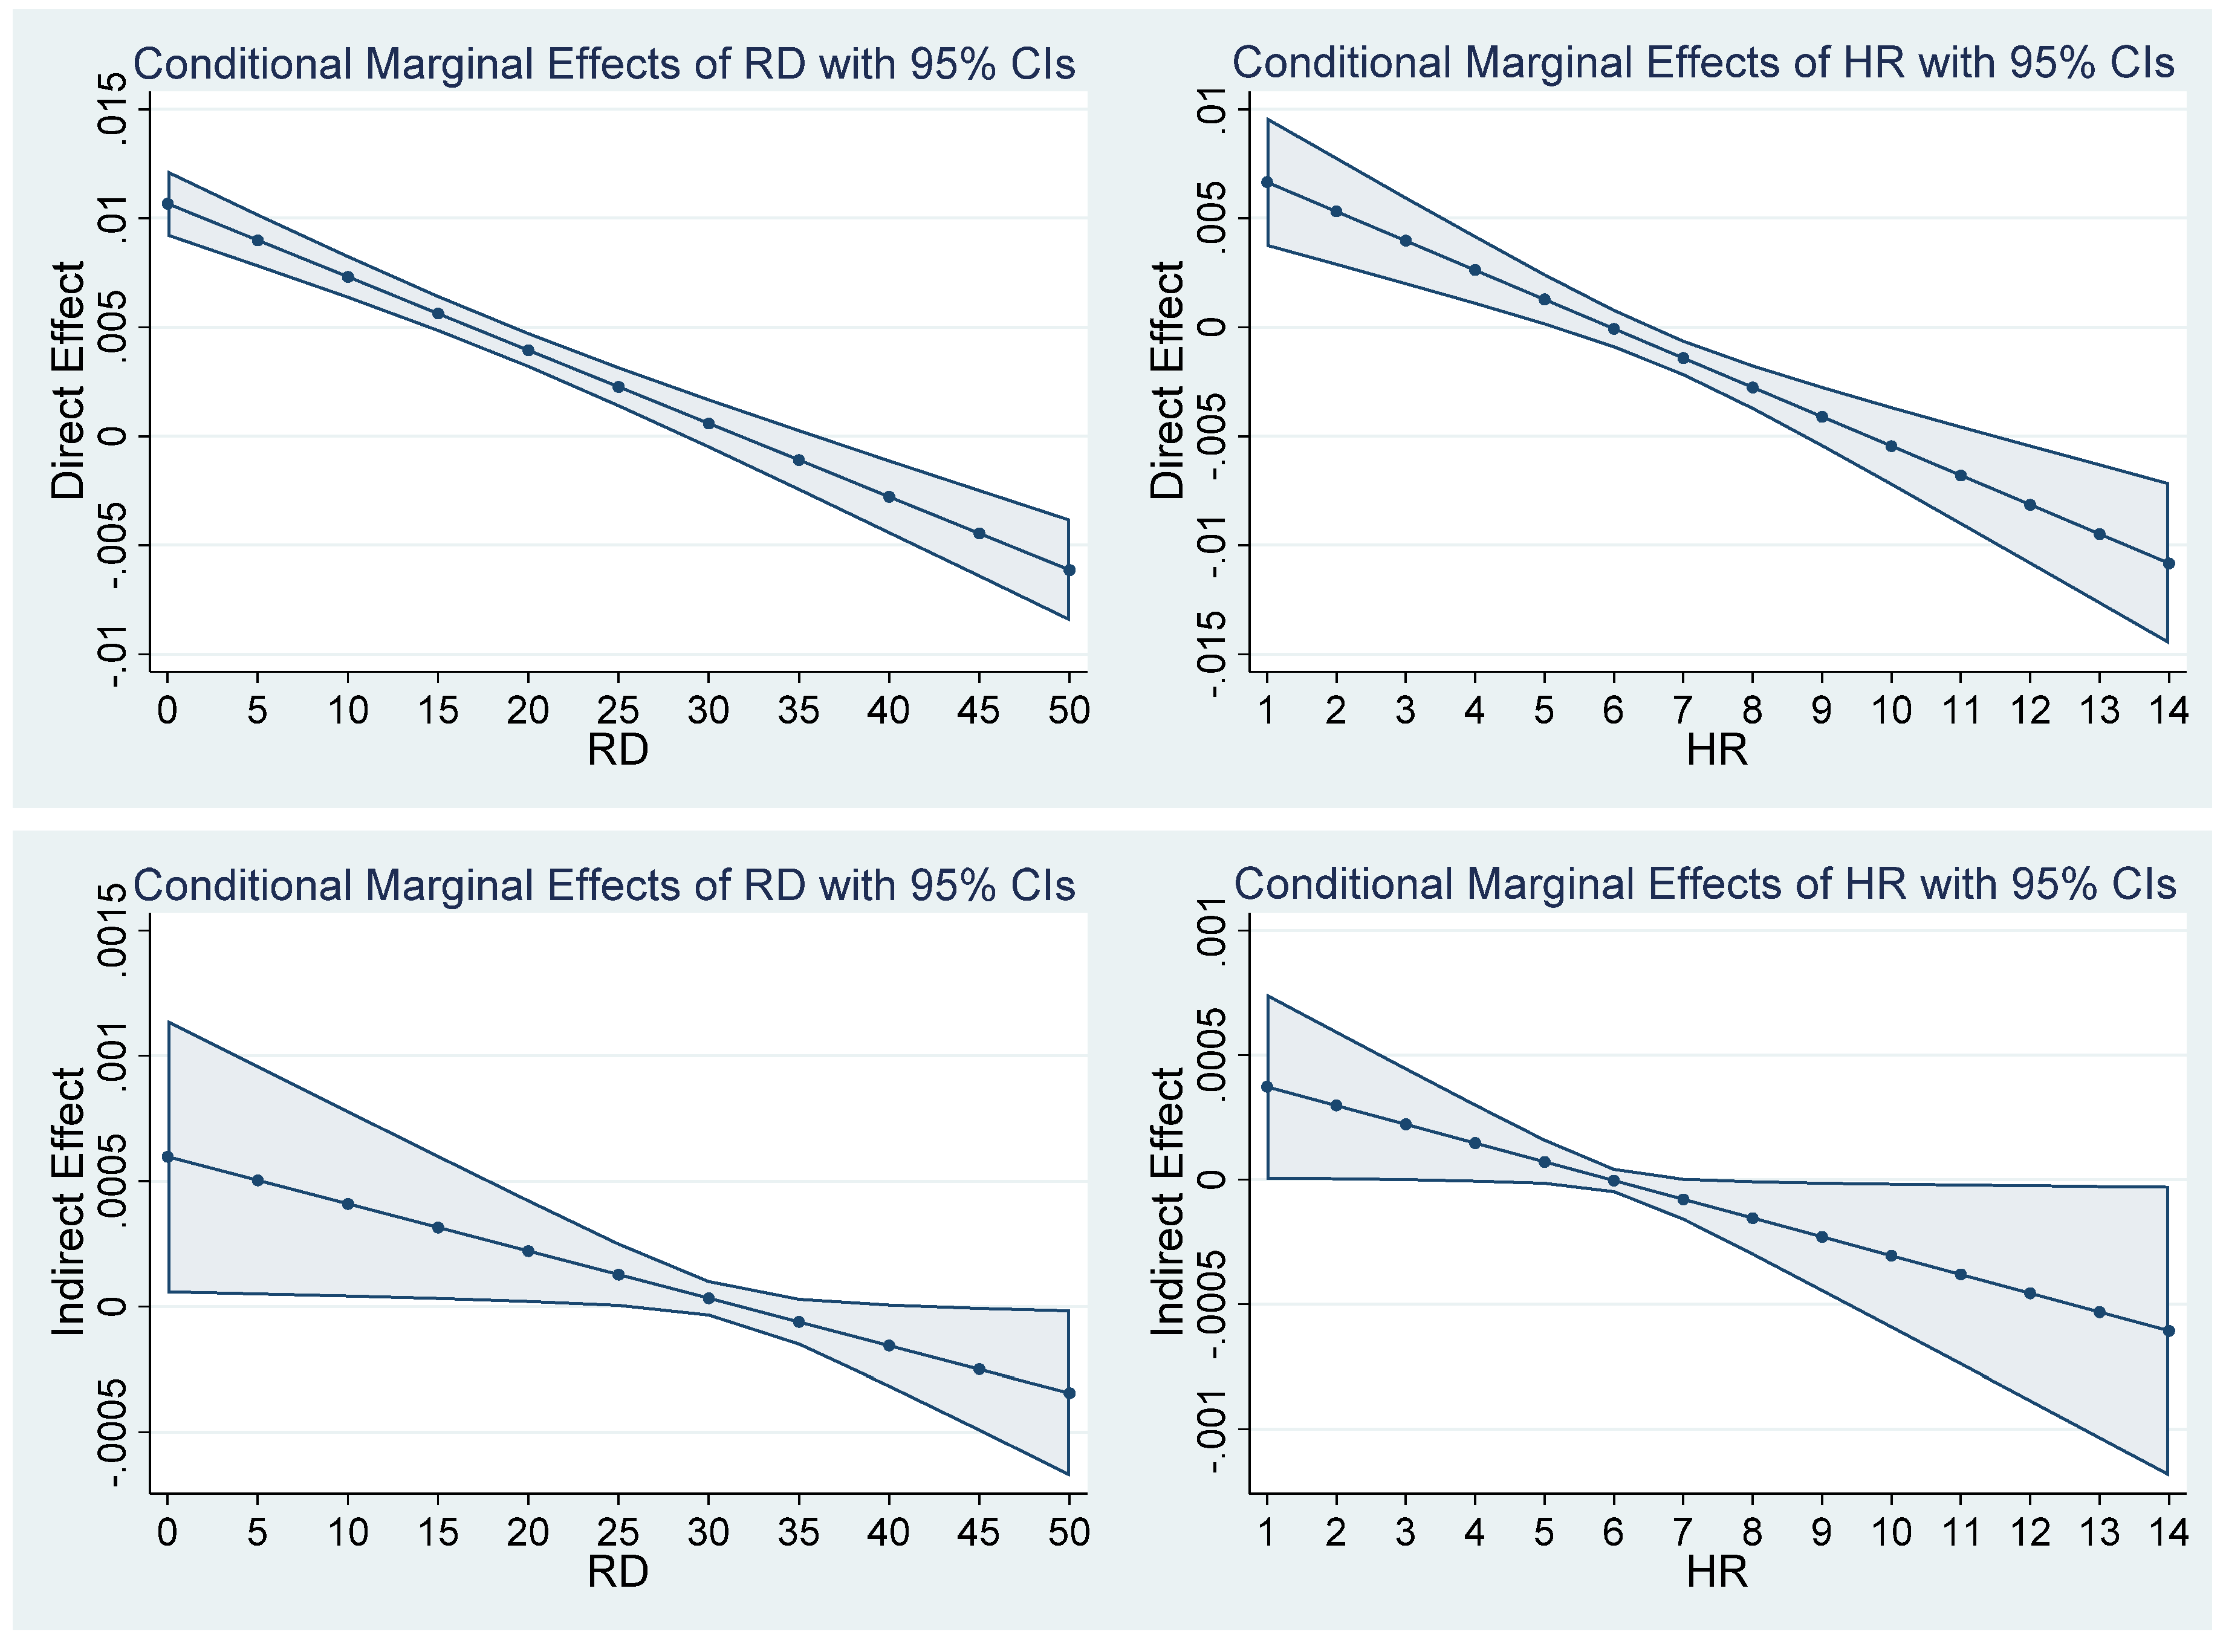
The Hausman test and likelihood ratio tests for nested spatial panel models with fixed effects indicate the Spatial Autoregressive Model (SARf) as the best-fitted model. For the SARf model, we calculate direct and indirect effects of RD and HR variables on TFP at different levels of RD and HR. As these effects are nonlinear, they are presented with 95 percent confidence intervals in Figure 2. Interpreting the results, it should be noted that a change in a single observation (region) involved with any given covariate will have an impact on the region itself (a direct effect) and possibly influence all other regions indirectly (an indirect effect). In turn, conditional marginal effects are statistics derived from a previously fit model at fixed values of some covariates and integrating over the remaining ones. The delta method is used to calculate standard errors.
Our results show that the direct benefits to regional R&D investments are subject to decreasing returns, supporting the first hypothesis. As can be seen, there is a point (i.e., 30%), where additional R&D becomes unproductive. These findings are consistent to some extent with the implications of the second generation of R&D-based models [18], which suggest the existence of weak scale effects to R&D. Contrary to the optimistic view of the first generation of R&D models ascribing great importance to increasing returns to R&D, our research tempers the enthusiasm for nonlimited investments in R&D. As is shown in the further analyses, the R&D investments require complementary intangible assets to transform technical inventions into productive innovations. The observed nonlinearity in the R&D and TFP relationship can provide an explanation for contradictory findings of other empirical papers. Männasoo et al. [10] find that there is inconsistent evidence for the impact of R&D on regional TFP growth. They report that this effect is significant in only two of five presented estimations. Moreover, Beugelsdijk et al. [3] point out that R&D spending has no effect on regional TFP level. On the other hand, some studies give strong support for the existence of a positive link between R&D and TFP at the regional level [4].
We found that there are knowledge spillovers in the regional European space. The estimation of the SARf model reveals that the spatial autocorrelation parameter is positive and significant. This means that TFP spills over from nearby regions. To find the channels of spillovers, we calculated the indirect effect of R&D investments. It is also of interest to find that this effect is decreasing. For relatively low levels of regional R&D expenditures, knowledge spillovers are positive. After passing a threshold (i.e., where regional R&D equals to 30%), knowledge spillovers become negative. Interpreting these results, it should be noticed that the indirect effect of R&D is slightly significant since the confidence interval broadens before and after reaching the threshold.
As regards the direct effect of human capital on TFP, we find strong support for the hypothesis asserting that human capital takes a nonlinear relationship with regional TFP (Hypothesis 2). Diminishing returns to human capital meet the expectations formulated on the ground of the traditional growth accounting methodology. At the same time, the outcomes of the research allow for rejecting the supposition of a single response coefficient for human capital. At the country level, similar conclusions are provided by Savvides and Stengos [36], who reveal that the beneficial effects of human resources on output growth is limited to economies with a lower-middle level of human capital, while for economies with a very high level of human resources, the effect turns out to be negative. In the case of TFP growth, the authors reveal that the impact of total years of schooling on TFP growth is nonlinear. More specifically, there are two thresholds. The former is related to the change of the sign of human resources impact on TFP growth, while the latter is involved with the change in the monotonicity of human capital effect. From Figure 2, it can be seen that the point where human capital appears to be unproductive is about 6%. It suggests that overinvesting in human capital may cause the opposite effect to the expected one. As with the direct effect of R&D investments, the explanation of this situation requires a reference to the Redding’s [39] model.
Unfortunately, our results reinforce the inconclusive empirical evidence in the literature on human capital spillovers at the regional level. Ramos et al. [42] in their empirical study in the sample of Spanish regions in 1980–2007 show no confirmation for positive regional spillovers of human capital. Moreover, they even report negative externalities of human capital for some specifications of spatial lags. Although the indirect effect of human capital in our analyses is decreasing and shows both positive and negative spillovers, it is hard to draw robust conclusions on its indirect impact on TFP due to the breadth of confidence interval. It may suggest that the TFP spillover is a complex process and cannot be explained entirely via human capital and R&D diffusion.
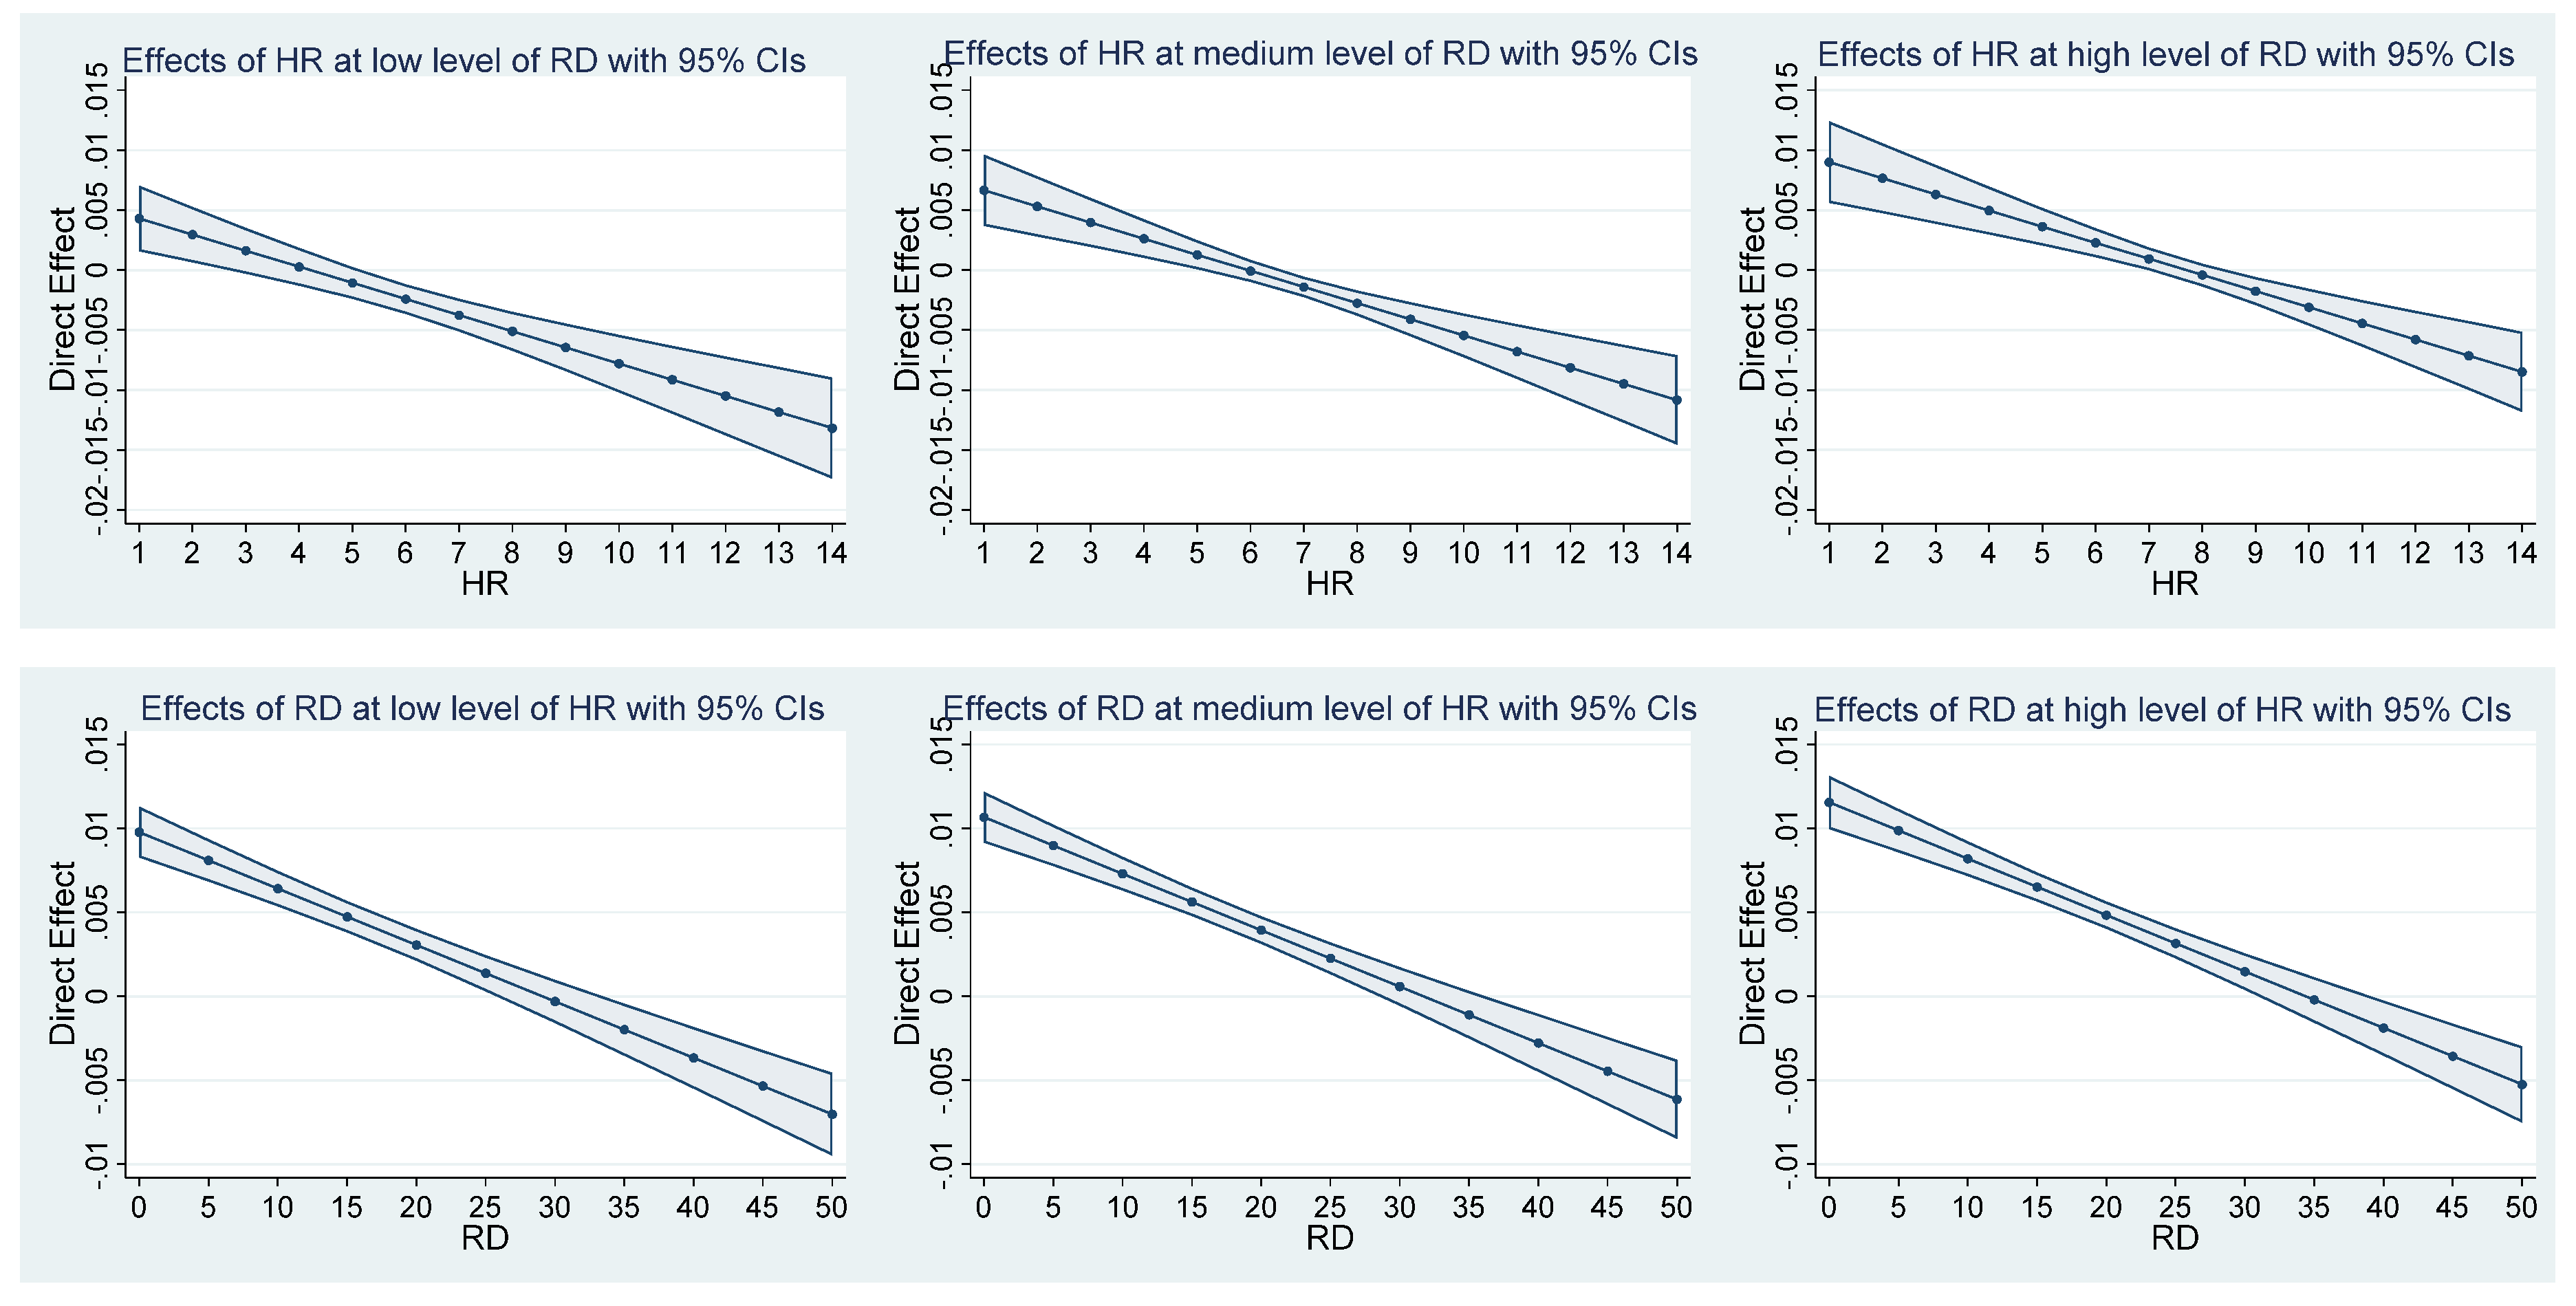
Our findings on the impact of human capital and R&D investments on TFP is extended further by attempting to measure the synergies and complementarities in this relationship. Figure 3 shows the direct conditional effect of R&D on TFP at different levels of human capital. As can be seen, there are increasing returns to R&D when the region simultaneously enhances its stock of human capital. A theoretical explanation of this finding is provided by Batabyal and Nijkamp [40] in their the multiregion model of economic growth with human capital and negative externalities in innovation. With respect to other empirical studies on a moderating role of human capital in the relationship between R&D and TFP at the regional level, there is a stream of research on verifying the effect of innovation on TFP within different spatial modes of innovation. For example, Charlot et al. [53] and Capello and Lenzi [54] show that the impact of additional R&D expenditures on regional productivity is higher in units with greater science-based knowledge endowment. What is interesting is that Capello and Lenzi [5] reveal that regions with a high level of human potential development can gain additional TFP gains from innovation. The complementary relationship between innovation and human capital capabilities is also advocated by Sanso-Navarro and Vera-Cabello [55] who study nonlinearities in regional growth.
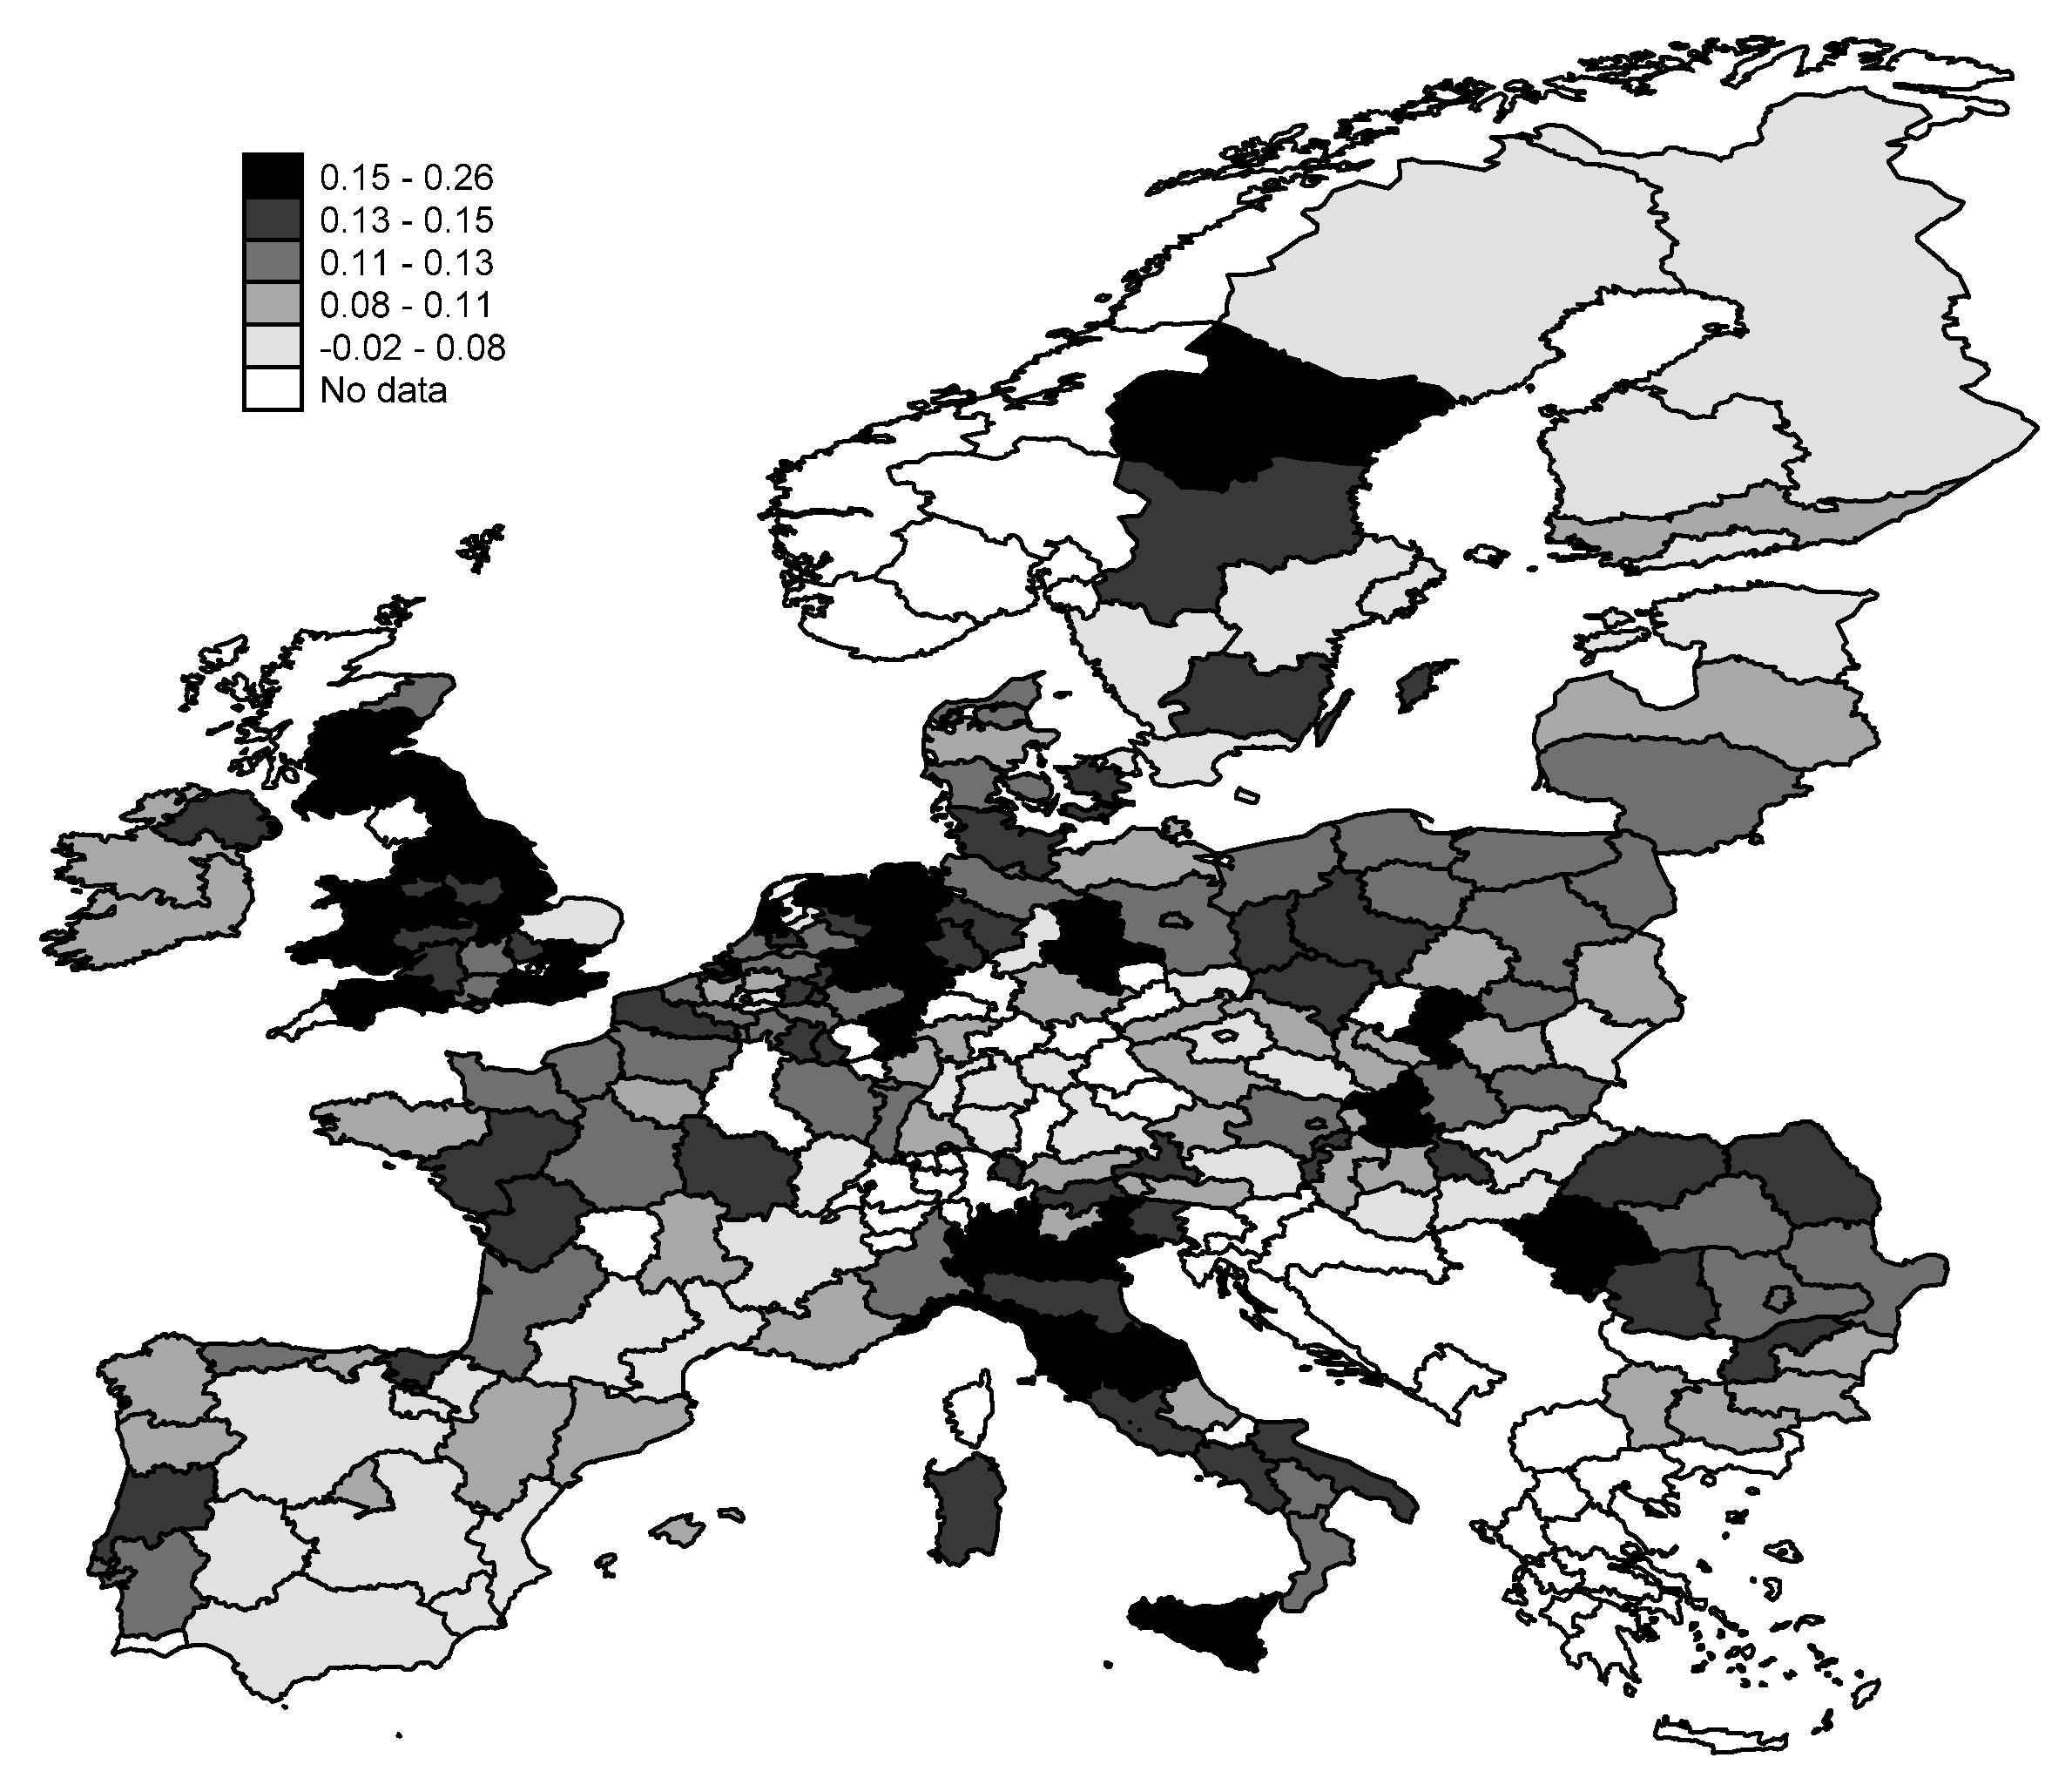
Application of the fixed-effect model means that significant specific factors influencing TFP for regions are not included in the model. They are present in individual effects term, which is presented in Figure 4.
The values of individual effects for NUTS2 indicate the regions with specific conditions which are favorable and unfavorable for productivity. The first group of regions with beneficial conditions for TFP, consists of the regions with high levels of TFP, e.g., the above-mentioned UK regions, Groningen, and Düsseldorf. In addition, it is worth paying attention to the high position of Italian regions. On the other hand, the bottom of this classification does not coincide with the low TFP level regions. Among regions with unprofitable conditions for TFP are many Spanish, German, and Swedish regions. This means that even negative territorial preconditions of TFP can be overcome by expenditures on human resources and R&D. Thus, regions may be characterized by specific territorial patterns of innovation [56]. Nevertheless, some regions (e.g., Polish regions) have an unexploited potential to increase their TFP levels. A promising approach that aims to boost the regional productivity growth is smart specialisation [57]. For example, Kijek and Bolibok [58] show that specialisation in high-tech manufacturing and high-tech knowledge-intensive services positively affects regional TFP.
5. Conclusions
Although the empirical literature on TFP drivers at the regional level is large [3,59,60,61], the results of research are inconclusive and controversial. From the theoretical perspective, this paper tries to show that studying TFP determinants by looking at the linear effects of human capital and R&D is not particularly informative, because these relationships seem to have a nonlinear character. Besides providing a concise review of theoretical arguments for the nonlinearity in the link between human resources, R&D investments, and TFP, we enrich the existing literature by studying empirically the nonlinear effects of two key drivers of TFP in the sample of European regions. This allows us to verify if there are increasing or decreasing returns to R&D and human capital, and more relevantly, whether these two kinds of intangibles are complementary or not. To the best of our knowledge, such analyses have not been presented in the literature on the drivers of regional TFP. We also include the spatial dimension to our analyses by checking whether TFP within a particular region affects TFP of the neighbouring regions. An additional novelty on the methodological ground lies in the application of the Färe–Primont index. Though this index is less known and consequently less applied than the Malmquist index, it has some required properties (i.e., determinateness and transitivity) that suggest its use in the analyses. Transitivity allows for the straightforward multilateral and multitemporal comparisons involving many objects and time periods. For example, the Hicks–Moorsteen index misses the transitivity requirement. On the other hand, the determinateness property of the Färe–Primont index means that the linear programs applied for the index calculation are always feasible. It is worth noting that this attribute is not valid for the Malmquist index.
Interestingly, we reveal that returns to research and development are decreasing and, after reaching the threshold, become negative. This result supports our first research hypothesis. As mentioned previously, the theoretical argumentation for the decrease of R&D productivity can be found in the second generation of R&D-based models [62,63]. These models assume diminishing returns to the stock of R&D knowledge due to the so-called fishing out effect. The presence of decreasing returns holds also true for human capital, which provides support for the second hypothesis. Our results reveal that inter-regional spillovers from TFP occur, i.e., TFP of proximate regions affects local aggregated productivity. What is important is that the indirect effects of R&D and human resources via TFP turn out nonlinear. As regards the third hypothesis concerning the relationship between human resources and R&D, the results prove that they are complementary determinants of TFP. This means that investments in human capital increase the incremental return to R&D and vice versa. Overall, these results have a few policy implications. Firstly, regional policies should focus on reducing human capital deficiencies that result in a decreasing effect of R&D investments. In fact, highly educated employees are crucial elements in knowledge creation and imitation processes. On the other hand, employees cannot fully use their knowledge and skills when the level of R&D investment is too low. So, regional development policy ought to be built on existing synergies between different types of knowledge and should be smartly tailored to the specific regional conditions which, as revealed by the results, may be favorable or unfavorable for productivity. Secondly, the low TFP regions should be closely linked to the high-productivity European regions, since the findings clearly show the existence of TFP spillovers. The exchange of codified knowledge and human capital can be realized by both traditional channels (e.g., physical infrastructure) and digital channels.
In this research, we concentrate on two key drivers of regional productivity, i.e., human capital and R&D. It seems to be worthwhile to go beyond our analyses at least in three directions. The first one includes investigating the potential impact of non-R&D innovation investments on TFP, since innovations may be introduced through activities which do not need R&D (e.g., the acquisition of external knowledge embodied in advanced machines and equipment or the acquisition of disembodied knowledge in the form of patents). The second direction of future research is related to the use of other proxies for human capital. It would be interesting to measure human resources at the regional level by applying the aggregate human capital index. Such an index could combine measures of human resources in science and technology with indicators of nontechnical skills and educational attainment. Finally, we recommend exploring different kinds of proximities that affect knowledge spillovers. As suggested by Capello and Caragliu [64], empirical findings on nonlinearities in alternative proximity outcomes of knowledge flows have never been studied. We believe that performing studies on these issues would be extremely useful to shed new light on the TFP determinants in the European regional space.
Supplementary Materials
The following are available online at https://0-www-mdpi-com.brum.beds.ac.uk/2071-1050/12/5/1808/s1. Annex S1: Estimates of SAR model parameters and specification tests (TFP equation with matrix based on geographical and economic proximity).
Author Contributions
Conceptualization, A.K. and T.K.; methodology, A.K. and T.K.; software, A.K. and T.K.; validation, A.K. and T.K.; formal analysis, A.K. and T.K.; investigation, A.K. and T.K.; resources, A.K. and T.K.; data curation, A.K. and T.K.; writing—original draft preparation, A.K. and T.K.; writing—review and editing, A.K. and T.K.; visualization, A.K. and T.K.; supervision, A.K. and T.K.; project administration, A.K. and T.K.; funding acquisition, T.K. All authors have read and agreed to the published version of the manuscript.
Funding
This research was financed by National Science Centre, Poland on the basis of decision number 2017/27/B/HS4/00893.
Conflicts of Interest
The author declares no conflict of interest.
References
- Porter, M.E. The Economic Performance of Regions. Reg. Stud. 2003, 37, 549–578. [Google Scholar] [CrossRef]
- Vieira, E.; Neira, I.; Vázquez, E. Productivity and innovation economy: Comparative analysis of European NUTS II, 1995-2004. Reg. Stud. 2011, 45, 1269–1286. [Google Scholar] [CrossRef]
- Beugelsdijk, S.; Klasing, M.J.; Milionis, P. Regional economic development in Europe: the role of total factor productivity. Reg. Stud. 2018, 52, 461–476. [Google Scholar] [CrossRef]
- Bronzini, R.; Piselli, P. Determinants of long-run regional productivity with geographical spillovers: The role of R&D, human capital and public infrastructure. Reg. Sci. Urban Econ. 2009, 39, 187–199. [Google Scholar]
- Capello, R.; Lenzi, C. Knowledge, Innovation and Productivity Gains across European Regions. Reg. Stud. 2015, 49, 1788–1804. [Google Scholar] [CrossRef]
- Vogel, J. The two faces of R&D and human capital: Evidence from Western European regions. Pap. Reg. Sci. 2015, 94, 525–551. [Google Scholar]
- Kumar, A.; Kober, B. Urbanization, human capital, and cross–country productivity differences. Econ. Lett. 2012, 117, 14–17. [Google Scholar] [CrossRef]
- Danquah, M.; Moral-Benito, E.; Ouattara, B. TFP Growth and its Determinants: A Model Averaging Approach. Empir. Econ. 2014, 47, 227–251. [Google Scholar] [CrossRef]
- Ciołek, D.; Brodzicki, T. Spatial Dependence Structure of Total Factor Productivity in Polish Local Administrative Districts. Folia Oecon. Acta Ul 2017, 3, 73–92. [Google Scholar] [CrossRef]
- Männasoo, K.; Hein, H.; Ruubel, R. The contributions of human capital, R&D spending and convergence to total factor productivity growth. Reg. Stud. 2018, 52, 1598–1611. [Google Scholar]
- OECD. Oslo Manual, Guidelines for Collecting and Interpreting Innovation Data, 3rd ed.; OECD: Paris, France, 2005. [Google Scholar]
- Mohnen, P.; Hall, B.H. Innovation and Productivity: An Update. EABR 2013, 3, 47–65. [Google Scholar]
- Solow, R.M. A Contribution to the Theory of Economic Growth. Q. J. Econ. 1956, 70, 65–94. [Google Scholar] [CrossRef]
- Romer, P.M. Endogenous Technological Change. J. Polit. Econ. 1990, 98, 71–102. [Google Scholar] [CrossRef] [Green Version]
- Kuwahara, S. Multiplicity and stagnation under the Romer model with increasing returns of R&D. Econ. Model. 2019, 79, 86–97. [Google Scholar]
- Aghion, P.; Howitt, P. A Model of Growth Through Creative Destruction. Econometrica 1992, 60, 323–351. [Google Scholar] [CrossRef]
- Ha, J.; Howitt, P. Accounting for Trends in Productivity and R&D: A Schumpeterian Critique of Semi-Endogenous Growth Theory. J. Money Credit Bank 2007, 39, 733–774. [Google Scholar]
- Jones, C. R&D Based Models of Economic Growth. J. Polit. Econ. 1995, 103, 759–784. [Google Scholar]
- Dinopoulos, E.; Thompson, P. Schumpeterian Growth without Scale Effects. J. Econ. Growth 1998, 3, 313–335. [Google Scholar] [CrossRef]
- Peretto, P. Technological Change and Population Growth. J. Econ. Growth 1998, 3, 283–311. [Google Scholar] [CrossRef]
- Howitt, P. Steady Endogenous Growth with Population and R&D Inputs Growing. J. Polit. Econ. 1999, 107, 715–730. [Google Scholar]
- Nijkamp, P.; Poor, H.J.; Rouwendal, J. A non-linear dynamic model of spatial economic development and R&D policy. Ann. Reg. Sci. 1991, 25, 287–302. [Google Scholar]
- Audretsch, B.; Feldman, M.P. Knowledge Spillovers and the Geography of Innovation. In Handbook of Urban and Regional Economics. Cities and Geography; Henderson, J.V., Thisse, J.-F., Eds.; North Holland Publishing: Amsterdam, Holland, 2004; Volume 4, pp. 2713–2739. [Google Scholar]
- Paci, R.; Marrocu, E.; Usai, S. The complementary effects of proximity dimensions on knowledge spillovers. Spat. Econ. Anal. 2014, 9, 9–30. [Google Scholar] [CrossRef]
- Kijek, A.; Kijek, T. Knowledge Spillovers: An Evidence from The European Regions. J. Open Innov. 2019, 5, 68. [Google Scholar] [CrossRef] [Green Version]
- Griffith, R.; Redding, S.; Van Reenen, J. Mapping the Two Faces of R&D: Productivity Growth in a Panel of OECD Industries. Rev. Econ. Stat. 2004, 86, 883–895. [Google Scholar]
- Dietzenbacher, E.; Los, B. Externalities of R&D Expenditures. Econ. Syst. Res. 2002, 14, 407–425. [Google Scholar]
- Schultz, T.W. Capital Formation by Education. J. Polit. Econ. 1960, 68, 571–583. [Google Scholar] [CrossRef]
- Becker, G.S. Investment in Human Capital: A Theoretical Analysis. J. Polit. Econ. 1962, 70, 9–49. [Google Scholar] [CrossRef]
- Lucas, R. On the Mechanics of Economic Development. J. Monet. Econ. 1988, 22, 3–42. [Google Scholar] [CrossRef]
- Mankiw, N.G.; Romer, D.; Weil, D.N. A Contribution to the Empirics of Economic Growth. Q. J. Econ. 1992, 107, 407–437. [Google Scholar] [CrossRef]
- Stokey, N.L. Human Capital, Product Quality, and Growth. Q. J. Econ. 1991, 106, 587–616. [Google Scholar] [CrossRef] [Green Version]
- Coleman, J. Foundations of Social Theory; The Belknap Press of Harvard University Press: Cambridge, MA, USA, 1990. [Google Scholar]
- Grossman, G.M.; Helpman, E. Quality Ladders in the Theory of Growth. Rev. Econ. Stud. 1991, 58, 43–61. [Google Scholar] [CrossRef] [Green Version]
- Benhabib, J.; Spiegel, M.M. The Role of Human Capital in Economic Development: Evidence from Aggregate Cross-Country Data. J. Monet. Econ. 1994, 34, 143–173. [Google Scholar] [CrossRef]
- Savvides, A.; Stengos, T. Human Capital and Economic Growth; Stanford University Press: Stanford, CA, USA, 2008. [Google Scholar]
- Azariadis, C.; Drazen, A. Threshold Externalities in Economic Development. Q. J. Econ. 1990, 105, 501–526. [Google Scholar] [CrossRef]
- Becker, G.S.; Murphy, K.M.; Tamura, R. Human Capital, Fertility, and Economic Growth. J. Polit. Econ. 1990, 98, 12–37. [Google Scholar] [CrossRef] [Green Version]
- Redding, S. The Low-Skill, Low-Quality Trap: Strategic Complementarities between Human Capital and R&D. Econ. J. 1996, 106, 458–470. [Google Scholar]
- Batabyal, A.; Nijkamp, P. A multi-region model of economic growth with human capital and negative externalities in innovation. J. Evol. Econ. 2013, 23, 909–924. [Google Scholar] [CrossRef]
- Saxenian, A. From Brain Drain to Brain Circulation: Transnational Communities and Regional Upgrading in India and China. Stud. Comp. Int. Dev. 2005, 40, 35–61. [Google Scholar] [CrossRef]
- Ramos, R.; Suriñach, J.; Artís, M. Human capital spillovers, productivity and regional convergence in Spain. Pap. Reg. Sci. 2010, 89, 435–447. [Google Scholar] [CrossRef] [Green Version]
- Arbia, G. A Primer for Spatial Econometrics: With Applications in R; Palgrave Macmillan: New York, NY, USA, 2014. [Google Scholar]
- O’Donnell, C.J. DPIN 3.0. A program for Decomposing Productivity Index Numbers; University of Queensland: Australia, Queensland, 2011; Available online: https://economics.uq.edu.au/cepa/software (accessed on 19 January 2020).
- Briec, W.; Kerstens, K.; Prior, D.; Van de Woestyne, I. Testing general and special Färe-Primont indices: A proposal for public and private sector synthetic indices of European regional expenditures and tourism. Eur. J. Oper. Res. 2018, 271, 756–768. [Google Scholar] [CrossRef]
- Van Biesebroeck, J. Robustness of productivity estimates. J. Ind. Econ. 2007, 55, 529–569. [Google Scholar] [CrossRef] [Green Version]
- Dettori, B.; Marrocu, E.; Paci, R. Total Factor Productivity, Intangible Assets and Spatial Dependence in the European Regions. Reg. Stud. 2012, 46, 1401–1416. [Google Scholar] [CrossRef] [Green Version]
- Lee, L.; Yu, J. Estimation of spatial autoregressive panel data models with fixed effects. J. Econom. 2010, 154, 165–185. [Google Scholar] [CrossRef]
- Elhorst, J. Spatial Econometrics: From Cross-Sectional Data to Spatial Panels; Springer: Berlin/Heidelberg, Germany, 2014. [Google Scholar]
- Mundlak, Y. On the pooling of time series and cross section data. Econometrica 1978, 46, 69–85. [Google Scholar] [CrossRef]
- Wooldridge, J.M. Fixed-effects and related estimators for correlated random-coefficient and treatment-effect panel data models. Rev. Econ. Stat. 2005, 87, 385–390. [Google Scholar] [CrossRef]
- Hsiao, C. Panel Data Analysis-Advantages and Challenges 2013; Working Papers; Wang Yanan Institute for Studies in Economics (WISE), Xiamen University: Xiamen, China, 14 October 2013. [Google Scholar]
- Charlot, S.; Crescenzi, R.; Musolesi, A. An ‘Extended’ Knowledge Production Function Approach to the Genesis of Innovation in the European Regions. Working Papers 2012–06 (GAEL). Available online: http://www.grenoble.inra.fr/Docs/pub/A2012/gael2012–06.pdf (accessed on 1 January 2020).
- Capello, R.; Lenzi, C. Territorial patterns of innovation and economic growth in European regions. Growth Chang. 2013, 44, 195–227. [Google Scholar] [CrossRef]
- Sanso-Navarro, M.; Vera-Cabello, M. Regional Growth, Innovation, and Latent Nonlinear Effects. J. Reg. Sci. 2016, 56, 814–847. [Google Scholar] [CrossRef]
- Capello, R. Territorial patterns of innovation. In Territorial Patterns of Innovation. An Inquiry on the Knowledge Economy in European Regions; Capello, R., Lenzi, C., Eds.; Routledge: Oxford, UK, 2013; pp. 129–150. [Google Scholar]
- McCann, P.; Ortega-Argilés, R. Smart Specialization, Regional Growth and Applications to European Union Cohesion Policy. Reg. Stud. 2015, 49, 1291–1302. [Google Scholar] [CrossRef]
- Kijek, T.; Matras-Bolibok, A. Knowledge-intensive specialisation and Total Factor Productivity (TFP) in the EU regional scope. Acta Univ. Agric. Silvic. Mendel. Brun. 2020, 68, 181–188. [Google Scholar] [CrossRef] [Green Version]
- Otsuka, A. Regional determinants of total factor productivity in Japan: stochastic frontier analysis. Ann. Reg. Sci. 2017, 58, 579–596. [Google Scholar] [CrossRef]
- Danska-Borsiak, B. Determinants of total factor productivity in Visegrad Group Nuts-2 regions. Acta Oecon. 2018, 68, 31–50. [Google Scholar] [CrossRef]
- Kim, Y.; Loayza, N. Productivity Growth: Patterns and Determinants Across the World; World Bank Group: Washington, DC, USA, 2019; no. WPS 8852. [Google Scholar]
- Kortum, S. Research, Patenting, and Technological Change. Econometrica 1997, 65, 1389–1419. [Google Scholar] [CrossRef]
- Segerstrom, P.S. Endogenous Growth without Scale Effects. Am. Econ. Rev. 1998, 88, 1290–1310. [Google Scholar]
- Capello, R.; Caragliu, A. Proximities and the Intensity of Scientific Relations: Synergies and Nonlinearities. Int. Reg. Sci. Rev. 2018, 44, 7–44. [Google Scholar] [CrossRef] [Green Version]
Figure 1.
Average Total Factor Productivity (TFP) level in 2009-2014 in NUTS2 EU regions.

Figure 2.
Conditional marginal direct and indirect effects of HR and RD variables.

Figure 3.
Conditional marginal direct effects of RD and HR variables at low, medium, and high levels of the moderator(s).
Figure 3.
Conditional marginal direct effects of RD and HR variables at low, medium, and high levels of the moderator(s).

Figure 4.
Individual effects term for NUTS2 EU regions in the spatial panel model with fixed effects.
Figure 4.
Individual effects term for NUTS2 EU regions in the spatial panel model with fixed effects.


Table 1.
Characteristics of variables
| Abbreviation | Description | Measurement |
|---|---|---|
| Dependent variable | ||
| TFP | Total factor productivity | Färe–Primont total factor productivity index |
| Independent variables | ||
| RD | Total intramural R&D expenditure in all sectors | Expenditure on R&D as % of Gross Fixed Capital Formation |
| HR | Human resources in science and technology | Scientists and engineers as a share of the active population in the age group 15–74 |
| Control variable | ||
| UNR | Unemployment rate | Unemployed persons as % of the economically active population in the age group 15–74 |
| ADL | Adult Participation in Learning | % of population aged 25–64 who participate in lifelong learning |
| TED | Tertiary Educational Attainment | % of population aged 30–34 who have successfully completed university or university-like (tertiary-level) |
| DENS | Population density | Average population per square kilometre |
Table 2.
Descriptive statistics and correlation coefficients between variables.
| Variable | Mean | Std. Dev. | Median | Min | Max | TFP | RD | HR |
|---|---|---|---|---|---|---|---|---|
| TFP | 0.229 | 0.051 | 0.223 | 0.094 | 0.506 | |||
| RD | 8.19 | 6.21 | 6.76 | 0.264 | 48.4 | 0.3627 | ||
| HR | 5.95 | 2.35 | 5.5 | 1.6 | 13.5 | 0.2418 | 0.5275 | |
| UNR | 7.7 | 4.5 | 6.6 | 1.8 | 33.4 | −0.1208 | −0.2871 | −0.3165 |
Table 3.
Estimates of model parameters and specification tests (TFP equation with matrix based on geographical and economic proximity).
Table 3.
Estimates of model parameters and specification tests (TFP equation with matrix based on geographical and economic proximity).
| Variable\Model | GNSr | GNSf | SDMf | SLXf | SARf |
|---|---|---|---|---|---|
| TFP | |||||
| RD | 0.0063 *** | 0.0082 *** | 0.0084 *** | 0.0084 *** | 0.0084 *** |
| RD2 | –0.0001 *** | –0.0002 *** | –0.0002 *** | –0.0002 *** | –0.0002 *** |
| HR | 0.0055 *** | 0.0057 *** | 0.0057 *** | 0.0058 *** | 0.0049 *** |
| HR2 | –0.0006 *** | –0.0007 *** | –0.0007 *** | –0.0007 *** | –0.0007 *** |
| RD HR | 0.0003 *** | 0.0004 *** | 0.0004 *** | 0.0004 *** | 0.0004 *** |
| UNR | 0.0030 *** | 0.0040 *** | 0.0042 *** | 0.0044 *** | 0.0042 *** |
| const | 0.0836 *** | ||||
| W | |||||
| RD | –0.0002 | –0.0002 | –0.0001 | 0.0001 | |
| HR | –0.0003 | –0.0010 | –0.0010 * | –0.0009 | |
| TFP | 0.2894 *** | 0.1096 | 0.0565 ** | 0.0546 ** | |
| e.TFP | –0.2311 *** | –0.0575 | |||
| sigma_u | 0.0407 *** | ||||
| sigma_e | 0.0159 *** | 0.0163 *** | 0.0164 *** | 0.0164 *** | 0.0164 *** |
| Pseudo R2 | 0.136 | 0.129 | 0.130 | 0.127 | 0.133 |
| Wald test of spatial terms | 75.34 | 8.50 | 7.85 | 2.77 | 4.95 |
| (p-value) | (0.000) | (0.075) | (0.049) | (0.251) | (0.026) |
| I-Moran test | 268.91 | 5.65 | 4.86 | 3.75 | 4.32 |
| (p-value) | (0.000) | (0.017) | (0.028) | (0.053) | (0.038) |
| Specification tests (model/model) | GNSr/GNSf | GNSf/SDMf | SDMf/SLXf | SDMf/SARf | |
| Hausman test | 66.92 | ||||
| (p-value) | (0.000) | ||||
| Likelihood ratio test | 0.63 | 5.04 | 2.87 | ||
| (p-value) | (0.428) | (0.025) | (0.238) |
* p < 0.1, ** p < 0.05, *** p < 0.01.
© 2020 by the authors. Licensee MDPI, Basel, Switzerland. This article is an open access article distributed under the terms and conditions of the Creative Commons Attribution (CC BY) license (http://creativecommons.org/licenses/by/4.0/).
Share and Cite
MDPI and ACS Style
Kijek, A.; Kijek, T. Nonlinear Effects of Human Capital and R&D on TFP: Evidence from European Regions. Sustainability 2020, 12, 1808. https://0-doi-org.brum.beds.ac.uk/10.3390/su12051808
AMA Style
Kijek A, Kijek T. Nonlinear Effects of Human Capital and R&D on TFP: Evidence from European Regions. Sustainability. 2020; 12(5):1808. https://0-doi-org.brum.beds.ac.uk/10.3390/su12051808
Chicago/Turabian StyleKijek, Arkadiusz, and Tomasz Kijek. 2020. "Nonlinear Effects of Human Capital and R&D on TFP: Evidence from European Regions" Sustainability 12, no. 5: 1808. https://0-doi-org.brum.beds.ac.uk/10.3390/su12051808
Note that from the first issue of 2016, this journal uses article numbers instead of page numbers. See further details here.