Social Exclusion and Convergence in the EU: An Assessment of the Europe 2020 Strategy


1
Department of Finance and Accounting and IEI, University Jaume I, Avda Sos Baynat s.n, Castellón de la Plana 12070, Spain
2
Department of Finance and Accounting, University Jaume I, Avda Sos Baynat s.n, Castellón de la Plana 12070, Spain
3
Department of Economics and IEI, Universitat Jaume I, Avda Sos Baynat s.n, Castellón de la Plana 12070, Spain
*
Author to whom correspondence should be addressed.
Sustainability 2020, 12(5), 1843; https://0-doi-org.brum.beds.ac.uk/10.3390/su12051843
Submission received: 13 January 2020
/
Revised: 17 February 2020
/
Accepted: 25 February 2020
/
Published: 29 February 2020
(This article belongs to the Special Issue Public Policies for Sustainability and Sustainable Public Policies)
Abstract
:Economic convergence has long been a declared objective of the EU and considered the fundamental mechanism for achieving socioeconomic cohesion. The recent economic crisis had an uneven impact across EU countries and brought a halt to the process of economic and social convergence. In response to this situation, the Europe 2020 strategy, launched in 2010, aimed to deliver social and territorial cohesion in the Member States. In this paper we evaluate the poverty and social exclusion pillar of the Europe 2020 strategy by analysing whether it has promoted convergence across the EU countries in the indicators devised to capture risk of poverty, severe material deprivation, and the number of persons living in households with very low work intensity. Our results for all three rates indicate that convergence occurs in heterogeneous clubs that do not follow a geographic east‒west or south‒north pattern. Convergence within each club, especially for the severe deprivation rate, takes place by means of a catching-up process, with Eastern European levels converging on the Western levels. Finally, not only is there club convergence, but there is no tendency for the clubs to convergence. Poverty and social cohesion indicators show a multi-speed Europe, casting doubt on the sustainability of the overall convergence process in the EU.
1. Introduction
Economic convergence is a real, long-term phenomenon directly related to growth processes, occurring when lower-income economies grow faster than higher-income economies so that the former catch up with the latter [1]. Convergence is achieved if the catching-up process persists over time. Furthermore, in an integrated area, such as the EU and most importantly the euro area, the sustainability of convergence over time is necessary to ensure the smooth functioning of the area. As was made clear during the euro area crisis, unsustainable convergence eventually results in financial instability and sovereign debt levels rising beyond market limits [2]. The sustainability of the convergence process appears as an essential element for the full materialisation of the benefits attained through being a member of an integrated economic area.
Recognising the importance of promoting convergence, the EU promptly developed policies aimed at enhancing economic convergence. The Structural Funds were established in 1975, and in 1993 the Cohesion Funds were implemented. However, despite these efforts, the empirical literature still finds a lack of real convergence between the European Union (EU hereafter) and the European Monetary Union (EMU hereafter) countries. Monfort et al. [3] conclude that for the EU-14 member states, northwestern, southern and central‒eastern European countries have converged to different equilibrium levels in income per capita. This club convergence is a possible form of conditional convergence, whereby economies belonging to a group of countries share similar features. Similarly, Alcidi et al. [4] claim that income convergence in real GDP per capita in the EU is a tale in two parts, with large internally divergent patterns that translate into the emergence of geographical clusters. Evidence of club convergence may indicate divergence in a group of countries and cast doubt on the sustainability of the integrated area. Ordóñez et al. [5] conclude that, after years of ever-closer economic integration, EMU countries have also converged to different steady states in competitiveness, measured as real unit labour costs, and in capital accumulation and total factor productivity. According to these authors, the fact that EMU countries have converged to different long-run equilibrium levels in terms of the growth drivers (capital accumulation and total factor productivity) points to the fact that the imbalances at the root of the euro crisis are related to the specificities of the growth model in the periphery and core European countries. Their results allow them to conclude that ‘EMU has not been the cause of the external imbalances and the resulting sovereign-debt crisis (…). Rather, it has boosted some structural divergencies that were already present in the growth model of these economies’ [5]. Similarly, Díaz del Hoyo et al. [2] also find that total factor productivity is the key driver of convergence and that the differences in productivity between southern European countries and the higher-income countries existed long before the introduction of the euro. According to Monfort et al. [6], a lack of real economic convergence can also be observed in income inequality and unemployment.
In the EU context, convergence goes beyond the economic sphere. Convergence has been always an explicit objective of the EU, as formulated in Article 130a of the Single European Act in 1986, and has been considered a fundamental mechanism to achieve socioeconomic cohesion [4]. While promoting economic growth (and productivity) has always been an EU policy target, much emphasis is now being placed on the social dimension of the EU. The economic crisis had an uneven impact across the EU countries, making it necessary to strengthen socioeconomic growth and convergence in order to preserve and consolidate the integration process and to prevent public disaffection with the EU project. It is widely accepted that ‘social and economic convergence go hand in hand’ [7] and both dimensions of convergence are important to guarantee the sustainability of the EU as an integrated area. The need to support social convergence alongside economic convergence is currently at the top of the EU political agenda.
As a consequence, in March 2010, the European Commission launched the Europe 2020 strategy ‘for smart, sustainable and inclusive growth’ [7] in the EU to prepare the integrated area for the challenges of the next decade. The strategy aims to foster a high-employment economy and to promote productivity and a more competitive economy based on knowledge and innovation. The ultimate goal is to deliver social and territorial cohesion in the Member States while reducing the impact on the natural environment through a more resource-efficient and greener economy. These objectives are defined in terms of eight targets in the areas of employment, research and development, climate change and energy, education and poverty reduction. A set of nine headline indicators and additional subindicators enable the monitoring of progress towards the overall targets and an assessment of how far the EU still has to go to reach them.
This paper aims to assess the poverty and social exclusion pillar of the Europe 2020 strategy by analysing convergence in the poverty and social exclusion indicators of this strategy [8], that is, in the components of the AROPE indicator. The poverty reduction target aims to reduce the number of people at risk of poverty or social exclusion by 20 million by 2020, compared with the 2008 level. At risk of poverty or social exclusion is defined in the Europe 2020 strategy as the sum of persons who are either at risk of poverty, or severely materially deprived or living in a household with a very low work intensity. These three dimensions of poverty constitute the headline indicators for the social exclusion pillar of the Europe 2020 strategy. Eurostat (2019) [9] presents the progress of the EU and its Member States towards the targets of the Europe 2020 strategy. According to this report, the target on poverty alleviation is still far from being achieved. In 2018, the reduction in people at risk of poverty and social exclusion for the EU-28 was 7.156 million persons: a long way off the objective of 20 million.
To the best of our knowledge, this paper constitutes the first attempt to assess the Europe 2020 strategy on poverty and social exclusion targets in terms of sustainable convergence. The existence of convergence clubs would reveal asymmetries in the socioeconomic performance of Member States, pointing towards the idea of a multi-speed Europe and casting doubt on the sustainability of the social cohesion in the EU. We evaluate the existence of clubs in poverty and social exclusion indicators by applying the methodology proposed by Phillips and Sul [10,11] which enables us to distinguish different paths of convergence among the various heterogeneous economies involved in a convergence process. This heterogeneity is modelled through a nonlinear time-varying factor model, which provides flexibility in studying idiosyncratic behaviours over time and in cross section. Our empirical findings reveal the existence of convergence clubs, thus calling into question the sustainability of social cohesion in the EU.
The remainder of the paper is organised as follows. The next section presents a discussion on the relevant theoretical literature as well as the channels through which economic integration can cause real divergence. Section 3 presents the methodology used, while Section 4 describes the data under analysis. Section 5 reports our empirical findings and finally, Section 6 summarises and provides concluding remarks.
2. Economic Integration and Convergence
The theoretical basis for the existence of convergence can be found in the neoclassical growth models originally set out by Solow [12] and Swan [13], which predict conditional income convergence. In this theoretical framework, convergence occurs when the growth rate of an economy is positively related to the difference between the economy’s initial level of income and its own steady state. Bénabou [14] points out that the neoclassical growth model predicts convergence in income per capita not just in the first moment, the mean, but also in higher moments, such as the variance. According to this author, “Once augmented with idiosyncratic shocks, most versions of the neoclassical growth model imply convergence in distribution: countries with the same fundamentals should tend towards the same invariant distribution of wealth and pretax income” [14]. This means that the neoclassical growth models predict convergence not only in income per capita but also in income inequality.
Convergence in income level and income distribution are closely related. Quah [15] explores the link between convergence in income per capita and income distribution, concluding that economic convergence is not just about the aggregate level of income, but also about how this income is distributed across countries. According to this author, what matters for convergence is the relative performance of poor and rich economies or, in other words, how economic progress occurs differently in poorer economies than in richer ones. The traditional question about convergence between rich and poor countries’ needs, therefore, to be respecified in terms of convergence between poorer and richer economies, and between high- and low-inequality economies. The prediction of income and income distribution convergence and the link between both mechanisms, as stressed by Quah [15], constitutes the theoretical basis for the convergence in social exclusion and poverty indicators.
There is abundant literature on testing for convergence in the EU, both at national [3,5,6] and at regional level [16,17,18,19]. Unsurprisingly, most of the literature rejects overall convergence in favour of cluster convergence. Monfort et al. [6] provide an insightful explanation of the reasons why economic integration in the EU has not translated to overall real economic convergence. As pointed out by these authors, in a neoclassical world with rational agents, perfect information, perfect competition, and full mobility of production factors, economic integration should lead to economic convergence. Although the European integration process has continuously attempted to make progress in these dimensions by enhancing transparency, competition, and factor mobility, there are three potential channels for divergence. First, the existence of real economic divergence is related to the impact of economic integration in terms of macroeconomic governance. According to Croci and Farina [20], the macroeconomic governance of the EU, and in particular the Eurozone, far from promoting real convergence, has magnified and mutually reinforced imbalances, exacerbating real divergences through endogenous asymmetric shocks [21]. Also, the lack of reform in national markets, the differing speeds, and the varying scope of such reforms could explain the existence of divergences between Eurozone countries. Second, divergence can also be the result of new mechanisms that arise from the interaction of markets at a microeconomic level. Greater integration may lead to activity specialization and economic agglomeration [22] and, in turn, differential growth across countries, affecting income distribution and intensifying inequalities between countries. Furthermore, greater specialization can also increase vulnerability to asymmetric shocks [23]. Third, and closely related to the indicators on social exclusion and poverty we analysed in this paper, divergence can also be explained by changes in the public redistributive capacity. Economic integration can set in motion new sources of inequalities that will require the implementation of new redistribution policies not included in the traditional welfare state, in order to offset the negative effects of market deregulation and greater factor mobility and competitiveness. Also, broader markets improve efficiency because they provide individuals with a wider range of choices; at the same time make it more difficult to implement redistribution policies [24].
3. Methodology
The time series approach to convergence analysis can be found in the seminal papers by Carlino and Mills [25] and Bernard and Durlauf [26,27]. These authors developed the concept of stochastic convergence, based on the stationarity properties of the variables under analysis. Thus, two nonstationary variables converge if there is a cointegrating relationship between them. In other words, two nonstationary series converge if they share the same stochastic trend.
This definition of convergence can be empirically tested by means of time series econometric techniques. However, as pointed out by Phillips and Sul [11], traditional convergence tests are inadequate when technology is heterogeneous across countries and the speed of convergence is time-varying. To account for temporal and transitional heterogeneity, Phillips and Sul [10,11] introduced cross-sectional and time series heterogeneity in the parameters of a neoclassical growth model. The starting point for the test is the following time-varying representation:
where Xit is the dependent variable observed across i = 1,2,…,N individuals over the period t = 1,2,…,T. . is an idiosyncratic time-varying factor loading capturing convergence to a common factor , which represents the common stochastic trend in the panel. In other words, . measures the share of the common factor each individual in the panel experiences. The simple econometric representation in (1) can be used to analyse convergence by testing whether the factor loadings . converge. The idiosyncratic element is defined as:
where . is fixed, , and . is i.i.d (0,1) across i, but weakly dependent on t (these conditions imply that the stochastic component declines asymptotically so that the trend vanishes and each coefficient converges to δit). and L(t) is a slowly varying function for which L(t) tends to infinity as t also goes to infinity).
The null hypothesis of convergence can be written as . against the alternative of no convergence . The alternative hypothesis includes divergence but can also include the possibility of club convergence. For example, if there are two convergent clubs, the alternative is:
where G stands for a specific club.
Phillips and Sul (2007) show that these hypotheses can be statistically tested by means of the following ‘log (t)’ regression model:
for t = [rT], [rT] + 1,…, T with some r > 0, L(t) = log (t + 1), and H1/Ht is the cross-sectional variance ratio defined as and
which measures the loading coefficient δit in relation to the panel. The variable . is called the relative transition path and traces out an individual trajectory for each i relative to the panel average. The regression is run starting at t = [rT], which is the integer part of rT for some fraction r > 0. Phillips and Sul [10] recommend using r = 0.3. Rejection of the null implies that there is no overall convergence, but there may be cluster convergence. The convergence patterns within groups (that is, the existence of club convergence and clustering) can be examined using log (t) regressions. The so-called ‘core group’, , is chosen by maximising . over k individuals according to the criterion: , subject to .
The convergence approach proposed by Phillips and Sul [10] presents a number of clear advantages. First, it is a test for relative convergence, as it measures convergence to some cross-sectional average, in contrast to the concept of level convergence analysed by Bernard and Durlauf [27]. Second, this approach outperforms the standard panel unit root tests, since in the latter case may retain nonstationary characteristics even though the convergence condition holds. In other words, panel unit root tests may classify the difference between gradually converging series as nonstationary. As a further problem, a mixture of stationary and nonstationary series in the panel may bias the results of unit root tests. Finally, sometimes these test results are not particularly robust. This is in contrast to the Phillips and Sul [10] test, which does not depend on any particular assumption concerning the trend stationarity or stochastic nonstationarity of the variables to be tested.
4. Data
The Europe 2020 strategy indicators for the at-risk-of-poverty rate, the severe material deprivation rate and the number of persons living in a household with a very low work intensity as a percentage of total population have been taken from the Eurostat database, Europe 2020 indicators on EU policy tables. According to Eurostat, the at-risk-of-poverty rate is defined as the share of people with an equivalised disposable income (after social transfer) below the at-risk-of-poverty threshold, which is set at 60% of the national median equivalised disposable income after social transfers. The indicator persons living in households with very low work intensity is defined as the number of persons living in a household where the members of working age worked less than 20% of their total potential during the previous 12 months. Material deprivation refers to a state of economic strain and to certain durables. It is defined as the enforced inability (rather than the choice not to do so) to pay unexpected expenses, afford a one-week annual holiday away from home, have a meal involving meat, chicken or fish every second day, adequately heat a dwelling, pay for durable goods such as a washing machine, colour television, telephone or car, as well as facing payment arrears (mortgage or rent, utility bills, hire purchase instalments or other loan payments).
The sample covers the years 2005 to 2018 and contains Austria, Belgium, Bulgaria, Cyprus, Czechia, Denmark, Estonia, Finland, France, Germany, Greece, Hungary, Ireland, Italy, Latvia, Lithuania, Luxembourg, Malta, the Netherlands, Poland, Portugal, Slovenia, Slovakia, Spain, Sweden, and the United Kingdom.
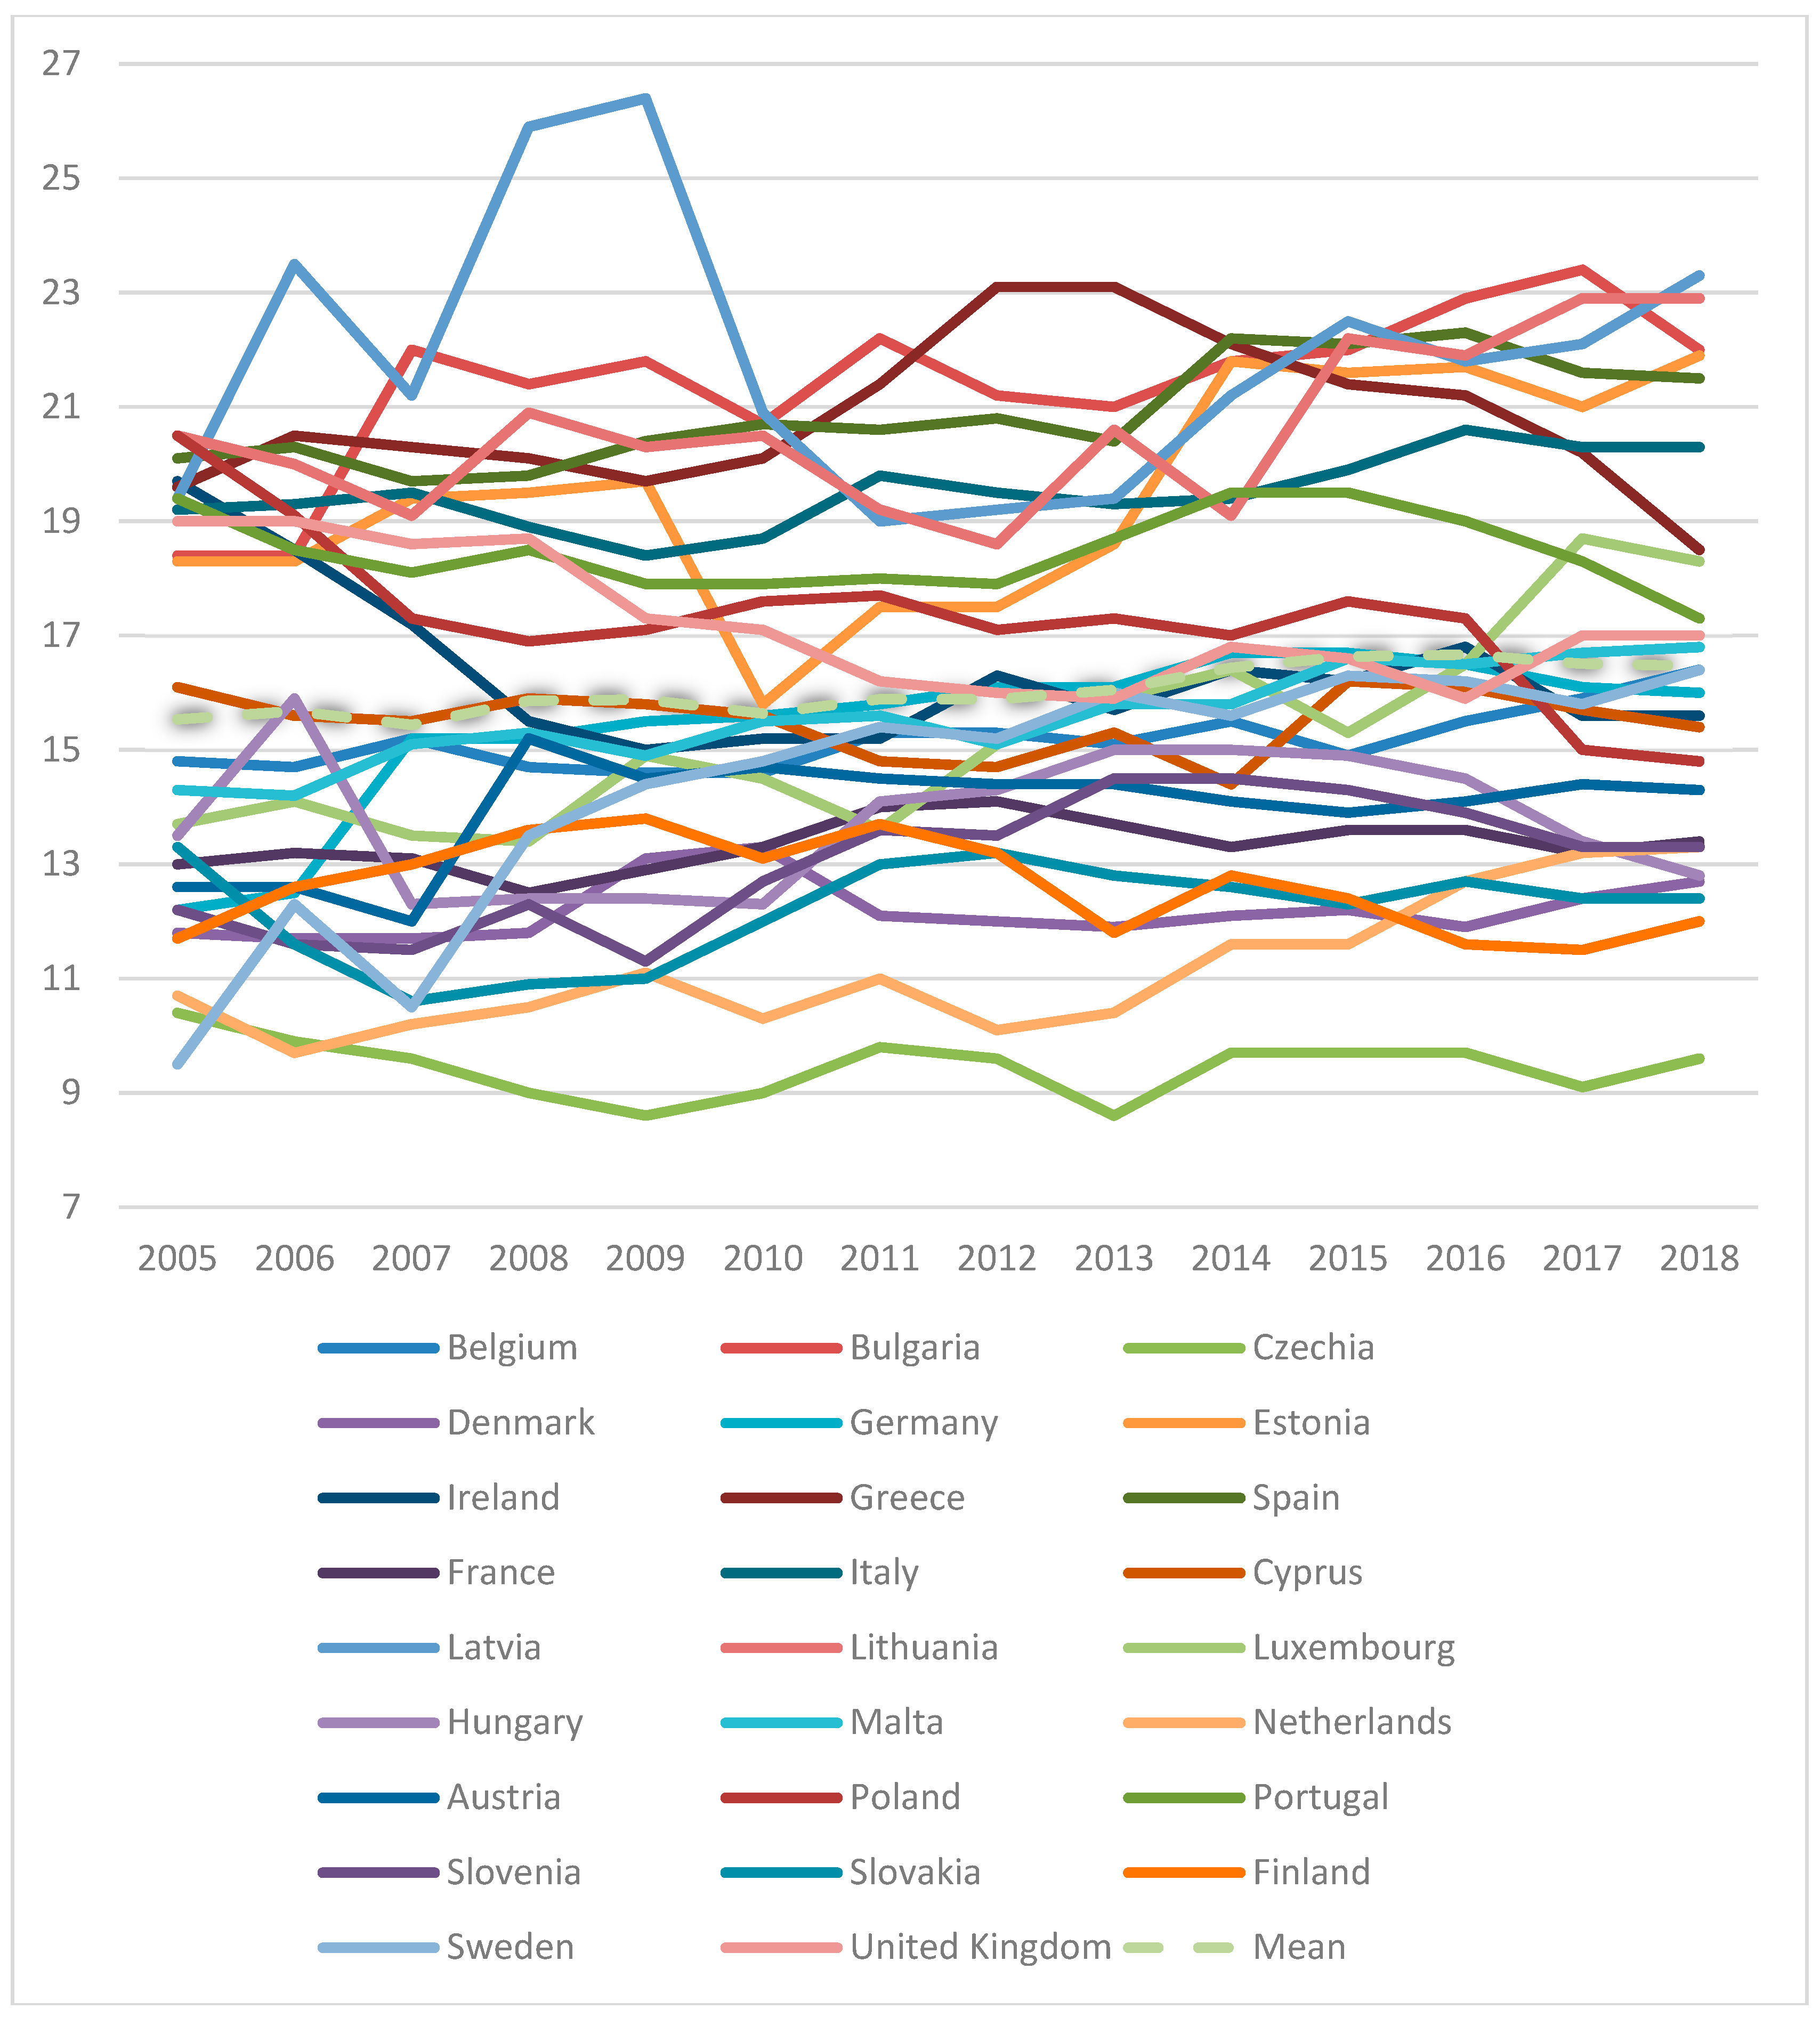
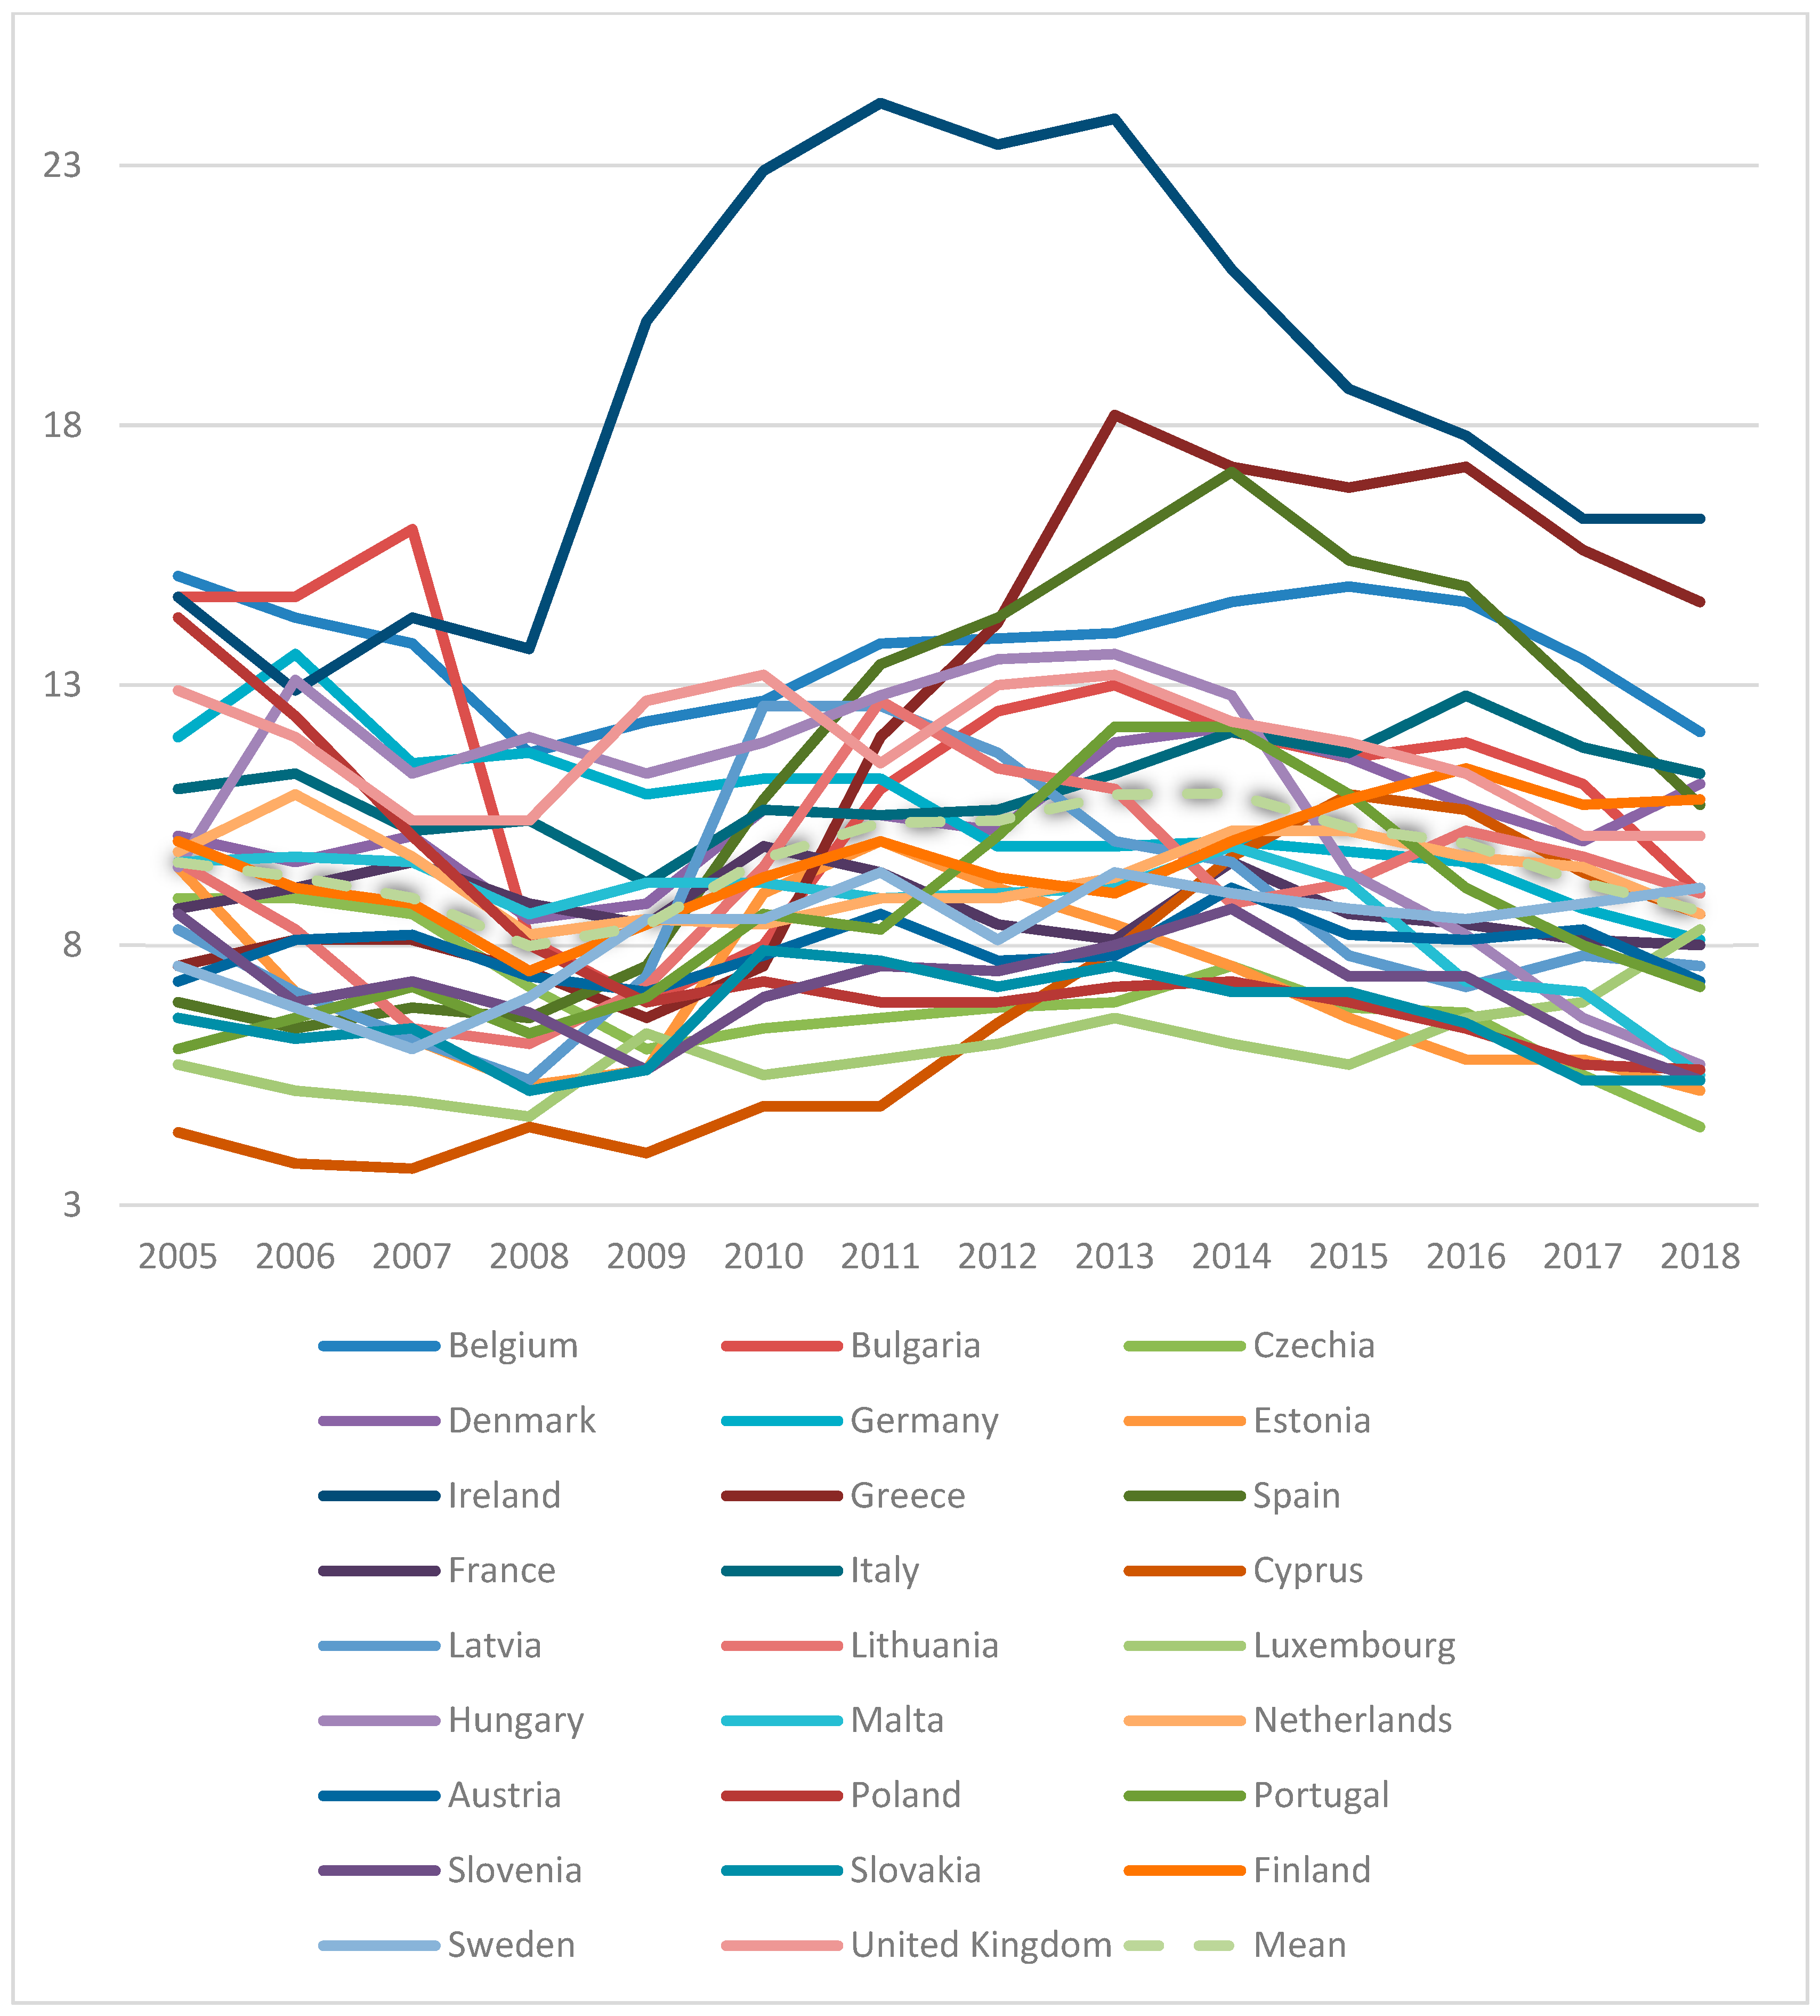
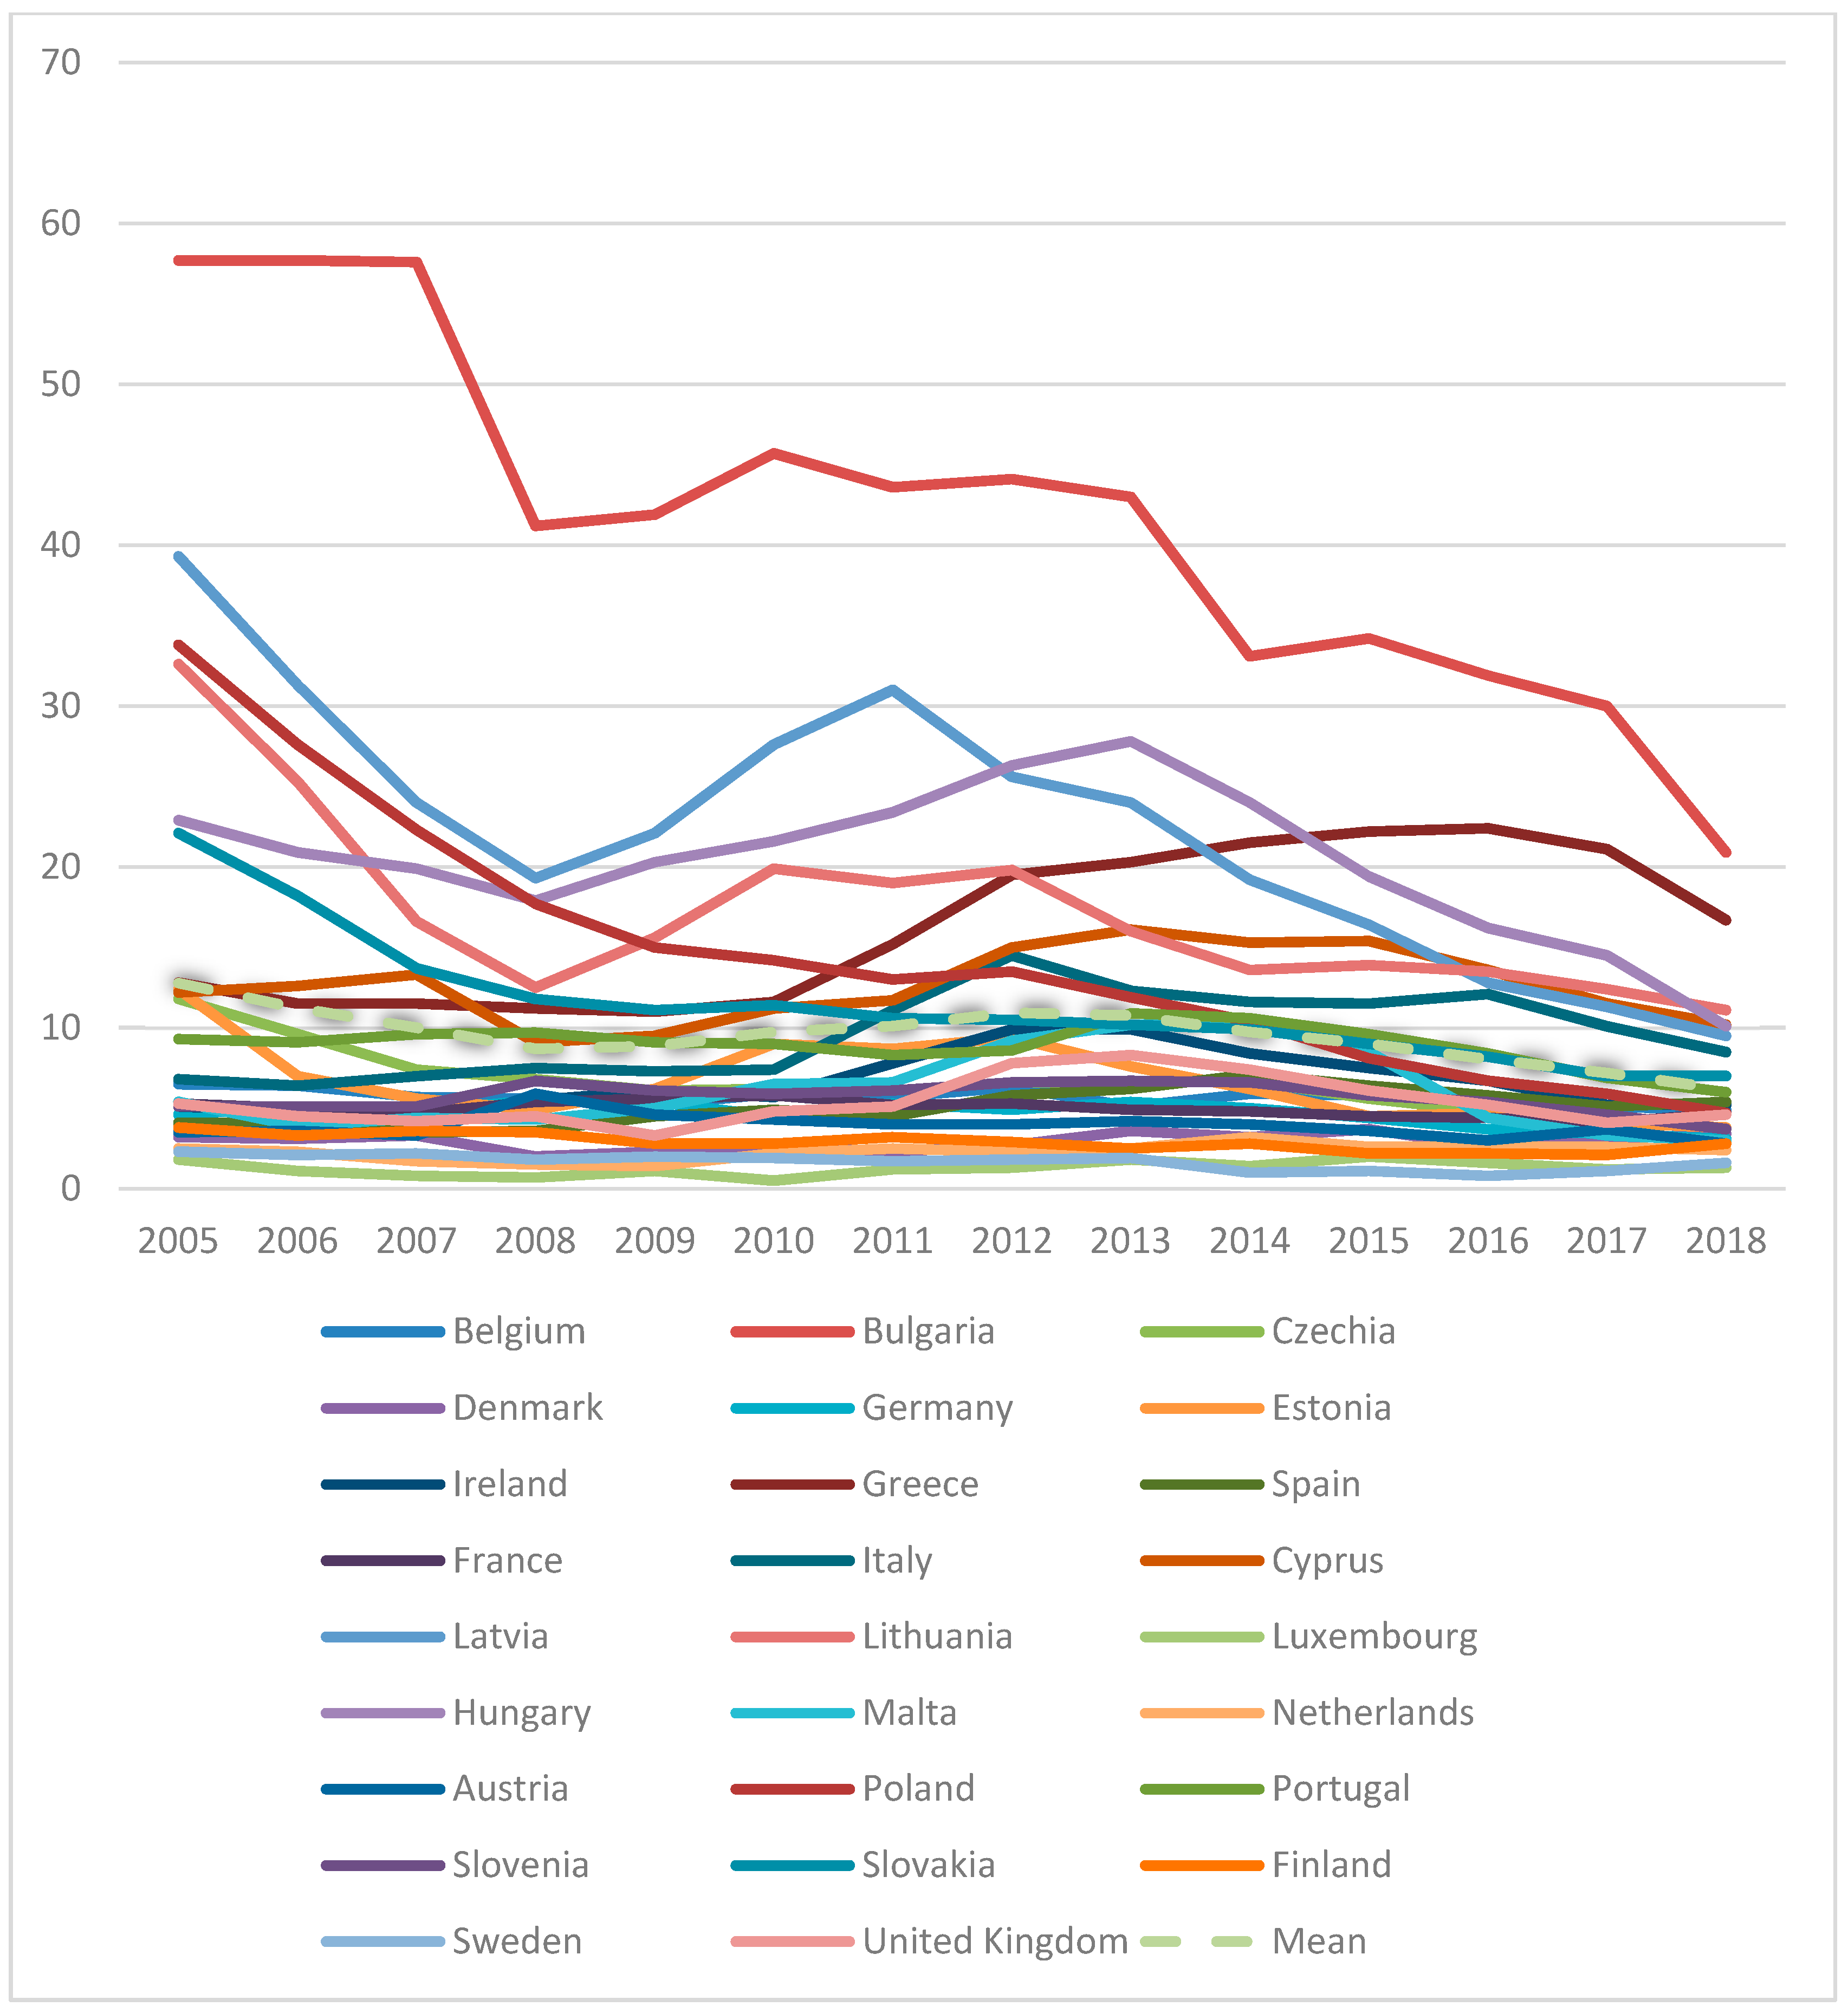
Figure A1, Figure A2 and Figure A3 in the Appendix A plot the data. With the exception of the severe material deprivation rate, there is no evidence of a reduction in the dispersion across countries when comparing the beginning and the end of the sample, indicating the absence of overall convergence. However, this does not preclude the existence of club convergence. As can be seen in Figure A1, a group of eastern (Bulgaria, Estonia, Latvia, and Lithuania) and southern (Greece, Italy, Portugal, and Spain) EU countries present values for the at-risk-of-poverty rate that are above the mean for the whole sample. Likewise, a group of eastern (Czechia, Slovenia, and Slovakia) and northwestern (Austria, Belgium, Denmark, France, Finland, and the Netherlands) EU countries present a lower at-risk-of-poverty rate than the mean. Regarding the number of persons living in households with very low work intensity—Figure A2—Ireland, Greece, Spain, Belgium, Bulgaria, the United Kingdom, and Italy present the highest rates, whereas eastern countries such as Estonia, Czechia, Poland, Slovenia, and Slovakia have a rate below the panel average throughout the sample, as is also the case with Austria, Luxembourg and Sweden. Figure A3 plots the data for the severe material deprivation rate: the worst performers are Bulgaria, Cyprus, Greece, Hungary, Italy, Latvia, and Lithuania. As can be seen, there is no clear distinctive pattern in terms of the poverty and social exclusion indicators between western and eastern countries; for each of the indicators, eastern countries can be found in both the best and the worst performers groups. In contrast, it seems that there is a north‒south divide; Bulgaria, Greece, Italy and Spain appear at least twice on the list of worst performers.
Table A1, Table A2 and Table A3 in the Appendix A present the descriptive statistics for all three indicators. For all three indicators, both the mean and the end values of show a marked disparity between countries. The highest mean values in the at-risk-of-poverty rate indicator are concentrated in eastern and southern European countries, while the lowest are in central and northern European countries. However, the minimum value for the entire sample of countries is reported for Czechia, with 8.6%, while Latvia registers the maximum value, with 26.4%. Regarding the number of persons living in households with very low work intensity, Ireland registers a noteworthy mean value of 18.56%, almost triple that of the lowest mean value of 6.03% reported for Luxembourg. On the other hand, there does not seem to be a clear geographical pattern in terms of the distribution of the values of this indicator; the highest and lowest mean values are found in both eastern and western countries, and in both the north and the south. Lastly, the severe material deprivation rate indicator presents the greatest variability of all the indicators. The highest mean value is 41.61% for Bulgaria, while the lowest is for Luxembourg with 1.27%. Bulgaria also presents the highest value of all those registered, with 57.7%, whereas Luxembourg records the lowest, with 0.5%. Analysis of the descriptive statistics for the three indicators indicates that there is no clear geographical pattern in countries’ performance in poverty and social exclusion indicators. The possible convergence clubs can thus be expected to be fairly heterogeneous, and do not reveal an east‒west or north‒south pattern.
5. Empirical Results
The club convergence test developed by Phillips and Sul [10,11] is applied to the three indicators for poverty and social exclusion. These authors have proven that eliminating the cyclical components of the data improves the power and size of the club convergence test in finite samples. Therefore, we have eliminated the cyclical components by means of the HP filter [28]. The test for overall panel convergence is rejected for all three indicators with a log t-stat of −65.74, −21.76, and −25.77 for the at-risk-of-poverty rate, the number of persons living in households with low work intensity percentage and the severe deprivation rate, respectively. The absence of convergence for the panel leads us to consider the possible existence of club convergence.
Table 1 presents the results for the club convergence analysis. Overall convergence can be rejected in favour of club convergence, with the analysis identifying six, four and six clubs, respectively, for the at-risk-of-poverty rate, the number of persons living in households with low work intensity percentage and the severe deprivation rate. The composition and heterogeneity of the clubs corroborates our findings based on the descriptive statistics. Given that the clustering procedure tends to find more groups than may actually exist, we have tested whether adjacent clubs can be merged into larger groups. Table 2 shows the results. According to the results, for the at-risk-of-poverty rate, the first and second clubs can be merged, as can the third and fourth clubs. Regarding the number of persons living in households with low work intensity percentage, the third and the fourth club can be merged, Finally, for the severe deprivation rate, the first and second clubs are merged, as are the fourth and fifth. The final composition of the clubs is shown in Table 3.
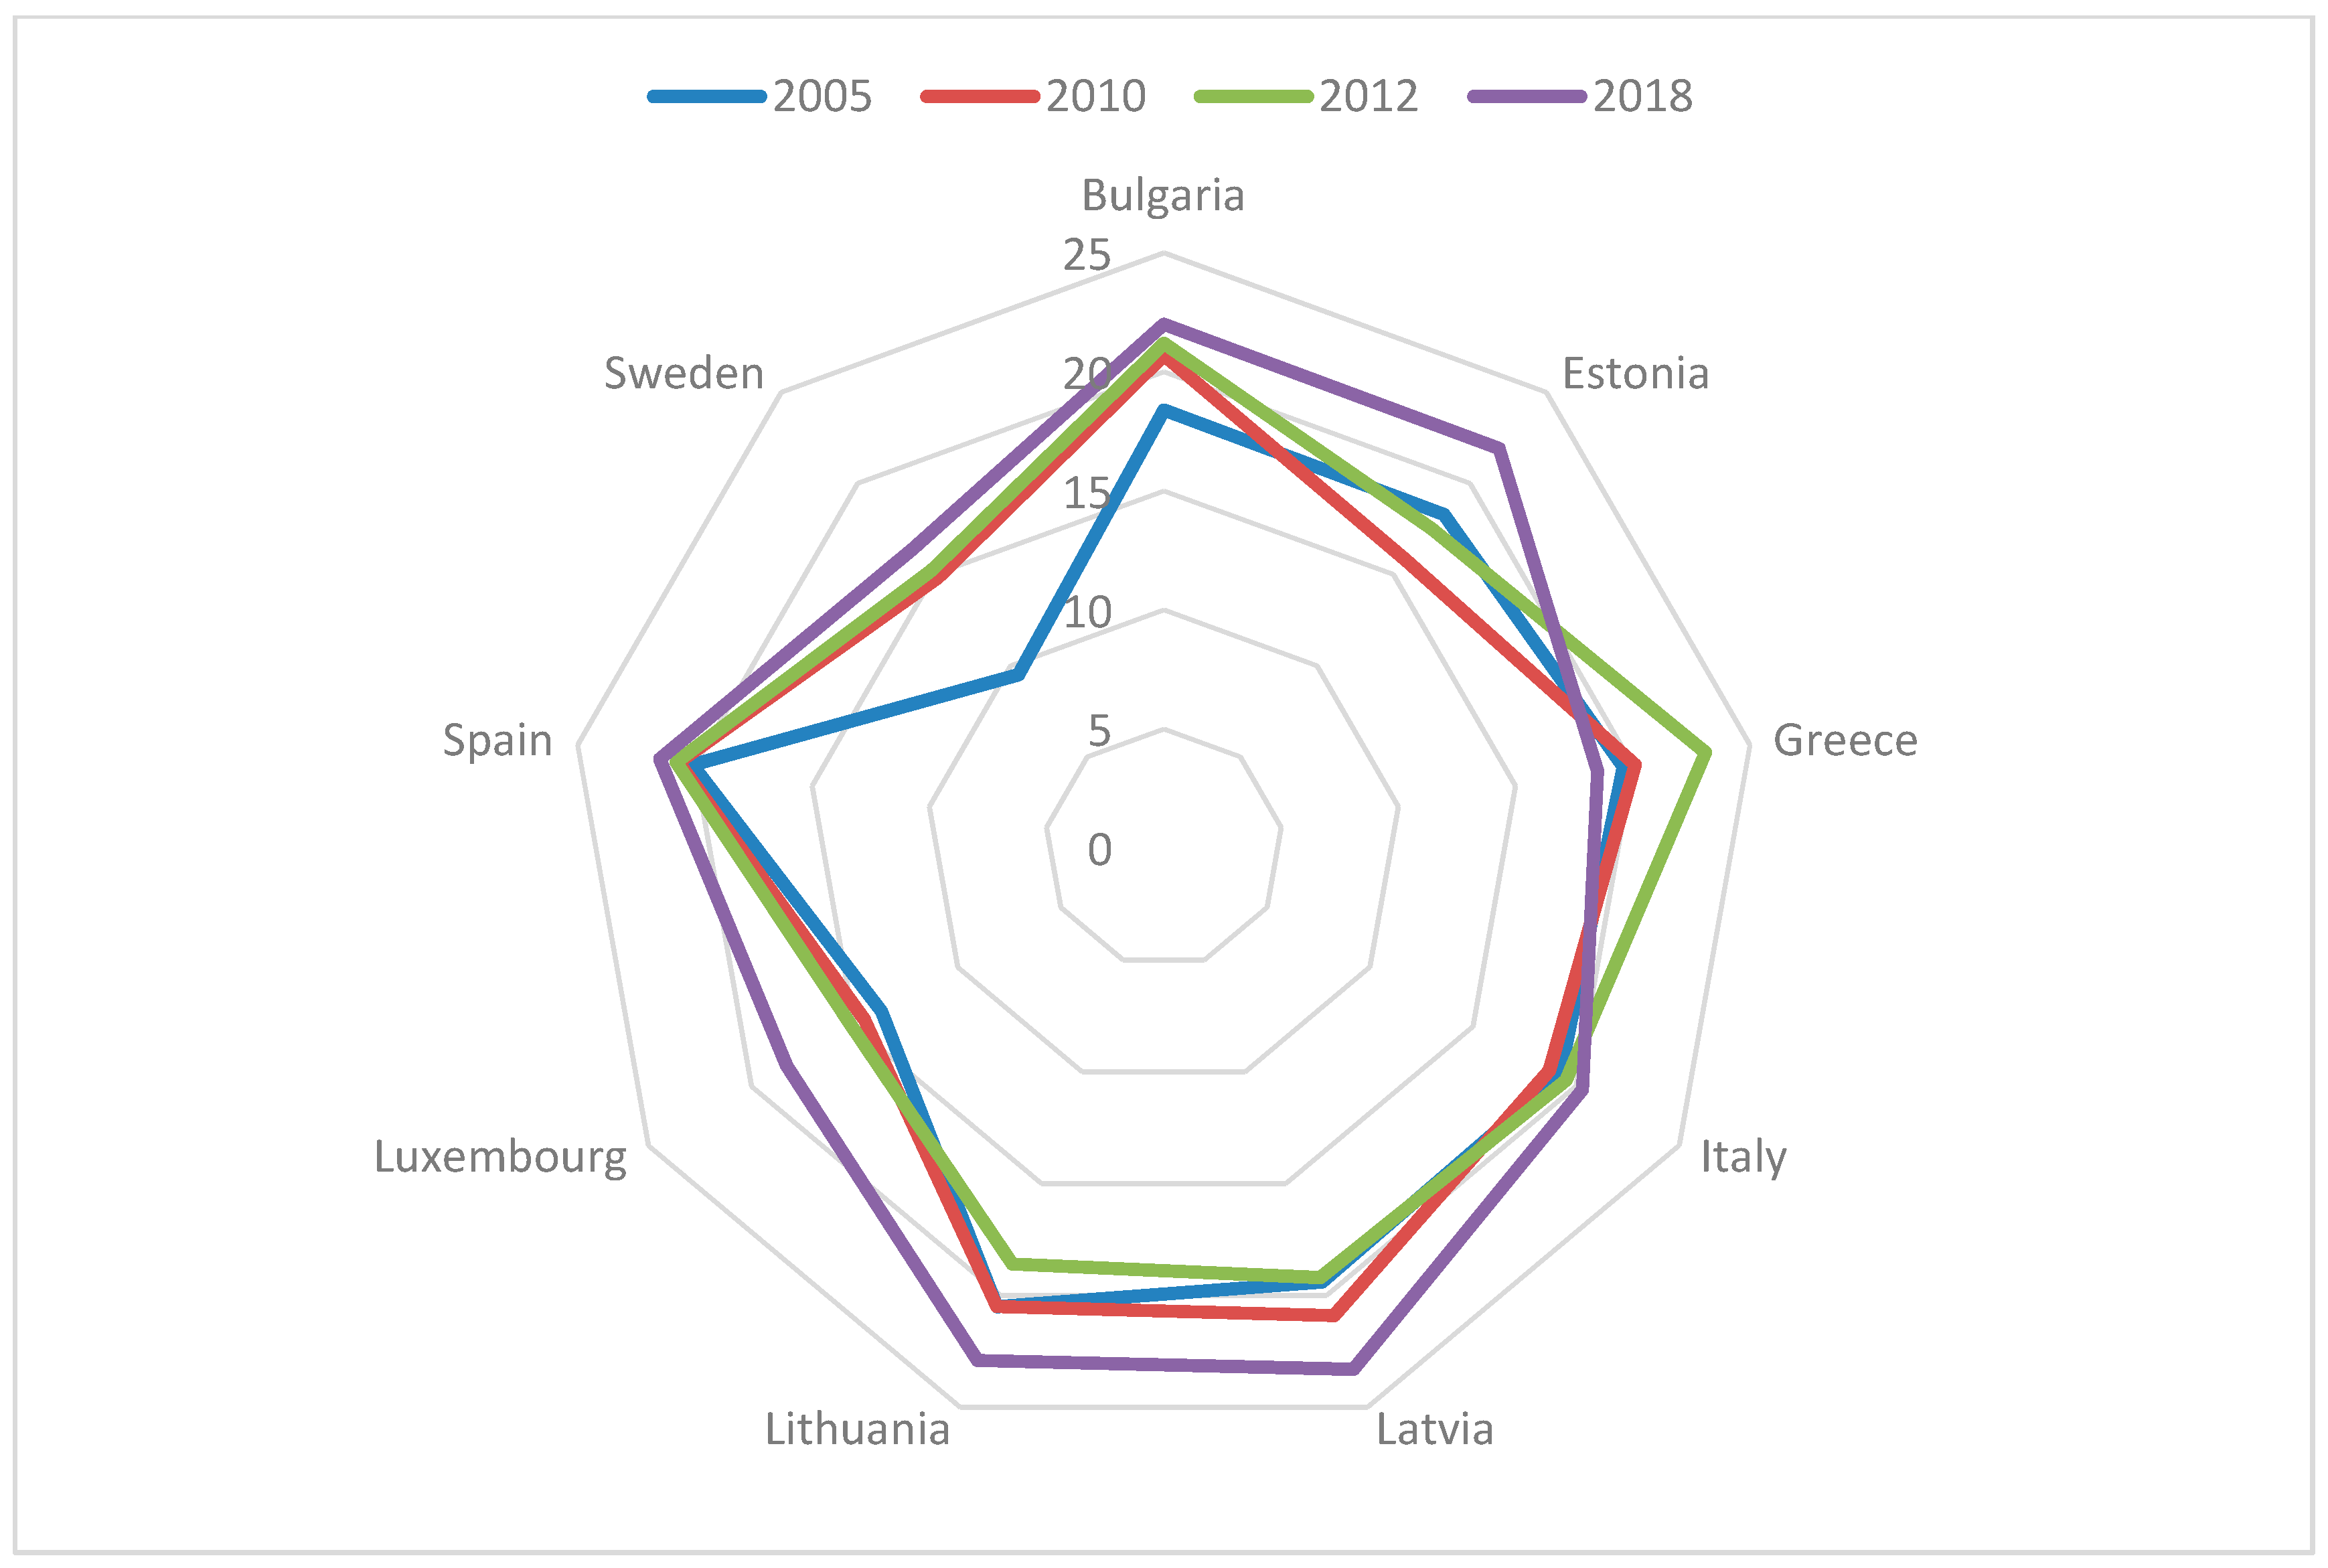
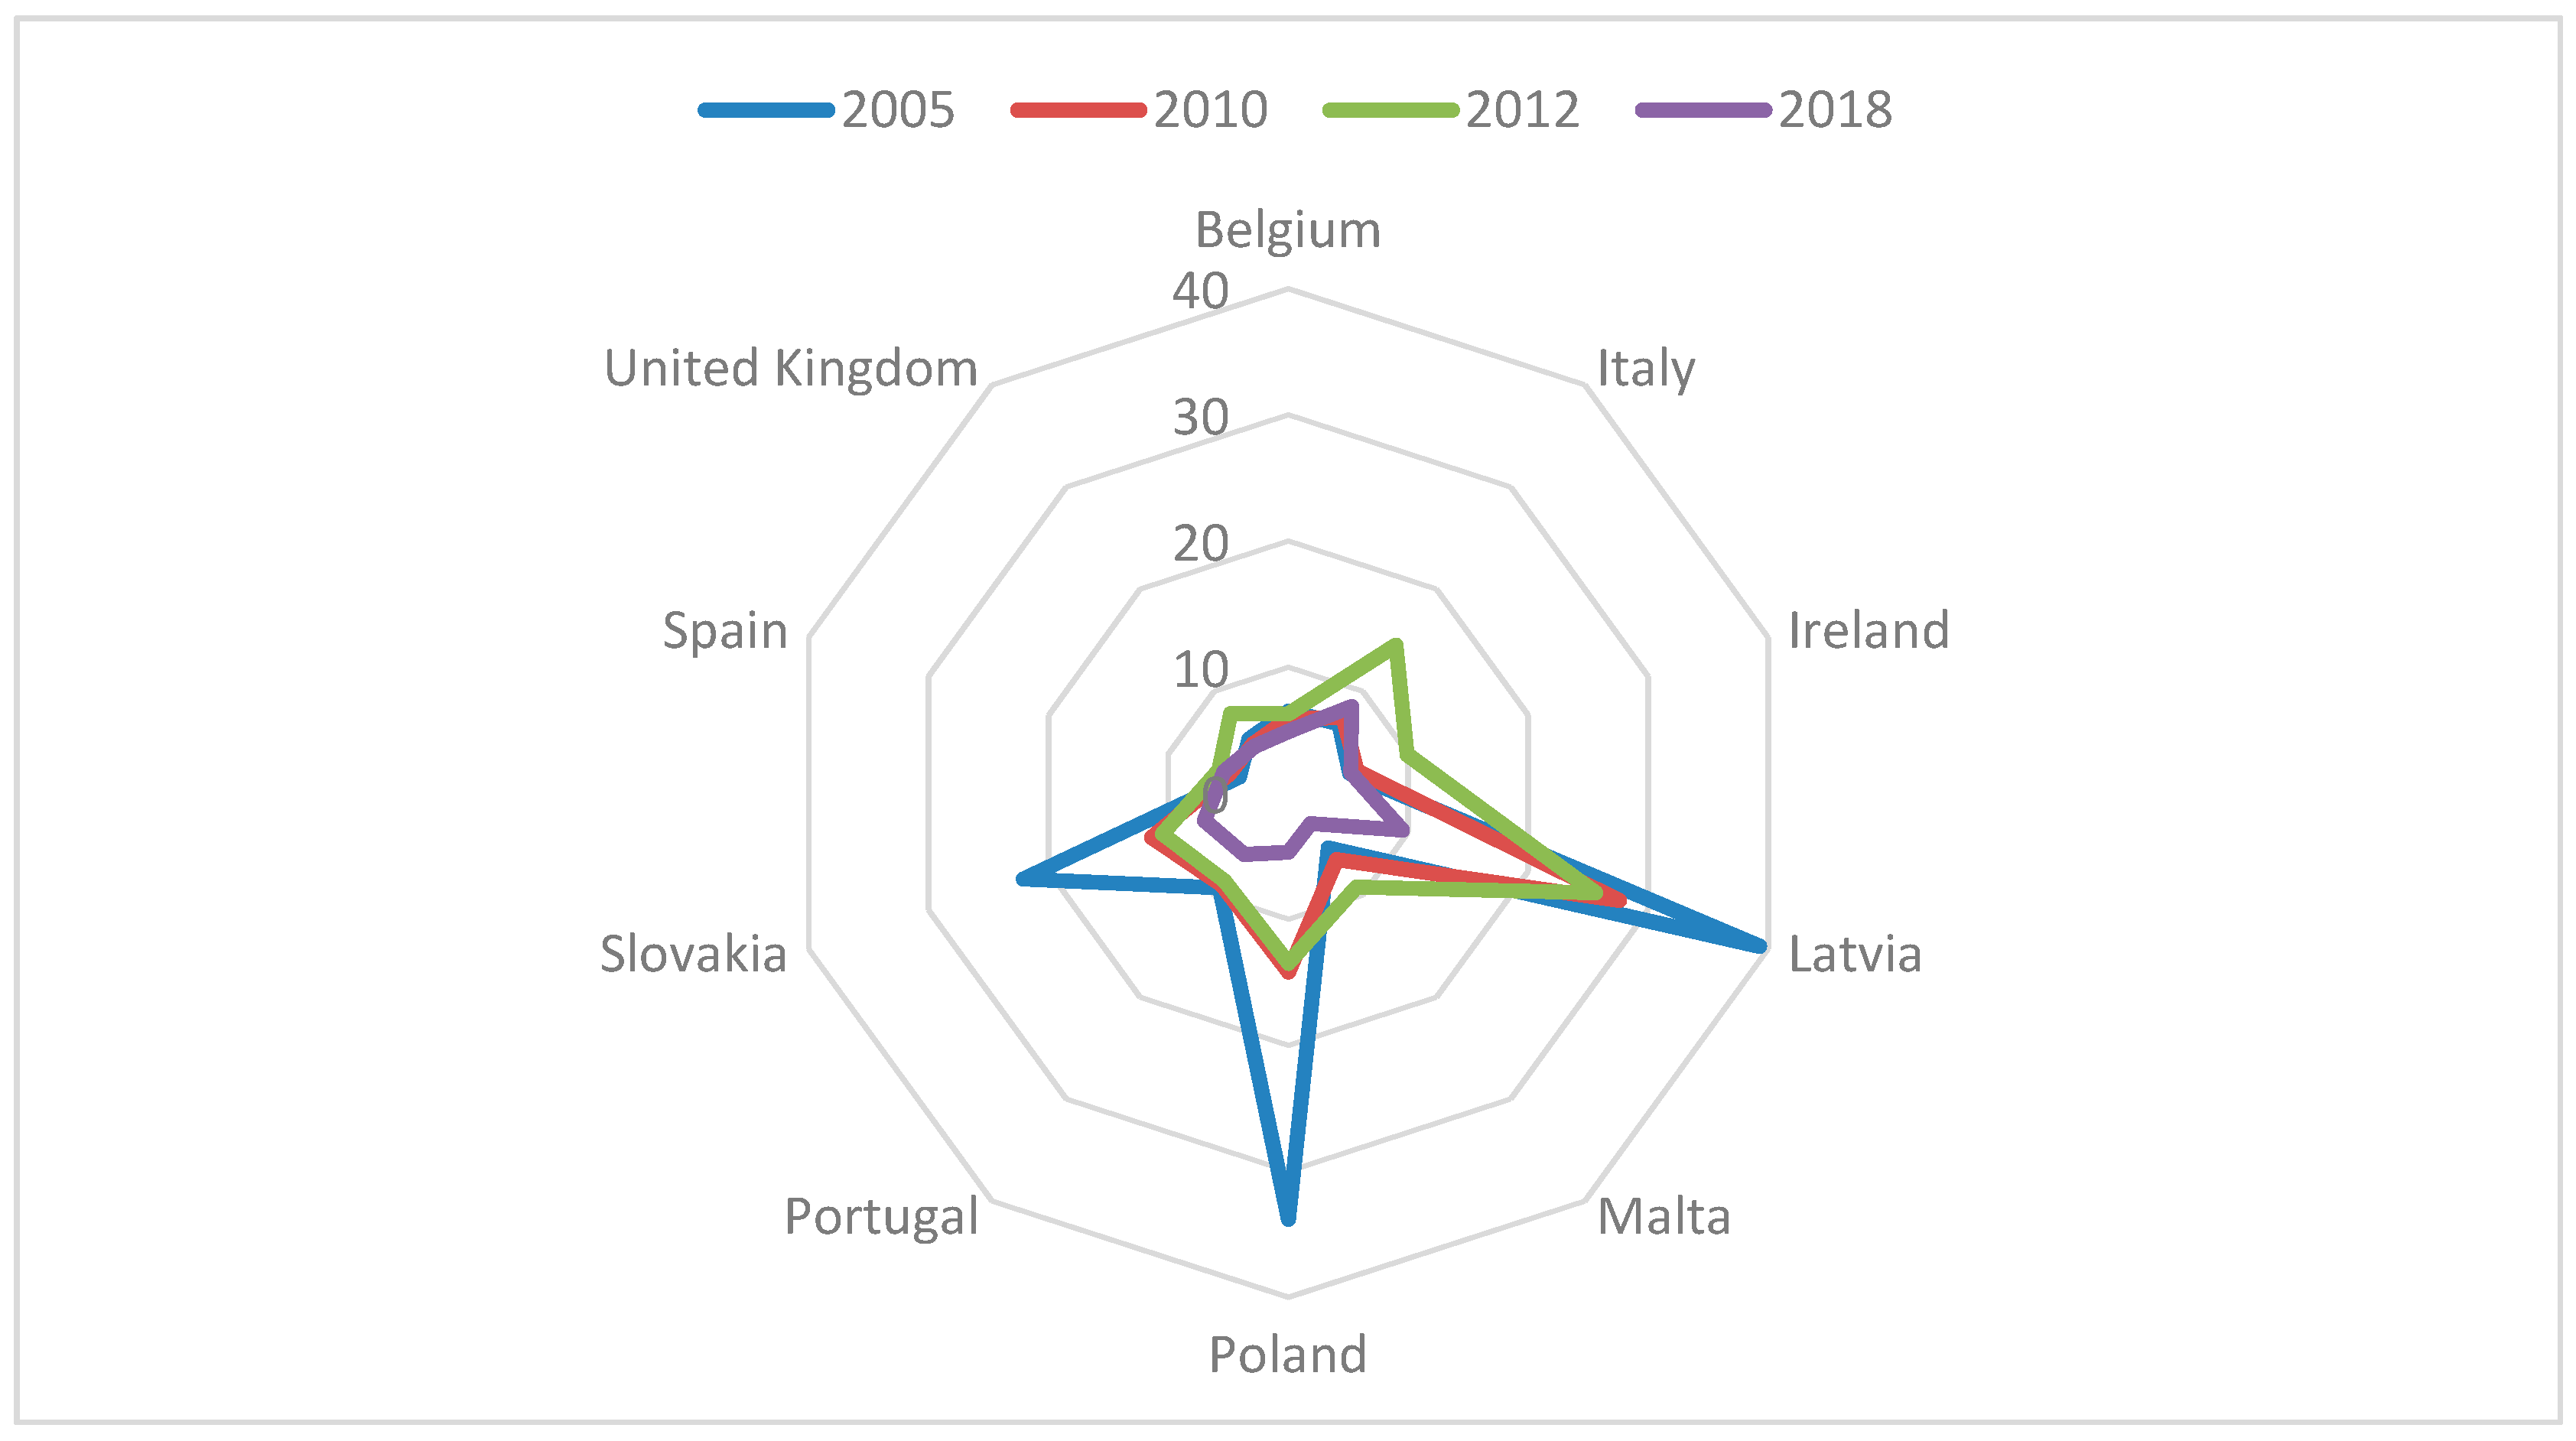
To offer some insight into the logic behind the formation of the most heterogeneous clubs, Figure 1, Figure 2, Figure 3, Figure 4, Figure 5 and Figure 6 present the radial graphs for each of these clubs, showing four values for each country belonging to the club: the initial value, in 2005; the value in the year the Europe 2020 strategy was adopted, 2010; 2012, to see what might be the effect of the crisis, and the final value, in 2018. Figure 1 shows the first convergence club for the at-risk-of-poverty rate indicator. This club is characterised by having a 2018 value for this rate of between 16% and 22%, and in general there is no substantial variation between the initial value in 2005 and the end one in 2018. The club is primarily composed of eastern and southern European countries. Although the inclusion of Luxembourg and Sweden in this club might seem surprising, in fact these countries, despite starting in 2005 with at-risk-of-poverty rate levels notably lower than the other countries in the club, performed much worse from then until 2018. This is especially true for Sweden, though both these countries show levels similar to the rest of the countries of the club in 2018. The graph also shows that Greece performed badly as a consequence of the crisis.
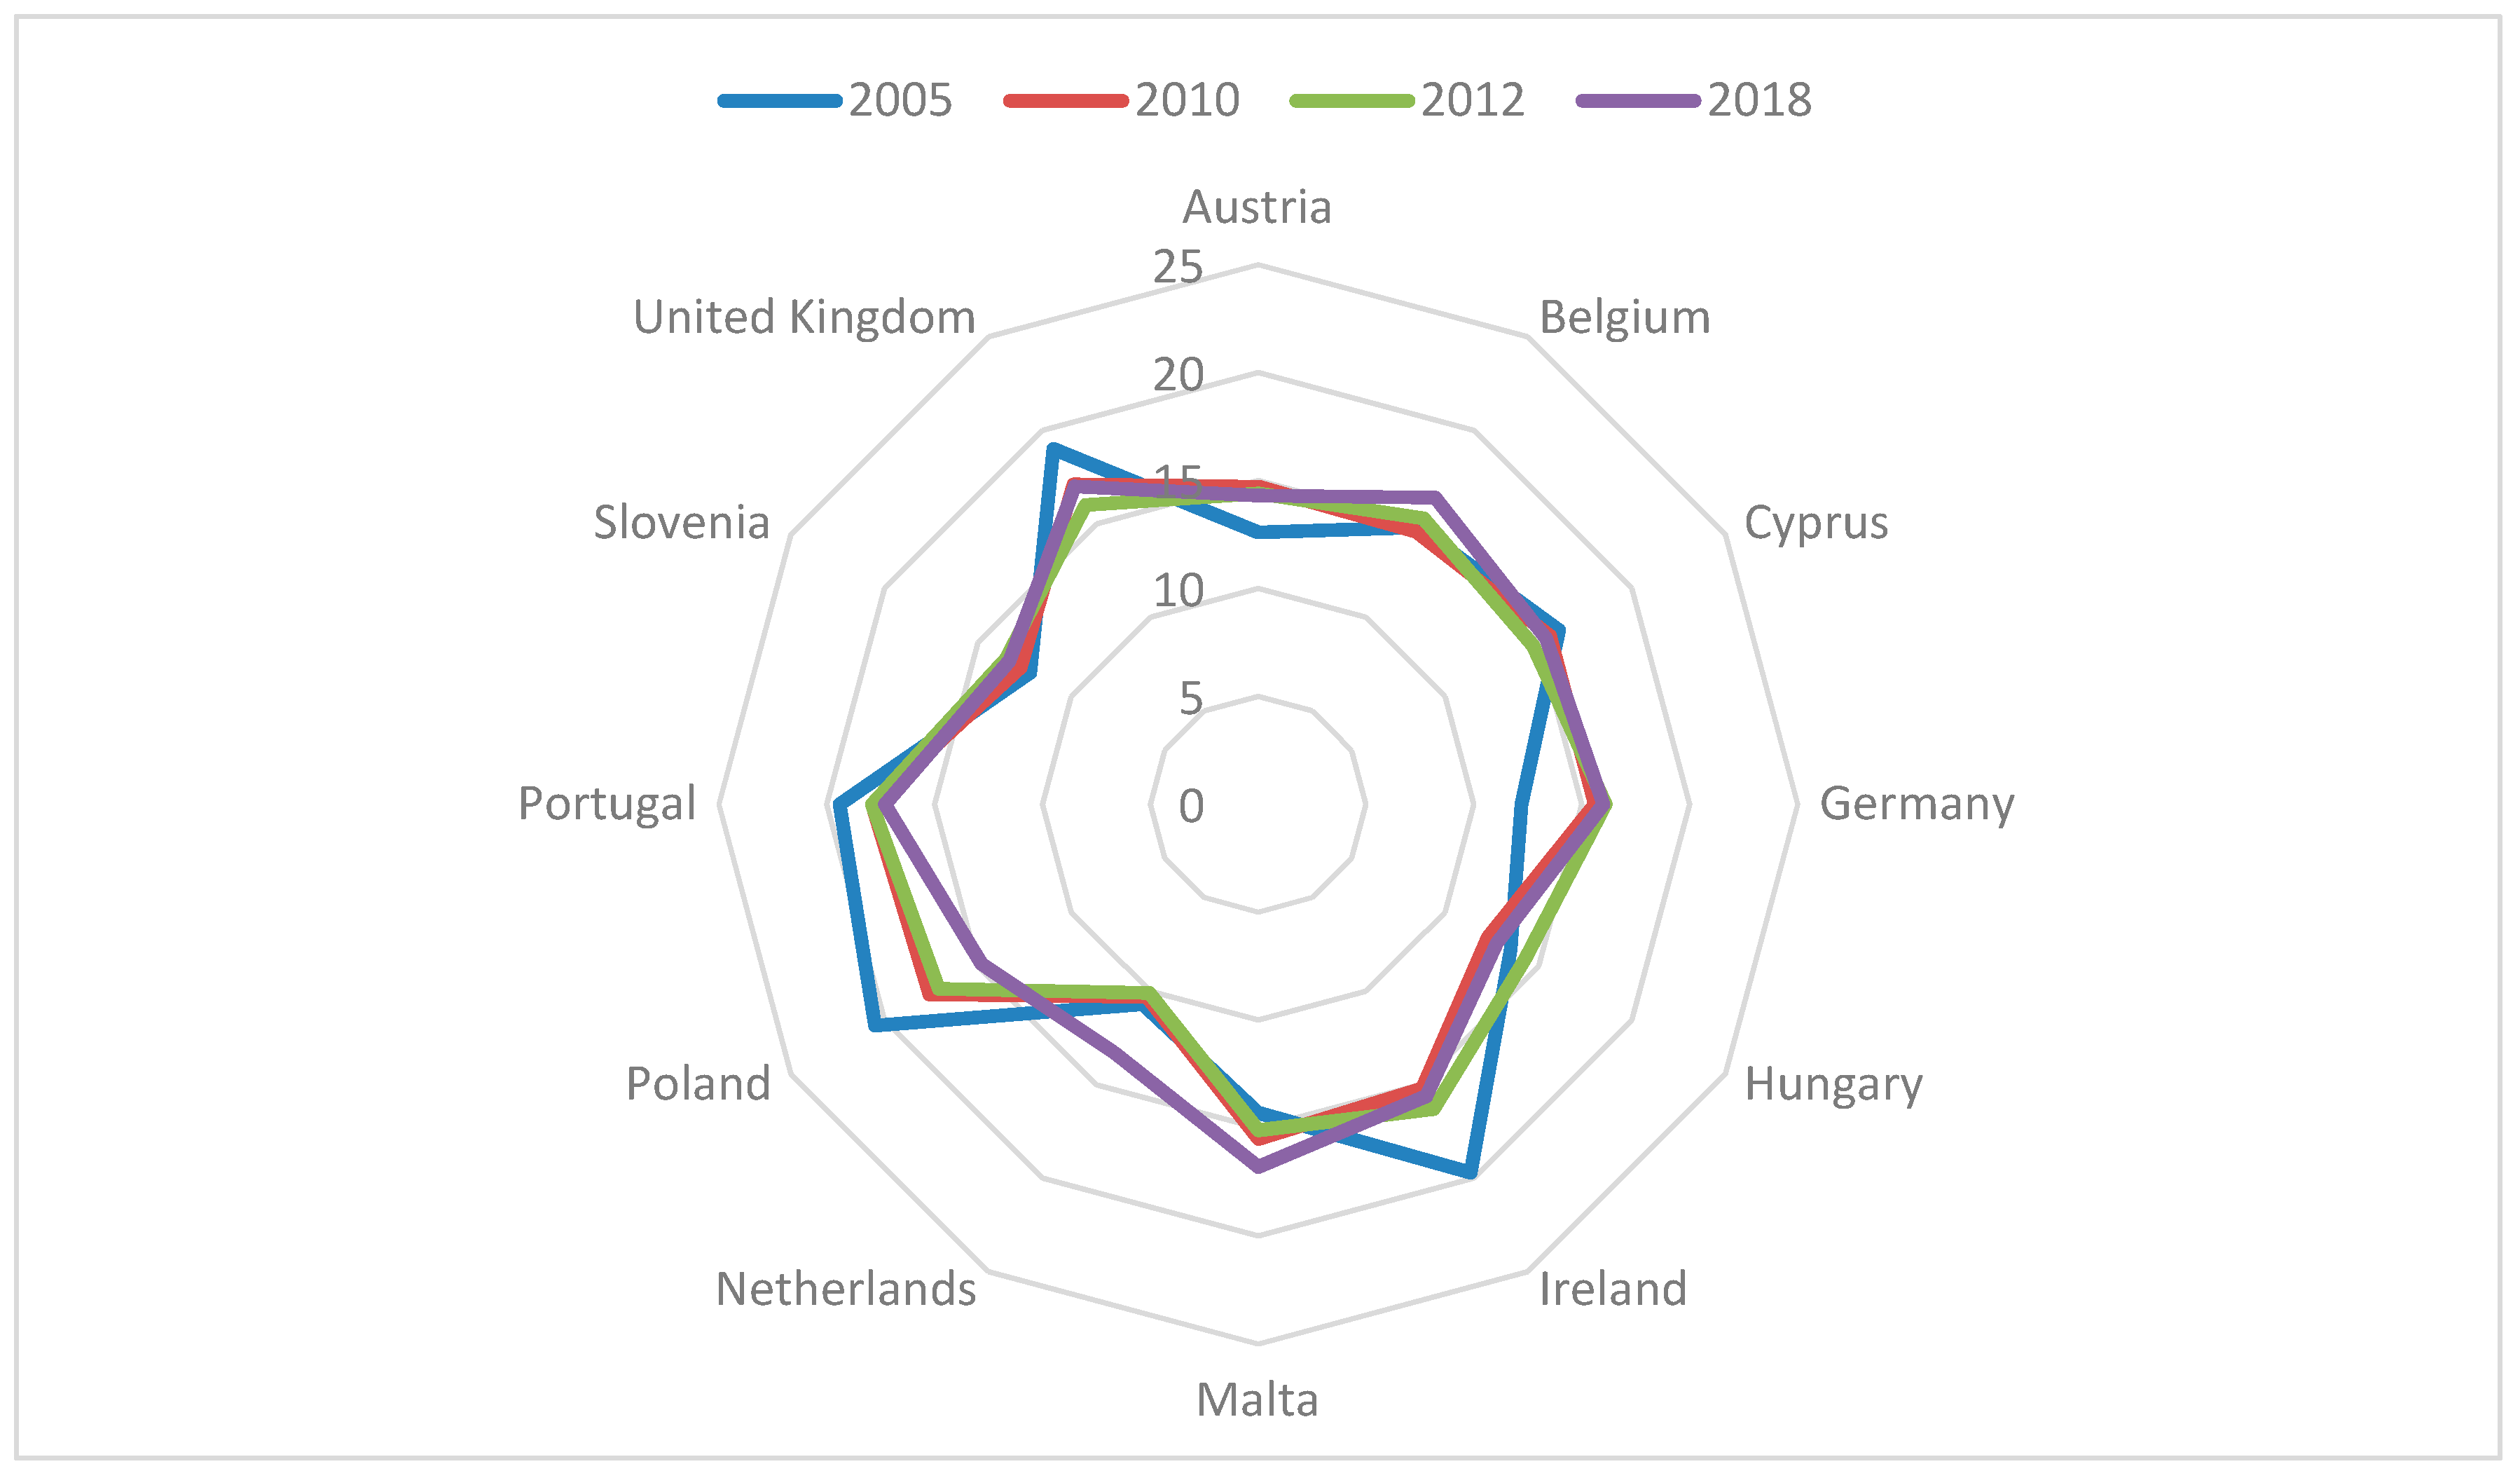
Figure 2 shows the second convergence club for the at-risk-of-poverty rate indicator. This club includes countries with a rate of between 13% and 17% in 2018. It is a very heterogeneous club containing countries from central, eastern and southern Europe. Countries such as Belgium, Cyprus, Hungary, Malta, Portugal and Slovenia show very little variability between 2005 and 2018 values. During the period under analysis, Ireland and Poland have achieved a significant reduction in the at-risk-of poverty rate, registering levels of around 15% in 2018. Conversely, Germany is the worst performing country, reporting an increase in this rate from 2005 values of around 12% to a final value of 16%.
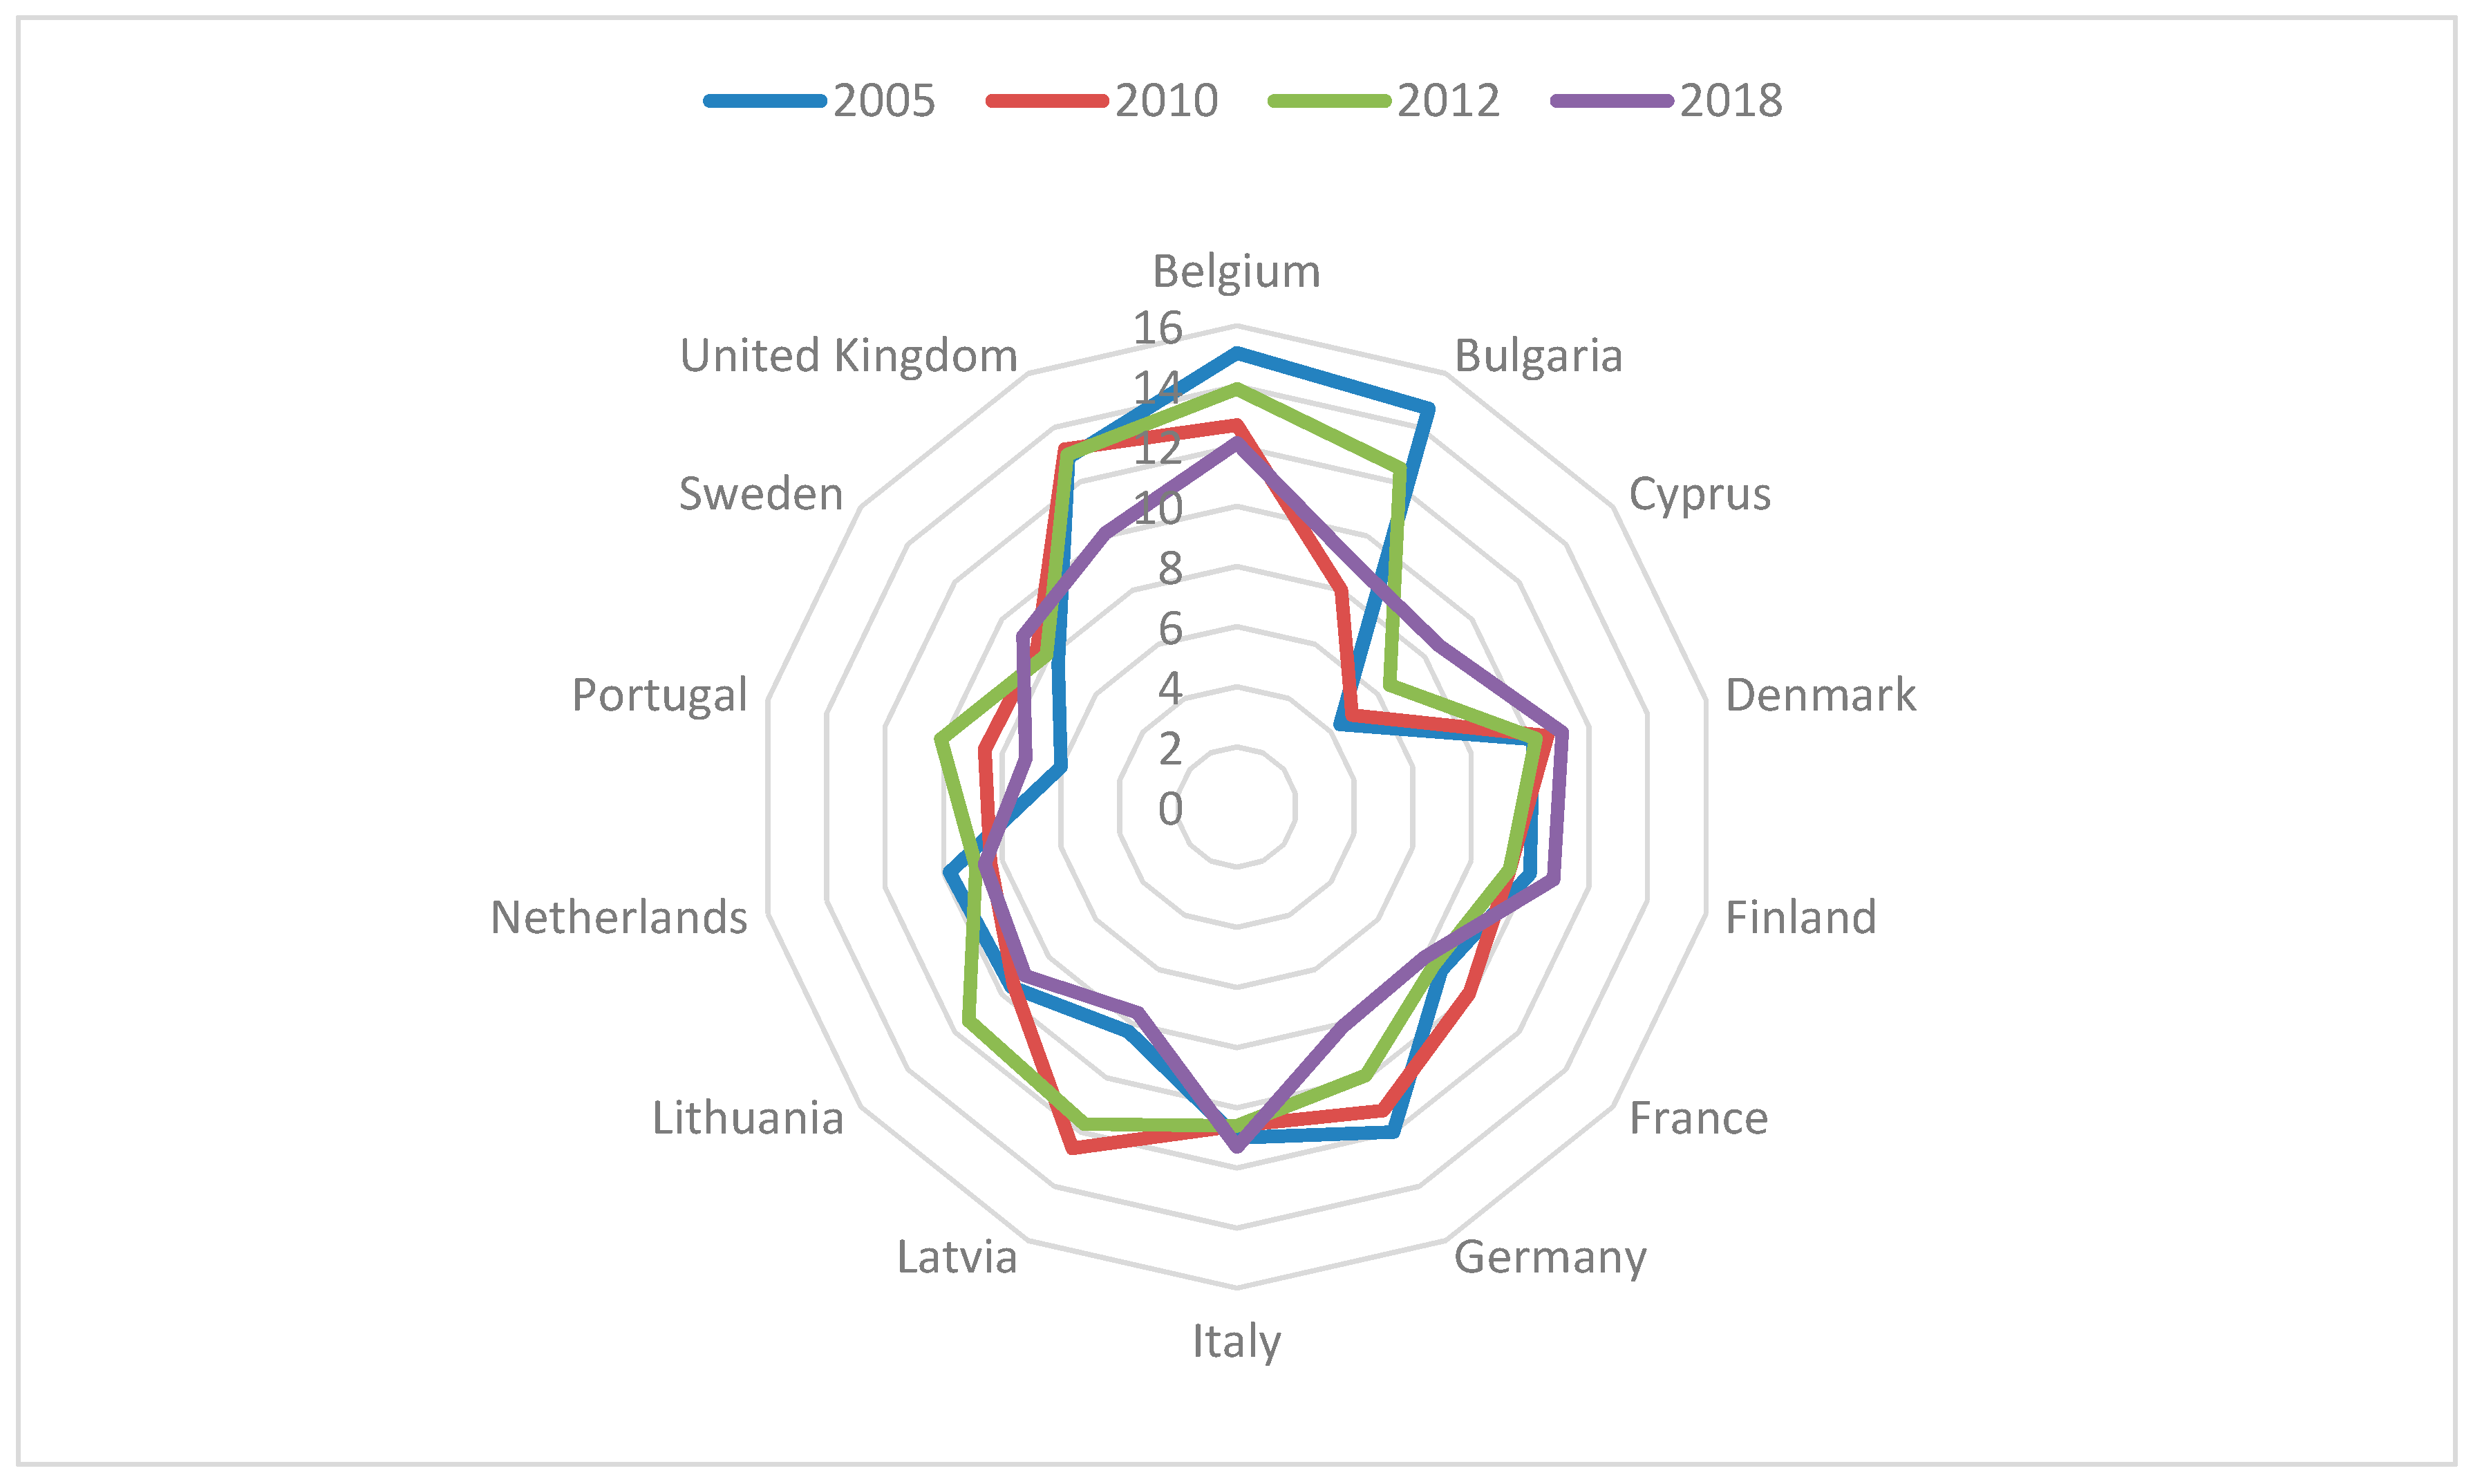
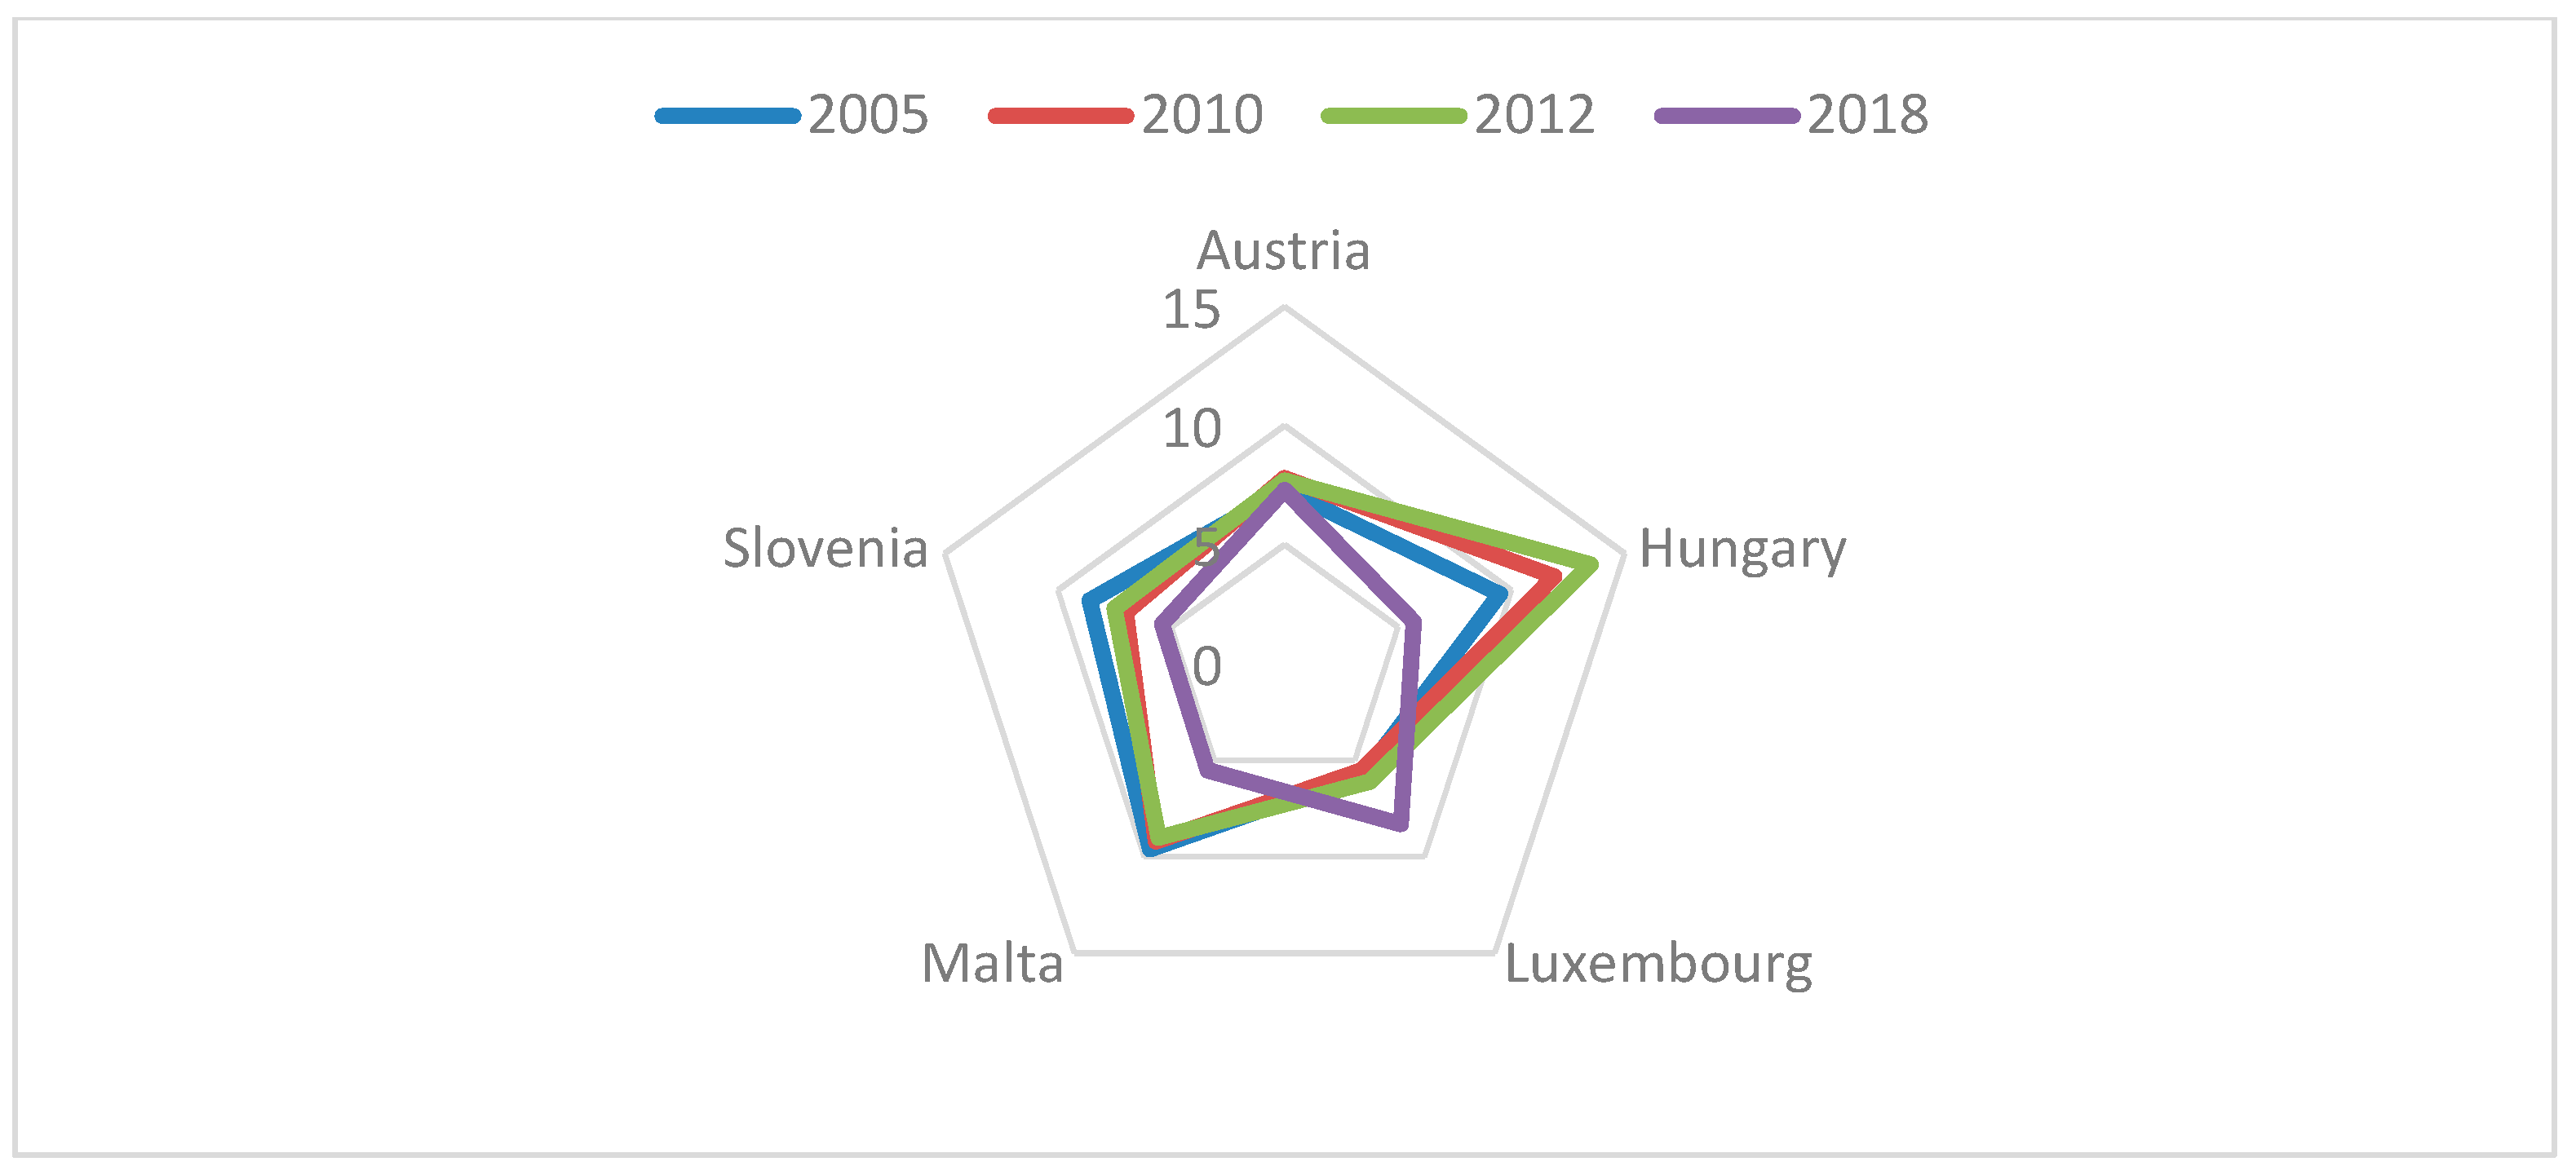
Figure 3 and Figure 4 show the radial graphs for the second and third clubs for the indicator number of persons living in households with very low work intensity. The second club displays values for this rate of between 8% and 12% for 2018, while the third club presents values of between 5% and 8%. Furthermore, both clubs are characterised by a marked dispersion between the initial and end values of the indicator for all countries. Both clubs are made up of central, eastern and southern European countries. The second club is characterised by a high dispersion in the initial values: the highest value for 2005 is recorded for Belgium with 15.1%, compared to the lowest value of 4.4% for Cyprus. This initial dispersion is balanced out by the progress of the countries that started out with higher rates (Belgium, Bulgaria, Germany, Latvia, and the United Kingdom) and the poor performance of those with lower values at the outset (Cyprus). Regarding the third club, the convergence occurs partly because of the sharp drop in the rate registered by Slovenia, but fundamentally due to Hungary and Malta. Luxembourg, on the other hand, performs poorly with its rate increasing by 2.5%, bringing it close to the levels reported for Austria.
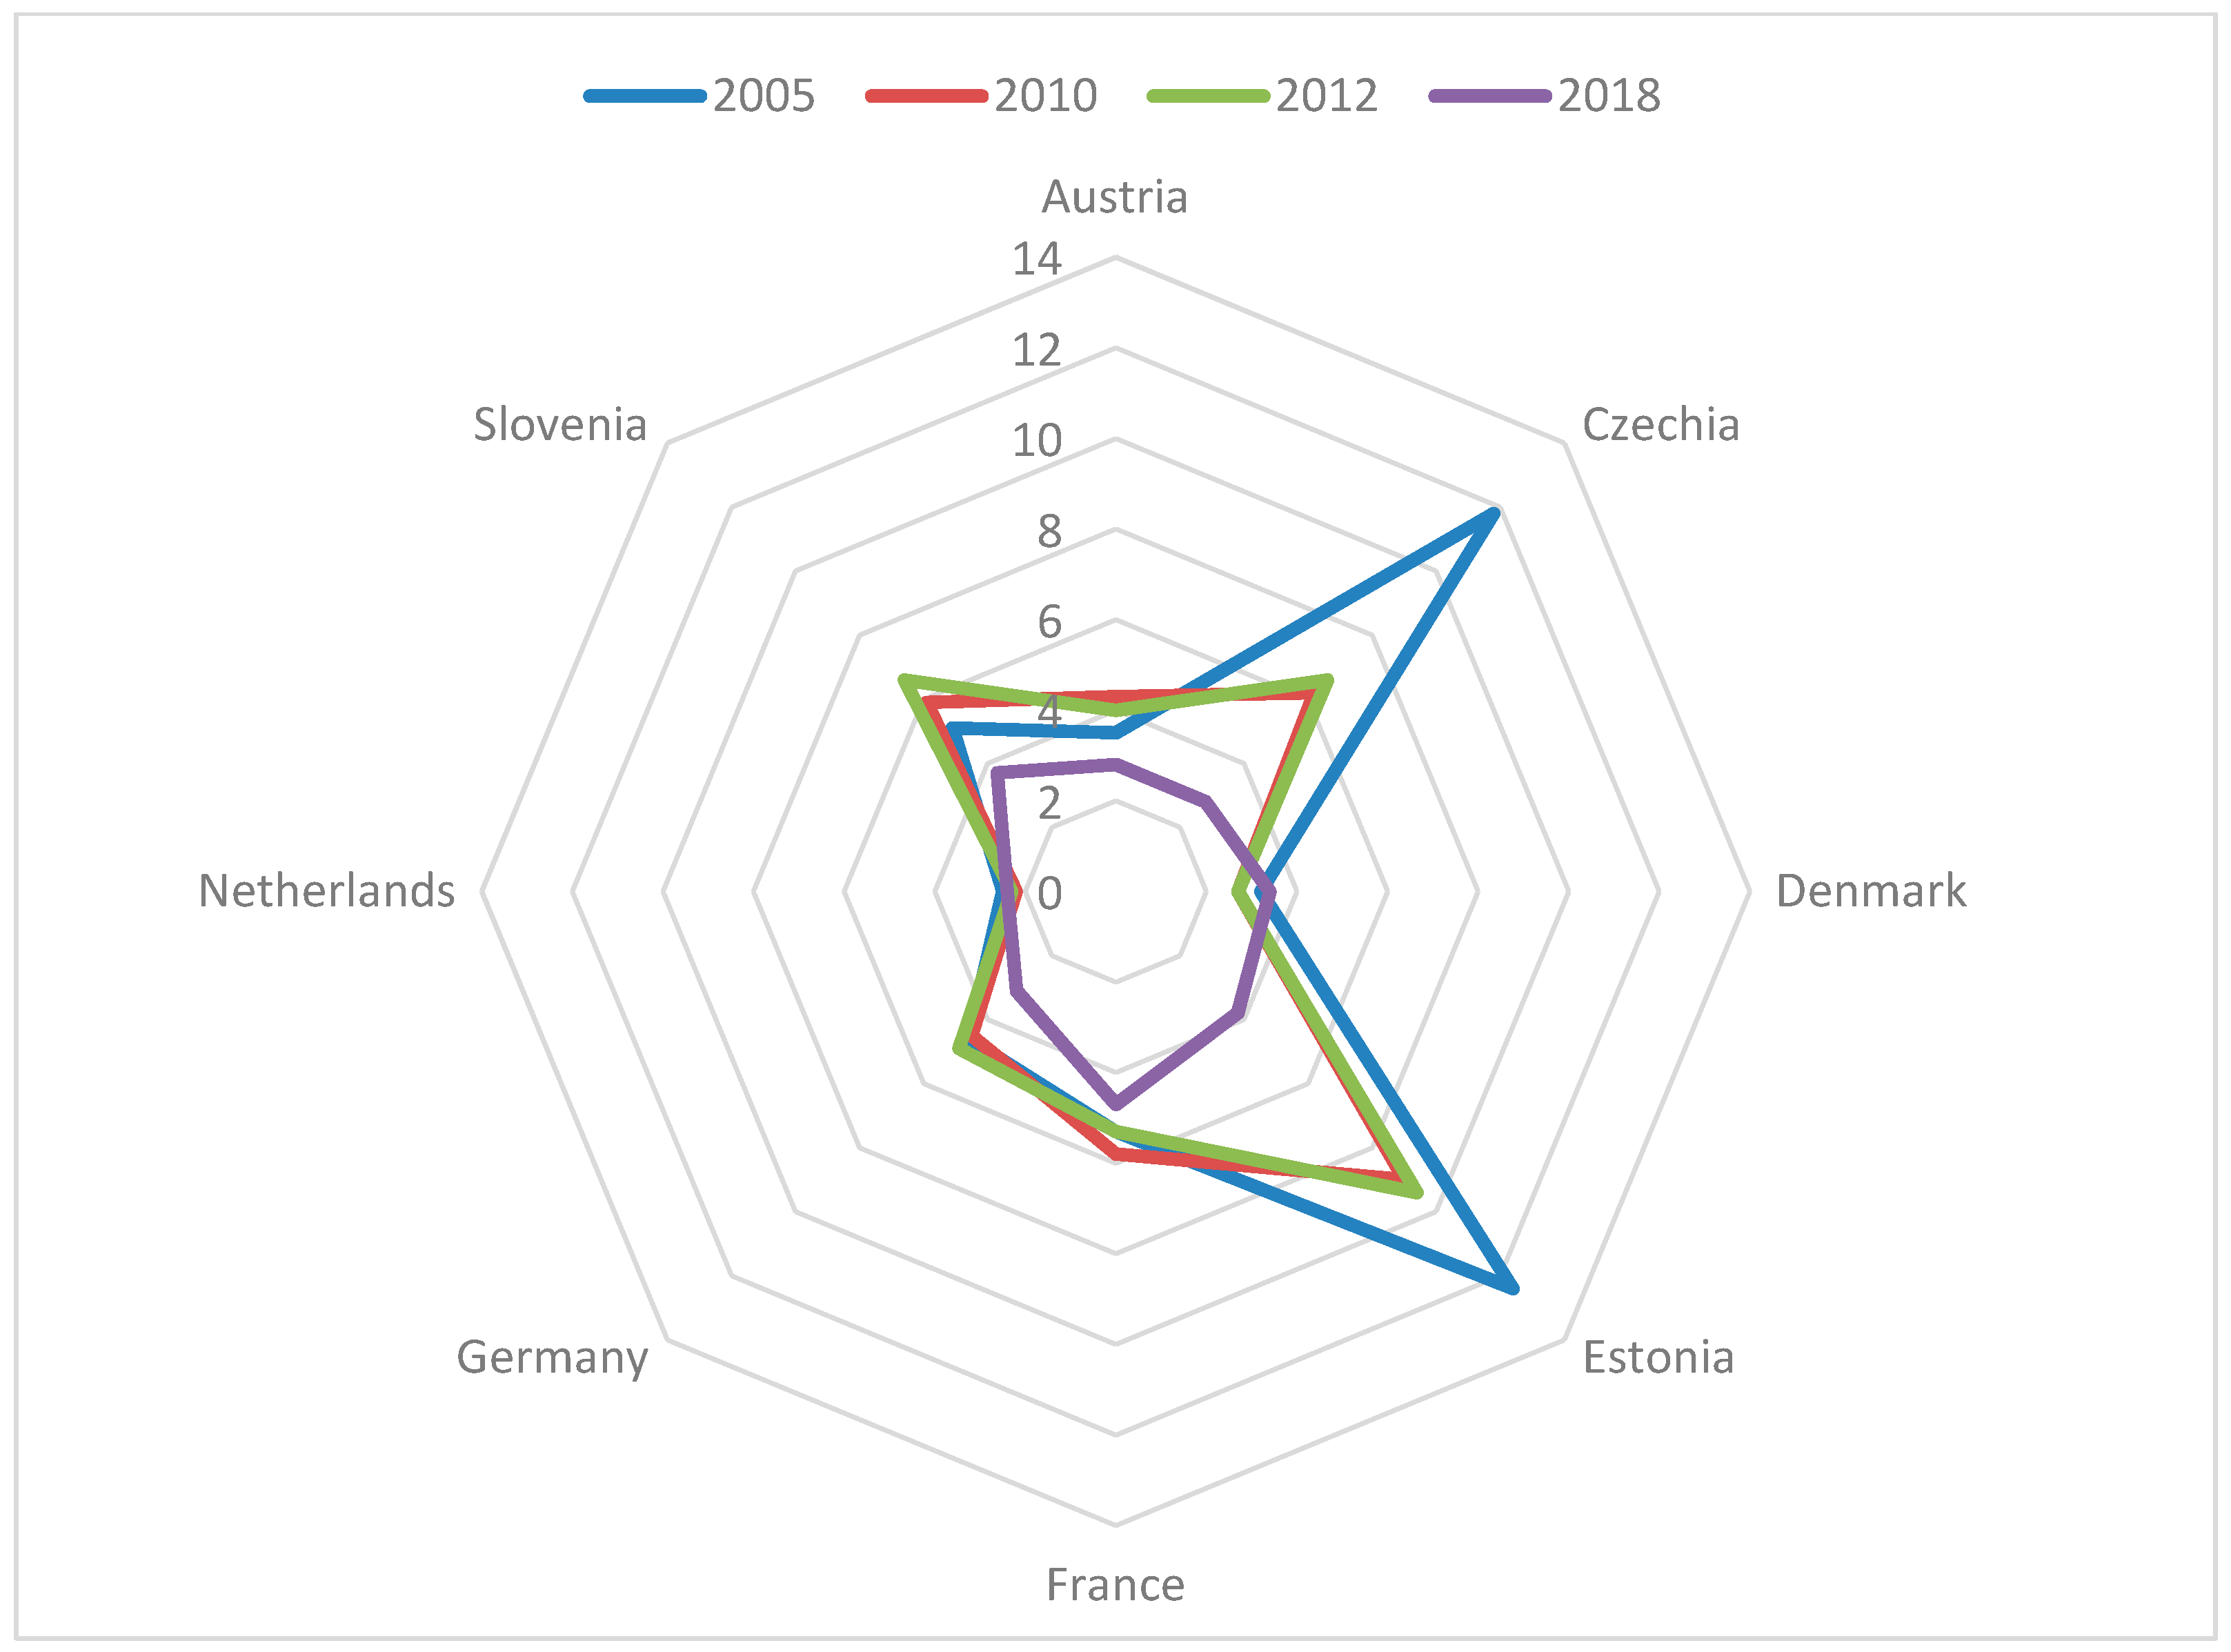
Figure 5 and Figure 6 present the radial graphs for the second and third clubs corresponding to the severe material deprivation rate indicator. In 2018, the second club shows values for this rate of between 5% and 9%, while the third club presents values of between 3% and 5%. In the second club, three countries from eastern Europe—Latvia, Poland and, to a lesser extent, Slovakia—have undergone a marked process of sustained convergence over time, bringing them in line with the levels achieved by the western European countries with which they share the club. With perhaps the only exception of Malta, all the western European countries included in the club present very similar values for this rate over the three years considered; as such, convergence is achieved entirely through the three eastern economies catching up to the levels of their western European counterparts. Something similar can be observed in the third club, where Denmark, the Netherlands and, to a lesser extent, France and Germany show similar values between 2005 and 2018, meaning that convergence is achieved through the sharp reduction in the severe material deprivation rate in the eastern economies, with a particularly intense decline in Czechia and Estonia. Figure 5 also shows how the crisis severely hit countries as Italy and Ireland.
From the analysis thus far, it can be concluded that, although there are clubs that are geographically fairly homogeneous, such as the first club for the number of persons living in households with very low work intensity indicator and for the severe material deprivation rate, in general the clubs do not reveal a clearly defined north‒south or east‒west geographical pattern. In addition, the clubs for the at-risk-of-poverty rate indicator show less dispersion between the initial and end values than those for the other two indicators. Lastly, it can be seen—very clearly in the case of the severe material deprivation rate—that convergence occurs through the countries from the east of Europe converging on those of the west. Thus, convergence is mainly the result of a process of eastern European countries catching up to the levels of western European ones.
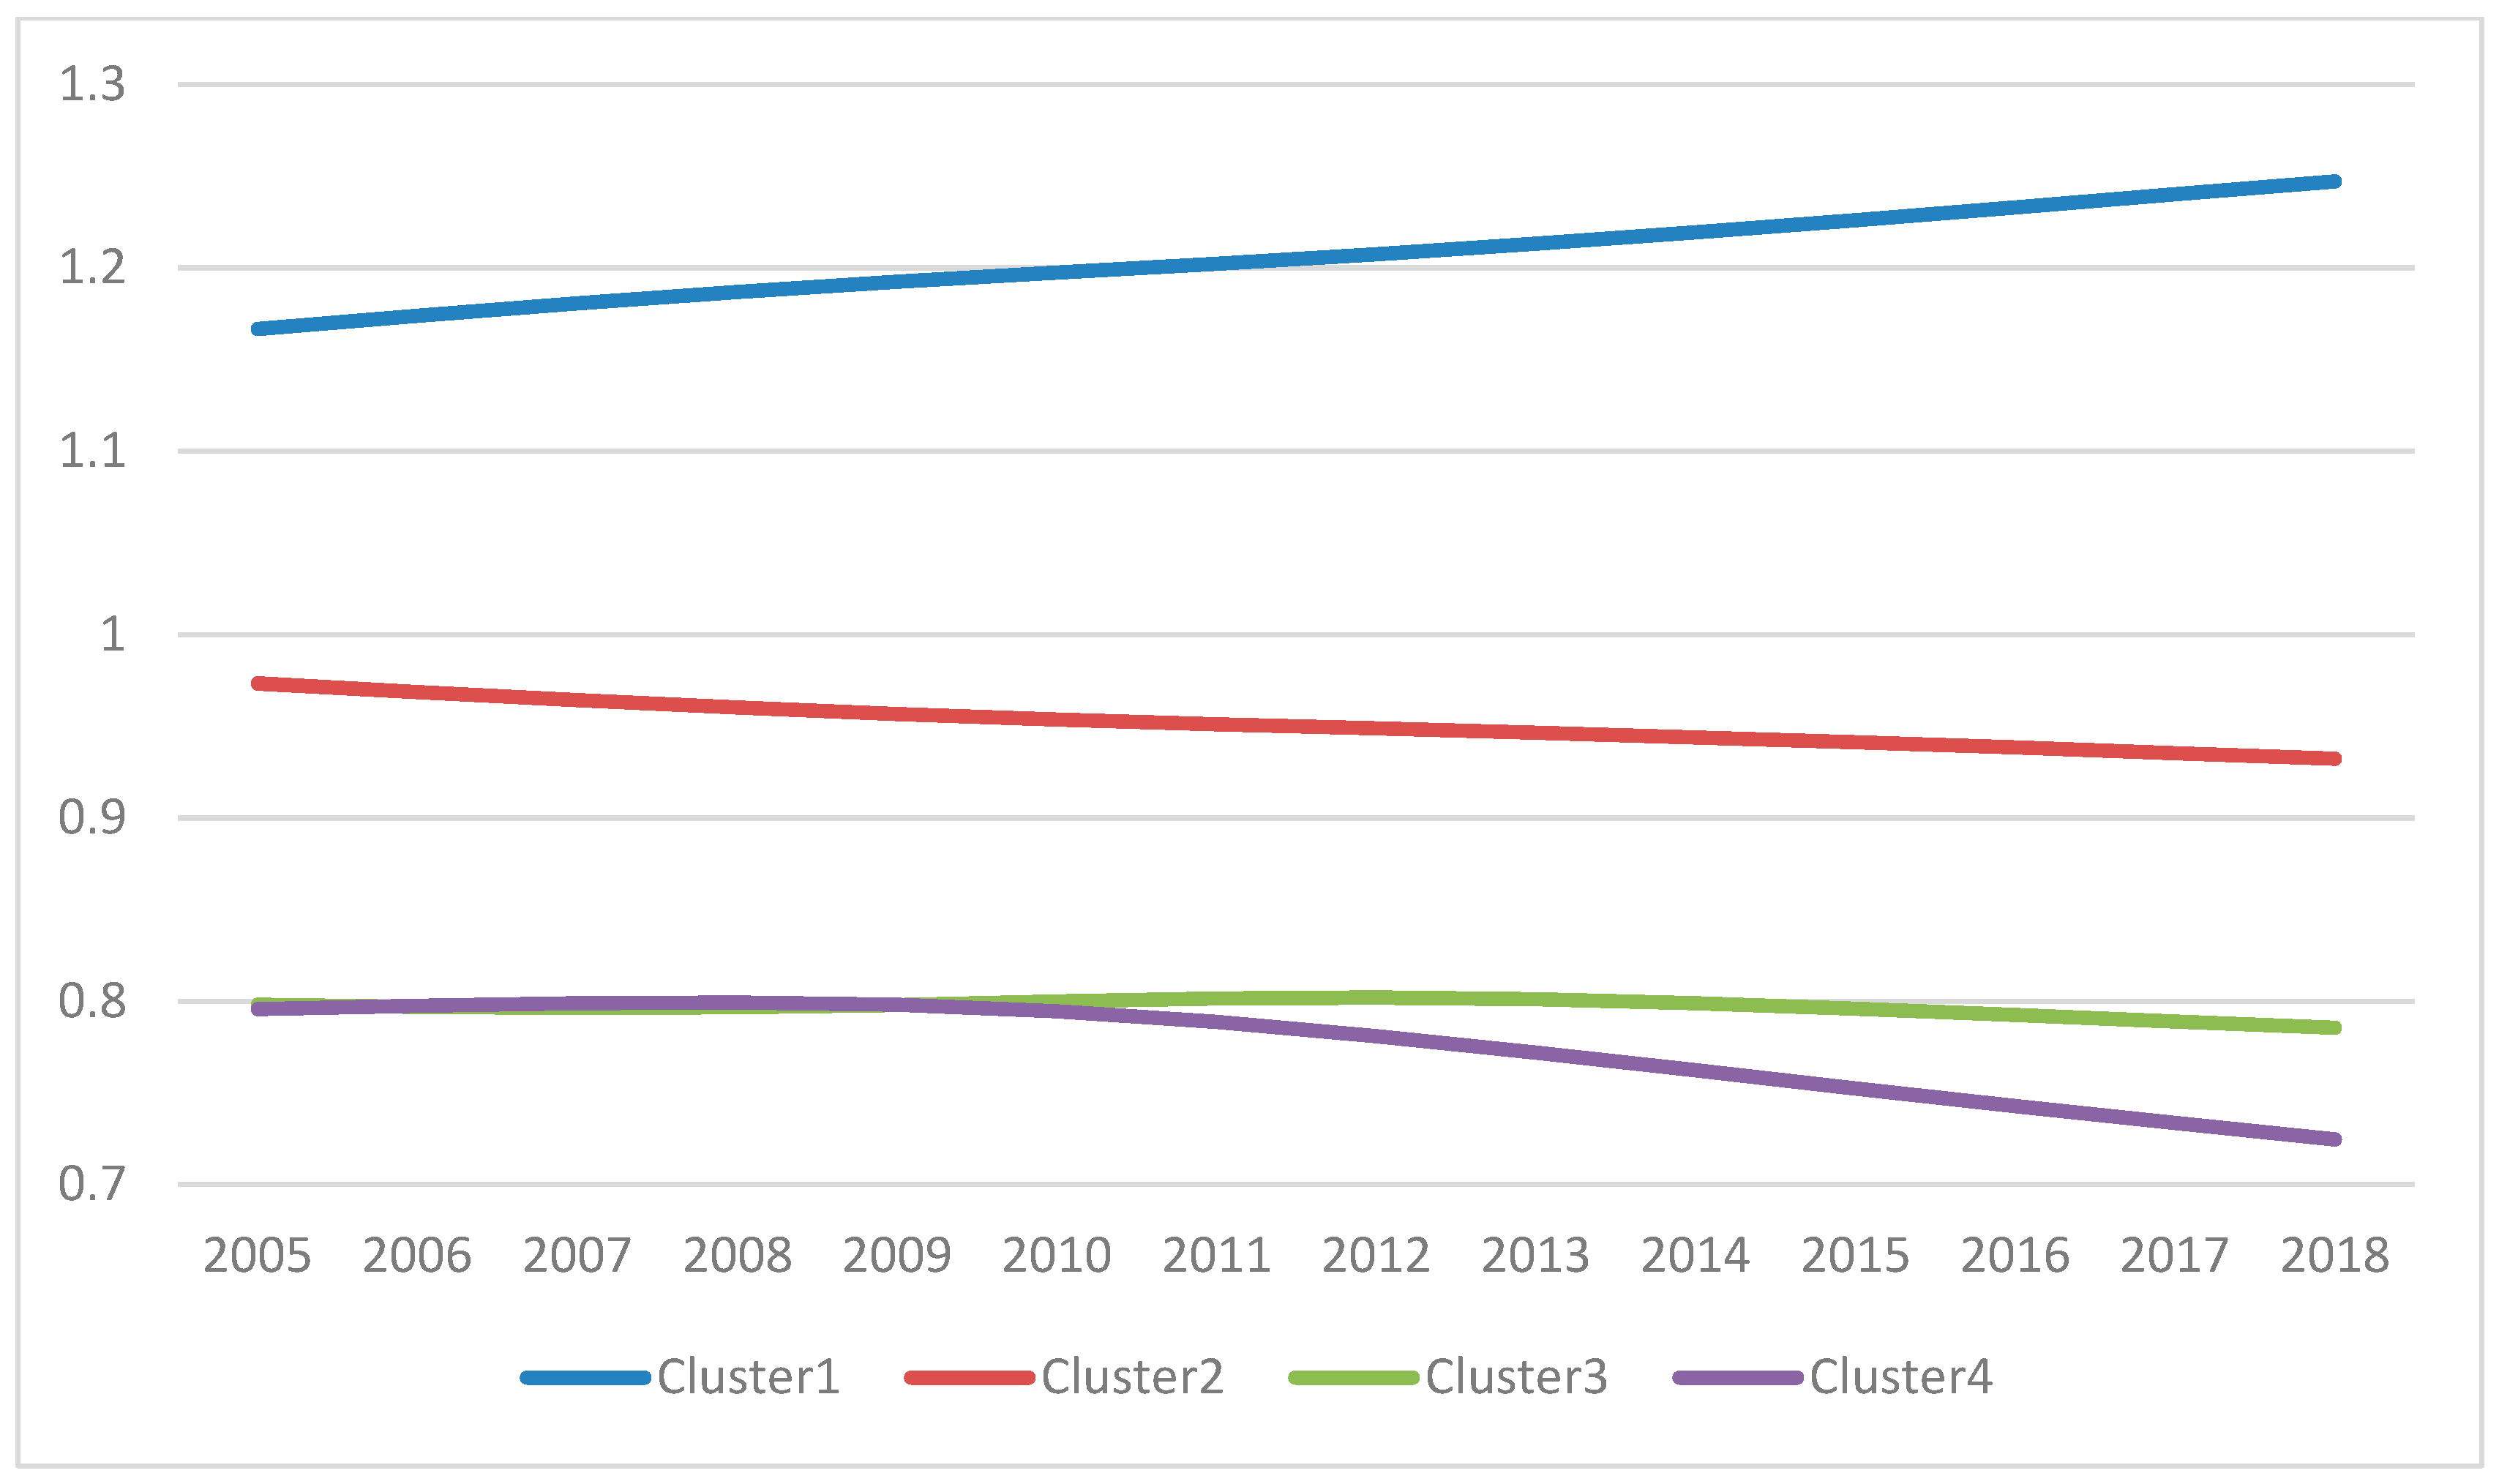
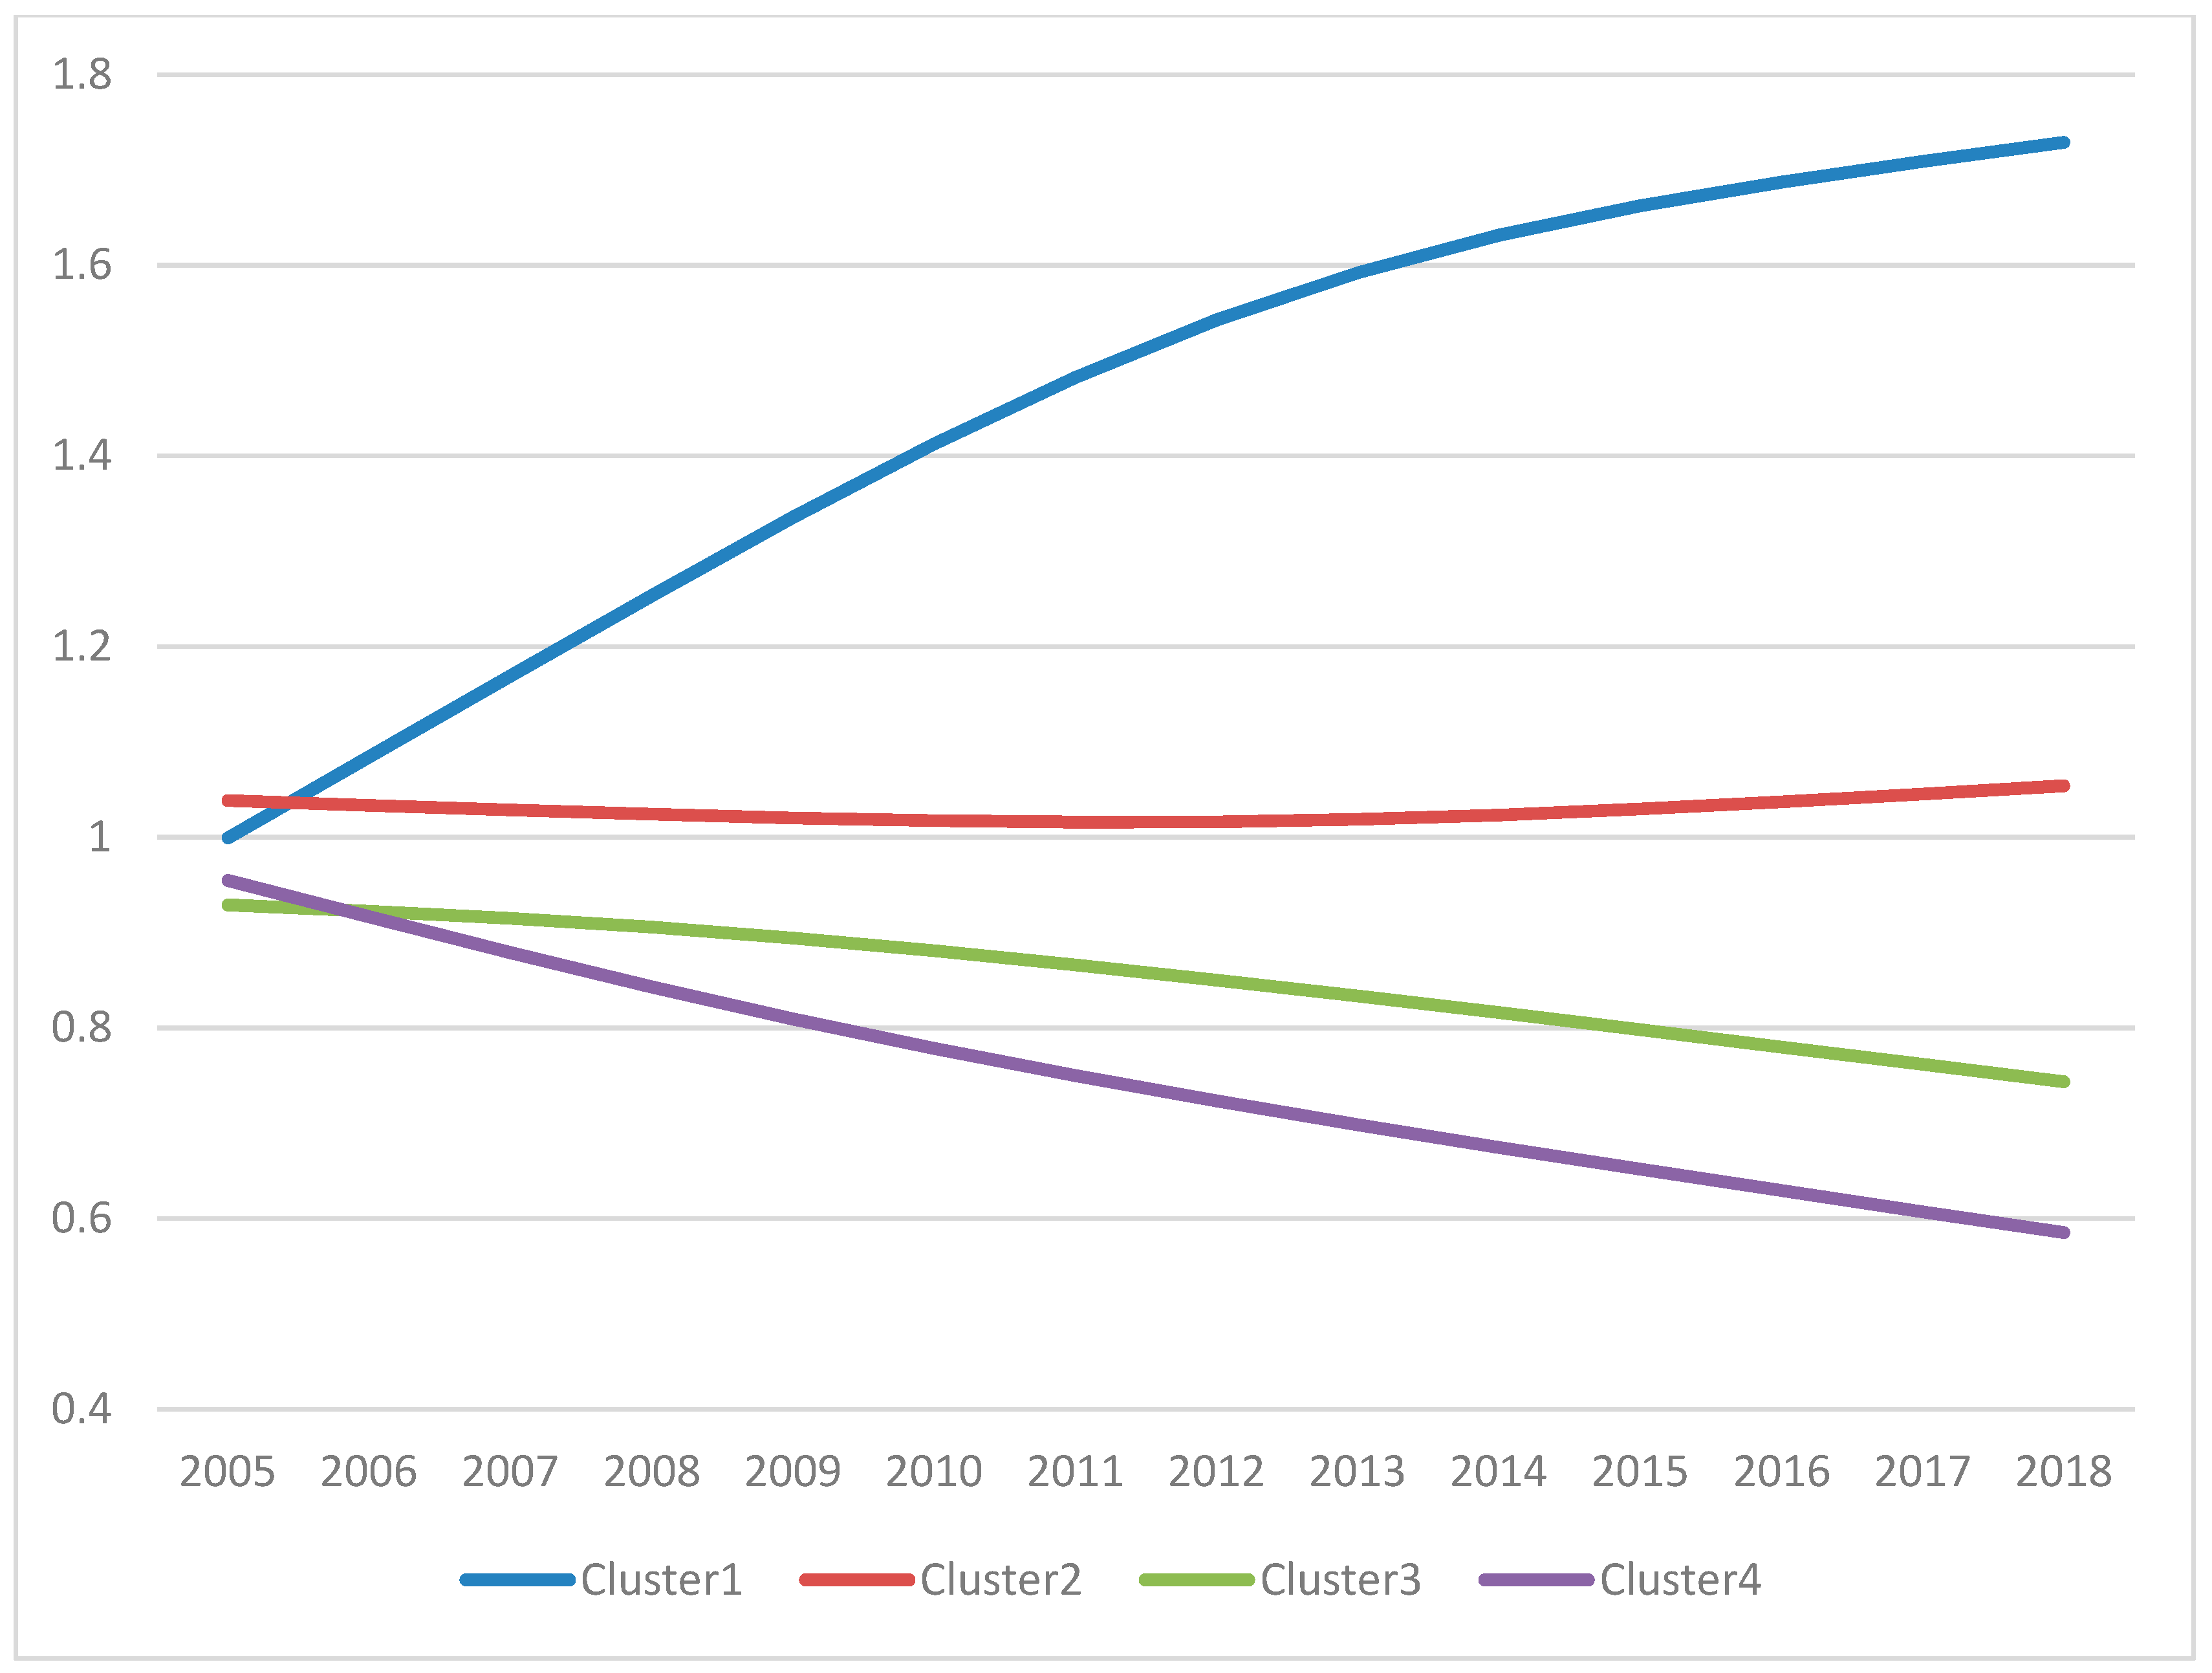
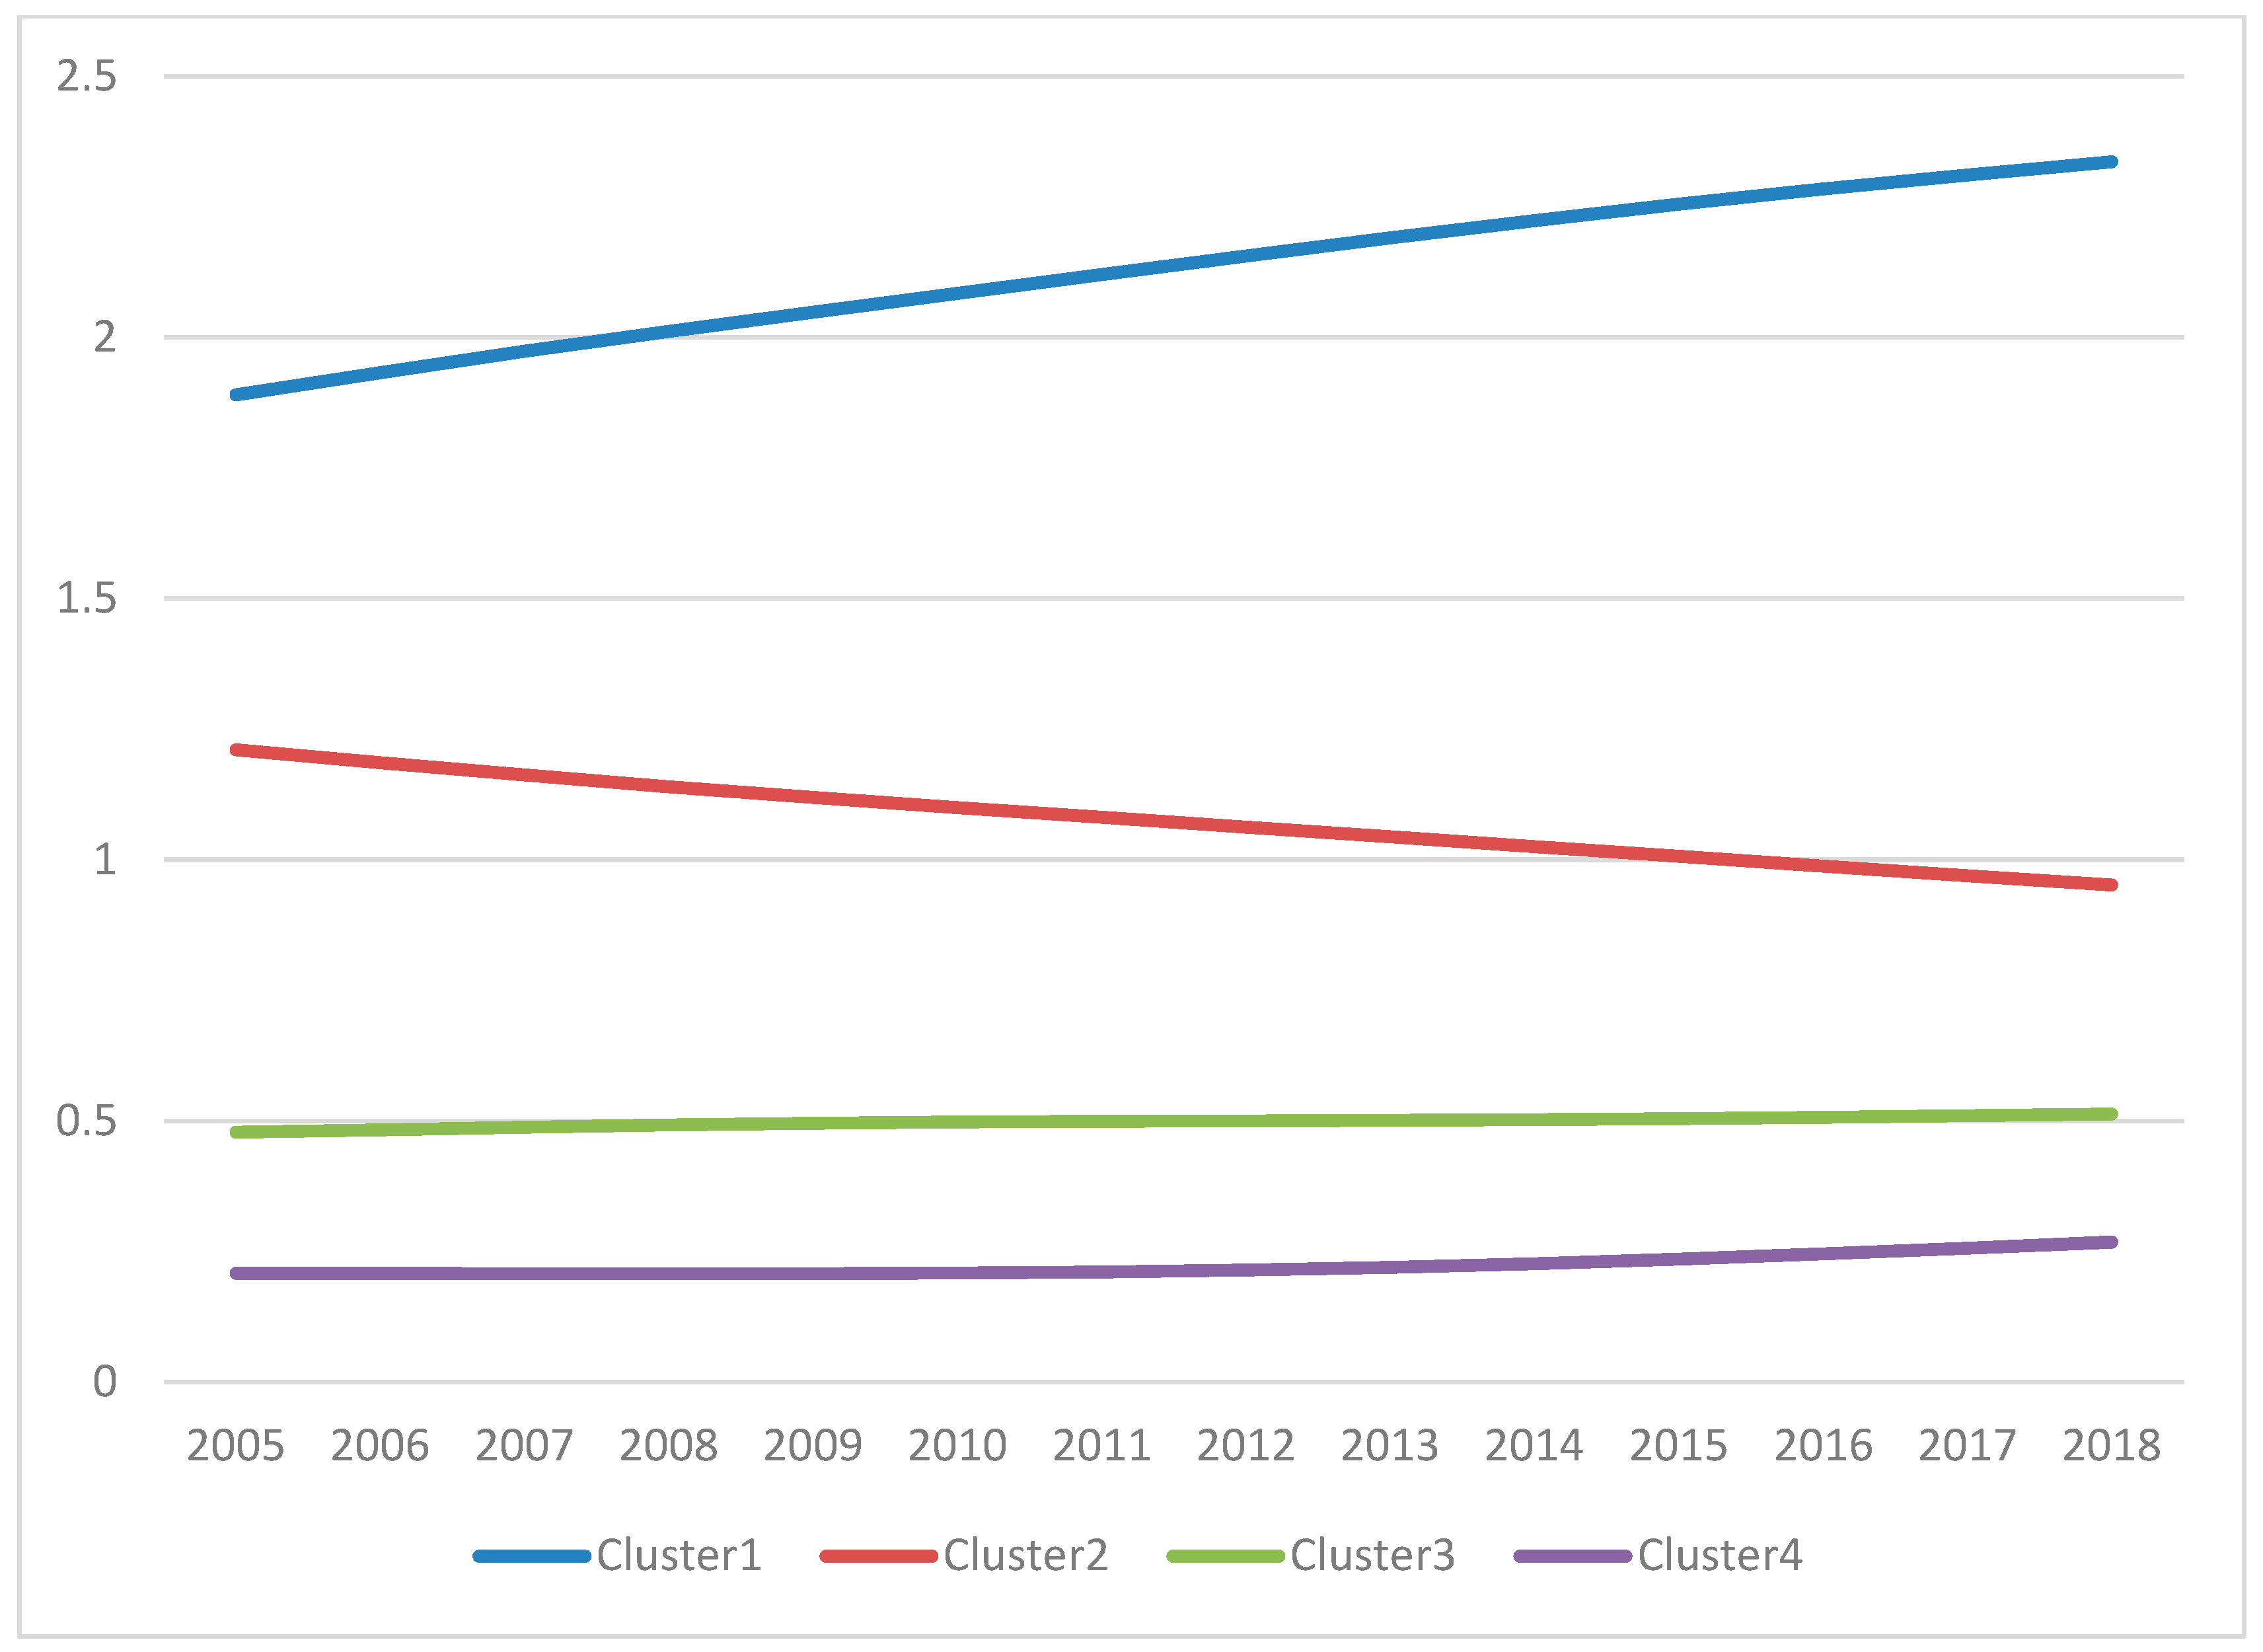
Figure 7, Figure 8 and Figure 9 plot the transition paths for each of the three indicators of poverty and social exclusion. These graphs show the performance of each club relative to the panel average. Thus, a declining transition path of the corresponding indicator for a given club cannot be interpreted as a decrease in the absolute value of this indicator, but rather as a decrease in the indicator relative to the average behaviour of the whole panel, represented in the figure by the value of 1. Therefore, these graphs are a useful way to gauge the degree of divergence among clubs and to determine when, and for how long, this divergence takes place. Divergence among clubs is clear in all three indicators. Thus, not only is there club convergence, but there is no tendency for the clubs to convergence. Poverty and social cohesion indicators show a multi-speed Europe, casting doubt on the sustainability of the overall convergence process in the EU.
6. Conclusions
Economic convergence has long been a declared objective of the EU and considered the fundamental mechanism for achieving socioeconomic cohesion. The sustainability of this convergence process is necessary to ensure the smooth functioning of the integrated area. The recent economic crisis increased the divergence between Member States not only in economic outcomes, but also in social aspects, such as working and living conditions. In March 2010, the European Commission launched the Europe 2020 strategy to promote smart, sustainable and inclusive growth in the EU. This initiative aimed to strengthen the EU economy and enhance social convergence alongside economic convergence.
This paper assesses the poverty and social exclusion pillar of the Europe 2020 strategy by testing whether convergence across EU Member States has increased in the three headline indicators of this pillar: at-risk-of-poverty rate, number of persons living in households with low work intensity, and severe material deprivation rate. If national objectives in poverty and social exclusion headline indicators of the Europe 2020 strategy are being achieved, convergence should be observed across the EU countries. However, it may be the case that convergence is observed not for all Member States, but rather for a group of countries sharing similar features, with the possible emergence of geographical clusters. This convergence in groups is referred to as club convergence in the literature, and it is a possible form of conditional convergence. The existence of convergence clubs would reveal asymmetries in the socioeconomic performance of Member States, pointing towards the idea of a multi-speed Europe and casting doubt on the sustainability of the social cohesion in the EU. We evaluate the existence of clubs in poverty and social exclusion indicators by applying the methodology proposed by Phillips and Sul [10,11].
Three conclusions emerge from our analysis. First, convergence in poverty and social indicators takes place in form of clubs. Overall, the clubs are heterogeneous and do not display a geographic east‒west or north‒south pattern. Second, convergence in each cluster usually takes place by means of a catching-up process, with the eastern countries converging on their western counterparts. Third, the different clubs in each indicator are diverging from one another. This divergent behaviour reflects the existence of a multi-speed Europe with very different success in achieving poverty reduction and enhancing social inclusion. This divergent pattern calls into question the sustainability of the overall convergence process in the EU.
Author Contributions
M.M. and J.O. carried out the econometric analysis. J.Á.L. and A.M. did the discussion of results. All authors were involved in writing the paper. All authors have read and agreed to the published version of the manuscript.
Funding
This research was funded by Ministerio de Ciencia, Innovación y Universidades grant number PGC2018-095072-B-I00, Ministerio de Economía, Industria y Competitividad, Agencia Estatal de Investigación’ (AEI) Spain and ‘Fondo Europeo de Desarrollo Regional’ (FEDER) grant number MINEIC-AEI-FEDER ECO2017-83255-C3-3-P, Universitat Jaume I grant number UJI-B2017-33, and Generalitat Valenciana grant number PROMETEO/2018/102.
Acknowledgments
J.Á.L. acknowledges financial support from “Ministerio de Ciencia, Innovación y Universidades” through PGC2018-095072-B-I00 project. J.O. acknowledges the MINEIC-AEI-FEDER ECO2017-83255-C3-3-P project from ‘Ministerio de Economía, Industria y Competitividad’ (MINEIC), ‘Agencia Estatal de Investigación’ (AEI) Spain and ‘Fondo Europeo de Desarrollo Regional’ (FEDER). J.O. and M.M. are grateful for support from the University Jaume I research project UJI-B2017-33. J.O. also acknowledges the Generalitat Valenciana project PROMETEO/2018/102.
Conflicts of Interest
The authors declare no conflict of interest.
Appendix A
Figure A1.
At-risk-of-poverty rate after social transfers (2005–2018).

Figure A2.
People living in households with very low work intensity (2005–2018).

Figure A3.
Severe material deprivation rate (2005–2018).


Table A1.
Descriptive statistics: At-risk-of-poverty rate after social transfers (2005–2018).
| Country | Mean | Std. Dev. | Min | Max | 2018 |
|---|---|---|---|---|---|
| Austria | 13.97 | 0.92 | 12 | 15.2 | 14.3 |
| Belgium | 15.17 | 0.52 | 14.6 | 16.4 | 16.4 |
| Bulgaria | 21.37 | 1.44 | 18.4 | 23.4 | 22 |
| Cyprus | 15.50 | 0.54 | 14.4 | 16.2 | 15.4 |
| Czechia | 9.45 | 0.51 | 8.6 | 10.4 | 9.6 |
| Denmark | 12.19 | 0.50 | 11.7 | 13.3 | 12.7 |
| Estonia | 19.47 | 1.92 | 15.8 | 21.9 | 21.9 |
| Finland | 12.62 | 0.80 | 11.5 | 13.8 | 12 |
| France | 13.35 | 0.42 | 12.5 | 14.1 | 13.4 |
| Germany | 15.44 | 1.39 | 12.2 | 16.7 | 16 |
| Greece | 20.80 | 1.32 | 18.5 | 23.1 | 18.5 |
| Hungary | 13.77 | 1.20 | 12.3 | 15.9 | 12.8 |
| Italy | 19.50 | 0.62 | 18.4 | 20.6 | 20.3 |
| Ireland | 16.35 | 1.34 | 15 | 19.7 | 15.6 |
| Latvia | 21.84 | 2.34 | 19 | 26.4 | 23.3 |
| Lithuania | 20.62 | 1.40 | 18.6 | 22.9 | 22.9 |
| Luxembourg | 15.27 | 1.71 | 13.4 | 18.7 | 18.3 |
| Malta | 15.5 | 0.84 | 14.2 | 16.8 | 16.8 |
| Netherlands | 11.17 | 1.16 | 9.7 | 13.3 | 13.3 |
| Poland | 17.30 | 1.40 | 14.8 | 20.5 | 14.8 |
| Portugal | 18.46 | 0.68 | 17.3 | 19.5 | 17.3 |
| Slovenia | 13.03 | 1.11 | 11.3 | 14.5 | 13.3 |
| Slovakia | 12.2 | 0.86 | 10.6 | 13.3 | 12.4 |
| Spain | 20.89 | 0.88 | 19.7 | 22.3 | 21.5 |
| Sweden | 14.4 | 2.20 | 9.5 | 16.4 | 16.4 |
| United Kingdom | 17.22 | 1.14 | 15.9 | 19 | 17 |
Table A2.
Descriptive statistics: People living in households with very low work intensity (2005–2018).
Table A2.
Descriptive statistics: People living in households with very low work intensity (2005–2018).
| Country | Mean | Std. Dev. | Min | Max | 2018 |
|---|---|---|---|---|---|
| Austria | 7.92 | 0.55 | 7.1 | 9.1 | 7.3 |
| Belgium | 13.66 | 1.07 | 11.7 | 15.1 | 12.1 |
| Bulgaria | 11.47 | 2.71 | 6.9 | 16 | 9 |
| Cyprus | 6.70 | 2.71 | 3.7 | 10.9 | 8.6 |
| Czechia | 6.95 | 1.25 | 4.5 | 8.9 | 4.5 |
| Denmark | 10.42 | 1.06 | 8.5 | 12.2 | 11.1 |
| Estonia | 7.22 | 1.68 | 5.2 | 10 | 5.2 |
| Finland | 9.65 | 1.07 | 7.5 | 11.4 | 10.8 |
| France | 8.79 | 0.62 | 8 | 9.9 | 8 |
| Germany | 10.57 | 1.43 | 8.1 | 13.6 | 8.1 |
| Greece | 12.23 | 4.45 | 6.6 | 18.2 | 14.6 |
| Hungary | 10.83 | 2.56 | 5.7 | 13.6 | 5.7 |
| Italy | 11.05 | 0.90 | 9.2 | 12.8 | 11.3 |
| Ireland | 18.56 | 4.02 | 12.9 | 24.2 | 16.2 |
| Latvia | 8.66 | 2.29 | 5.4 | 12.6 | 7.6 |
| Lithuania | 9.22 | 1.84 | 6.1 | 12.7 | 9 |
| Luxembourg | 6.03 | 0.90 | 4.7 | 8.3 | 8.3 |
| Malta | 8.71 | 1.23 | 5.5 | 9.9 | 5.5 |
| Netherlands | 9.34 | 0.79 | 8.2 | 10.9 | 8.6 |
| Poland | 7.99 | 2.53 | 5.6 | 14.3 | 5.6 |
| Portugal | 8.55 | 2.08 | 6 | 12.2 | 7.2 |
| Slovenia | 7.16 | 0.97 | 5.4 | 8.7 | 5.4 |
| Slovakia | 6.56 | 0.91 | 5.2 | 7.9 | 5.4 |
| Spain | 11.38 | 3.90 | 6.4 | 17.1 | 10.7 |
| Sweden | 8.24 | 1.03 | 6 | 9.4 | 9.1 |
| United Kingdom | 11.78 | 1.16 | 10.1 | 13.2 | 10.1 |
Table A3.
Descriptive statistics: Severe material deprivation rate (2005–2018).
| Country | Mean | Std. Dev. | Min | Max | 2018 |
|---|---|---|---|---|---|
| Austria | 3.89 | 0.76 | 2.8 | 5.9 | 2.8 |
| Belgium | 5.68 | 0.49 | 4.9 | 6.5 | 4.9 |
| Bulgaria | 41.61 | 11.05 | 20.9 | 57.7 | 20.9 |
| Cyprus | 12.62 | 2.25 | 9.1 | 16.1 | 10.2 |
| Czechia | 6.48 | 2.22 | 2.8 | 11.8 | 2.8 |
| Denmark | 2.94 | 0.51 | 2 | 3.7 | 3.4 |
| Estonia | 6.72 | 2.46 | 3.8 | 12.4 | 3.8 |
| Finland | 2.89 | 0.53 | 2.1 | 3.8 | 2.8 |
| France | 4.97 | 0.48 | 4.1 | 5.8 | 4.7 |
| Germany | 4.65 | 0.76 | 3.1 | 5.5 | 3.1 |
| Greece | 16.32 | 4.67 | 11 | 22.4 | 16.7 |
| Hungary | 20.37 | 4.68 | 10.1 | 27.8 | 10.1 |
| Italy | 9.57 | 2.60 | 6.4 | 14.5 | 8.5 |
| Ireland | 6.59 | 1.82 | 4.5 | 9.9 | 5.2 |
| Latvia | 22.38 | 8.41 | 9.5 | 39.9 | 9.5 |
| Lithuania | 17.27 | 5.84 | 11.1 | 32.6 | 11.1 |
| Luxembourg | 1.27 | 0.43 | 0.5 | 2 | 1.3 |
| Malta | 6.07 | 2.53 | 3 | 10.3 | 3 |
| Netherlands | 2.31 | 0.48 | 1.4 | 3.2 | 2.4 |
| Poland | 14.62 | 8.38 | 4.7 | 33.8 | 4.7 |
| Portugal | 8.93 | 1.29 | 6 | 10.9 | 6 |
| Slovenia | 5.67 | 0.89 | 3.7 | 6.7 | 3.7 |
| Slovakia | 11.47 | 4.17 | 7 | 22.1 | 7 |
| Spain | 5.07 | 1.09 | 3.5 | 7.1 | 5.4 |
| Sweden | 1.66 | 0.47 | 0.8 | 2.3 | 1.6 |
| United Kingdom | 5.37 | 1.49 | 3.3 | 8.3 | 4.6 |
References
- Barro, R.; Sala-i-Martin, X. Economic Growth, 2nd ed.; The MIT Press: Boston, MA, USA, 2003. [Google Scholar]
- Díaz del Hoyo, J.L.; Dorrucci, E.; Heinz, F.F.; Muzikarova, S. Real Convergence in the Euro Area: A Long-Term Perspective, Occasional Paper Series (European Central Bank); European Central Bank: Frankfurt, Germany, 2017. [Google Scholar]
- Monfort, M.; Cuestas, J.C.; Ordóñez, J. Real convergence in Europe: A cluster analysis. Econ. Model. 2013, 33, 689–694. [Google Scholar] [CrossRef] [Green Version]
- Alcidi, C.; Núñez Ferrer, J.; Di Salvo, M.; Musmeci, R.; Pilati, M. Income Convergence in the EU: A Tale of Two Speeds. CEPS commentary, 9 January 2018. [Google Scholar]
- Ordóñez, J.; Sala, H.; Silva, J.I. Real unit labour costs in Eurozone countries: Drivers and clusters. Iza J. Eur. Labor Stud. 2015, 4, 1–19. [Google Scholar] [CrossRef] [Green Version]
- Monfort, M.; Ordóñez, J.; Sala, H. Inequality and Unemployment Patterns in Europe: Does Integration Lead to (Real) Convergence? Open Econ. Rev. 2018, 29, 703–724. [Google Scholar] [CrossRef]
- Moscovici, P. Making Economic and Social Convergence our Political Priority, Closing Remarks, Reinventing Convergence: Towards Economic Resilient Structures; European Commission: Brussels, Belgium, 2017.
- European Commission Europe 2020. A Strategy for Smart, Sustainable and Inclusive Growth; European Commission: Brussels, Belgium, 2010.
- European Commission. Smarter, Greener, More Inclusive? Indicators to support the Europe Europe 2020 Strategy; European Commission: Brussels, Belgium, 2019.
- Phillips, P.; Sul, D. Transition Modeling and Econometric Convergence Tests. Econometrica 2007, 75, 1771–1855. [Google Scholar] [CrossRef] [Green Version]
- Phillips, P.; Sul, D. Economic Transition and Growth. J. Appl. Econ. 2009, 24, 1153–1185. [Google Scholar] [CrossRef] [Green Version]
- Solow, R. A Contribution to the Theory of Economic Growth. Q. J. Econ. 1956, 70, 65–94. [Google Scholar] [CrossRef]
- Swan, T. Economic Growth and Capital Accumulation. Econ. Rec. 1956, 32, 344–361. [Google Scholar] [CrossRef]
- Bénabou, R. Inequality and Growth. In NBER Macroeconomics Annual; Bernanke, B.S., Rotemberg, J.J., Eds.; Massachusetts Institute Technology: Cambridge, MA, USA, 1996; pp. 11–92. [Google Scholar]
- Quah, D. Twin Peaks: Growth and Convergence in Models of Distributional Dynamics. Econ. J. 1996, 106, 1045–1055. [Google Scholar] [CrossRef] [Green Version]
- Armstrong, H.W. Convergence among regions of the European Union, 1950–1990. Pap. Reg. Sci. 1995, 74, 143–152. [Google Scholar] [CrossRef]
- Mora, T. Factors conditioning the formation of European regional convergence clubs. Ann. Reg. Sci. 2008, 42, 911–927. [Google Scholar] [CrossRef]
- Bartkowska, M.; Riedl, A. Regional convergence clubs in Europe: Identification and conditioning factors. Econ. Model. 2012, 29, 22–31. [Google Scholar] [CrossRef] [Green Version]
- Borsi, M.T.; Metiu, N. The evolution of economic convergence in the European Union. Empir. Econ. 2015, 48, 657–681. [Google Scholar] [CrossRef]
- Croci, A.E.; Farina, F. Current account imbalances and systemic risk within a monetary union. J. Econ. Behav. Organ. 2012, 83, 647–656. [Google Scholar]
- De Grauwe, P.; Ji, Y. Self-fulfilling crises in the Eurozone: An empirical test. J. Int. Money Financ. 2013, 34, 15–36. [Google Scholar] [CrossRef]
- Krugman, P. Geography and Trade; Massachusetts Institute Technology: Cambridge, MA, USA, 1991. [Google Scholar]
- Midelfart, H.K.; Overman, H.G.; Venables, A.J. Monetary union and the economic geography of Europe. J. Common Mark. Stud. 2003, 41, 847–868. [Google Scholar] [CrossRef]
- Agell, J. On the determinants of labour market institutions: Rent seeking vs. social insurance. Ger. Econ. Rev. 2002, 4, 29–48. [Google Scholar] [CrossRef] [Green Version]
- Carlino, G.; Mills, L. Are US Incomes Converging? A Time Series Analysis. J. Monet. Econ. 1993, 32, 335–346. [Google Scholar] [CrossRef]
- Bernard, A.B.; Durlauf, S.N. Convergence in International Output. J. Appl. Econ. 1995, 10, 97–108. [Google Scholar] [CrossRef] [Green Version]
- Bernard, A.B.; Durlauf, S.N. Interpreting Tests of Convergence Hypothesis. J. Econ. 1996, 71, 161–173. [Google Scholar] [CrossRef] [Green Version]
- Hodrick, R.J.; Prescott, E.C.; Postwar, U.S. Business Cycles: An Empirical Investigation. J. Money Credit Bank. 1997, 29, 1–16. [Google Scholar] [CrossRef]
Figure 1.
Radial graph at-risk-of-poverty rate indicator: first club.

Figure 2.
Radial graph at-risk-of-poverty rate indicator: second club.

Figure 3.
Radial graph number of persons living in households with very low work intensity indicator: second club.
Figure 3.
Radial graph number of persons living in households with very low work intensity indicator: second club.

Figure 4.
Radial graph number of persons living in households with very low work intensity indicator: third club.
Figure 4.
Radial graph number of persons living in households with very low work intensity indicator: third club.

Figure 5.
Radial graph severe material deprivation rate indicator: second club.

Figure 6.
Radial graph severe material deprivation rate indicator: third club.

Figure 7.
Clubs’ transition functions: At-risk-of-poverty rate after social transfers (2005–2018).

Figure 8.
Clubs’ transition functions: People living in households with very low work intensity (2005–2018).
Figure 8.
Clubs’ transition functions: People living in households with very low work intensity (2005–2018).

Figure 9.
Clubs’ transition functions: Severe material deprivation rate (2005–2018).

Table 1.
Club analysis (2005–2018).
| At-Risk-of-Poverty Rate after Social Transfers | ||
| Log t | t Statistic | Clubs |
| 0.019 | 0.572 | First club: Bulgaria, Estonia, Latvia, Lithuania, Spain, and Sweden |
| 0.574 | 2.009 | Second club: Greece, Italy, and Luxembourg |
| 0.082 | 1.693 | Third club: Belgium, Germany, Ireland, Malta, Poland, Portugal, and the United Kingdom |
| 0.344 | 1.770 | Fourth club: Austria, Cyprus, Hungary, the Netherlands, and Slovenia |
| −0.115 | −0.920 | Fifth club: France and Slovakia |
| 1.547 | 1.176 | Sixth club: Denmark and Finland |
| - | - | No club convergence: Czechia |
| People Living in Households with Very Low Work Intensity | ||
| Log t | t Statistic | Clubs |
| 0.444 | 1.301 | First club: Greece, Ireland, and Spain |
| −0.174 | −1.001 | Second club: Belgium, Bulgaria, Cyprus, Denmark, Finland, France, Germany, Italy, Latvia, Lithuania, the Netherlands, Portugal, Sweden, and the United Kingdom |
| 0.453 | 1.089 | Third club: Austria, Hungary, and Luxembourg |
| 0.131 | 0.369 | Fourth club: Malta and Slovenia |
| 0.620 | 3.201 | Fifth club: Czechia, Estonia, Poland, and Slovakia |
| Severe Material Deprivation Rate | ||
| Log t | t Statistic | Clubs |
| −0.061 | −0.500 | First club: Bulgaria, Cyprus, Greece, Hungary, and Lithuania |
| 0.036 | 0.205 | Second club: Italy, Latvia, and Spain |
| 0.503 | 3.154 | Third club: Belgium, Ireland, Malta, Poland, Portugal, Slovakia, and the United Kingdom |
| 0.002 | 0.010 | Fourth club: Czechia, Denmark, Estonia, France, and Slovenia |
| 0.401 | 1.429 | Fifth club: Austria, Germany, and the Netherlands |
| 0.367 | 1.406 | Sixth club: Finland and Luxembourg |
| - | - | No club convergence: Sweden |
Table 2.
Testing for club merging (2005–2018).
| At-Risk-of-Poverty Rate after Social Transfers | ||
| Log t | t Statistic | Clubs |
| 0.040 | 0.487 | Club 1 + 2 |
| −0.491 | −10.172 | Club 2 + 3 |
| −0.064 | −0.707 | Club 3 + 4 |
| 0.061 | 0.435 | Club 4 + 5 |
| −0.970 | −9.582 | Club 5 + 6 |
| −0.742 | −6.665 | Club 6 + 7 |
| People Living in Households with Very Low Work Intensity | ||
| Log t | t Statistic | Clubs |
| −0.787 | −9.806 | Club 1 + 2 |
| −0.405 | −2.553 | Club 2 + 3 |
| 0.101 | 0.285 | Club 3 + 4 |
| −0.518 | −9.049 | Club 4 + 5 |
| Severe Material Deprivation Rate | ||
| Log t | t Statistic | Clubs |
| −0.330 | −3.518 | Club 1 + 2 |
| −0.151 | −1.587 | Club 2 + 3 |
| −0.215 | −2.336 | Club 3 + 4 |
| −0.061 | −0.335 | Club 4 + 5 |
| −0.276 | −1.615 | Club 5 + 6 |
Table 3.
Final club analysis (2005–2018).
| At-Risk-of-Poverty Rate after Social Transfers | ||
| Log t | t Statistic | Clubs |
| 0.040 | 0.487 | First club: Bulgaria, Estonia, Greece, Italy, Latvia, Lithuania, Luxembourg, Spain, and Sweden |
| −0.064 | −0.707 | Second club: Austria, Belgium, Cyprus, Germany, Hungary, Ireland, Malta, the Netherlands, Poland, Portugal, Slovenia, and the United Kingdom |
| −0.115 | −0.920 | Third club: France and Slovakia |
| 1.547 | 1.176 | Fourth club: Denmark and Finland |
| - | - | No club convergence: Czechia |
| People Living in Households with Very Low Work Intensity | ||
| Log t | t Statistic | Clubs |
| 0.444 | 1.301 | First club: Greece, Ireland, and Spain |
| −0.174 | −1.001 | Second club: Belgium, Bulgaria, Cyprus, Denmark, Finland, France, Germany, Italy, Latvia, Lithuania, the Netherlands, Portugal, Sweden, and the United Kingdom |
| 0.101 | 0.285 | Third club: Austria, Hungary, Luxembourg, Malta, and Slovenia |
| 0.620 | 3.201 | Fourth club: Czechia, Estonia, Poland, and Slovakia |
| Severe Material Deprivation Rate | ||
| Log t | t Statistic | Clubs |
| −0.061 | −0.500 | First club: Bulgaria, Cyprus, Greece, Hungary, and Lithuania |
| −0.151 | −1.587 | Second club: Belgium, Italy, Ireland, Latvia, Malta, Poland, Portugal, Slovakia, Spain, and the United Kingdom |
| −0.061 | −0.335 | Third club: Austria, Czechia, Denmark, Estonia, France, Germany, the Netherlands, and Slovenia |
| 0.367 | 1.406 | Fourth club: Finland and Luxembourg |
| - | - | No club convergence: Sweden |
© 2020 by the authors. Licensee MDPI, Basel, Switzerland. This article is an open access article distributed under the terms and conditions of the Creative Commons Attribution (CC BY) license (http://creativecommons.org/licenses/by/4.0/).
Share and Cite
MDPI and ACS Style
Lafuente, J.Á.; Marco, A.; Monfort, M.; Ordóñez, J. Social Exclusion and Convergence in the EU: An Assessment of the Europe 2020 Strategy. Sustainability 2020, 12, 1843. https://0-doi-org.brum.beds.ac.uk/10.3390/su12051843
AMA Style
Lafuente JÁ, Marco A, Monfort M, Ordóñez J. Social Exclusion and Convergence in the EU: An Assessment of the Europe 2020 Strategy. Sustainability. 2020; 12(5):1843. https://0-doi-org.brum.beds.ac.uk/10.3390/su12051843
Chicago/Turabian StyleLafuente, Juan Ángel, Amparo Marco, Mercedes Monfort, and Javier Ordóñez. 2020. "Social Exclusion and Convergence in the EU: An Assessment of the Europe 2020 Strategy" Sustainability 12, no. 5: 1843. https://0-doi-org.brum.beds.ac.uk/10.3390/su12051843
Note that from the first issue of 2016, this journal uses article numbers instead of page numbers. See further details here.