Archaeological Sites in Small Towns—A Sustainability Assessment of Northumberland County

Department of Geography and Environmental Studies, Ryerson University, Toronto, ON M5B 1W7, Canada
Sustainability 2020, 12(5), 2018; https://0-doi-org.brum.beds.ac.uk/10.3390/su12052018
Submission received: 14 December 2019
/
Revised: 29 February 2020
/
Accepted: 3 March 2020
/
Published: 6 March 2020
(This article belongs to the Special Issue Small and Medium-Size Towns Across the World: From the Past into the Future (SMTs))
Abstract
:Background: Land-use change, resulting from urban expansion, has led to the unprecedented importance of rethinking our interactions with the environment in general. The consequences of anthropogenic activity on natural land, as well as sustainable land use types, is a significant concern to the detriment of small towns. In this article, I assess the changes in the urban footprint morphology of Northumberland County while evaluating the consequences of urban fragmentation on archaeological sites. Northumberland has a total population of 85,598 divided into seven municipalities and the Alderville First Nation reserve. Northumberland County is a commuting distance of one hour from Toronto, one of North America’s most important economic hubs. It is of the highest importance to measure and understand the current characteristics of land-use change and its impacts on the sustainability of small towns and local communities. Methods: A total of archaeological sites are used to test the impacts of urbanization and land-use change throughout the perimeter of Northumberland county. Spatial analysis is conducted employing spatial autocorrelation techniques (global and local) to assess the existence of hotspots of archaeological sites and the potential endangerment of these sites due to urban pressure. A hexagonal topology is used to derive a regional understanding of impacted regions within the county, allowing the richness of archaeological heritage sites as well as the possible concerns of these spatial clusters to be examined. Results: It is shown that a significant number of archaeological sites are present in Northumberland county, with a clear indication of a hotspot around Rice Lake. Future urbanization as well as land-use fragmentation may have an impact on the sustainability of these archaeological sites. It is shown that hexagonal geometries may establish relevant spatial surfaces to compare urban and archaeological sites as criteria to understand the endangerment of archaeological sites. The availability of the Global Urban Footprint (GUF) creates a particularly rigorous framework for the detection of impact on archaeological sites. Conclusion: The findings suggest that archaeological sites in small towns can benefit from high-resolution urban land-use footprints to detect impacts on archaeological sites and the relations of land-use change and intrasite management. This is of utmost importance in times of significant anthropogenic change brought by increasing urban pressure on small and medium-sized towns.
1. Introduction
1.1. GIS, Archaeology and Small Towns
Archaeological material evidence has led to the collection of spatial data related to anthropogenic and archaeological artefacts with a significant level of geographical detail [1]. Archaeological material evidence, as is the case for archaeological sites with specific spatial characteristics, may offer specific spatial characteristics [2]. The combination of anthropogenic sites at a spatial level supports not only the understanding of our territorial identity but incites the possibility of envisioning history as a product for regional development [3]. Archaeological sites foster a vital role in the historical knowledge of local communities and offer differentiation between small towns. Canadian archaeology brings a well-documented richness of anthropological interactions since prehistory [4]. The available remains from pre and post-settlement sites paint a complex picture of archaeological wealth that should be a part of our shared heritage and identity [5]. The aboriginal identity, in particular its richness and historical importance for the Canadian identity, is a driving force of the very core of Canadian values, sustainability and shared living heritage [6].
The region of southern Ontario has been a cradle for different societies, and inter-site analysis allows for an understanding of the topology of human behavior since the Paleo-Indian occupation [7]. The combination of archaeological evidence, together with site location, allows understanding of regional patterns of spatial topology merged with environmental characteristics [8,9,10]. By employing spatial analysis, archaeological evidence may bring the opportunity to assess past territorial behavior, as well as document our cultural complexity [11].
Through a systematic analysis of archaeological evidence, territorial uniqueness may further enable understanding of how to gear the service sector to provide the advantage of using cultural heritage in relevant economies such as tourism, and assure that the archaeological sites are protected and remain an intangible value for generations to come [12]. Within the context of southern Ontario, the richness of local and regional history may be explored efficiently by understanding the typology and distribution of archaeological sites. This is furthered by the potential of sensitizing society to the existing heritage, and by offering solutions to meso-economic issues, sustainable and more integrated directions of regional development [13]. The effects of tourism, however, must be carefully analyzed as to not overburden the carrying capacity of landscape, environment and ecosystems.
Excessive tourism may lead unavoidably to land-use change, pollution and the vulnerability of ecosystems [14,15,16]. The understanding of cultural legacy at the regional level starts with the application of spatial technologies in the context of detecting patterns of the urban footprint concerning the territorial dimension of land use planning [17,18]. Although at times left unconsidered in Canadian planning, archaeology does have an important role and has long relied on survey data, remote sensing [19], spatial analysis [20] and, recently, agent based models [21] and other techniques such as machine learning and artificial intelligence [22] to facilitate the historical understanding of past landscapes. Preservation of archaeological sites allow sustainable landscapes to be supported, particularly within small towns that rely on (i) product differentiation, (ii) seasonal tourism, (iii) endogenous economies and (iv) conservation of their small-town landscape. Archaeological sites can have an utmost important role and support local communities. By protecting archaeological sites, small towns have the chance to renew their position of unique hubs for historical and cultural landscapes.
1.2. The Importance of Aboriginal Archaeological Sites in Ontario
The complexity and controversy of the first settlement of the Americas is predominantly a result of historical, cultural, archaeological and genetic evidence [23,24], where present technology is used to gain a better understanding of this century-old debate. The controversies of the first settlement revolve around three distinct paradigms relating to the early humans settled in the New World [25]. These questions are best answered by the assessment of distinct hypotheses that build up the framework of archaeological and cultural evidence among which the following are the most relevant: (a) the Clovis hypothesis [26], (b) the coastal entry hypothesis [27] and (c) the Solutrean Hypothesis [28]. The Clovis hypothesis sets out as the most commonly accepted hypothesis that the first settlement of the Americas started during the late Ice Age when hunter–gatherers were entering North America through the Bering Land Bridge. The geomorphological characteristics of the Bering Land Bridge join the regions of Siberia and Alaska. With the variation of sea level, during the Wisconsinan glaciation (between 75,000 to 11,000 BCE), this became a possible migration path from Asia. With the colonization of Beringia potentially sometime between 20,000 and 10,000 BCE, a path of possible entry between the glaciers allowed entry to North America [29]. This allowed the Clovis people, as big-game hunters, to follow along with the corridor into the Great Plains, although with limitations concerning the geographical extent due to ice sheets further north. The apparent extinction of large animals in the Americas [30] corroborates with this settlement of humans in North America sometime around 12,000 [31].
With growing evidence, the coastal entry hypothesis suggests arrival by the first humans in America by boats [32]. Pre-Clovis cultures in South and North America seem remnant of an earlier date than the recent ice age [33]. Material evidence brought from circa 35,000 BCE identifies the possibility of navigating inland by boats through the coasts and rivers of Central and South America. The geographical choice of settlement in the warmer regions leads up to the potential of pre-Clovis people expanding northwards during the ice recession around 11,000 years ago.
For more than a century have similarities between Siberians and North American Indians been pointed out. It is, however, an analysis performed by [34] in regards to dental characteristics that disputes the concept of sinodonty, a morphological similarity between northern Asia and the Americas, with potential links to over 40,000 BCE. Very recent findings strongly connect, through archaeology again, the pre-Clovis timeline through findings of hammerstones and stone anvils dating to 130,000 years ago [35]. Nevertheless, a response publication by Haynes [36], debates the stratigraphic characteristics of these findings, shedding doubt on the archaeological evidence itself found in the Cerutti Mastodon site. This clearly shows the juxtaposing positions on pre-Clovis and Clovis humans and is a very recent example of the complex decade-old debate of the first settlement in the Americas. Ontario may have a leading role in regard to the spatial morphology through archaeological heritage to better understand prehistorical site distribution. It is through aboriginal history and archaeology that we may have a better idea of our Ontario’s prehistorical origins. The exploration of these subjects brings a picture of intangible heritage and an opportunity for cherishing our past in the remote and rural landscape of small towns.
2. Study Area
Northumberland County is an upper-tier level of municipal government situated on the north shore of Lake Ontario, east of Toronto in Central Ontario. It comprises the town of Cobourg; three municipalities, namely Port Hope, Trent Hills and Brighton; and the three townships of Hamilton, Alnwick/Haldimand and Cramahe. It includes the following towns: Cobourg, Port Hope, Brighton, Campbellford, Colborne, Hastings, Baltimore, Bewdley, Camborne, Centreton, Grafton and Warkworth. From 1802 to 1849, jointly with Durham County, it formed the Newcastle District as well as the United Counties of Northumberland and Durham between 1850 to 1973. It was on January 1st, 1974 that Northumberland County became a county, detaching itself from the Durham County. With a history of the United Empire Loyalists escaping the American Colonies in the 18th century, the crown provided plots of land to settlers. It is important to note that following the War of 1812, some of the towns within Northumberland, particularly Port Hope and Cobourg, became an important commercial center as well as a landing point for European immigrants arriving in steamers.
These unique characteristics have lent to Northumberland county and particularly to the towns of Port Hope and Cobourg, a significant historical character, which remains well documented and maintained. Overall, towns such as Cobourg, as well as the Northumberland County itself, are quite proud of their history and legacy, maintaining an active cultural agenda.
3. Data
3.1. GlobeLand30
GlobeLand30 is a unique project that offers global land cover throughout the world. Created by the National Geomatics Centre of China (NGCC), it provides comprehensive land-use coverage at a resolution of 30 m. With two available time sets (2000 and 2010), image rectification consisted of a total of ten thousand data images gathered from the Landsat Thematic Mapper (TM) and the Enhanced Thematic Mapper Plus (ETM+). Utilizing a pixel-based method, this data holds an accuracy of over 80 percent at a global level.
The global nature of this data allows for a significant amount of distinct analytics that assesses, monitors and quantifies land cover change. For the province of Ontario, GlobeLand30 is a consistent mapping product that permits a thorough understanding of land-use in more remote places. Given the often-unavailable land use coverage outside of highly-dense urban cores, this land use data brings a set of novel explorative analysis in regard to land cover change, possible impacts of urbanization, loss of forest area, impacts on agricultural land and the overall environmental and regional sustainability of the dynamics of artificial land-use change.
3.2. Northumberland’s Urban Footprint
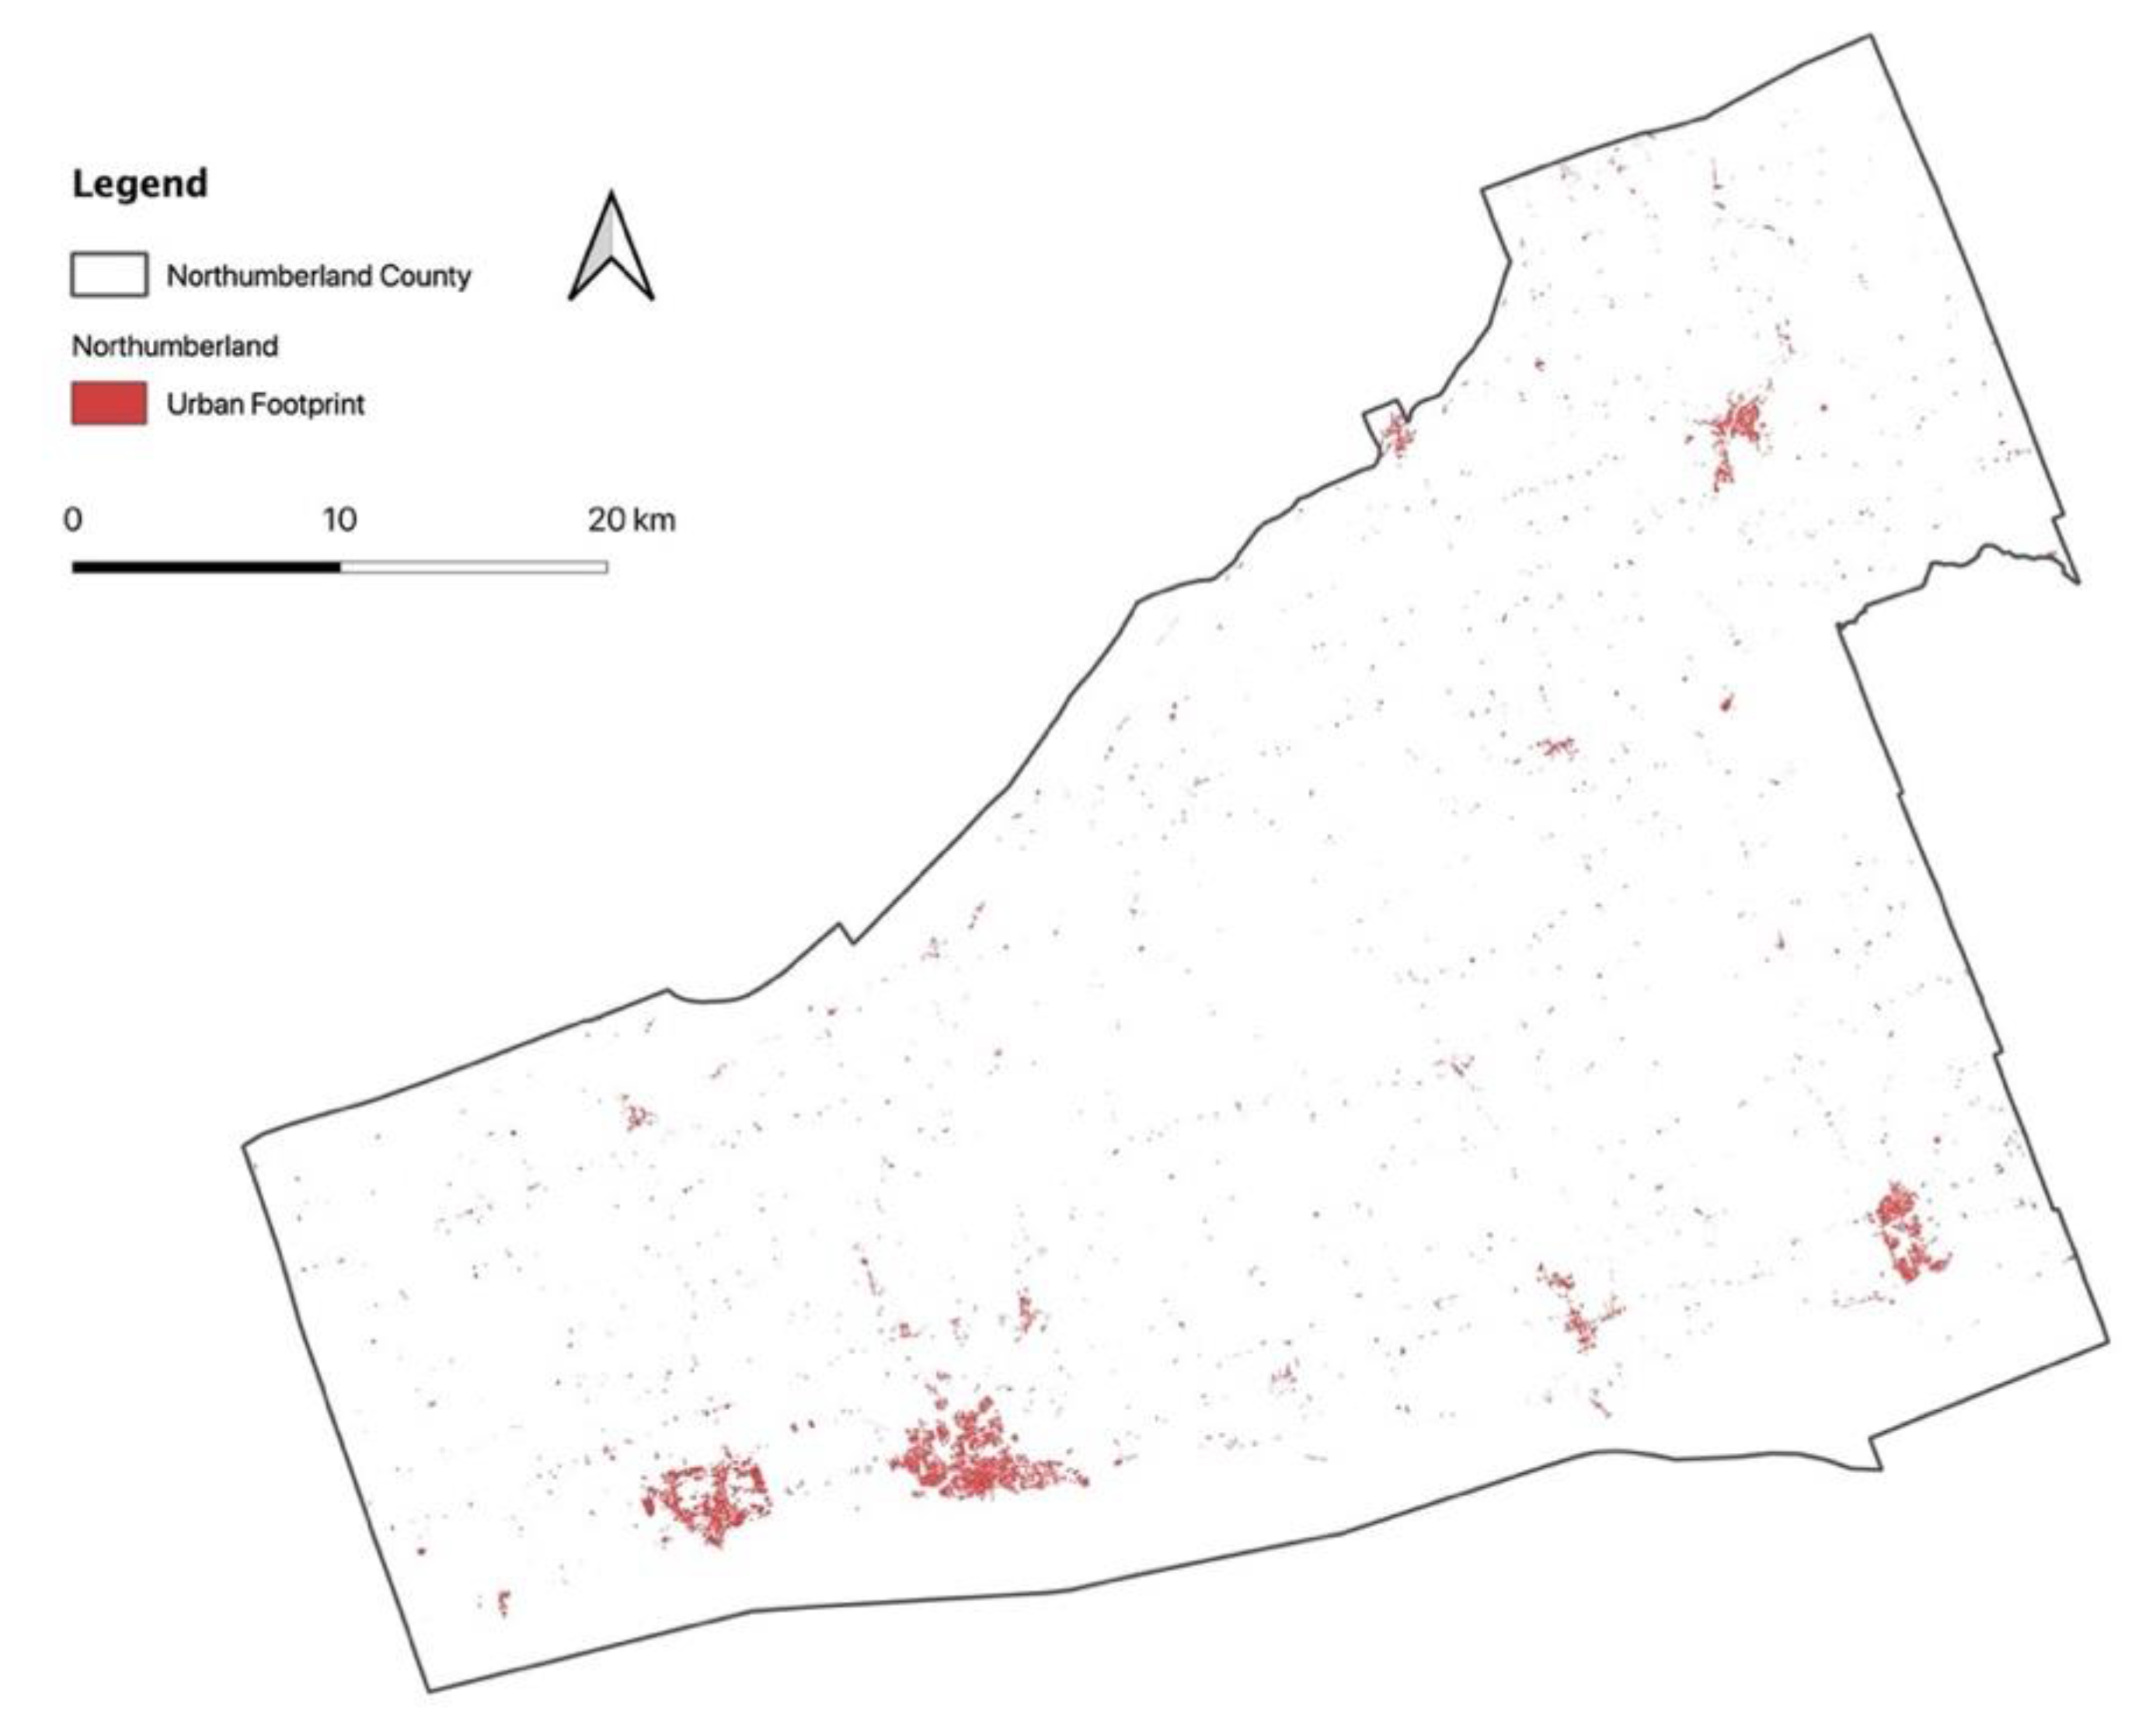
The urban footprint (Figure 1) brings a concise understanding of artificial land and allows for assessment at the global and regional levels [37]. This definition of urban land use is particularly important for the assessment of small towns given their rapid change as well as their sprawl potentialized by economic growth into agricultural land. This is aggravated by the fact that many small towns increasingly become satellites to more massive urban cores, a problem increasingly witnessed in Asia [38,39], potentialized by population growth, which may be expected in the coming decades in Ontario through immigration patterns. The integration of different anthropogenic land activities into the urban footprint allows for a spatial and temporal assessment. This brings a systemic approach to the consequences of urbanization and land-use and impacts on small towns. The urban footprint for Northumberland County was analyzed through the integration of the Global Urban Footprint (GUF) dataset from Germany’s Earth Observation Centre. Input data are single look slant range complex (SSC) TerraSAR-X and TanDEM-X amplitude images acquired in Stripmap mode at 3 m ground resolution [40,41].
3.3. Archaeological Sites
The Archaeological sites were made available by Ontario’s Ministry of Heritage, Sport, Tourism and Culture Studies. The Archaeological site collection consists of a site record for every new site discovered in the province. For the study area, a total of 294 sites were considered encompassing the following affinities (Table 1).
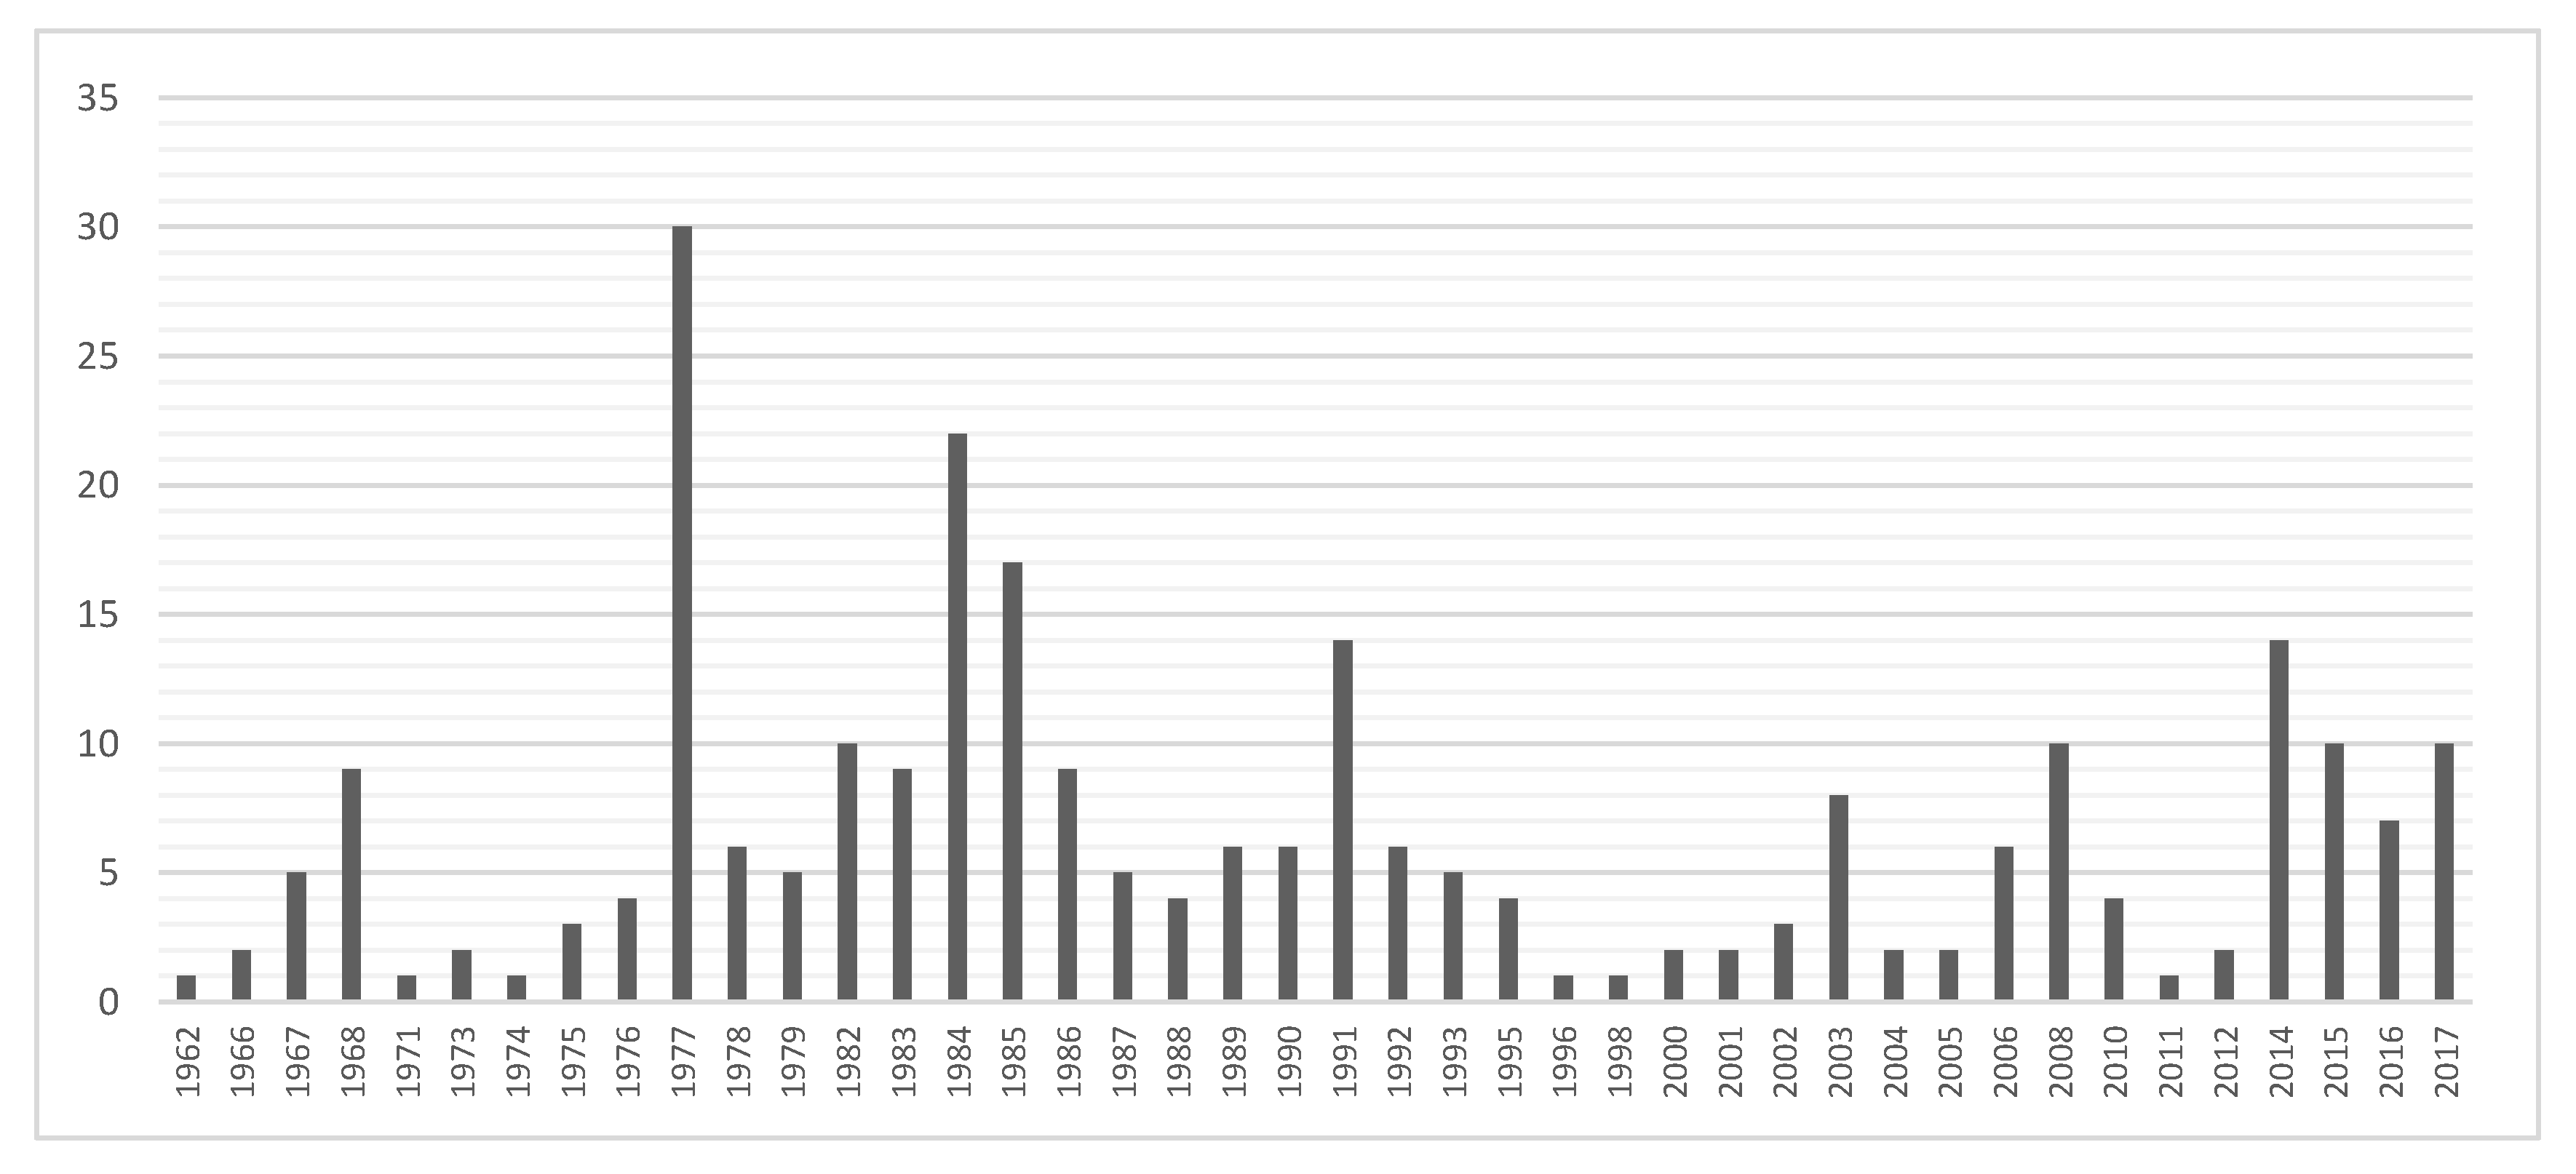
A total of 203 archaeological sites comprise Aboriginal affinities, while 90 sites have material evidence of Euro-Canadian affinity, and 22 sites have evidence of Iroquoian affinity. It is expected that due to the stratigraphic nature of archaeological sites, several time periods would overlap at the inter-sites level. Evidence of material remains from different time periods and groups were found in 24 sites. One should note that many of these sites have not been subdued to excavations, and material evidence simply reported back from the database. The figure below (Figure 2) shows the timeline of the discovery of archaeological sites in the region.
4. Methodology
4.1. Global Spatial Autocorrelation
Several steps were performed to assess the spatial characteristics of the impact of land-use change on archaeological sites in Northumberland county. Further to importing the point-data into a GIS, a first step consisted of performing a Moran’s I analysis to test whether there was any evidence of spatial autocorrelation over the geographical site locations [42]. This statistic was conducted to test the null hypothesis (Ho) relating to the absence of spatial clustering of archaeological sites in Northumberland County (Equation (1)):
where corresponds to a binary weight matrix defined with the weight of one, given contiguity of adjacency for any value that holds and any value without adjacency as . The product of the distance is defined as for any location in the distance to relation of its mean. This holds as a statistic for assessing the entire spatial distribution of adjacency formed for the county. The null hypothesis was rejected, suggesting global spatial autocorrelation for archaeological sites in the county.
4.2. Local Spatial Autocorrelation
The Getis-Ord statistic was calculated by first determining a hexagon grid for archaeological site locations. This hexagon grid establishes the count of total archaeological sites falling within a 1-kilometer perimeter. While several approaches allow for spatial density estimation, I considered that the unavailability of small census tracts within the county should allow for grid analytics to create smaller spatial boundaries. This enabled an assessment of significantly greater spatial detail that otherwise would not have been possible. The usage of hexagon geometry provided the ideal setting for further analysis of local spatial autocorrelation. This approach led to the creation of a density surface of archaeological sites that defined an aggregation of hotspots and coldspots. The Getis-Ord algorithm is performed as follows:
where is the spatial weight matrix following a 1 km distance (d), and is assumed as 1. The maps show densities of injury patient residences as hot spots and cold spots, with red representing the highest concentrations of injury and blue the lowest.
5. Discussion
5.1. The Spatial Geomorphology of Small Towns
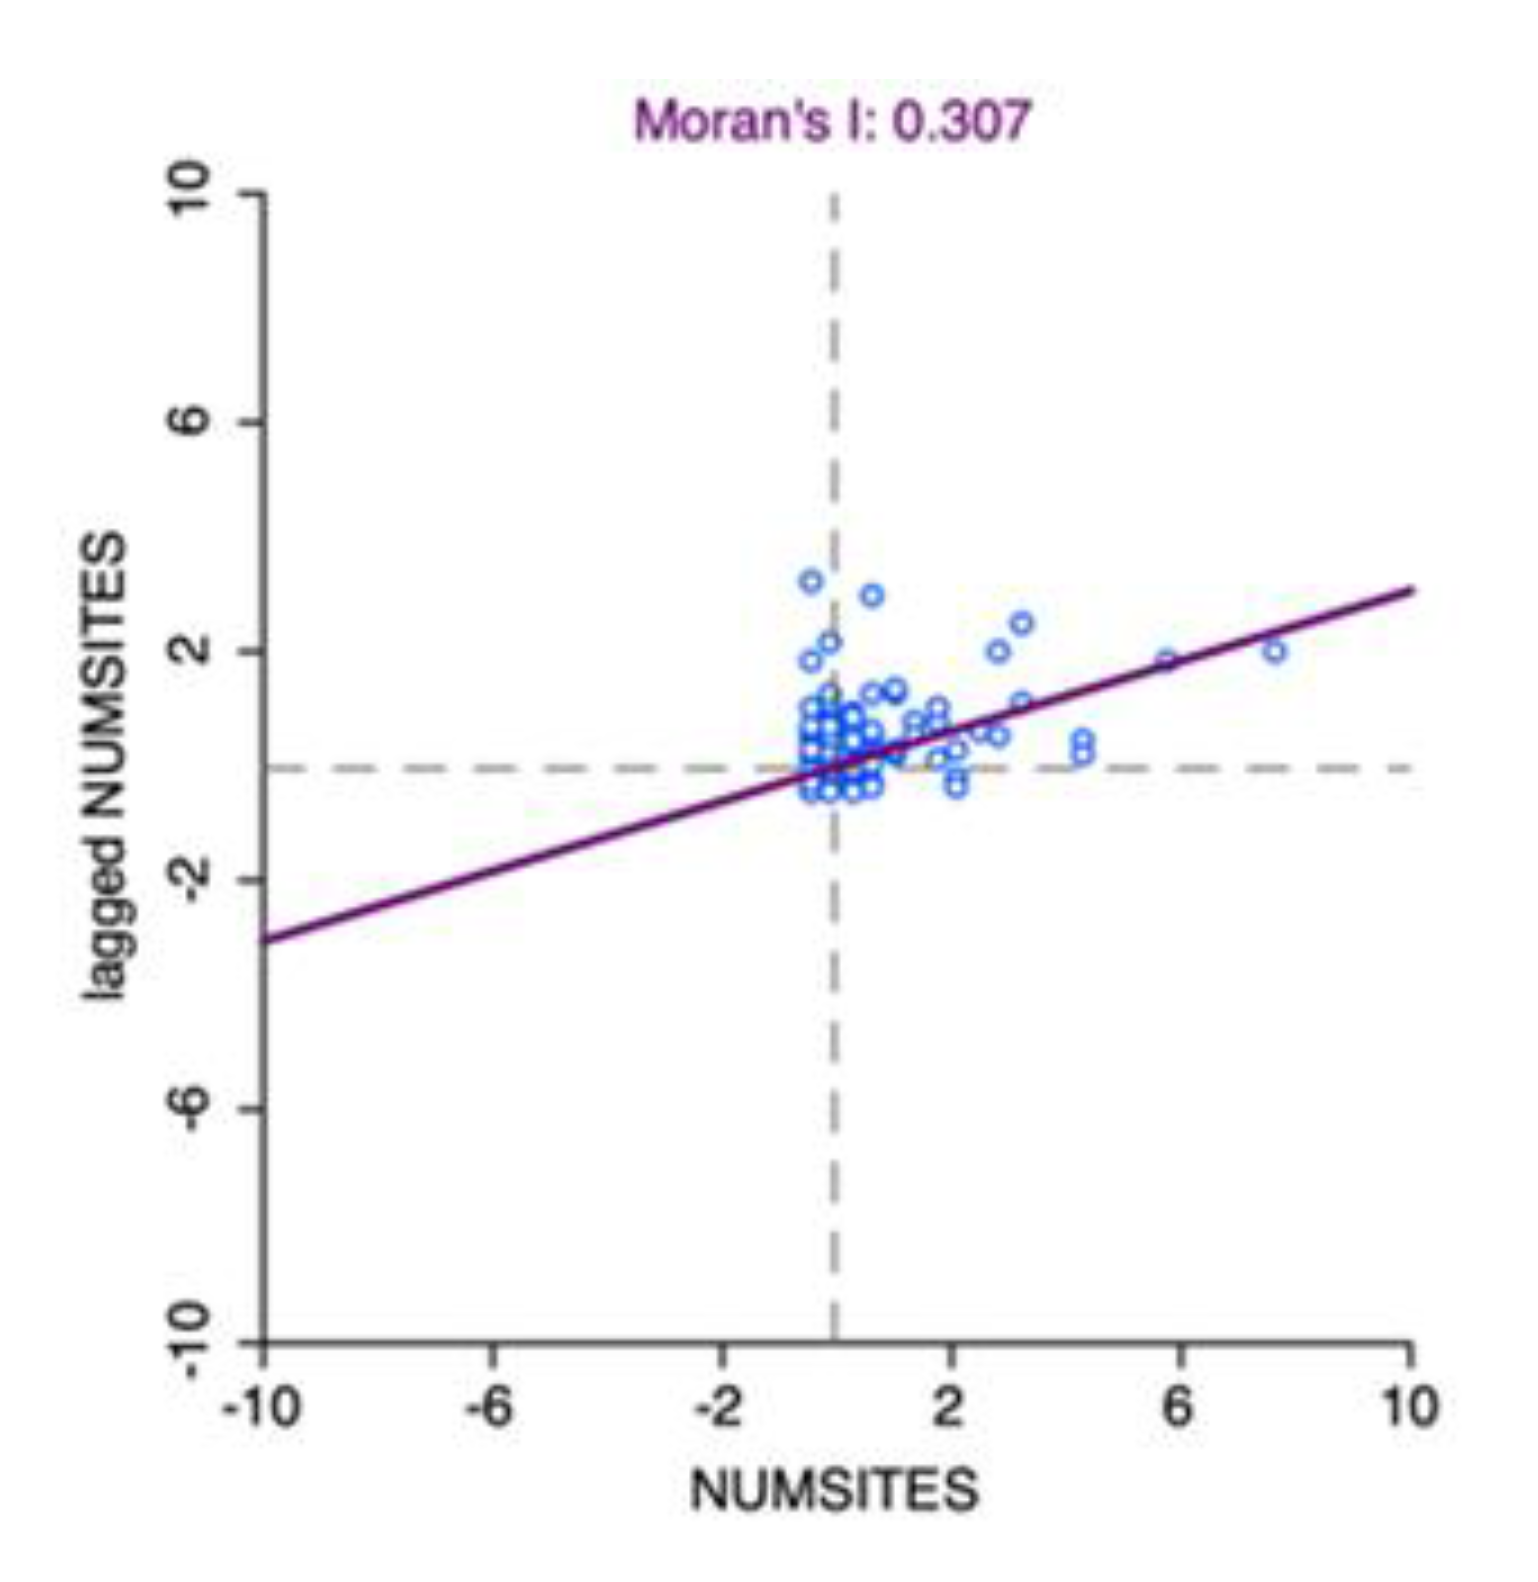
Archaeological sites showed a positive spatial autocorrelation. The rejection of the null hypothesis confirmed a positive association between the location of archaeological sites and geographical space with a Global Moran’s I of 0.307 (Figure 3).
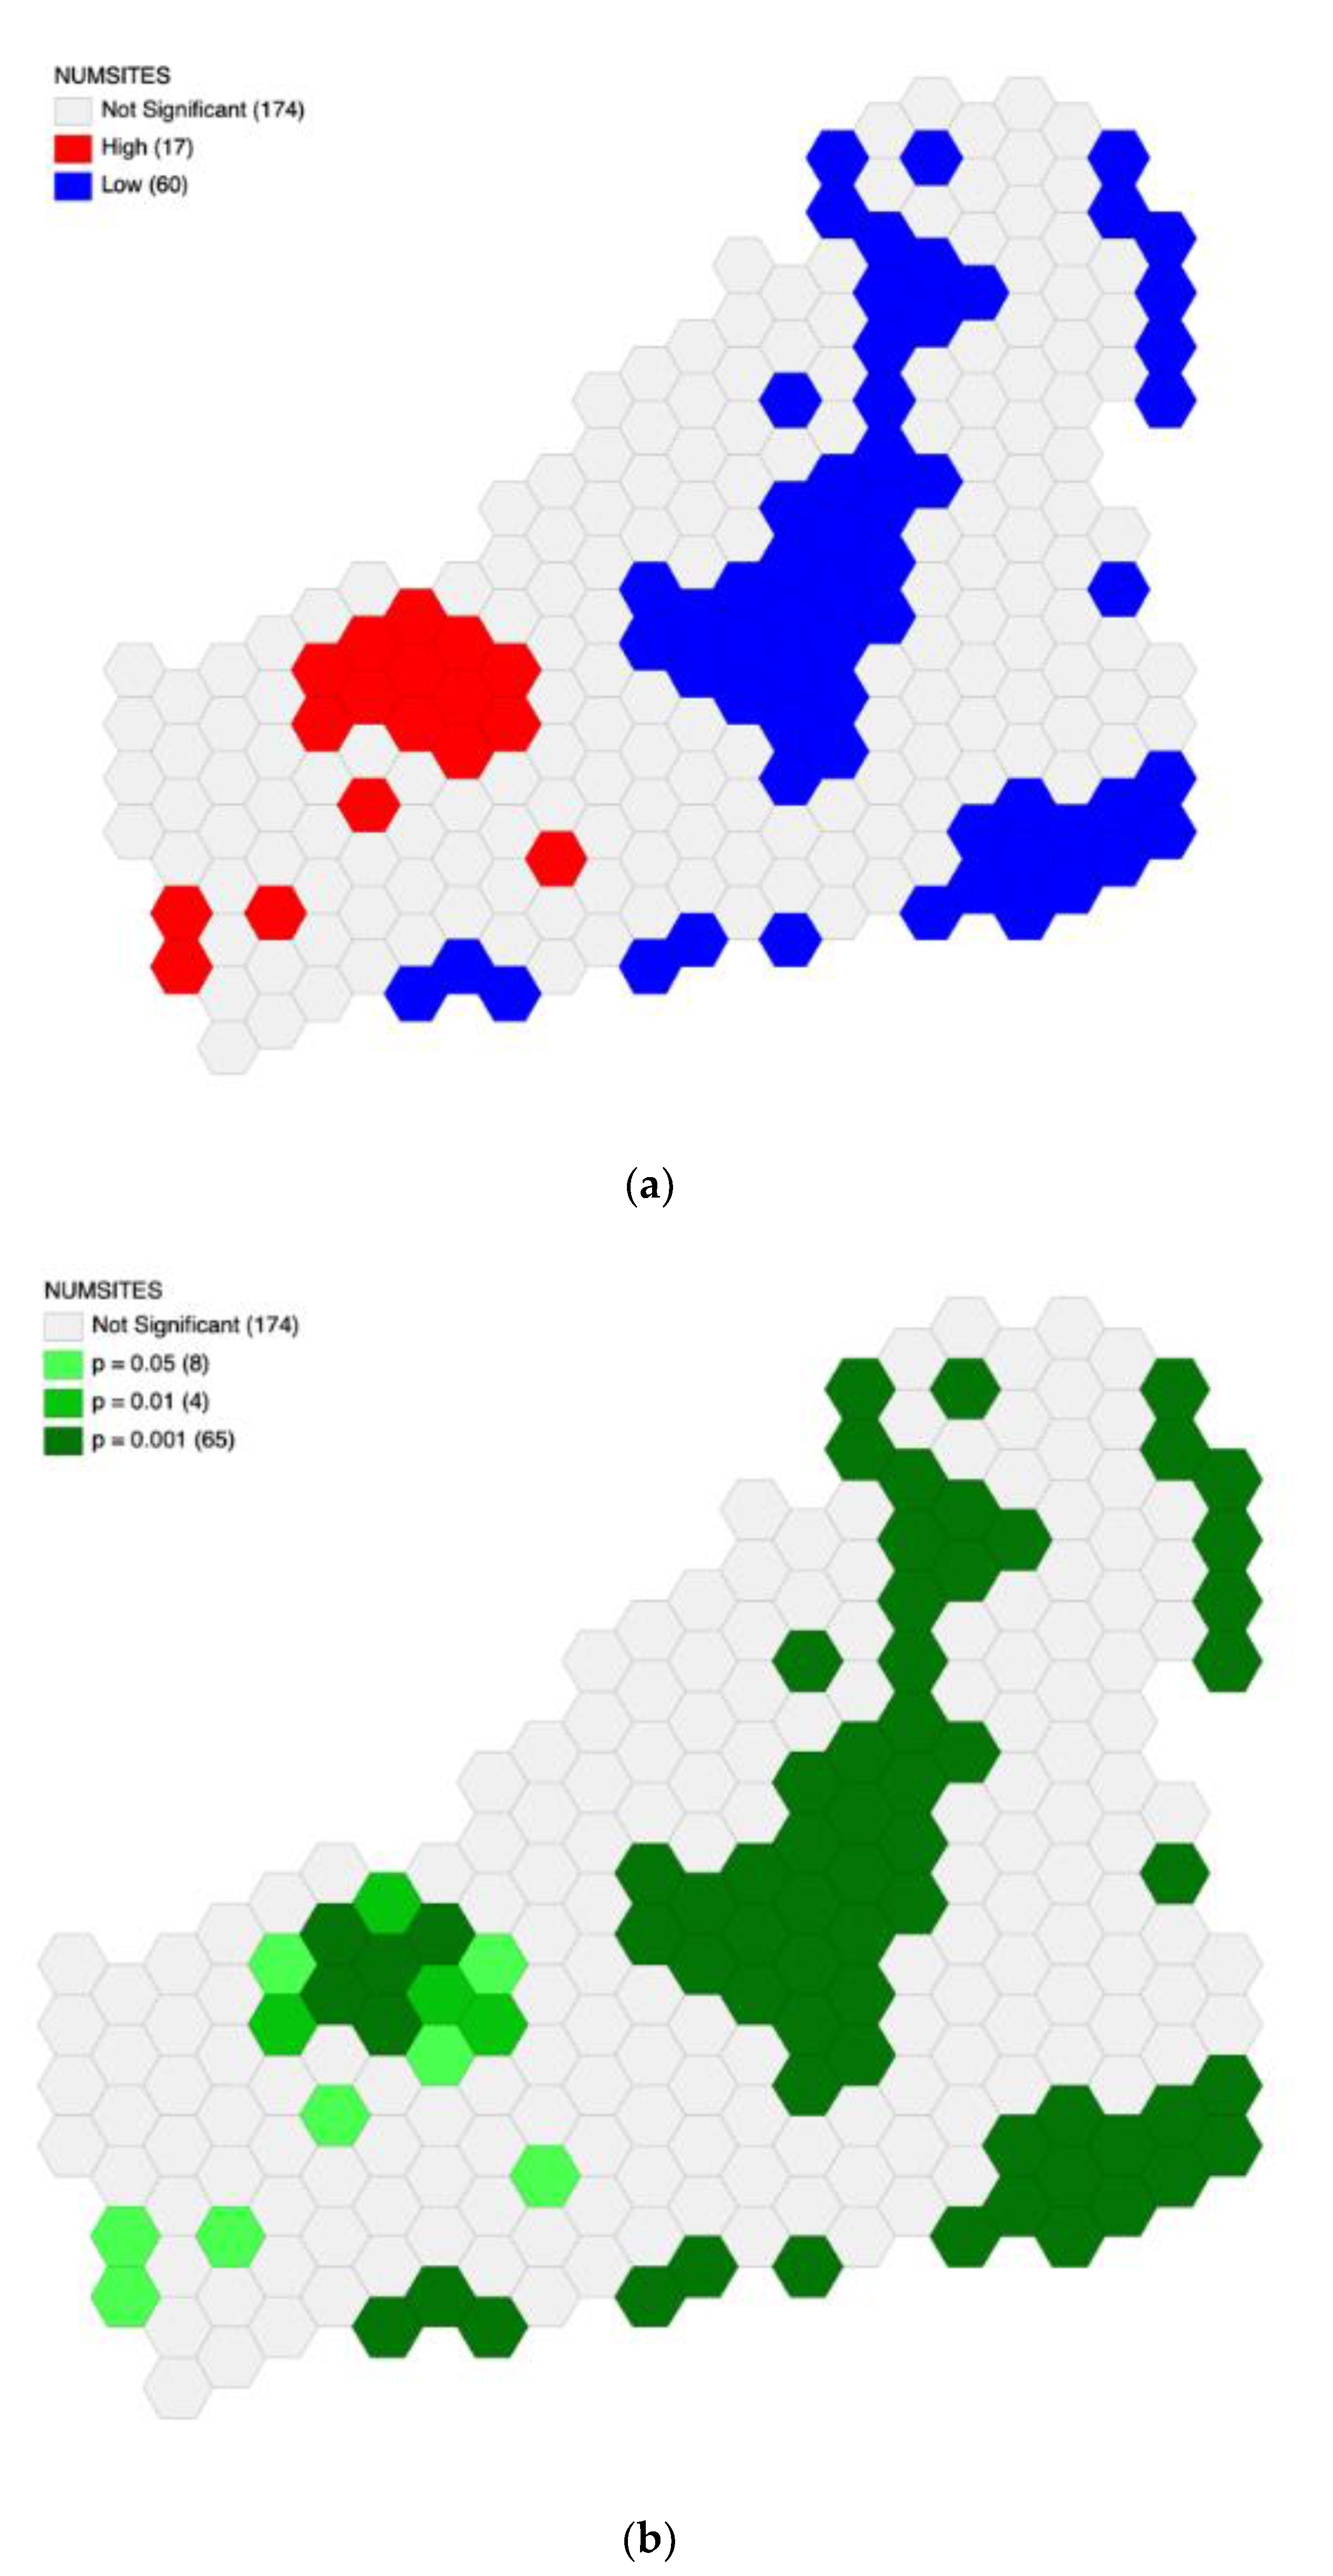
Historical path-tendency of resettlement suggests that human settlements are located in similar areas where past settlements existed, albeit subject to human bias. As further explored in the conclusion section, archaeological sites are also often discovered due to anthropic intervention due to economic activity. This is a fundamental aspect of exploring the sustainability of archaeological preservation and raises the importance of using GIS efficiently for heritage management, as well as the monitoring that should be given during urbanization. The stratigraphic analysis confirms that several sites have inter-archaeological material evidence from different epochs. This furthers the need to articulate careful planning of cities to protect archaeological sites in a multi-dimensional framework of material evidence. The confirmed spatial hotspots brought a robust understanding of the exact location of regions within small towns that need to focus on continuous monitoring and assessment (Figure 4a,b).
Of the identified hotspots and coldspots, the hotspots are particularly noteworthy of further investigation. Of the 17 identified hotspots, five of the hexagons had a p = 0.001, that is, a robust spatial clustering of archaeological sites. The usage of a hexagon mesh clearly allowed a topological division of a terrain where otherwise spatial information would be nonexistent, due to the coarseness of census tract information and the size of forward sortation areas (FSA). It is of extreme interest to understand the local and regional interactions of these hexagons within the highly clustered profile of archaeological sites. This was conducted by comparing the data resulting from the GlobeLand30 initiatives as well as the Global Urban Footprint.
5.2. Comparing Land Use for Small Towns
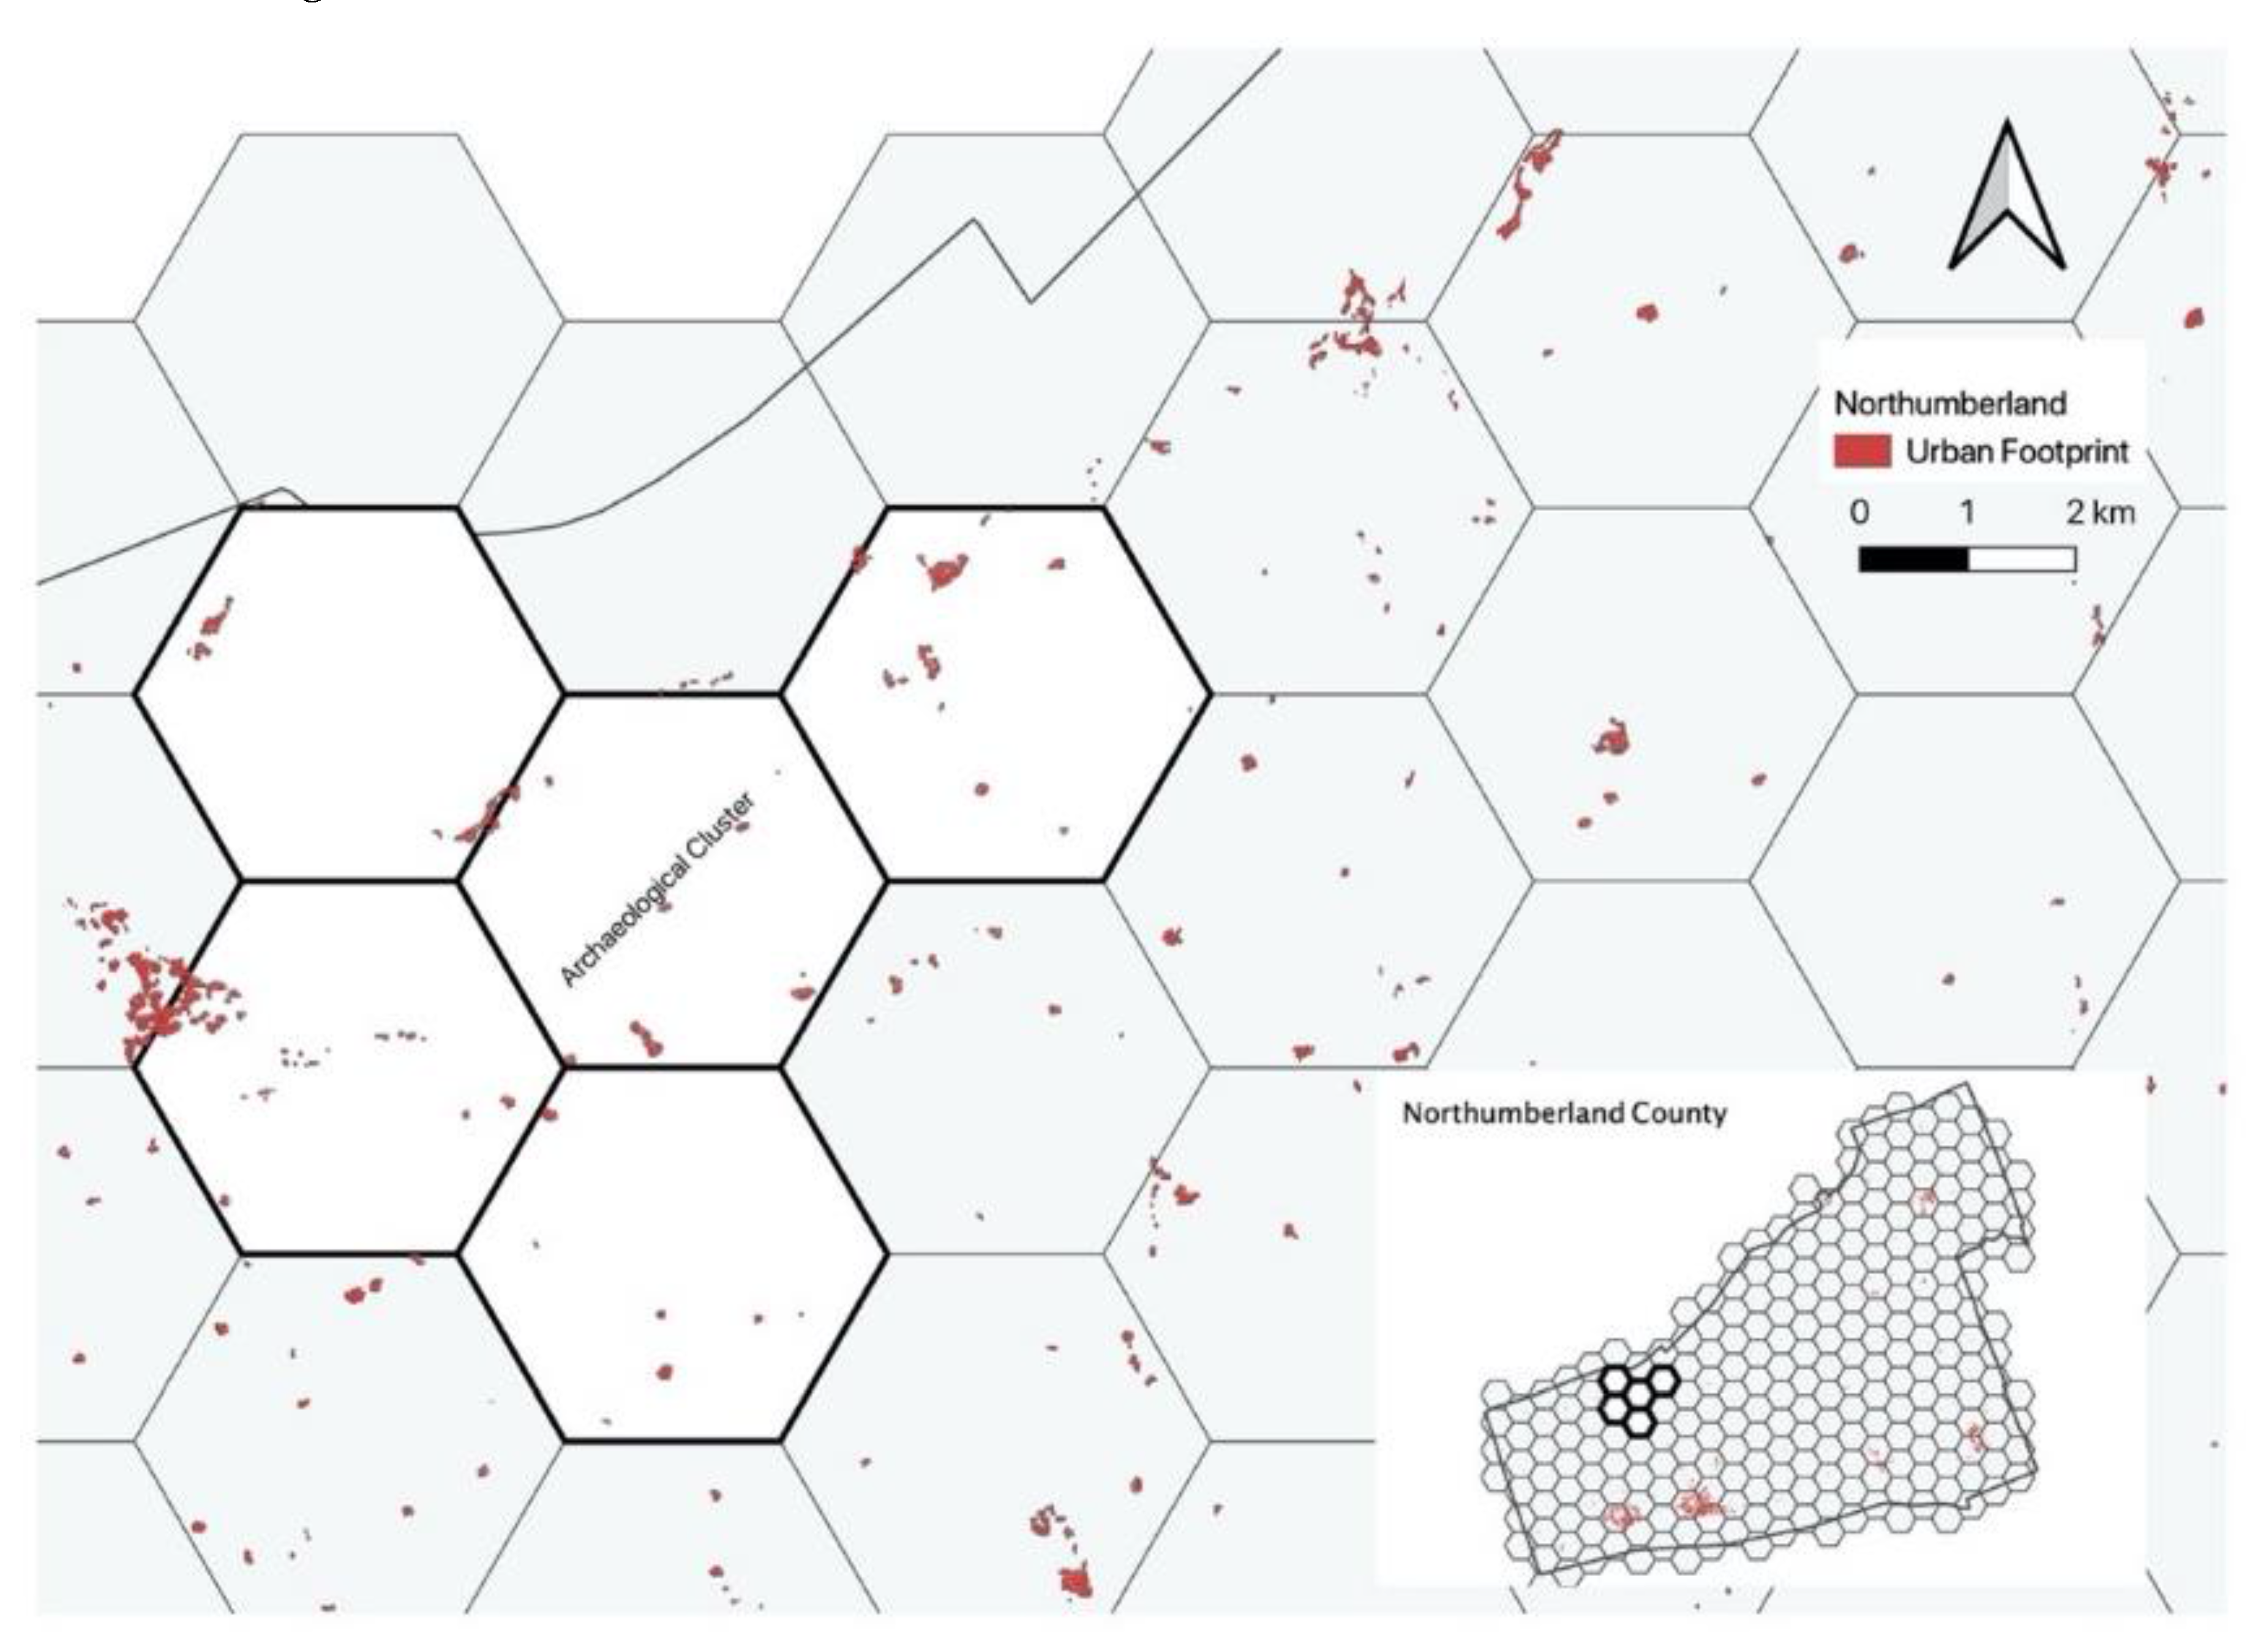
While a substantial amount of research has been conducted on global and regional land use/land cover change, studies of land-use change within small towns are mostly nonexistent. This is largely due to the unavailability of data sources, such as demographic data and land use/land cover, and the nonexistence of multiple timestamps for spatial data. The generation of a hexagon mesh for local analysis within smaller administrative extents may provide a useful solution when combined with global land-use change data sets. The hotspot hexagons were compared with the two global land-use cover sets (Figure 5).
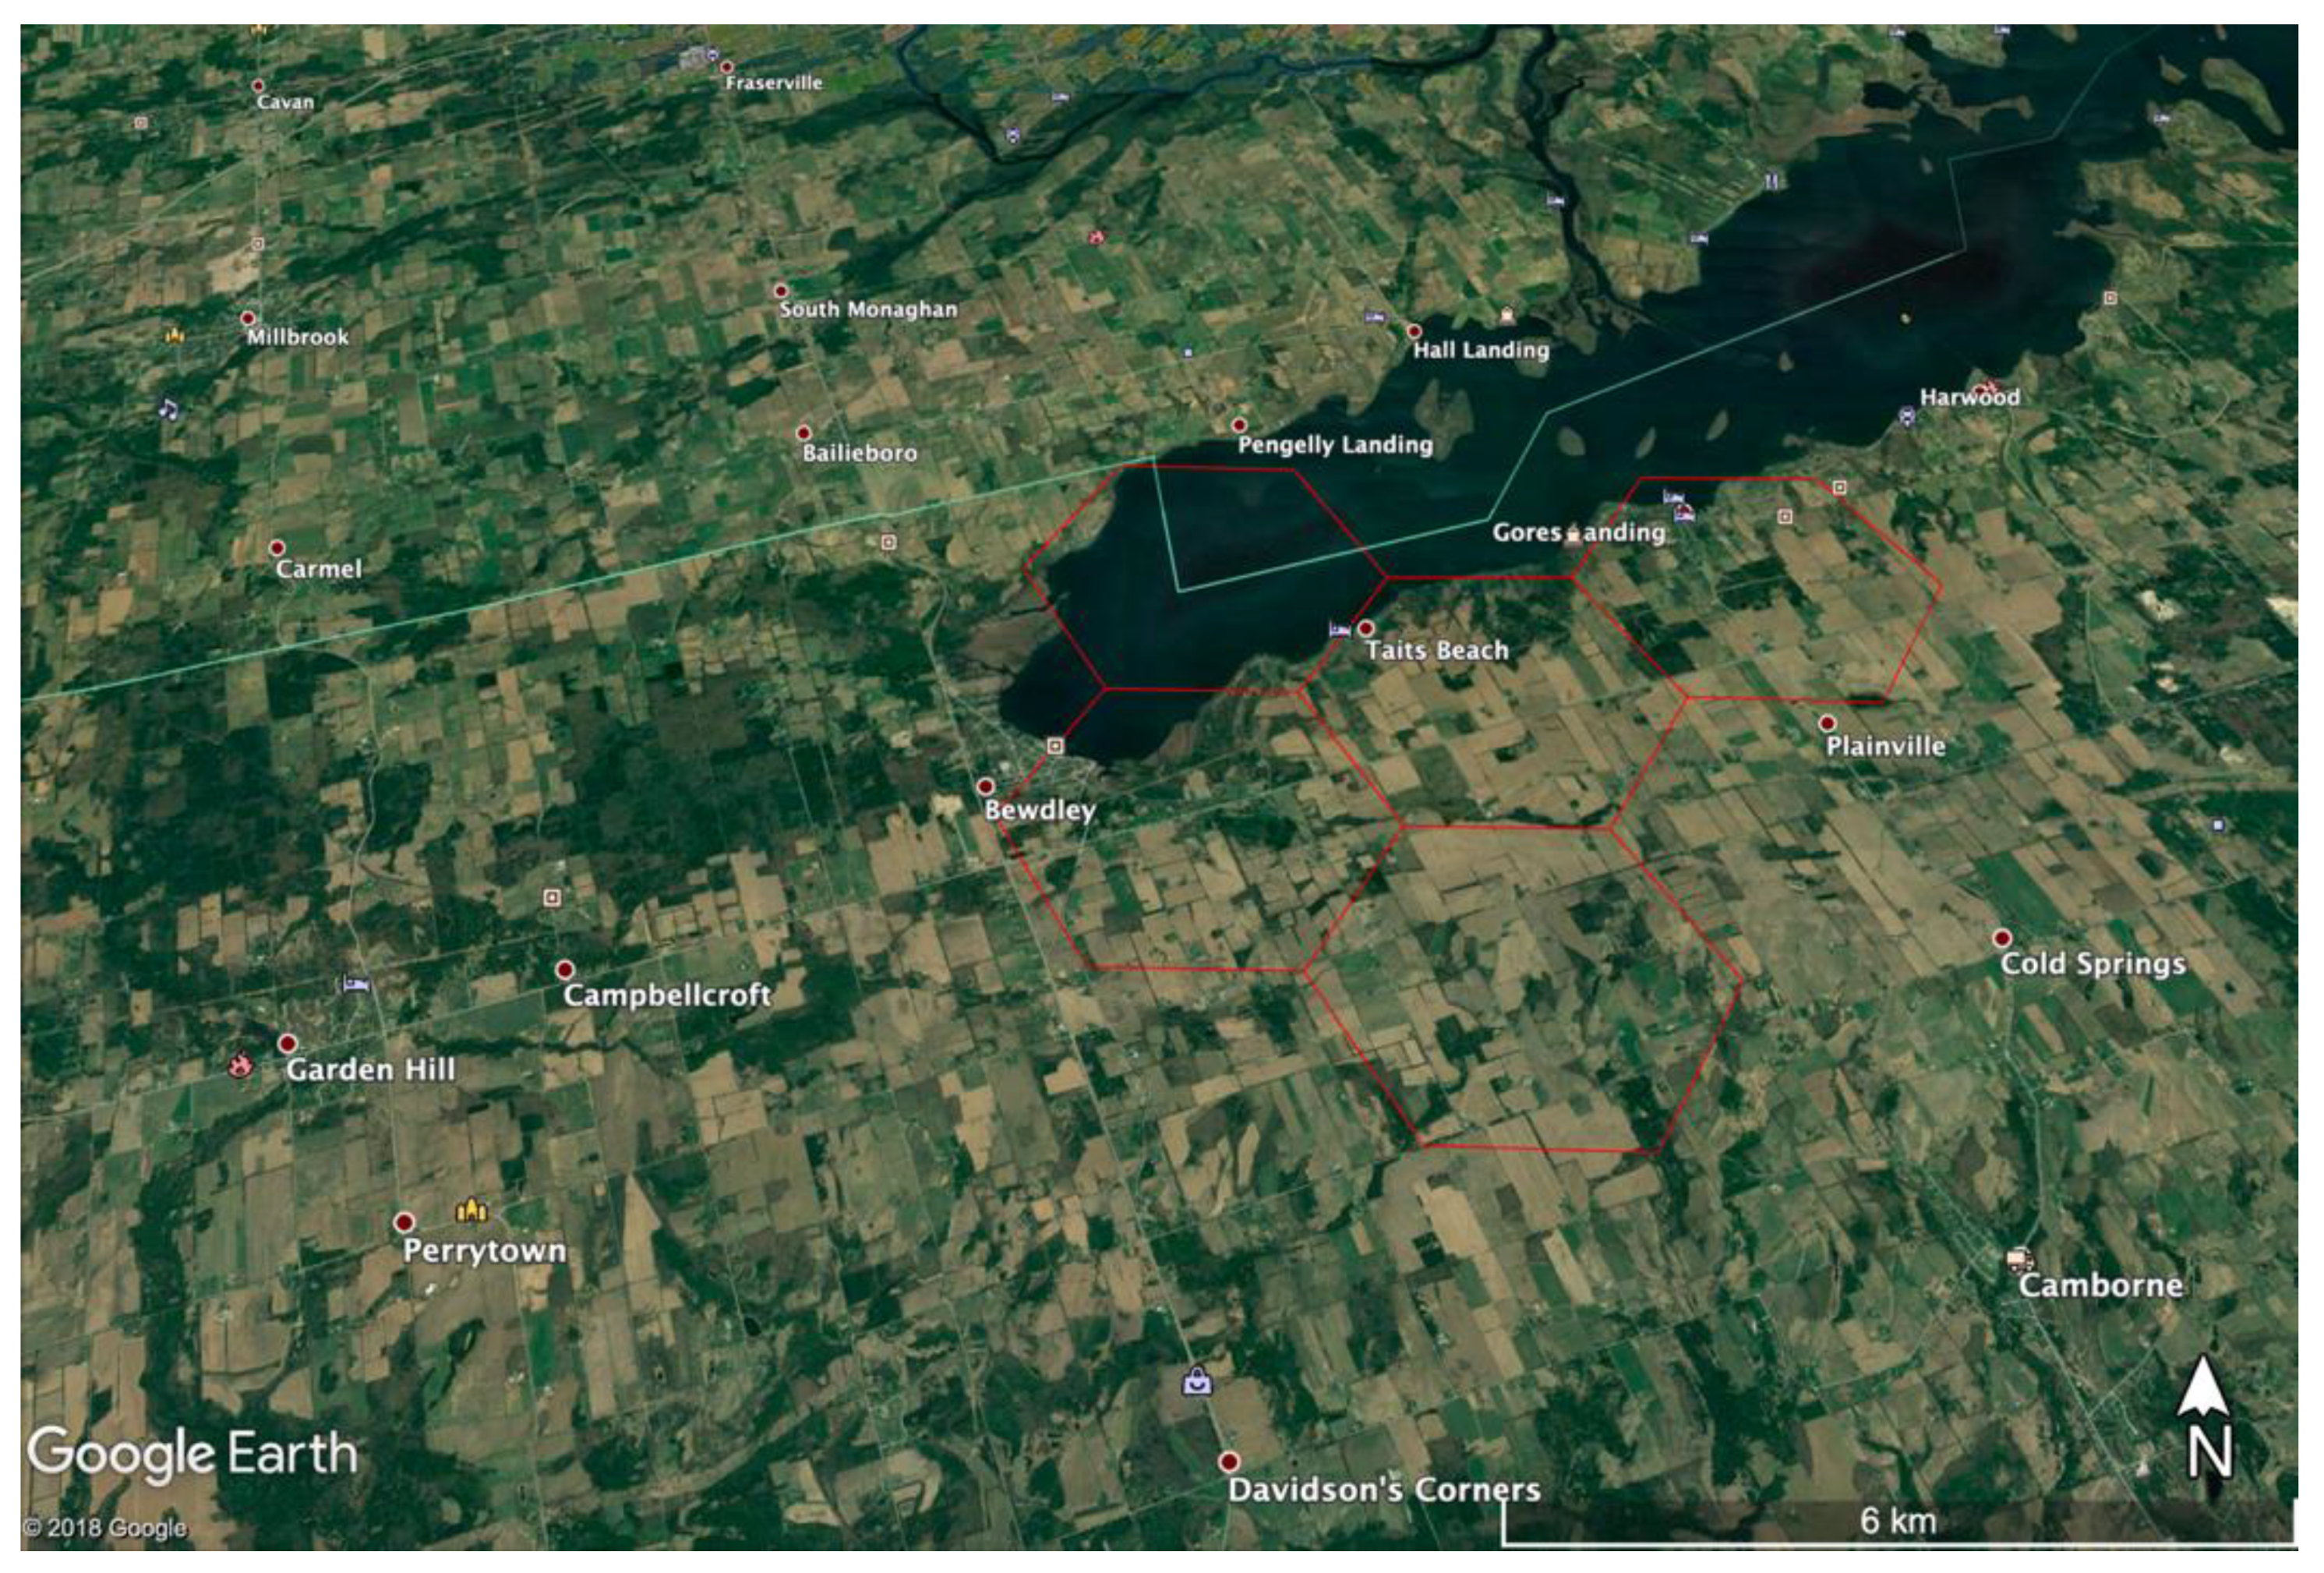
The Global Urban Footprint (GUF) provided an excellent understanding of the existing urban footprint within the archaeological cluster. The inspection was carried out by converting the hotspot hexagons as a kml file, allowing a detailed examination of the geographical surrounding of the area to be performed on Google Earth Pro (Figure 6).
This inspection allowed us to look at the economic profile of the surrounding small towns beyond the geographical evidence found through traditional spatial analytical tools. The hotspot for archaeological sites is predominantly located to the southwest of Rice Lake, with the area encompassing smaller communities such as Bewdley, Taits Beach and Gores Landing. The proximity to the lake and the availability of cottages make these communities particularly prone to seasonal tourism, especially when considering the future expansion of cities such as Toronto [43] and Oshawa, towards transportation efficiency in the direction of Ottawa, passing through Port Hope and Cobourg. Overall, while the GlobeLand30 for 2000 and 2010 did not infer much information, the urban footprint showed a significant level that allows one to parse the spatial characteristics of land use.
6. Conclusions
6.1. The Role of GIS and Archaeology in Small Towns
Despite the rich historical legacy, past land use and the relation to archaeological sites have not been explored robustly for small towns in Ontario. However, the availability of archaeological catalogs and geo-information data concerning the environment, supported by spatial analysis and GIS, enables a better understanding of past land-use patterns [44]. As the causal relations between georeferenced sites are established, environmental and geographical characteristics can help to recover spatial dimensions of archaeological evidence together with changing urban environments [45,46]. Such socio-economic niches seem to be common throughout the entire province [47]. Understanding aboriginal archaeological evidence allows for the generation of historical landscapes that bring added value to the sustainability of local and regional development [48]. The collection of this spatial information has enabled a database to be compiled with hundreds of occurrences dated from the 1970s to the present. This becomes a rich dataset for further analysis and should be integrated into multidisciplinary frameworks relating economic growth and sustainability of small towns and communities.
One should consider the nature, however, of the archaeological record itself. While it is certain that protecting archaeological sites in small towns is of utmost importance to address the identity and structure of cultural landscapes and the preservation of small and medium-town sustainability, it is paramount to address the spatial distribution of archaeological sites. There seems to be a relation between the evidence of the archaeological record and the expectation of finding archaeological sites due to anthropogenic activity, such as urbanization, agriculture and surveying. While future expansions of small and medium-sized towns are likely certain, the sustainability of archaeological sites is not. Intense development and urbanization will likely expose new sites in the future. Exposing these sites must be handled both with care as well as with the awareness that the archaeological record might well be enhanced, and the distribution of past material evidence better understood, exploring a more concise and consistent picture of archaeological evidence.
Since the beginning of processual archaeology, material evidence obtained from archaeological excavations has had a vital role in the interpretation of material culture [49]. Because of their inherent spatial character, past activities based on spatial archaeological data become easier to understand. Technological advances, statistical approaches, survey methods and available information have become more critical supporting methodologies for “quantifying archaeology” [50]. In the context of urban and regional planning [51], environmental determinism in archaeology and urban footprint analysis may lead to the following policy implications:
- (a)
- the possibility to observe past land use has shed light on road networks, which leads to monuments of historical interest;
- (b)
- to develop specific products available in towns, that amount to historical and archaeological preservation and knowledge dissemination;
- (c)
- the articulation between tourism and archaeology or cultural heritage leading to spatial environmental determinism already exists because of available infrastructures that complement the provision of the already available tourist industry.
6.2. Establishing a Small Town Framework for Archaeological Preservation
Over the years, archaeology has dramatically benefitted from spatial analysis and surveillance by remote sensing techniques, as well as database management and GIS in general. The ubiquity of areas in which archaeology benefits has such a broad spectrum that the correct manipulation of data and research of collected material is often non-linear. Such complexity involves many different actors with different needs and demands within the archaeological subject. Information should allow the creation of innovative scientific processes involving different actors in the archaeological frame. It is of utmost importance to position these debates in line with the development and sustainability of small communities and the growth of small towns as a driver for sustainable choices and heritage preservation [52]. Small towns have to consider the impact in the medium and long run of their policies and governance and become more resilient [53]. Sustainable growth should be a prerequisite of understanding the impact not only on archaeological sites but the consequential impact of land use/land cover change in general [54,55]. In southern Ontario, where massive urban sprawl has led to significant and often irreversible land loss, this must be carefully considered as small towns will significantly change in the coming decades.
Acknowledgments
I would like to thank two blind peer-reviewers for their excellent reviews that significantly helped to enhance this piece.
Conflicts of Interest
The author declares no conflict of interest.
References
- Lock, G.; Harris, T. Visualizing spatial data: The importance of Geographic Information Systems. In Archaeology and the Information Age: A Global Perspective; Reilly, R., Rathz, S., Eds.; Routledge: London, UK, 1992; pp. 81–96. [Google Scholar]
- Simonetti, C. Between the vertical and the horizontal. Hist. Human Sci. 2013, 26, 90–110. [Google Scholar] [CrossRef]
- Van Der Valk, A. Preservation and Development: The Cultural Landscape and Heritage Paradox in the Netherlands. Landsc. Res. 2014, 39, 158–173. [Google Scholar] [CrossRef]
- Nicholas, G.P.; Andrews, T.D. At a Crossroads: Archaeology and First Peoples in Canada; Archaeology Press: Oxford, England, 1997; ISBN 0864911815. [Google Scholar]
- Enhancing the City; Maciocco, G.; Serreli, S. (Eds.) Springer: Dordrecht, The Netherlands, 2009; ISBN 978-90-481-2418-3. [Google Scholar]
- McMillan, A.D. Native Peoples and Cultures of Canada: An Anthropological Overview; Douglas & McIntyre: Vancouver, BC, Canada, 1988. [Google Scholar]
- Munson, M.K. Before Ontario: The Archaeology of a Province; McGill-Queen’s Press-MQUP: Montreal, QC, Canada, 2013; Volume 72. [Google Scholar]
- Achino, K.F.; Barceló, J.A. Spatial Prediction: Reconstructing the “Spatiality” of Social Activities at the Intra-Site Scale. J. Archaeol. Method Theory 2019, 26, 112–134. [Google Scholar] [CrossRef]
- Gaydarska, B. Spatial analysis. In Field Archaeology from Around the World: Ideas and Approaches; Springer International Publishing: Berlin/Heidelberg, Germany, 2015; pp. 71–75. ISBN 9783319098197. [Google Scholar]
- Romagnoli, F.; Vaquero, M. The challenges of applying refitting analysis in the Palaeolithic archaeology of the twenty-first century: An actualised overview and future perspectives. Archaeol. Anthropol. Sci. 2019, 11, 4387–4396. [Google Scholar] [CrossRef] [Green Version]
- Kvamme, K.L. The fundamental principles and practice of predictive archaeological modeling. Math. Inf. Sci. Archaeol. A Flex. Framew. 1990, 3, 257. [Google Scholar]
- González Álvarez, D. Rethinking tourism narratives on the cultural landscapes of Asturias (Northern Spain) from the perspective of Landscape Archaeology: Do archaeologists have anything to say? Landsc. Res. 2019, 44, 117–133. [Google Scholar] [CrossRef]
- Guzmán, P.C.; Roders, A.R.P.; Colenbrander, B.J.F. Measuring links between cultural heritage management and sustainable urban development: An overview of global monitoring tools. Cities 2017, 60, 192–201. [Google Scholar] [CrossRef]
- De Noronha Vaz, E.; Nainggolan, D.; Nijkamp, P.; Painho, M. Crossroads of tourism: A complex spatial systems analysis of tourism and urban sprawl in the Algarve. Int. J. Sustain. Dev. 2011, 14, 225–241. [Google Scholar]
- Vaz, E.; Caetano, M.; Nijkamp, P. A multi-level spatial urban pressure analysis of the Giza pyramid plateau in Egypt. J. Herit. Tour. 2011, 6, 99–108. [Google Scholar]
- Monteiro, V.; Painho, M.; Vaz, E. Is the heritage really important? A theoretical framework for heritage reputation using citizen sensing. Habitat Int. 2015, 45, 156–162. [Google Scholar] [CrossRef]
- Territorial Governance; Torre, A.; Traversac, J.-B. (Eds.) Physica-Verlag HD: Heidelberg, Germany, 2011; ISBN 978-3-7908-2421-6. [Google Scholar]
- Vaz, E.; Taubenböck, H.; Kotha, M.; Arsanjani, J.J. Urban change in Goa, India. Habitat Int. 2017, 68, 24–29. [Google Scholar] [CrossRef]
- Campana, S. Remote Sensing in Archaeology. In Encyclopedia of Geoarchaeology; Gilbert, A.S., Goldberg, P., Holliday, V.T., Mandel, R.D., Sternberg, R.S., Eds.; Springer: Dordrecht, The Netherlands, 2017. [Google Scholar]
- Magnini, L.; Bettineschi, C. Theory and practice for an object-based approach in archaeological remote sensing. J. Archaeol. Sci. 2019, 107, 10–22. [Google Scholar] [CrossRef]
- Romanowska, I.; Crabtree, S.A.; Harris, K.; Davies, B. Agent-Based Modeling for Archaeologists: Part 1 of 3. Adv. Archaeol. Pract. 2019, 7, 178–184. [Google Scholar] [CrossRef] [Green Version]
- van den Dries, M.H. Archaeology and the Application of Artificial Intelligence: Case-Studies on Use-Wear Analysis of Prehistoric Flint Tools. Doctoral Thesis, Faculty of Archaeology, Leiden University, Leiden, Holand, 1998. [Google Scholar]
- Greenberg, J.H.; Turner, C.G.; Zegura, S.L.; Campbell, L.; Fox, J.A.; Laughlin, W.S.; Szathmary, E.J.E.; Weiss, K.M.; Woolford, E. The settlement of the Americas: A comparison of the linguistic, dental, and genetic evidence [and comments and reply]. Curr. Anthropol. 1986, 27, 477–497. [Google Scholar] [CrossRef]
- Goebel, T.; Waters, M.R.; O’Rourke, D.H. The late Pleistocene dispersal of modern humans in the Americas. Science (80-) 2008, 319, 1497–1502. [Google Scholar] [CrossRef] [PubMed] [Green Version]
- Haynes, G.; Gary, H. The Early Settlement of North America: The Clovis Era; Cambridge University Press: Cambridge, UK, 2002. [Google Scholar]
- Saunders, J.J.; Agogino, G.A.; Boldurian, A.T.; Haynes, C.V., Jr. A Mammoth-Ivory Burnisher-Billet from the Clovis Level, Blackwater Locality No. 1, New Mexico. Plains Anthropol. 1991, 36, 359–363. [Google Scholar]
- Jackson, L.E., Jr.; Phillips, F.M.; Shimamura, K.; Little, E.C. Cosmogenic 36Cl dating of the Foothills erratics train, Alberta, Canada. Geology 1997, 25, 195–198. [Google Scholar] [CrossRef]
- Oppenheimer, S.; Bradley, B.; Stanford, D. Solutrean hypothesis: Genetics, the mammoth in the room. World Archaeol. 2014, 46, 752–774. [Google Scholar] [CrossRef] [Green Version]
- Hoffecker, J.F.; Powers, W.R.; Goebel, T. The colonization of Beringia and the peopling of the New World. Science (80-) 1993, 259, 46–53. [Google Scholar] [CrossRef]
- Barnosky, A.D.; Koch, P.L.; Feranec, R.S.; Wing, S.L.; Shabel, A.B. Assessing the causes of late Pleistocene extinctions on the continents. Science (80-) 2004, 306, 70–75. [Google Scholar] [CrossRef] [Green Version]
- Grayson, D.K.; Meltzer, D.J. A requiem for North American overkill. J. Archaeol. Sci. 2003, 30, 585–593. [Google Scholar] [CrossRef] [Green Version]
- O’Rourke, D.H.; Raff, J.A. The human genetic history of the Americas: The final frontier. Curr. Biol. 2010, 20, R202–R207. [Google Scholar] [CrossRef] [PubMed] [Green Version]
- Aldenderfer, M. Pre-Clovis projectile points in North America. Science 2018, 362, 415–416. [Google Scholar]
- Turner, C.G. Teeth, needles, dogs, and Siberia: Bioarchaeological evidence for the colonization of the New World. In The First Americans: The Pleistocene Colonization of the New World; Jablonski, N.G., Ed.; Memories of the California Academy of Sciences: San Francisco, CA, USA, 2002; pp. 123–158. [Google Scholar]
- Holen, S.R.; Deméré, T.A.; Fisher, D.C.; Fullagar, R.; Paces, J.B.; Jefferson, G.T.; Beeton, J.M.; Cerutti, R.A.; Rountrey, A.N.; Vescera, L.; et al. A 130,000-year-old archaeological site in southern California, USA. Nature 2017, 544, 479. [Google Scholar] [CrossRef]
- Haynes, G. Reply to Holen et al. regarding the Cerutti Mastodon. PaleoAmerica 2018, 4, 99–100. [Google Scholar] [CrossRef]
- Taubenböck, H.; Weigand, M.; Esch, T.; Staab, J.; Wurm, M.; Mast, J.; Dech, S. A new ranking of the world’s largest cities—Do administrative units obscure morphological realities? Remote Sens. Environ. 2019, 232, 111353. [Google Scholar] [CrossRef]
- Shao, X.; Wang, J. Appraisal of Intensive Land Use of Development Zones in Small Towns—A Case Study of Cixi in Zhejiang Province. Prog. Geogr. 2008, 1, 75–81. [Google Scholar]
- He, Q.; Song, Y.; Liu, Y.; Yin, C. Diffusion or coalescence? Urban growth pattern and change in 363 Chinese cities from 1995 to 2015. Sustain. Cities Soc. 2017, 35, 729–739. [Google Scholar] [CrossRef]
- Esch, T.; Heldens, W.; Hirner, A.; Keil, M.; Marconcini, M.; Roth, A.; Zeidler, J.; Dech, S.; Strano, E. Breaking new ground in mapping human settlements from space—The Global Urban Footprint. ISPRS J. Photogramm. Remote Sens. 2017, 134, 30–42. [Google Scholar] [CrossRef] [Green Version]
- Esch, T.; Bachofer, F.; Heldens, W.; Hirner, A.; Marconcini, M.; Palacios-Lopez, D.; Roth, A.; Üreyen, S.; Zeidler, J.; Dech, S.; et al. Where we live—A summary of the achievements and planned evolution of the global urban footprint. Remote Sens. 2018, 10, 895. [Google Scholar] [CrossRef] [Green Version]
- Premo, L.S. Local spatial autocorrelation statistics quantify multi-scale patterns in distributional data: An example from the Maya Lowlands. J. Archaeol. Sci. 2004, 31, 855–866. [Google Scholar] [CrossRef]
- Vaz, E.; Jokar Arsanjani, J. Predicting Urban Growth of the Greater Toronto Area—Coupling a Markov Cellular Automata with Document Meta-Analysis. J. Environ. Inform. 2015, 25, 71–80. [Google Scholar] [CrossRef]
- Vaz, E. The future of landscapes and habitats: The regional science contribution to the understanding of geographical space. Habitat Int. 2016, 51, 70–78. [Google Scholar] [CrossRef]
- de Noronha Vaz, E.; de Noronha Vaz, T.; Nijkamp, P. The use of gravity concepts for agricultural land-use dynamics: A case study on the Algarve. Int. J. Foresight Innov. Policy 2012, 8, 262–271. [Google Scholar]
- Jokar Arsanjani, J.; Fibæk, C.S.; Vaz, E. Development of a cellular automata model using open source technologies for monitoring urbanisation in the global south: The case of Maputo, Mozambique. Habitat Int. 2018, 71, 38–48. [Google Scholar] [CrossRef]
- Vaz, E.; Bowman, L. An application for regional coastal erosion processes in urban areas: A Case Study Of The Golden Horseshoe in Canada. Land 2013, 2, 595–608. [Google Scholar] [CrossRef] [Green Version]
- Monteiro, V.; Henriques, R.; Painho, M.; Vaz, E. Sensing World Heritage: An Exploratory Study of Twitter as a Tool for Assessing Reputation; Springer: Berlin/Heidelberg, Germany, 2014; Volume 8580, ISBN 9783319091280. [Google Scholar]
- Baumanova, M. Space matters: A reflection on archaeological theory and method for interpreting the materiality of space. Interdiscip. Archaeol. 2016, 7, 209–216. [Google Scholar] [CrossRef]
- Schliephake, C. Urban Ecologies: City Space, Material Agency, and Environmental Politics in Contemporary Culture; Lexington Books: Washington, DC, USA, 2014. [Google Scholar]
- Dandekar, H. City Space+ Globalization: An International Perspective; The University of Michigan: Ann Arbor, MI, USA, 1998. [Google Scholar]
- Vaz, E. Regional Intelligence: A new kind of GIScience. Habitat Int. 2018, 72, 1–108. [Google Scholar] [CrossRef]
- Vaz, E.; de Noronha, T.; Pinto, H. Conclusion: Resilience—What’s Next. In Resilience and Regional Dynamics; Springer: Berlin/Heidelberg, Germany, 2018; pp. 251–255. [Google Scholar]
- Vaz, E.; Nijkamp, P. Gravitational forces in the spatial impacts of urban sprawl: An investigation of the region of Veneto, Italy. Habitat Int. 2015, 45, 99–105. [Google Scholar] [CrossRef]
- Tayyebi, A.; Tayyebi, A.; Vaz, E.; Arsanjani, J.J.; Helbich, M. Analyzing crop change scenario with the SmartScapeTM spatial decision support system. Land Use Policy 2016, 51, 41–53. [Google Scholar] [CrossRef]
Figure 1.
Global Urban Footprint—Northumberland County.

Figure 2.
Archaeological sites per year of discovery.

Figure 3.
Calculation of Global Moran’s I for archaeological sites in Northumberland County.

Figure 4.
(a) Located hotspots and coldspots for archaeological sites; (b) significance of spatial clusters of archaeological sites.
Figure 4.
(a) Located hotspots and coldspots for archaeological sites; (b) significance of spatial clusters of archaeological sites.

Figure 5.
Archaeological cluster and Global Urban Footprint.

Figure 6.
Location of hotspot hexagons within Google Earth Pro (Google Earth © 2019).


Table 1.
Distribution of archaeological sites by affinities.
| Affinity | Number of Sites |
|---|---|
| Aboriginal | 187 |
| Aboriginal, Euro-Canadian | 11 |
| Aboriginal, Euro-Canadian, Iroquoian | 5 |
| Aboriginal, Iroquoian | 8 |
| Euro-Canadian | 74 |
| Iroquoian | 9 |
© 2020 by the author. Licensee MDPI, Basel, Switzerland. This article is an open access article distributed under the terms and conditions of the Creative Commons Attribution (CC BY) license (http://creativecommons.org/licenses/by/4.0/).
Share and Cite
MDPI and ACS Style
Vaz, E. Archaeological Sites in Small Towns—A Sustainability Assessment of Northumberland County. Sustainability 2020, 12, 2018. https://0-doi-org.brum.beds.ac.uk/10.3390/su12052018
AMA Style
Vaz E. Archaeological Sites in Small Towns—A Sustainability Assessment of Northumberland County. Sustainability. 2020; 12(5):2018. https://0-doi-org.brum.beds.ac.uk/10.3390/su12052018
Chicago/Turabian StyleVaz, Eric. 2020. "Archaeological Sites in Small Towns—A Sustainability Assessment of Northumberland County" Sustainability 12, no. 5: 2018. https://0-doi-org.brum.beds.ac.uk/10.3390/su12052018
Note that from the first issue of 2016, this journal uses article numbers instead of page numbers. See further details here.