Article

Identifying Urban Road Black Spots with a Novel Method Based on the Firefly Clustering Algorithm and a Geographic Information System

1
The Key Laboratory of Road and Traffic Engineering, Ministry of Education, College of Transportation Engineering, Tongji University, Shanghai 201804, China
2
College of Surveying and Geo-Informatics, Shandong Jianzhu University, Jinan 250101, China
*
Authors to whom correspondence should be addressed.
Sustainability 2020, 12(5), 2091; https://0-doi-org.brum.beds.ac.uk/10.3390/su12052091
Submission received: 30 December 2019 / Revised: 29 February 2020 / Accepted: 29 February 2020 / Published: 9 March 2020

Abstract

:
With the rapid development of urban road traffic, there are a certain number of black spots in an urban road network. Therefore, it is important to create a method to effectively identify the urban road black spots in order to quickly and accurately ensure the safety of residents and maintain the sustainable development of a city. In this study, a GIS (geographic information system) and the Firefly Clustering Algorithm are combined. On the one hand, a GIS can accurately extract the distance between accident points through its spatial analysis function, overcoming the disadvantage of the accident data not usually including the specific location data. On the other hand, the Firefly Clustering Algorithm can be used to comprehensively extract the characteristics of accident points, which is particularly suitable for the identification of black spots. In order to verify the feasibility of the proposed method, this research compares the identification effect between the OD (origin–destination) cost distance calculated by GIS and the Euclidean distance. The results show that the Euclidean distance is smaller than the OD cost distance and that the accident search method based on the Euclidean distance can overestimate the number of black spots, especially for intersections. Therefore, the proposed method based on the Firefly Clustering Algorithm and GIS can not only contribute to identifying urban road black spots but also plays an auxiliary role in reducing urban road crashes and maintaining sustainable urban development.

1. Introduction

Traffic accidents are regarded as one of the most serious social problems. Over and above the resulting personal emotional impact and trauma of injury or loss of life, they seriously affect people’s travel safety and lead to huge socio-economic losses. As a result, traffic accidents hinder the sustainable development of society. According to the National Highway Traffic Safety Administration (NHTSA), traffic accidents have annual economic costs of $277 billion and social costs of $594 billion, including those due to the suffering and loss of life resulting from car crashes [1]. The Global Status Report on Road Safety 2018, launched by the World Health Organization (WHO) in December 2018, highlighted that the number of annual road traffic deaths has reached 1.35 million worldwide [2]. Meanwhile, urban road traffic accidents account for a high proportion of road traffic accidents. They not only cause incalculable economic losses to society but also have a serious negative impact on sustainable urban development.
Urban roads commonly have many similar intersections and road sections, as well as varying traffic conditions. As such, there are some traffic accidents that occur on similar road sections or intersections during a specific period of time; these areas are called black spots. Though the percentage of black spots in an urban road network is small, their harm to people’s lives and property is substantial. Therefore, attention should be focused on identifying these black spots, which would help reduce the frequency of traffic accidents, improve road safety, and promote greater socio-economic benefits. Therefore, the focus of this study is on how to better identify black spots by utilizing existing traffic accident information.
In general, the identification of the location of black spots is the first and most important step in the accident mitigation process. Previous studies and practices have shown that the black spot identification method is an effective and reactive means of dealing with the occurrence of accidents [3]. The method is especially useful when it is introduced for an urban road to help the government to manage road safety. To implement this method, the most important priority is to identify the location of black spots for safety management.
The available black spot identification methods include many statistical methods such as the accident number method, the accident rate method, the quality control method, the regression analysis method, and the BP (Back Propagation) neural network method. These methods can generally be classified into three categories: the linear theory method, the nonlinear theory method, and the experiential learning method, with pros and cons associated with each method. Specific descriptions and comparative analysis of the different methods are shown in Table 1.
As shown in the table, each black spot identification method has its own advantages and disadvantages, even in the applicable conditions. The existing methods are seldom applied to urban roads due to the complexity of urban road circumstances, especially for some special road sections or intersections.
One of the major difficulties in black spot identification is a lack of the location data of an accident. In various pieces of research on black spot identification, the time and number of accidents have usually been paid more attention to, but the location has often been ignored. A rough description is recorded in Table 2, revealing that the spatial distance among accidents cannot be accurately calculated [14,15].
In view of the aforementioned shortcomings, this paper intends to introduce a novel approach for identifying black spot sites, mainly by employing the Firefly Clustering Algorithm and GIS (geographic information system). The purpose of this research is to illustrate how the Firefly Clustering Algorithm and GIS can be used to identify the black spots in urban roads. This method is expected to provide a reference guide for the mitigation of accidents in complex urban road circumstances, which can help reduce socio-economic losses and have a positive impact on urban sustainable development.

2. Materials and Methods

2.1. Definition of Black Spot

Though no universally accepted definition of a black spot or black zone has been given, these locations are generally described as high-risk accident locations. Determining whether a place is a black spot depends on different definitions. In Australia, the definition of a black spot is given as: for individual sites such as an intersection, a mid-block, or a short road section, there has to be a history of at least three casualty crashes in any one year, three casualty crashes over a three-year period, four casualty crashes over a four-year period, five casualty crashes over a five-year period, etc. For lengths of road, there must be an average of 0.2 casualty crashes per kilometer of the length in question over five years, or the road length to be treated must be amongst the top 10% of sites with a demonstrated higher crash rate than that of other roads in a region [16].
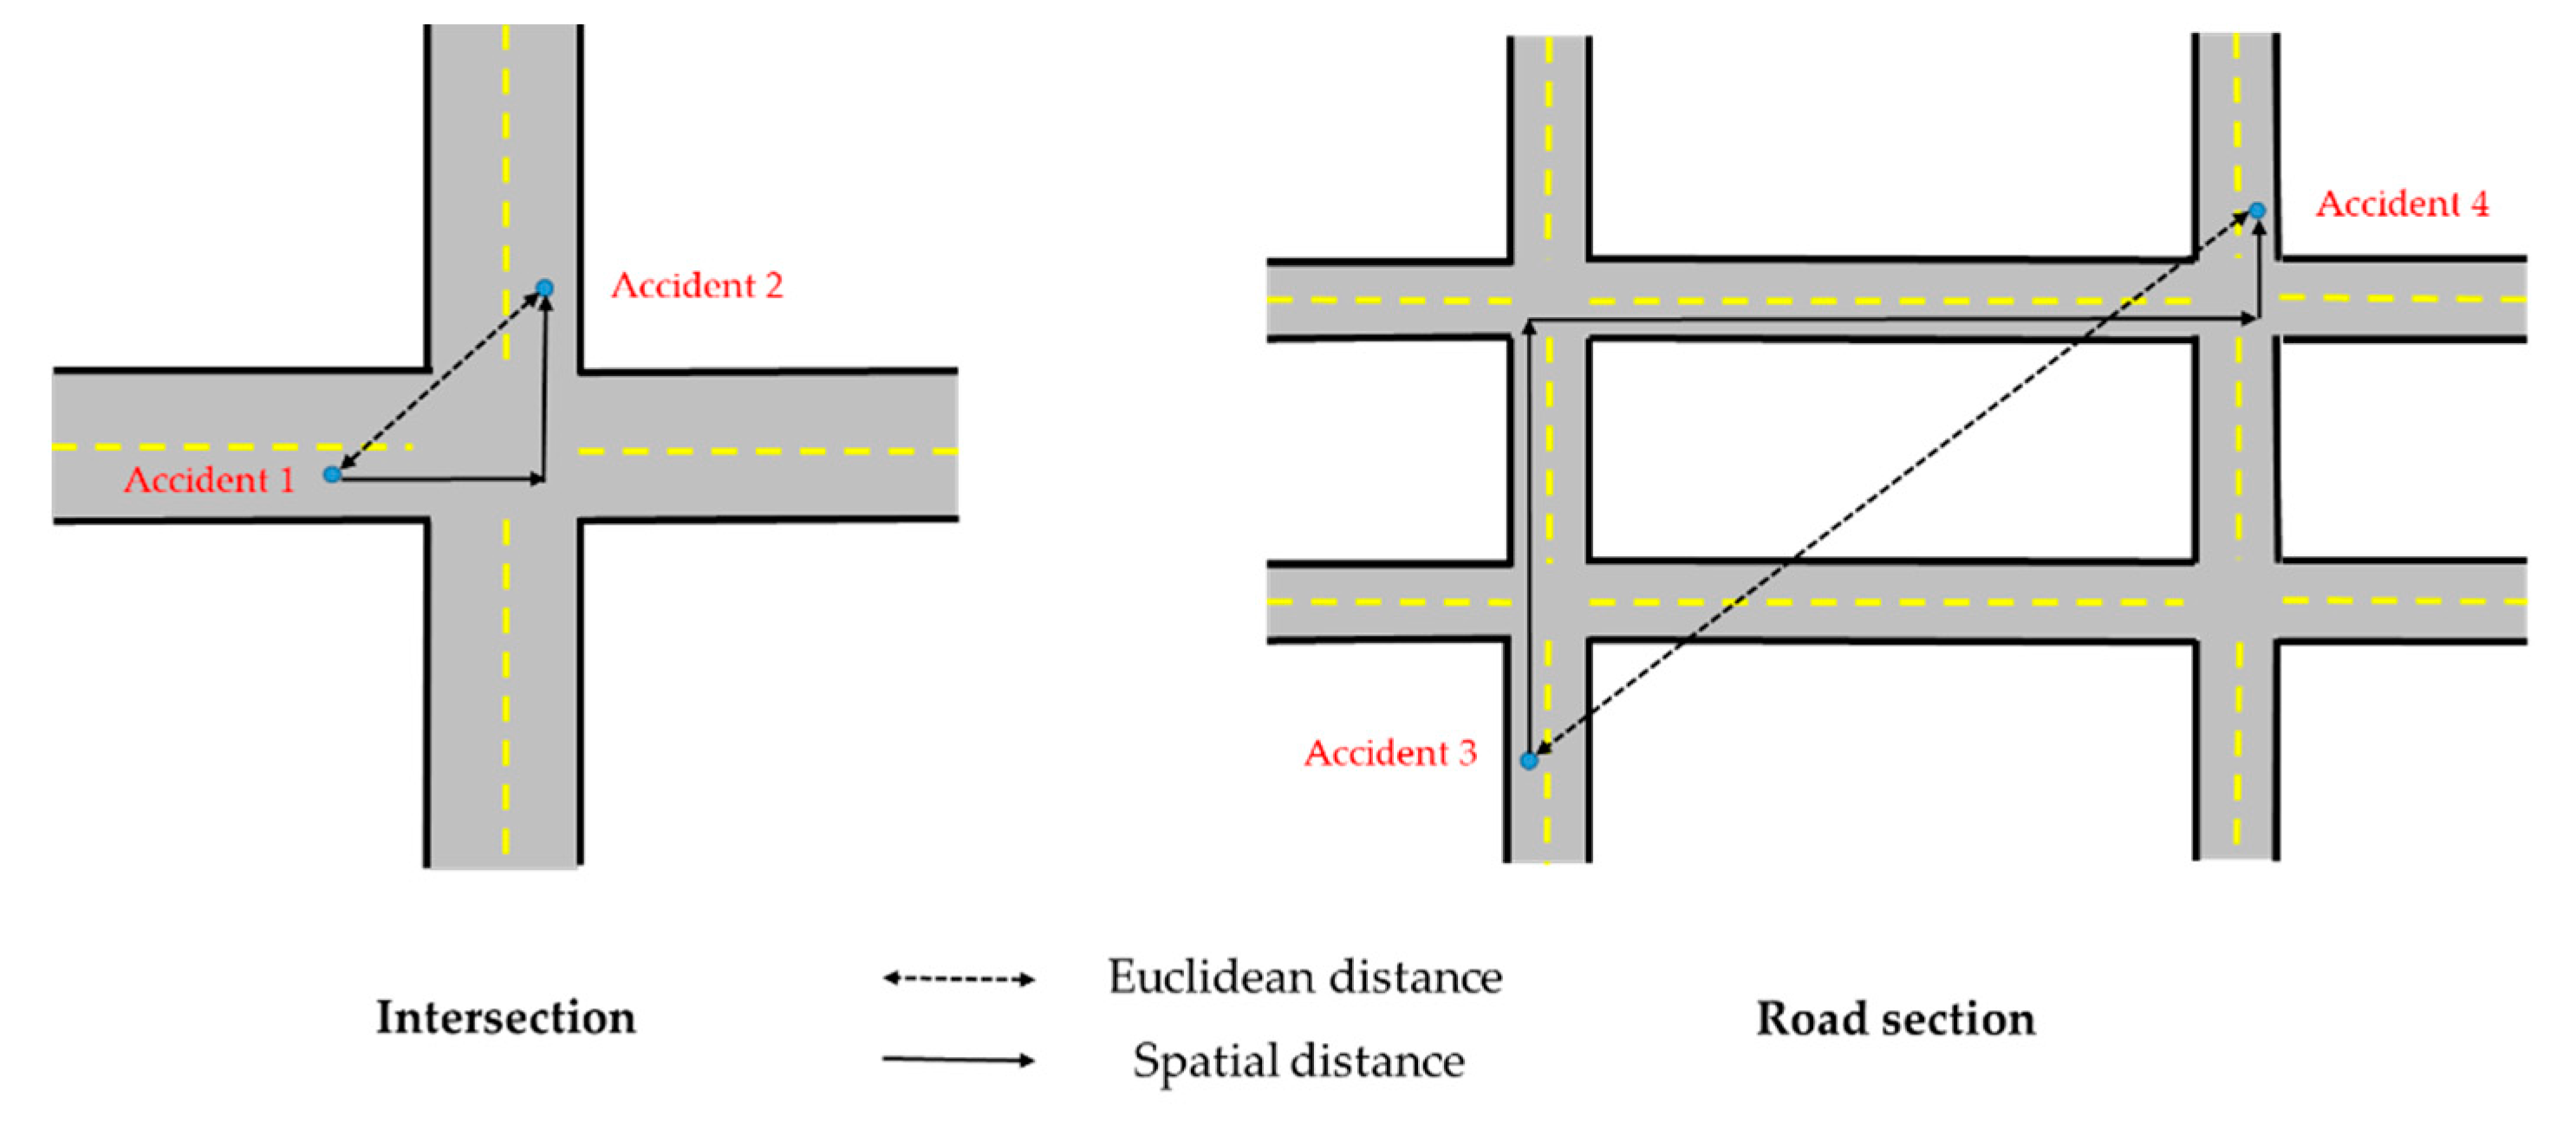
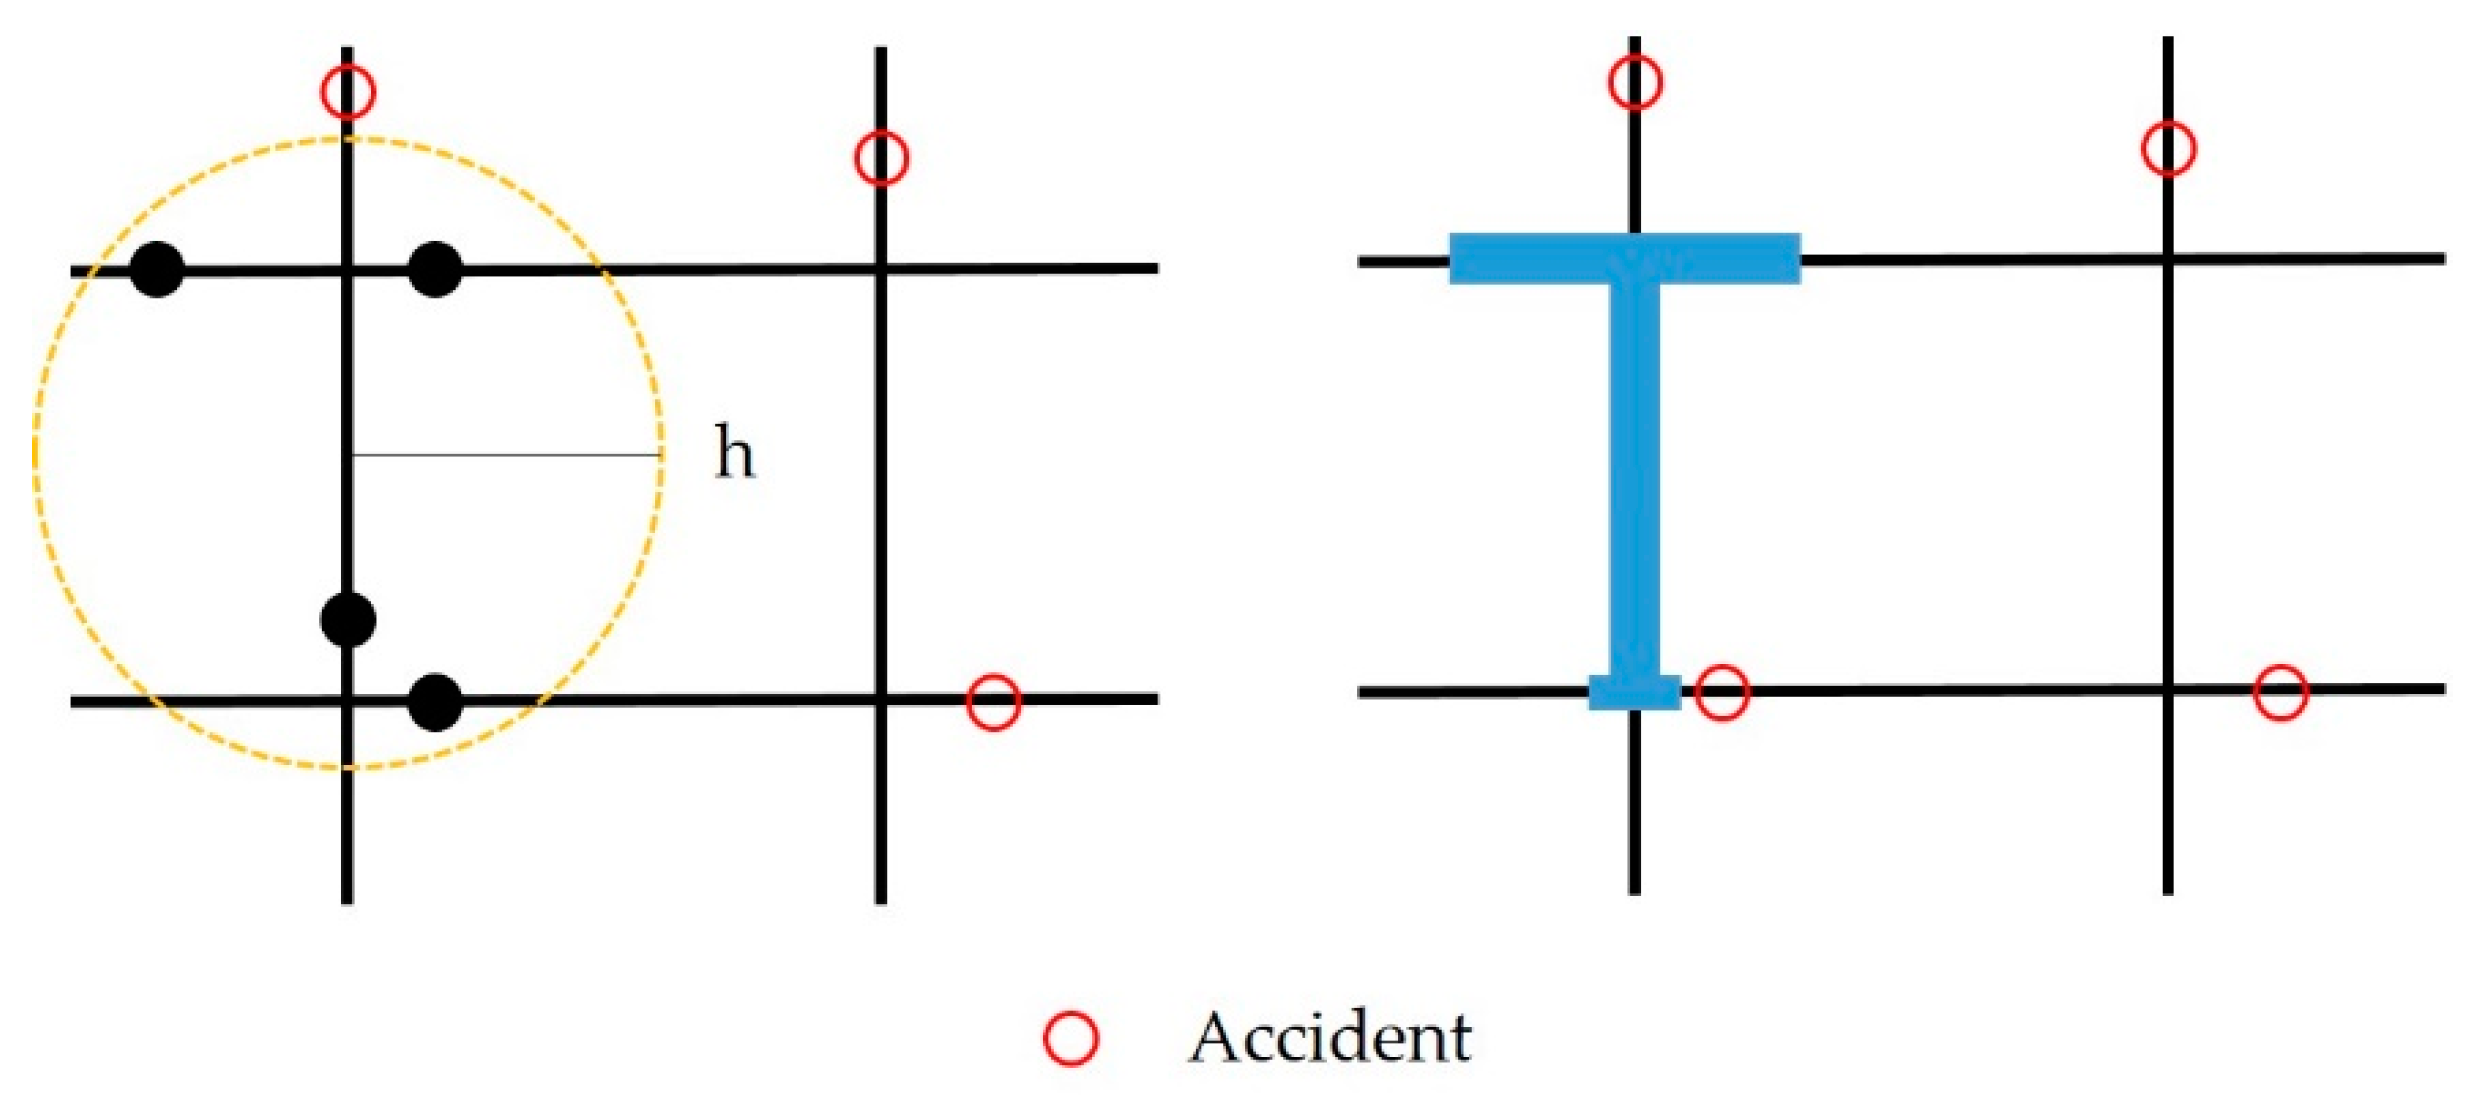
Identifying a black spot mainly depends on the definitions used. In circumstances of the urban road, a black spot may be an intersection, a section of road, or any other location that meets the definition. Therefore, this research mainly focuses on urban road black spot identification. The accident time, number, and location are essential because they provide an advantage in practice. Combined with previous definition research, this research mainly refers to the rules of black spot identification that were promulgated by China in 2001. Ultimately, the urban road black spot is regarded as being the following: For a road section within 500 meters or an intersection within 150 meters, there has to be a history of at least three casualty crashes in any one year, which means that a normal number of accidents is three in 500-meter road section or 150 meters of an intersection a year.

2.2. Distance-Measure Impacts on the Identification of Black Spot

Previous research has shown that the choice of the distance calculation method significantly affects the final results in terms of black spot identification, as shown in Figure 1. In fact, the Euclidean distance that the linear distance between two points is calculated cannot present the real distance between any two accident points, because some special road sections and intersections make urban road conditions complicated.
The comparison results show that accident search results are different between spatial distance and Euclidean distance. As shown in Figure 2, an accident search result that depends on spatial distance is three in a section of road within a certain search range, whereas an accident search result that depends on Euclidean distance is four in the same location within the same range. Thus, it can be known that an accident search method based on Euclidean distance may overestimate the number of accidents.

2.3. Firefly Clustering Algorithm to Identify the Black Spot

According to the distribution characteristics of a traffic accident point, it happens randomly for a single traffic accident. However, when several accidents occur continuously in one place of an urban road within a certain period, they must be impacted or affected by some external factors. This phenomenon of aggregation is very similar to the firefly clustering phenomenon, so this research intends to introduce the Firefly Clustering Algorithm to identify black spots, because it is an efficient, stable, and widely applicable method that is suitable for different types of accident data. In addition, the Firefly Clustering Algorithm can also mine the similarity of accidents.
The Firefly algorithm was developed by Xin-She Yang [17,18] and is based on the idealized behavior of the flashing characteristics of fireflies. To concisely describe our firefly algorithm, this research uses the following three idealized rules:
(1) All fireflies are unisex, so one firefly will be attracted to other fireflies regardless of their sex.
(2) An important and interesting behavior of fireflies is to glow brighter, mainly to attract prey and to share food with others.
(3) Attractiveness is proportional to their brightness, so each agent firstly moves toward a neighbor that glows brighter [19].
The Firefly Algorithm (FA) [20] is a population-based algorithm that is used to find the global optima of objective functions based on swarm intelligence by investigating the foraging behavior of fireflies. In the FA, physical entities (agents or fireflies) are randomly distributed in the search space. Agents are thought of as fireflies that carry a luminescence quality, called luciferin, that emit light proportional to this value. Each firefly is attracted by the brighter glow of other neighboring fireflies. The attractiveness decreases as their distance increases. If there is no brighter one than a particular firefly, it will move randomly. In the application of the FA to clustering, the decision variables are cluster centers. The objective function is related to the sum on all training set instances of the Euclidean distance in an N-dimensional space [21].
Based on this objective function, initially, all the agents (fireflies) are randomly dispersed across the search space. The two phases of the firefly algorithm are as follows.
(1) Variation of light intensity: Light intensity is related to objective values [20]. One maximization/minimization problem is that a firefly with a high/low intensity will attract another firefly with a high/low intensity. Assuming that there exists a swarm of n agents (fireflies) and x i represents a solution for a firefly i , whereas f ( x i ) denotes its fitness value, then here, the brightness I of a firefly is selected to reflect its current position x of its fitness value f ( x ) [18].
I i = f ( x i ) ,   1 i n
(2) Movement towards attractive firefly: Firefly attractiveness is proportional to the light intensity seen by adjacent fireflies [16]. Each firefly has its distinctive attractiveness β that implies how strong it attracts other members of the swarm. However, the attractiveness β is relative and varies with the distance r i j between two fireflies, i and j at locations x i and x j , respectively, which is given as.
r i j = x i x j
The attractiveness function β ( r ) of the firefly is determined by
β ( r ) = β 0 e γ r i j 2
where β 0 is the attractiveness at r = 0 and γ is the light absorption coefficient.
The movement of a firefly i at location x i attracted to another more attractive (brighter) firefly j at location x j is determined by
x i ( t + 1 ) = x i ( t ) + β 0 e γ r i j 2 ( x j x i )
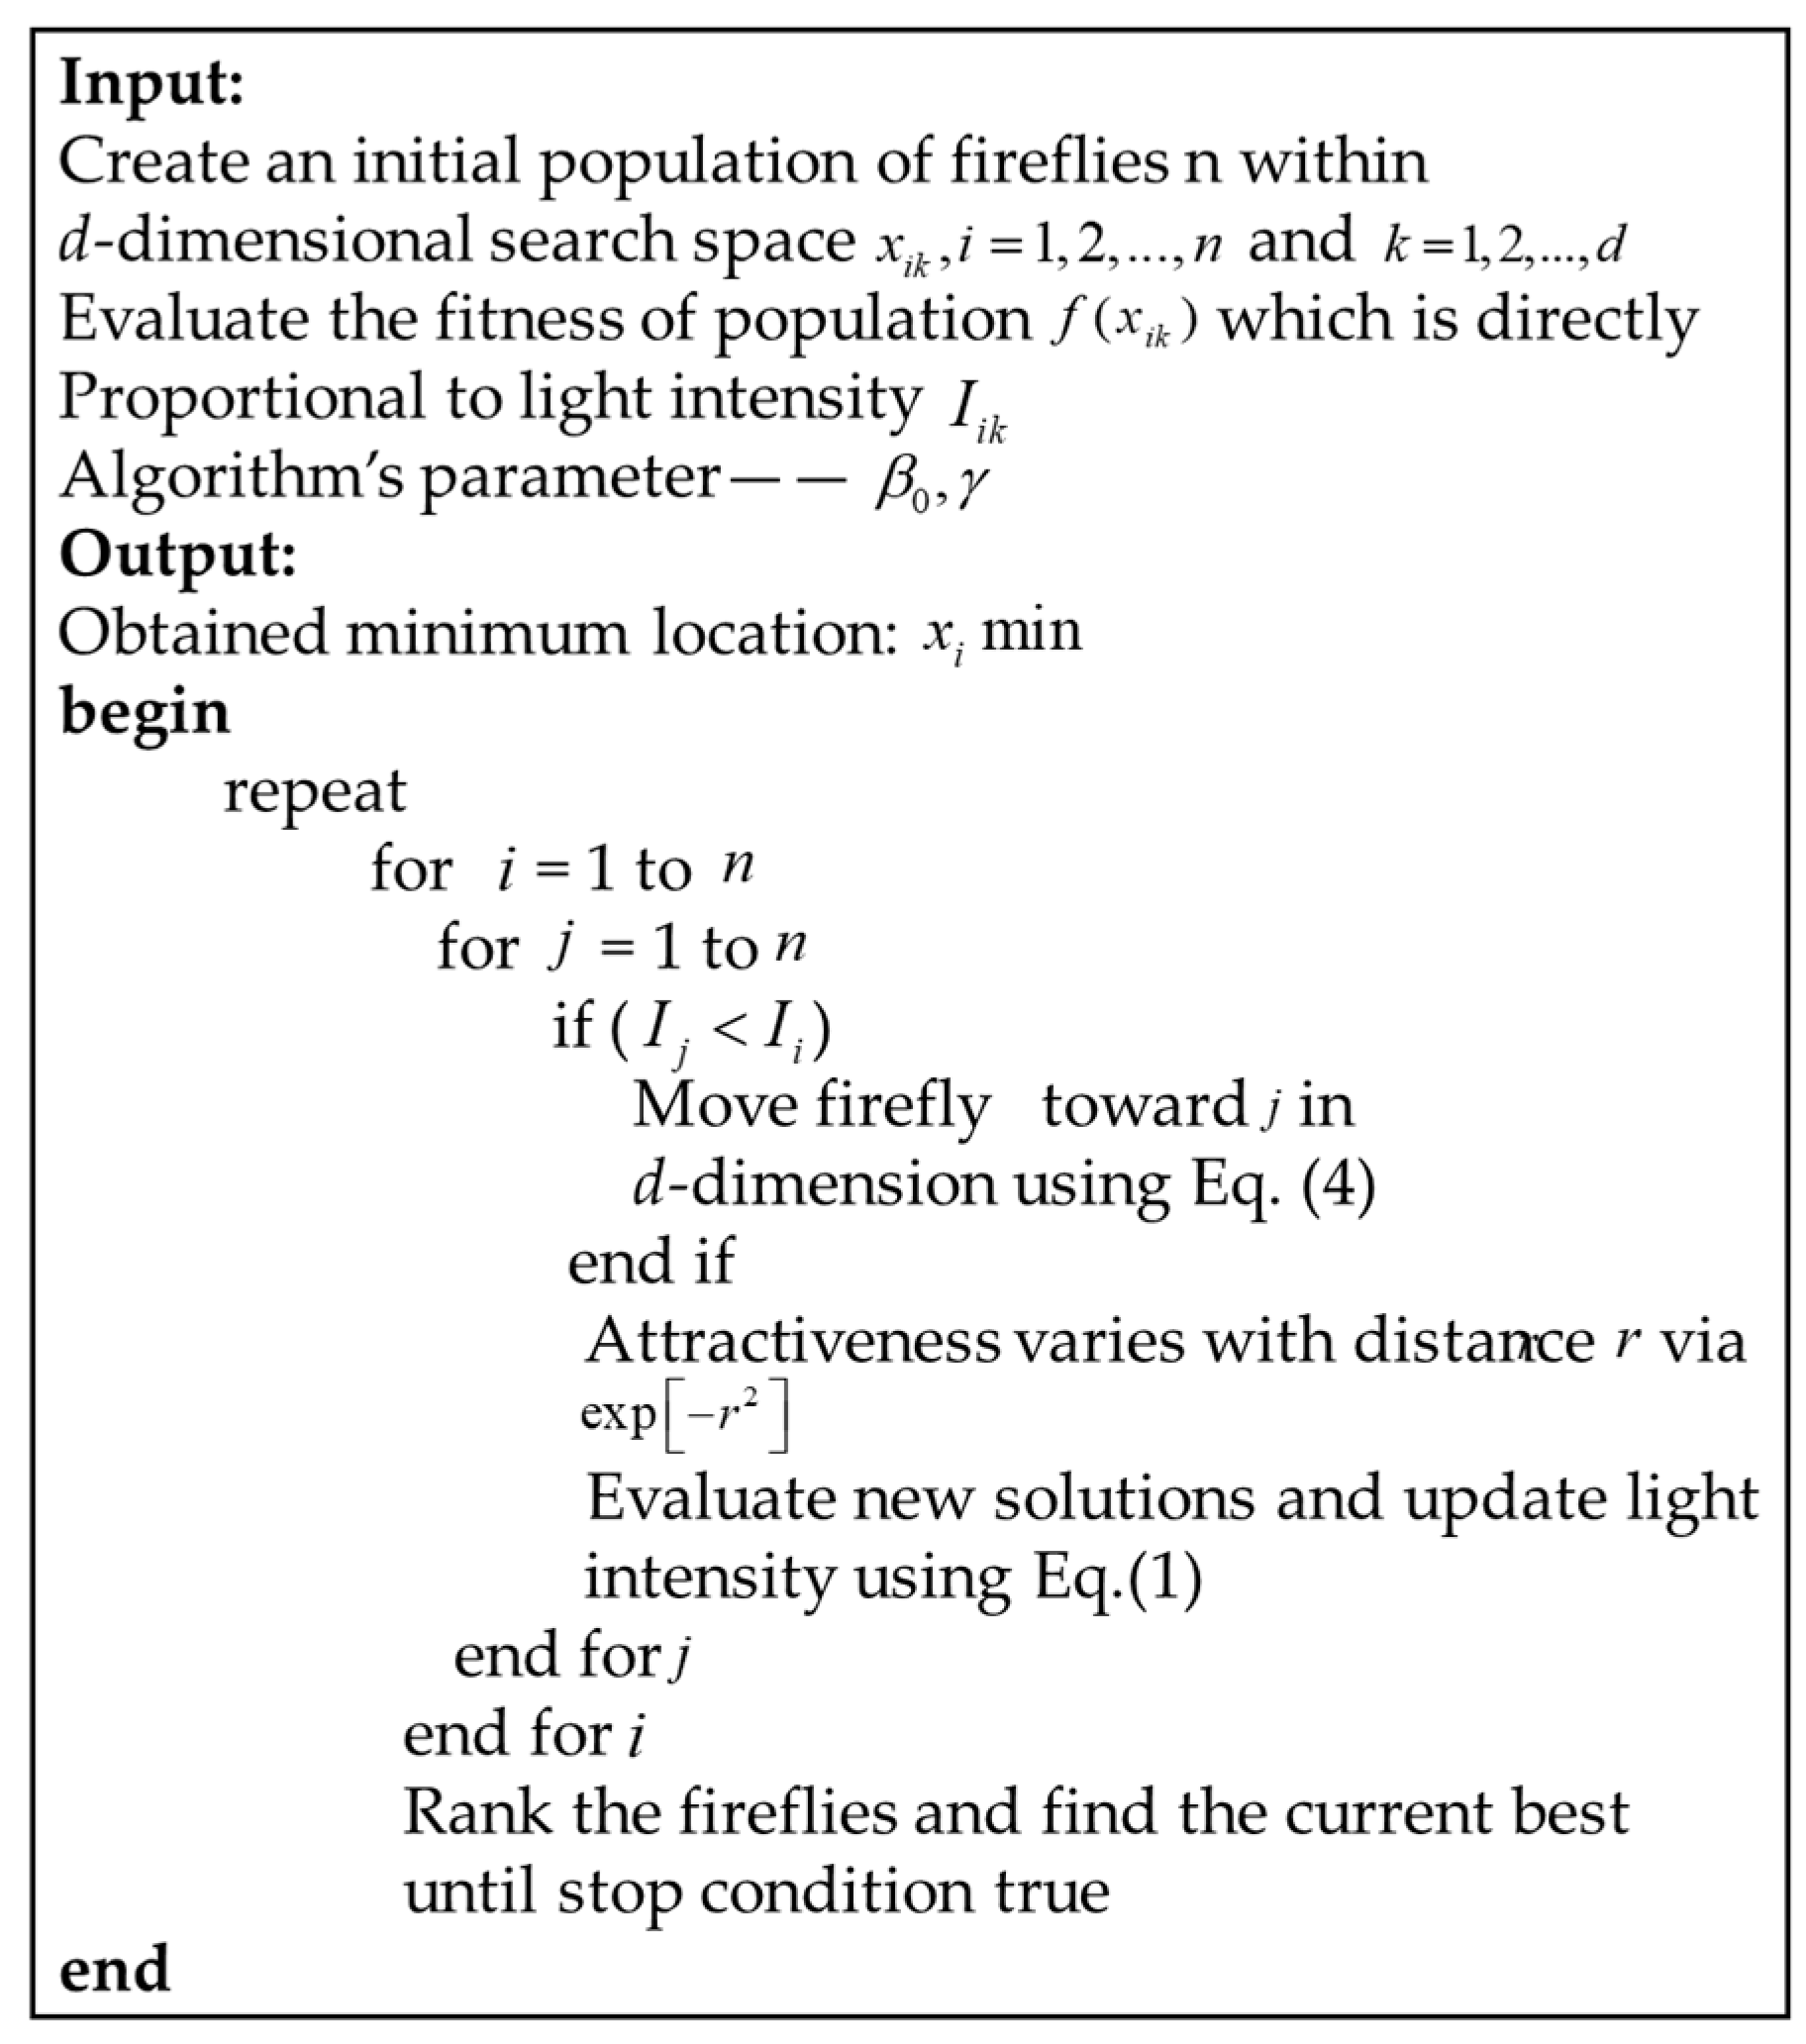
A detailed description of this FA is given in [20]. A pseudo-code of this algorithm is given in Figure 3.
The clustering methods, separating the objects into groups or classes, are developed based on unsupervised learning. In the unsupervised technique, the training data set are grouped first, based solely on the numerical information in the data (i.e., cluster centers) and are then matched by the analyst to information classes. The data sets that we tackled contained the information of classes for each data. Therefore, the main goal was to find the centers of the clusters by minimizing the objective function, the sum of distances of the patterns to their centers [19].
For N given objects, the problem is to minimize the sum of the squared Euclidean distances between each pattern and allocate each pattern to one of the k cluster centers. The clustering objective function is the sum of error squared, as given in Equation (5), is described as in [22]:
J ( K ) = K = 1 K i c k ( x i c k )
where K is the number of clusters for a given n pattern. x i ( i = 1 , 2 , 3 , , n ) is the location of the i t h pattern. and c k ( k = 1 , 2 , 3 , , K ) is the k t h clustering center, to be found by Equation (6):
c k = i c k x i n k
where n k is the number of patterns in the k t h cluster.
The cluster analysis forms the assignment of the dataset into clusters so that it can be grouped into the same cluster based on some similarity measures [23]. Distance measurement is most widely used for evaluating similarities between patterns. The cluster centers are the decision variables that are obtained by minimizing the sum of the Euclidean distance on all training set instances in the d-dimensional space between generic instance x i and the center of the cluster c k . The cost (objective) function for the pattern i is given by Equation (7), as in [21,24]
f i = J = 1 D T d ( x j , p C L ( x j ) )
where D T is the number of training datasets that are used to normalize the sum that will range any distance within [ 0.0 , 1.0 ] and P C L ( x j ) defines the class that instance belongs to according to database.
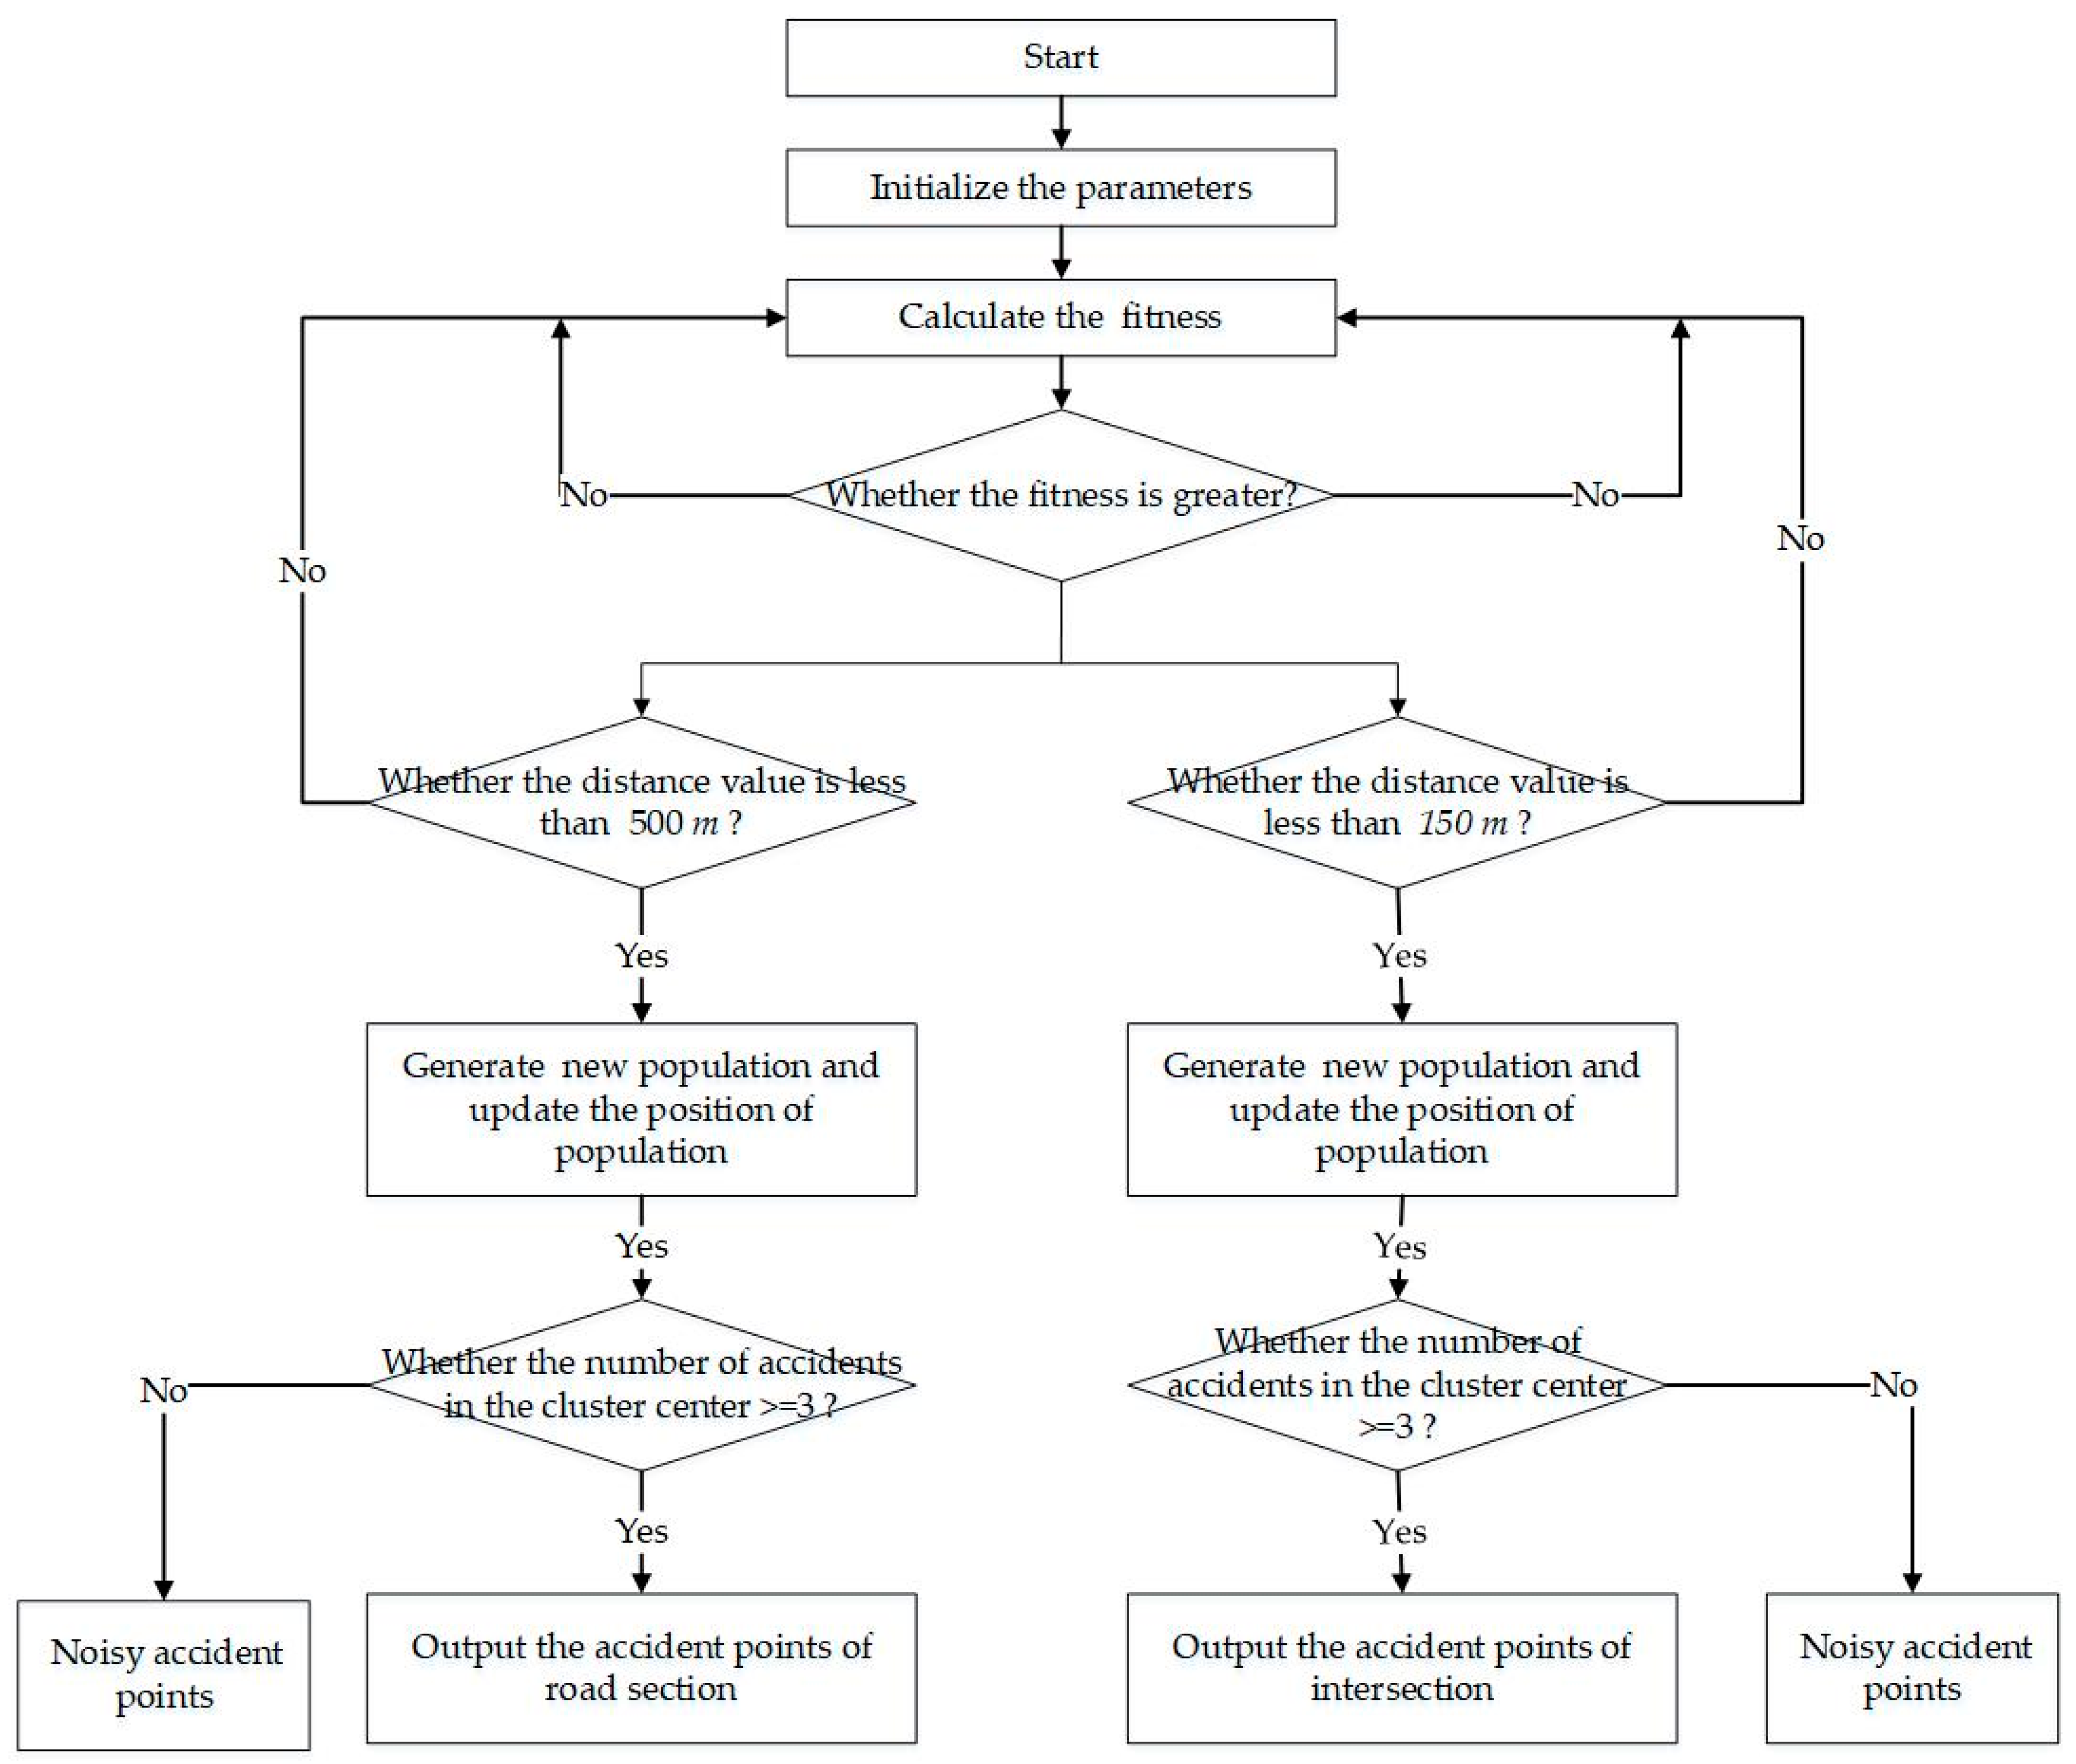
A detailed description of this Firefly Clustering Algorithm is given in [20]. A flowchart of this algorithm is given in Figure 4.

2.4. Study Area and Distance Calculation with GIS

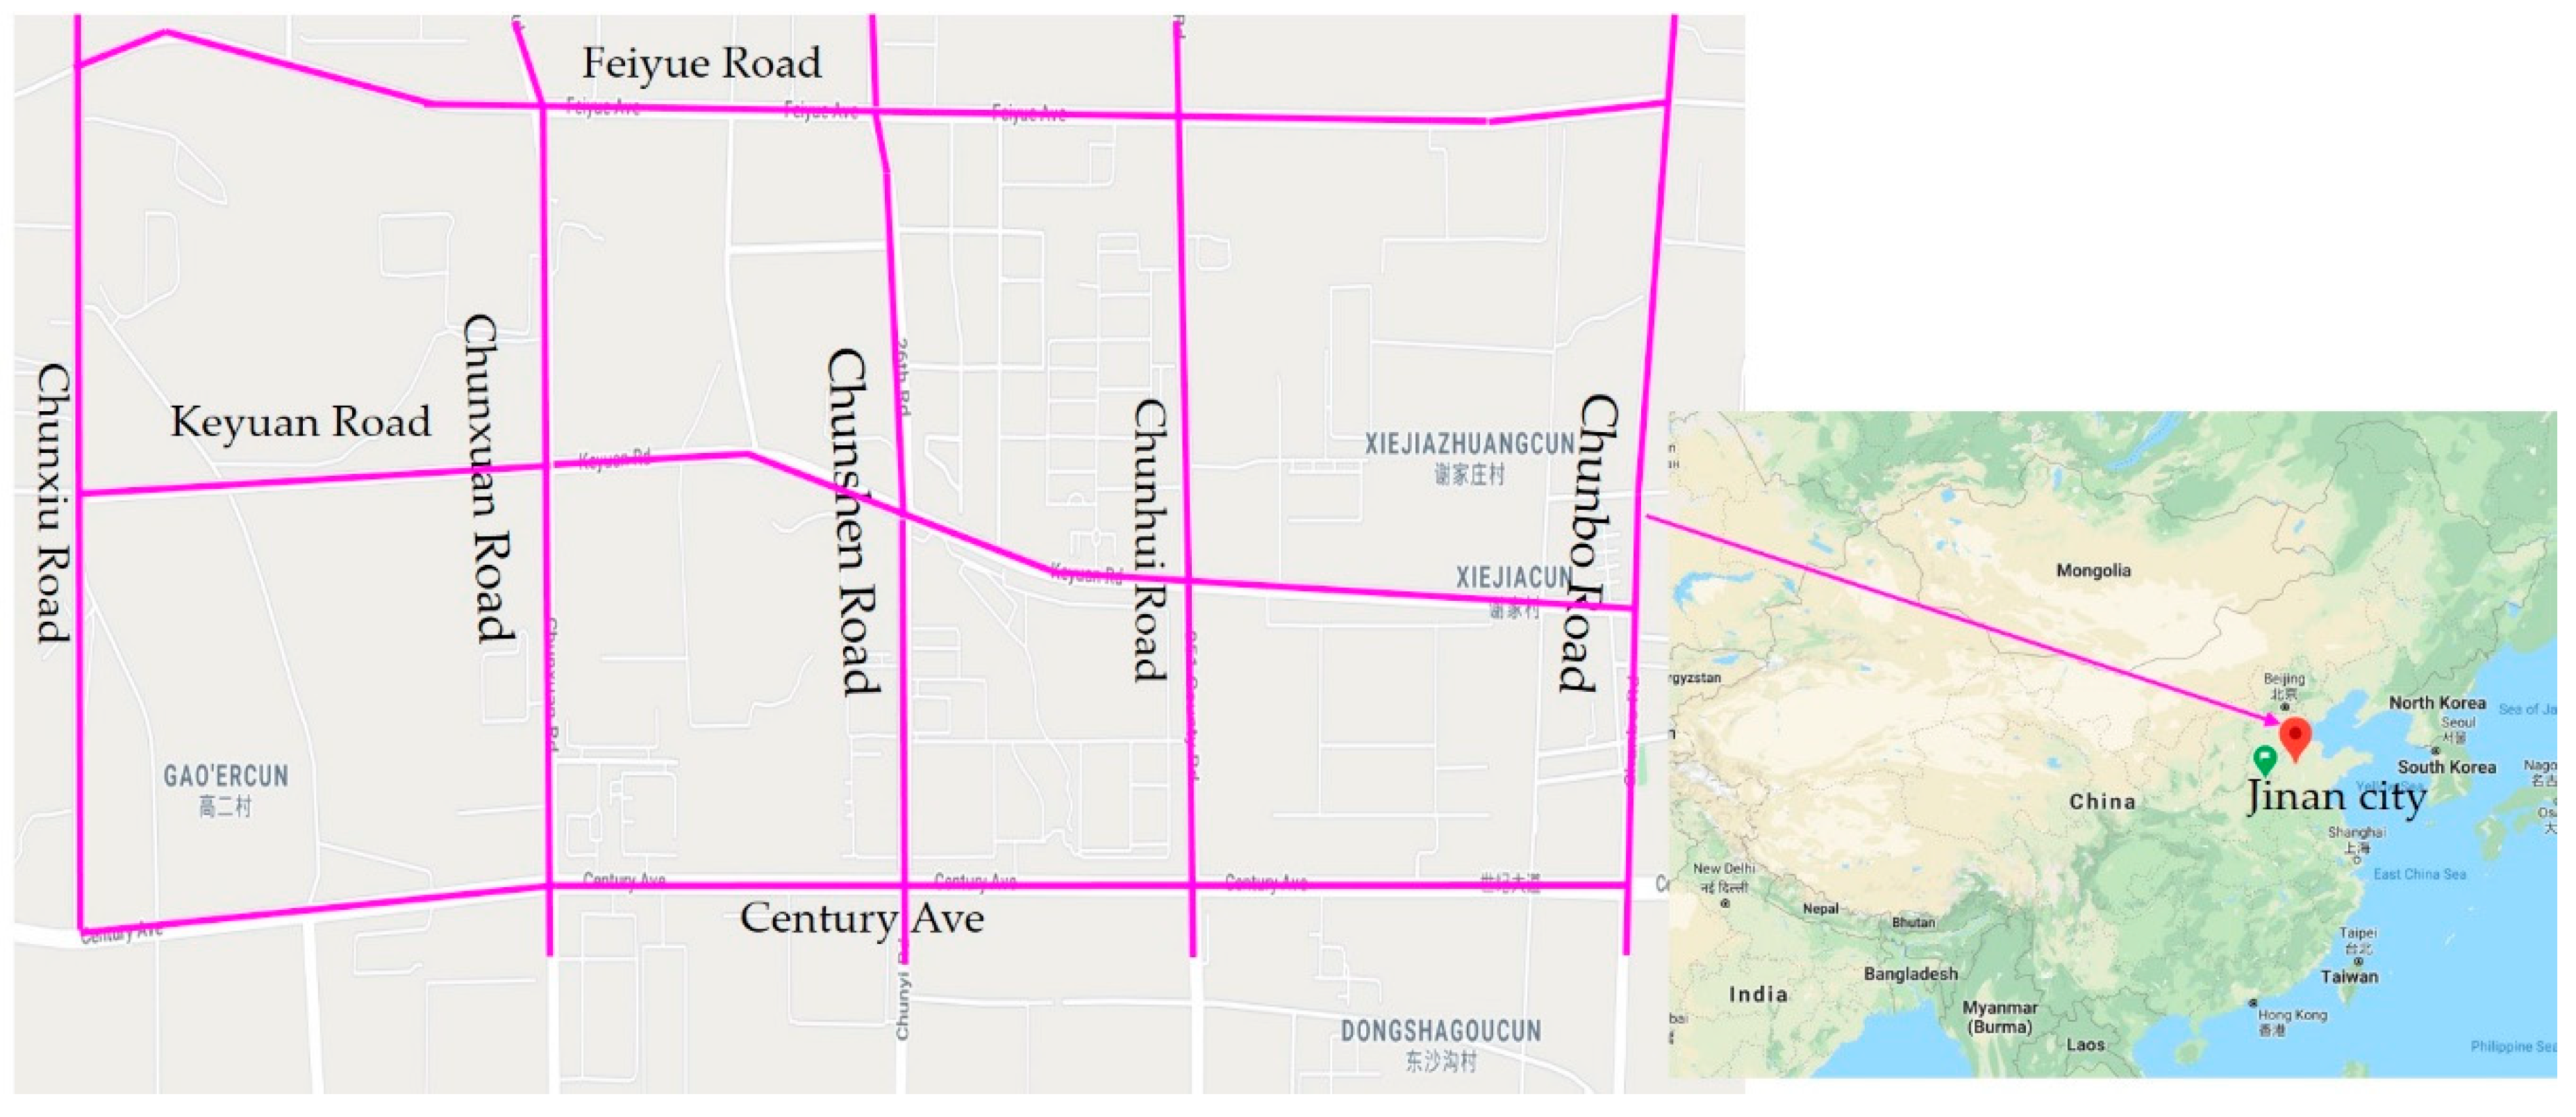
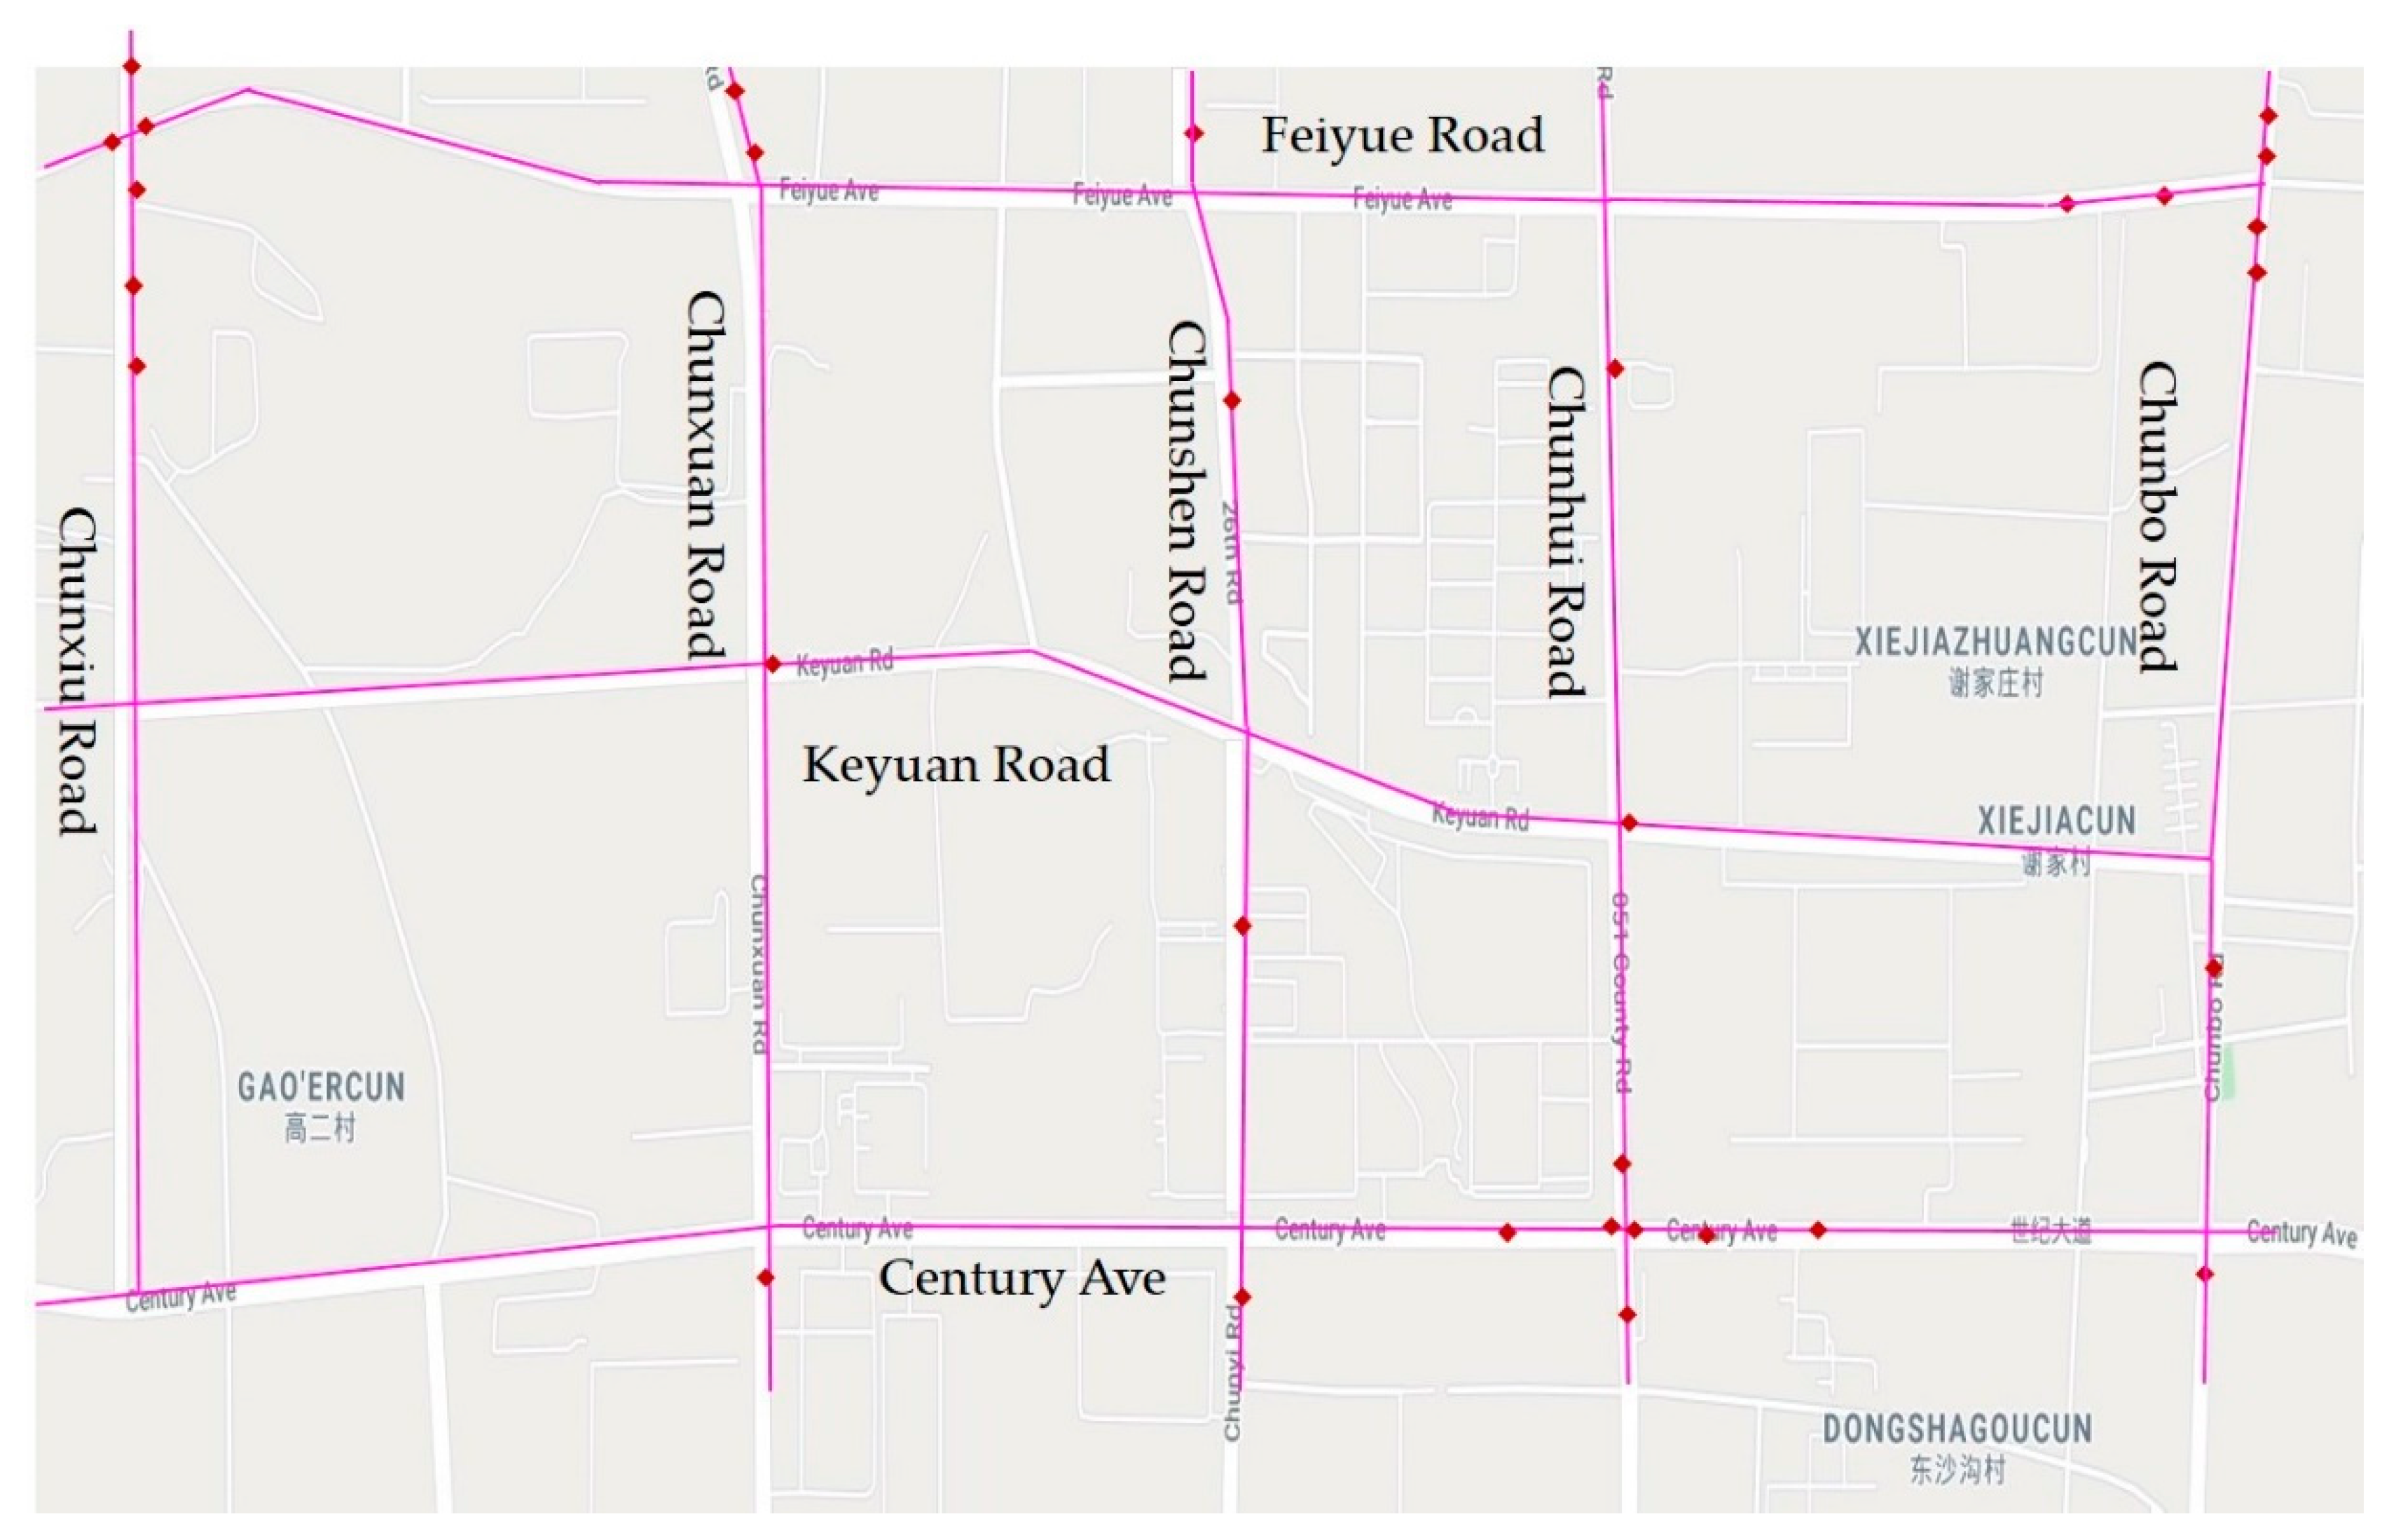
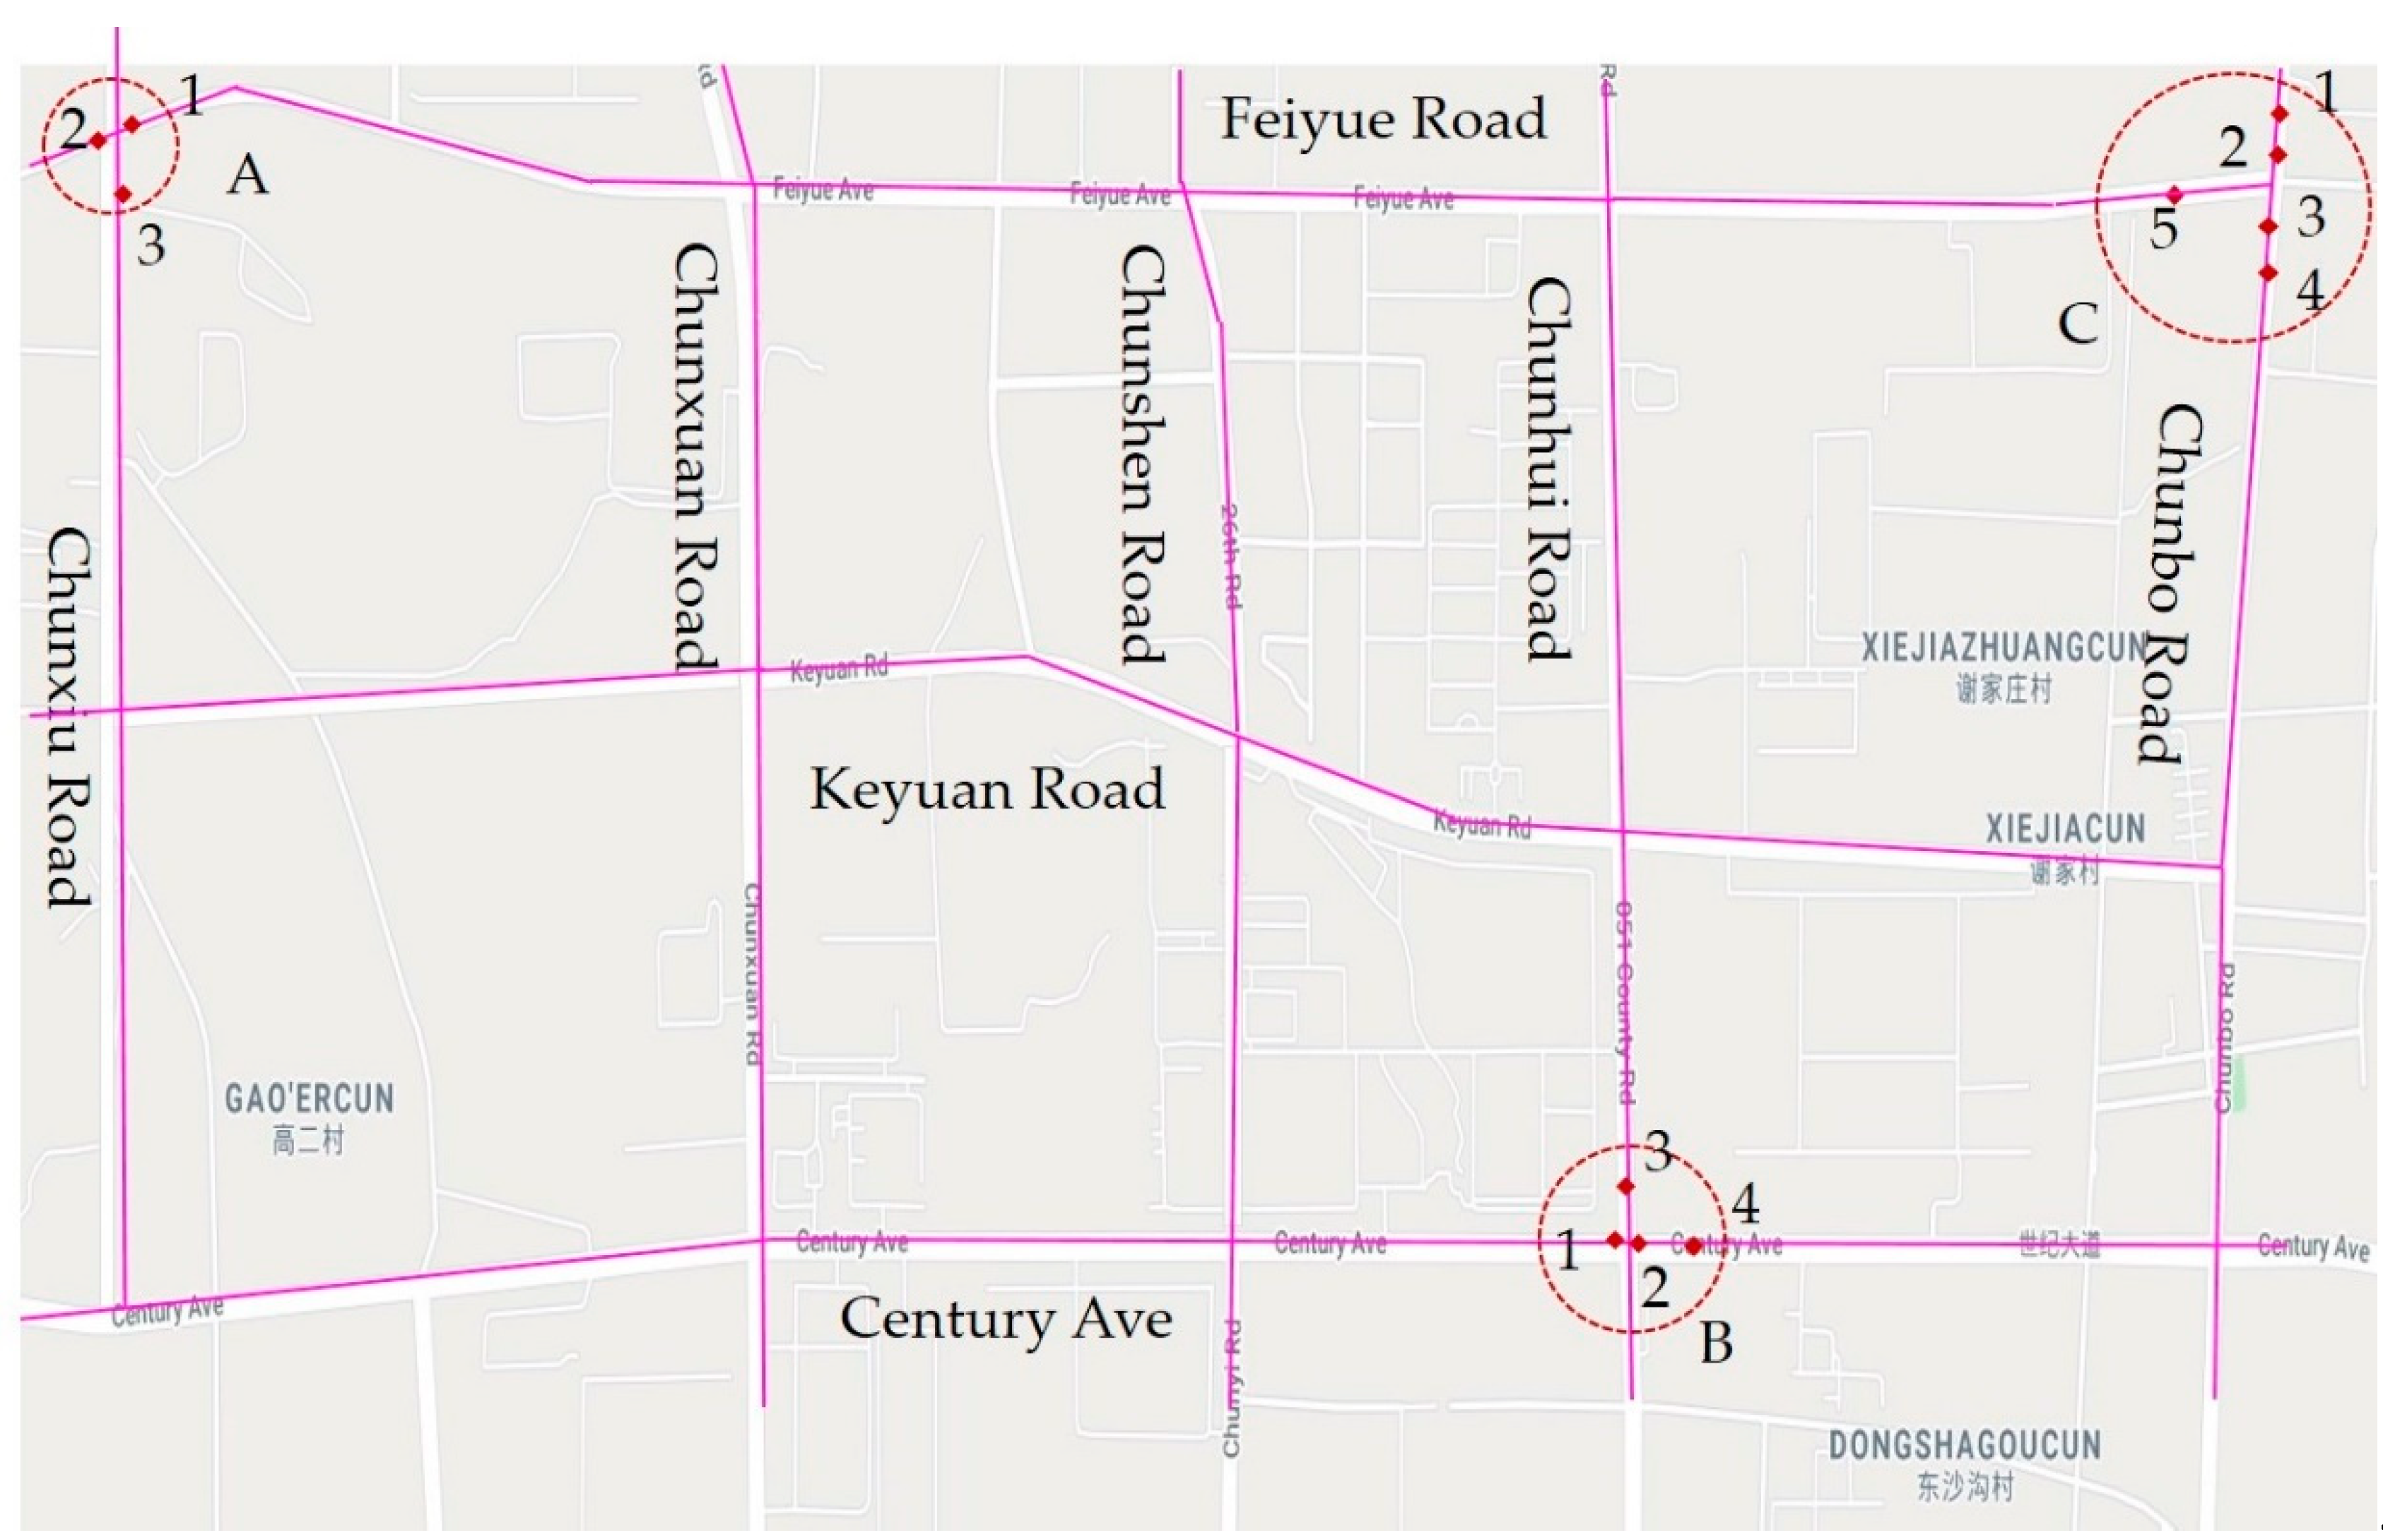
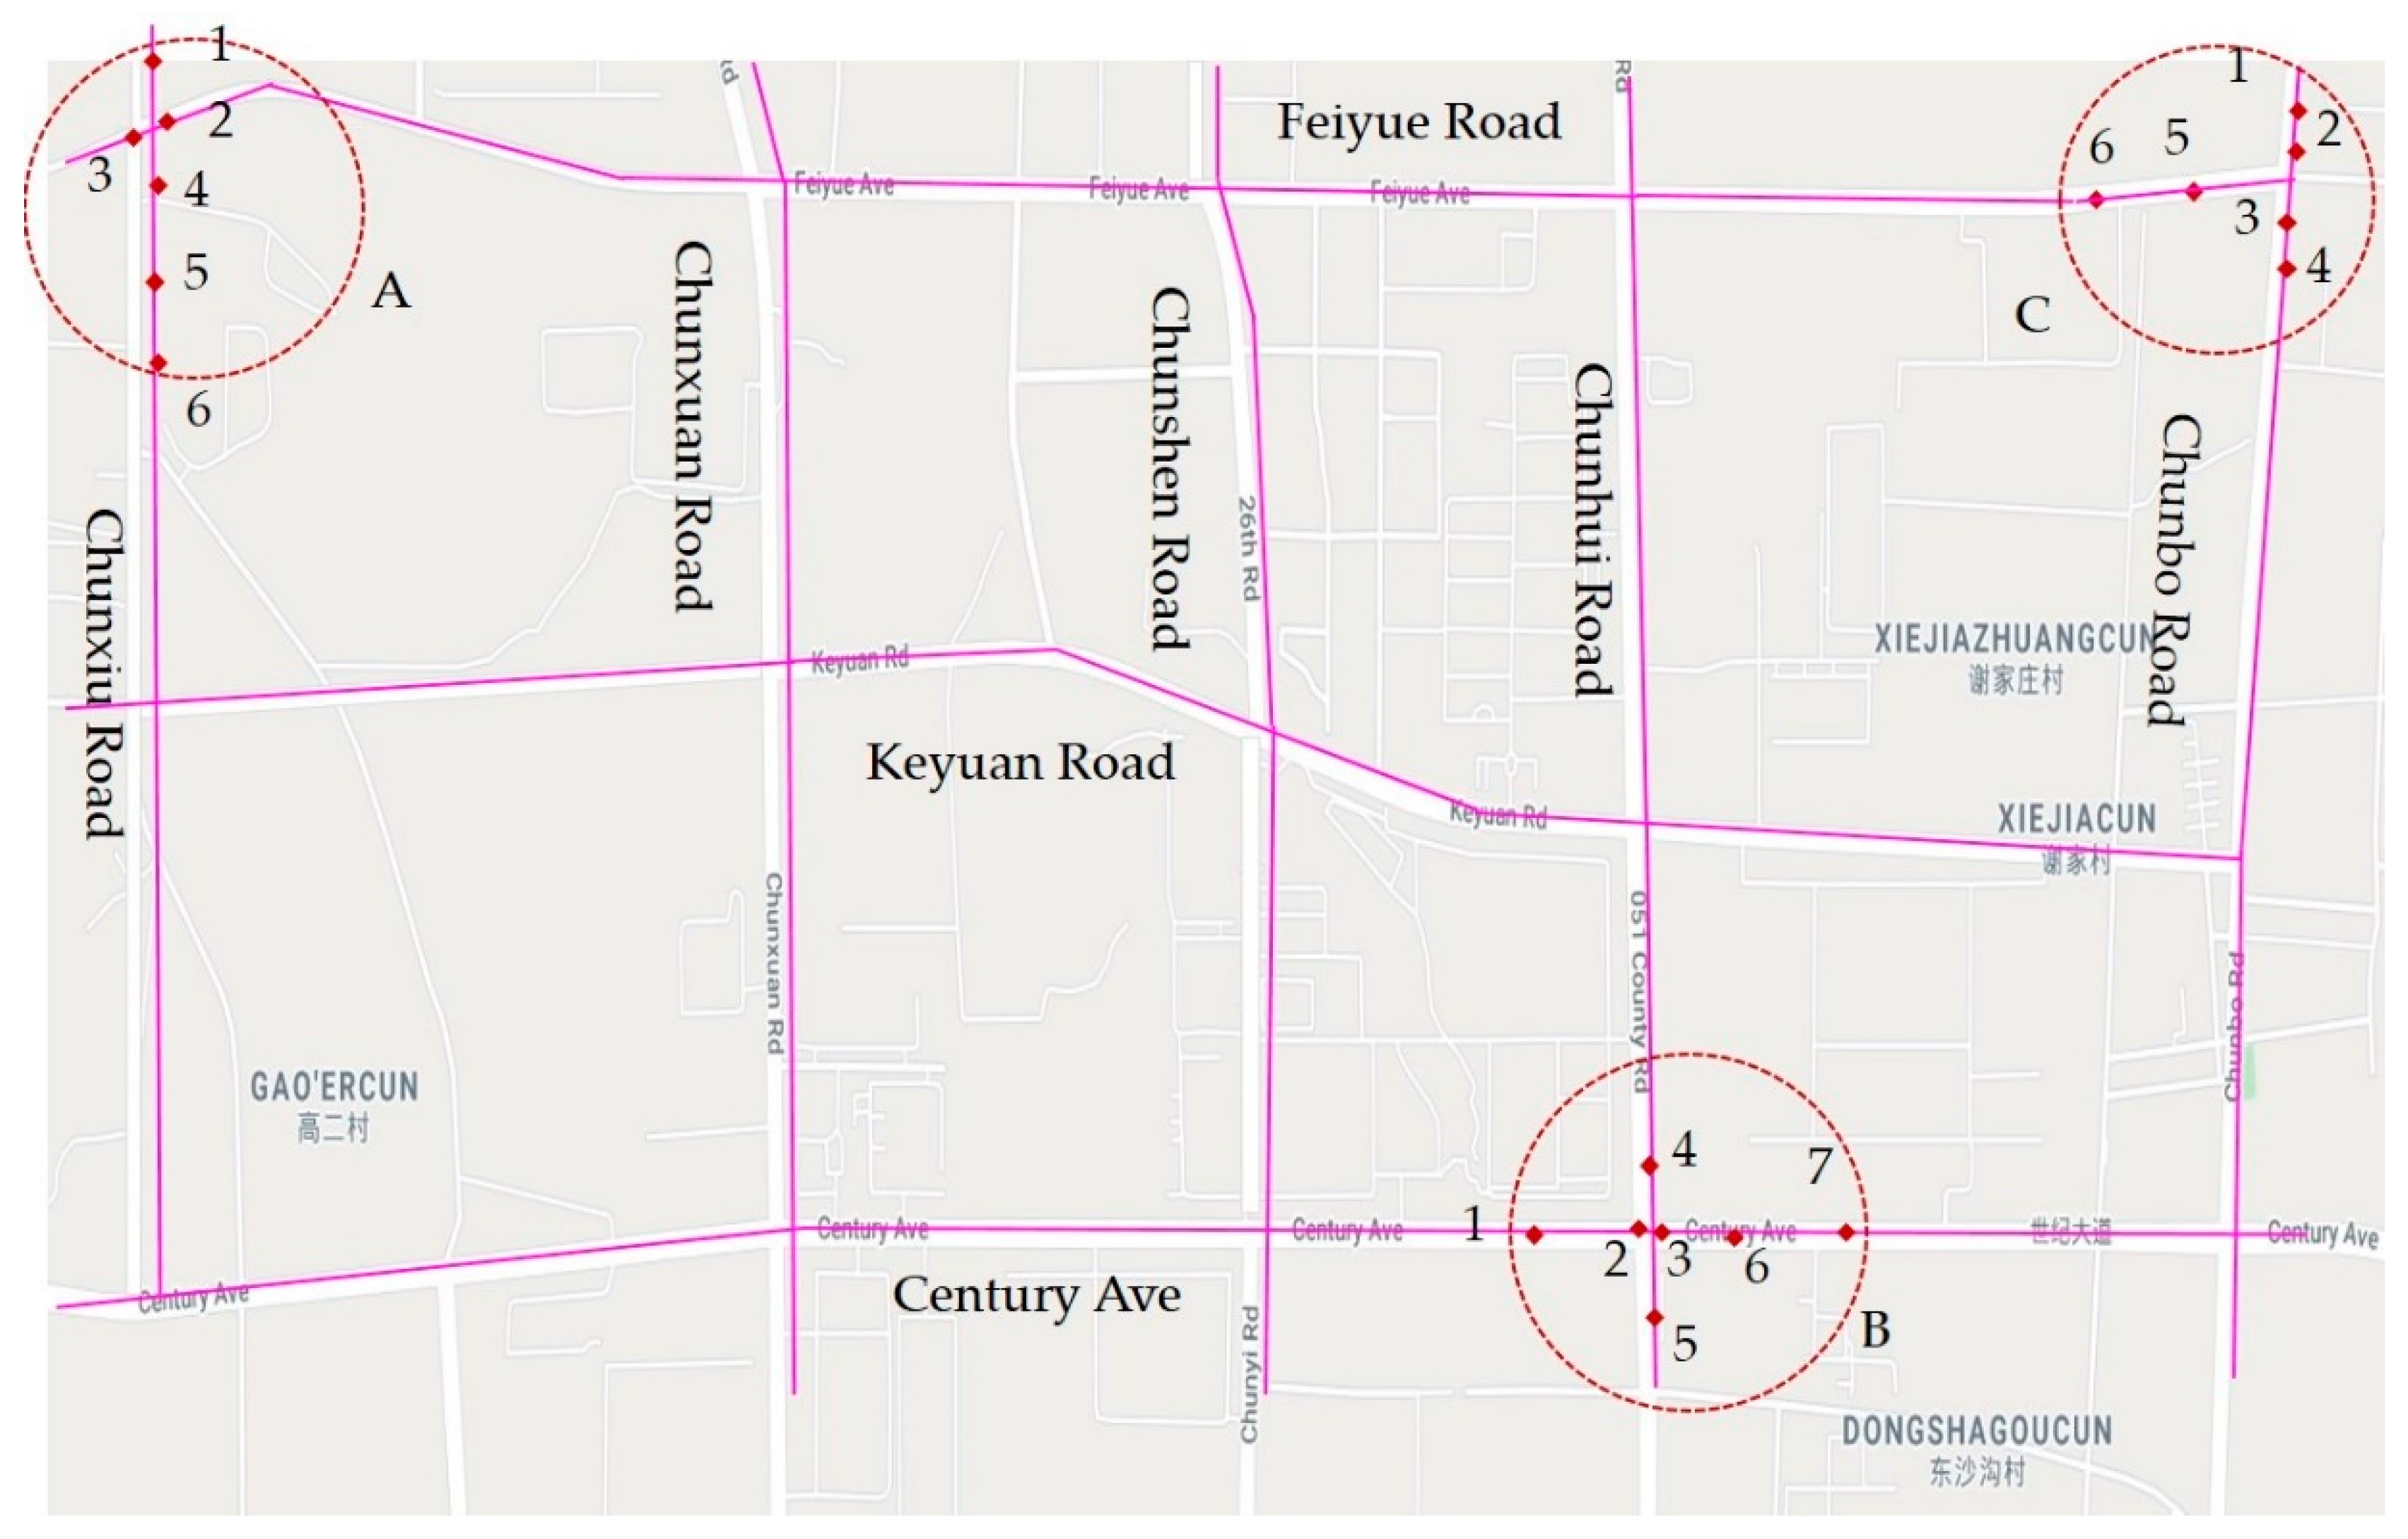
This research used distance calculation with GIS to identify accident black spots and to help improve road safety in urban road contexts. The study area was the “Licheng” district located in the east of Jinan, China. Figure 5 shows the roads in the study area. From north to south, this area contains Feiyue Road, Keyuan Road, and Century Avenue, which are urban main roads with three lanes in each direction. From west to east, this area contains Chunxiu Road, Chunxuan Road, Chunshen Road, and Chunbo Road, which are urban roads with two lanes in each direction. The surrounding areas are all residential and commercial areas, with traffic accidents often occurring in these intersections and road sections in recent years.
This research chose GIS to calculate the distance among accident points. GIS is increasingly being used in road safety research and traffic planning because of its ability to manage, display, and analyze spatial data [25]. A critical issue when using GIS in the identification of black spots is the procedure for calculating distances. Here, the distance calculation was carried out with ArcGIS 10.0, because the ArcGIS spatial analyst can provide several distance mapping tools for measuring distance, especially when the location of an accident is roughly described in CAD (Computer Aided Design) files. Therefore, this research adopts the origin–destination (OD) cost distance to indicate the shortest distance between the accident points because the OD cost distance not only means the least-cost or shortest path from a chosen destination to the source point but also signifies additional factors beyond the cost surface to account for the actual travel distance over the terrain.
Taking the traffic accident data of study area as an example, the detailed procedures were as follows:
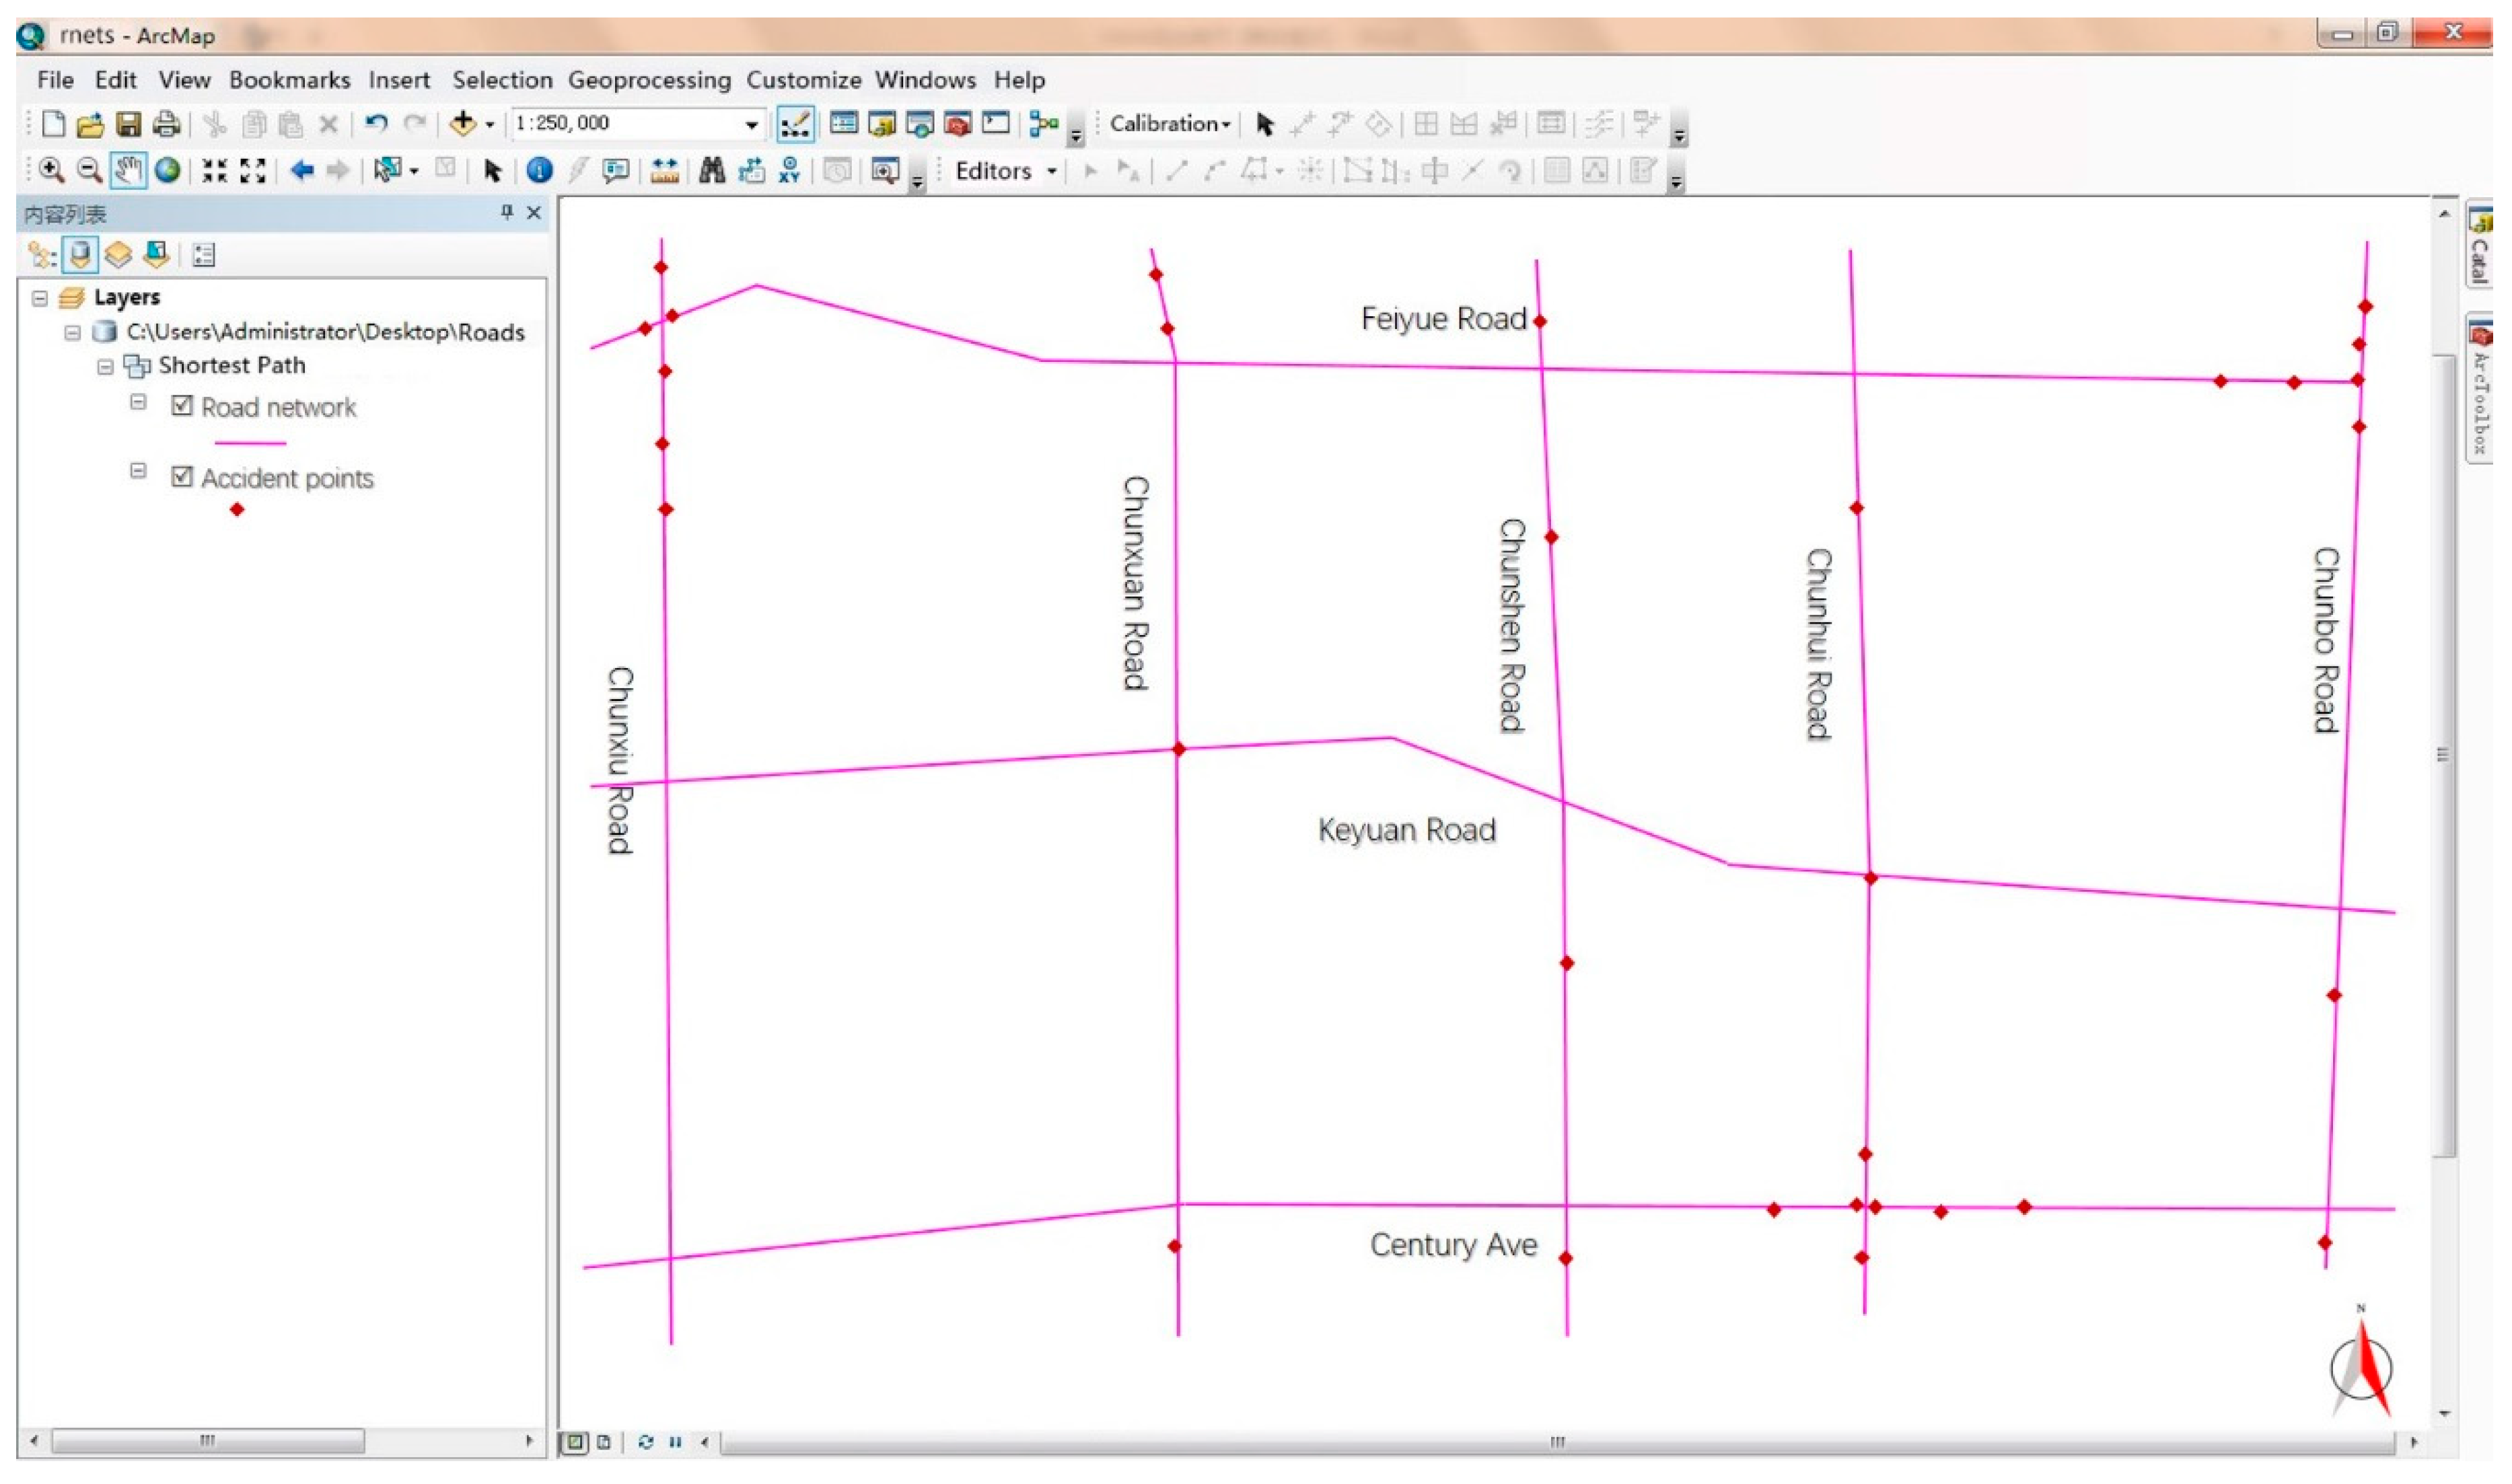
(1) Establishment of the road network.
(i) Prepare the road network CAD file (including the accident points) and import it into the ArcGIS platform, correcting the wrong sections and nodes to obtain the basic data of the road network so that it can pass the topology inspection.
(ii) Interrupt the basic data of the road network at nodes according to road connectivity.
(iii) Employ the ArcGIS software to create road network data set. The result is given as shown in Figure 6.
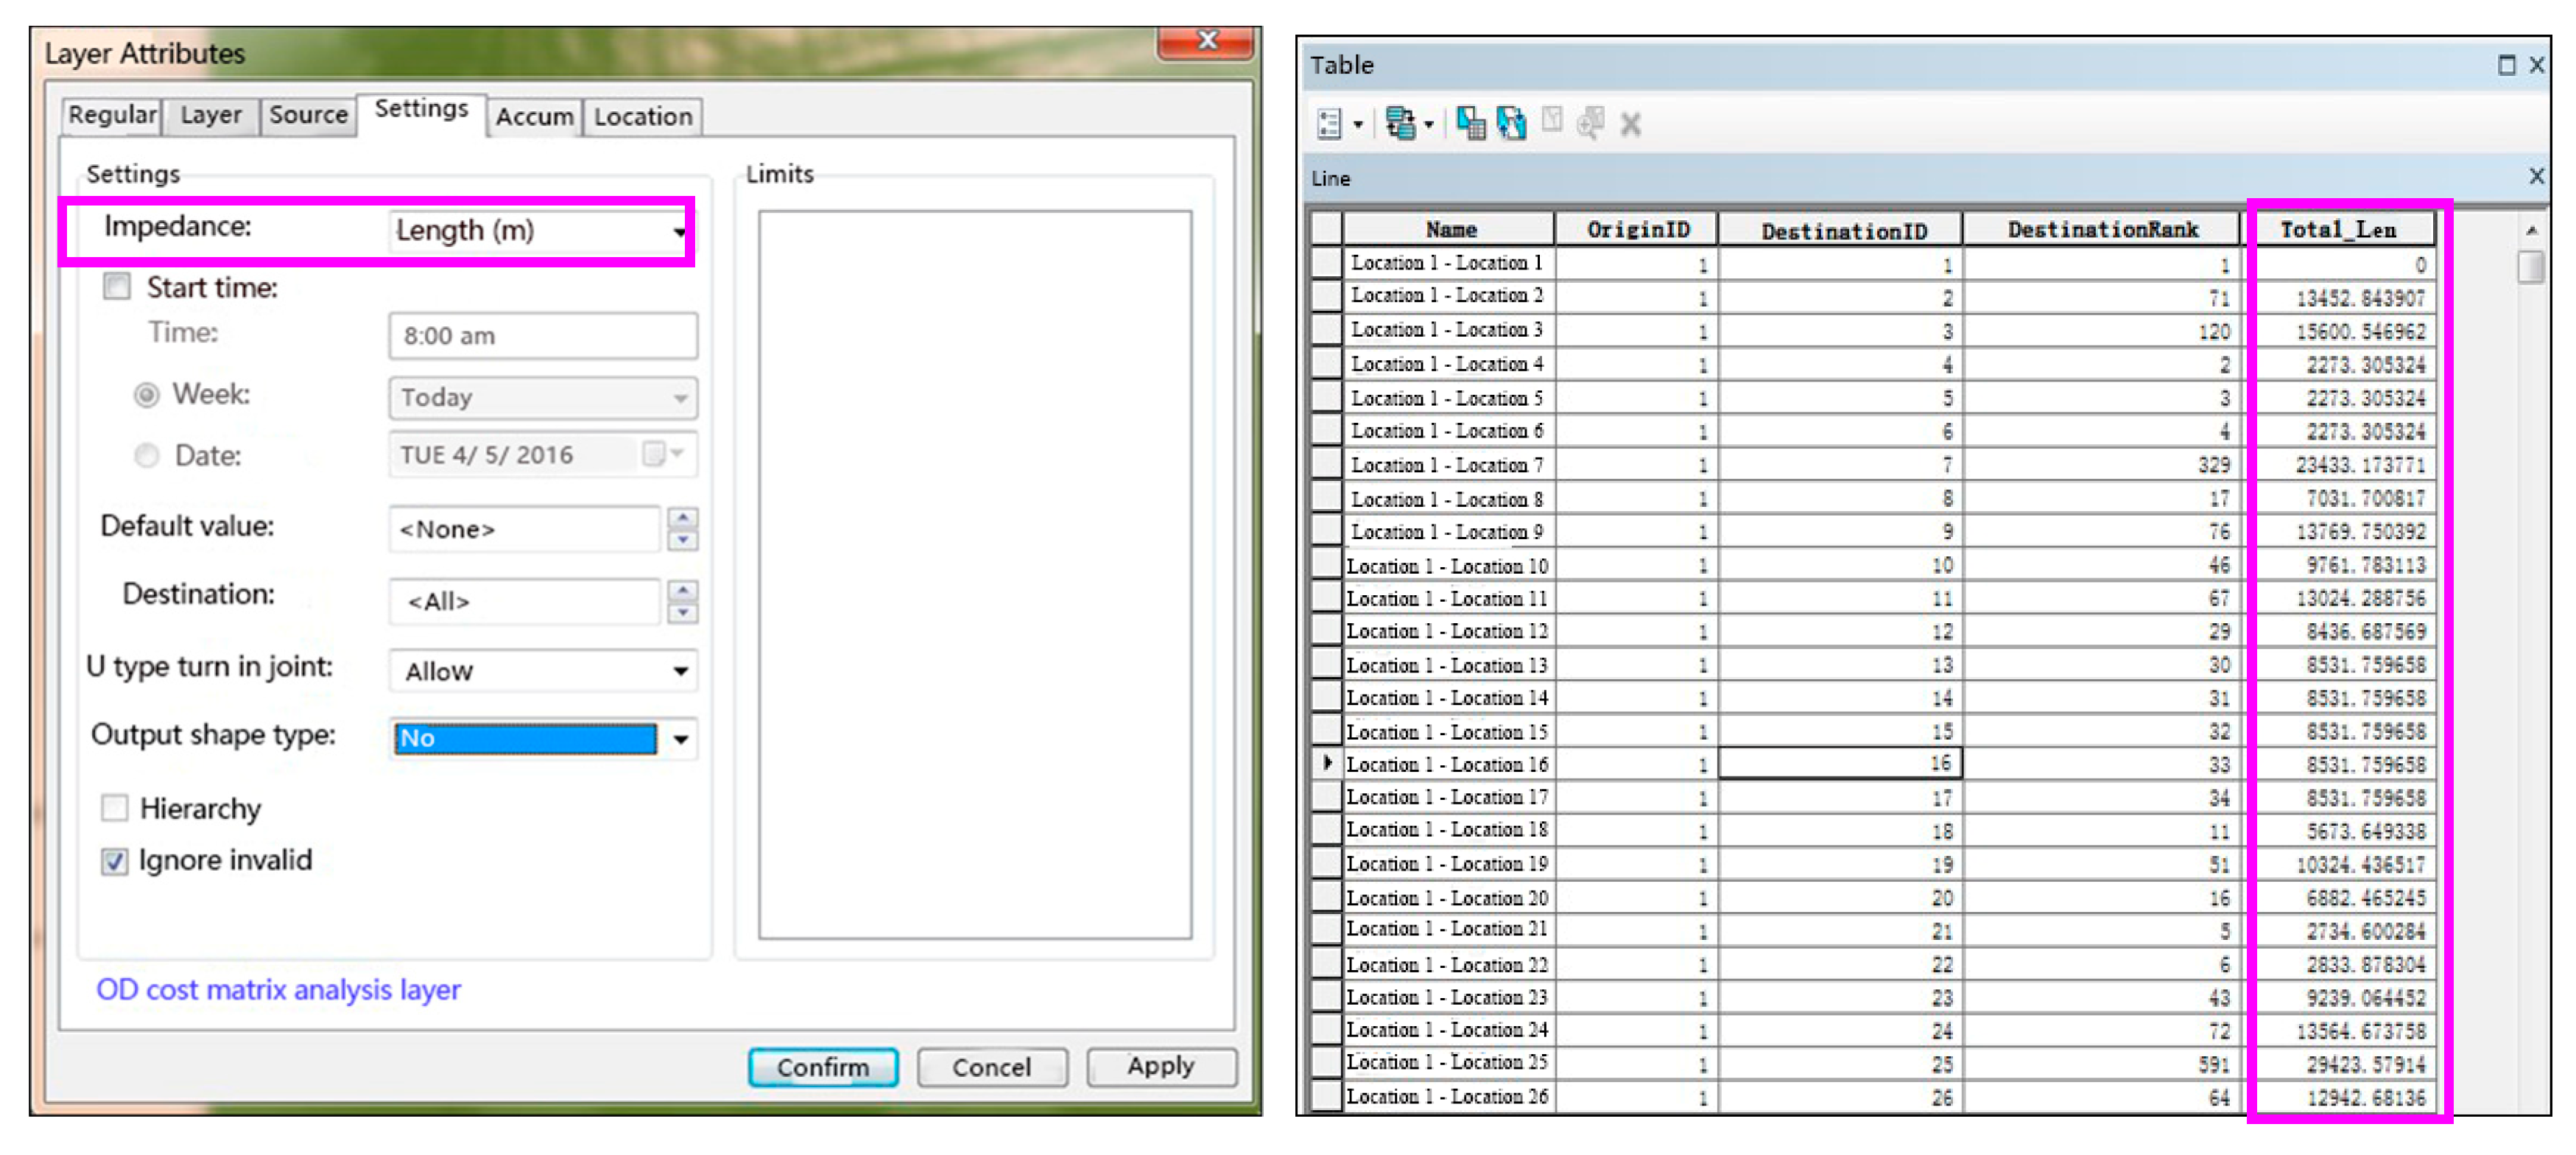
(2) OD cost distance calculation with GIS.
(i) Set the accident point as the start and end point of the OD distance matrix and create the point pair OD distance matrix, as the OD cost distance matrix in the network analysis is used to calculate the distance of road length between point pairs.
(ii) Output the road network distance diagram and sort the data to obtain the distance between the accident points. The calculated distance of point pair is the shortest distance between accident points.
The detailed procedure and output are described as shown in Figure 7.

3. Results

3.1. Firefly Clustering Algorithm and OD Cost Distance

In order to verify the feasibility of the proposed method based on the Firefly Clustering Algorithm and GIS, some regional traffic accident points of Section 2.4 were selected for simulation. The initial distribution of accident points were partly exhibited on GIS, as shown in Figure 8.
The Firefly Clustering Algorithm was implemented as the introduced procedures of Section 2.2 based on secondarily-developed GIS. The most important step of the algorithm is setting parameters; this research set the road section to 500 m, intersections to 150 m, and the number of accident parameter to three, according to the definition of urban black spots. After the clustering, the data with the number of accidents less than the threshold value in the clustering center were defined as the noisy accident point and the clustering result is displayed on GIS, as shown in Figure 9.
As shown in the result, three clusters of accident points were output through the Firefly clustering analysis, and the points without clusters were noisy accident points, which had been excluded. Consequently, intersections A, B, and C were identified as black spots, and the number of accident points of black spots was three, four, and five, respectively. The results showed that there were no black spots on other intersections and road sections except for on intersections A, B, and C, which was basically consistent with the initial accident point distribution.

3.2. Firefly Clustering Algorithm and Euclidean distance

In addition, Euclidean distance was also applied to the Firefly clustering analysis to verify the sensitivity of the distance calculation. Setting the same parameters of the Firefly Clustering Algorithm as Section 3.1, the results were intuitively displayed on GIS. The clustering results showed that intersections A, B and C were also identified as black spots, and the number of accident points in clustering centers A, B, and C was six, six, and seven, respectively. Moreover, the number of accident points identified with Euclidean distance was more than those identified with the method with OD cost distance, as shown in Figure 10.
The results showed that the novel method that combined Firefly Clustering Algorithm and OD cost distance could identify the urban black spots and accurately evaluate the condition of the black spots. However, the method based on Euclidean distance could overestimate the number of black spots, especially in the intersections. Therefore, the proposed method based on the Firefly Clustering Algorithm and GIS could not only contribute to identifying urban road black spots but could also play an auxiliary role in evaluating the condition of black spots, which will help reduce urban road crashes and maintain urban sustainable development.

3.3. Comparison Results between OD Cost Distance and Euclidean Distance

Due to the Euclidean distance method overestimating the number of accident points, it was important that this research discuss whether the identified accident points could be really associated with the intersection by comparing the accident reports. As described in the accident reports shown in Table 3, Table 4 and Table 5, some accident points’ location records were not intersections, such as accident points 1, 5, 6 of black spot A, accident point 6 of black spot B, and accident points 1, 5, 7 of black spot C. Therefore, the Firefly Clustering Algorithm and Euclidean distance method could overestimate the number of accident points. However, the novel Firefly Clustering Algorithm and OD cost distance method could effectively and accurately identify black spots.
The comparison results showed that the accident search result was different when using Euclidean distance and when using OD cost distance. Take identified black point A shown in Figure 9 and Figure 10 as an example: The accident search result that depended on OD cost distance was three in a road intersection within a certain search range, whereas, the accident search result that depended on Euclidean distance was six in the same location within the same range.

3.4. Further Analysis between OD Cost Distance and Euclidean Distance

The distance calculation method can significantly affect the final results in terms of black spot identification. As the distance from each accident point to the cluster center was calculated, it can be found that the Euclidean distance was generally smaller than the OD cost distance. Therefore, the two clustering centers were offset in the clustering analysis, which impacted on the identification of black spots. The average variation of the coefficient of distance for black spots A, B, and C was 34.13%, 19.79%, and 21.20%, respectively, and the detailed contents of such are discussed in Table 6, Table 7 and Table 8.
From Table 6, Table 7 and Table 8 and Figure 11, the following can be observed:
(1) The Euclidean distance was less than the OD cost distance, so it is concluded that the Euclidean distance cannot present the real distance in complicated urban road circumstances, and the OD cost distance can present the real distance among accident points.
(2) When the distance among accident points was smaller, the variation coefficient of the distance of accident points was smaller between the Euclidean distance and the OD cost distance.
(3) The identifying number of accident points with the OD cost distance was more than that with the Euclidean distance, so it is concluded that the Firefly Clustering Algorithm with GIS can effectively identify black spots in urban road systems.

4. Discussion

Distance can impact black spot identification. Generally, Euclidean distance, which indicates the linear distance between two accident points, has been used to identify black spots in previous research. Due to this linearity, it cannot accurately represent the real distance between any two accident points in complicated urban road conditions. According to the characteristics of black spots, a clustering algorithm is usually used in black spot identification, and Euclidean distance is the basic choice in the clustering process among the accident points. Ultimately, this type of distance overestimate the number of accidents, especially in road intersections. Furthermore, the location of accident points has been roughly recorded in the various pieces of research of black spot identification, meaning the spatial distance among accidents cannot be accurately calculated.
In order to accurately identify urban road black spots, the Firefly Clustering Algorithm and GIS have been introduced in this paper, showing OD cost distance can be calculated in GIS, because it accounts for actual travel distance and is thus close to the real space distance. In addition, the Firefly Clustering Algorithm is suitable for different types of accident data and can quickly mine the similarity of accidents. The results implied that identifying the number of accident points with the OD cost distance is better than that with the Euclidean distance, especially in road intersections. The method with Euclidean distance identifies some accident points of road sections as intersection black spots, but OD cost distance can cover this disadvantage. The proposed black spot identifying method could effectively identify black spots in urban roads.
This paper used a case study to explore the effects of the proposed method on black spot identification in urban road intersections. Future research should concern the detailed location description of accidents, such as the coordinate data of accident points. Moreover, the black spot identification method could be used in the scenario of a flyover, with this proposed method validated by case tests.

5. Conclusions

The paper proposed a novel identification method based on the Firefly Clustering Algorithm and GIS to solve the existing problem of the inaccurate identification of urban road accident black points. The Firefly Clustering Algorithm can abstractly represent the characteristics of road traffic accidents, whilst GIS has advantages in spatial object management and analysis. Considering the shortcomings of the Firefly Algorithm with the Euclidean distance measurement in spatial distance calculation, an OD cost distance calculation based on GIS road network was introduced to improve the accuracy of identifying urban road accident points. Moreover, the paper also verified the feasibility of this algorithm with the accident data of a certain area and proved that the clustering effect is much better than the common firefly clustering effect, especially in intersections. Finally, the paper made a sensitivity analysis of distance calculation between Euclidean distance and OD cost distance. The results showed that Euclidean distance provides lesser results than OD cost distance, and the accident search method based on Euclidean distance can overestimate the severity of accidents. The proposed Firefly Clustering Algorithm based on OD cost distance can not only effectively overcome this shortcoming but also accurately identify the black spots and purposefully provide decisions for solving urban road safety problems, which is helpful for decreasing socio-economic losses and promoting the sustainable development of cities.

Author Contributions

All authors contributed to the conceptualization of this paper, as well as the methodology and data analysis. T.Y. mainly focused on the writing, reviewing and editing of the paper, while X.Z. and T.S. provided the supervision, project administration and financial acquisition. All authors have read and agreed to the published version of the manuscript.

Funding

This research was funded by National Independent Innovation Demonstration Region Project (201705-JD-C1085-056 & 201705-JD-C1085-072).

Conflicts of Interest

The authors declare no conflict of interest.

References

  1. Blincoe, L.; Miller, T.R.; Zaloshnja, E. The economic and societal impact of motor vehicle crashes (Revised). Ann. Emerg. Med. 2015, 66, 194–196. [Google Scholar]
  2. Toroyan, T. Global status report on road safety. Inj. Prev. 2009, 15, 286. [Google Scholar] [CrossRef] [PubMed]
  3. Sorensen, M.; Elvik, R. Black Spot Management and Safety Analysis of Road Networks; Institute of Transport Economics: Washington DC, USA, 2007. [Google Scholar]
  4. Östen, J.; Wanvik, P.O.; Elvik, R. A new method for assessing the risk of accident associated with darkness. Accid. Anal. Prev. 2009, 41, 809–815. [Google Scholar]
  5. Erdogan, S. Explorative spatial analysis of traffic accident statistics and road mortality among the provinces of Turkey. J. Saf. Res. 2009, 40, 341–351. [Google Scholar] [CrossRef]
  6. Weber, D.C. Accident rate potential: An application of multiple regression analysis of a poisson process. J. Am. Stat. Assoc. 1971, 66, 285–288. [Google Scholar] [CrossRef]
  7. Sugiyanto, G. The cost of traffic accident and equivalent accident number in developing countries (case study in Indonesia). ARPN J. Eng. Appl. Sci. 2017, 12, 389–397. [Google Scholar]
  8. Pei, Y.L. Improvement in the quality control method to distinguish the black spot of the road. J. Harbin Inst. Technol. 2006, 38, 97–100. [Google Scholar]
  9. Erdogan, S.; Yilmaz, I.; Baybura, T.; Gullu, M. Geographical information systems aided traffic accident analysis system case study: City of afyonkarahisar. Accid. Anal. Prev. 2008, 40, 174–181. [Google Scholar] [CrossRef]
  10. Joshua, S.C.; Nicholas, J.G. Estimating truck accident rate and involvements using linear and poisson regression models. Transp. Plan. Technol. 1990, 15, 41–58. [Google Scholar] [CrossRef]
  11. Liu, Y.T. A fuzzy-based model for macroscopic evaluation of road traffic safety. China J. Highw. Transp. 1995, 8, 169–175. [Google Scholar]
  12. Deublein, M.; Schubert, M.; Adey, B.T. Prediction of road accidents: A bayesian hierarchical approach. Accid. Anal. Prev. 2013, 51, 274–291. [Google Scholar] [CrossRef] [PubMed]
  13. Chong, M.; Ajith, A.; Marcin, P. Traffic accident analysis using machine learning paradigms. Informatica 2005, 29, 89–98. [Google Scholar]
  14. Samuel, C.; Keren, N.; Shelley, M. Frequency analysis of hazardous material transportation incidents as a function of distance from origin to incident location. J. Loss Prev. Process Ind. 2009, 22, 783–790. [Google Scholar] [CrossRef] [Green Version]
  15. Kowtanapanich, W.; Tanaboriboon, Y.; Chadbunchachai, W. Applying public participation approach to black spot identification process. IATSS Res. 2006, 30, 73–85. [Google Scholar] [CrossRef] [Green Version]
  16. Department of Transport and Regional Services (DOTARS). National Black Spot Program. 2003. Available online: http://www.dotars.gov.au/transprog/road/blackspot/index.htm (accessed on 8 July 2014).
  17. Yang, X.S. Firefly algorithms for multimodal optimization in Stochastic Algorithms Foundations and Applications. Springer 2009, 5792, 169–178. [Google Scholar]
  18. Yang, X.S. Firefly algorithm stochastic test functions and design optimization. Int. J. Bio-Inspired Comput. 2010, 2, 78–84. [Google Scholar] [CrossRef]
  19. Tyler, J. Glow-Worms. Available online: http://website.lineone.net/galaxypix/Tylerbookpt1.html (accessed on 11 March 1994).
  20. Yang, X.S. Nature Inspired Metaheuristic Algorithms; Luniver Press: London, UK, 2008. [Google Scholar]
  21. Karaboga, D.; Ozturk, C. A novel cluster approach: Artificial bee colony (ABC) algorithm. Appl. Soft Comput. 2010, 11, 652–657. [Google Scholar] [CrossRef]
  22. Marinakis, Y.; Marinaki, M.; Doumpos, M.; Matsatsinis, N.; Zopounidis, C. A hybrid stochastic genetic-GRASP algorithm for clustering analysis. Oper. Res. Int. J. 2008, 8, 33–46. [Google Scholar] [CrossRef]
  23. Jain, A.K.; Murty, M.N.; Flynn, P.J. Data clustering: A review. ACM Comput. Surv. 1999, 31, 264–323. [Google Scholar] [CrossRef]
  24. Falco, I.D.; Cioppa, A.D.; Tarantino, E. Facing classification problems with particle swarm optimization. Appl. Soft Comput. 2007, 7, 652–658. [Google Scholar] [CrossRef]
  25. Miller, H.J. Potential contributions of spatial analysis to geographic information systems for transportation (GIS-T). Geogr. Anal. 1999, 31, 373–399. [Google Scholar] [CrossRef]
Figure 1. Comparison of different distance calculations.
Sustainability 12 02091 g001
Figure 2. Contrast of search result of different distances.
Sustainability 12 02091 g002
Figure 3. A pseudo-code of the Firefly Algorithm.
Sustainability 12 02091 g003
Figure 4. Flowchart of the Firefly Clustering Algorithm.
Sustainability 12 02091 g004
Figure 5. The area of study (images are from google map).
Sustainability 12 02091 g005
Figure 6. The road traffic network.
Sustainability 12 02091 g006
Figure 7. Set the origin–destination (OD) cost matrix parameter and output the spatial distance.
Sustainability 12 02091 g007
Figure 8. The initial distribution of accident points.
Sustainability 12 02091 g008
Figure 9. The clustering result with OD cost distance displayed on geographic information system (GIS).
Sustainability 12 02091 g009
Figure 10. The clustering result with Euclidean distance displayed on GIS.
Sustainability 12 02091 g010
Figure 11. Variation coefficient of the distance of the accident points.
Sustainability 12 02091 g011
Table 1. Summary of black spot identification methods.
MethodPrincipleAdvantagesDisadvantagesSuitable Conditions
Accident frequency methodIdentify and sort accidents according to accident frequency. Considers the length and traffic use of a road section.Does not consider the regression effect of accidents.Is suitable for road sections or intersections where conditions are similar and traffic is not heavy [4].
Matrix analysis methodIdentify an accident according to the accident number and accident frequency.Evaluation result is accurate and flexible.Identification criteria is subjective.Is suitable for road sections or intersections where conditions are similar and traffic is not heavy [5].
Accident rate methodIdentify the accident based on the accident rate.Considers many accident factors.Needs a lot of accident data and neglects randomness of accidents.Is suitable for describing regional accident conditions [6].
Equivalent accidents number methodIdentify the accident according to the equivalent accident number.Considers many accident factors.Needs a lot of accident data and it is difficult to use to determine the weight value.Is suitable for urban roads or highways with similar conditions [7].
Quality control methodIdentify the accident according to a set threshold.Considers the traffic conditions and its evaluation result is accurateRequires a lot of traffic data and classification work.Applies to road sections with low traffic flows [8].
Cumulative frequency methodIdentify the accident according to accident number and accident rate per kilometerUses a lot of basic traffic data.Does not take into account the conditions of an accident.Applies to roads with widely varying accident conditions [9].
Regression analysis methodConsiders a lot of factors of accident.Considers different factors of accidents.There are high requirements for the model parameters and basic data.Applies to the regional accident quantification [10].
Fuzzy evaluation methodConsiders a lot of factors of accident.Its mathematical model is simple and suitable for multi-level problems.Index weight is subjective.Widely used in many conditions [11].
Expert experience methodIdentify the accident according to accident number.Can estimate the result quickly and easily.Is too subjective.Applies to roads that lack basic data [12].
BP neural networkConsiders a lot of factors of accident.Can evaluate the accident comprehensivelyIndicator is not directly related to the accident.Applies to the highway [13].
Table 2. The record of accident points.
TimeTraffic FatalityRoad NameAccident Location
2014-03-03 10:300North industrial roadNorth industrial road and Happiness Square intersection
2014-02-05 21:500Kaiyuan RoadNo. 66 east gate, north industrial road, Kaiyuan Road
2014-02-13 22:181Provincial Highway 10219.7 km of Provincial Highway 102
2014-02-11 19:450Lintang Road100 meters east of the intersection of Lintang Road and Jiaxuan Road
2014-01-11 21:200Wenquan RoadWenquan Road, about 30 meters west of union college
2014-05-21 23:150Provincial Highway 102Gengchen gas station on Provincial highway 102
2014-03-09 20:000Wenliang Road1 km north of Lujia intersection
Table 3. Accident points’ location records of black spot A.
Euclidean DistanceOD Cost DistanceLocation Record
1Chunxiu Road section
21Chunxiu and Feiyue Intersection
32Chunxiu and Feiyue Intersection
43Chunxiu and Feiyue Intersection
5Chunxiu Road section
6Chunxiu Road section
Table 4. Accident points’ location records of black spot B.
Euclidean DistanceOD Cost DistanceLocation Record
11Chunbo and Feiyue Intersection
22Chunbo and Feiyue Intersection
33Chunbo and Feiyue Intersection
44Chunbo and Feiyue Intersection
55Chunbo and Feiyue Intersection
6Feiyue Road section
Table 5. Accident points’ location records of black spot C.
Euclidean DistanceOD Cost DistanceLocation Record
1Century Avenue section
21Chunhui and Century Avenue Intersection
32Chunhui and Century Avenue Intersection
43Chunhui and Century Avenue Intersection
5Chunhui Road section
64Chunhui and Century Avenue Intersection
7Century Avenue section
Table 6. Distance between accident point and cluster center—black spot A.
Distance (m)Euclidean Distance Clustering Center IDistance (m)OD cost Distance Clustering Center IIDifference (m)%
Accident point 1135.3160.625.318.70%
Accident point 258.6Accident point 180.722.137.71%
Accident point 343.5Accident point 266.422.952.64%
Accident point 490.3Accident point 3123.232.936.43%
Accident point 5116.2156.340.134.51%
Accident point 6146.5182.836.324.78%
Table 7. Distance between accident point and cluster center—black spot B.
Distance (m)Euclidean Distance Clustering Center IDistance (m)OD Cost Distance Clustering Center IIDifference (m)%
Accident point 1108.6Accident point 1127.518.917.40%
Accident point 283.5Accident point 290.16.67.90%
Accident point 338.3Accident point 358.920.653.79%
Accident point 485.1Accident point 498.613.515.86%
Accident point 5123.5Accident point 5136.312.810.36%
Accident point 6143.4162.619.213.39%
Table 8. Distance between accident point and cluster center—black spot C.
Distance (m)Euclidean Distance Clustering Center IDistance (m)OD Cost Distance Clustering Center IIDifference (m)%
Accident point 1134.8161.526.719.81%
Accident point 258.6Accident point 170.211.619.80%
Accident point 338Accident point 249.811.831.05%
Accident point 494.3Accident point 3112.818.519.62%
Accident point 5137.9154.616.712.11%
Accident point 6102.6Accident point 4125.522.922.32%
Accident point 7144.6178.934.323.72%

