Article

RGB Vegetation Indices, NDVI, and Biomass as Indicators to Evaluate C3 and C4 Turfgrass under Different Water Conditions

1
Departamento de Investigación e Innovación, AreaVerde MG projects Madrid, 28050 Madrid, Spain
2
Departamento de Investigación Agroambiental, Instituto Madrileño de Investigación y Desarrollo Rural, Agrario y Alimentario (IMIDRA), 28800 Madrid, Spain
3
Instituto de Investigación para la Gestión Integrada de Zonas Costeras, Universitat Politecnica de Valencia, 46730 Grao de Gandia, Valencia, Spain
4
Departamento de Producción Agraria, Universidad Politécnica de Madrid, 28040 Madrid, Spain
*
Author to whom correspondence should be addressed.
Sustainability 2020, 12(6), 2160; https://doi.org/10.3390/su12062160
Submission received: 3 February 2020 / Revised: 28 February 2020 / Accepted: 29 February 2020 / Published: 11 March 2020

Abstract

:
Grasslands have a natural capacity to decrease air pollution and a positive impact on human life. However, their maintenance requires adequate irrigation, which is difficult to apply in many regions where drought and high temperatures are frequent. Therefore, the selection of grass species more tolerant to a lack of irrigation is a fundamental criterion for green space planification. This study compared responses to deficit irrigation of different turfgrass mixtures: a C4 turfgrass mixture, Cynodon dactylon-Brachypodium distachyon (A), a C4 turfgrass mixture, Buchloe dactyloides-Brachypodium distachyon (B), and a standard C3 mixture formed by Lolium perenne-Festuca arundinacea-Poa pratensis (C). Three different irrigation regimes were assayed, full irrigated to 100% (FI-100), deficit irrigated to 75% (DI-75), and deficit irrigated to 50% (DI-50) of container capacity. Biomass, normalized difference vegetation index (NDVI), green area (GA), and greener area (GGA) vegetation indices were measured. Irrigation significantly affected the NDVI, biomass, GA, and GGA. The most severe condition in terms of decreasing biomass and vegetation indices was DI-50. Both mixtures (A) and (B) exhibited higher biomass, NDVI, GA, and GGA than the standard under deficit irrigation. This study highlights the superiority of (A) mixture under deficit irrigation, which showed similar values of biomass and vegetation indices under full irrigated and deficit irrigated (DI-75) container capacities.

1. Introduction

In recent decades, the development of big cities and industry have provoked an increase in environmental pollution and poor air quality. This situation is likely to increase in the future because climatic change is expected to decrease precipitation and increase the emission of pollutant gases. In this context, grasslands have a natural capacity to decrease the cities’ pollution and have a positive impact on citizen life. Moreover, urban green spaces have been defined as a key ingredient for city sustainability [1]. In addition, it has been reported that the provision of urban green space and its associated benefits are important for sustainable urban development from ecological, economic, and social perspectives [2].
However, the adequate maintenance of green space requires regular and optimum irrigation, which is difficult to apply in many regions where drought and high temperatures are frequent. Chebella has stated that one of the biggest obstacles to establishing and maintaining green space is the scarcity of water [3]. The quality of urban green spaces could be at risk with reduced rainfall as well as greater frequency and duration of droughts [4].
Given the high level of water deficiency in many urban areas and the high consumption of water by lawns, it is essential to select alternative mixtures of turfgrass species that allow a good maintenance of grassland with lower water consumption. The selection of turfgrass for water conservation by the use of varieties with superior drought resistance and low water use is a primary means of decreasing water needs on turfgrass sites [5]. In this context, the water requirements of turfgrass are important in their selection, adaptation, and use, particularly in areas and times when water for turfgrass culture and maintenance is restricted [6]. Therefore, plants with lower water needs that can remain visually acceptable under dry conditions might become preferred plants in an urban setting [7].
Moreover, the authors of [8] have divided turfgrass in two kinds: the C3 species typical for cooler temperature grassland regions and the C4 grasses adapted to persist in warmer environments [8]. Both species differ in the photosynthetic system for the uptake of carbon dioxide. In this context, the authors of [9] reported that the saturation of Rubisco with CO2 eliminates photorespiration in C4 plants under most conditions, producing higher rates of CO2 fixation than the C3 type, and the net CO2 assimilation rates (A) are typically higher in C4 than in C3 species over a wide range of conditions. Higher uptake of CO2 at reduced intercellular CO2 concentration (ci) in C4 plants allows equivalent or greater A at lower stomatal conductance (gs) than in C3 species [10,11], indicating that C4 is characterized by maximal rates of net leaf photosynthesis (A) at a lower stomatal conductance than in C3 species, also by lower transpiration and conserving water, especially in hot conditions when evaporative demand is high. Moreover, the authors of [12] conclude in their investigation that C4 grasses in control treatments were characterized by higher CO2 assimilation rates and water potential, but lower stomatal conductance and under drought, stomatal conductance declined more dramatically in C3 than C4 species. Furthermore, the authors of [13] have indicated that lower gs associated with C4 photosynthesis may result in adaptation of plant hydraulics.
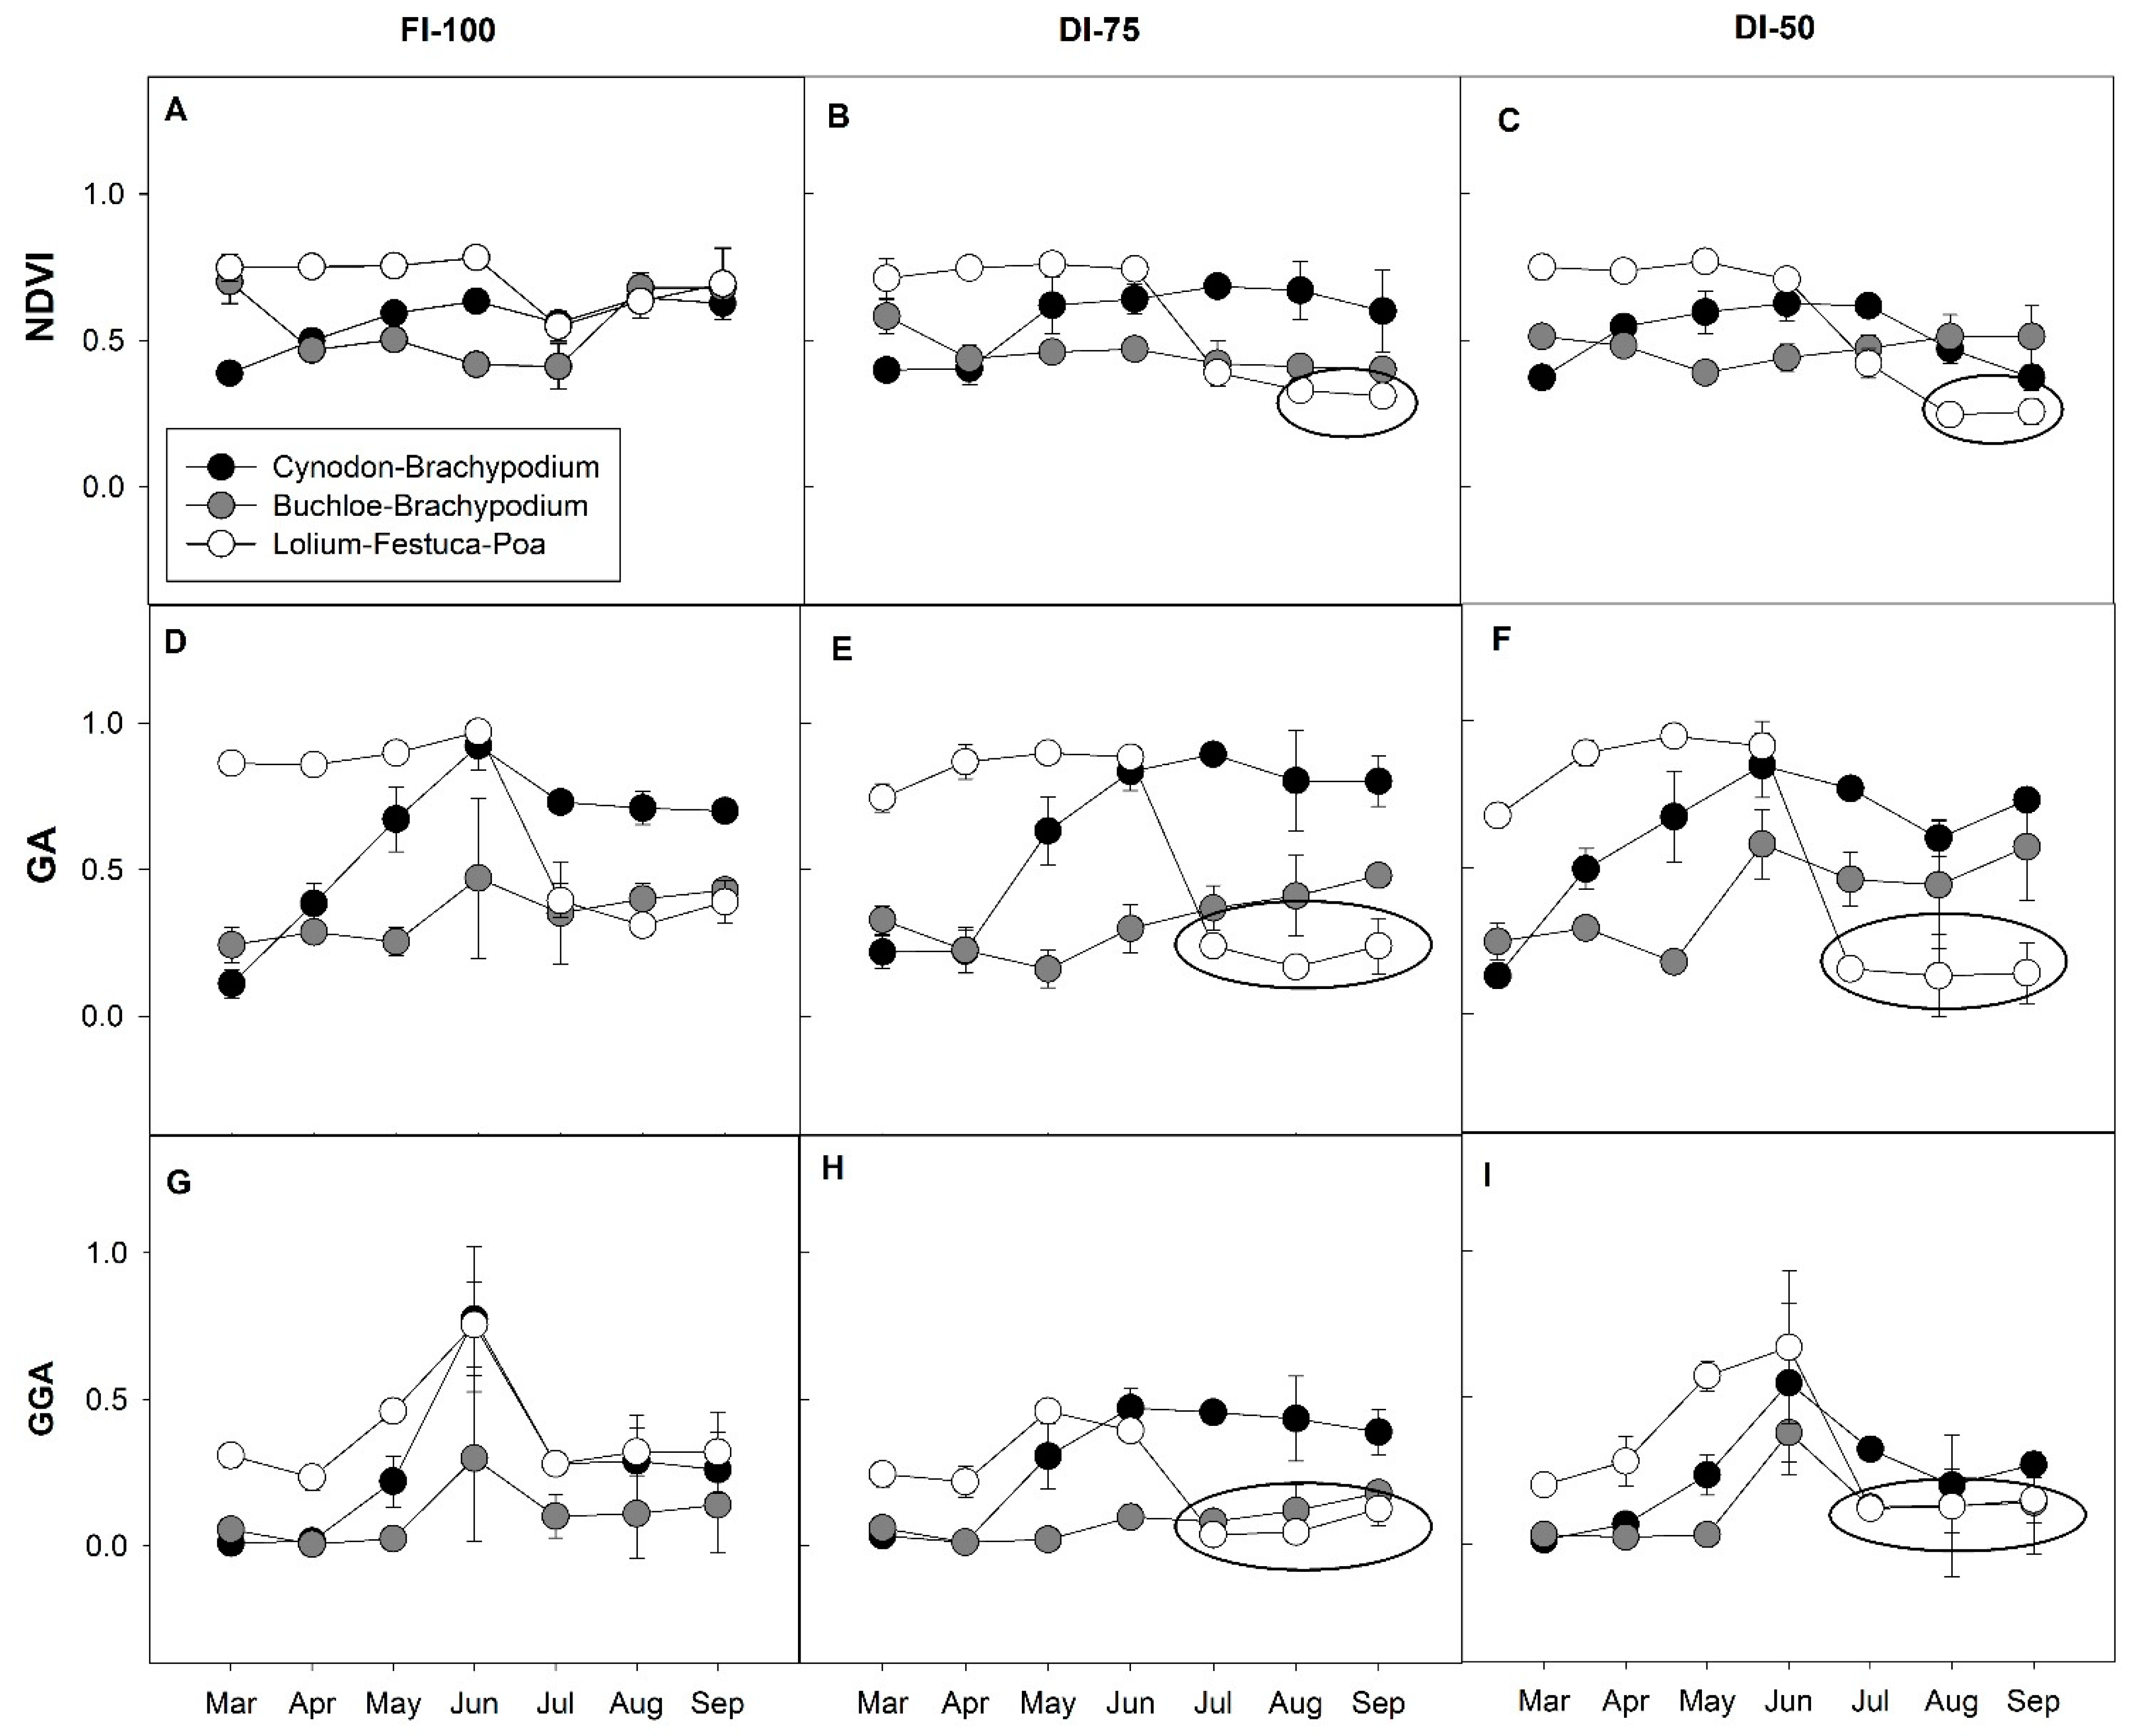
In the present, precision turfgrass water management using spectral reflectance was proposed as an alternative method to improve irrigation efficiency [14]. Spectral reflectance sensing has become a crucial part of precision turfgrass management and an active area of research for many years [
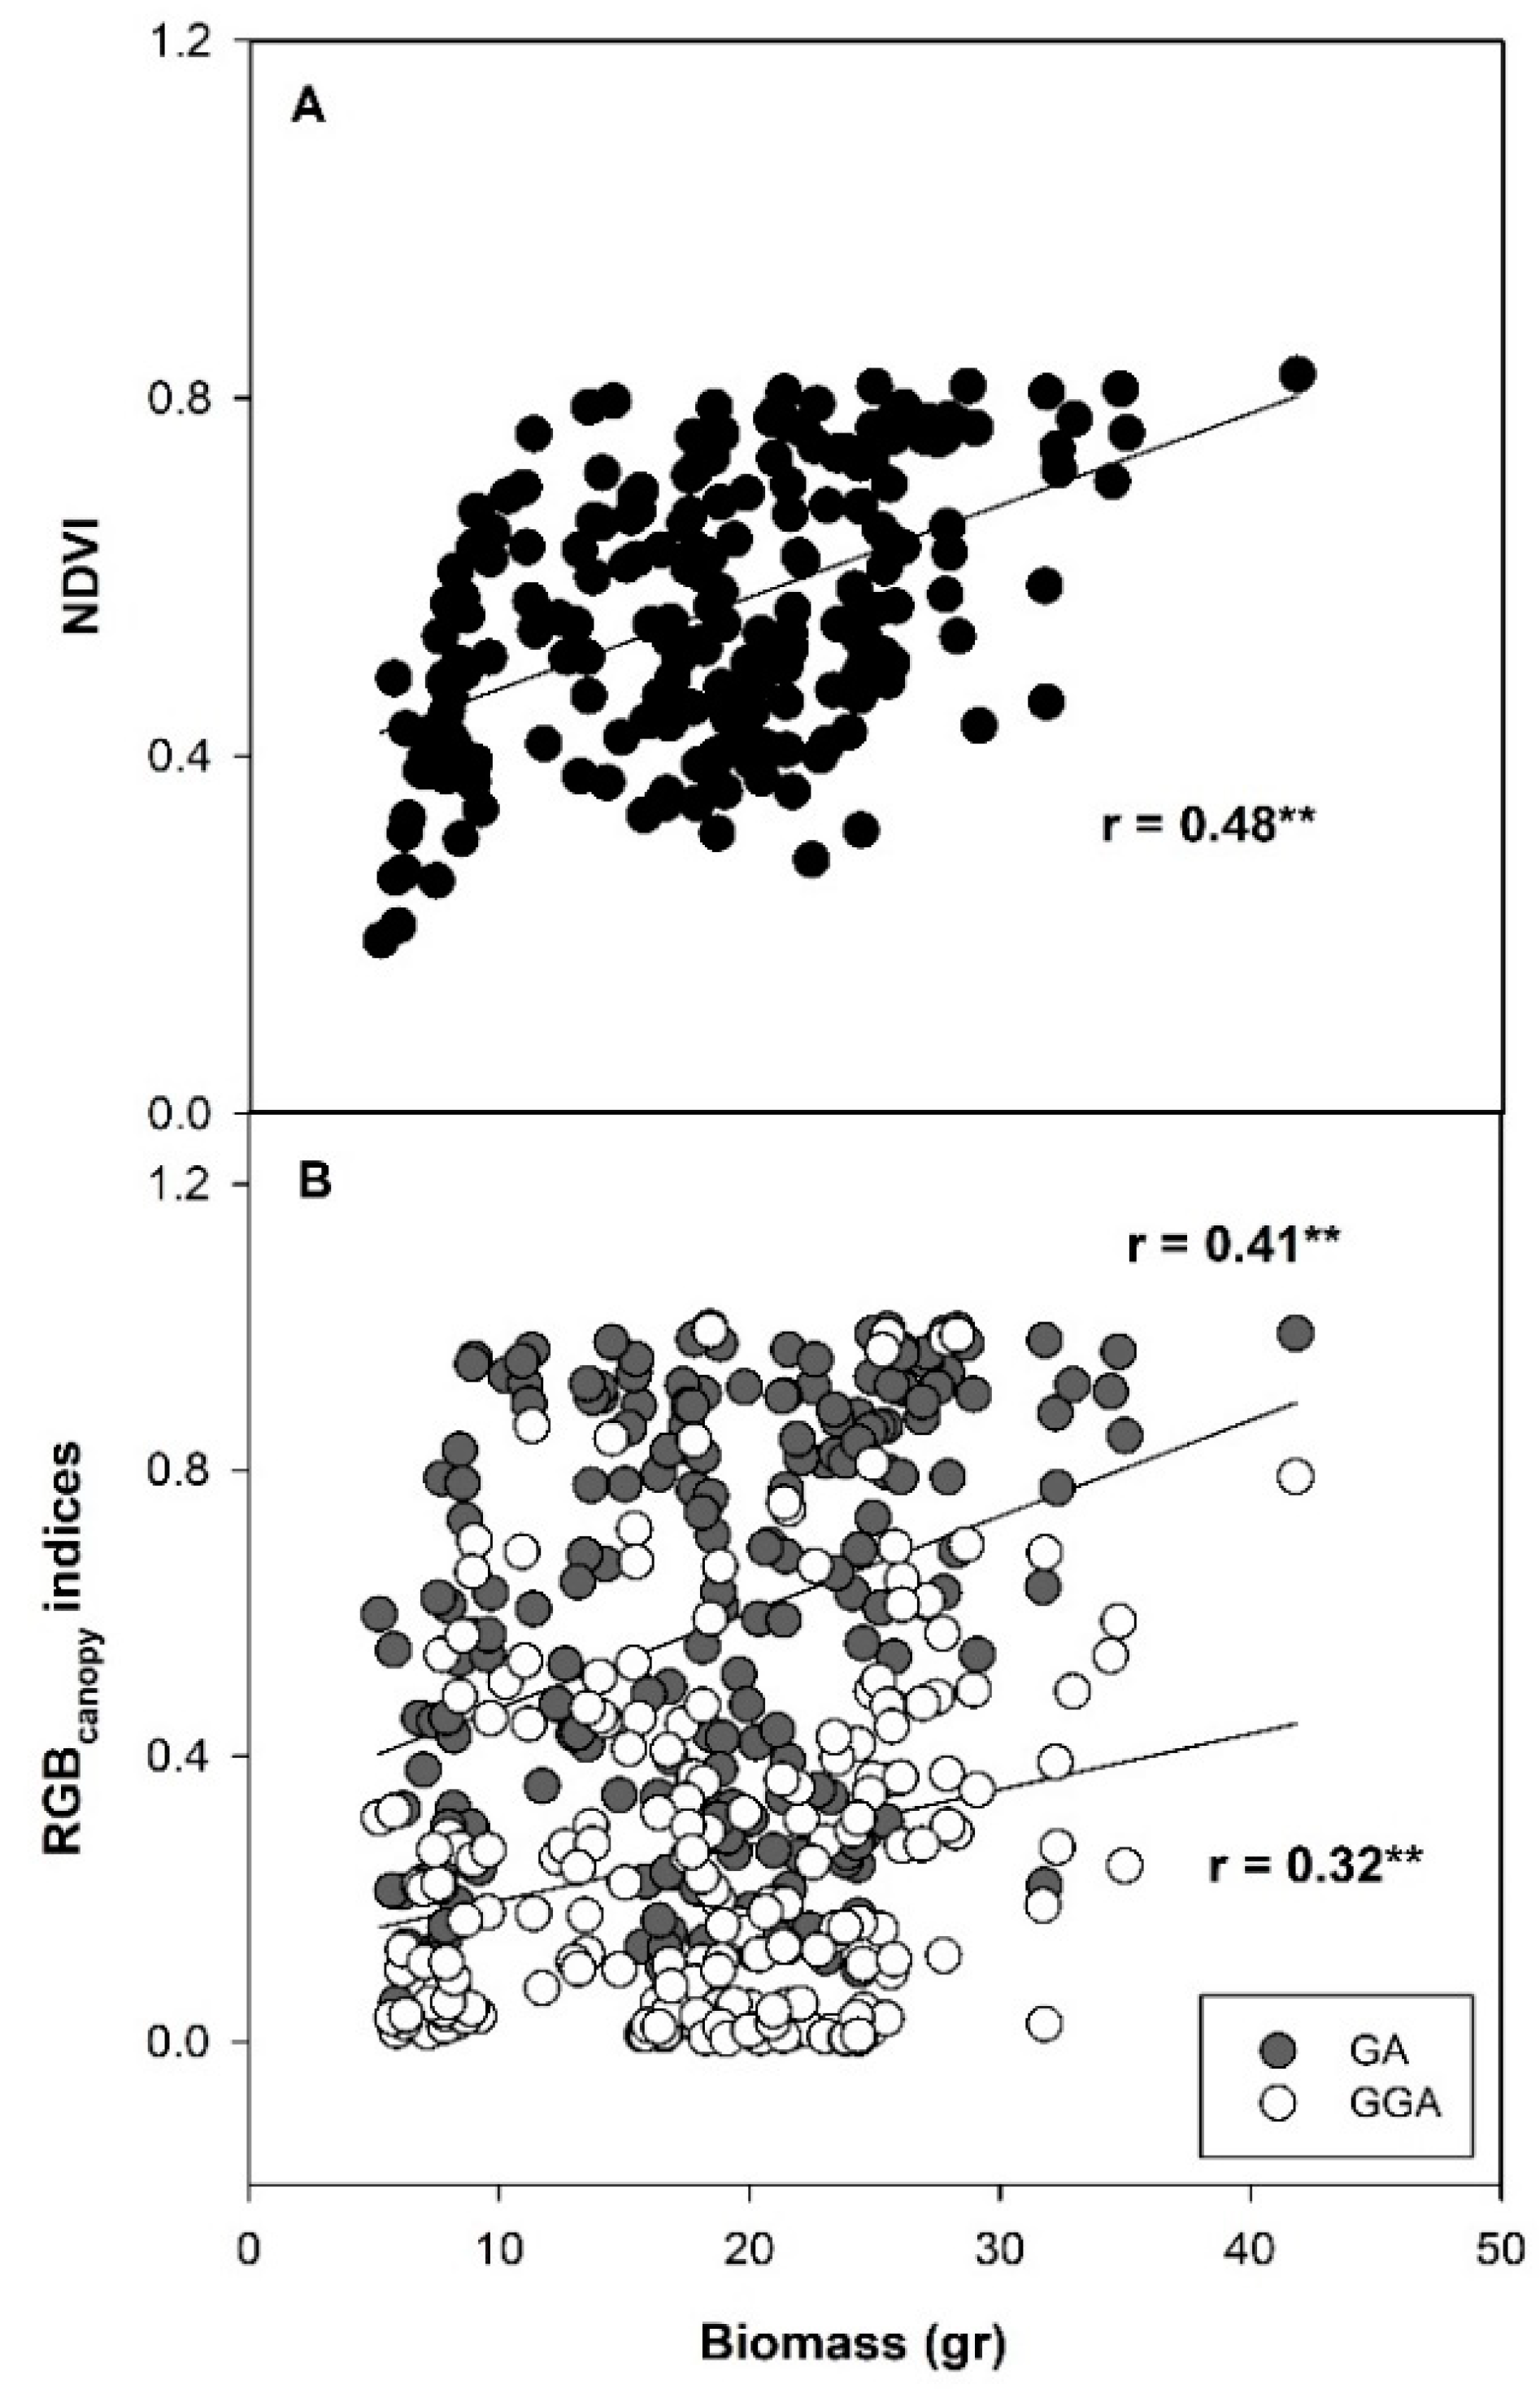
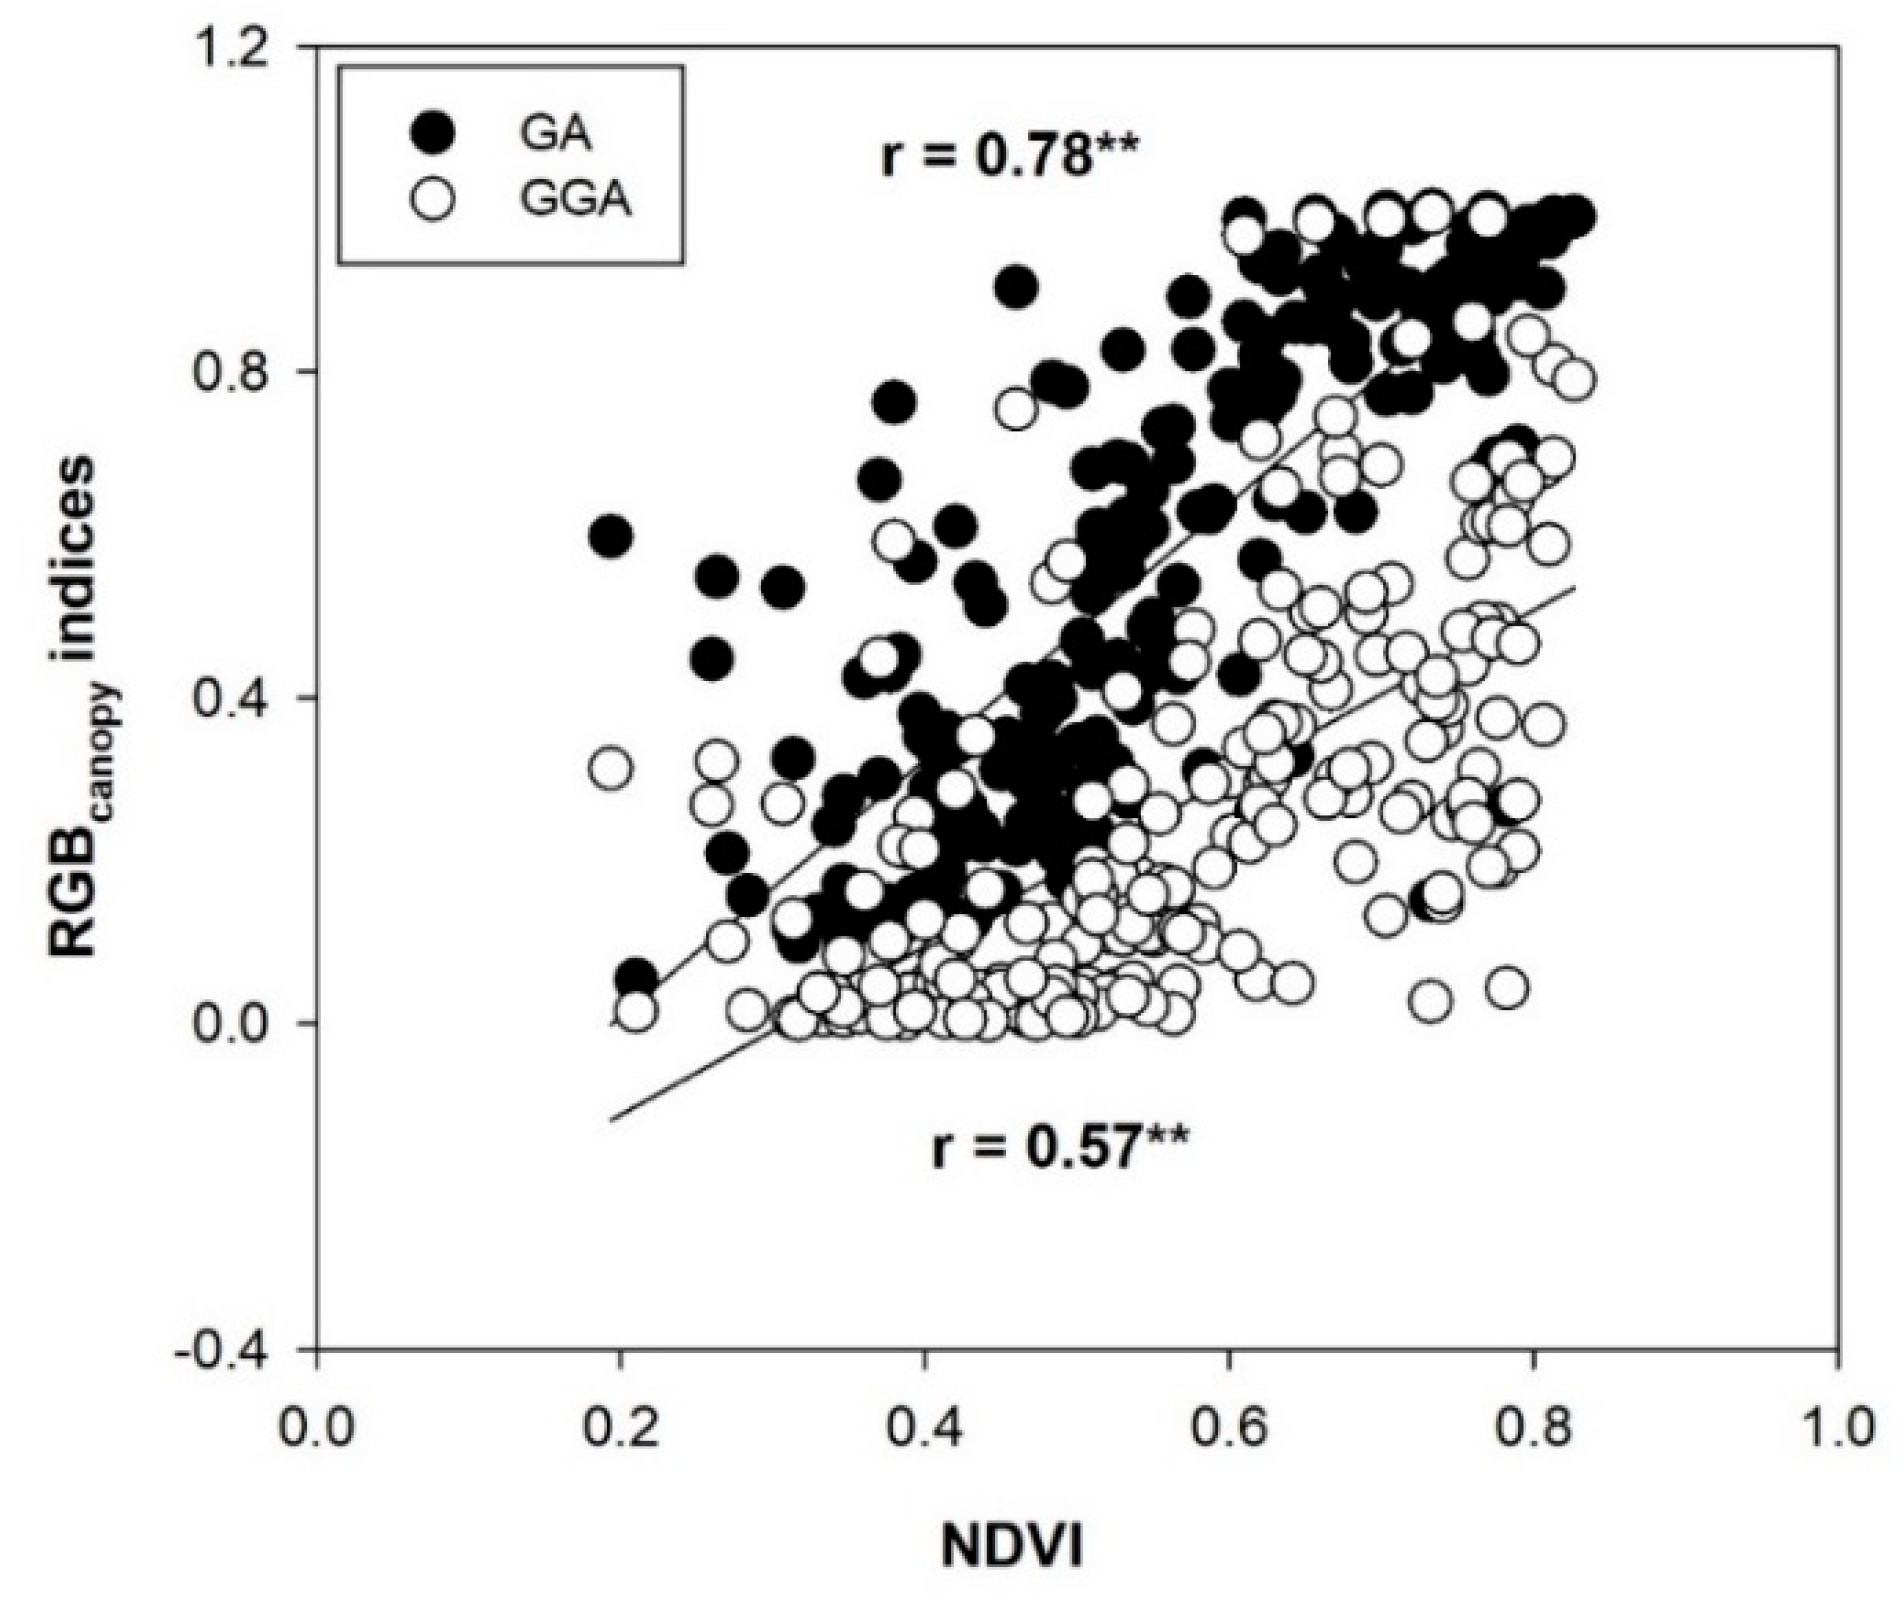
15]. The normalized difference vegetation index (NDVI) is one of the most well-known vegetation indices derived from optical remote sensing and which is formulated using the following equation: (NIR − R) / (NIR + R), where R is the reflectance in the red band and NIR is the reflectance in the near-infrared light reflectance. NDVI has been used widely in the estimation of plant biomass [16,17,18] and to maintained turfgrass [19]. Alternatively, the use of information obtained by conventional digital red, green, blue (RGB) images to estimate canopy vegetation could represent a substitute way of spectroradiometrical vegetation indexing. Digital image analysis has been successfully used to assess turfgrass color and the percentage of green cover [20]. The green area (GA) and greener area (GGA) represent two indexes derived from digital conventional images. GA describes the amount of green biomass in the picture, whereas the more yellowish-green pixels are defined by the GGA. In fact, the active photosynthetic areas and plant senescences are represented by the greener area [21]. These indices are obtained by BreedPix open access software [22,23].
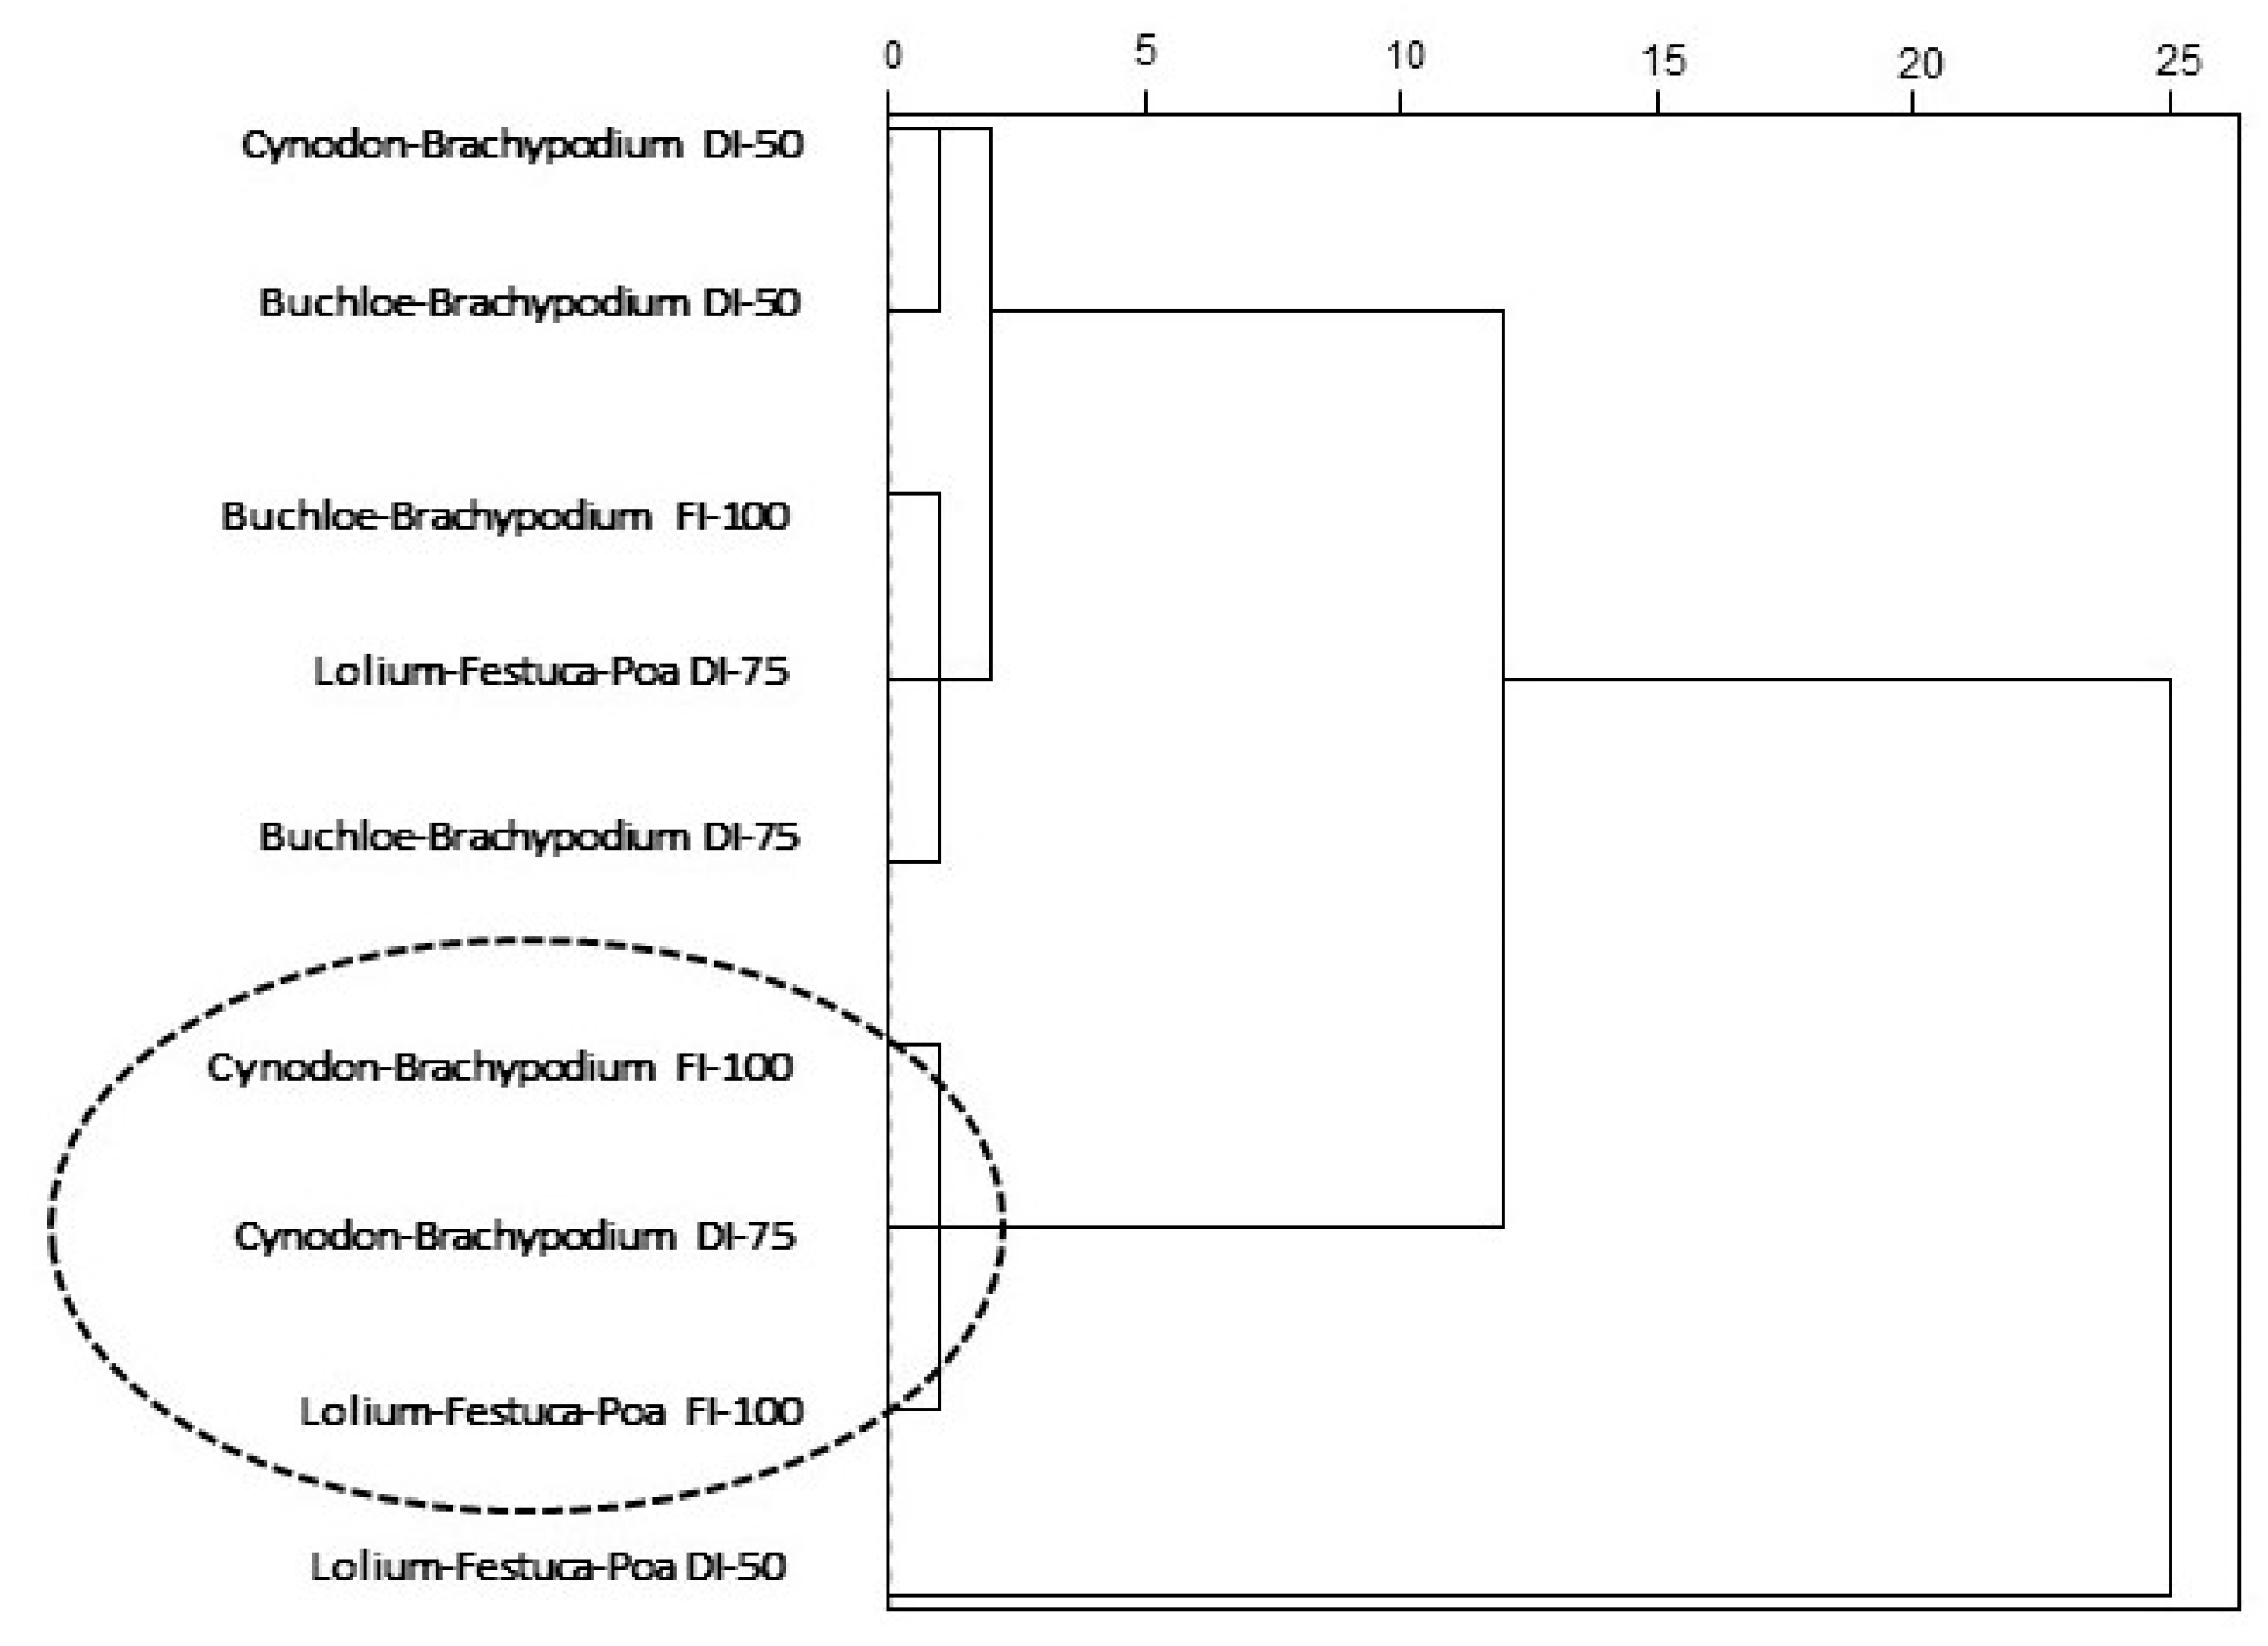
The chief objective of this study was to compare growth of two C3–C4 turfgrass mixtures and a standard one formed only with C3 plants, under different water conditions using economical remote sensing approaches. Furthermore, a key objective of this study was to evaluate if low-cost remote sensing techniques (Green Seeker and digital camera) used to estimate canopy green biomass were good predictors of turfgrass water stress and could be used in similar way as the more expensive technologies used to manage turfgrass irrigation. Furthermore, a key objective of this study was to determine if the turfgrass mixture (C4–C3) was more tolerant to the deficit water irrigation. It is well-known that C3 and C4 grasses actively grow during different seasons, whereas C4 grasses tend to have their period of active growth in summer and are known as summer-active plants, while the C3 turfgrasses are autumn–winter–spring growing. For this reason, in this study we evaluated two different C4-C3 mixtures (compared with only C3 mixture), with the purpose to use them for the sustainability of the urban green spaces, with a uniform turfgrass appearance throughout the year, less water irrigation consumption, and low maintenance cost.
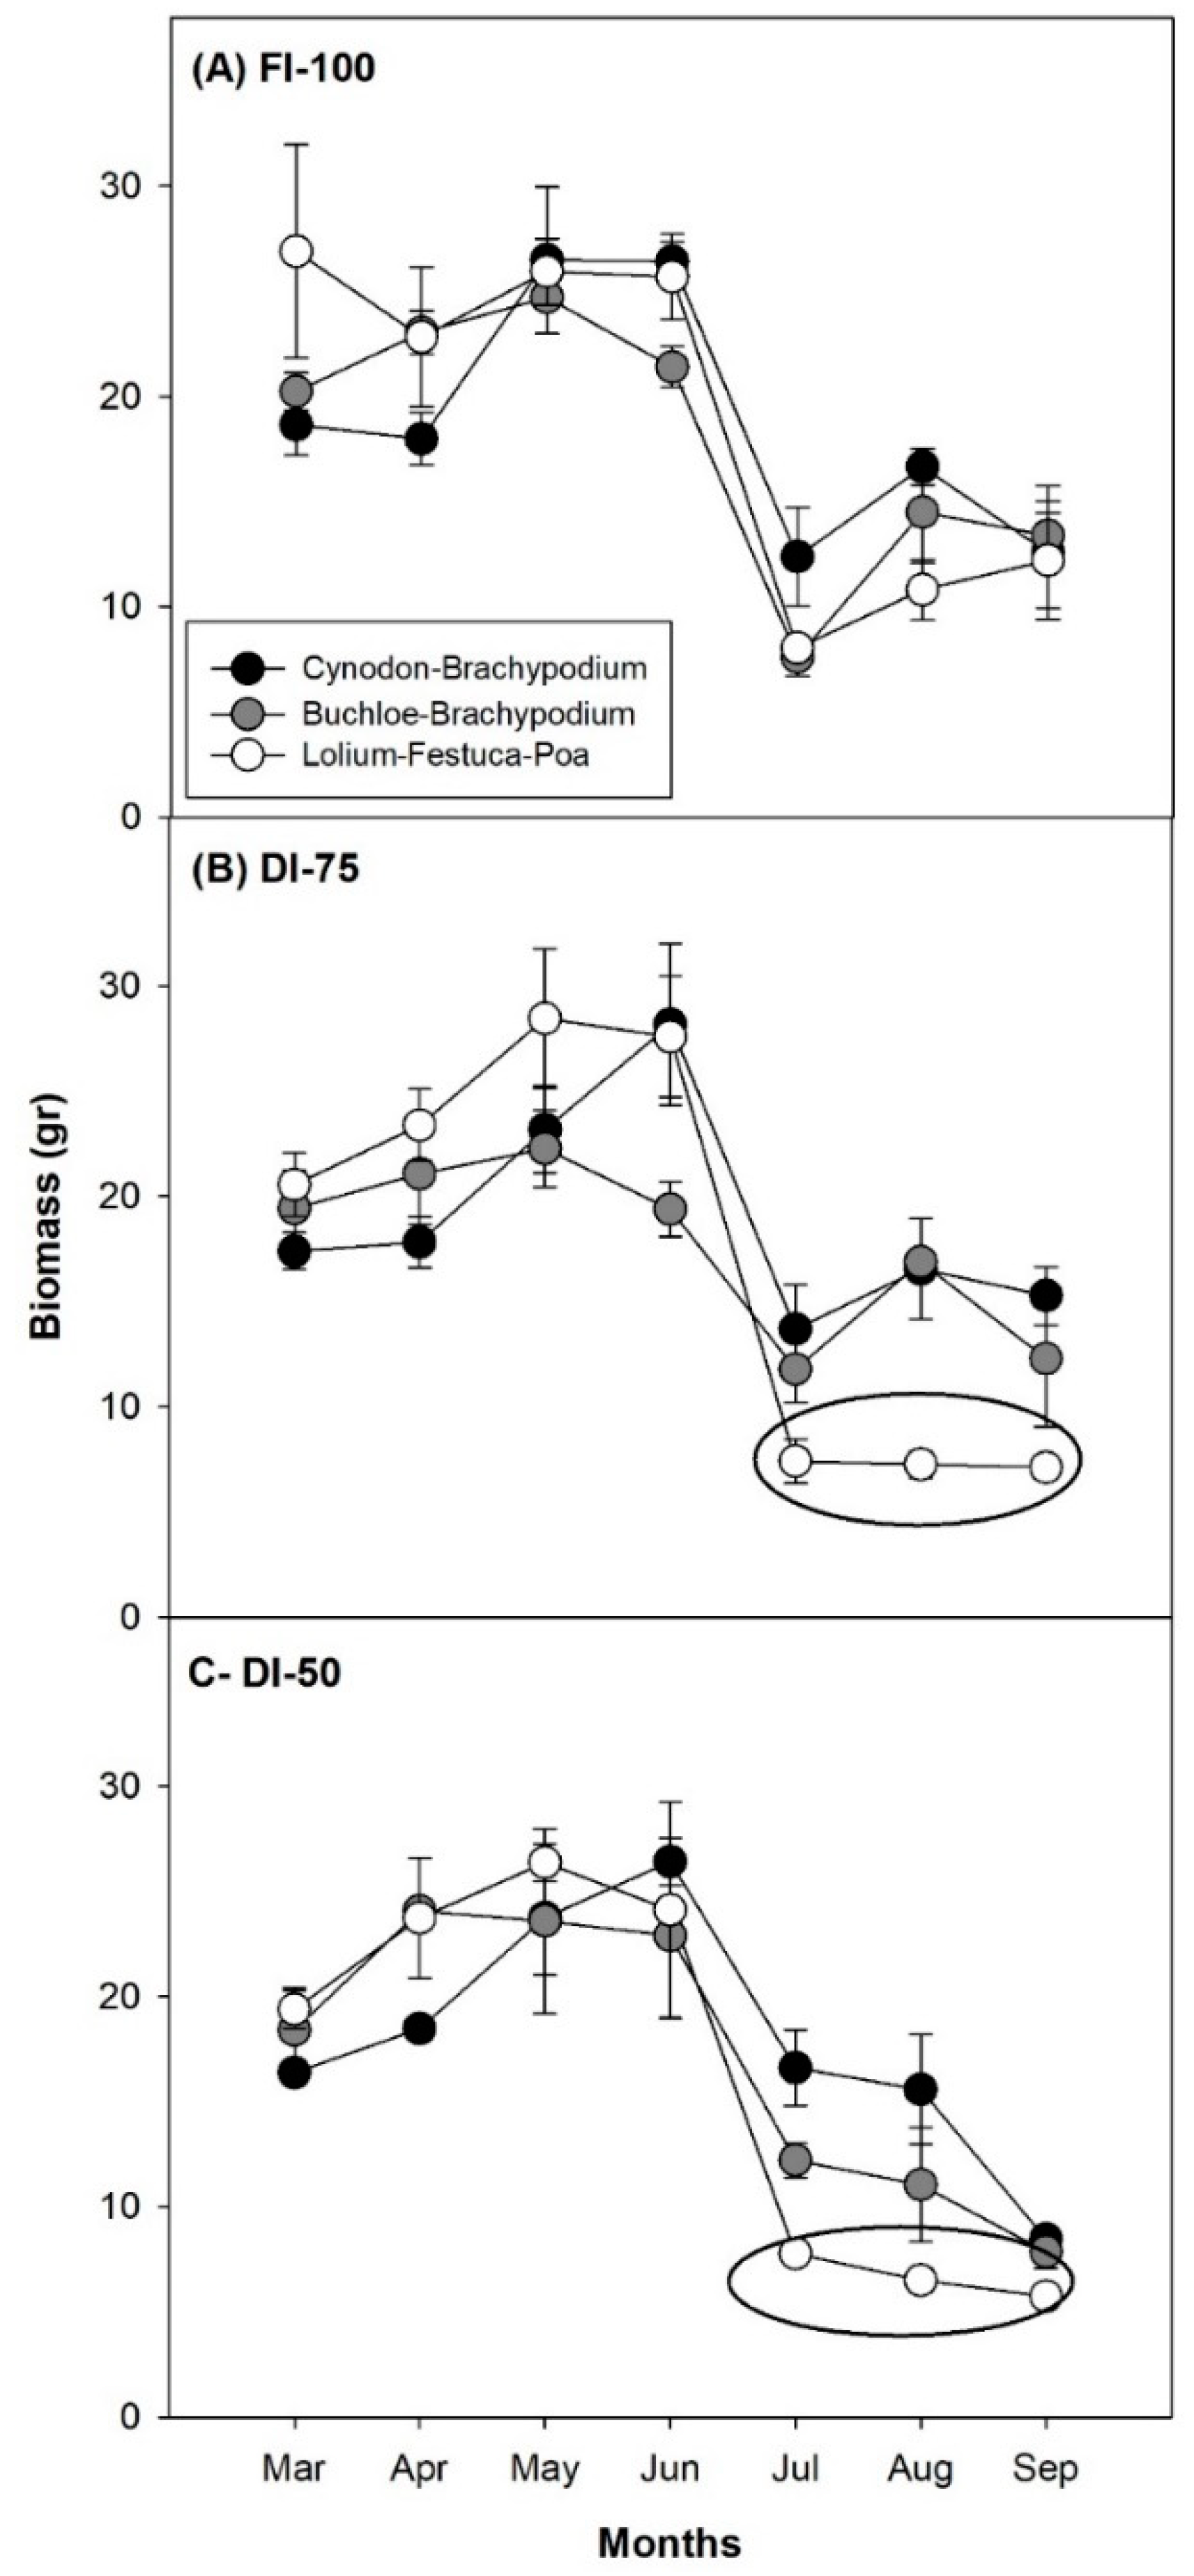
2. Materials and Methods

2.1. Plant Material and Growing Conditions

Field trials were conducted during 2017 at the Madrid Institute for Rural, Agrarian and Food Research and Development (IMIDRA) in the area of Alcala de Henares. This commune is characterized by loamy sand fertile soils (Table A1) and continental climate. The amount of total rainfall and temperatures accumulated by months for the 2017 crop season in the study region are presented in Table A2. Two mixtures of C3-C4 turfgrass were assessed, Cynodon dactylon (C4) with Brachypodium distachyon (C3) and Buchloe dactyloides (C4) with Brachypodium distachyon, with 50% of seeds of each one. As a standard mixture, we have used one formed by three C3 plants Lolium perenne (15%)-Festuca arundinacea (75%)-Poa pratensis (15%). The description and characteristics of all turfgrass species evaluated are explained in the Table 1. Three different regime irrigation were assayed, full irrigated to 100% (FI-100) and deficit irrigated to 75% (DI-75) and 50% (DI-50) of container capacity. Irrigation was applied with sprinkler in blocks connected by valves and controlled by the program of Rain Bird system irrigation (ESP-LXME Model). Water deficit was imposed 1 month after growing by decreasing irrigation. Periods of measures were from March to September 2017.

2.2. Biomass

Biomass was determined by a manual harvest with an electric scissor (Makita DUM 166 Z). The area of measurements was 50 cm in length and 16 cm wide and cut using a metal ruler placed parallel to the electric scissor. Taking the production of plant biomass of 800 cm2, we estimated the production of total biomass expressed in g/m2. The sampling was carried out in the central part of the plot.

2.3. NDVI Index

A portable spectroradiometer (GreenSeeker handheld crop sensor, Trimble, USA) was used to measure the NDVI (Normalized Difference Vegetation Index). The NDVI is calculated by the succeeding equation: (NIR–R)/ (NIR+R), where R is the reflectance in the red band and NIR is the reflectance in the near-infrared band. A constant distance of 50–60 cm above and vertical to the canopy was taken between the sensor and the plots.

2.4. RGB Vegetation Indices

Moreover, RGB (red, green, blue) image were acquired per plot using a SONY DSC-W120 camera. Pictures were taken in the center of each plot and about 80 cm above the plant canopy in a zenithal plane. The BreedPix 0.2 free-access software established for digital image processing was used in the the analysis of pictures [22]. The vegetation indices measured by this software were the green area (GA; portion of pixels with 60 < Hue < 120 from the total amount of pixels) and the greener area (GGA, portion of pixels with 80 < Hue < 120). [22]. The active photosynthetic area, excluding senescent leaves, was captured by the GGA index.

2.5. Statistical Analysis

Data were subjected to factorial analyses of variance (anovas) to test the effects of irrigation and turfgrass mixture at different periods of growth. Means were compared by Tukey’s honestly significant difference (HSD). A bivariate correlation procedure was constructed to analyse the relationships between shoot biomass, NDVI, GA and GGA indices. To assess the performance of each turfgrass species mixture under each water regime irrigation, data were subjected to unweighted pair group method with arithmetic mean (UPGMA) cluster analysis, using as variable the shoot biomass, NDVI and RGB vegetation indices, in order to evaluate appearances between turfgrass mixtures by grouping them into groups and subsets using Euclidean distance method. Statistical analyses were performed by IBM SPSS Statistics 24 (SPSS Inc., Chicago, IL, USA). Figures were established using Sigma-Plot 11.0 for Windows (Systat Software Inc., Point Richmond, CA, USA).

3. Results

3.1. Water Irrigation Effect on Shoot Biomass, NDVI, GA and GGA

Water regime significantly affected the shoot biomass of all turfgrass mixtures (Table 2). The most severe irrigation conditions in term of decreasing biomass were deficit irrigated to 50% of container capacity (DI-50). Moreover, shoot biomass decreased considerably under all water regime in summer season (Table 3), where temperatures were significantly higher (Table A1). Likewise, the NDVI (p < 0.001), as well as the green area (p < 0.001) and the greener area (p < 0.001) indices were significantly affected by water regime (Table 2). Highest values of these three vegetation indices were observed under FI-100 compared to DI-75 and DI-50 water deficit irrigation, where NDVI, GA and GGA were lesser. The most severe deficit irrigation in terms of decreasing vegetation indices was deficit irrigated to 50% of container capacity (DI-50). In addition, comparison between the vegetation indices across periods showed also a significant difference under FI-100, DI-75, and DI-50, but only for GA and GGA indices. While, NDVI values were significantly different between periods only under DI-50 (Table 3). Values of vegetation indices were higher in the spring period and lower under summer climatic conditions.

3.2. C4-C3 Effect on Biomass, NDVI, GA and GGA

Genotypic differences between the three mixtures studied were examined for all physiological traits and under each growing condition (Table 4). Results showed that under the full irrigation (FI-100), differences were found only for NDVI and GA with higher values in standard mixture. Meanwhile, for biomass and GGA, no differences were found between mixtures. Under DI-75 differences existed for the set of traits, with higher biomass and GGA for the Cynodon-Brachypodium mixture compared with the standard. However, under DI-50 differences were observed for biomass, NDVI and GA (Table 4), with higher values of biomass for the two mixtures of C4 species Cynodon and Buchloe with Brachpodium (C3), while the standard mixture (only C3 plants) presented lower values of biomass under these severe deficit irrigation regime.

3.3. Water Deficit and Seasonal Periods Effects on Turfgrass Growing

Biomass and vegetation indices of the three mixtures of turfgrass were also examined under both the different water regime conditions and periods of growth. Compared with the standard mixture, the two mixtures with C4 turfgrass evaluated (Cynodon and Buchloe with Brachypodium) were significantly associated with higher biomass at DI-75 and under DI-50 in summer season (Figure 1). The figure also shows that the standard mixture formed only with C3 plants exhibits higher or equal values of biomass, from March to June, compared to the two mixtures of C4-C3 and under the three water regimes assayed. However, during the summer season characterized with high temperatures and lack of rainwater (July, August) the biomass values of the standard mixture were lower than the two other mixtures C4-C3, especially under the two deficit irrigations D-75 and DI-50. Moreover, the two mixtures with C4 species also exhibited significantly higher NDVI, GA, and GGA during the summer period and at DI-75 and DI-50 deficit irrigation (Figure 2).
Additionally, cluster analyses (Figure 3) were performed as a way of summarizing the relevance of the mixture effects on changes of water irrigation regime using as parameters the biomass and the three green biomass indexes (NDVI, GA and GGA). The cluster analysis clearly showed that the mixture formed by Cynodon and Brachypodium was the best in terms of adaptation to the deficit water irrigation (Figure 3). The mixture Cynodon-Brachypodium showed an identical level of growing at both FI-100 and DI-75 and was regrouped with higher growing conditions of the standard mixture. In addition, Figure 4 showed clearly the difference in color between both C4-C3 mixture and the standard (only C3) at DI-75, where the color of the latter is characterized by many visible yellow areas referring to leaf senescence.

3.4. Relationships of Biomass, NDVI and RGB Vegetation Indices

Biomass was positively correlated with NDVI, GA and GGA indexes (Figure 5) when all turfgrass mixtures, growing conditions, and replicates analysed were combined. The highest coefficient of correlation of biomass was found with NDVI and GA (r = 0.48 and r = 0.41 respectively). Whereas, the correlation between biomass and GGA vegetation index was also significant but weaker (r = 0.32). Likewise, NDVI also was correlated positively and highly with GA and GGA RGB vegetation indices (Figure 6), with highest correlation coefficient in the case of the green area vegetation index (r = 0.78).

4. Discussion

4.1. Potential of Spectral Vegetation Indices to Evaluate Turfgrass Growing

In turfgrass, many studies have demonstrated that NDVI was highly correlated with visual turf quality, shoot density, turfgrass visual assessment rates, turf chlorophyll content [24] and had been used to measure drought stress [24,25]. In accordance, our results showed that NDVI was higher at irrigated conditions than water deficit (Table 2) and was correlated significantly with shoot biomass through all growing conditions. When plants are growing under water stress, their leaves reflect significantly less NIR and redder irradiance, and as a result, the NDVI value decreased under stress conditions. Moreover, Moran et al. [26] found water-stressed canopies to have a lower spectral reflectance in the NIR wavebands than unstressed canopies.
Moreover, vegetation indices obtained by digital RGB (red green blue) images could similarly inform on green biomass status [20,22,23,27]. In our study of green area and greener area, vegetation indices obtained by the digital camera were similarly significantly lower under deficit irrigation than the irrigated plots (Table 2) and were significantly correlated with shoot biomass across growing conditions. In this context, digital image analysis has been successfully used to assess turfgrass color and percent of green cover [20]. Both NDVI and digital camera vegetation indices of this study allow information of the growth status and color of turfgrass species. In agreement with this, [28] reported that the application of vegetation indices helps to highlight spectral differences including turf quality, colour, dry matter, chlorophyll, carotenoids and nitrogen content. Additionally, results of this study showed the usefulness of vegetation indices as a method to identify turfgrass genotypic variation under different conditions of growing. All vegetation indices, or at least one of them, were significantly different between turfgrass mixtures under the three water regimes (Table 4). In this context, [28] showed that vegetation indices are often able to discriminate between different turfgrass cultivars that have been established and maintained with identical agronomical practices. In addition, other studies reported on the utilization of NDVI and other spectral reflectance-based plant stress indices for assessing turfgrass performance [29].
Furthermore, both groups of vegetation indices (NDVI and vegetation indices derived from the digital camera) present higher and positive correlations between them (Figure 5). This result is in accordance with prior research [21,30,31] and confirms that these indices inform with similar manner of biomass status. Nevertheless, our data showed that NDVI was not significant between genotypes under FI-100 and DI-75 across periods of growth. In contrast, GA and GGA indices derived from digital pictures showed a high level of significance between periods under all water regimes assayed. In this context, [21,22] reported that digital pictures can help to acquire some information which is not directly obtained by the spectral reflectance measurements, like the percentage of senescence leaves of cultivars growing at the field. Vegetation indices obtained by RGB images achieved information somewhat superior than the NDVI, possibly because GA was minus saturated than the NDVI. Saturated NDVI at higher periods of turfgrass activity provide less results than RGB indices characterized by less evident saturation patterns. Therefore, the accessibility and low cost of digital cameras characterized them as a perfect and practical device for the supervision of crop water and fertilization status [32]. At present, there are many low-cost drones with an integrated, simple RGB camera. Drone flights allow for taking pictures of all turfgrass plots in little time for their further analysis. Digital picture analysis allows for evaluation of plants, growth status and to detect if there are any limitations in field (such as lack of water or fertilizer) in order to take early and rapid decision (in real time) to better conserve grassland with correct management of inputs.
In addition, the use of information and communication technology offers the possibility of monitoring the grass state in order to adjust the irrigation regime [33,34].

4.2. Turfgrass Water Management Using Low-cost Remote Sensing Techniques

The utilization of remotely sensed data is a powerful quantitative tool that can help in the development of management practices that save water while maintaining high turfgrass quality [35]. In this context, all vegetation indices evaluated in our study decreased under the most severe water deficit indicating need to provide complementary irrigation to plants. In addition, we have seen that there were times of the year that the plant had very high vegetation indices (NDVI, GA, GGA) with saturated values of NDVI. This information allows us to make a decision regarding irrigation by decreasing it at times of the year with favourable weather conditions and preserve water for the summer season with high temperatures and lack of rain. Values of vegetation indices evaluated in this study could give us an estimate of biomass and plant development, since they are related to biomass. Vegetation indices variations with change of amount of water provided makes them important parameters when managing plot irrigation. High values of vegetation indices indicate that the plants are in optimal conditions of growth and there is no need of irrigation and in this way, we will save on water consumption. However, low values of these indices allow us to make a decision in real time for a supplementary irrigation. In agreement with our results, [36] informed that turf management can be achieved by the use of optical remote sensing methods in a consistent and non-destructive manner to evaluate the growth, quality and the irrigation prevision. It should be noted that the low values of NDVI, GA, and GGA may be due to the lack of water irrigation or to plants diseases and lack of nutrients, so before making decisions regarding irrigation, all effects of other factors causing alterations of the turfgrass color and quality must be discarded. At present, there are many methods used to detect crop diseases through digital images, as well as many algorithms to control and adjust fertilization. These techniques can help to detect all remote sensing parameters indicating crop stress which is not due to water deficit.

4.3. Is the Mixture C4-C3 Better Tolerant to Water Stress than C3?

Results of our study showed performance difference between C4-C3 and only C3 turfgrass mixture under water deficit. Both mixtures with C4 turfgrass showed a higher performance under water deficit irrigation compared to the standard mixture, especially in summer periods with higher temperatures and lower water availability. Cynodon-Brachypodium and Buchloe-Brachypodium showed a similar pattern between FI-100 and DI-75, while the standard mixture had lowest values in biomass and vegetation indices under stress conditions, with a drastic decrease in these parameters in summer periods compared with the two other mixtures. We suggested that lower performance of the standard mixture under water stress is due to its composition (only C3 turfgrass) and with a high percentage of fescue in the mixture (75%). In agreement with our results, [36] informed that the most susceptible turfgrass to water restriction were Festuca species and the least susceptible were the warm season species. In addition, [37] found that Festuca arundinacea was highest water users and reported lower evapotranspiration rates in Buchloe dactyloides, indicating that some turfgrass species use less water than selected ornamentals. Some turfgrass species have been identified as generally low or high water users in comparison with other species. The warm season grasses (Bermudagrass and Buffalograss) had evapotranspiration rates that were about 20% less than the cool season grasses [38]. The greater WUE (water use efficiency) of C4 compared with C3 photosynthesis arises from both differences in stomatal aperture and the kinetic properties of the carboxylase enzymes employed by each pathway [39]. We concluded that better tolerance to the stress conditions of mixtures with C4 turfgrass is due to its effective water use with lower rate of stomatal conductance under drought [14], thus avoiding losses of water molecules during high temperatures and water deficit. Likewise, C4 grasses tend to have their period of active growth in summer and can continue to grow their roots in these periods [40], which helps them access soil water at greater depth under drought conditions and have better growth than C3 turfgrass.
In addition, comparison between the two mixtures with C4 turfgrass evaluated in this study showed that mixture with Cynodon dactylon had better performance under water deficit. In this context, Bermudagrass is considered as drought tolerant species with genotypic variations [41]. Several Bermudagrass genotypes were found to have deep and large root systems, [42] a morphological criterion that allows it to reach the available water in more depth under stress conditions. Moreover, thick leaf cuticles, smaller stomatal openings [43], reduced leaf surface stoma density, and the lower water transpiration rate [44] of Cynodon dactylon permit it to have effective water use efficiency and better tolerance to water stress compared to the other turfgrass species.

4.4. Can We Sustain Turfgrass Quality with Less Water Irrigation?

Results of our work showed that some grass species could tolerate a water deficit up to 75% of container capacity, and in some cases up to 50%, especially in the months of growth with moderate climatic conditions (spring). Moreover, the estimation of turfgrass green biomass during different periods of growth showed that under moderate temperatures and with some rain, plants can grow perfectly, and we can save water irrigation, while at times of high temperatures and lack of rain (summer) irrigation is important for the grasslands.
In addition, the comparison between the turfgrass species conclude that the C4-C3 mixture can maintain better their growth under limited irrigation conditions compared to C3 mixture. Due to their morphology and their photosynthetic C4 metabolism, Cynodon and Buchloe provide the mixtures with a better resistance to high temperatures and lack of water in summer, when C3 turfgrass cannot adapt, consequently, to have a uniform grassland during all seasons of the year. This conclusion suggests that the selection of drought tolerant turfgrass is a principal criterion when planting grasslands.
Furthermore, the correct scheduling of irrigation using remote sensing methods (irrigation in correct time and with adequate quantity) and a good choice of the turfgrass species (more tolerant to drought) permits the conservation of grassland quality with limited irrigation, which supports the improvement of life conditions in modern cities, to decrease pollution and improve the sustainability of green spaces.

5. Conclusions

The high demand for water resources of turfgrass represents a significant problem of this last decade due to the lack and costs of water. For this reason, the efficient management of water irrigation (an adequate amount of water irrigation contributed at the right time) is required to ensure high quality of turfgrass with lesser maintenance. This study showed the efficacy of the use of economical remote sensing devices for the turfgrass crop management. The important relations found among vegetation indexes and shoot biomass confirm the efficiency of these indexes in turfgrass crop maintenance. Therefore, the accessibility, easy use and low cost of the GreenSeeker and digital cameras makes them a perfect device for turfgrass water management and green biomass estimation, especially under limited growing conditions. However, while NDVI measures are extensively used as a method to estimate variations in turfgrass development under different growing conditions, in this study we have demonstrated that GA and GGA biomass indexes obtained by digital pictures can provide comparable estimation of biomass to the GreenSeeker and at a comparatively lower cost.
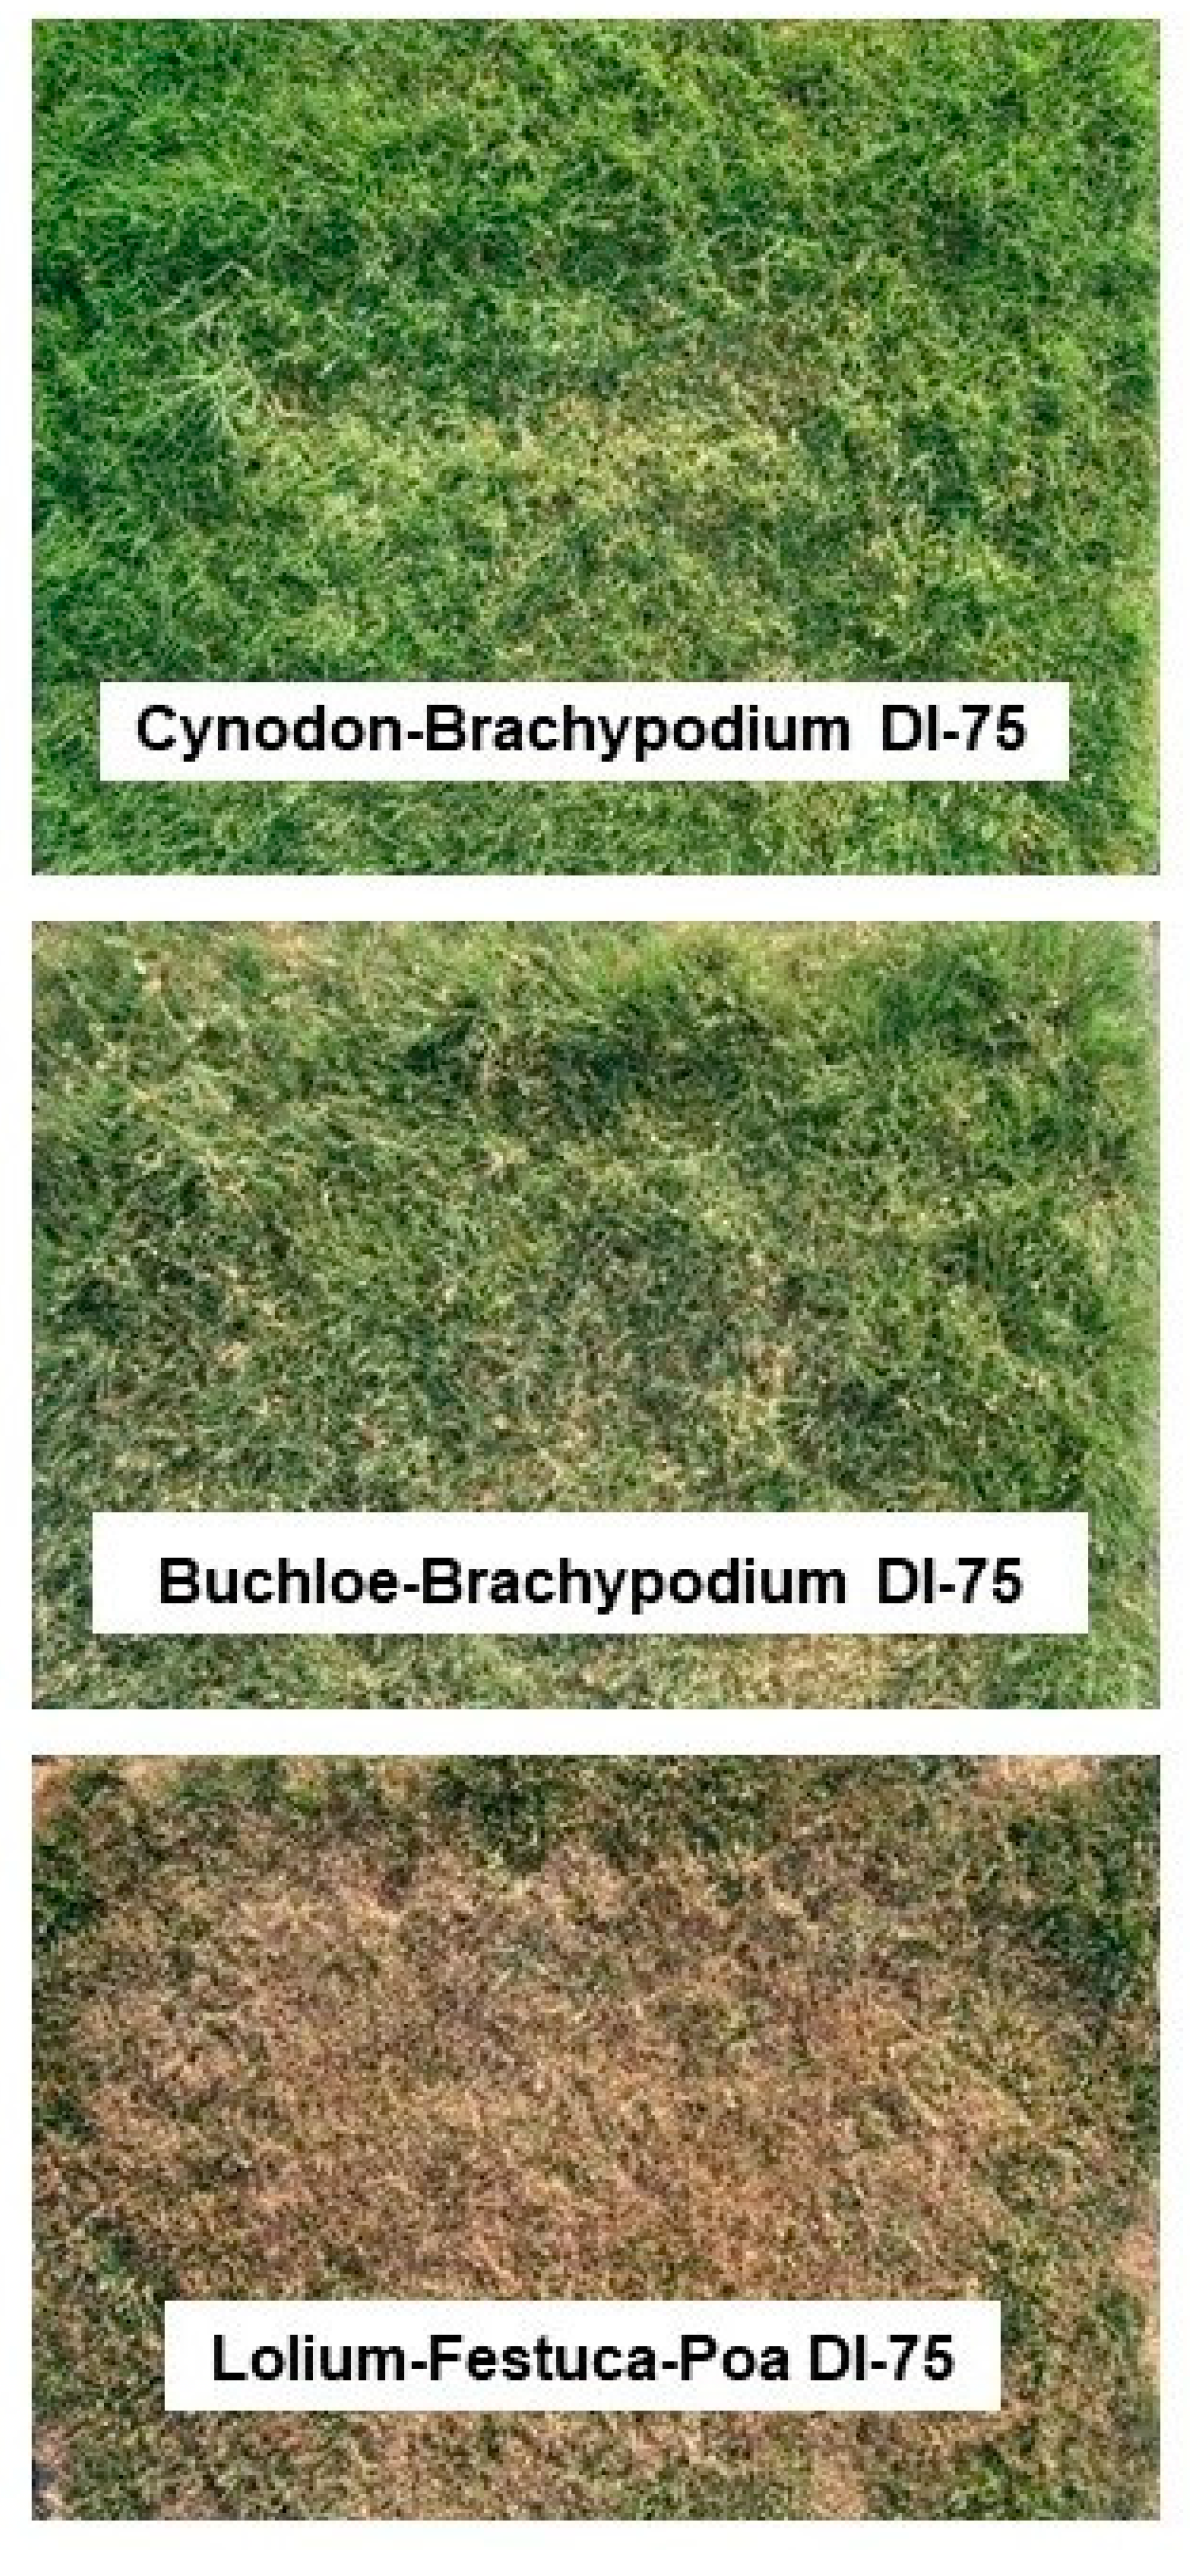
Furthermore, development and use of turfgrass species with superior drought resistance/low water use is a primary criterion to decreasing water needs on grassland [5]. In this context, our results confirm the high performance of turfgrass mixture with C4 species (warm weather plants) to tolerate the water deficit. Subsequently, mixtures of turfgrass with C4 species can allow having grasslands with better appearance in summer and with less consumption in irrigation water.
Finally, we suggested that selection of C4 drought tolerant turfgrass and their combination with rustic C3 species contributes to the development of urban green space with lower water consumption and with better appearance throughout the seasons. Both a good choice of turfgrass species and the use of remote sensing techniques have a significant effect on grassland sustainability and can avoid unnecessary costs in irrigation and help in the prevention of the environment. In future work, we suggest continuing the evaluation of the same two C4 species (Cynodon and Buchloe) studied here, but mixed with two other different C3 turfgrass, in order to select the most tolerant mixture to the deficit irrigation and suitable for the sustainability of the natural grassland. In addition, we propose to decrease the level irrigation to 60% of container capacity, since the results of the present study showed that DI-50 (deficit irrigated to 50% of container capacity) presents the most severe stress conditions, while under DI-75 (deficit irrigated to 75% of container capacity) the results are almost equal to the full irrigated conditions in some cases of the C3-C4 turfgrass mixture. Additionally, we will use a drone for future research, which permits taking thermal and RGB images for continuous monitoring of the vegetation and water status of the turfgrass plots.

Author Contributions

Conceptualization, J.M.; Methodology, J.M.; Field measures and sampling, J.M.; Formal analysis, S.Y.; Data curation, S.Y.; Writing—original draft preparation, S.Y.; Writing—review and editing, S.Y., J.M., and P.V.M.; Supervision, P.V.M., L.P., J.L., and A.M.; Validation, P.V.M., J.L., and A.M.; Project administration, J.M. All authors have read and agreed to the published version of the manuscript.

Funding

This research was funded by AREA VERDE-MG projects and Projects GO-PDR18-XEROCESPED funded by the European Agricultural Fund for Rural Development (EAFRD) and IMIDRA.

Acknowledgments

We acknowledge the support of Juan García Barbero, garden manager of RAIN BIRD, manufacturer and provider of irrigation products and services, and to Julian Aguilar Alcazar, commercial manager of RIVERSA-TORO manufacturer and provider of cutting machinery.

Conflicts of Interest

The authors declare no conflict of interest.

Appendix A

Table A1. Soil chemical characteristics and texture of the plots studied.
Soil Characteristics Unity
PH8.35
Electrical conductivity (EC)170µs/cm
Potasium (K+)0.83meq/100gr
Calcium Ca+2)11.00meq/100gr
Magnesium (Mg+2)3.12meq/100gr
Sodium (Na+)0.85meq/100gr
Phosphorus (P)26.3mg/kg
Total Nitrogen459mg/kg
Clay27%
Silt23%
Sand50%
Textureloamy sand soil
Table A2. Monthly total accumulated rainfall (PP), air temperature (minimum; T min and maximum; T max), evapotranspiration (ET) and average air temperature (T aver) and evapotranspiration (ET aver) for the 2017 crop season. Values were registered at the meteorological station of Madrid Institute for Rural, Agrarian and Food Research and Development (IMIDRA), Madrid, Spain.
MarAprMayJunJulAugSep
PP (mm)19.0014.8029.2013.8038.9015.700.00
T min (°C)3.305.0010.3215.7417.1118.0112.00
T max (°C)18.3724.0026.7532.3733.6233.2928.00
T aver (°C)11.1514.5018.5324.0525.3626.0020.00
ET (mm)164.4327.0377.6.411.8287.8223.7379.0
ET aver (mm)5.310.912.213.79.37.212.6

References

  1. Chiesura, A. The role of urban parks for the sustainable city. Landsc. Urban Plan. 2004, 68, 129–138. [Google Scholar] [CrossRef]
  2. James, P.; Tzoulas, K.; Adams, M.D.; Barber, A.; Box, J.; Breuste, J.; Elmqvist, T.; Frith, M.; Gordon, C.; Greening, K.L.; et al. Towards an integrated understanding of green space in the European built environment. Urban For. Urban Green. 2009, 8, 65–75. [Google Scholar] [CrossRef]
  3. Schebella, M.F.; Weber, D.; Brown, G.; Hatton MacDonald, D. The importance of irrigated urban green space: Health and recreational perspectives. Technical Report; Goyder Institute for Water Research: Adelaide, Australia, 2014. [Google Scholar]
  4. Saunders, R. Climate Change Discussion Paper: The Impact of Climate Change on Urban Parks Managed by Parks Victoria; Rob Saunders Associates: Carlton Victoria, Australia, 2009. [Google Scholar]
  5. Kenna, M.R.; Horst, G.L. Turfgrass water conservation and quality. Inter. Turf. Soc. Res. J. 1993, 7, 99–113. [Google Scholar]
  6. Jansen van vuuren, J.D. Optimal Use of Turf Grass; Water Research Commission: Pretoria, South Africa, 1997. [Google Scholar]
  7. Domenghini, J.C.; Bremer, D.J.; Fry, J.D.; Davis, G.L. Evapotranspiration and Performance among Turfgrass and Ornamental Landscape Species in Response to Irrigation Deficit. Inter. Turf. Soc. Res. J. 2013, 12, 405–414. [Google Scholar]
  8. Edwards, E.J.; Smith, S.A. Phylogenetic analyses reveal the shady history of C4 grasses. Proc. Natl. Acad. Sci. USA 2010, 107, 2532–2537. [Google Scholar] [CrossRef] [PubMed] [Green Version]
  9. Long, S.P. Environmental responses. In C4 Plant Biology; Sage, R.F., Monson, R.K., Eds.; Academic Press: San Diego, CA, USA, 1999; pp. 215–249. [Google Scholar]
  10. Osmond, C.B.; Winter, K.; Ziegler, H. Functional significance of different pathways of CO2 fixation in photosynthesis. In Encyclopedia of Plant Physiology: New Series; Lange, O.L., Nobel, P.S., Osmond, C.B., Ziegler, H., Eds.; Springer: Berlin, Germany, 1982; pp. 479–547. [Google Scholar]
  11. Ehleringer, J.; Pearcy, R.W. Variation in quantum yield for CO2 uptake among C3 and C4 plants. Plant Physiol. 1983, 73, 555–559. [Google Scholar] [CrossRef] [PubMed] [Green Version]
  12. Taylor, S.H.; Ripley, B.S.; Woodward, F.I.; Osborne, C.P. Drought limitation of photosynthesis differs between C3 and C4 grass species in a comparative experiment. Plant. Cell Environ. 2011, 34, 65–75. [Google Scholar] [CrossRef] [PubMed]
  13. Kocacinar, F.; Sage, R.F. Photosynthetic pathway alters xylem structure and hydraulic function in herbaceous plants. Plant. Cell Environ. 2003, 26, 2015–2026. [Google Scholar] [CrossRef]
  14. Krum, J.; Carrow, R.N.M.; Karnok, K. Spatial mapping of complex turfgrass sites: Site-specific management units and protocols. Crop Sci. 2010, 50, 301–315. [Google Scholar] [CrossRef]
  15. Caturegli, L.; Lulli, F.; Foschi, L.; Guglielminetti, L.; Enrico Bonari, E.; Volterrani, M. Turfgrass spectral reflectance: Simulating satellite monitoring of spectral signatures of main C3 and C4 species. Precis. Agric. 2014, 16, 297–310. [Google Scholar] [CrossRef]
  16. Prince, S.D. Satellite remote sensing of primary production: Comparison ofresults for Sahelian grassland 1981–1988. Inter. J. Remote Sens. 1991, 12, 1301–1312. [Google Scholar] [CrossRef]
  17. Babar, M.A.; Reynolds, M.P.; Van Ginkel, M.; Klatt, A.R.; Raun, W.R.; Stone, M.L. Spectral reflectance indices as a potential indirect selection criteria forwheat yield under irrigation. Crop Sci. 2006, 46, 578–588. [Google Scholar] [CrossRef]
  18. Marti, J.; Bort, J.; Slafer, G.A.; Araus, J.L. Can wheat yield be assessed by earlymeasurements of normalized difference vegetation index? Ann. Appl. Biol. 2007, 150, 253–257. [Google Scholar] [CrossRef]
  19. Carrow, R.N.; Krum, J.M.; Flitcroft, I.; Cline, V. Precision turfgrass management: Challenges and field applications for mapping turfgrass soil and stress. Precis. Agric. 2010, 11, 115–134. [Google Scholar] [CrossRef]
  20. Karcher, D.E.; Richardson, M.D. Quantifying turfgrass color using digital image analysis. Crop Sci. 2003, 43, 943–951. [Google Scholar] [CrossRef]
  21. Casadesus, J.; Kaya, Y.; Bort, J.; Nachit, M.M.; Araus, J.L.; Amor, S.; Ferrazzano, G.; Maalouf, F.; Maccaferri, M.; Martos, V.; et al. Using vegetation indices derived from conventional digital cameras as selectioncriteria for wheat breeding in water-limited environments. Ann. Appl. Bot. 2007, 150, 227–236. [Google Scholar] [CrossRef]
  22. Casadesús, J.; Biel, C.; Savé, R. Turf color measurement with conventional digital cameras. In EFITA/WCCA Joint Congress in Agriculture; Boaventura Cunha, J., Morais, R., Eds.; Universidade de Trás-os-Montes e Alto Douro: Vila Real, Portugal, 2005; pp. 804–811. [Google Scholar]
  23. Casadesús, J.; Villegas, D. Conventional digital cameras as a tool for assessingleaf area index and biomass for cereal breeding. J. Integr. Plant. Biol. 2014, 56, 7–14. [Google Scholar] [CrossRef]
  24. Bell, G.E.; Martin, D.L.; Wiese, S.G.; Dobson, D.D.; Smith, M.W.; Stone, M.L.; Solie, J.B. Vehicle-mounted optical sensing: An objective means for evaluating turf quality. Crop Sci. 2002, 42, 197–201. [Google Scholar] [CrossRef]
  25. Trenholm, L.E.; Carrow, R.N.; Duncan, R.R. Relationship of multispectral radiometry data to qualitative data in turfgrass research. Crop Sci. 1999, 39, 763–769. [Google Scholar] [CrossRef]
  26. Moran, M.S.; Pinter, P.J.; Clothier, B.E.; Allen, S.G. Effects of water stress on the canopy architecture and spectral indices of irrigated alfalfa. Remote Sens. Environ. 1989, 29, 251–261. [Google Scholar] [CrossRef]
  27. Jia, G.J.; Epstein, H.E.; Walker, D.A. Controls over intra-seasonal dynamics ofAVHRR NDVI for the Arctic tundra in northern Alaska. Inter. J. Remote Sens. 2004, 25, 1425–1432. [Google Scholar] [CrossRef]
  28. Caturegli, L.; Lulli, F.; Foschi, L.; Guglielminetti, L.; Bonari, E.; Volterrani, M.M. Monitoring Turfgrass Species and Cultivars by Spectral Reflectance. Eur. J. Hortic. Sci. 2014, 79, 97–107. [Google Scholar]
  29. Trenholm, L.E.; Sclossberg, G.; Lee, G.; Parks, W. An evaluation of multi-spectral responses on selected turfgrass species. Inter. J. Remote Sens. 2000, 21, 709–721. [Google Scholar] [CrossRef]
  30. Adamsen, F.J.; Pinter, P.J.; Barnes, E.M.; LaMorte, R.L.; Wall, W.G.; Leavitt, S.W.; Kimball, B.A. Measuring wheat senescence with a digital camera. Crop Sci. 1999, 39, 719–724. [Google Scholar] [CrossRef]
  31. Lukina, E.V.; Stone, M.L.; Raun, W.R. Estimating vegetation coverage in wheat using digital images. J. Plant. Nutr. 1999, 22, 341–350. [Google Scholar] [CrossRef]
  32. Araus, J.L.; Kefauver, S.C. Breeding to adapt agriculture to climate change: Affordable phenotyping solutions. Curr. Opin. Plant Biol. 2018, 45, 237–247. [Google Scholar] [CrossRef]
  33. Marín, J.; Parra, L.; Rocher, J.; Sendra, S.; Lloret, J.; Pedro, V. Mauri, Alberto Masaguer. Urban Lawn Monitoring in Smart City Environments. J. Sens. 2018, 2018, 1–16. [Google Scholar] [CrossRef] [Green Version]
  34. Marín, J.; Rocher, J.; Parra, L.; Sendra, S.; Lloret, J.; Mauri, P.V. Autonomous WSN for Lawns Monitoring in Smart Cities. In Proceedings of the IEEE/ACS 14th International Conference on Computer Systems and Applications (AICCSA 2017), Hammamet, Tunisia, 30 October–3 November 2017. [Google Scholar]
  35. Kenna, M.P. Detecting turf stress with remote sensing. Grounds Maint. 1995, 10, 17–20. [Google Scholar]
  36. Taghvaeian, S.; Chávez, J.L.; Mary, J.; Hattendorf, M.J.; Crookston, M.A. Optical and Thermal Remote Sensing of Turfgrass Quality, Water Stress, and Water Use under Different Soil and Irrigation Treatments. Remote Sens. 2013, 5, 2327–2347. [Google Scholar] [CrossRef] [Green Version]
  37. Horst, G.L.; Steinegger, D.H.; Gaussoin, R.E. Comparative evapotranspiration rates of some perennial herbaceous ground covers and turfgrass species under greenhouse conditions. Inter. Turf. Soc. Res. J. 1997, 8, 1274–1279. [Google Scholar]
  38. Feldhake, C.M.; Danielson, R.E.; Butler, J.D. Turfgrass Evapotranspiration. I. Factors Influencing Rate in Urban Environ. Agron. J. 1983, 75, 824–830. [Google Scholar] [CrossRef]
  39. Osborne, C.P.; Sack, L. Evolution of C4 plants: A new hypothesis for an interaction of CO2 and water relations mediated by plant hydraulics. Philos. Trans. R. Soc. Lond. B Biol. Sci. 2012, 367, 583–600. [Google Scholar] [CrossRef] [PubMed] [Green Version]
  40. Beard, J.B. Turfgrass: Science and Culture; Prentice-Hall: Englewood Cliffs, NJ, USA, 1973; p. 130. [Google Scholar]
  41. Husmoen, D.; Vietor, D.M.; Rouquette, F.M.; Cothren, J.T. Variation of responses to water stress between ‘Tifton 85’ and ‘Tifway’ or ‘Coastal’ bermudagrass. Crop Sci. 2012, 52, 2385–2391. [Google Scholar] [CrossRef]
  42. Carrow, R.N. Drought resistance aspects of turfgrasses in the Southeast: Root-shoot responses. Crop Sci. 1996, 36, 687–694. [Google Scholar] [CrossRef]
  43. Zhou, Y.; Lambrides, C.; Kearns, R.; Ye, C.; Cao, N.; Fukai, S. Selecting for drought tolerance among Australian green couch grasses (Cynodon spp.). Crop Pasture. Sci. 2009, 60, 1175–1183. [Google Scholar] [CrossRef]
  44. Mukhtar, N.; Hameed, M.; Ashraf, M.; Ahmed, R. Modifications in stomatal structure and function in Cenchrus ciliaris L. and Cynodon dactylon (L.) pers. in response to cadmium stress. Pak. J. Bot. 2013, 45, 351–357. [Google Scholar]
Figure 1. Shoot biomass values of each turfgrass mixture under the three water regime conditions and different periods of growth. Water regime conditions: FI-100, full irrigation (100% to container capacity); DI-75 and DI-50 deficit irrigation (75% and 50% to container capacity, respectively).
Sustainability 12 02160 g001
Figure 2. Evaluation of NDVI, GA and GGA values of each turfgrass mixture under the three water regime conditions and the different periods of growth. Abbreviations of water regime and variables as defined in Table 2.
Sustainability 12 02160 g002
Figure 3. Cluster analysis of the three turfgrass mixtures under the different growing conditions assayed and using as variables the shoot biomass and the complete set of vegetation indices studied in this work. Abbreviations of water regime as defined in Figure 3.
Sustainability 12 02160 g003
Figure 4. RGB images of the three turfgrass mixtures studied under deficit irrigated to 75% of container capacity (DI-75) in August.
Sustainability 12 02160 g004
Figure 5. Relationships of Biomass with NDVI, GA and GGA) across all water regimes assayed. Abbreviations of variables as defined in Table 2. Significance levels: **p < 0.01.
Sustainability 12 02160 g005
Figure 6. Relationships of NDVI with GA and GGA across all water regimes assayed. Abbreviations of variables as defined in Table 2. Significance levels: **p < 0.01.
Sustainability 12 02160 g006
Table 1. Characteristics of the species used in the present study.
Species Characteristics
Brachypodium distachyonIt is highly resistant to the winter cold, drought and high temperatures of spring, own of the Mediterranean climate. Resistant quite well the trampling.
Buchloe dactyloidesSpecie of warm weather. It adapts to all types of soils, preferring the alkaline. Resistant to drought and the conditions of aridity. Bad adaptation to the shade. Low maintenance.
Cynodon dactylonIt is the most important C4 grass species of warm weather. Resistant to long periods of drought and does not need special care. It adapts to all kinds of soils with strong stolons that give it a lot of covering power and withstand trampling.
Festuca ArundinaceaC3 grass specie of temperate climate. Resistant to drought, shade, trampling and diseases especially Brown Patch.
Lolium perenneResistant to low reaping, is well adapted to extreme climates (heat and cold) and to diseases such as Grey Leaf.
Poa PratensisSpecie of temperate climate. Vigorous root system that gives high power density. Resistant to trampling. Adaptable to various soils and climates, it is typically used in mixtures. Excellent tolerance to salinity and shade, is also quite resistant to heat and drought.
Source: Dalmau Seeds: www.semillasdalmau.com and Zulueta seeds: www.zulueta.com.
Table 2. Water regime and genotypes mean for turfgrass SB (Shoot biomass), NDVI (Normalized Difference Vegetation Index), GA (Green Area), GGA (Greener Area) and the corresponding ANOVA. Water regime conditions: FI-100, full irrigation (100% to container capacity); DI-75 and DI-50 deficit irrigation (75% and 50% to container capacity, respectively). Significance levels: ns, not significant; *p < 0.05; **p < 0.01 and ***p < 0.001.
SBNDVIGAGGA
Water regime
FI-10018.48 b0.60 c0.64 b0.32 b
DI-7517.94 ab0.56 b0.54 a0.22 a
DI-5017.10 a0.51 a0.53 a0.24 a
Level of significance
Water regime (WR)0.038*0.000***0.000***0.000***
The different letter succeeding the means are significantly different (p < 0.05) according to Tukey’s honestly significant difference (HSD) test.
Table 3. Effect of irrigation and seasonal periods on biomass and vegetation indices. Abbreviations of water regime and variables are as defined in Table 2. Significance levels: ns, not significant; *p < 0.05; **p < 0.01 and ***p < 0.001.
MarAprMayJunJulAugSepSignificance
Water regime
FI-100SB21.91 b21.26 b25.69 d24.48 c9.33 a13.97 a12.70 a0.000***
NDVI0.61ab0.57 ab0.62 ab0.61ab0.51a0.65 b0.66 b0.172 ns
GA0.80c0.91c0.61 abc0.78 bc0.49 ab0.40 a0.51ab0.000***
GGA0.51bc0.54c0.23 ab0.60 c0.12a0.12a0.08a0.000***
DI-75SB19.11bc20.74c24.63c25.03c10.95a13.55a11.55a0.000***
NDVI0.56a0.54a0.58a0.58a0.53a0.56a0.52a0.974 ns
GA0.56b0.64b0.56b0.64b0.50a0.43a0.44a0.018**
GGA0.24b0.33b0.26ab0.32ab0.19a0.11a0.08a0.019**
DI-50SB18.04ab22.07bc24.55c24.45c12.19a11.03a7.34a0.000***
NDVI0.54b0.59b0.58b0.59b0.50ab0.41a0.38a0.006**
GA0.55b0.59b0.59b0.78b0.46ab0.35a0.42a0.025**
GGA0.21b0.33b0.28b0.30b0.16a0.08a0.12a0.000***
The different letter succeeding the means are significantly different (p < 0.05) according to Tukey’s honestly significant difference (HSD) test.
Table 4. Effect of turfgrass mixture on biomass, NDVI, GA and GGA. Abbreviations of water regime and variables are as defined in Table 2.
Cynodon-BachypodiumBuchloe-BrachypodiumLlium-Festuca-PoaSigificance
FI-100
SB18.72a17.82a18.89a0.865ns
NDVI0.56a0.55a0.70b0.000***
GA0.50a0.66b0.78b0.005**
GGA0.32a0.23a0.39a0.186ns
DI-75
SB18.86b17.57a17.38a0.035*
NDVI0.57b0.48a0.61b0.017*
GA0.58b0.43a0.62b0.016*
GGA0.30b0.14a0.22b0.028**
DI-50
SB18.00b17.14ab16.21a0.040*
NDVI0.55a0.47a0.51a0.051*
GA0.56b0.44a0.51b0.018*
GGA0.23a0.20a0.30a0.355ns
The different letter succeeding the means are significantly different (p < 0.05) according to Tukey’s honestly significant difference (HSD) test. Significance levels: ns, not significant; *p < 0.05; **p < 0.01 and ***p < 0.001.

