Evaluation of a 3.5-MW Floating Photovoltaic Power Generation System on a Thermal Power Plant Ash Pond


1
Department of Construction Engineering, Dongyang University, No. 145 Dongyangdae-ro, Punggi-eup, Yeongju-si 36040, Korea
2
Management Support Division, Shinhwa E&E, 237, Gonghang-daero, Gangseo-gu, Seoul 07803, Korea
3
Department of Architectural Engineering, Gachon University, Seongnam 13120, Korea
*
Author to whom correspondence should be addressed.
Sustainability 2020, 12(6), 2298; https://0-doi-org.brum.beds.ac.uk/10.3390/su12062298
Submission received: 24 January 2020
/
Revised: 12 March 2020
/
Accepted: 13 March 2020
/
Published: 15 March 2020
(This article belongs to the Section Sustainable Engineering and Science)
Abstract
:This study evaluated the design and performance of an improved 3.5 MW floating photovoltaic (PV) power generation system consisting of fiber-reinforced polymer (FRP) members and its installation in the ash pond of a thermal power plant. The FRP design code of the American Society of Civil Engineers was used to design the structure. The safety of the structure was then confirmed using a finite element analysis indicating that the induced stresses were less than the allowable stresses dictated by the Korean Highway Bridge Design Code. An examination of the energy performance of the floating PV energy generation system after installation determined that the measured electricity production was as high as approximately 94% of the installed 3.5-MW capacity. The energy production of the floating PV structure with the improved design and module angles was found to increase by 7.65 times.
1. Introduction
Energy costs are rapidly increasing in many countries due to fossil fuel depletion, continuously high oil prices, and imbalances between supply and demand. Particularly in Korea, fossil fuels are commonly used. Moreover, the effects of environmental pollution and climate change due to the massive use of fossil fuels are being felt across the planet. The primary countermeasure to reduce the use of fossil fuels is to improve their efficiency of production, transfer, and consumption. However, for the ultimate goal, it is more important to use new renewable energy that does not emit carbon dioxide, which helps protect sustainable energy sources [1]. Accordingly, the Kyoto Protocol of the United Nations Framework Convention on Climate Change promotes the development, use, and distribution of renewable energy. Among the different types of renewable energies, photovoltaic (PV) power generation has been included in the Renewable Portfolio Standard (RPS) system since 2012. Participants in the RPS include the U.S., Japan, and Korea. In order to expand PV power generation capacity, research efforts have recently been focused on developing both terrestrial and floating PV structures.
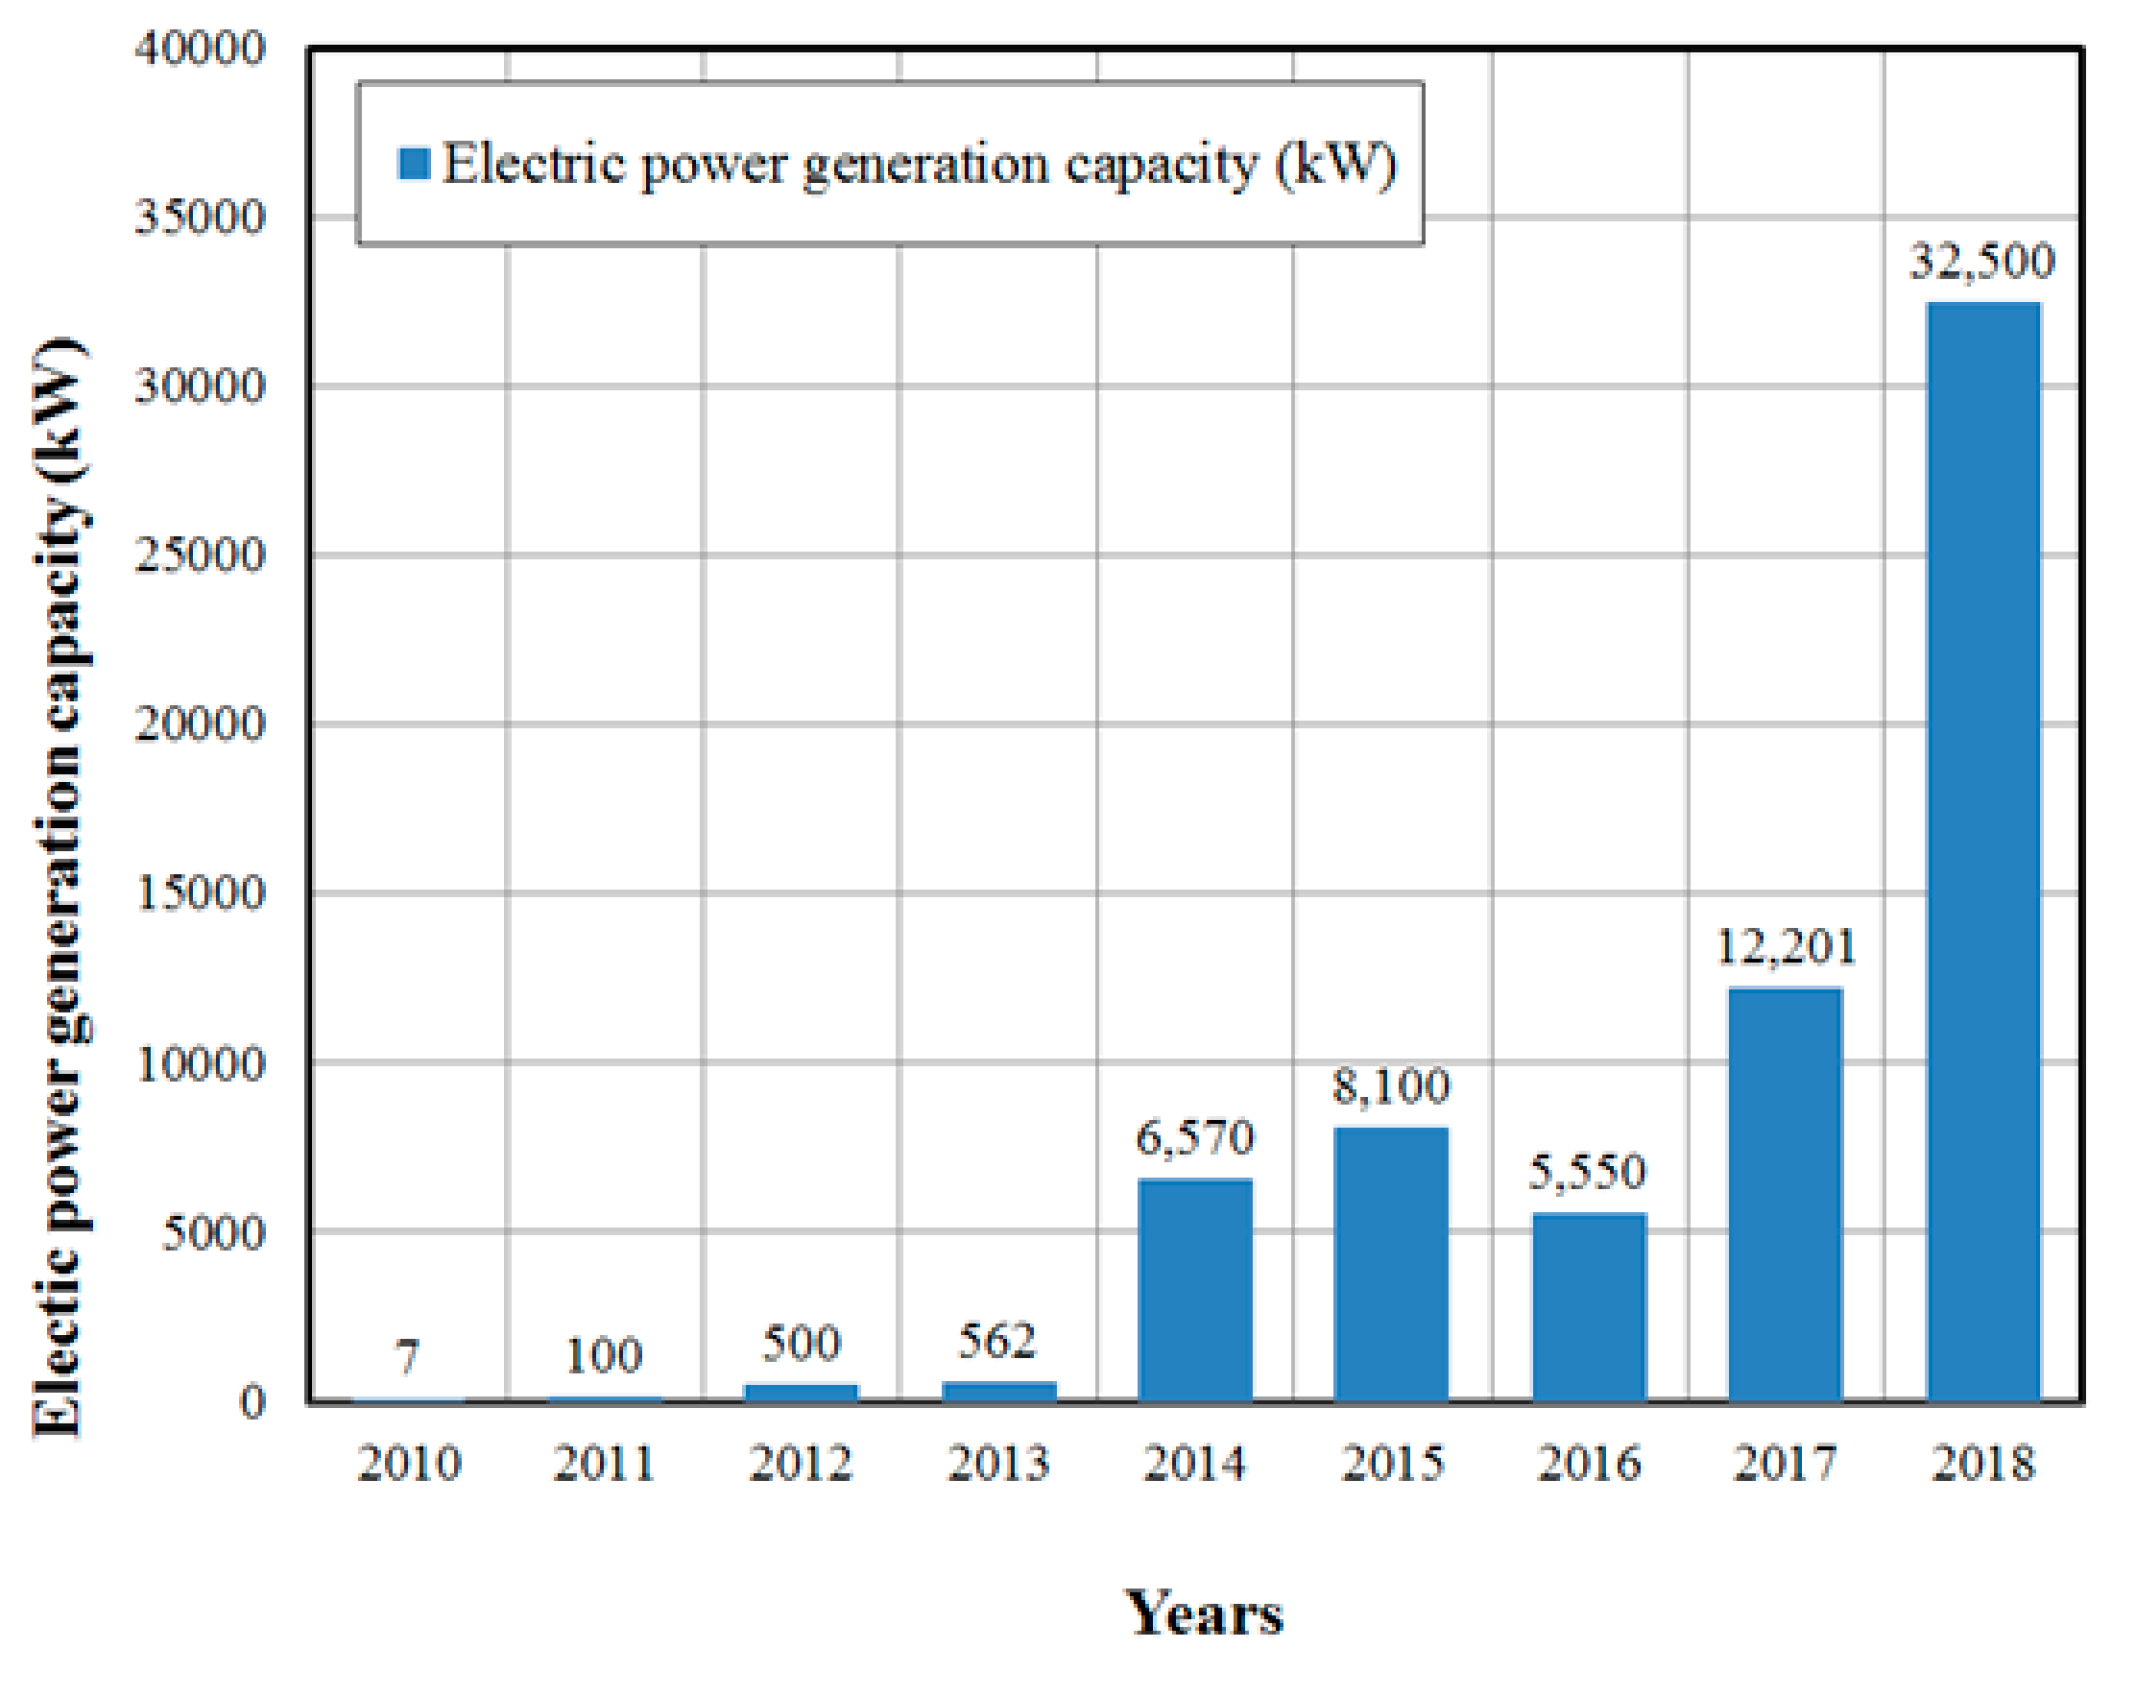
Due to space limitations, it can be difficult to find appropriate terrestrial locations for PV power generation facilities. To address this problem, researchers have investigated floating PV modules that can be installed atop unused space such as the surfaces of inland water bodies. Previous studies conducted by Choi et al. and Lee et al. demonstrate that the power generated by a floating PV installation is approximately 10% higher than that by a terrestrial PV installation owing to low temperatures and reflected waves on their respective surfaces [2,3]. This technology is effective for producing alternative energy in South Korea. In such floating PV power generation implementations, PV modules are mounted on structures configured to float rather than fixed to the ground. Indeed, most floating PV structures have been installed atop unused bodies of water [2,3,4,5,6,7,8,9]. Kim et al. [4] provided an overview of the construction process of a 1-MW floating PV structure on the unused surface of the intake channel of a thermal power plant. Ferrer-Gisbert et al. [5] studied a fixed PV structure installed atop 4700 m2 of a Spanish agricultural reservoir (constituting approximately 7% of the reservoir’s total area), then examined the effects on the evaporation loss from the reservoir. Lee et al. [2] introduced an offshore floating PV structure fabricated using fiber-reinforced polymer (FRP) members. Rosa-Clot et al. [6] determined the energy efficiency of a PV structure floating on the Bolivar wastewater basin in a northern suburb of Adelaide, South Australia. Finally, Cazzaniga et al. [7] and Liu et al. [8] examined the energy efficiency and cost effectiveness of floating PV power generation plants. According to a survey by Trapani and Sanafé [9], the installation of floating PV structures has increased rapidly in South Korea, Japan, the United States, and Europe since 2007. In South Korea specifically, the total power generation capacity of floating PV systems has increased over the last eight years, as shown in Figure 1 [10]. In this study, floating PV power generation structures were installed in the ash pond of a thermal power plant with an idle water surface.
In South Korea, steel, aluminum, and FRP have all been used as structural materials in floating PV installations since 2009. The results of the viability evaluation conducted by Kim et al. demonstrated that the unit material cost of FRP is higher than that of steel. However, the cost of steel members is higher than that of the FRP members because of the difference in the unit weight (or specific gravity) of the materials they are made of [4].
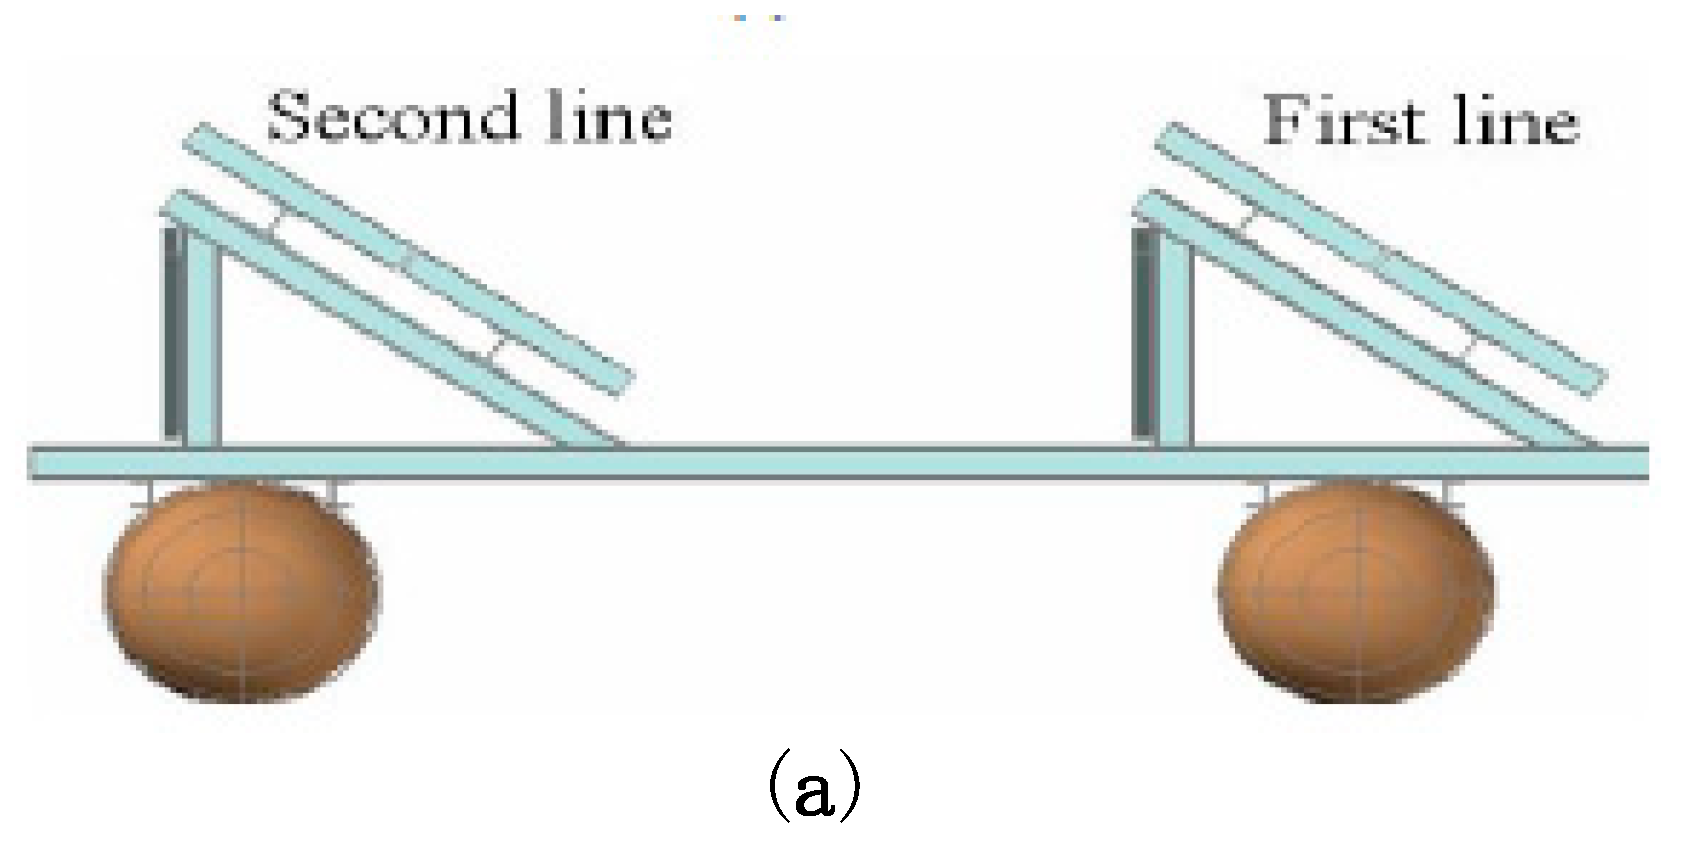
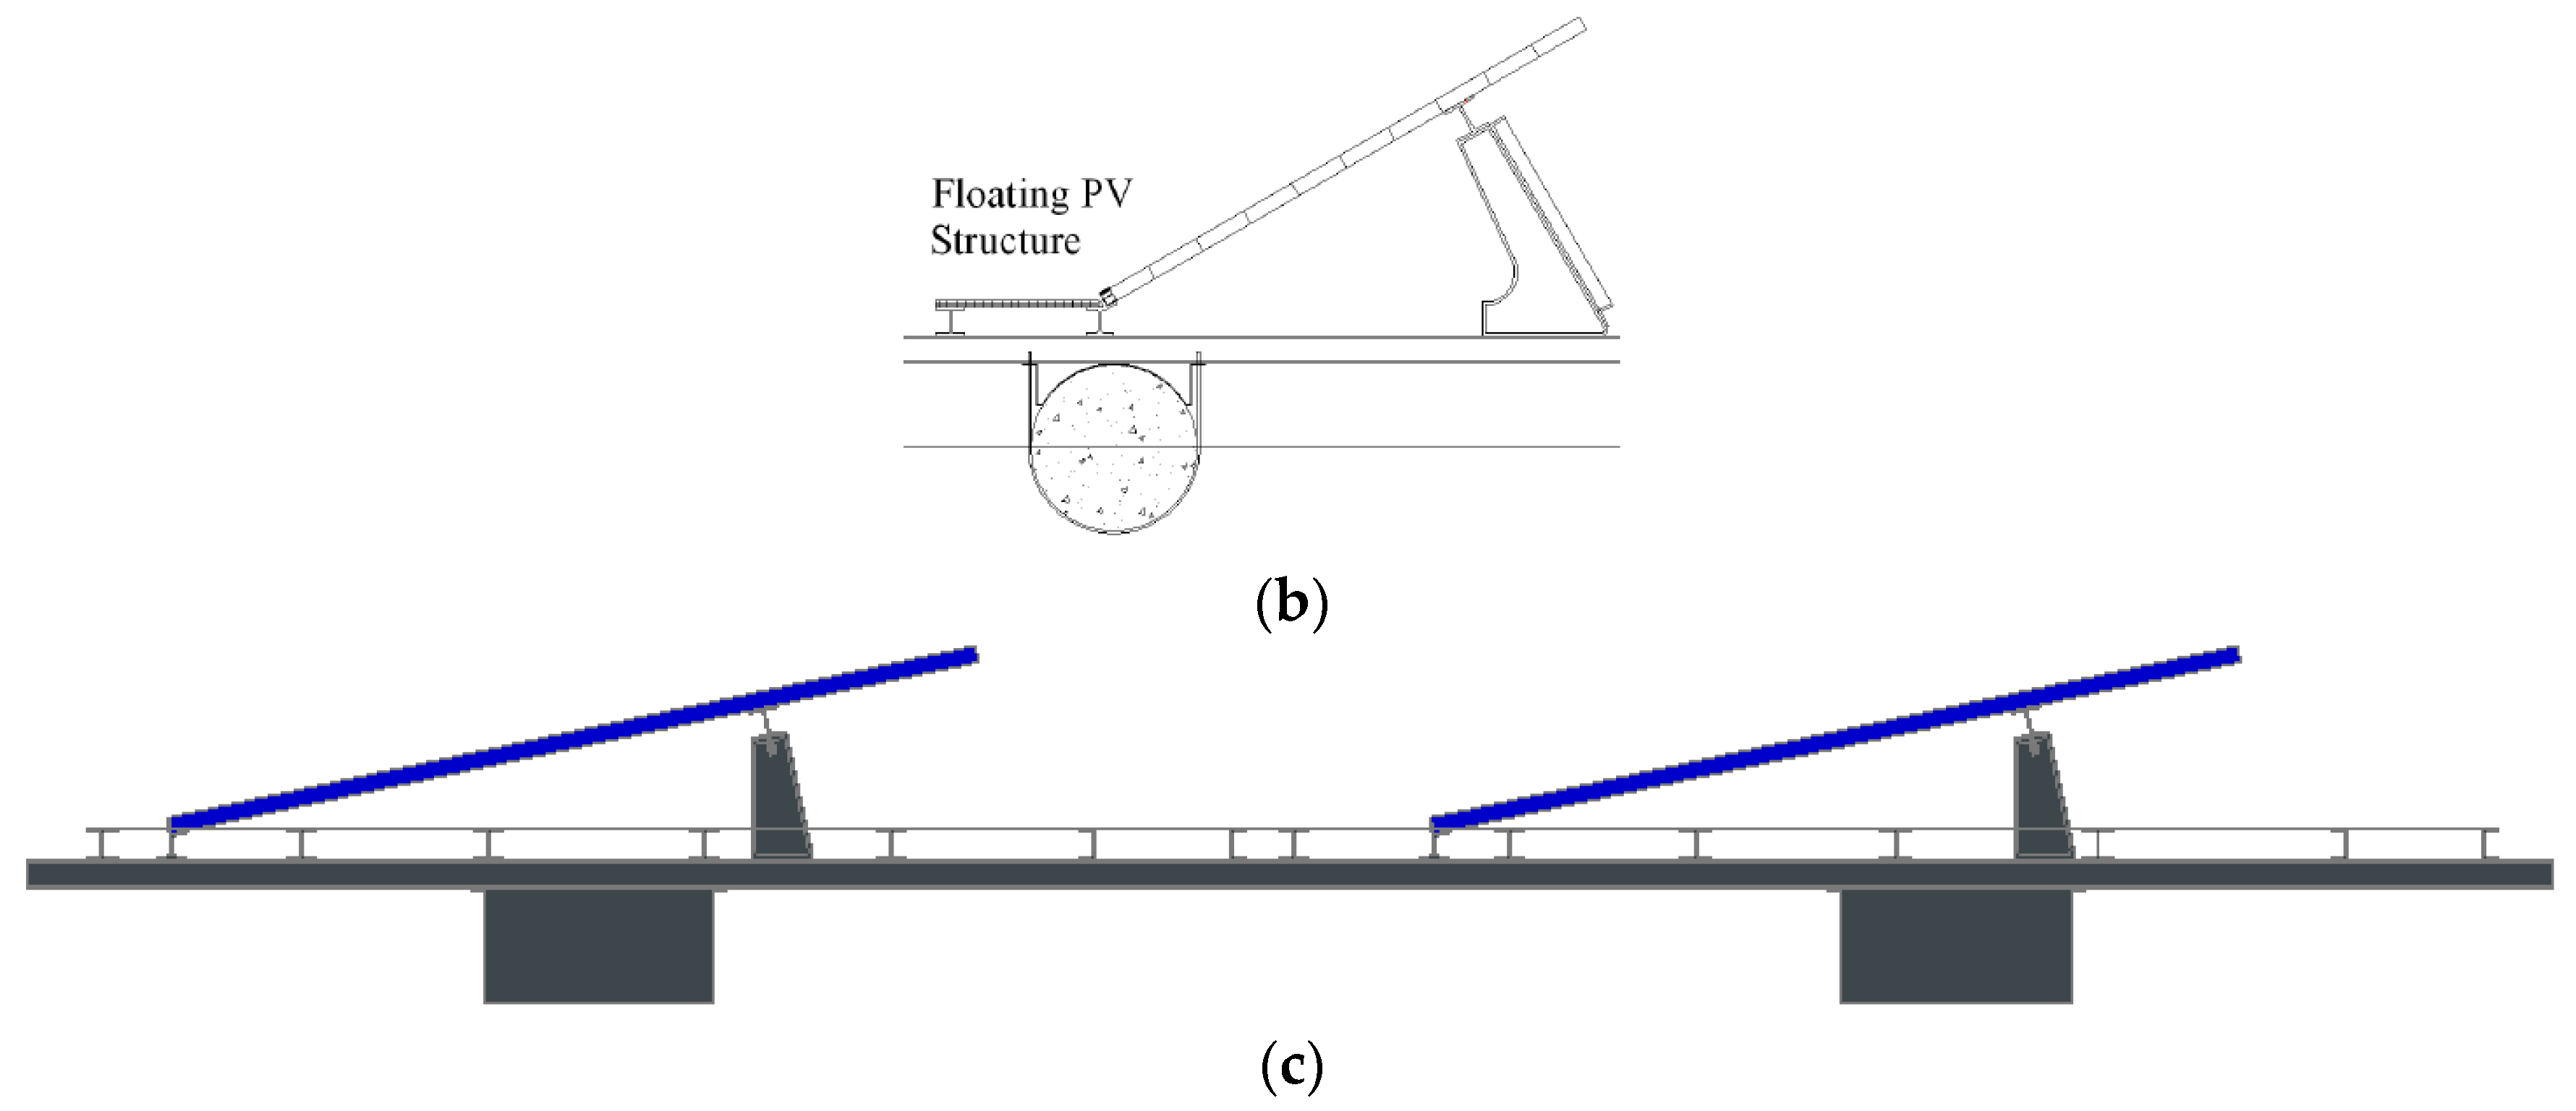
Previous efforts by Choi et al. in 2010 [11] and 2013 [12] developed the FRP member-based floating PV structure designs shown in Figure 2a and Figure 2b, respectively. In this study, we improved on this design, as shown in Figure 2c, by continuing the refinement of the triangular member.
According to the previous studies conducted by Choi et al., all the members of the floating PV structure shown in Figure 2a are designed to be assembled by bolting. When the wind load acts on the floating PV structure installed on the surface of the water, the wind load is transmitted through the solar panel. The transferred load is transmitted to the contact surface of the buoyance and water through each bolting. During this load transfer, the members of the support system and the bolting have to be structurally safe [11]. First-generation PV models require excessive stiffeners and bolts. In addition, the solar module vibrates even for a small load because the load supports one point of the solar module. To solve this problem, the second-generation PV model is applied to the vertical structure of the STS 304 member to improve constructability by reducing connected member punching and the number of bolts. As mentioned by Kim et al., the connection of the unit structure solely comprises bolts without welding to ensure resistance to fatigue load [4].
The angle of the PV module in Figure 2 was reduced by 30 degrees for the first- and second-generation PV model [12], and 12 degrees for the third-generation PV model (present study). Though PV power generation efficiency is generally quite good in South Korea when the angle of the PV module is 30 degrees, Ko et al. [13] and Song et al. [14] found no significant difference in PV efficiency at angles as low as 12 degrees. Notably, when the angle of the PV module is reduced from 30 to 12 degrees, the fabrication of the triangular FRP member can be better optimized, reducing costs. Additionally, the configuration of the pontoon was changed from a tubular structure to a prismatic FRP structure to simplify the shape of the sheet molding compound (SMC) support. When a 3.5-MW class floating PV power generation complex is constructed using FRP members, the total cost for the structures is 2.77 times lower than for those shown in Figure 2a and 2.48 times lower than for those shown in Figure 2b, because of low specific gravity. Therefore, when a 3.5-MW class floating PV power generation complex is constructed, the structures shown in Figure 2c are estimated to be the most cost effective. The results of the commercial viability evaluation are summarized in Table 1.
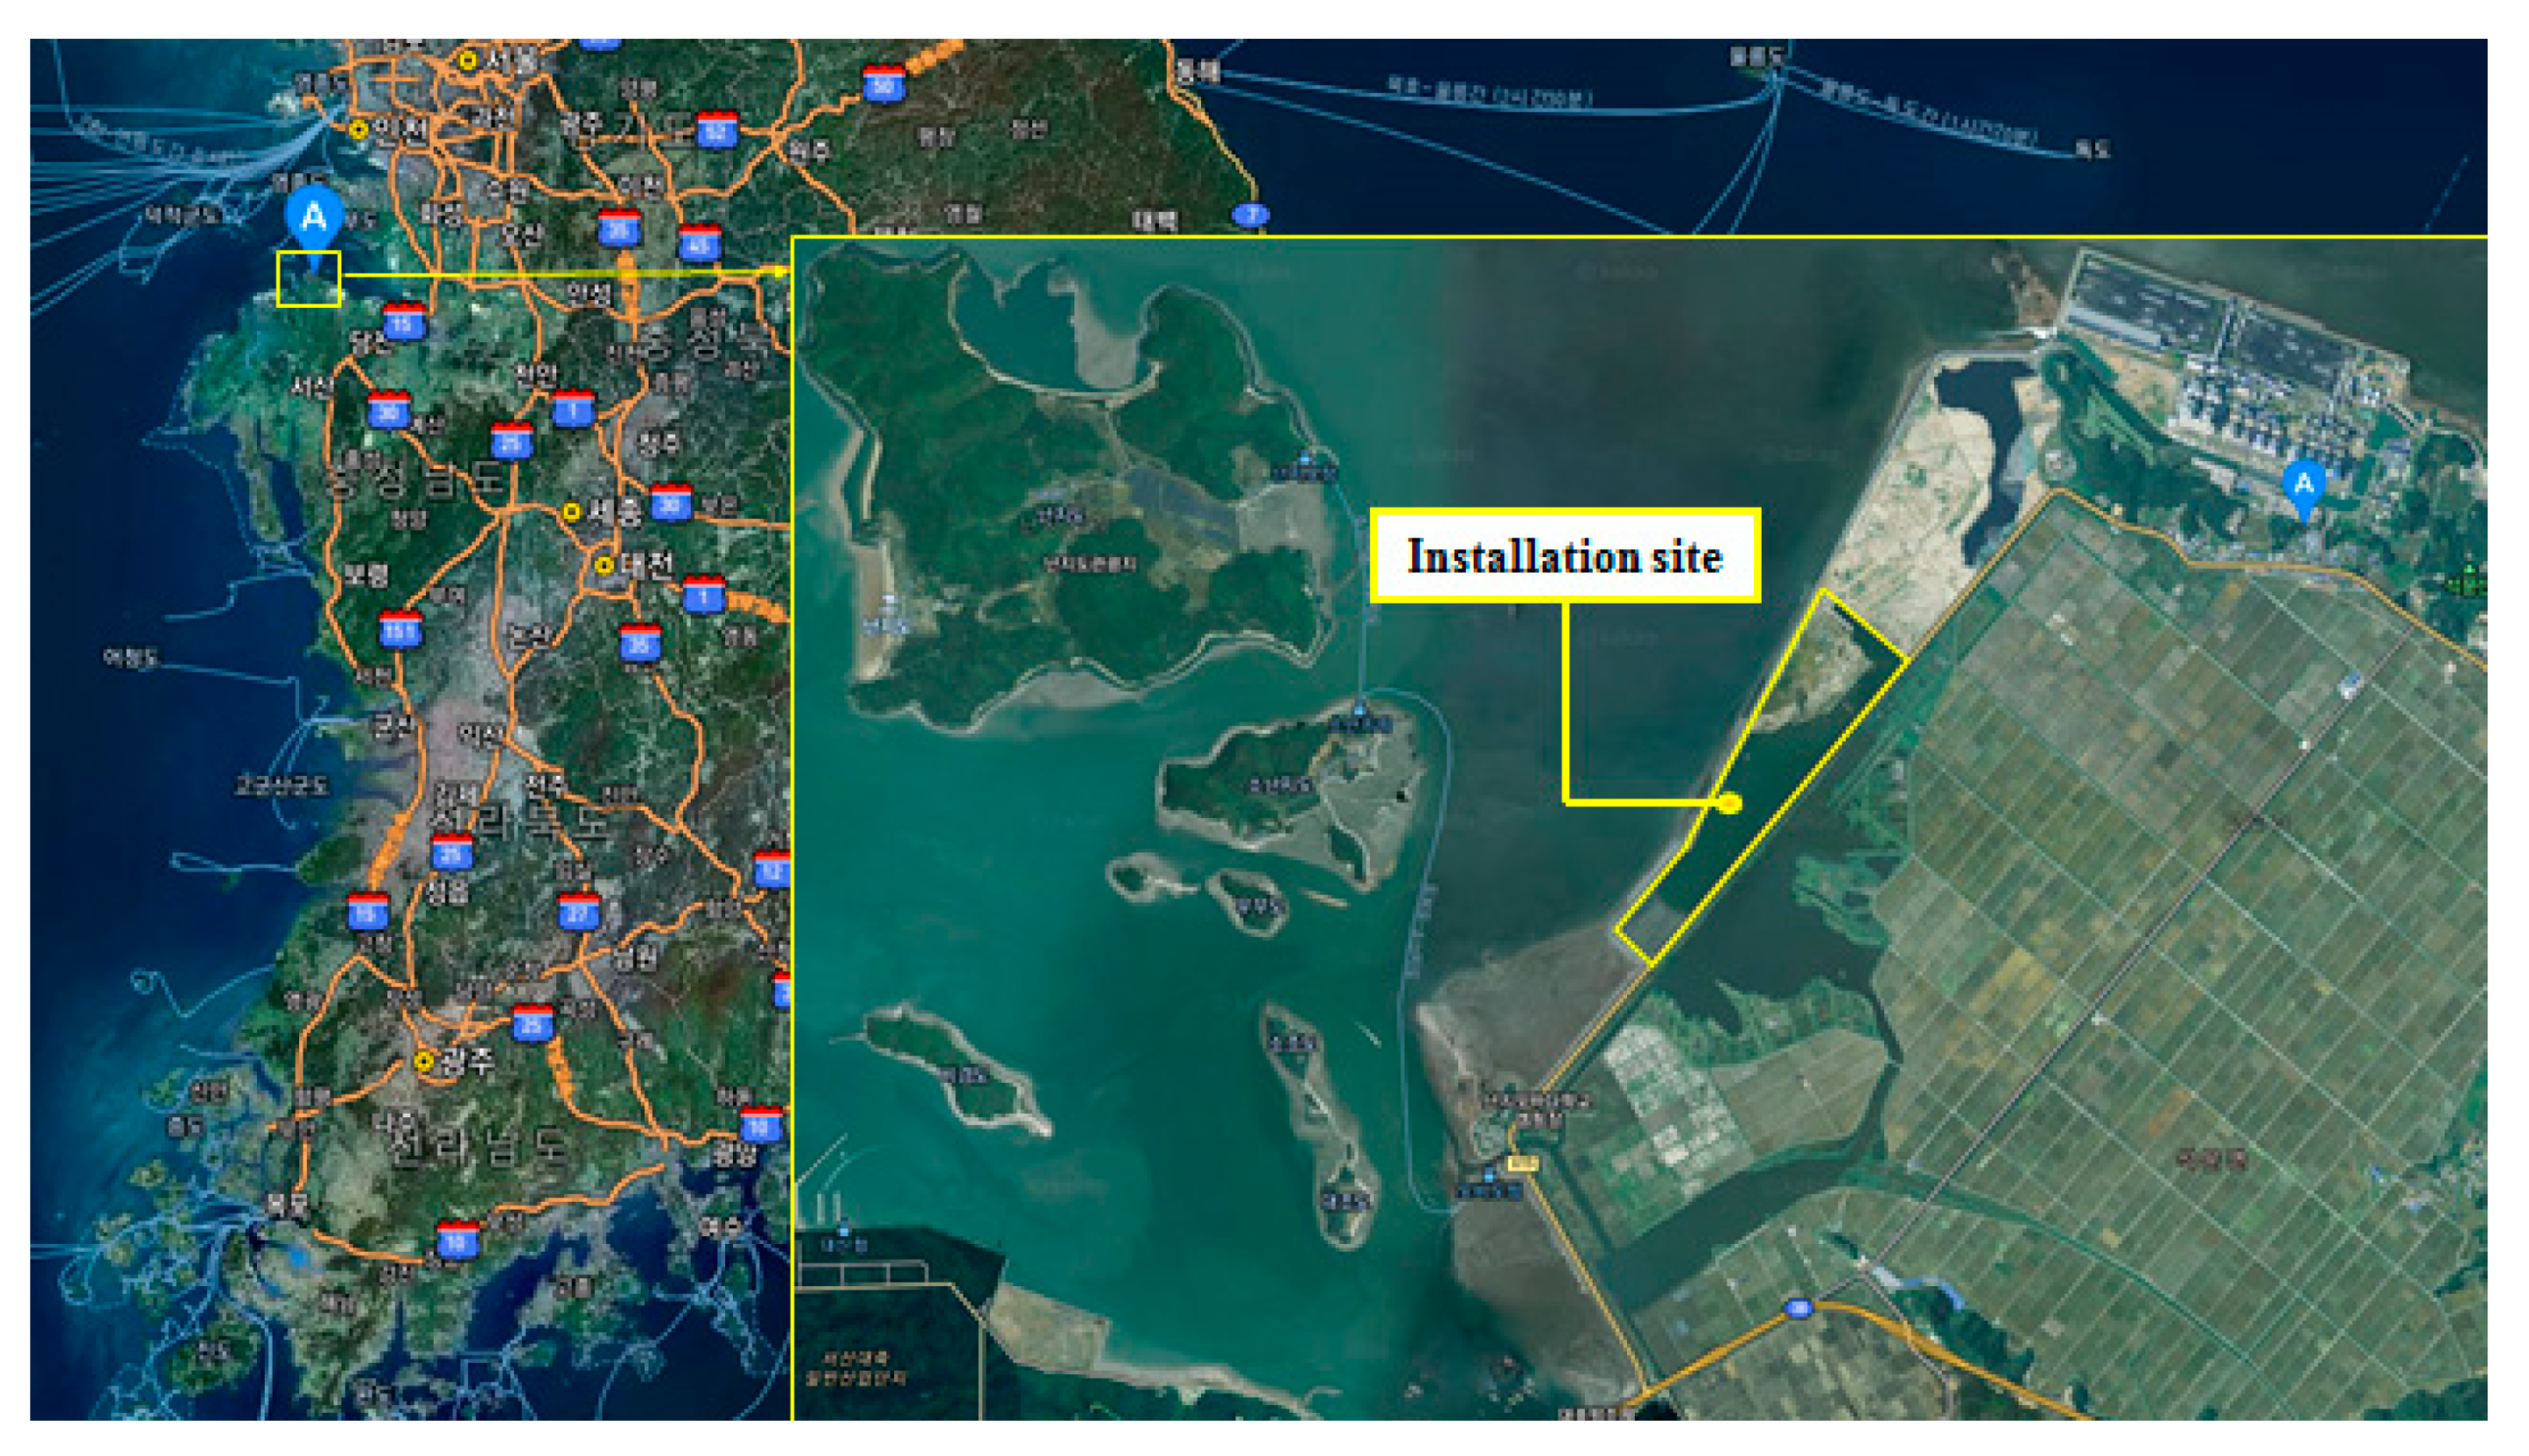
In Korea, as there is no clear design standard for a floating PV generation system, clearly evaluating the load on such structures is difficult. As the prediction of structural behavior is inaccurate, reviews should be undertaken in various respects. In this study, the structure of the improved PV generation structure was reviewed using a finite element analysis. To evaluate the proposed changes to the floating PV structure, we used a finite element analysis (FEA) to model its structural behavior according to the parameters for installation on the unused surface of a thermal power plant ash pond in Dangjin-si, Chungcheongnam-do, South Korea (shown in Figure 3). The behavior of the connections was evaluated using a design review and experiments. We numerically confirmed the power generation efficiency of the completed and installed PV system by examining its performance in 5 min increments over a 2 h period. Finally, the energy produced by the improved PV generation structures and existing structures was compared.
2. Proposed Floating PV Power Generation System
2.1. Mechanical Properties of FRP Members
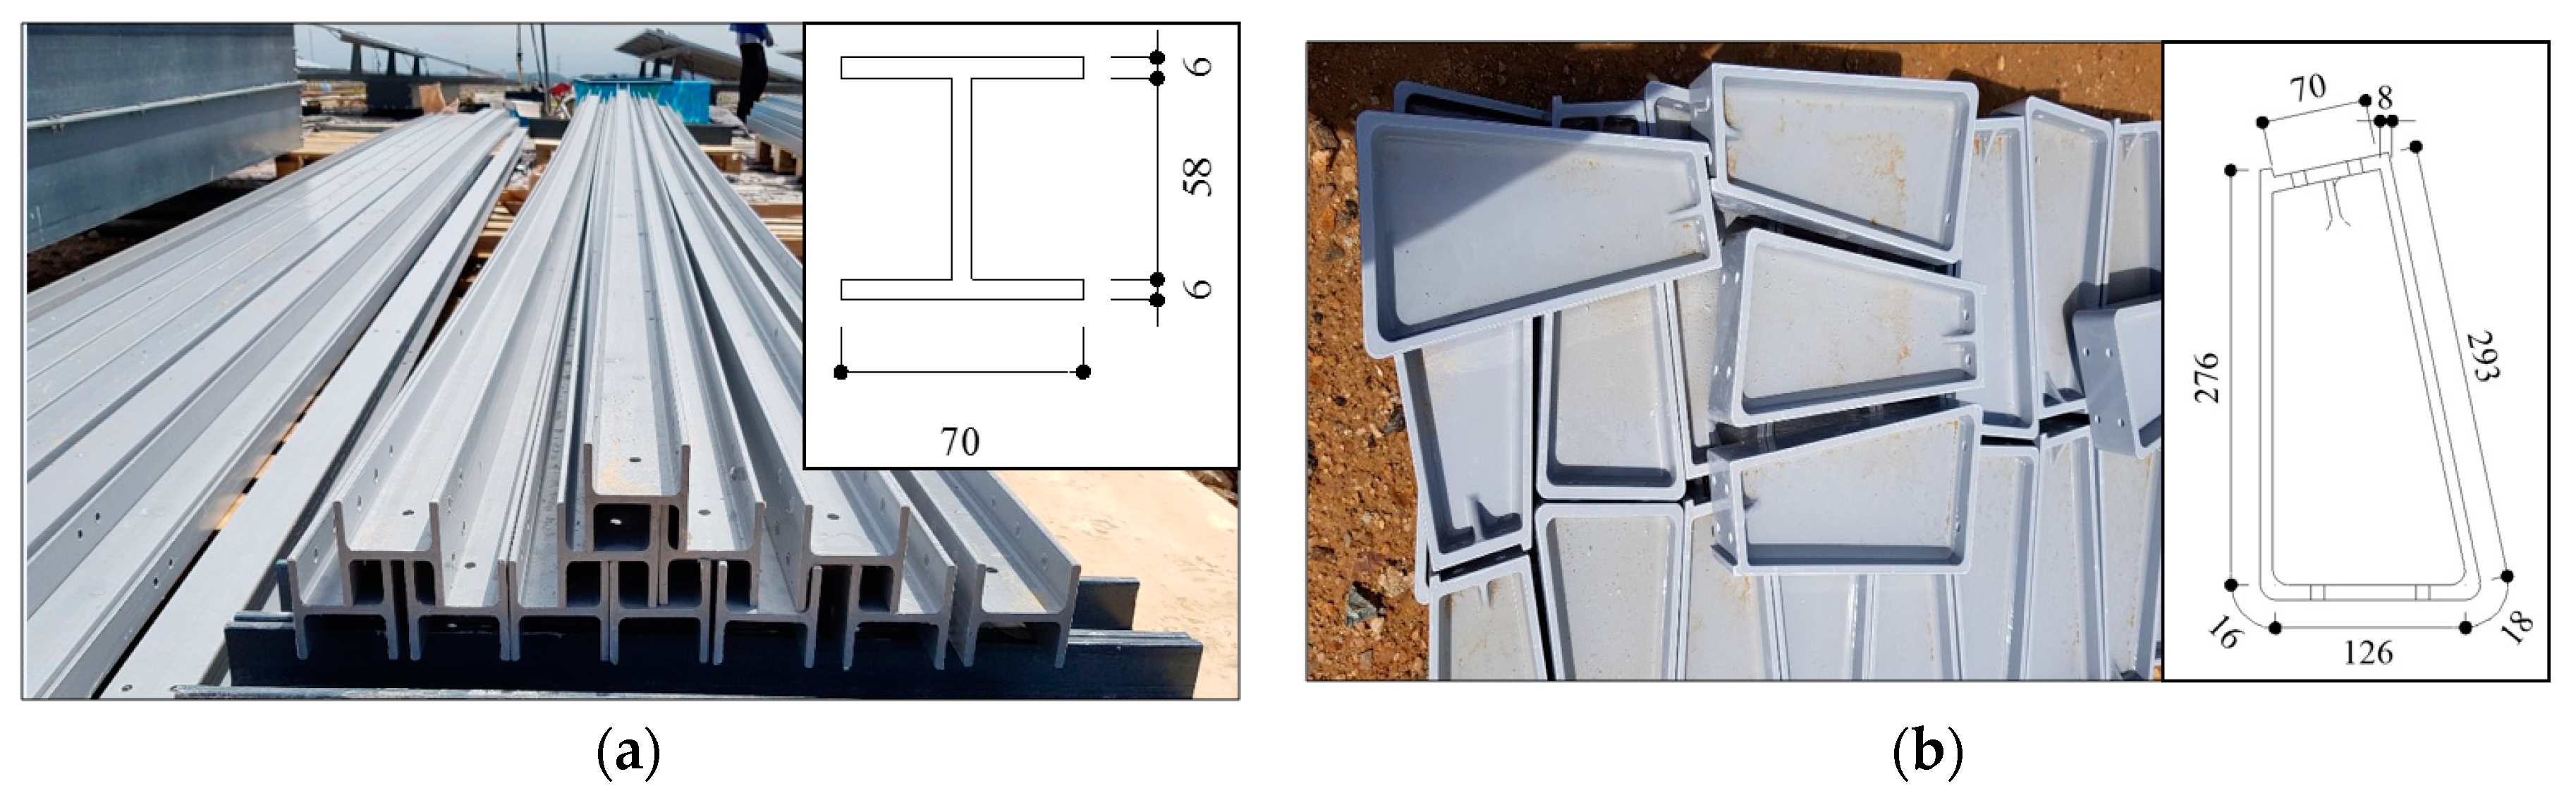
The main members of the framework used in the floating PV structure consisted of pultruded FRP (PFRP) and SMC-FRP. The shapes and dimensions of the PFRP and SMC-FRP cross-sections are shown in Figure 4. The mechanical properties of the FRP materials are important as they differ depending on how the material was produced; the mechanical properties of the PFRP and SMC-FRP used in this study are summarized in Table 2.
2.2. Components of the PV Power Generation Structure
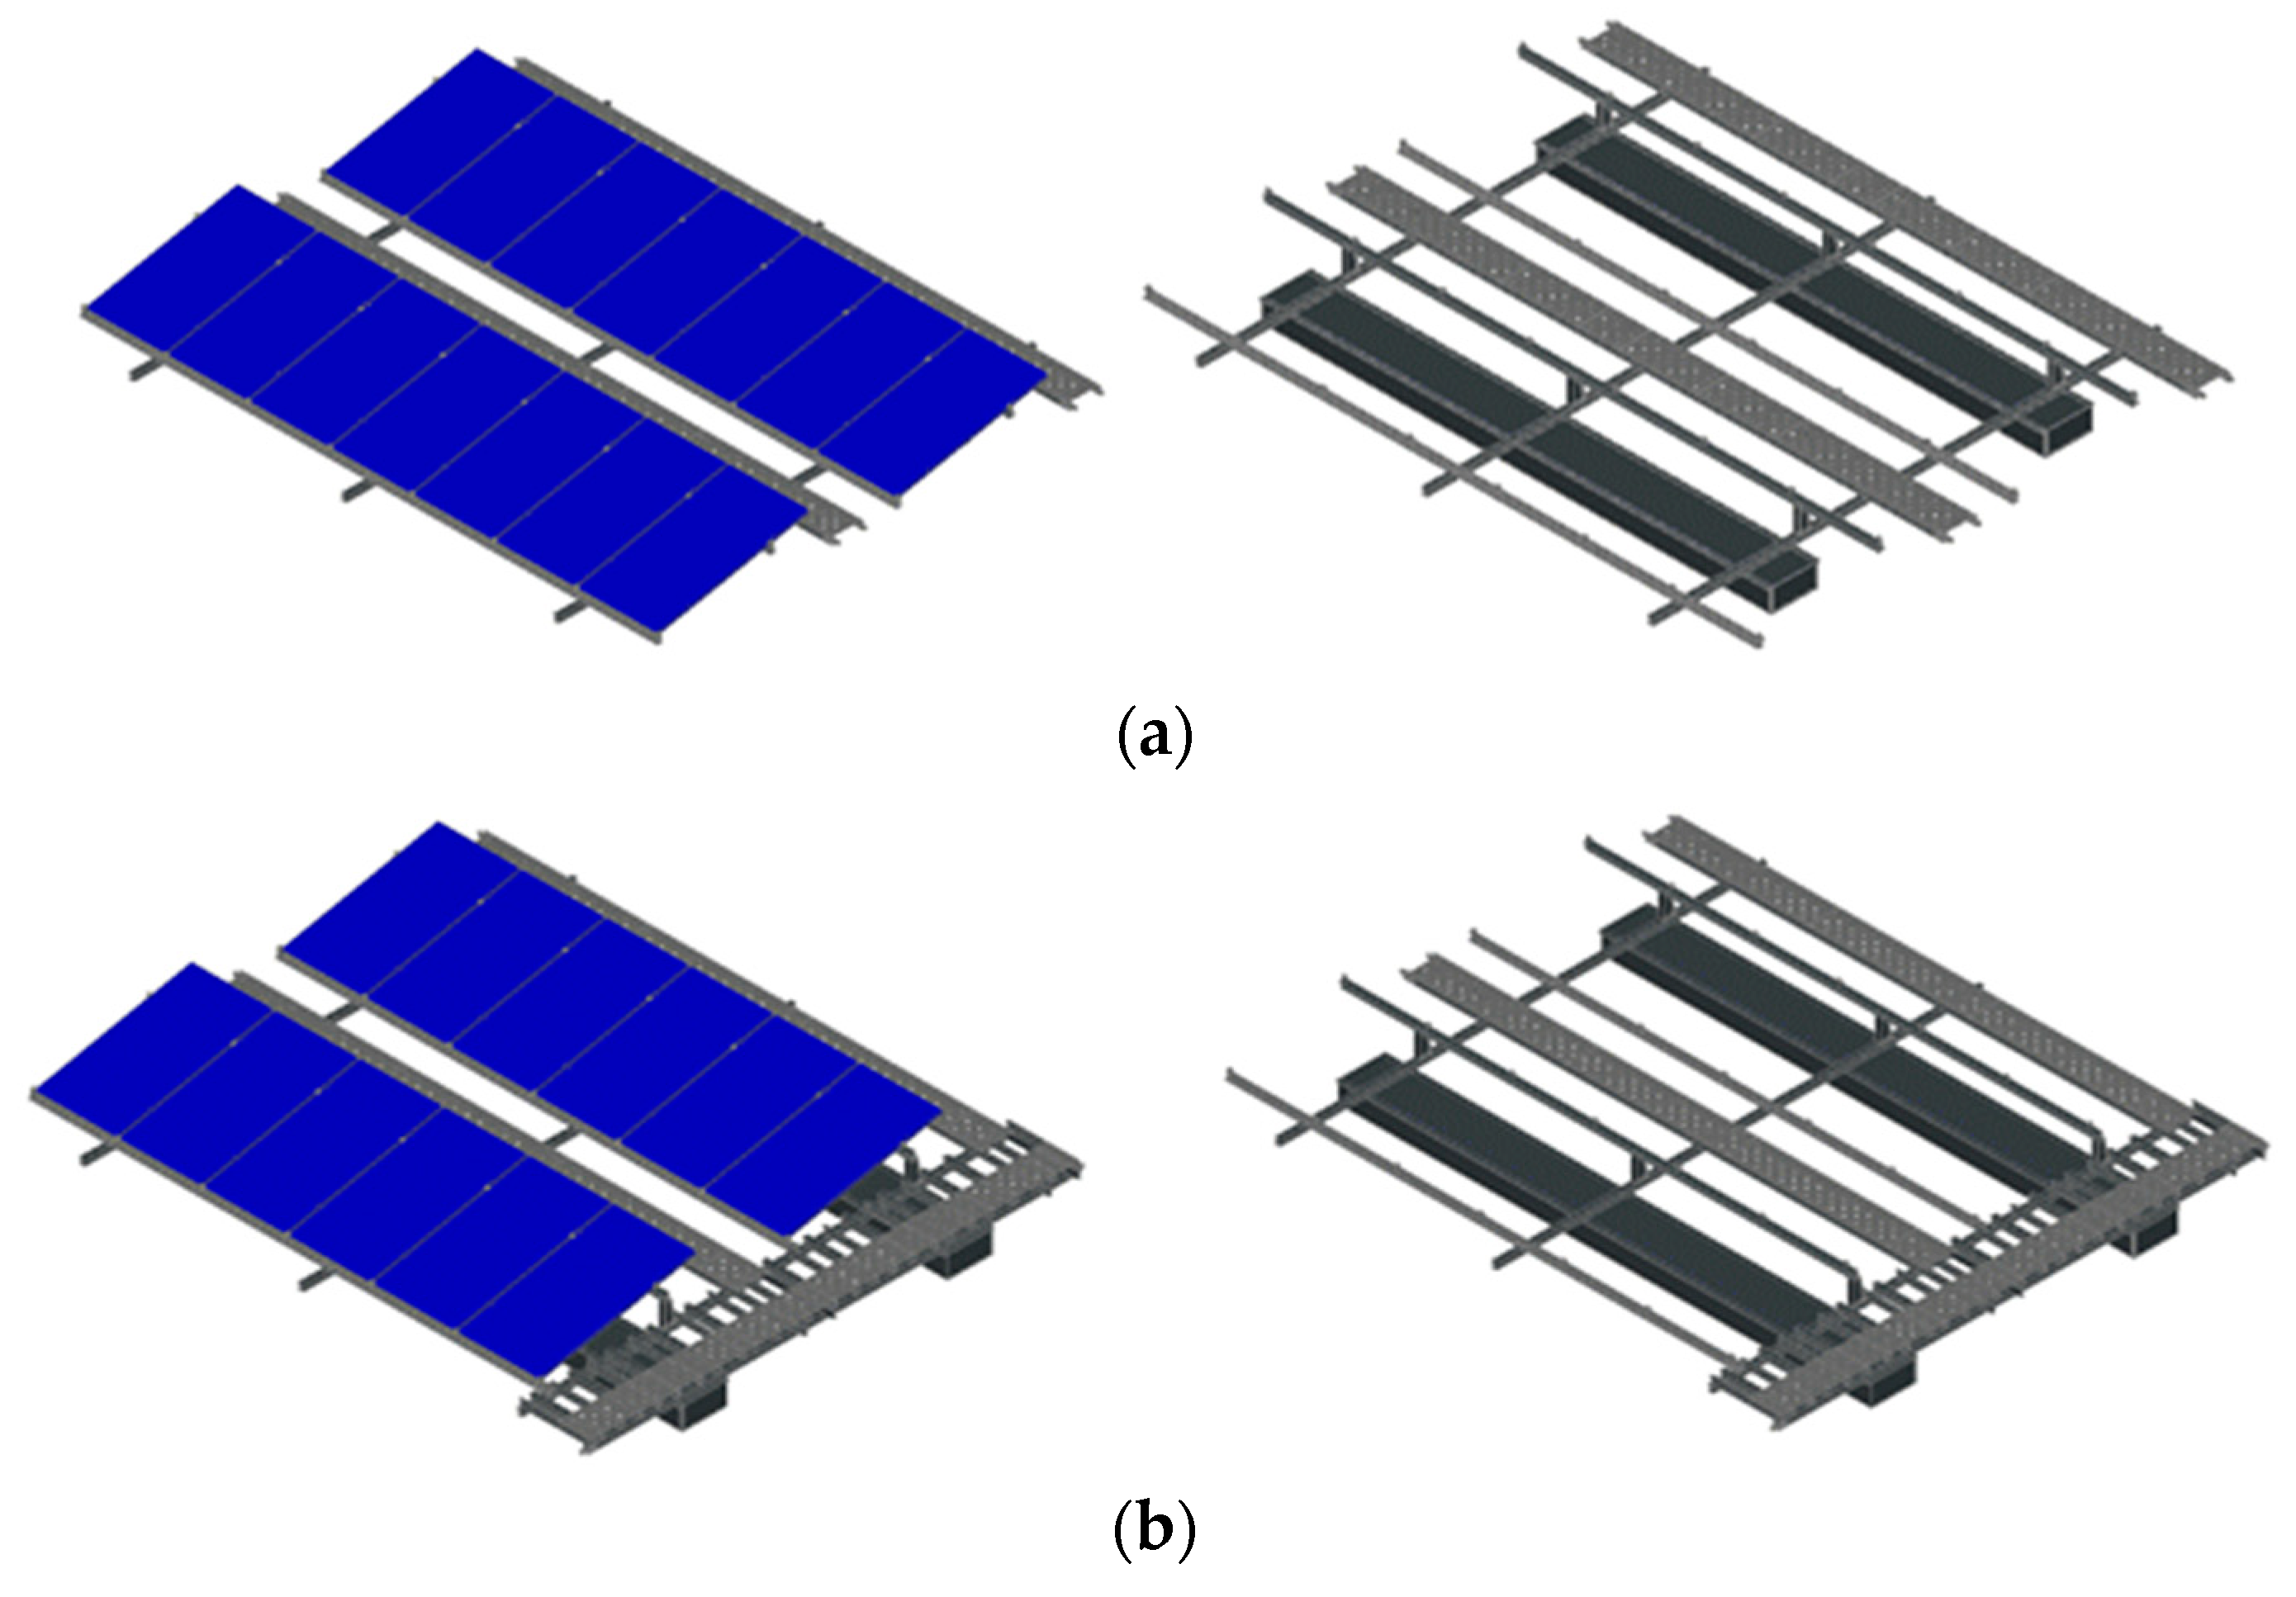
Two types of floating PV structures were designed to create the proposed floating PV structure, Type A and Type B, shown in Figure 5. The Type A structure consisted of general structural components only, whereas the Type B structure also included a walkway. The Type A structure had 14 PV modules, but because of the space required by the walkway, the Type B structure had 12 PV panels. The PV modules in both structure types were 1960 × 998 mm, each with a capacity of 340 W. Thus, the Type A structure shown in Figure 5a has a capacity of 4.76 kW (=340 W × 14) and the Type B structure shown in Figure 5b has a capacity of 4.08 kW (=340 W × 12). The angle of the chord drawn between the top of the PV panel in the first line and the bottom of the PV panel in the second line was set to 13 degrees so that all 14 PV panels could maximize power generation time without shadows.
2.3. Design Codes
The floating PV structure evaluated in this study was designed according to the FRP design standards of the American Society of Civil Engineers (ASCE) [16]. Its buoyancy was designed using hydraulic principles to determine the framework for operating a stable structure. Structural safety during power generation was ensured using a mooring design based on methods for designing floating structures in accordance with domestic conditions [17,18].
2.4. Design Loading Conditions
Floating PV structures are classified as building structures; they consider only the loads generated by solar modules owing to self-weight and weather conditions. Because the load is transmitted to the ground through the structure, the load transmission structure is clear, and safety can be ensured using the simple structural design. However, the floating PV structure is divided into gravity and horizontal loads. The loads are transmitted to the buoyancy and mooring system. Each component material of the floating PV structure evaluated in this study is lightweight and exposed to the elements; thus, they are prone to damage by typhoons or other disasters. Accordingly, wind load is an extremely important factor in the structural design of such large-scale PV installations. Wind and snow loads were therefore calculated for application to the floating PV structure. The wind load for the design was calculated based on the wind speed as per the Korean Highway Bridge Design Code [19] and the Korean Building Code (KBC) [20] as follows:
where is the basic wind speed for the design (in m/s), is the velocity pressure exposure coefficient, is the topographic factor, and is the importance factor. Table 3 provides the values of the wind load variables used in this study, in which the maximum sustained wind speed recorded in South Korea was used as .
The snow load was calculated according to the Korean Highway Bridge Design Code [19] and KBC [20], as follows:
where is the roof snow load factor, is the exposure factor, is the temperature factor, is the gradient factor, is the importance factor, and is the snow load (in kN/m2). Table 4 lists the values of all snow load variables used in this study, in which a snow depth of approximately 50 cm in Dangjin-si (where the subject ash pond is located) was applied when defining the basic snow load .
2.5. Finite Element Analysis
2.5.1. Modeling
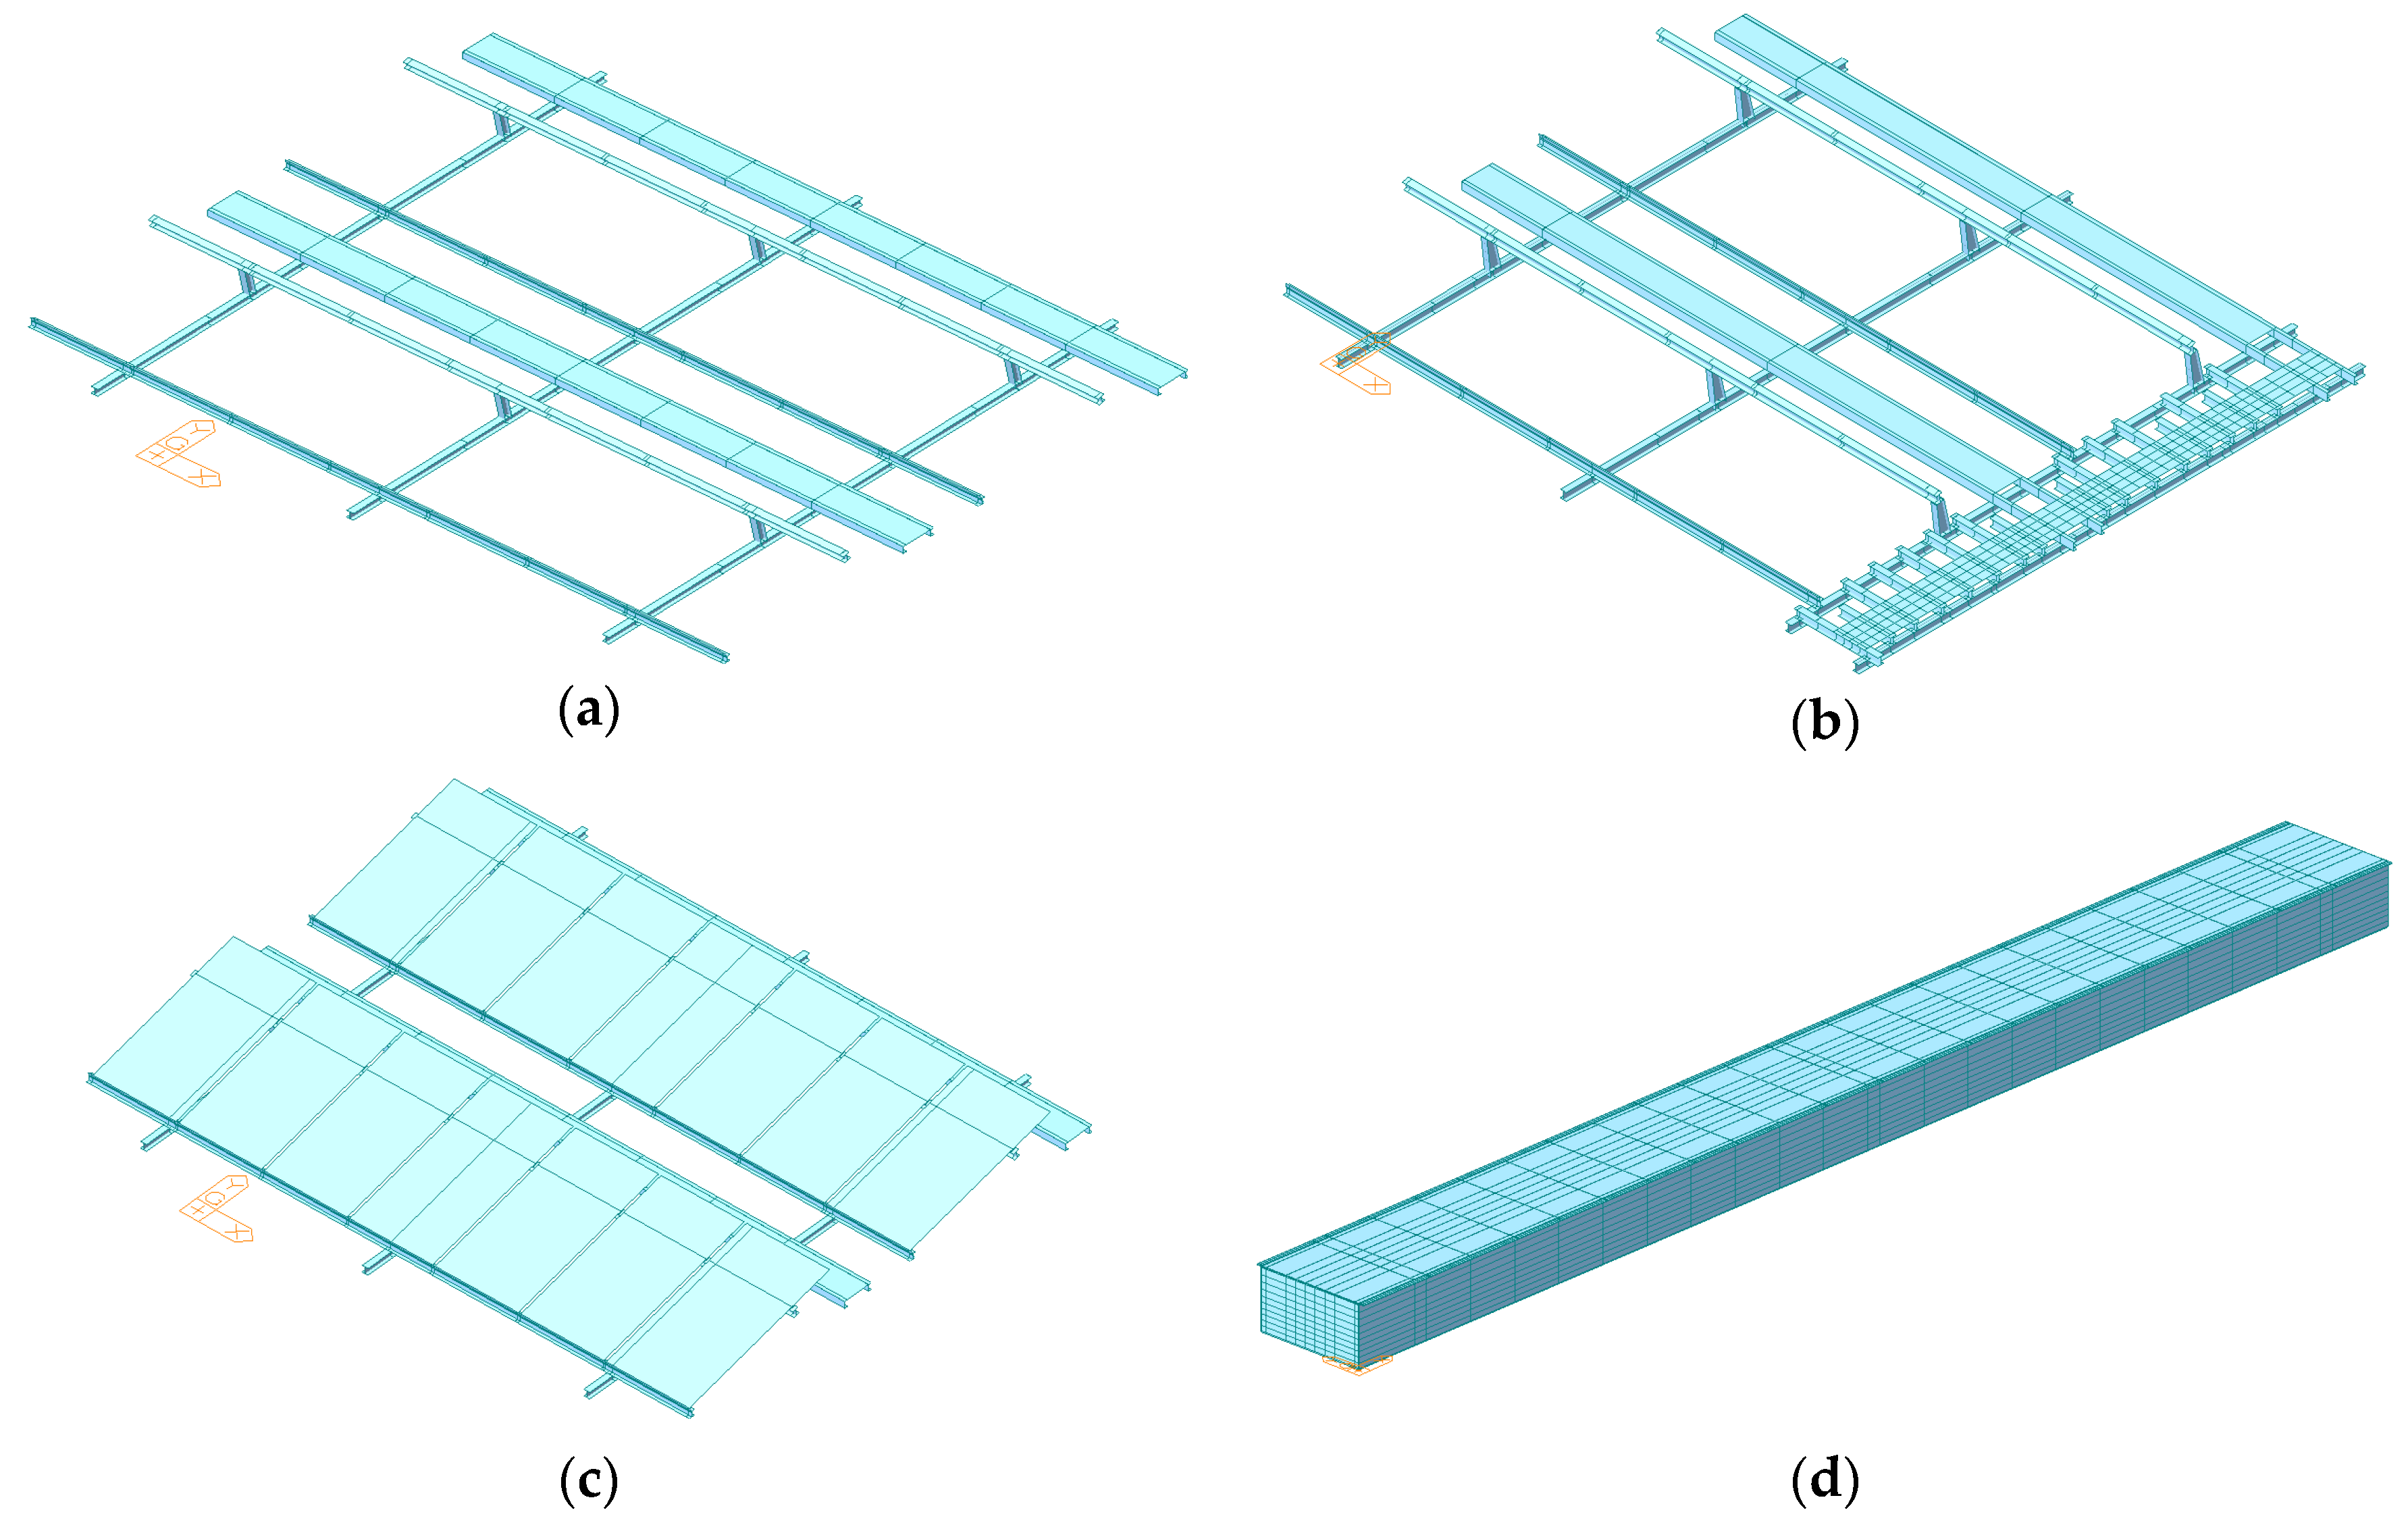
The structural safety of the two evaluated floating photovoltaic structure types was verified by a three-dimensional (3D) FEA performed using MIDAS Civil Ver. 2012 [21]. In the FEA program, the structural members (FRP members) of the Type A and Type B structures were modeled as 3D frames, as shown in Figure 6a and Figure 6b, respectively. The photovoltaic modules and pontoons were modeled as plates, as shown in Figure 6c and Figure 6d, respectively.
2.5.2. Loads and Boundary Conditions
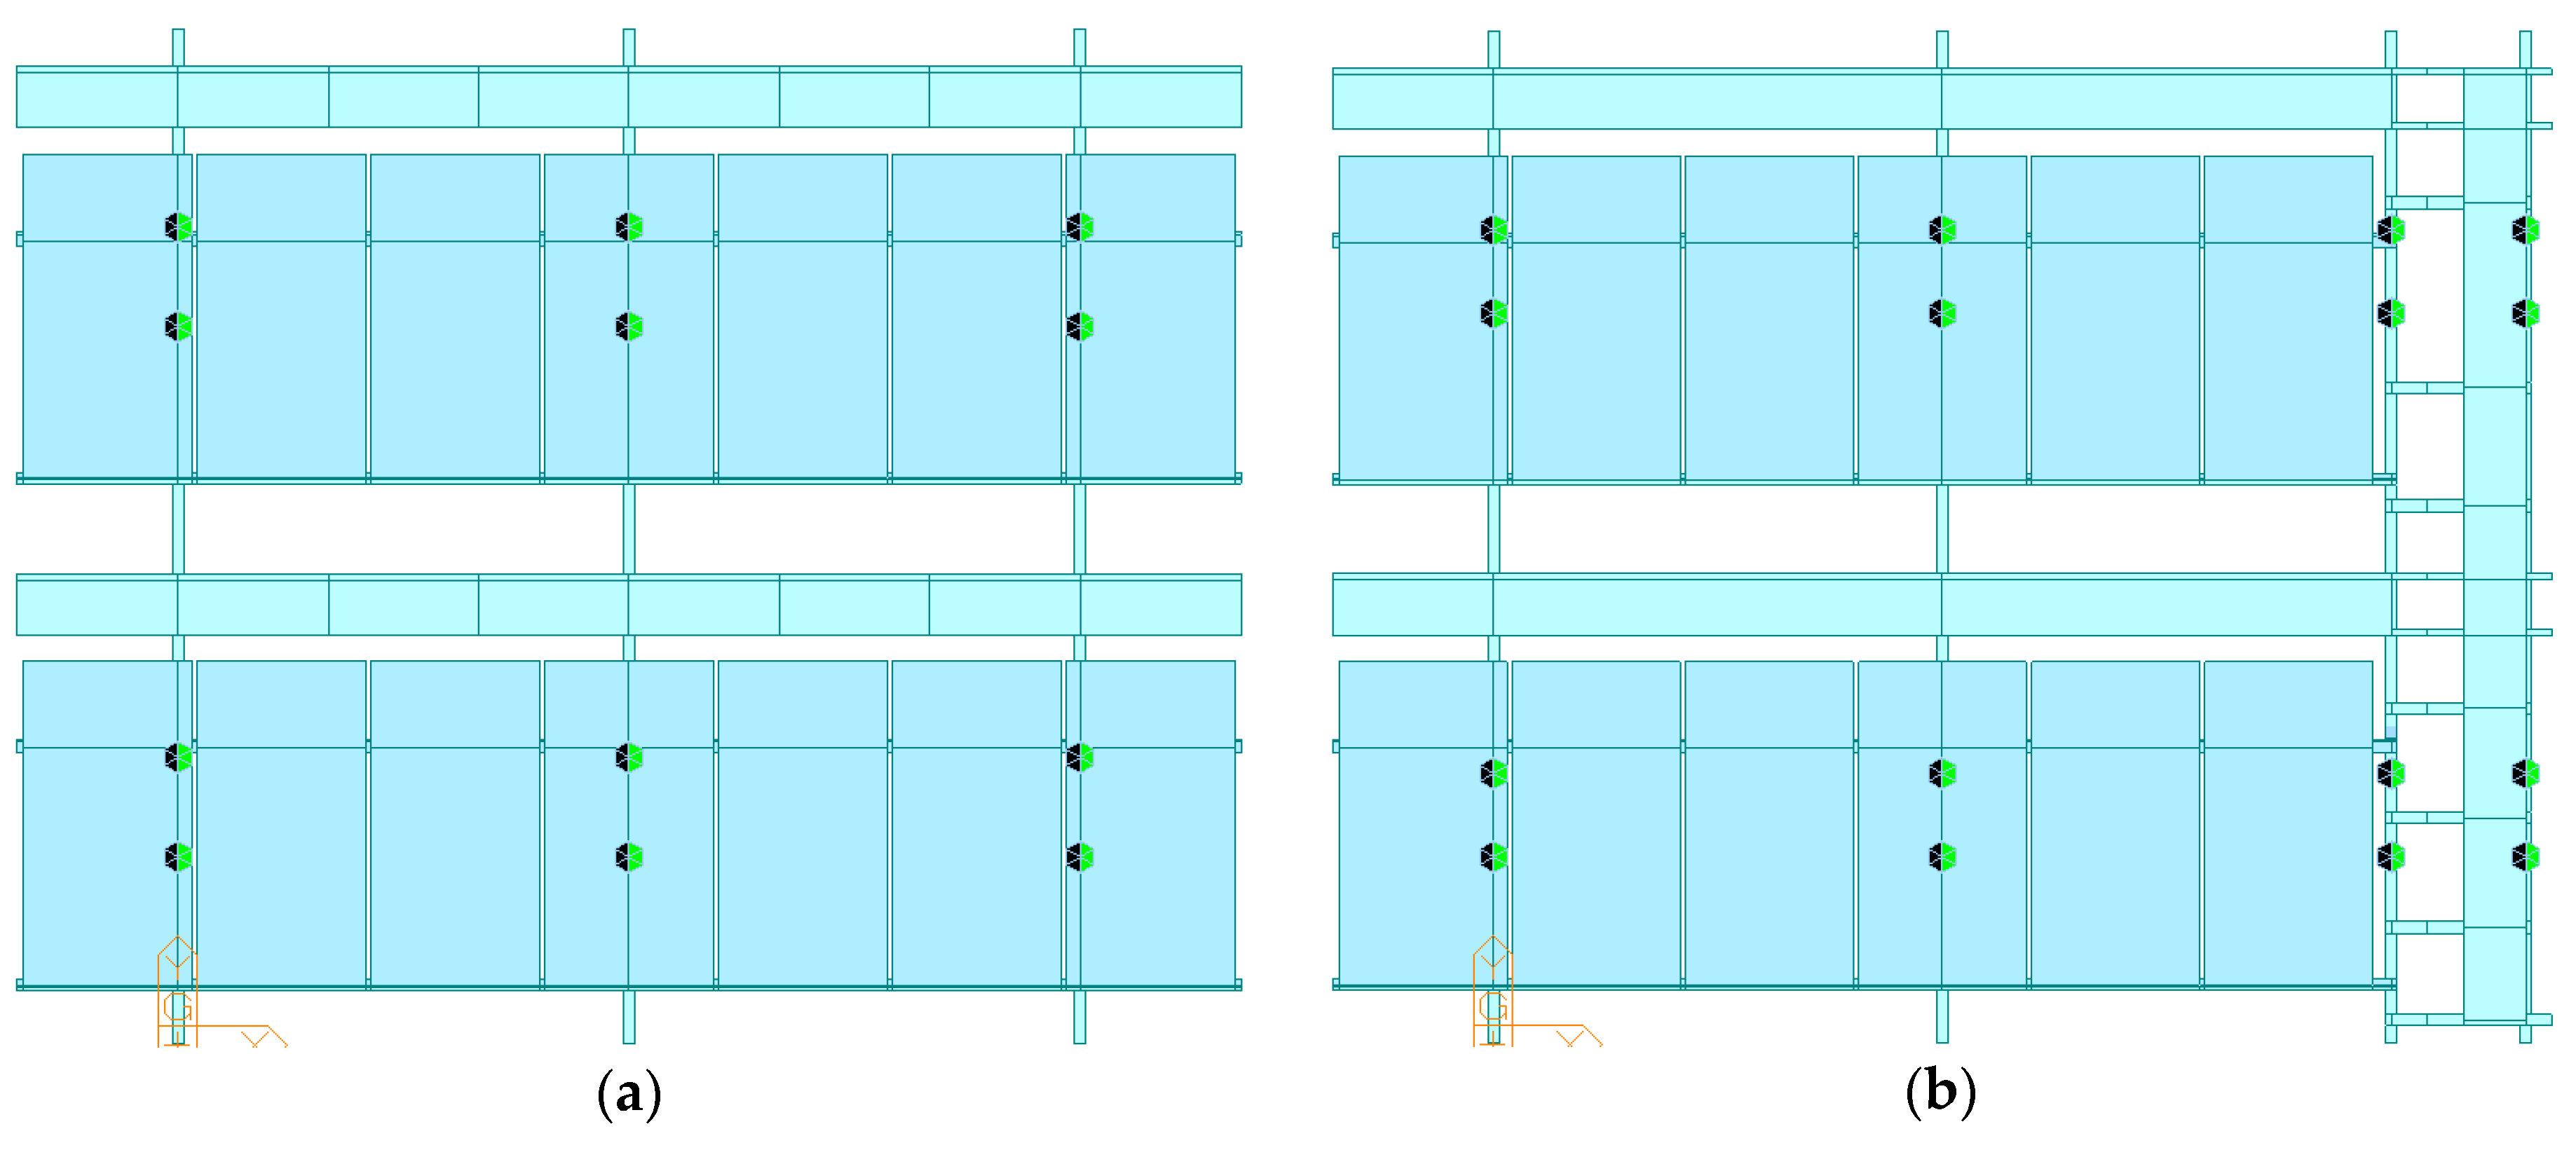
The boundary conditions applied in the FEA model are shown in Figure 7. The pontoons were assumed to be simply supported, and the combined self-weight, wind load, and snow load was applied. The mechanical properties of the materials used in the analysis were as presented in Table 2. The mesh of the Type A structure contained 346 nodes and 190 elements, and that of the Type B structure contained 519 nodes and 317 elements.
The maximum stress in each member was determined by applying the wind load, snow load, and self-weight as a combined load. The wind load applied to the structures was determined based on a design sustained wind speed of 50.85 m/s as per the requirements of the Korean Highway Bridge Design Code [19]. A maximum instantaneous wind speed of 72.72 m/s was applied using the instantaneous wind speed coefficient (1.43) in the ASCE code [16].
2.5.3. Results of the Finite Element Analysis
The results of the FEA are shown in Figure 8a–c and presented in Table 5. These results indicate that the safety factor of the allowable maximum stress in the Type A structure was 3.91 and that in the Type B structure was 3.96. The safety factor of allowable maximum flexural stress in the pontoon, evaluated in the longitudinal direction, was 8.88. Therefore, according to the results of the FEA, the stress in the FRP members remained within the allowable limits.
3. Proposed Mooring System
3.1. Mooring System Design
Unlike the mooring systems used in many existing floating PV structures, which allow the PV structure to be moved, the mooring systems for the floating PV structure evaluated in this study must maintain the PV modules in a fixed position for at least 20 years. The mooring system should therefore be designed to minimize the impact of its behavior on the structural members. The proposed floating PV structure was moored using the horizontal and vertical anchor mooring methods illustrated in Figure 9, according to the topography of the ash pond site. The required anchor weight and type of mooring lines used in floating-type marine structures were determined from previous research into mooring system design [5]. For the horizontal mooring method, concrete anchors were installed at the top and bottom of the surrounding embankment and a mooring chain, which was horizontally connected to the floating structure by a stainless steel (STS) cable, was installed between them. For the vertical mooring method, the mooring chain was used to directly connect the concrete anchor, located on the bottom of the pond, to the floating structure above.
From the free body diagram provided in Figure 10, the mooring line tension values TAB and TBC can be respectively obtained by
and
where TAB is the tension in mooring line segment AB (in tonf), TBC is the tension in mooring line segment BC (in tonf), Wu is the weight of the lower anchor (in tonf), P is the load on the structure (in tonf), and is the angle between the load, P, and the mooring line (in degrees).
The calculated strengths of mooring line segments AB and BC used in the horizontal mooring system were 0.59 tonf (5.249 kN) and 1.67 tonf (14.857 kN), respectively, which were within the allowable strengths of the mooring lines: 2.05 tonf (18.238 kN) and 4.74 tonf (42.169 kN), respectively.
3.2. Mooring Hardware Design
When designing the mooring connection hardware, the maximum horizontal force acting on the connection should be considered. In the proposed system, the mooring hardware for each line consisted of a bolt and connection plate, as shown in Figure 11. The maximum horizontal mooring force (Pu) for the floating PV structure on the ash pond was determined to be 28.64 kN (2.92 tonf), based on the free body diagram in Figure 10. Note that the bolting effect on the web was not considered in the safety of the design.
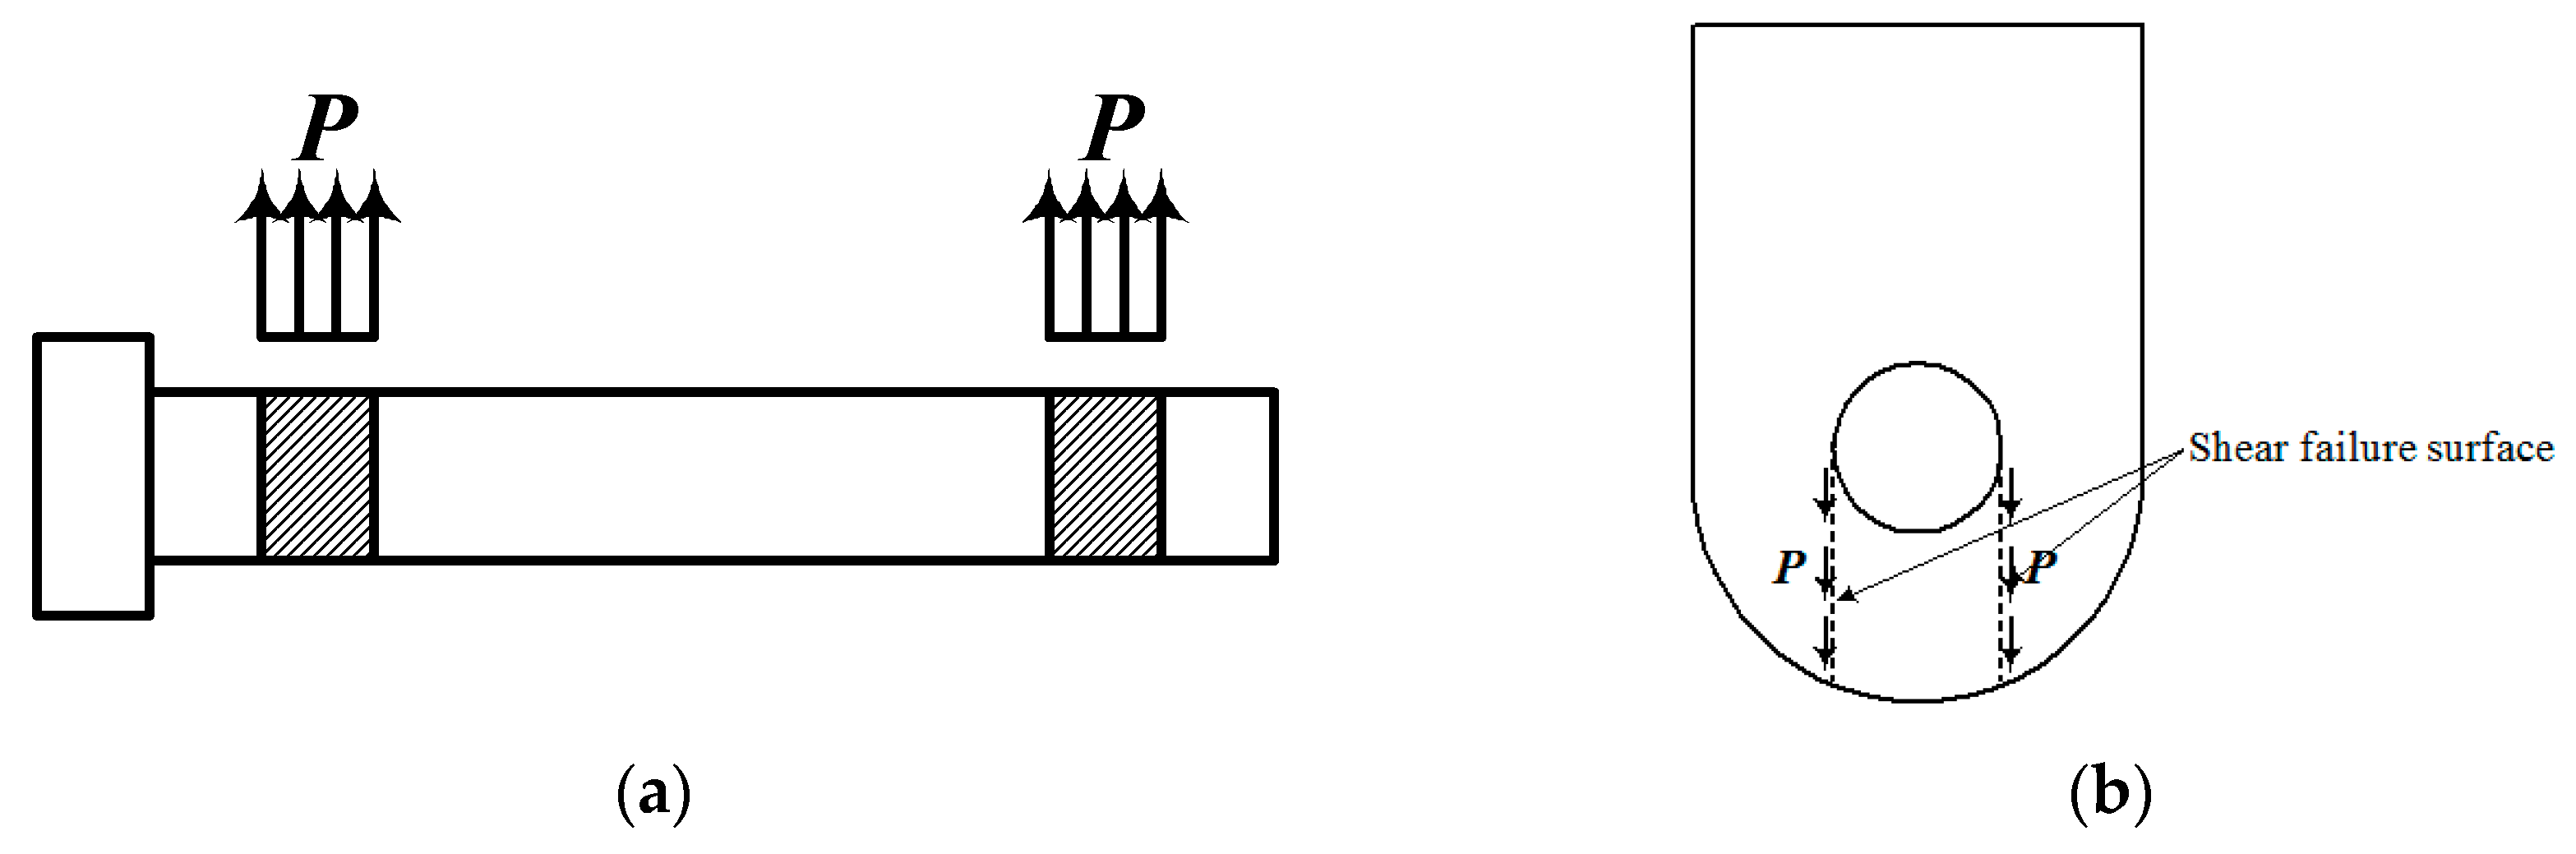
The mooring hardware was reviewed according to the results of Lee et al. [22] and Woo et al. [23] to ensure that shear failure would be induced in the bolt and connection plate, rather than in the floating structure itself. The allowable shear capacities of the hardware components shown in Figure 12 were calculated as connecting hardware for mooring lines using a safety factor of 2 according to [22,23] as follows:
where is the allowable load (in kN), is the nominal tensile strength (in kN), is the nominal unthreaded body area of the bolt (in mm2), and n is the number of shear planes across the effective width, where n = 4.
Table 6 presents the results of the shear evaluation of the connection hardware shown in Figure 11, indicating that the allowable shear force had a safety factor at least 1.72 times the maximum horizontal mooring force. Therefore, the mooring connection hardware was determined to be safe for mooring the proposed floating PV structures.
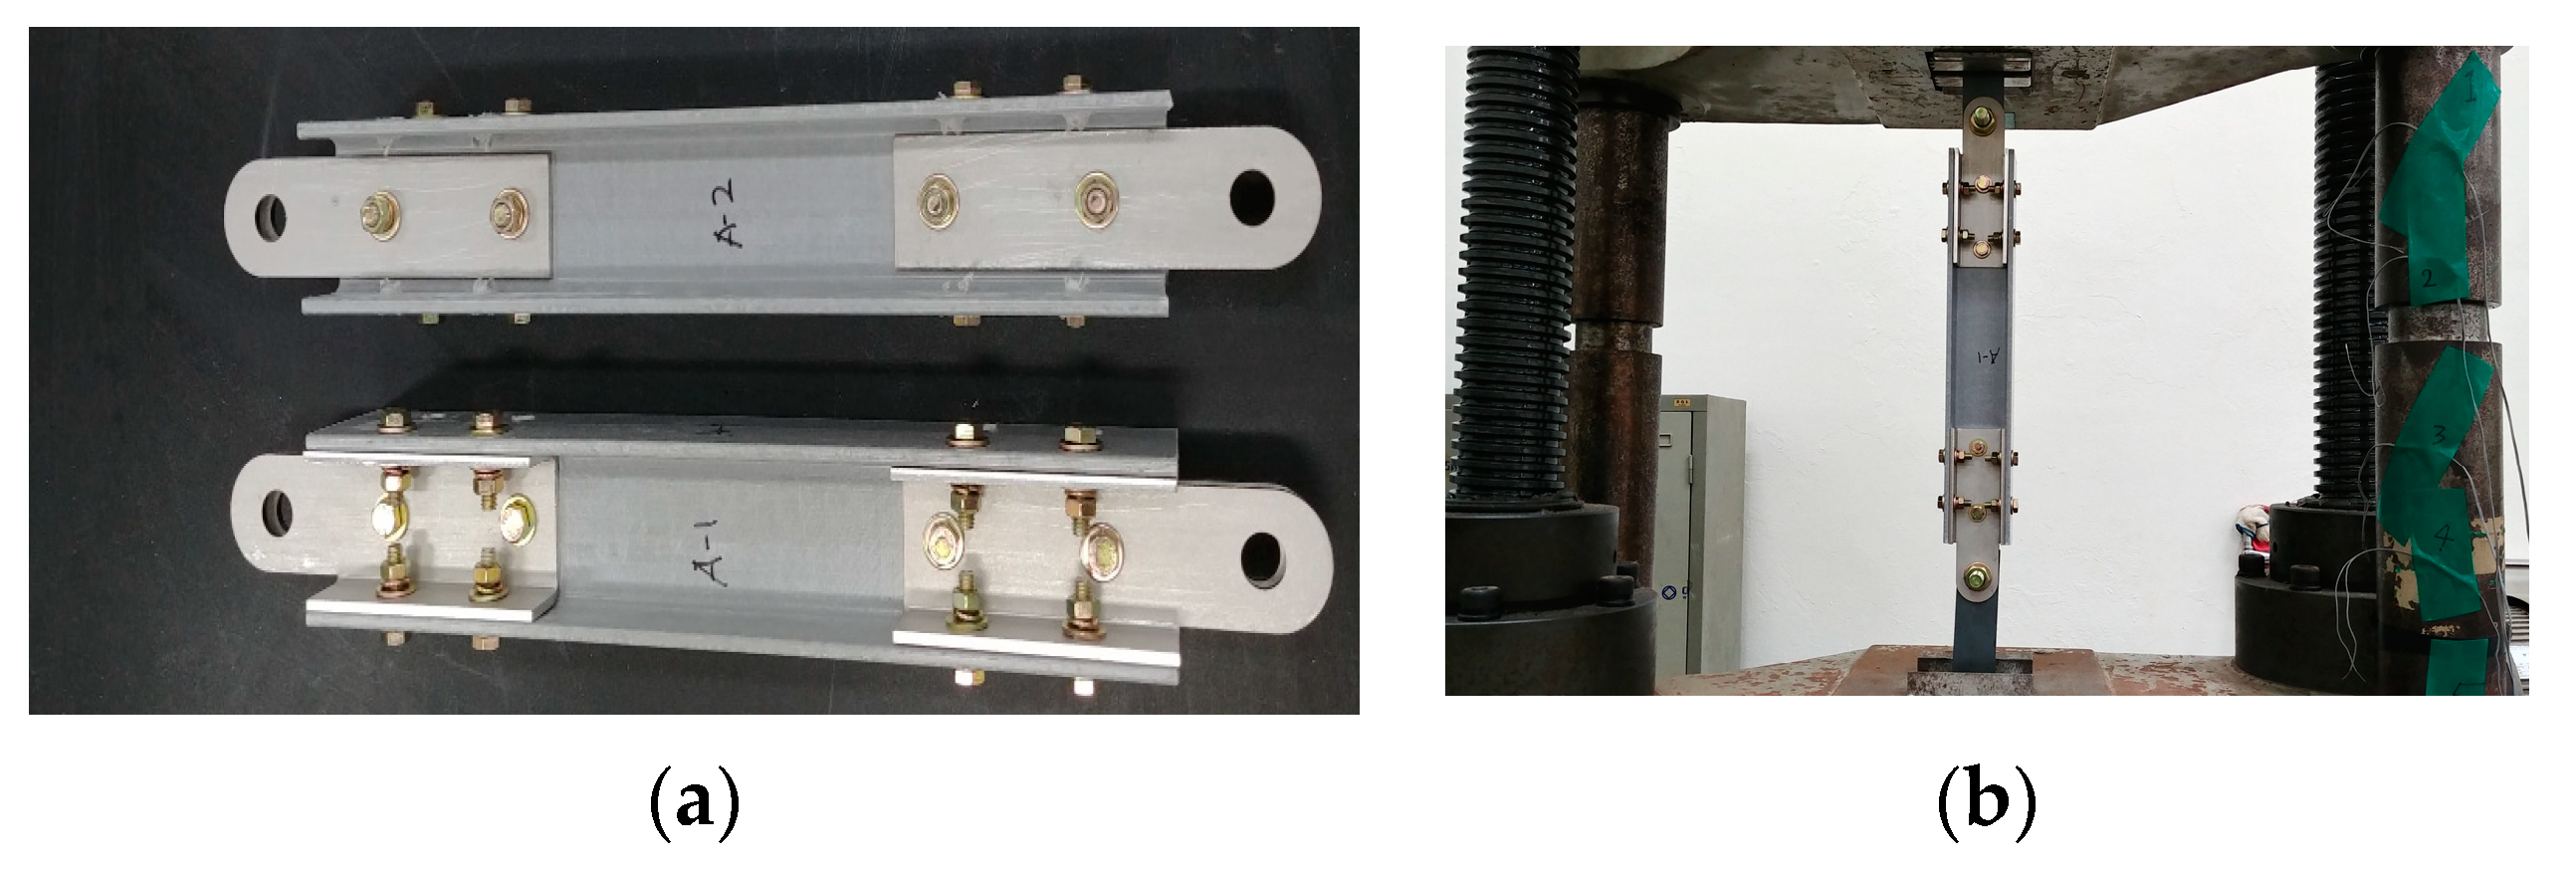
3.3. Mooring Connection Strength Testing
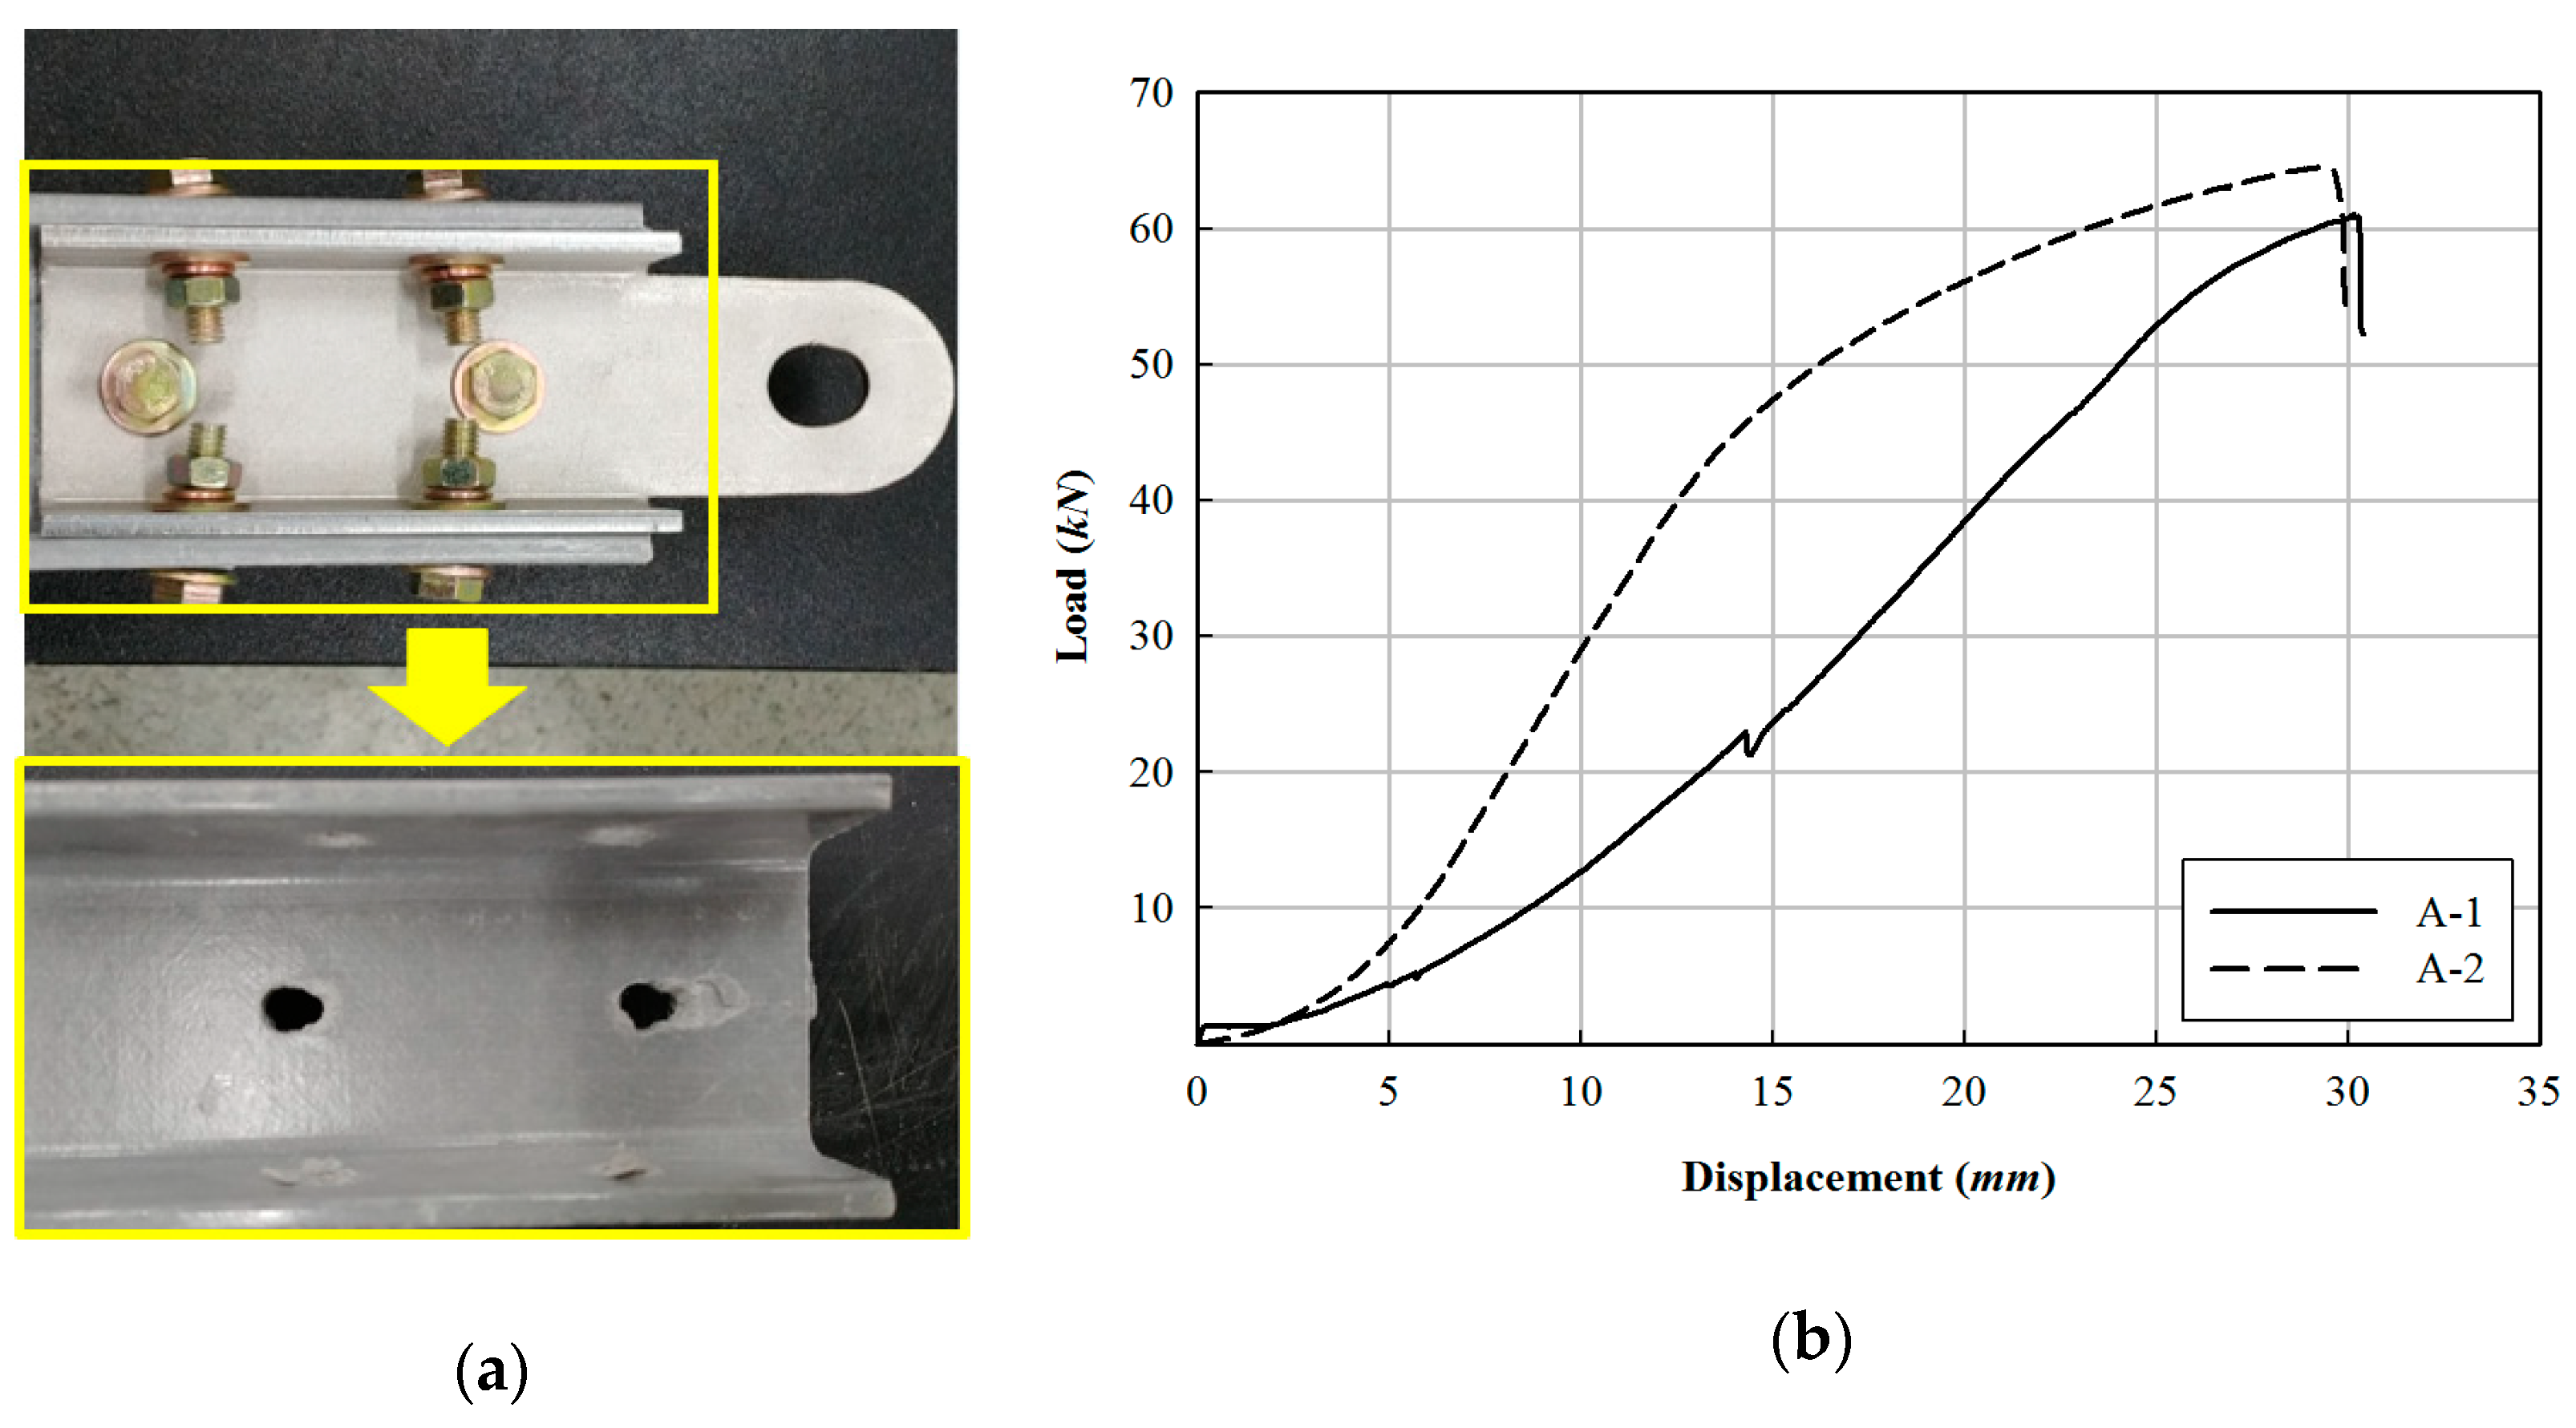
The mooring hardware to PRFP member connections were evaluated according to the maximum horizontal force applied by the mooring lines determined in the mooring design. To do so, the mooring hardware was mounted on each end of a PFRP member of the same material used in the PV structures, as shown in Figure 13a. Two such specimens were then subjected to tension tests, as shown in Figure 13b. A displacement-controlled load was applied at 1 mm/min using an actuator with a 1000 kN capacity. The experimental results indicated that the connections of both specimens failed in the bearing, as shown in Figure 14a, matching the FRP failure forms suggested by Lee et al. and Woo et al. [22,23]. As the PFRP was weaker in shear than the steel hardware, a sufficient design load could be provided by ensuring a sufficient number of bolts across the effective width, or by reinforcing the connection hardware to induce bolt failure. Indeed, in order to prevent shear failure of the FRP after it failed in the bearing, the number of bolts across the effective width of the FRP was set to four or more by Lee et al. [22]. Figure 14b shows the load–displacement relationship of the connection, and the tension test results are summarized in Table 7. The results of the tension tests indicated that the steel connection had a safety factor 1.28 times higher than the applied load (49.20 kN).
4. Installation of Proposed Floating PV Power Generation System
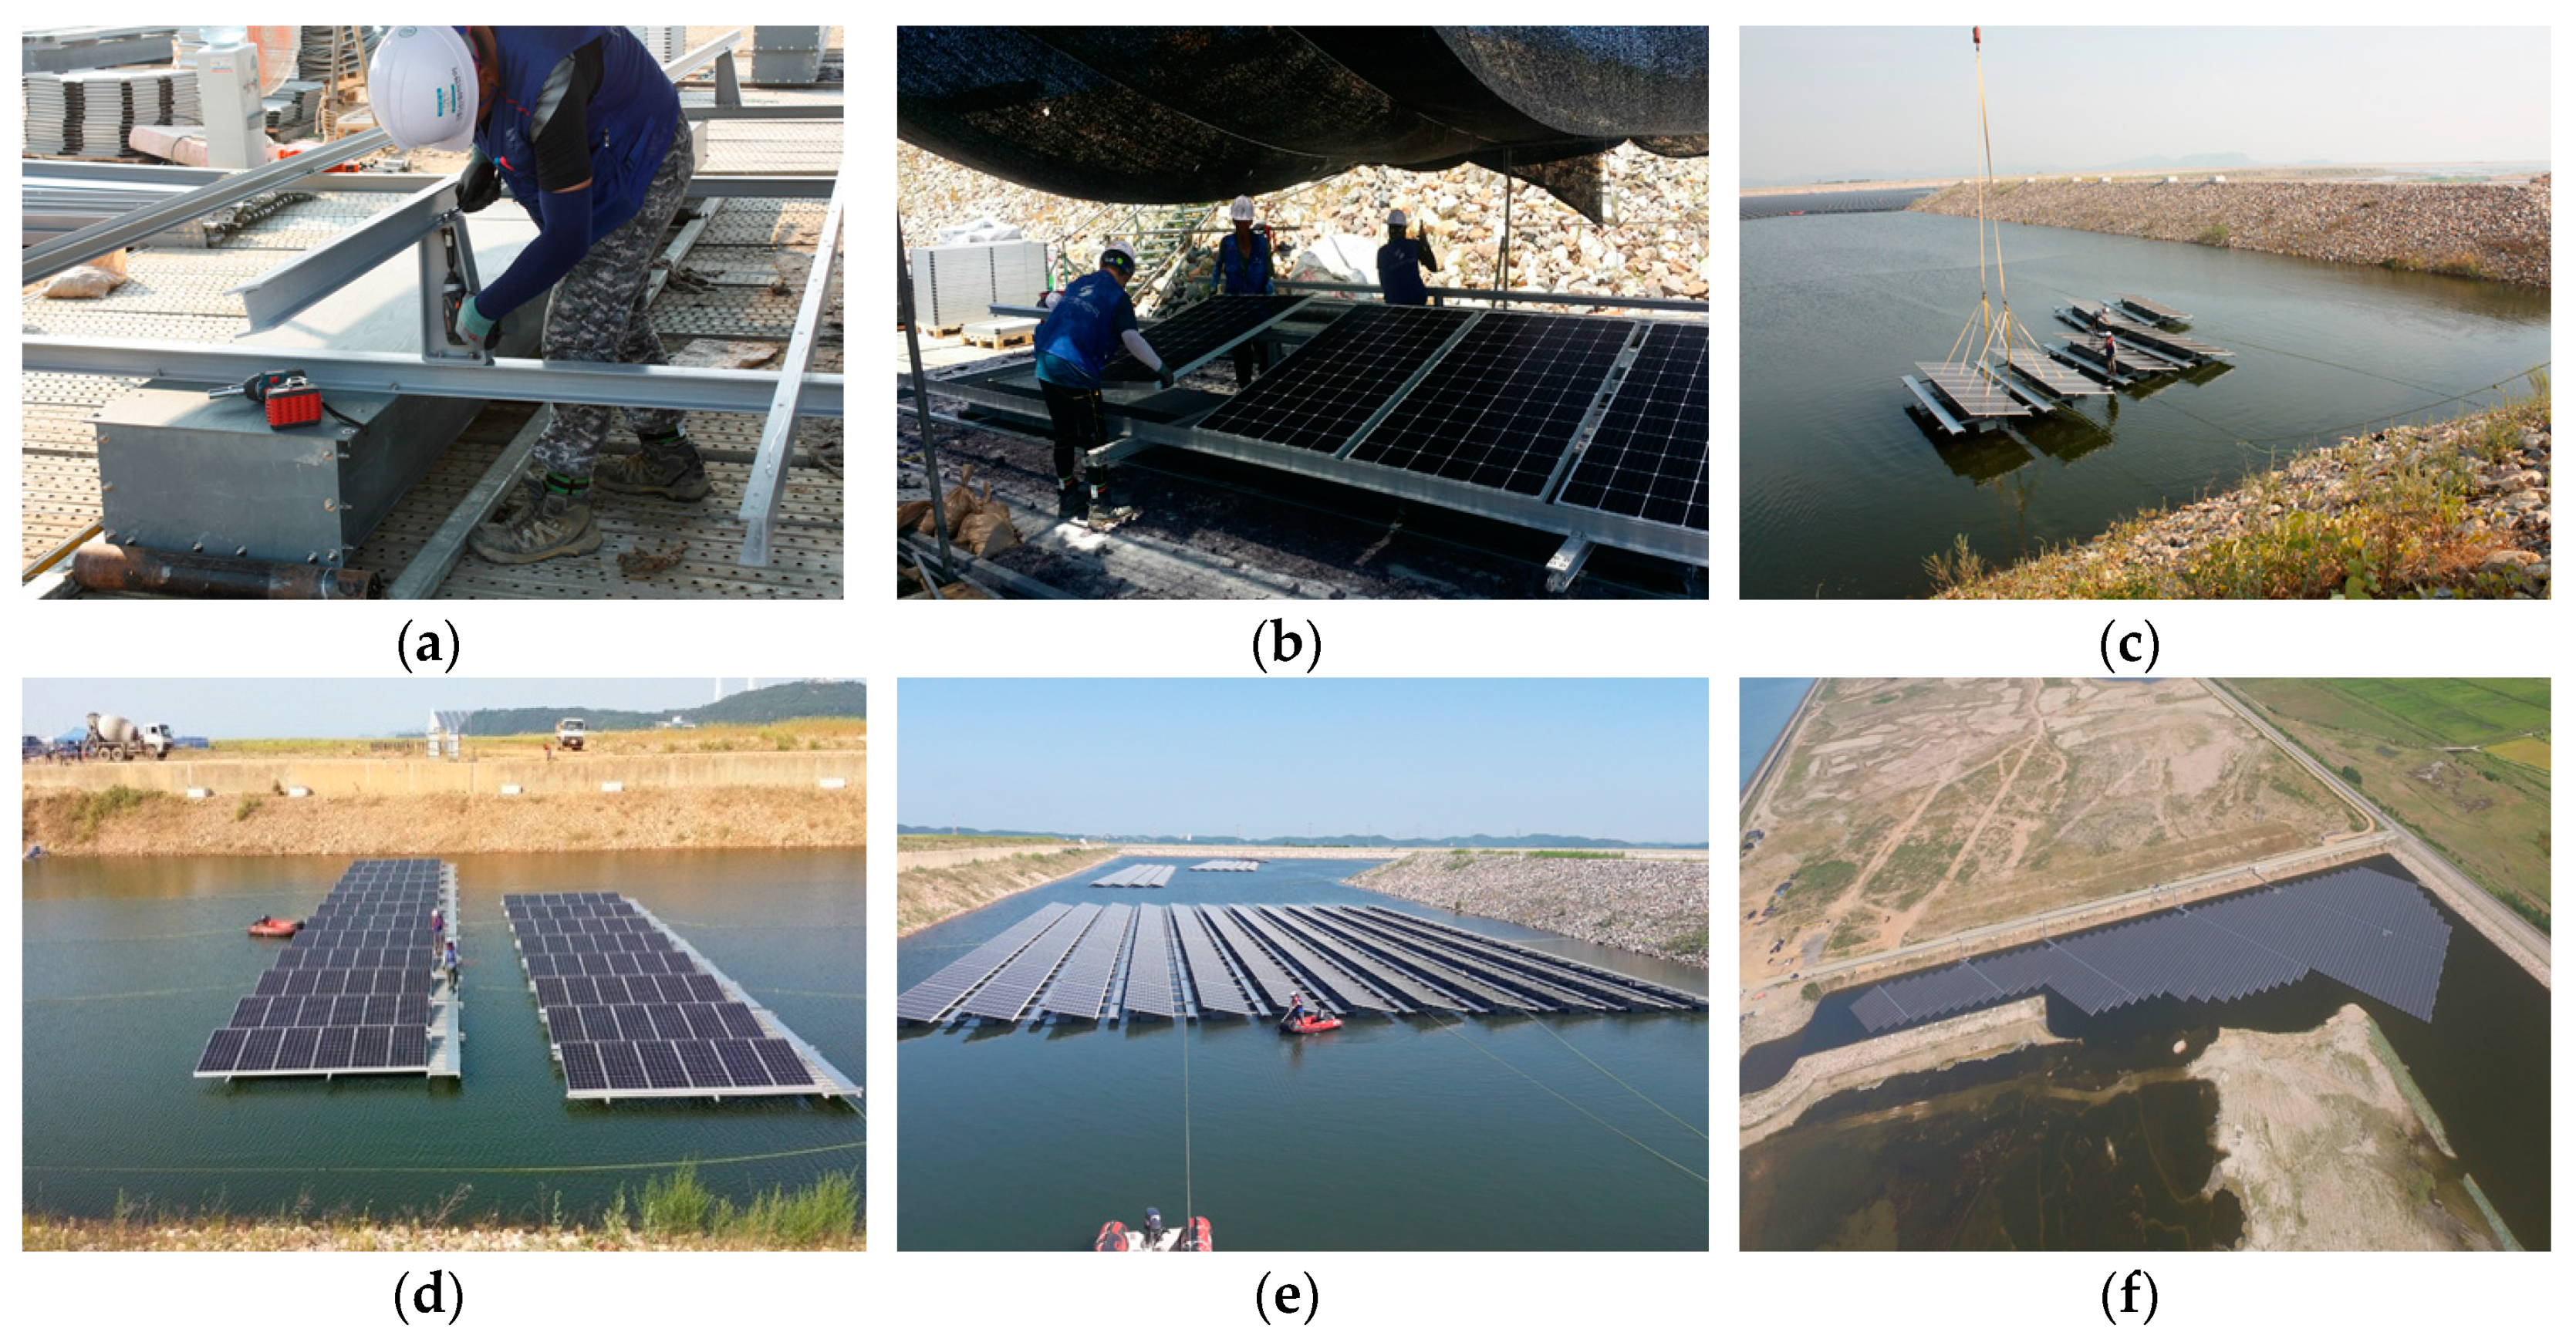
As illustrated in Figure 15a–e, the floating photovoltaic structure was assembled in the following order: unit structure assembly, PV unit assembly, lifting and launching, unit structure connection, and structure mooring. The completed PV power generation structure is shown installed in the ash pond in Figure 15f.
5. Performance of Proposed Floating PV Power Generation System
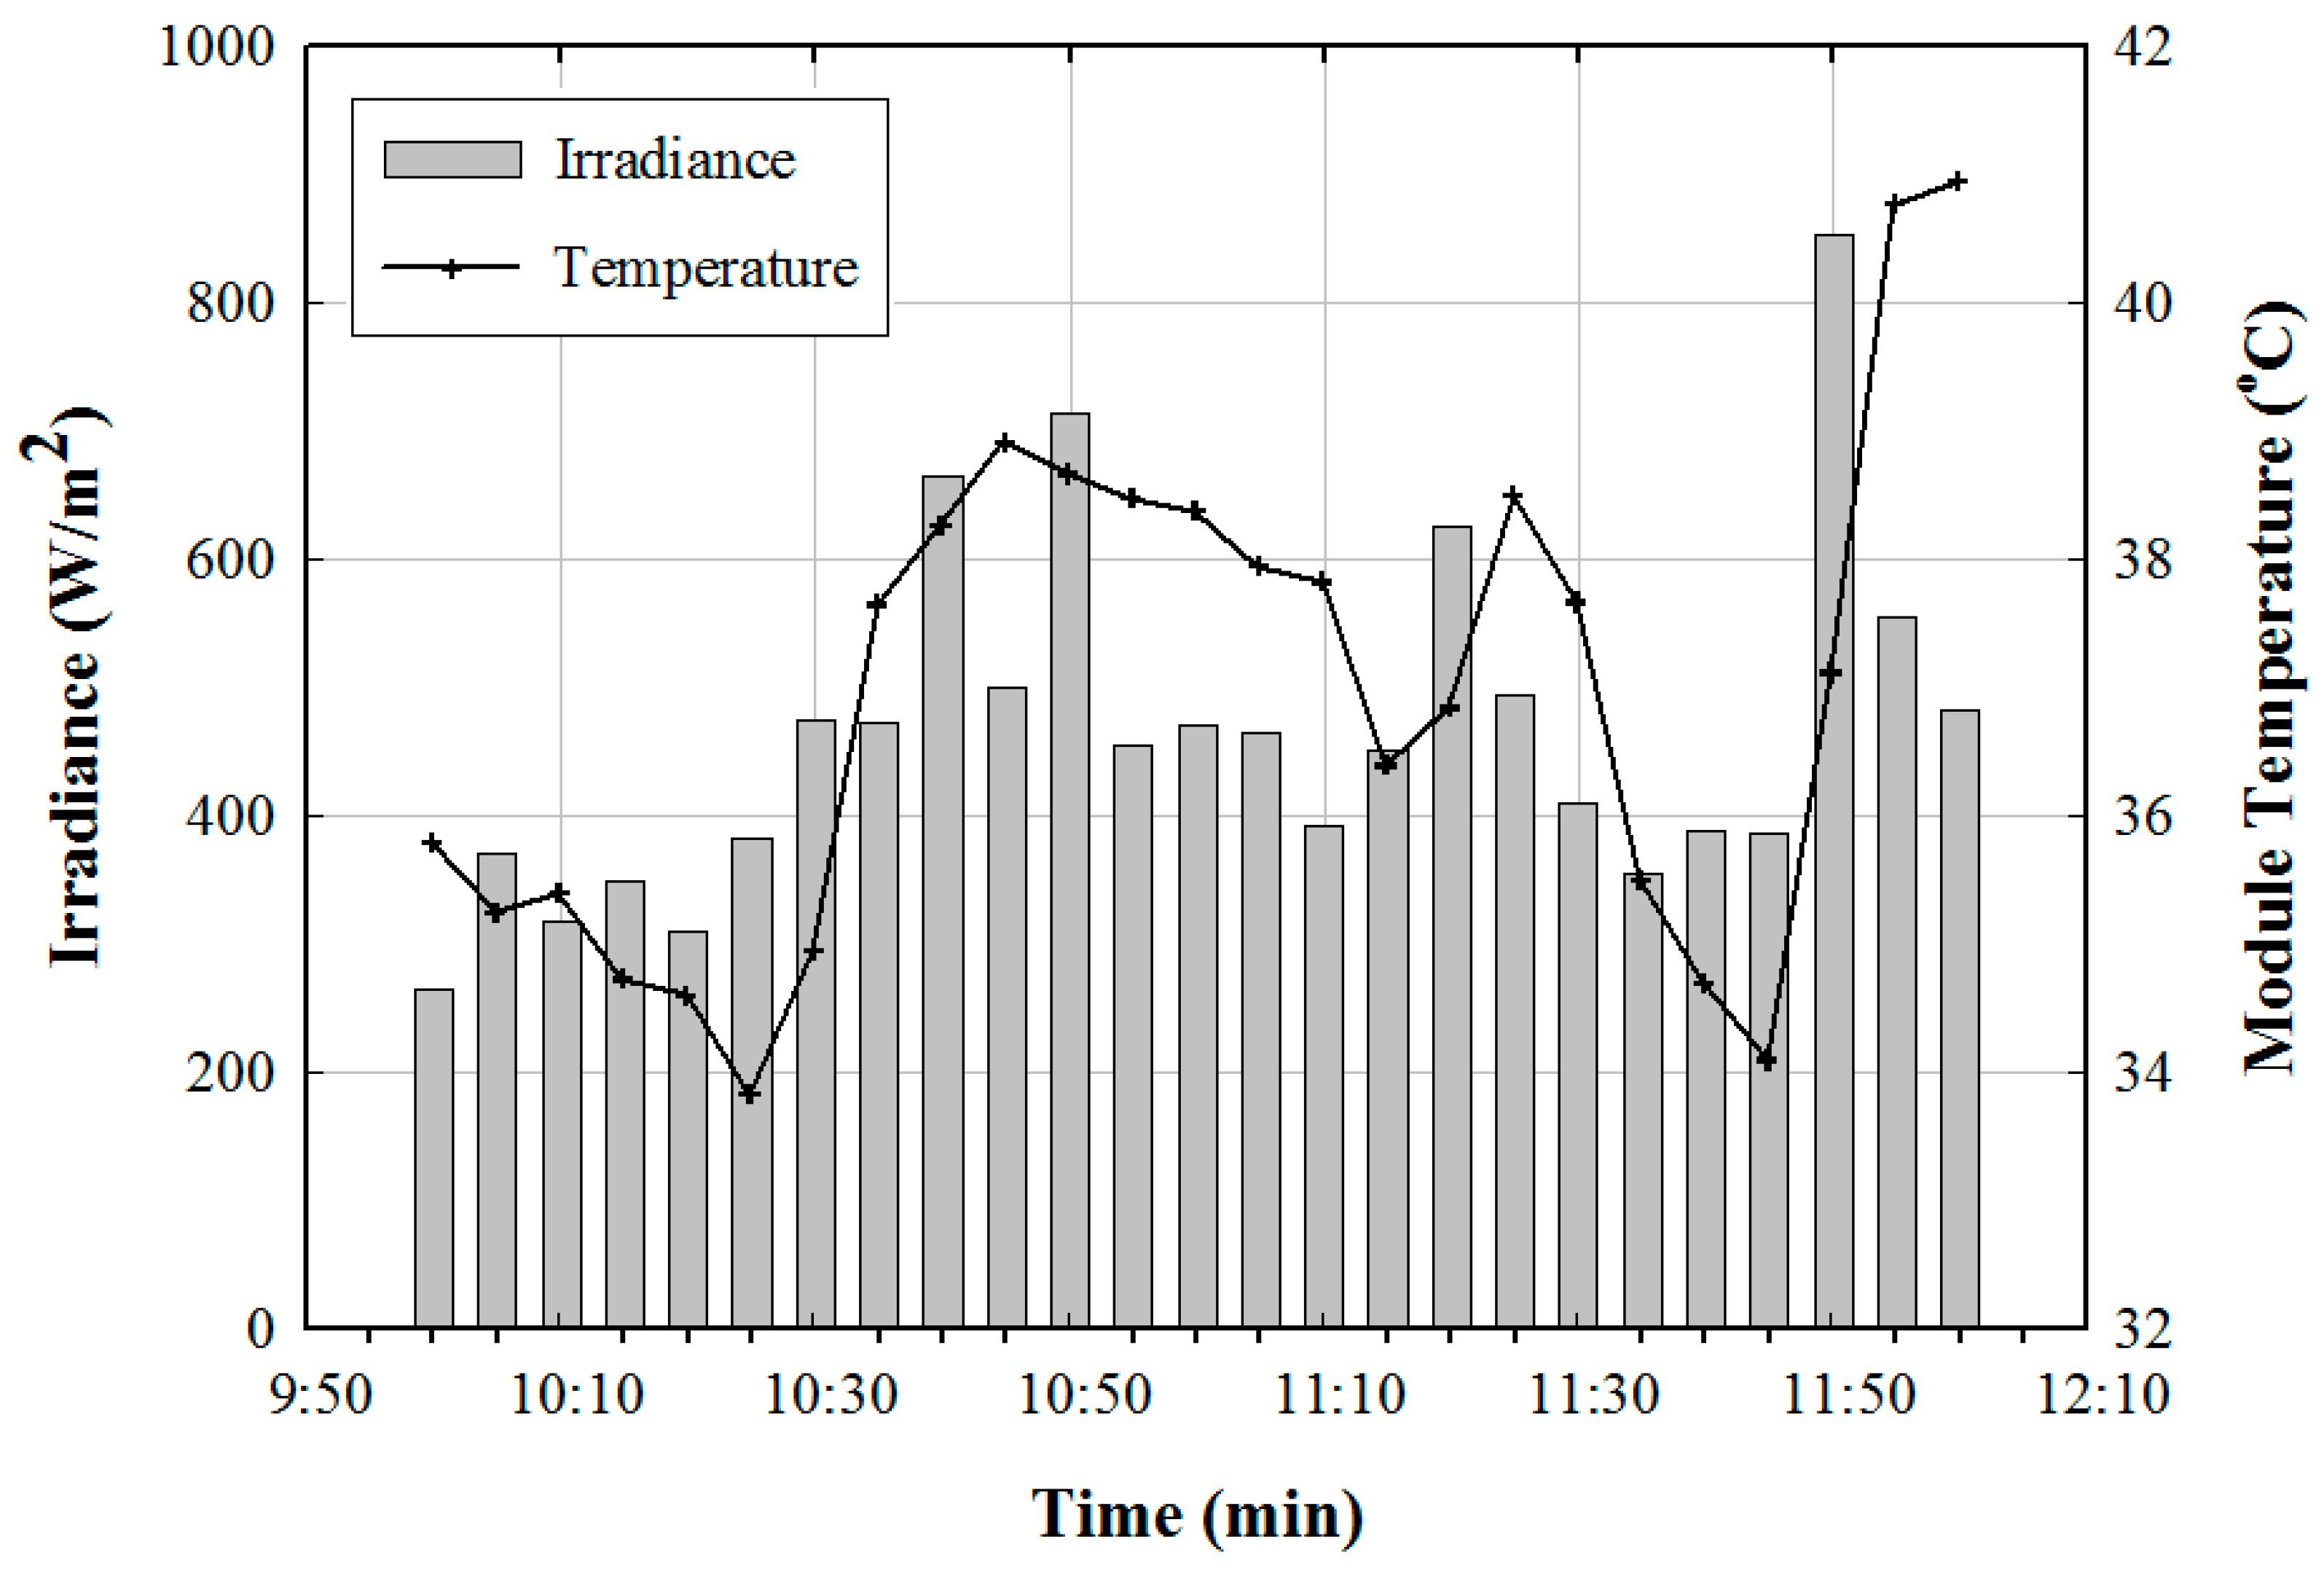
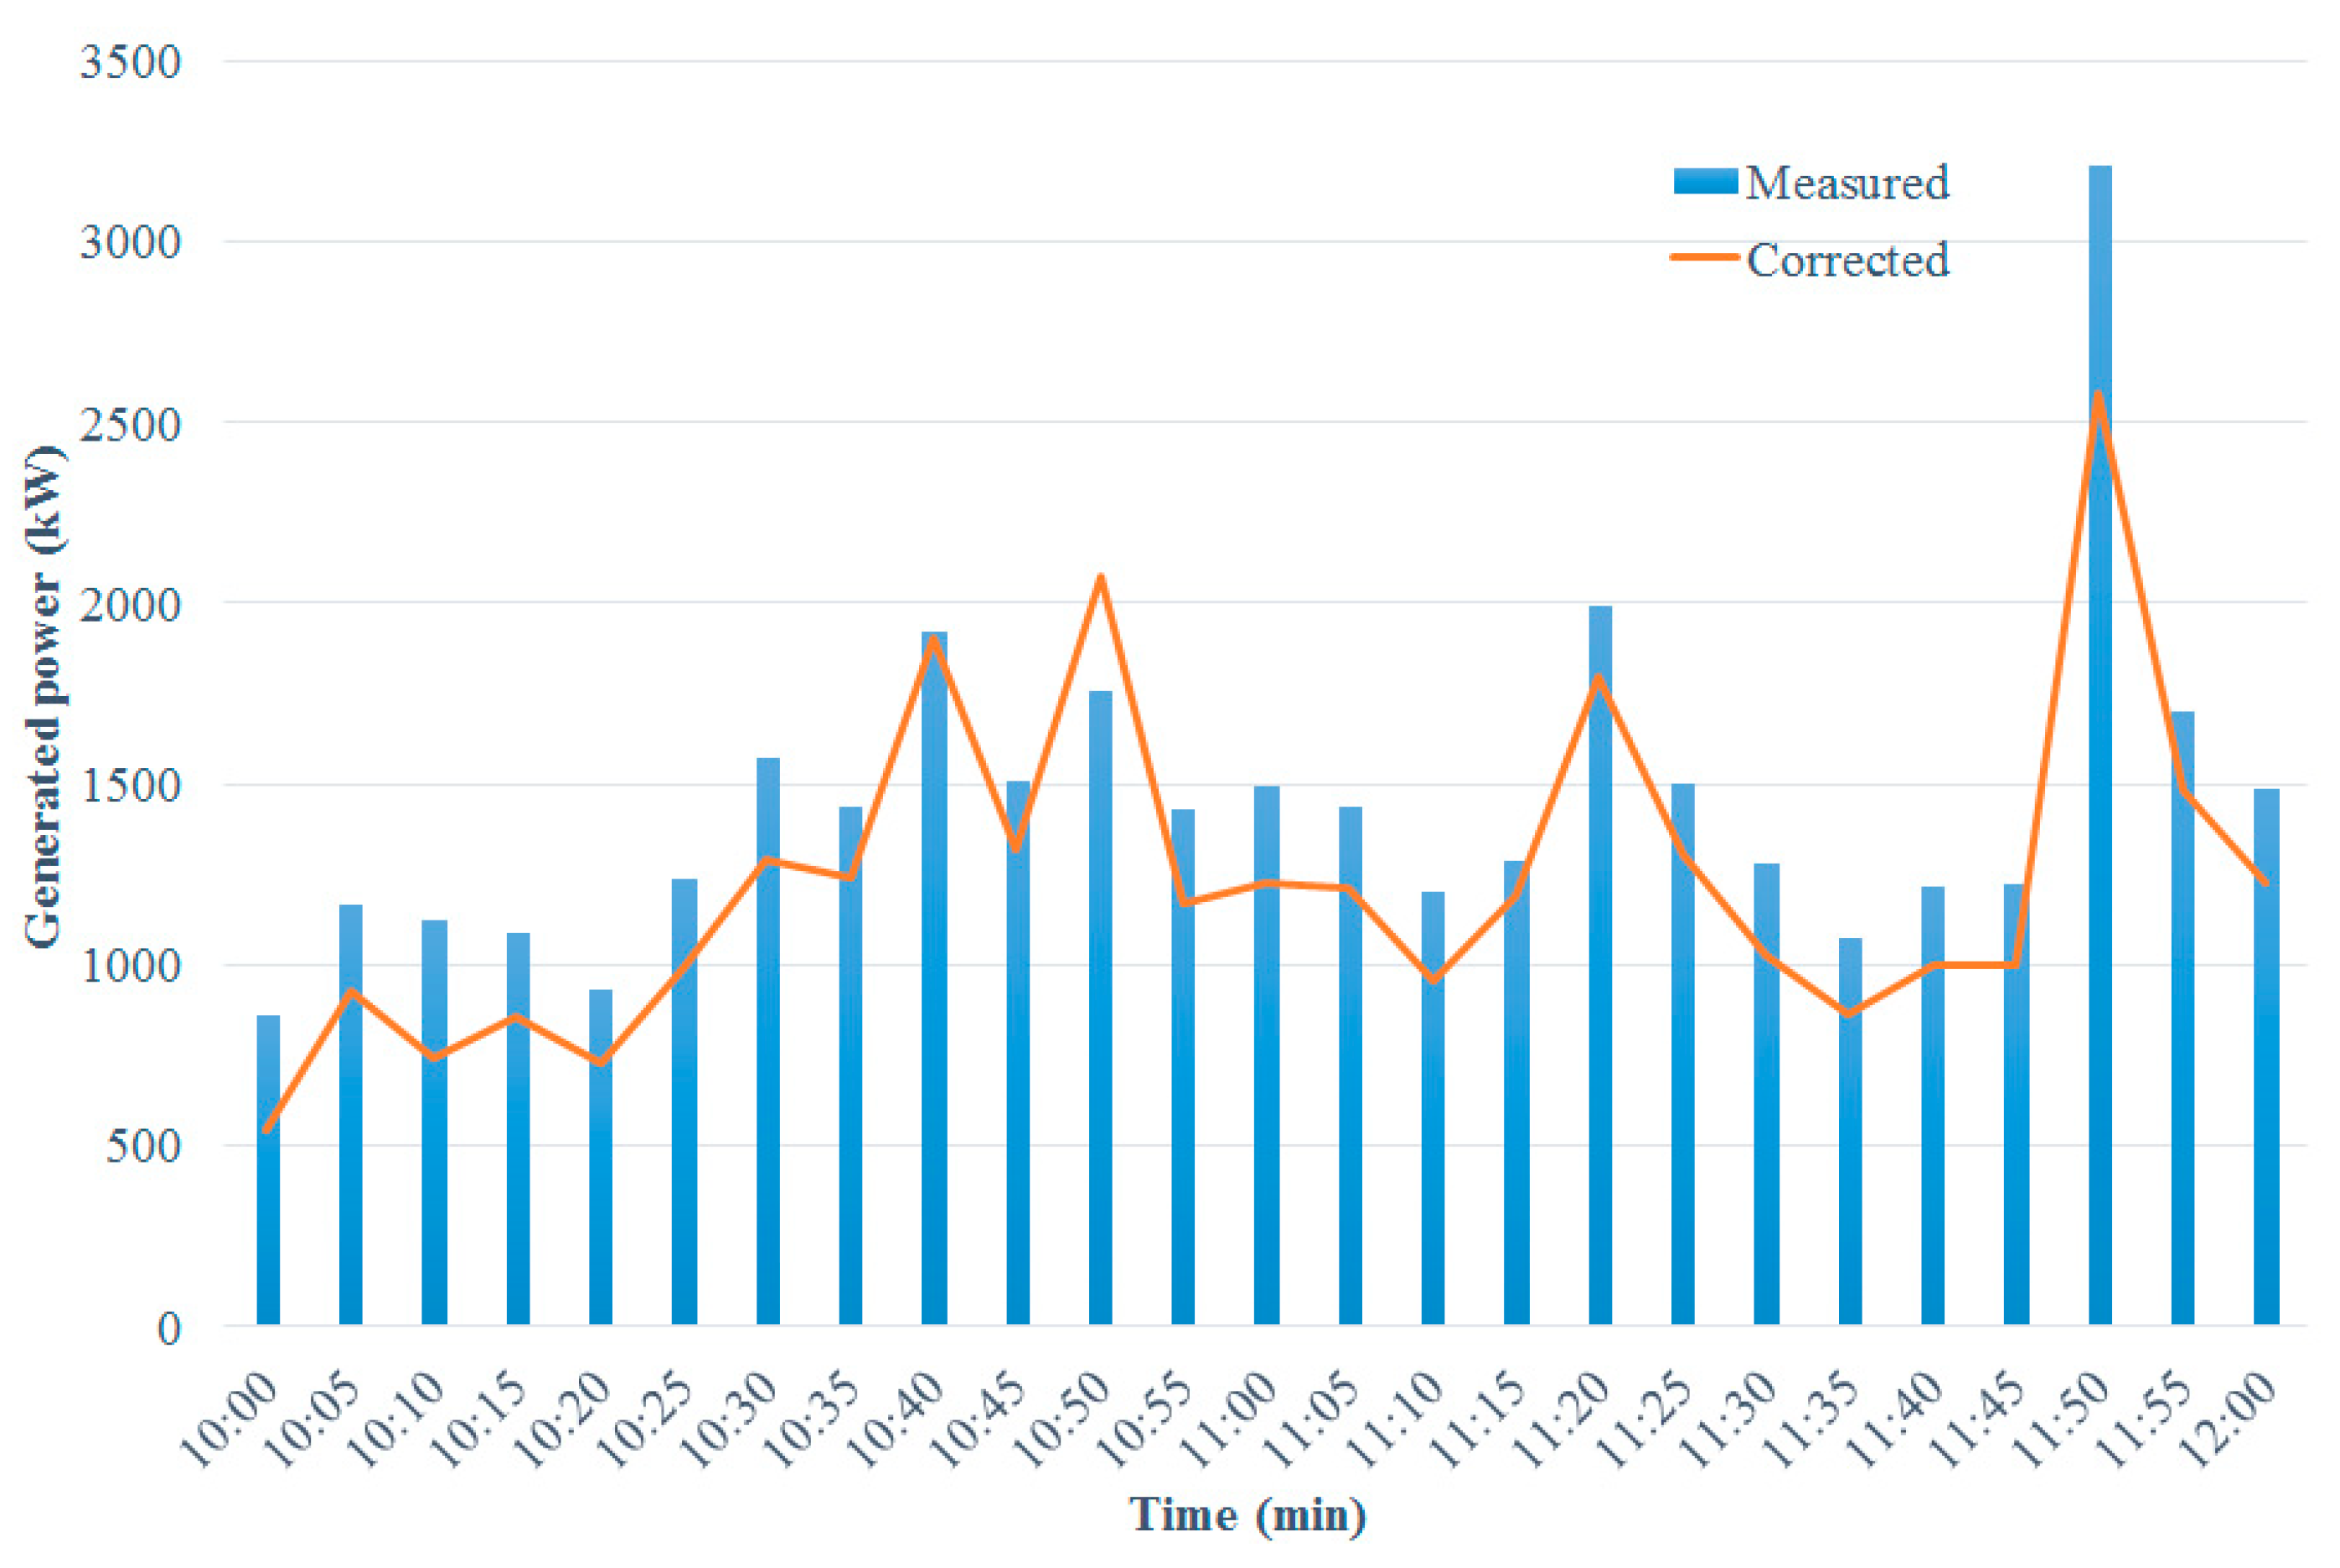
The electrical efficiency of the 3.5-MW floating PV power generation system installed in the ash pond was measured every 5 min from 10 a.m. to 12 p.m. on 18 September 2018, a day with mild solar radiation fluctuations. Note that the output values measured by the field-mounted transformer should be corrected for the effects of irradiance and temperature. The irradiance- and temperature-corrected values were obtained by
where is the transformer-measured output power (in MW); , module surface temperature correction (in MW); , the irradiance correction value (in MW); module surface temperature (in ); , temperature coefficient (in/); , capacity of output power facility (in ); and , measured solar irradiance (in ). The measurements of the irradiance and module temperature are shown in Figure 16. The measured power is shown in Figure 17, confirming that the measured values were generally greater than the corrected values, as would be expected according to Equation (6). The measured power was as high as 3.29 MW, which is approximately 94% of the installed capacity of 3.5 MW. However, continuous measurement remains necessary to obtain complete and reliable data describing the electrical efficiency of the proposed floating PV power generation system.
6. Production of PV Energy Generation of the System
The monthly energy produced by the third-type floating PV energy generation system is compared with that of the first-type PV generation system installed on the surface of the water. The measured energy production data of the third-type floating PV energy generation system are compared with those of the first-type PV energy generation system measured in Lee’s study [2] and the second-type floating PV energy generation system, as summarized in Table 8. The table indicates that the energy production of the third-type floating system from July to September is significantly higher than that of the first- and second-type systems. The amount of radiance generated varies depending on the installation location of the PV generation structure. The second- and third-type systems were installed in the same area (in Dangjin, Korea) to check the amount of power generated according to the module installation angle of the PV structure. The results showed that the third-type of system produced about 1.2-times higher energy output than the second-type, as shown in Table 8. Accordingly, the improved structure (third-type) is effective for energy production. To obtain more reliable data for the efficiency, several years of continuous measurements are required.
7. Conclusions
This study confirmed the structural safety of a floating PV power generation system installed in the ash pond of a thermal power plant. As discussed in the introduction, the first- and second-type PV energy generation structures require a higher cost of production than that required for the third-type PV energy generation plant.
This floating structure was constructed of PFRP and SMC members and designed according to ASCE specifications. Horizontal and vertical chain anchor mooring systems were used to anchor the floating PV structure according to the topography of the ash pond. The structural safety of the floating PV power generation system was first assessed using an FEA considering self-weight, wind, and snow loads. The structure was confirmed to be safe as the generated stresses were less than the allowable stresses dictated by the Korean Highway Bridge Design Code. Additionally, a numerical and experimental evaluation of the mooring hardware and connection strengths indicated that the mooring connection had a safety factor of 1.28. After confirming the safety of the design, the structure was constructed and installed in the ash pond of a power plant. Once installed, the electrical efficiency of the floating PV power generation system was measured over two hours in the morning under mild solar radiation fluctuations to examine its energy performance. The system was found to provide approximately 94% of the installed capacity of 3.5 MW. Finally, the energy production of the improved (third-type) floating systems increased more 7.65 and 1.38 times than those of the first- and second-type systems, respectively. In future research, the performance of the proposed floating PV power generation system will be evaluated in more detail using the electrical efficiency determined by continuous measurements.
Author Contributions
S.-T.H. contributed to conception and design; J.-Y.C. investigated the data acquisition and formal analysis; S.-H.K. wrote and revised the paper. All authors have read and agreed to the published version of the manuscript.
Funding
This research received no external funding.
Acknowledgments
The authors are grateful for the technical support from SHIHWA E&E.
Conflicts of Interest
The authors declare no conflict of interest.
References
- Nam, J.H. Development of Floating Type Photovoltaic Energy Generation System Using the Pultruded Structural Members. Ph.D. Thesis, Hongik University, Seoul, Korea, 28 December 2010. [Google Scholar]
- Lee, Y.-G.; Joo, H.-J.; Yoon, S.-J. Design and installation of floating type photovoltaic energy generation system using FRP members. Sol. Energy 2014, 108, 13–27. [Google Scholar] [CrossRef]
- Choi Structural Performance Evaluation of Floating PV Power Generation Structure System. J. Korean Soc. Civ. Eng. 2014, 34, 1353–1362. [CrossRef]
- Kim, S.-H.; Yoon, S.-J.; Choi, W. Design and Construction of 1 MW Class Floating PV Generation Structural System Using FRP Members. Energies 2017, 10, 1142. [Google Scholar] [CrossRef] [Green Version]
- Ferrer-Gisbert, C.; Gozalvez, J.J.F.; Redón-Santafé, M.; Gisbert, P.F.; Sánchez-Romero, F.J.; Torregrosa-Soler, J.B. A new photovoltaic floating cover system for water reservoirs. Renew. Energy 2013, 60, 63–70. [Google Scholar] [CrossRef] [Green Version]
- Rosa-Clot, M.; Tina, G.M.; Nizetic, S. Floating photovoltaic plants and wastewater basins: An Australian project. Energy Procedia 2017, 134, 664–674. [Google Scholar] [CrossRef]
- Cazzaniga, R.; Cicu, M.; Rosa-Clot, M.; Rosa-Clot, P.; Tina, G.M.; Ventura, C. Floating photovoltaic plants: Performance analysis and design solutions. Renew. Sustain. Energy Rev. 2018, 81, 1730–1741. [Google Scholar] [CrossRef]
- Liu, L.; Wang, Q.; Lin, H.; Li, H.; Sun, Q.; Wennersten, R. Power Generation Efficiency and Prospects of Floating Photovoltaic Systems. Energy Procedia 2017, 105, 1136–1142. [Google Scholar] [CrossRef]
- Trapani, K.; Santafé, M.R. A review of floating photovoltaic installation: 2007–2013. Prog. Photovolt. 2015, 23, 524–532. [Google Scholar] [CrossRef] [Green Version]
- Lee, J.H. Preliminary Study on Development of Buoyant Body and Mooring System for Marine Solar Power lant; Korea Institute of Civil Engineering and Building Technology (KICT): Suwon, South Korea, 2018; p. 15. [Google Scholar]
- Choi, H.; Joo, H.J.; Nam, J.H.; Kim, K.S.; Yoon, S.-J. Structural Design for the Development of the Floating Type Photovoltaic Energy Generation System. Mater. Sci. Forum 2010, 654, 2803–2806. [Google Scholar] [CrossRef]
- Choi, J.-W.; Joo, H.-J.; Nam, J.-H.; Hwang, S.-T.; Yoon, S.-J. Performance Enhancement of Floating PV Generation Structure Using FRP. Compos. Res. 2013, 26, 105–110. [Google Scholar] [CrossRef] [Green Version]
- Ko, J.-W.; Yun, N.-R.; Min, Y.-K.; Jung, T.-H.; Won, C.-S.; Ahn, H.K. Prediction of Output Power for PV Module with Tilted Angle and Structural Design. Trans. Korean Inst. Electr. Eng. 2013, 62, 371–375. [Google Scholar] [CrossRef]
- Song, J.-H.; Yoon, J.-H.; An, Y.-S.; Kim, S.-G.; Lee, S.-J.; Choung, Y.-K. Power performance characteristics of transparent thin-film BIPV module depending on an installation angle. J. Korean Solar Energy 2008, 28, 58–63. [Google Scholar]
- Kakaomap. Available online: https://map.kakao.com/ (accessed on 7 December 2019).
- American Society of Civil Engineers. Pre-standard for Load and Resistance Factor Design (LRFD) of Pultruded Fiber Reinforced Polymer (FRP) Structures. Available online: http://dev1.kreysler.com/information/specifications/specs-resources/LRFD%20PreStandard%20-%20Revised%20FINAL%20-%20Nov%209%202010.pdf (accessed on 1 August 1996).
- Port and Fishing Port Design Standards. Ministry of Oceans and Fisheries (MOF). Available online: http://kpcs.portcals.go.kr/kc/mv_list.do (accessed on 1 July 2014).
- Structure and Equipment Standards for Floating Offshore Structures. Ministry of Oceans and Fisheries (MOF). Available online: http://mesis.krs.co.kr/Rules/Board/Ko/view.aspx?CurrPage=5&b_code=188&b_num=57&mode=M (accessed on 7 January 2011).
- Lee, K.-Y.; Kim, W.; Lee, J.-S. Review of Steel ratio Specifications in Korean Highway Bridge Design Code (Limit States Design) for the Design of RC Flexural Members. J. Korean Soc. Civ. Eng. 2017, 37, 277–287. [Google Scholar] [CrossRef] [Green Version]
- Korean Building Code (KBC). Architectural Institute of Korea: Seoul, Korea, 2016. Available online: http://r-nbck.or.kr/en/Sub/Sub_02_03.aspx (accessed on 8 August 2012).
- MIDAS Analysis Reference. MIDAS Information Technology Co., Ltd. (MIDAS IT): Seoul, Korea, 2012. Available online: https://kor.midasuser.com/civil/ (accessed on 8 August 2012). (In Korean).
- Lee, Y.-G.; Kim, S.-H.; Won, Y.-S.; Cheon, J.-U.; Shin, K.-Y.; Yoon, S.-J. Strength Evaluation of Bolt Arrangement in PFRP Bolted Connection with 2 Bolts. J. Korean Soc. Adv. Compos. Struct. 2014, 5, 17–22. [Google Scholar] [CrossRef] [Green Version]
- Woo, S.-P.; Kim, S.-H.; Yoon, S.-J.; Choi, W. Effect of Bolt-Hole Clearance on Bolted Connection Behavior for Pultruded Fiber-Reinforced Polymer Structural Plastic Members. Int. J. Polym. Sci. 2017, 2017, 1–12. [Google Scholar] [CrossRef] [Green Version]
Figure 1.
Electric power generation capacity of floating photovoltaic (PV) systems in South Korea [10].
Figure 1.
Electric power generation capacity of floating photovoltaic (PV) systems in South Korea [10].

Figure 2.
Photovoltaic (PV) models: (a) First-generation PV model [11], (b) second-generation PV model [12], and (c) third-generation PV model (present study).


Figure 3.
Installation location [15].
Figure 3.
Installation location [15].

Figure 4.
Structural members: (a) PFRP I-shaped members, and (b) sheet molding compound (SMC) members.
Figure 4.
Structural members: (a) PFRP I-shaped members, and (b) sheet molding compound (SMC) members.

Figure 5.
Unit structure types: (a) Type A and (b) Type B.

Figure 6.
Modeling of the (a) Type A unit, (b) Type B unit, (c) PV modules, and (d) pontoon.

Figure 7.
Boundary conditions: (a) Type A and (b) Type B.

Figure 8.
Results of the finite element analysis (FEA): (a) Type A unit, (b) Type B unit, and (c) pontoon.
Figure 8.
Results of the finite element analysis (FEA): (a) Type A unit, (b) Type B unit, and (c) pontoon.

Figure 9.
Mooring installation according to terrain.

Figure 10.
Free body diagram of the horizontal mooring system.

Figure 11.
Mooring hardware (a) locations and (b) detail.

Figure 12.
Mooring hardware shear in the (a) bolt and (b) connection plate.

Figure 13.
Tension test (a) specimens and (b) set up.

Figure 14.
Results of the tension tests: (a) Failure mode and (b) load–displacement curves.

Figure 15.
Floating photovoltaic (PV) power generation system installation process: (a) assembly of unit structural members, (b) assembly of PV modules, (c) lifting and launching, (d) unit structure connection, (e) mooring, and (f) completed PV power generation system.
Figure 15.
Floating photovoltaic (PV) power generation system installation process: (a) assembly of unit structural members, (b) assembly of PV modules, (c) lifting and launching, (d) unit structure connection, (e) mooring, and (f) completed PV power generation system.

Figure 16.
Measurement of irradiance and module temperature.

Figure 17.
Electrical efficiency measurement.


Table 1.
Commercial viability evaluation of floating PV power generation complex.
| First-Generation PV Model | Second-Generation PV Model | Third-Generation PV Model | |
|---|---|---|---|
| No. of unit buoy (Each, EA.) | 2 | 9 | 2 |
| No. of structure (EA) | 940 | 360 | 736 |
| Module capacity (W) | 230 | 295 | 340 |
| Unit of generation capacity (kW) | 3.68 | 9.735 | 4.76 |
| Pultruded fiber reinforced polymer (PFRP) quantity (m3) | 0.536 | 1382.35 | 313.68 |
| Total capacity (MW) | 3.5 | ||
| Unit cost of structure (US$) | 2500 | 8250 | 1417 |
| Cost of structure (US$) | 2350,000 | 2970,000 | 1042,912 |
| Unit cost of buoy (US$) | 833 | 167 | 250 |
| Total No. of buoys (EA) | 1880 | 3240 | 1472 |
| Cost of buoys (US$) | 1566,040 | 541,080 | 368,000 |
| Total cost (US$) | 3916,040 | 3510,000 | 1410,833 |
Table 2.
Material properties of fiber-reinforced polymer (FRP).
| Material | Young’s Modulus (E, GPa) | Tensile Strength (ft, MPa) | Shear Strength (fv, MPa) | Poisson’s Ratio , mm/mm) | Specific Weight (G, kN/m3) |
|---|---|---|---|---|---|
| PFRP | 25.00 | 350.00 | 91.32 | 0.32 | 18.42 |
| SMC-FRP | 17.33 | 183.85 | 34.47 | 0.25 | 18.42 |
Table 3.
Wind load variables.
| Description | Design Wind Speed | Velocity Pressure Exposure Coefficient | Topographic Factor | Importance Factor |
|---|---|---|---|---|
| Value | 45 | 1.13 | 1.00 | 1.00 |
Table 4.
Snow load variables.
| Description | Snow Load | Roof Snow Load Factor | Exposure Factor | Temperature Factor | Importance Factor | Gradient Factor |
|---|---|---|---|---|---|---|
| Value | 0.65 | 0.7 | 0.8 | 1.2 | 1.2 | 1.05 |
Table 5.
Examination of member safety.
| Member | Maximum Stress by FEA (MPa) ① | Allowable Stress (MPa) ② | Safety Factor ②/① | Status | |
|---|---|---|---|---|---|
| Type A | Tensile | 1.57 | 175.00 | 111.46 | OK |
| Compressive | 1.22 | 116.67 | 95.63 | OK | |
| Shear | 7.78 | 30.44 | 3.91 | OK | |
| Flexural | 16.81 | 140.00 | 8.32 | OK | |
| Type B | Tensile | 0.97 | 175.00 | 175.25 | OK |
| Compressive | 1.47 | 116.67 | 79.36 | OK | |
| Shear | 7.68 | 30.44 | 3.96 | OK | |
| Flexural | 18.09 | 140.00 | 7.73 | OK | |
| Pontoon | Flexural | 15.76 | 140.00 | 8.88 | OK |
Table 6.
Results of the mooring connection hardware review.
| Description | Allowable Load (Pallow, kN)① | Horizontal Mooring Force (Pu, kN)② | Safety Factor ①/② |
|---|---|---|---|
| Bolt | 64.34 | 28.64 (=2.92 tonf) | 2.25 |
| Connection plate (steel) | 49.20 | 1.72 | |
| FRP member | 289.30 | 10.10 |
Table 7.
Connection tension test results.
| Description | Maximum Load (kN)① | Maximum Displacement (mm) | Design Load (kN)② | Maximum Mooring Force (Pu, kN) | Safety Factor ①/② |
|---|---|---|---|---|---|
| A-1 | 61.03 | 30.41 | 49.20 | 28.64 | 1.24 |
| A-2 | 64.49 | 30.01 | 1.31 | ||
| Average | 62.76 | 30.21 | 1.28 |
Table 8.
Comparison of the monthly energy production.
| Month | Floating | ①/(0.93kW/3500 kW) (④, kWh) | ②/(1500kW/3500 kW) (⑤, kWh) | ③/④ | ③/⑤ | ||
|---|---|---|---|---|---|---|---|
| First-Type [2] (0.93 kW) (①, kWh) | Second-Type (1500 kW) (②, kWh) | Third-Type (3500 kW) (③, kWh) | |||||
| May | - | 114,025 | - | - | - | - | - |
| June | - | 121,324 | - | - | - | - | - |
| July | 52.6 | 117,562 | 379,020 | 49,489 | 274,311 | 7.65 | 1.38 |
| August | 55.8 | 107,499 | 282,192 | 52,500 | 250,831 | 5.37 | 1.12 |
| September | 46.5 | 98,364 | 253,414 | 43,750 | 229,516 | 5.79 | 1.10 |
© 2020 by the authors. Licensee MDPI, Basel, Switzerland. This article is an open access article distributed under the terms and conditions of the Creative Commons Attribution (CC BY) license (http://creativecommons.org/licenses/by/4.0/).
Share and Cite
MDPI and ACS Style
Choi, J.-Y.; Hwang, S.-T.; Kim, S.-H. Evaluation of a 3.5-MW Floating Photovoltaic Power Generation System on a Thermal Power Plant Ash Pond. Sustainability 2020, 12, 2298. https://0-doi-org.brum.beds.ac.uk/10.3390/su12062298
AMA Style
Choi J-Y, Hwang S-T, Kim S-H. Evaluation of a 3.5-MW Floating Photovoltaic Power Generation System on a Thermal Power Plant Ash Pond. Sustainability. 2020; 12(6):2298. https://0-doi-org.brum.beds.ac.uk/10.3390/su12062298
Chicago/Turabian StyleChoi, Jung-Youl, Seong-Tae Hwang, and Sun-Hee Kim. 2020. "Evaluation of a 3.5-MW Floating Photovoltaic Power Generation System on a Thermal Power Plant Ash Pond" Sustainability 12, no. 6: 2298. https://0-doi-org.brum.beds.ac.uk/10.3390/su12062298
Note that from the first issue of 2016, this journal uses article numbers instead of page numbers. See further details here.