The Influence of Internet Finance on the Sustainable Development of the Financial Ecosystem in China

1
School of Management Science and Engineering, Shandong University of Finance and Economics, Jinan 250014, China
2
School of Business, University of Jinan, Jinan 250022, China
*
Author to whom correspondence should be addressed.
Sustainability 2020, 12(6), 2365; https://0-doi-org.brum.beds.ac.uk/10.3390/su12062365
Submission received: 2 February 2020
/
Revised: 29 February 2020
/
Accepted: 16 March 2020
/
Published: 18 March 2020
(This article belongs to the Section Economic and Business Aspects of Sustainability)
Abstract
:As a new species in the financial ecosystem, internet finance has significantly impacted traditional finance and has improved the diversity and ended the long-term stability of the financial ecosystem. From the perspective of the interaction between the ecological subjects of the Internet and traditional finance, this study examines the influence of internet finance on the sustainability of the financial ecosystem in China. We tested the dynamic correlation and risk transmission at the volatility level between the ecological subjects of internet finance and the banking, securities, and insurance industries by establishing a dynamic conditional correlation-generalized autoregressive conditional heteroskedasticity (GARCH) model of Baba, Engle, Kraft, and Kroner (DCC-GARCH-BEKK). The result indicates a positive dynamic correlation between internet finance and traditional finance almost all of the time. The introduction of internet finance has changed the risk transmission effect among the ecological subjects of traditional finance. Based on empirical findings, this study provides suggestions to promote the sustainable development of internet finance and the whole financial ecosystem. Our research not only has strong practical significance but also contributes significantly to the literature on internet finance and sustainable development.
1. Introduction
Financial ecosystem refers to a dynamic equilibrium system in which the financial industry and its external environment for survival and development interact with each other through their own adjustment mechanisms [1]. Its main purpose is to reflect the interrelationship between financial organizations and individuals. The research on financial ecosystem focuses on financial crisis avoidance and financial risk prevention. Although the birth of internet finance has not changed the essence of finance, it has significantly impacted and disrupted the traditional financial ecosystem while improving the ecological diversity of the financial market [2]. Internet finance has significantly changed the three core elements of the financial ecosystem—the species of a financial ecosystem, the financial ecological environment, and the financial ecological relationships—thereby leading to the formation of a new financial ecosystem.
The various Internet finance platforms, such as peer-to-peer (P2P) lending, crowd-funding, and third-party payment, started appearing in the financial ecosystem in recent years, influencing the ecological subjects of traditional finance as well as the financial ecological environment [3,4]. Characterized by advanced technology, fast service, and low costs, internet finance promotes the reformation of traditional financial subjects. However, internet finance carries several risks. Owing to the integration and penetration of internet finance and the traditional financial industry in business, technological, capital channels, and other aspects, there are strong linkages between them [5,6,7], and internet finance transmits risks through these channels and its other linkages with traditional financial industries. Risks in the Internet finance industry will proliferate to the traditional financial industries through related channels.
Therefore, studying the ecological relationship between the Internet and traditional financial industries and internet finance’s influence on the sustainability of the financial ecosystem can promote the sustainable development of internet finance and stabilize the entire financial ecosystem.
The rest of the paper is organized as follows. Section 2 discusses the literature review and related work. Section 3 describes the data and methodology. Section 4 analyzes the empirical results, Section 5 discusses the empirical results, and Section 6 concludes and presents the implications and limitations of the research.
2. Literature Review
Our research mainly relates to the following three aspects of literature: (1) the development of internet finance ecological subject; (2) the ecological relationship between internet finance and traditional finance; and (3) the influence of internet finance on the financial ecosystem.
Literature has significantly progressed in the study of internet finance. Some studies focus on the development and the ecological construction of internet finance. Liu et al. [8] analyzed the theory of the construction of the Internet finance ecosystem from the perspective of the business ecosystem. Chen and Tan [9] also studied the development trend of the Internet finance ecosystem from the perspective of the theory. Huang et al. [10] suggested that regional internet finance development has network characteristics and that the difference in economic development, the traditional finance development level, and other factors has a significant negative effect on the spillover of internet finance development. Fintech is a further extension of internet finance. Some scholars have also done a lot of research on this area of study. Peter et al. [11] described the development course of the fintech. Sanjiv [12] studied the direction of future development about the fintech. Almost all the research on the Internet financial ecosystem and the development of the fintech are from the theoretical perspective. Few studies about the development of internet finance is empirical.
Many scholars have studied the ecological relationship between internet finance and traditional finance. Some studies discuss internet finance’s influence on a single enterprise or traditional financial industry, and most of them focus on the influence on the banking industry [13,14], and rarely have researchers discussed the influence on other financial industries [15]. Although there are several studies on the spillover effect among the ecological subjects of traditional finance markets [16,17,18,19], there are only a few studies on the dynamic correlation and risk transmission effects between the ecological subjects of internet finance and traditional finance. Only Chen et al. [20] used the conditional value at risk (CoVaR) to measure the degree of spillover when internet finance is in extreme risk. This study shows that the risk of internet finance is more likely to spillover to the banking industry, followed by the insurance industry, and, lastly, the securities industry. However, the CoVaR model can only study the risk spillovers between the two parties; it cannot study the influence of internet finance on traditional financial ecology. The DCC-GARCH model can study the dynamic relationship between the two variables, and the GARCH-BEKK model can study the relationship between multivariate variables. This paper creatively studies the dynamic correlation between internet finance and each traditional financial variable, and then studies the influence of risk transmission effect of internet finance on the traditional financial system by DCC-GARCH-BEKK model. The DCC-GARCH and GARCH-BEKK models have been widely used in the empirical analysis of dynamic correlation and volatility spillover. Satish et al. [21] verified that the DCC-GARCH model is efficient at estimating time-varying correlations. Aaron [22] constructed a multivariate DCC-GARCH model to analyze the influence of exchange rate uncertainty on bilateral export growth in China’s top 10 export markets. Vo and Ellis [23] employed DCC-GARCH to study stock return linkages and volatility transmission between Vietnam and advanced countries and Felipe et al. The authors of [24] employed a MGARCH-BEKK, DCC, and t-copulas modelling to analyze the spillover effects and channels of volatility from and to Brazilian stock market. Moreover, the GARCH-BEKK model was used by many scholars [25,26,27,28,29,30,31,32,33] to study the volatility transmission.
Some researchers focus on the construction of the financial ecosystem and the relationship between internet finance and sustainability. Ziolo et al. [34] designed a more sustainable financial systems from a macro-perspective considering the roles of environment, society, and government in the decision-making process to realize sustainable development. Deng et al. [35] proposed an indicator system to evaluate sustainability and supported the notions that there is a U-shaped relationship between the financial technology (fintech) and sustainable development and there are significant regional differences in the influence of fintech on sustainable development. Wang et al. [36] studied the relationship between internet finance, green finance, and sustainability. The existing literature studies the construction of the financial ecosystem and the relationship between internet finance and sustainable development. Moreover, some studies focus on the influence of internet finance on one single financial industry [13,14], ignoring the influence of internet finance on the whole financial ecosystem.
Based on the literature review, the research gap includes three aspects. First, studies on the development of the Internet financial ecosystem has received more theoretical research, but less empirical research. Second, as for the relationship between internet finance and traditional finance, most literature focus on the influence of internet finance on a traditional financial industry, that is the total influence for a time period. However, there is no literature about dynamic time-varying relationships. Third, as for the influence of internet finance on the traditional financial ecosystem, most of the literature is only based on the influence of internet finance on a financial ecological subject, while the research about the influence of internet finance on the whole traditional financial ecosystem from the perspective of relevance has not yet emerged.
Our study makes three main contributions to the literature. First, given the lack of dynamic correlation between the ecological subjects of internet finance and traditional finance, we employed the DCC-GARCH model to analyze the ecological relationship between them. Second, we employed the GARCH-BEKK model to study the influence of internet finance on the sustainable development of the financial ecosystem from the perspective of the risk transmission (volatility spillover) [33] effects. Finally, the study provides the relevant follow-up policy orientation for promoting the sustainable development of internet finance and the whole financial ecosystem for the regulators based on the empirical analysis.
3. Data and Methodology
The stock market can reflect the economic situation of a country at any time. Therefore, we selected several industry indexes in the stock market to represent the operation of the industries. This study selects the Internet finance index and the Shenyin Wanguo (SW) bank, securities, and insurance indexes as proxy variables for internet finance and the banking, securities, and insurance industries. The Shenyin Wanguo industry index is a stock index based on Shenyin Wanguo industry classification standard, which represents the average stock price changes of different industries. The SW bank index is the weighted average of the stock prices of 16 listed banks. The SW securities and insurance indexes are weighted averages of the stock prices of 25 listed securities companies and 5 listed insurance companies, respectively. We selected data from the wind database for the 4 January 2010 to 19 July 2019, Rt is the daily returns of each index, which is defined as follows:
where Pt is the daily closing prices of the variables, demonstrating volatility clustering in all the four financial markets.
3.1. Descriptive Statistics
Table 1 presents a descriptive statistical analysis of the data. It demonstrates that the skewness of the four time series is not zero, and their kurtosis is more than 3, that is, the time series of the four industries show a leptokurtosis and fat-tailed distribution characteristics. Moreover, the Jarque–Bera statistics show that all four sequences do not follow normal distribution. Therefore, the data selected in this study have significant characteristics of the GARCH model, and hence it is reasonable to adopt the GARCH model.
3.2. Stationarity Test
The premise of establishing the GARCH model is that the time series are stationary. We used the Augmented Dickey–Fuller (ADF) test to study the stationarity of the four time series. Table 2 demonstrates that the returns of the four time series reject the alternative hypothesis of the existence of unit root within a 99% confidence interval and that the four return series are stationary.
The statistic Q (10) indicates that all the residuals of four return series have autocorrelation and that the statistic Q2 (10) has a significant autocorrelation in the squared residuals. Hence, the fluctuations have a long memory and all the four return series have ARCH effect. We can use the GARCH model to describe the time-varying characteristics of the fluctuations. This is indicative of the feasibility of the next empirical analysis.
3.3. Univariate GARCH Modeling
Table 3 demonstrates that the univariate GARCH models of internet finance and the traditional finance industries are significant, and hence the GARCH models established in this study are reasonable. Based on the GARCH model’s results, we can obtain standardized residuals and, subsequently, estimate parameters of the DCC coefficient and the dynamic correlation coefficient.
3.4. The DCC-GARCH-BEKK Models
This study mainly estimates the dynamic correlation, the risk transmission (volatility spillover) effect, and the persistence of linkage between internet finance and the banking, securities, and insurance industries. According to descriptive statistics, there are significant GARCH model features between internet finance and the traditional financial industries. In order to better describe the dynamic change and the conditional heteroscedasticity, control the number of parameters, and ensure the positive characterization of each return matrix of conditional covariance, a DCC-GARCH model was adopted to study the dynamic linkage between them. The DCC-GARCH model used in this article is as follows:
where is the return vector of i at time t, It−1 is the information set at time t−1, is the variance covariance matrix, is the diagonal matrix composed of the standard deviation calculated by the GARCH model, and is the dynamic correlation coefficient matrix. The multivariate dynamic heteroscedasticity is as follows:
where denotes the non-conditional correlation coefficient,, , respectively, is the coefficient of the DCC model, m and n are the lag orders, αm denotes the m-order lag residual product influence on the dynamic correlation coefficient, and denotes the conditional heteroscedasticity coefficient for the n-order lag. If the condition of is satisfied, the positive property of Ht can be guaranteed.
Generally, the DCC model is estimated through the following two steps. The first step establishes a univariate GARCH model for each financial variable, then the likelihood function of the univariate GARCH model is as follows:
The second step estimates the dynamic conditional correlation coefficient. This part mainly uses the condition standardization residual obtained through the first step. The maximum likelihood function method is used to estimate the parameters of D and R. The likelihood function is as follows:
In addition to studying the dynamic volatility between internet finance and the traditional finance industries, this study will continue to use the GARCH-BEKK model to study the volatility spillover effect between them. The BEKK model was proposed by Engle and Kroner in 1995 [37], which is expressed as follows:
After expanding the above formula, the specific form of the variance–covariance matrix Ht is obtained as follows:
The parameter matrix M represents the lower triangular constant matrix; A and B, respectively, represent the coefficient matrices of the ARCH and GARCH terms, respectively, corresponding to the short-term and long-term fluctuation components. Additionally, the Wald test is used to estimate the variance equation and further check the direction of the volatility spillover between internet finance and the traditional financial industries. It is generally conducted on the basis of the maximum likelihood estimation. The likelihood function of the model is as follows:
where Γ denotes the parameter matrices of the endogenous variable and T denotes the sample size.
The Wald statistical test of volatility spillover effect is as follows:
We propose the following three hypotheses:
- H1: , indicating that there is no volatility spillover from the variable i to the variable j.
- H2: , indicating that there is no volatility spillover from the variable j to the variable i.
- H3: and , indicating the absence of the mutual volatility spillover effect between the variables i and j.
4. Empirical Analysis
4.1. Dynamic Correlation Coefficient Test between Internet Finance and the Traditional Financial Industries
First, we estimate the GARCH model parameters and, subsequently, the DCC model by the maximum likelihood estimation.
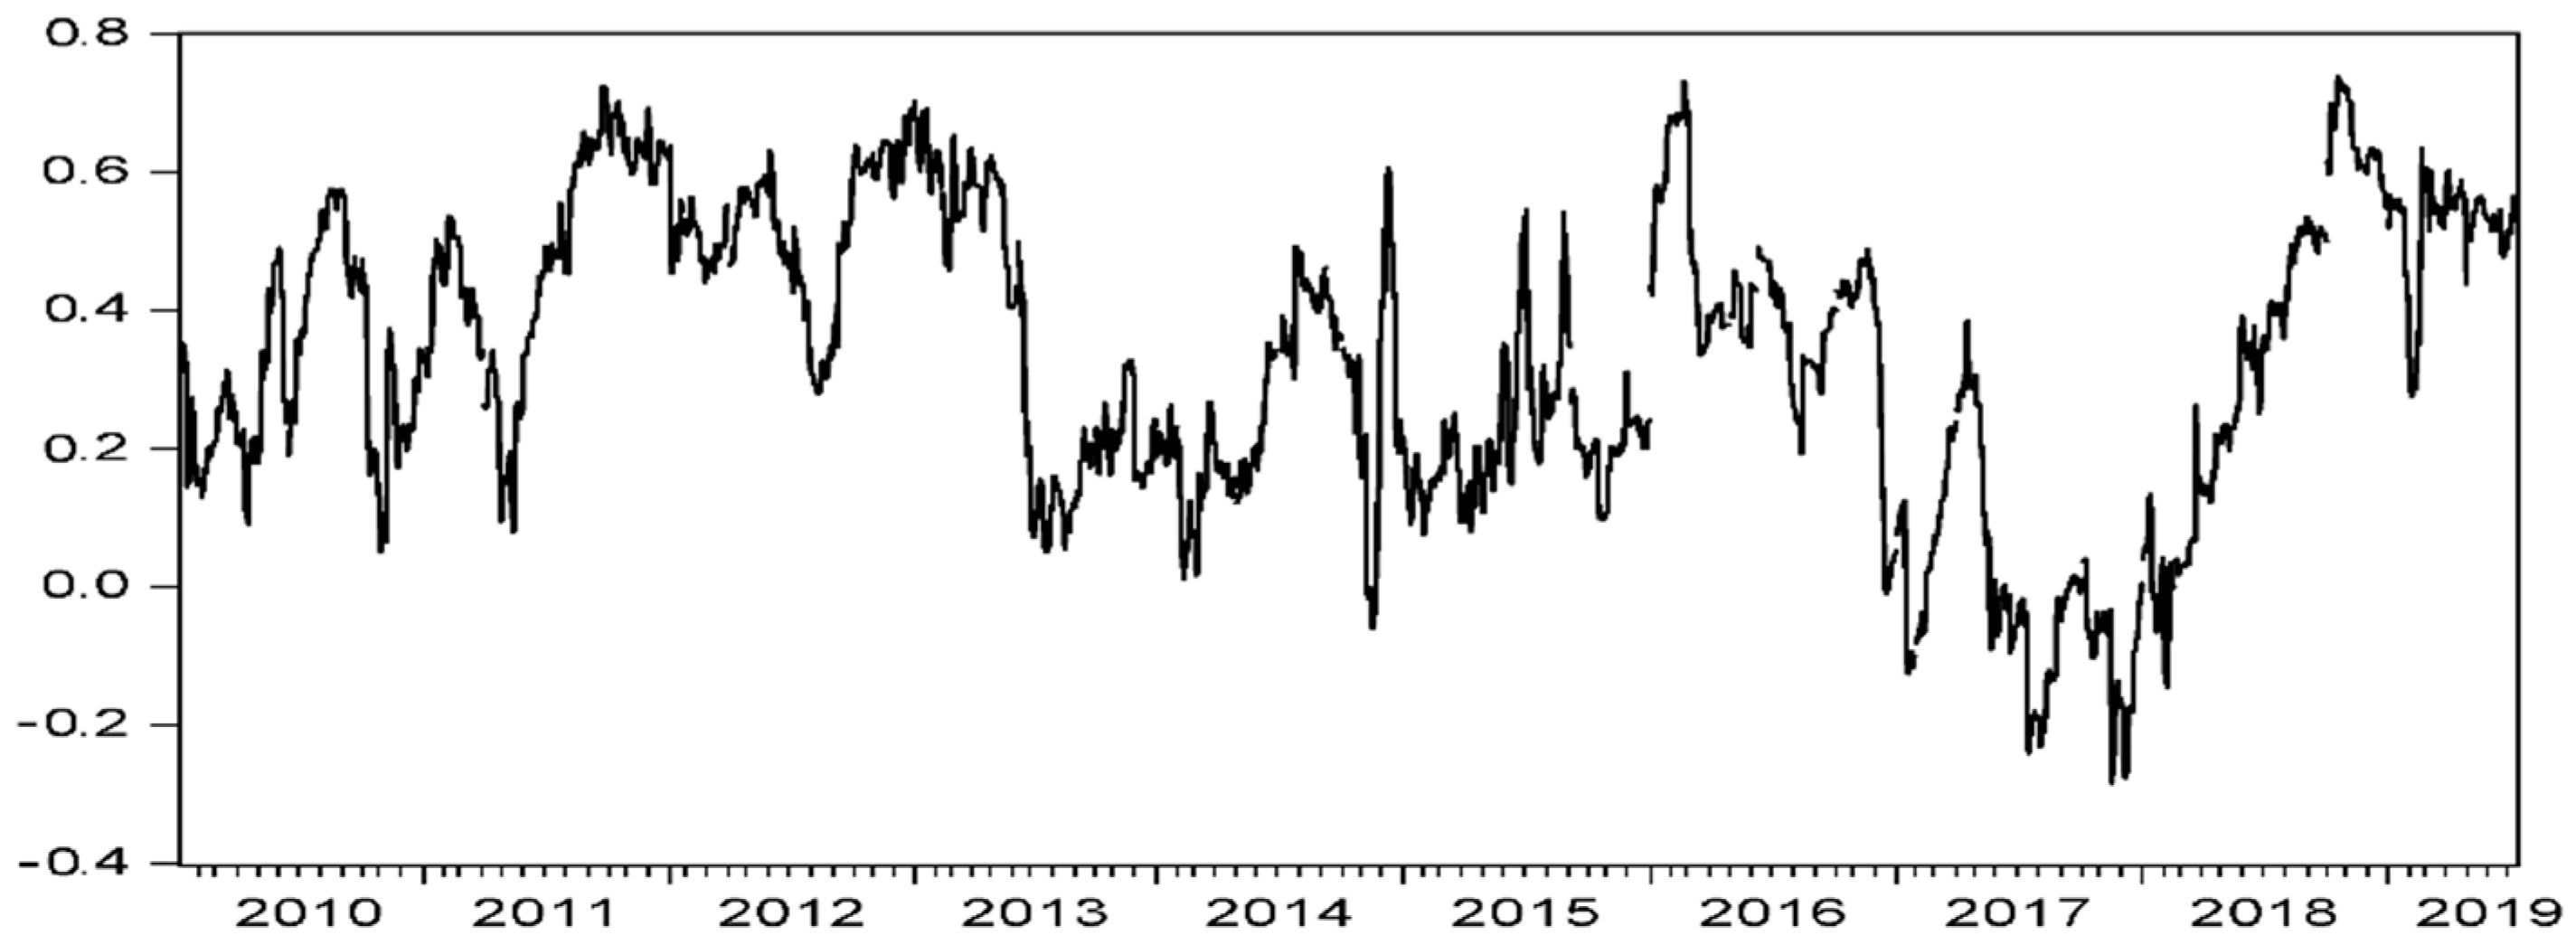
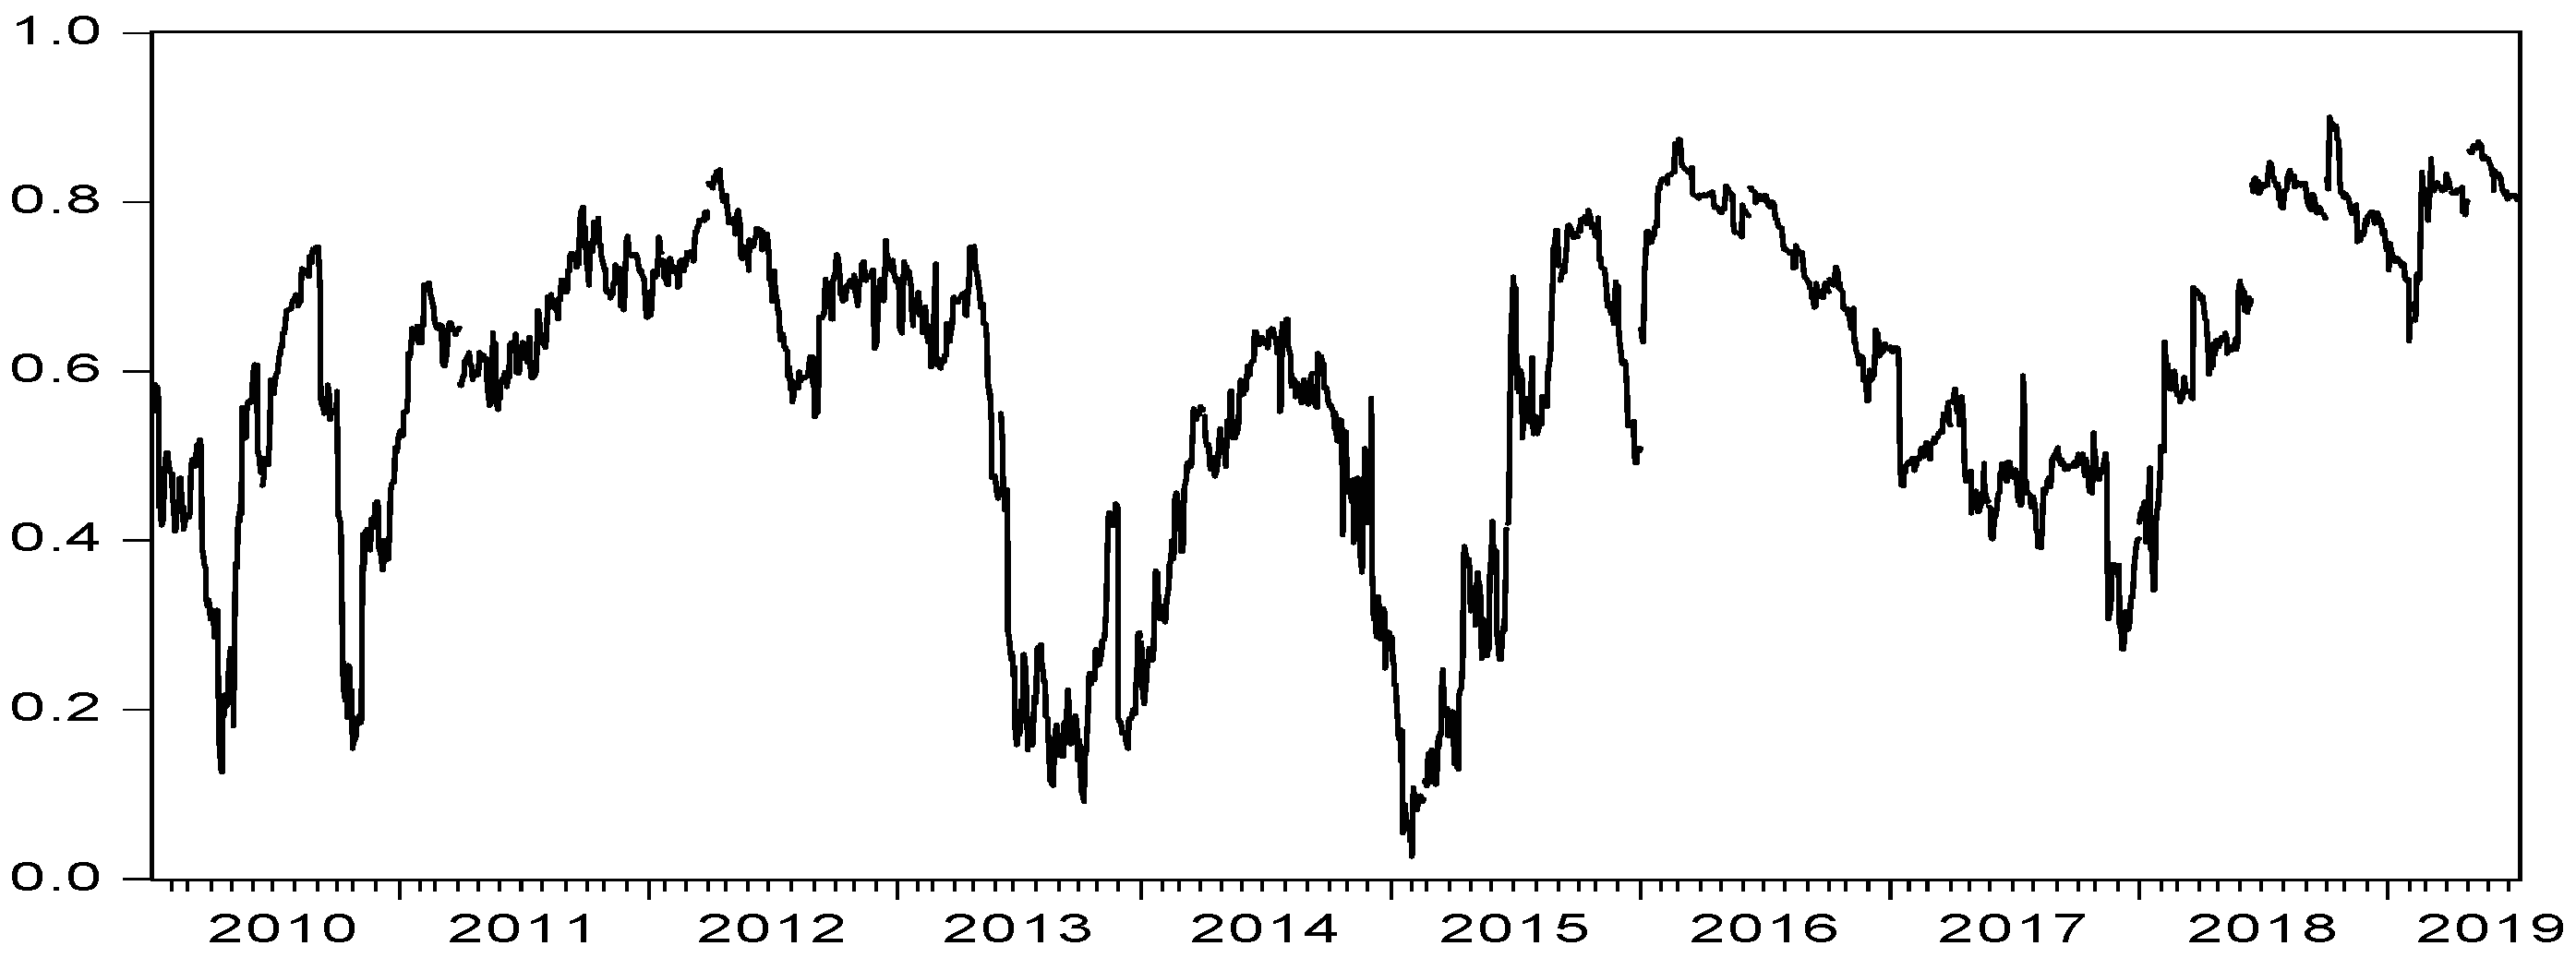
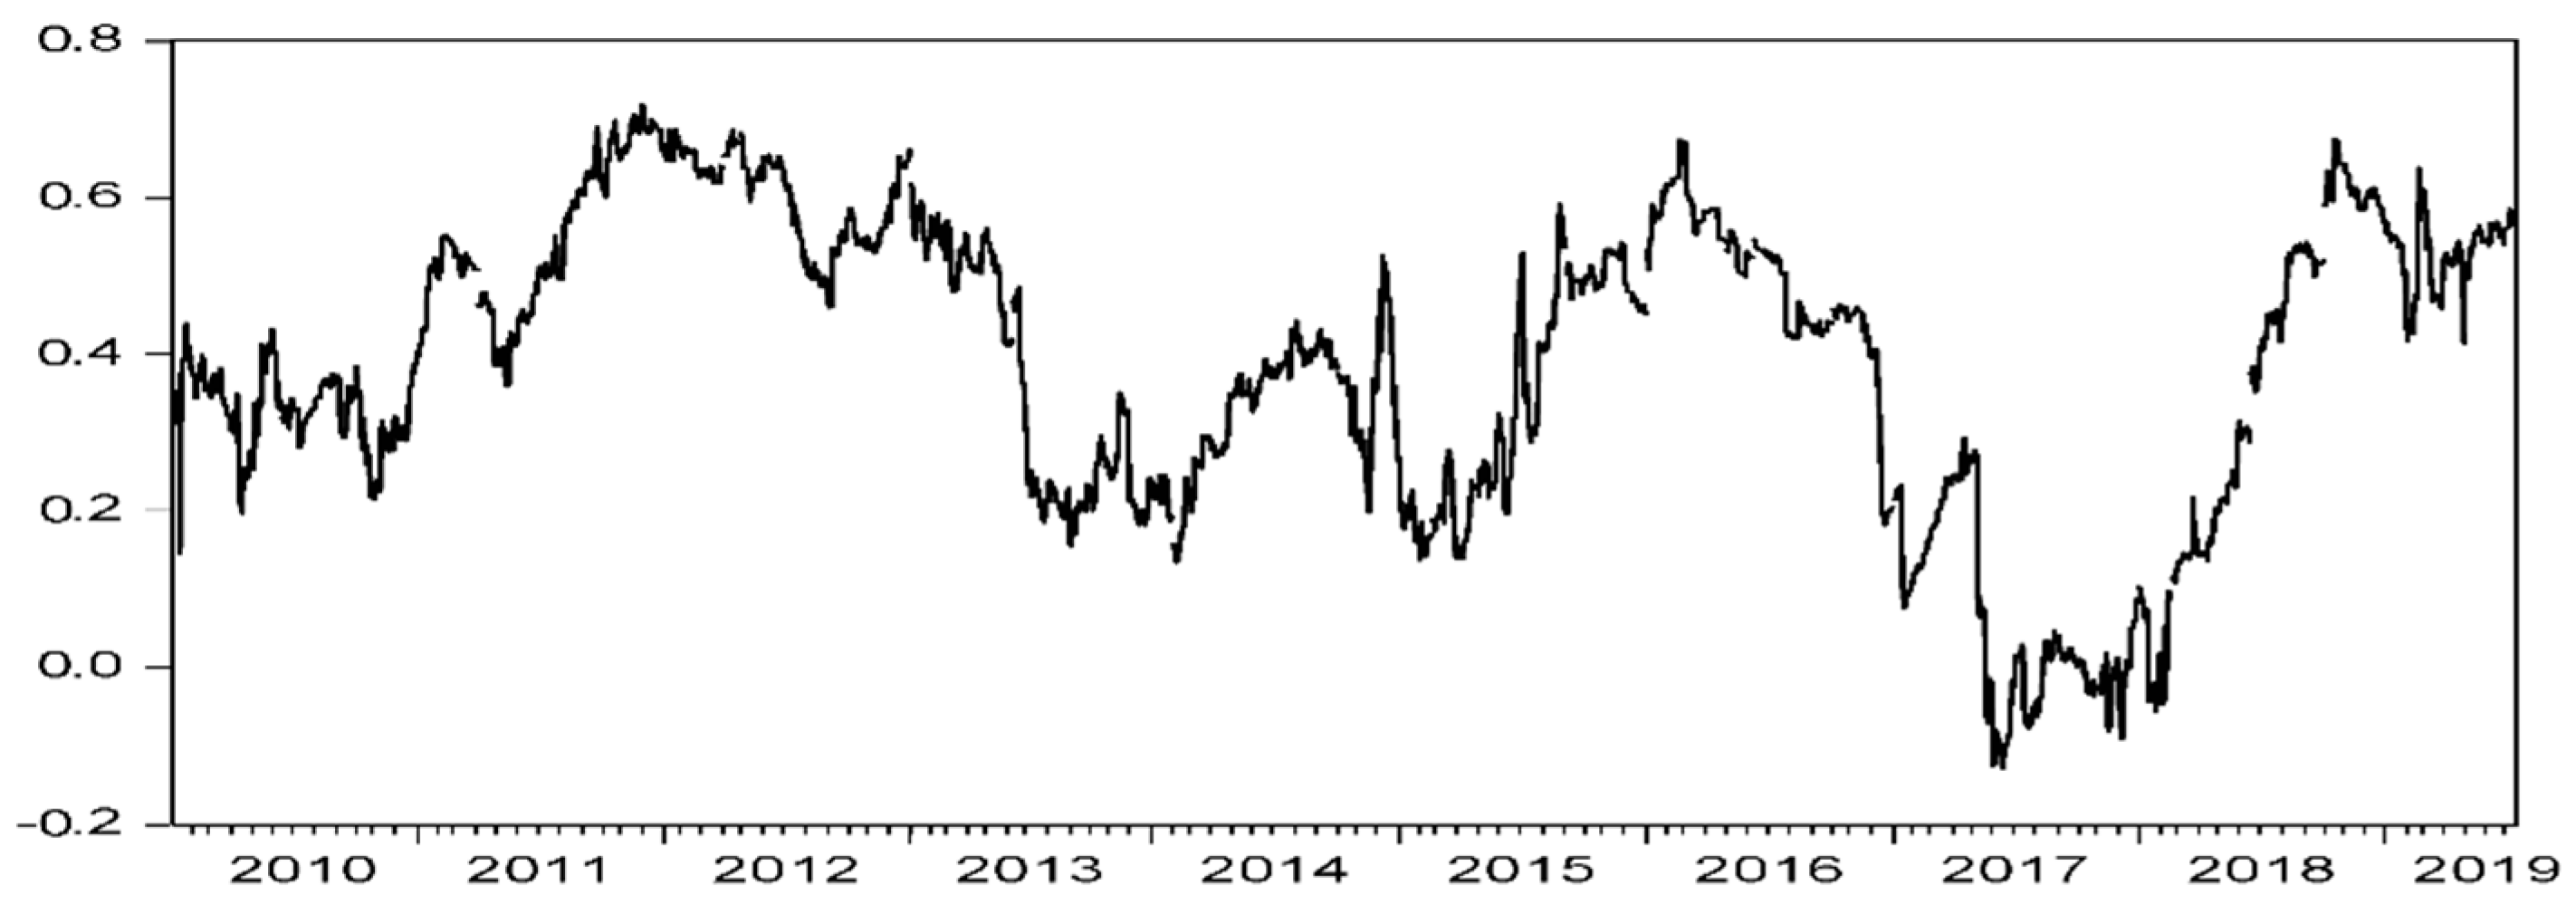
According to the parameter values estimated by the DCC-GARCH model, the dynamic correlation coefficients between internet finance and the traditional financial industries are calculated and plotted in Figure 1, Figure 2 and Figure 3. Table 4 shows the descriptive statistics of the dynamic correlation coefficients between internet finance and the traditional finance industries. First, the dynamic correlation coefficient between internet finance and the securities, insurance, and banking industries is positive in the mean value, and the absolute value of the mean value of each dynamic correlation coefficient is significantly different. This result depicts the strongest correlation between internet finance and the securities industry, among the three traditional financial industries.
Table 4 demonstrates that the DCC coefficients between internet finance and traditional financial industries are generally volatile. Most of the DCC coefficients between internet finance and the banking, securities, and insurance industries run within the range of −0.2701 to 0.7395, 0.0261 to 0.9013, and −0.1286 to 0.7194, respectively. The above analysis shows that the fluctuations among internet finance and the securities, banking, and insurance industries have strong interactions, stability, and conductivity; this is most evident in the case of the dynamic correlation between internet finance and the securities industry.
Table 5 demonstrates the estimation results of the DCC model. The α and β in the DCC-GARCH model constructed by internet finance and the traditional financial industries are significant at the 1% level, indicating a clear time-varying dependency between the return sequence of the Internet and traditional financial industries in China. The sum of α and β is less than 1, and hence the model construction is reasonable. α is close to 0, and β is close to 1. This shows the mean residual’s minimal influence and dynamic condition heteroscedasticity’s significant influence on their respective dynamic correlation coefficients in the early stage. The α value of internet finance and the traditional financial industries is relatively small, which reflects the fact that the previous external interference cannot change the current correlation. The β value of internet finance and the traditional financial industries all exceed 0.9, and the correlation coefficient is significantly limited within the early stage and has a strong fluctuation persistence. Figure 1, Figure 2 and Figure 3 depict the dynamic conditional correlation coefficients estimated by the DCC-GARCH model.
Figure 1, Figure 2 and Figure 3 show the fluctuation of the correlation coefficient between internet finance and the traditional finance industries. The dynamic correlation between internet finance and the traditional financial industries is time-varying and mostly shows a positive correlation.
The dynamic correlation coefficient between internet finance and the banking industry remains at the trough from 2017 to 2018. This can be attributed to the fact that the banking industry issued a series of regulatory policies in 2017, which weakened the correlation between internet finance and the banking industry. The trough of the dynamic correlation between internet finance and the securities industry was in 2010, 2013, and 2015. The dynamic correlation between internet finance and the insurance industry was at a relatively high peak from 2011 to 2013 and from 2015 to 2016, and its trough was in 2017. A series of regulatory policies in financial industries has led to fluctuations in the dynamic correlation between them.
The above analysis shows that the promulgation of regulatory policies affects the relationship between financial ecological subjects.
4.2. Risk Transmission (Volatility Spillover) Effect Influence of Internet Finance on the Traditional Financial Ecosystem
4.2.1. Risk Transmission (Volatility Spillover) Effect between the Ecological Subjects of the Traditional Financial Industries
Table 6 describes the risk transmission (volatility spillover) effect between the traditional financial industries; it rejects the null hypothesis at the 1% significance level and accepts the assumption that the insurance industry has a one-way risk transmission (volatility spillover) effect on the banking industry. At the 5% significance level, it rejects the null hypothesis and accepts the assumption that the insurance industry has a one-way risk transmission (volatility spillover) effect on the securities industry, and, at the 10% significance level, it rejects the null hypothesis and accepts the assumption that the securities industry has a one-way risk transmission (volatility spillover) effect on the insurance industry. Therefore, there are two-way risk transmission (volatility spillover) effects between the securities and insurance industries.
4.2.2. The Model’s Robustness Check
In order to test the fitting effect of the set GARCH-BEKK model on the data, we tested the rationality of the established model. The results in Table 7 show that there was no residual ARCH effect in the three time series. Therefore, the model set in this part has a good fitting effect.
4.2.3. Risk Transmission (Volatility Spillover) Effect between All Four Financial Markets Based on the Relevance Perspective
Table 8 rejects the null hypothesis at the 1% significance level, indicating that the banking industry has a one-way risk transmission (volatility spillover) effect on internet finance. The study accepts the null hypothesis and indicates the absence of the risk transmission (volatility spillover) effect between internet finance and the securities industry; it accepts the null hypothesis that there is no risk transmission (volatility spillover) effect between internet finance and the insurance industry. Rejecting the null hypothesis at the 5% significance level, it accepts that the securities industry has a one-way risk transmission (volatility spillover) effect on the banking industry. Rejecting the null hypothesis at the 1% significance level, it accepts a one-way risk transmission (volatility spillover) effect from the insurance industry to the banking industry. Rejecting the null hypothesis at the 5% significance level, it accepts that the insurance industry has a one-way risk transmission (volatility spillover) effect on the securities industry.
4.2.4. The Model’s Robustness Check
In order to test the fitting effect of the GARCH-BEKK model set on the data, we tested the rationality of the established model. The results in Table 9 show the absence of the residual ARCH effect in the four time series. Therefore, the model set in this part has a good fitting effect.
4.2.5. The Change in the Risk Transmission (Volatility Spillover) Effect between the Traditional Financial Industries after the Introduction of Internet Finance
A comparison of the results in Table 6 and Table 8 show that the introduction of internet finance has changed the risk transmission effect between the three traditional financial industries. With the introduction of internet finance, the risk transmission (volatility spillover) effect between the securities and banking industries changed from no risk transmission (volatility spillover) to one-way risk transmission (volatility spillover) from the securities industry to the banking industry. The risk transmission (volatility spillover) effect between the insurance and securities industries reduced and changed from a two-way to a one-way risk transmission (volatility spillover) from the insurance to the securities industry. However, the one-way risk transmission (volatility spillover) effect from the insurance industry to the banking industry remained unchanged [33].
5. Discussion
The literature [20] studies the degree of risk spillovers between the Internet and traditional financial industries using the CoVaR model. Their study shows that the risk of internet finance is more likely to spillover to the banking industry followed by the insurance industry and, lastly, the securities industry. However, we studied the dynamic time-varying correlation between the Internet and traditional financial industries using DCC-GARCH model. The estimation results of the DCC-GARCH demonstrate that the dynamic correlation coefficient between internet finance and the securities, insurance, and banking industries is large and positive almost all of the time. The ecological subjects of internet finance and the traditional finance industries can form symbiotic relationships.
First, the learning effect of the banking industry on internet finance strengthens the cooperation between the domains. Commercial banks use internet financial technology to conduct risk management and facilitate information-sharing customers. Commercial banks continue to use the Internet technology to build online malls in order to expand the sales channels of off-balance sheet business and financial products. Second, a large amount of the Internet’s financial customers’ funds flow into the securities market, especially the stock market. The rapid development of the network securities business has contributed toward overcoming the limitations of physical space and saving costs as well as the “dematerialization” of the market. Moreover, the Internet financial platform provides a sales bridge for brokerage financial services. Third, the emergence of internet finance has promoted the development of the insurance industry to a certain extent. Internet finance’s big data analysis technology helps in managing and controlling the industry’s risks, accurately assessing the potential risks and needs of customers, and providing insurance products that meet these needs. The development of internet finance promotes innovation in the traditional insurance sector to facilitate the continuous development of new insurance products. It also expands the insurance sales channel to a certain extent and reduces the cost of physical agencies, thus reducing the insurance sale’s cost.
Different from previous literature [9,20,35], we studied the influence of internet finance ecological subject on the sustainable development of financial ecosystem from empirical perspectives. The risk transmission effect between the traditional financial ecological subjects has been studied [19], but the influence of internet finance on the financial ecosystem of the traditional financial industries has not been studied. We obtained the results by the GARCH-BEKK model. With the introduction of internet finance, the directions of risk transmission between the ecological subjects of banking and securities industries have changed. The effect and directions of risk transmission between the ecological subjects of securities and insurance industries have changed. Therefore, in order to realize the sustainable development of the whole financial ecosystem, it would be important to control the risks of the Internet financial ecological subjects. This can be achieved by strengthening the infrastructure for internet finance, establishing a unified financial risk prediction and prevention platform, promoting the construction of a national credit system, and improving the information security system to eliminate information security risks drastically.
6. Conclusions
This study analyzes the ecological relationship between the financial ecological subjects of internet finance and the banking, securities, and insurance industries, and the influence of internet finance on the sustainable development of financial ecosystem based on the DCC-GARCH-BEKK model, and draws the following conclusions. The dynamic correlation between internet finance and the traditional finance industries has been positive almost all of the time. The dynamic correlation coefficient between internet finance and the traditional finance industries is fluctuating most of the time because a series of regulatory policies in financial industries has led to fluctuations in the dynamic correlation between them, meaning that the promulgation of regulatory policies affects the relationship between financial ecological subjects. In addition, the introduction of internet finance changed the risk transmission effect between the three traditional financial industries, and internet finance industry has changed the ecological relationship between traditional financial industries.
6.1. Theoretical Implication
Academically, the contribution of this study lies in applying the DCC-GARCH-BEKK model to analyze the ecological relationship between the ecological subjects of the Internet and traditional financial industries and the influence of internet finance on the sustainability of the financial ecosystem for the first time. Therefore, a pioneer reference for similar research in the future has been provided by this study.
This study enriches the financial ecological theory by investigating the ecological relationship between internet finance and traditional finance. Theoretical research or the logistic extension model in the ecology are used to study financial ecology or the ecological relationship in the prior studies. This study employs the financial econometric model to study the ecological relations. Thus, this study identifies the symbiotic relationships from the perspective of empirical analysis, which increases the research methods in the ecology. In order to promote the sustainable development of internet finance and the whole financial ecosystem, it would be essential to optimize the financial ecological relationship between internet finance and traditional finance and integrate ecological subjects. Owing to their positive dynamic correlation, it would be necessary to integrate the ecological subjects between internet finance and traditional finance and achieve a balanced development among these ecological subjects, promote the sustainable development of internet finance, the whole financial ecosystem, and achieve economic and social sustainable development.
Studies on the influence of internet finance on the financial ecosystem are lacking. This study broadens the investigation of internet finance and the financial ecosystem, and pushes the study of the financial ecosystem towards a more comprehensive viewpoint. Our study can help to improve the existing financial ecosystem theory and realize sustainable development.
6.2. Practical Implications
In view of the rapid development of internet finance in all countries in the world, including China, our research results can also be used for other countries. We should seize the opportunities presented by the development of internet finance and provide follow-up policy guidance for sustainable development.
On the other hand, it provides a decision-making basis for the government’s macro-control in practice. It would be crucial to improve the ecological environment and create a prudent and measured regulatory environment. The research results supply suggestions for internet finance and traditional finance supervision system construction, legal supervision system construction, and supervision concept innovation. Under the leadership of the People’s Bank of China (PBOC), the follow-up policy design for the regulation of internet finance should consider and analyze the complexity of products and services and put them into practice in the reality of micro-regulation. In terms of improving the legal and regulatory system of internet finance, it would be important to implement regulations in the form of departmental rules or joint provisions, at an early stage of the formation of the regulatory framework. Gradually, efforts should focus on enriching the provisions; after gaining supervision and regulatory experience, the supervision should be implemented in the form of a national legislation. In terms of the innovation of the regulation concept, it forms the core focus of the Internet’s financial regulation. According to its different influences on the existing financial system, it would be necessary to adopt an innovative supervision concept that is both classified and based on coordinated supervision. This would encourage innovation, prevent systemic risks, and thereby promote the healthy and sustainable development of internet finance and the whole financial ecosystem.
6.3. Limitations
Our study also has some limitations. On the one hand, when analyzing the relationship between the ecological subjects of the Internet and traditional financial industries, we use the data of China and not involving the data of other countries. On the other hand, we do not conclude other important factors, such as monetary policy, when analyzing the influence of internet finance on the sustainable development of the financial ecosystem. In future research, we aim to focus on the following two aspects. On the one hand, we plan to analyze the influence of internet finance on the sustainable development of the financial ecosystem, including other important factors. On the other hand, we aim to conduct a comparative analysis on the influence of internet finance on the sustainable development of the financial ecosystem from developed and developing countries.
Author Contributions
S.L. and X.L. conceptualized and designed the work. S.L. and C.W. were accountable for conducting research and drafting the manuscript. S.L. was responsible for statistical analysis. All authors have read and agreed to the published version of the manuscript.
Funding
This research was funded by National Social Science Foundation of China (Grant No. 18CJY004) and China Postdoctoral Science Foundation (Grant No.2018M642638) and Shandong Social Science Planning Project (Grant No.20DJJJ04 and Grant No.18DGLJ16).
Acknowledgments
The authors would like to thank the editors and anonymous reviewers for their constructive comments and helpful suggestions.
Conflicts of Interest
The authors declare no conflict of interest.
References
- Monnet, E.; Pagliari, S.; Vallee, S. Beyond “financial repression” and “capture of regulation” recomposition of European financial ecosystems after the crisis. Actes De La Rech. En Sci. Soc. 2019, 229, 14–33. [Google Scholar]
- Hendrikse, R.; van Meeteren, M.; Bassens, D. Strategic coupling between finance, technology and the state: Cultivating a Fintech ecosystem for incumbent finance. Environ. Planing A Econ. Space 2019, 11, 0308518X19887967. [Google Scholar] [CrossRef]
- De Luca, V.V.; Margherita, A.; Passiante, G. Crowd-funding: A systemic framework of benefits. Int. J. Entrep. Behav. Res. 2019, 25, 1321–1339. [Google Scholar] [CrossRef]
- Lee, K.H.; Kim, D.H. A peer-to-peer (P2P) platform business model: The case of Airbnb. Serv. Bus. 2019, 13, 647–669. [Google Scholar] [CrossRef]
- Burtch, G.; Ghose, A.; Wattal, S. The hidden cost of accommodating crowdfunder privacy preferences: A randomized field experiment. Manag. Sci. 2015, 61, 949–962. [Google Scholar] [CrossRef] [Green Version]
- Dorfleitner, G.; Priberny, C.; Schuster, S.; Stoiber, J.; Weber, M.; Castro, I.; Kammler, J. Description-text related soft information in peer-to-peer lending–evidence from two leading European platforms. J. Bank. Financ. 2016, 64, 169–187. [Google Scholar] [CrossRef]
- Paravisini, D.; Rappoport, V.; Ravina, E. Risk aversion and wealth: Evidence from person-to-person lending Portfolios. Manag. Sci. 2016, 63, 279–297. [Google Scholar] [CrossRef] [Green Version]
- Liu, X.; Chen, J.; Wang, Y. The construction of Internet finance ecosystem--from the perspective of business ecosystem. Mod. Econ. Res. 2017, 4, 53–57. [Google Scholar]
- Chen, L.; Tan, Y. The development trend of the Internet financial ecosystem and its regulatory countermeasures. Financ. Econ. 2016, 3, 68. [Google Scholar]
- Huang, J.; Zhang, W.; Ruan, W. Spatial spillover and impact factors of the Internet finance development in China. Phys. A 2019, 527, 1–12. [Google Scholar] [CrossRef]
- Peter, G.; Robert, J.; Kauffman, C.P.; Bruce, W.W. Financial information systems and the fintech revolution. J. Manag. Inf. Syst. 2018, 35, 12–18. [Google Scholar]
- Sanjiv, R.D. The future of fintech. Financ. Manag. 2019, 48, 981–1007. [Google Scholar]
- Zhao, Q.; Pei-Hsuan, T.; Wang, J. Improving financial service innovation strategies for enhancing China’s banking industry competitive advantage during the fintech revolution: A hybrid MCDM model. Sustainability 2019, 11, 1419. [Google Scholar] [CrossRef] [Green Version]
- Sangmin, L. Evaluation of mobile application in User’s perspective: Case of P2P lending apps in fintech industry. KSII Trans. Internet Inf. Syst. 2017, 11, 1105–1117. [Google Scholar]
- Raza, S.A.; Hanif, N. Factors affecting Internet banking adoption among internal and external customers: A case of Pakistan. Int. J. Electron. Financ. 2013, 7, 82–96. [Google Scholar] [CrossRef] [Green Version]
- Berg, K.A.; Vu, N.T. International spillovers of US financial volatility. J. Int. Money Financ. 2019, 97, 19–34. [Google Scholar] [CrossRef]
- Gulzar, S.; Kayani, G.M.; Xiaofeng, H.; Ayub, U.; Rafique, A. Financial cointegration and spillover effect of global financial crisis: A study of emerging Asian financial markets. Ekon. Istraživanja Econ. Res. 2019, 32, 187–218. [Google Scholar] [CrossRef] [Green Version]
- Yoon, S.M.; Al Mamun, M.; Uddin, G.S.; Kang, S.H. Network connectedness and net spillover between financial and commodity markets. N. Am. J. Econ. Financ. 2019, 48, 801–818. [Google Scholar] [CrossRef]
- Gamba-Santamaria, S.; Gomez-Gonzalez, J.; Hurtado-Guarin, J.L.; Melo-Velandia, L.F. Volatility spillovers among global stock markets: Measuring total and directional effects. Empir. Econ. 2019, 56, 1581–1599. [Google Scholar] [CrossRef] [Green Version]
- Chen, R.; Chen, H.; Jin, C.; Wei, B.; Yu, L. Linkages and Spillover between Internet Finance and Traditional Finance: Evidence from China. Emerg. Mark. Financ. Trade 2019, 1–15. [Google Scholar] [CrossRef]
- Satish, K.; Ashis, K.P.; Aviral, K.T.; Sang, H.K. Correlations and volatility spillovers between oil, natural gas, and stock prices in India. Resour. Policy 2019, 62, 282–291. [Google Scholar]
- Aaron, D.S. Analyzing exchange rate uncertainty and bilateral export growth in China: A multivariate GARCH-based approach. Econ. Model. 2019, 82, 332–344. [Google Scholar]
- Vo, X.V.; Ellis, C. International financial integration: Stock return linkages and volatility transmission between Vietnam and advanced countries. Emerg. Mark. Rev. 2018, 36, 19–27. [Google Scholar] [CrossRef]
- de Oliveira, F.A.; Maia, S.F.; de Jesus, D.P.; Besarria, C.D.N. Which information matters to market risk spreading in Brazil? Volatility transmission modelling using MGARCH-BEKK, DCC, t-Copulas. N. Am. J. Econ. Financ. 2018, 45, 83–100. [Google Scholar] [CrossRef]
- Mumtaz, M.Z.; Smith, Z.A. Estimation of the spillover effect between patents and innovation using the GARCH-BEKK model. Pac. Econ. Rev. 2017, 22, 772–791. [Google Scholar] [CrossRef]
- Gomez-Gonzalez, J.E.; Rojas-Espinosa, W. Detecting contagion in Asian exchange rate markets using asymmetric DCC-GARCH and R-vine copulas. Econ. Syst. 2019, 43, 100717. [Google Scholar] [CrossRef] [Green Version]
- Cardona, L.; Gutiérrez, M.; Agudelo, D.A. Volatility transmission between US and Latin American stock markets: Testing the decoupling hypothesis. Res. Int. Bus. Financ. 2017, 39, 115–127. [Google Scholar] [CrossRef] [Green Version]
- Helmut, L. New Introduction to Multiple Time Series Analysis; Springer: Berlin/Heidelberg, Germany, 2005; Volume 83, pp. 109–110. [Google Scholar]
- Alfreedi, A.A. Shocks and volatility spillover between stock markets of developed countries and GCC stock markets. J. Taibah Univ. Sci. 2019, 13, 112–120. [Google Scholar] [CrossRef]
- Arouri, M.E.H.; Lahiani, A.; Nguyen, D.K. Return and volatility transmission between world oil prices and stock markets of the GCC countries. Econ. Model. 2011, 28, 1815–1825. [Google Scholar] [CrossRef] [Green Version]
- Awartani, B.; Maghyereh, A.I. Dynamic spillovers between oil and stock markets in the Gulf Cooperation Council countries. Energy Econ. 2013, 36, 28–42. [Google Scholar] [CrossRef]
- Caporale, G.M.; Menla, A.F.; Spagnolo, N. Exchange rate uncertainty and international portfolio flows: A multivariate GARCH-in-mean approach. J. Int. Money Financ. 2015, 54, 70–92. [Google Scholar] [CrossRef] [Green Version]
- Hu, Y.; Zhou, J. A time-varying study on systemic risk and intra-system risk transmission in China’s financial system from the perspective of interconnectedness. Nankai Econ. Stud. 2018, 3, 117–135. [Google Scholar]
- Ziolo, M.; Filipiak, B.Z.; Bąk, I.; Cheba, K. How to design more sustainable financial systems: The roles of environmental, social, and governance factors in the decision-making process. Sustainability 2019, 11, 5604. [Google Scholar] [CrossRef] [Green Version]
- Deng, X.; Huang, Z.; Cheng, X. FinTech and sustainable development: Evidence from China based on P2P data. Sustainability 2019, 11, 6434. [Google Scholar] [CrossRef] [Green Version]
- Wang, K.; Tsai, S.; Du, X.; Bi, D. Internet finance, green finance, and sustainability. Sustainability 2019, 11, 3856. [Google Scholar] [CrossRef] [Green Version]
- Engle, R.F.; Kroner, K.F. Multivariate simultaneous generalized ARCH. Econom. Theory 1995, 11, 122–150. [Google Scholar] [CrossRef]
Figure 1.
Dynamic correlation coefficient between internet finance and the banking industry.

Figure 2.
Dynamic correlation coefficient between internet finance and the securities industry.

Figure 3.
Dynamic correlation coefficient between internet finance and the insurance industry.


Table 1.
Descriptive statistics for the returns of the Internet and traditional financial industries.
Table 1.
Descriptive statistics for the returns of the Internet and traditional financial industries.
| Internet Finance | Banking Industry | Securities Industry | Insurance Industry | |
|---|---|---|---|---|
| Mean | 0.0232 | 0.0054 | −0.0047 | 0.0149 |
| Median | 0.0433 | −0.0180 | −0.0374 | −0.0091 |
| Maximum | 4.6657 | 3.4087 | 4.1392 | 3.9993 |
| Minimum | −4.1539 | −4.5625 | −4.5760 | −4.3099 |
| Std. Dev. | 0.9899 | 0.6588 | 1.0250 | 0.8585 |
| Skewness | −0.4169 | 0.0429 | 0.0409 | 0.0964 |
| Kurtosis | 5.0021 | 9.3269 | 6.8036 | 6.0315 |
| Jarque–Bera | 454.5364 | 3868.6210 | 1398.6170 | 891.5911 |
| Probability | 0.0000 | 0.0000 | 0.0000 | 0.0000 |
| Observations | 2319 | 2319 | 2319 | 2319 |
Table 2.
Unit root test.
| Variable | 1% | 5% | 10% | T-Statistics | P-Statistics | Conclusion | Q (10) | Q2 (10) |
|---|---|---|---|---|---|---|---|---|
| Internet finance | −3.4398 | −2.8626 | −2.5673 | −42.9206 *** | 0.0000 | stationary | 59.2880 *** | 942.4800 *** |
| Banking industry | −3.4398 | −2.8626 | −2.5673 | −48.9334 *** | 0.0001 | stationary | 33.0720 *** | 508.4200 *** |
| Securities industry | −3.4398 | −2.8626 | −2.5673 | −46.2962 *** | 0.0000 | stationary | 18.8200 ** | 492.8300 *** |
| Insurance industry | −3.4398 | −2.8626 | −2.5673 | −42.9206 *** | 0.0000 | stationary | 23.2740 *** | 323.1300 *** |
Note: *** and ** denote the significance of the expression at the 1% and 5% levels, respectively.
Table 3.
Parameters of the univariate generalized autoregressive conditional heteroskedasticity (GARCH) model.
Table 3.
Parameters of the univariate generalized autoregressive conditional heteroskedasticity (GARCH) model.
| List | Variable | Coefficient | Standard Deviation | Z-Value | p-Value |
|---|---|---|---|---|---|
| Internet finance | C | 3.02E-06 | 5.51E-07 | 5.4780 | 0.0000 |
| RESID(-1)^2 | 0.0478 | 0.0050 | 9.4141 | 0.0000 | |
| GARCH(-1) | 0.9462 | 0.0050 | 187.4317 | 0.0000 | |
| Banking industry | C | 2.37E-06 | 3.77E-07 | 6.2861 | 0.0000 |
| RESID(-1)^2 | 0.0738 | 0.0056 | 13.1777 | 0.0000 | |
| GARCH(-1) | 0.9184 | 0.0050 | 183.2538 | 0.0000 | |
| Securities industry | C | 2.71E-06 | 5.31E-07 | 5.1011 | 0.0000 |
| RESID(-1)^2 | 0.0476 | 0.0038 | 12.4377 | 0.0000 | |
| GARCH(-1) | 0.9490 | 0.0035 | 264.2489 | 0.0000 | |
| Insurance industry | C | 3.03E-06 | 6.17E-07 | 4.9081 | 0.0000 |
| RESID(-1)^2 | 0.0624 | 0.0058 | 10.7078 | 0.0000 | |
| GARCH(-1) | 0.9319 | 0.0060 | 154.4614 | 0.0000 |
Table 4.
Results of the dynamic correlation coefficient.
| Internet Finance-Banking Industry | Internet Finance-Securities Industry | Internet Finance-Insurance Industry | |
|---|---|---|---|
| α | 0.0331 | 0.0350 | 0.0207 |
| β | 0.9642 | 0.9616 | 0.9772 |
| α + β | 0.9973 | 0.9966 | 0.9979 |
| Mean value | 0.3363 | 0.5822 | 0.3894 |
| Standard deviation | 0.2131 | 0.1916 | 0.1906 |
| Minimum value | −0.2701 | 0.0261 | −0.1286 |
| Maximum value | 0.7395 | 0.9013 | 0.7194 |
| T-statistic | 75.8060 | 146.1074 | 98.2918 |
| Log-likelihood ratio | 12663.7055 | 12002.5642 | 11975.8792 |
Table 5.
DCC model parameter estimation results.
| α | β | α + β | |
|---|---|---|---|
| Internet finance-banking industry | 0.0331 *** (0.0002) | 0.9642 *** (0.0000) | 0.9973 |
| Internet finance-securities industry | 0.0350 *** (0.0000) | 0.9616 *** (0.0000) | 0.9966 |
| Internet finance-insurance industry | 0.0207 *** (0.0000) | 0.9772 *** (0.0000) | 0.9979 |
Note: *** means that the expression is significant at the level of 1%. p values are in parentheses.
Table 6.
Risk transmission (volatility spillover) effect between the traditional financial industries.
Table 6.
Risk transmission (volatility spillover) effect between the traditional financial industries.
| Sequence | Hypothesis 1: There Is no Volatility Spillover Effect from Market A to Market B H0: a12= b12=0 | Hypothesis 2: There Is no Volatility Spillover Effect from Market B to Market A H0: a21 = b21=0 | Hypothesis 3: There Is no Mutual Volatility Spillover Effect between the Two Markets H0: a12 = b12=0, a21 = b21=0 |
|---|---|---|---|
| Banking industry–securities industry | Wald=0.7282 (0.6948) | Wald=4.1162 (0.1276) | Wald=4.7060 (0.3188) |
| Banking industry–insurance industry | Wald=0.6067 (0.7383) | Wald=9.5671 *** (0.0083) | Wald=11.6617 ** (0.0200) |
| Securities industry–insurance industry | Wald=5.2695 * (0.0717) | Wald=8.3037 ** (0.0157) | Wald=13.1103 ** (0.0107) |
Note: ***, **, and * denote the significance of the expression at the 1%, 5%, and 10% levels, respectively. The values in parentheses are p values.
Table 7.
Test results of the standardized residuals of the traditional financial industries.
| Banking Industry | Securities Industry | Insurance Industry | |
|---|---|---|---|
| Q2(10) | 9.0050 | 7.6760 | 9.7260 |
| p-value | 0.1732 | 0.2628 | 0.1366 |
Table 8.
Risk transmission (volatility spillover) effect between all four financial markets.
| Sequence | Hypothesis 1: There Is no Volatility Spillover Effect from Market A to Market B H0: a12= b12=0 | Hypothesis 2: There Is no Volatility Spillover Effect from Market B to Market A H0: a21 = b21=0 | Hypothesis 3: There Is no Mutual Volatility Spillover Effect between the Two Markets H0: a12 = b12=0, a21 = b21=0 |
|---|---|---|---|
| Internet finance–banking industry | Wald=1.0171 (0.6013) | Wald=15.5383 *** (0.0004) | Wald=21.1596 *** (0.0003) |
| Internet finance–securities industry | Wald= 0.5306 (0.7669) | Wald=1.2960 (0.5230) | Wald=4.6391 (0.3263) |
| Internet finance–insurance industry | Wald=0.2738 (0.8720) | Wald=0.1848 (0.9117) | Wald=0.3247 (0.9881) |
| Banking industry–securities industry | Wald=2.5843 (0.2746) | Wald=7.3055 ** (0.0259) | Wald=8.3965 * (0.0780) |
| Banking industry– insurance industry | Wald=3.4924 (0.1744) | Wald=9.7250 *** (0.0077) | Wald=10.1864 ** (0.0374) |
| Securities industry–insurance industry | Wald=4.0312 0.1332 | Wald=7.7568 ** 0.0206 | Wald=12.6431 ** 0.0131 |
Note: ***, **, and * denote the significance of the expression at the 1%, 5%, and 10% levels, respectively. The values in parentheses are p values.
Table 9.
Test results of standardized residuals of the Internet and traditional financial industries.
Table 9.
Test results of standardized residuals of the Internet and traditional financial industries.
| Internet Finance | Banking Industry | Securities Industry | Insurance Industry | |
|---|---|---|---|---|
| Q2(10) | 5.612 | 8.902 | 8.845 | 10.644 |
| p-Value | 0.6678 | 0.4128 | 0.8371 | 0.9099 |
© 2020 by the authors. Licensee MDPI, Basel, Switzerland. This article is an open access article distributed under the terms and conditions of the Creative Commons Attribution (CC BY) license (http://creativecommons.org/licenses/by/4.0/).
Share and Cite
MDPI and ACS Style
Li, S.; Liu, X.; Wang, C. The Influence of Internet Finance on the Sustainable Development of the Financial Ecosystem in China. Sustainability 2020, 12, 2365. https://0-doi-org.brum.beds.ac.uk/10.3390/su12062365
AMA Style
Li S, Liu X, Wang C. The Influence of Internet Finance on the Sustainable Development of the Financial Ecosystem in China. Sustainability. 2020; 12(6):2365. https://0-doi-org.brum.beds.ac.uk/10.3390/su12062365
Chicago/Turabian StyleLi, Shuping, Xinghua Liu, and Chongren Wang. 2020. "The Influence of Internet Finance on the Sustainable Development of the Financial Ecosystem in China" Sustainability 12, no. 6: 2365. https://0-doi-org.brum.beds.ac.uk/10.3390/su12062365
Note that from the first issue of 2016, this journal uses article numbers instead of page numbers. See further details here.