On LSP Lifecycle Model to Re-design Logistics Service: Case Studies of Thai LSPs

1
Ph.D.’s Degree Program in Industrial Engineering, Department of Industrial Engineering, Faculty of Engineering, Chiang Mai University, Chiang Mai 50200, Thailand
2
Center of Excellence in Logistics and Supply Chain Management, Chiang Mai University, Chiang Mai 50200, Thailand
3
Department of Industrial Engineering, Faculty of Engineering, Chiang Mai University, Chiang Mai 50200, Thailand
*
Author to whom correspondence should be addressed.
Sustainability 2020, 12(6), 2394; https://0-doi-org.brum.beds.ac.uk/10.3390/su12062394
Submission received: 13 February 2020
/
Revised: 12 March 2020
/
Accepted: 13 March 2020
/
Published: 19 March 2020
(This article belongs to the Special Issue Industry 4.0 for SMEs - Smart Manufacturing and Logistics for SMEs)
Abstract
:Improving service logistics is crucial in order to reciprocate customer needs. The paper aims to validate the Logistics Service Provider (LSP) Lifecycle Model for re-designing logistics service in three LSP case studies in Thailand. The lifecycle-stage evaluation was adapted to identify the current status in its lifecycle. Afterward, logistics service strategies were implemented according to the voice of the customer by Quality Function Deployment (QFD). The study combined the Logistics Service Provider (LSP) Lifecycle Model with the application of Industry 4.0 (I4.0) to improve service logistics. Case studies showed the implementation of the service logistics strategies with the feasibility solution of Industry 4.0.
1. Introduction
Global enterprises fulfill customer satisfaction with trust and royalty [1,2]. The service sector is extremely significant in this competition [3,4]. In addition, the Logistics Service Provider (LSP) has become a role for smoothing cooperation, progressing association, and improving the value-added throughout the entire supply chain [5,6]. After the Industrial Revolution, LSPs have been essential to managing the supply chain in the global economy. It is a task for LSPs to offer what customer needs to compete in the service outsourcing that has arisen around the world [7]. Service innovation and efficiency improvement are needed to respond to the complexity of customer requirements [8]. The LSP Lifecycle Model was created to improve customer satisfaction throughout the whole lifecycle of the logistics services, comprising such states of the lifecycle as design, test, logistics operation, after-sales service, service evaluation, and decomposition. There are three phases [9]: the Beginning of Life (BOL), the Middle of Life (MOL), and the End of Life (EOL) [10]. The evaluation is needed to classify the phase of logistics service, which can be recognized to improve logistics services. The development and re-designing are important parts for examining service innovation in response to customer needs [11]. Quality Function Deployment (QFD) is a well-known methodology for design and re-design to acknowledge customer requirements [12,13,14]. Yet, implementing QFD with LSPs for re-designing appropriate services in order to extend the service lifecycle is questionable and, indeed, challenging. Customer satisfaction can be recorded as Customer Requirements (CRs), which is translated into Engineering Characteristics (ERs) to offer what customer needs [15,16]. Logistics service can be improved or develop new service from the Voice of Customer (VOC) [14,17,18,19,20].
Whilst the LSPs’ end-customer lifestyles have changed due to technological advancement, their requirements have become more complicated and sophisticated than ever before. On-demand delivery, real-time information, and Circular Economy (CE) [21] are now among the basic customer requirements. Furthermore, customer behavior has changed too. Quick and immediate responses are expected. Information Technology (IT) has been increasingly used in the global business to satisfy the customer in terms of supply [22,23]. Today, Industry 4.0 is being used to accomplish the customer target, operation, and improvement in manufacturing [24,25]. Some examples of the advancement of Industry 4.0 are applying to self-learning automation, big data analytics, real-time information, Internet of Things (IoT), and smart sensors [26,27]. This improvement expands to the logistics industry in the form of, for example, on-demand delivery which offers an abrupt response to the customer [28,29]. The trend has changed rapidly around the world and the logistics service is demanded to support it. Therefore, LSPs need to innovate and create new service to address these complicated customer trends [30]. This paper demonstrates the use of the LSP Lifecycle Model to re-design the logistics service using three case-study LSPs in Thailand. It aims to address the research questions of whether the developed LSP Lifecycle Model is valid and if the Industry 4.0 concept is applicable and can be beneficial for LSPs. Firstly, the study identified the stage of the service. Secondly, services were re-designed using QFD. Thirdly, customer requirements were prioritized using the Multiple-Criteria Decision-Making (MCDM) tool. Finally, the Industry 4.0 concept was mapped to address these demands.
2. Literature Review
The goal of this literature review is to review if the LSP Lifecycle Model can be integrated with the Industry 4.0 concept. Whilst the Industry 4.0 is common and recognized to be beneficial to the industry and manufacturing sectors, the solid approach in logistics sectors is otherwise. In addition to maintaining service quality [31,32] and a standardized management system [33], re-designing the logistics service is required to extend its lifecycle.
2.1. LSP Lifecycle Model
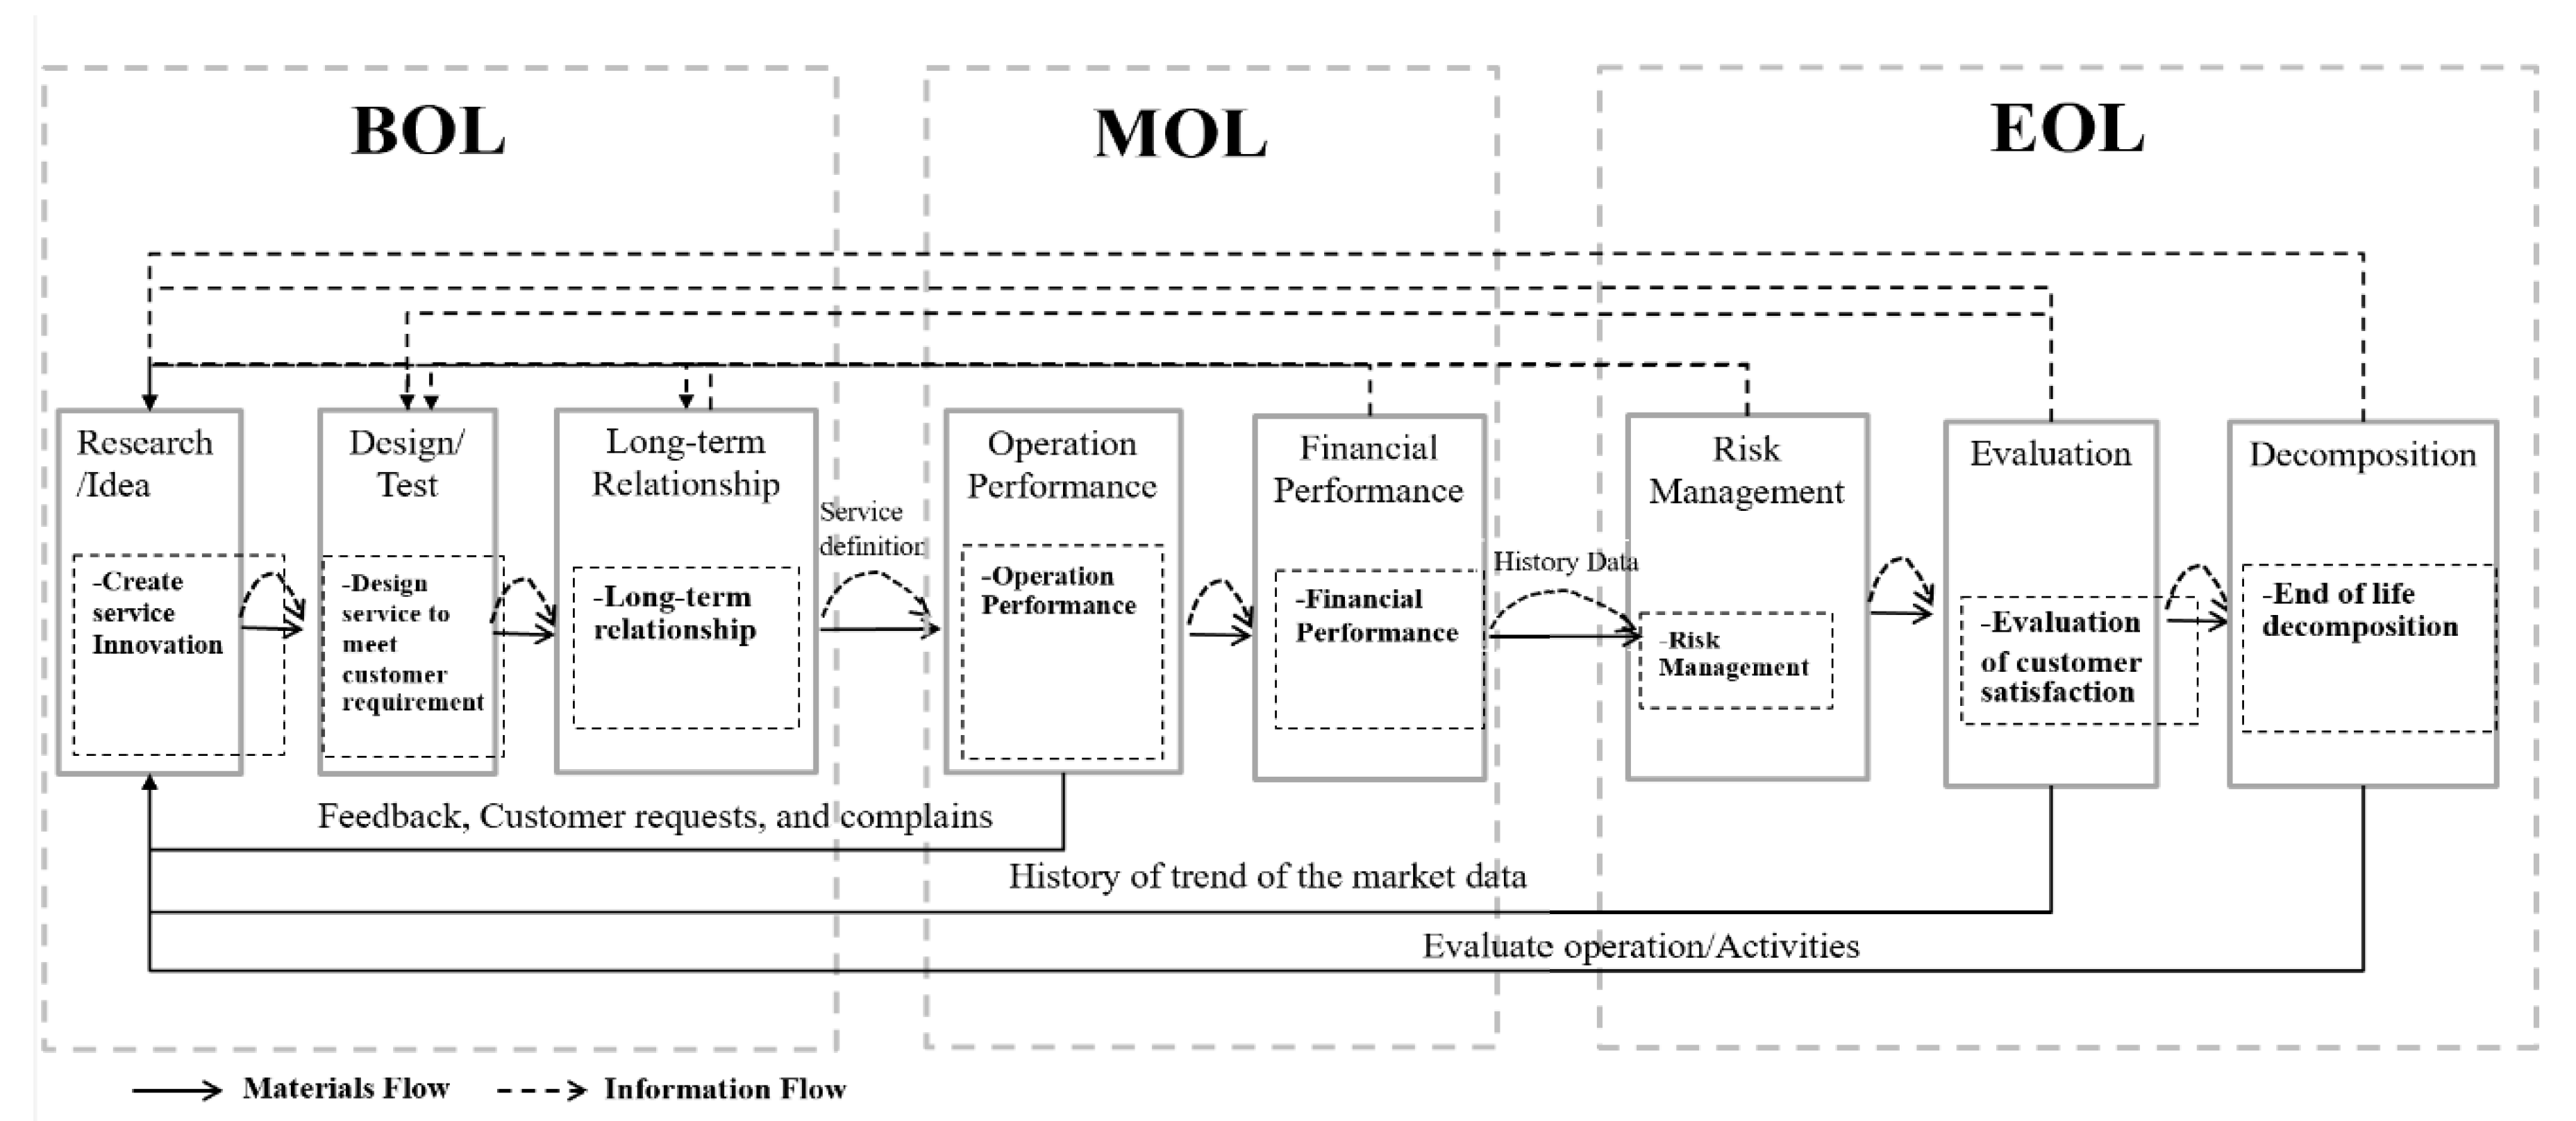
LSPs play an important role in smooth operation and increasing the value-added in supply-chain management [34]. LSPs must satisfy customer requirements by collecting and analyzing data and managing the operations to resolve problems and to develop services that can support the whole lifecycle. The complexity of the logistics service is separated into activities which are based on what LSPs attempt to offer to match the customer needs. The level of party LSP is determined based on a set of characteristics that correspond to five levels, namely, 1PL, 2PL, 3PL, 4PL, and 5PL [10]. The level of service and commitment are incremental to the level of cooperation and adaptation of IT [35,36]. Agility is a highly important determinant of impressing the target group. The LSP Lifecycle Model cooperates with the physical flow (material flow) and information flow throughout each phase from forward and backward. The LSP Lifecycle Model is created by combing the logistics service characteristics of the entire lifecycle to fulfill customer requirements. The model comprises of three lifecycle phases: the Beginning of Life (BOL), the Middle of Life (MOL), and the End of Life (EOL). Creating and designing the logistics service is the first stage of implementing a new service to satisfy the customers [37]. Collecting and analyzing information data can assist in accommodating all of the requirements and lead to suggestions for service innovation. Evaluation and decomposition are the last phases of improving the service to satisfy customer needs throughout the lifecycle (see Figure 1).
2.2. Industry 4.0
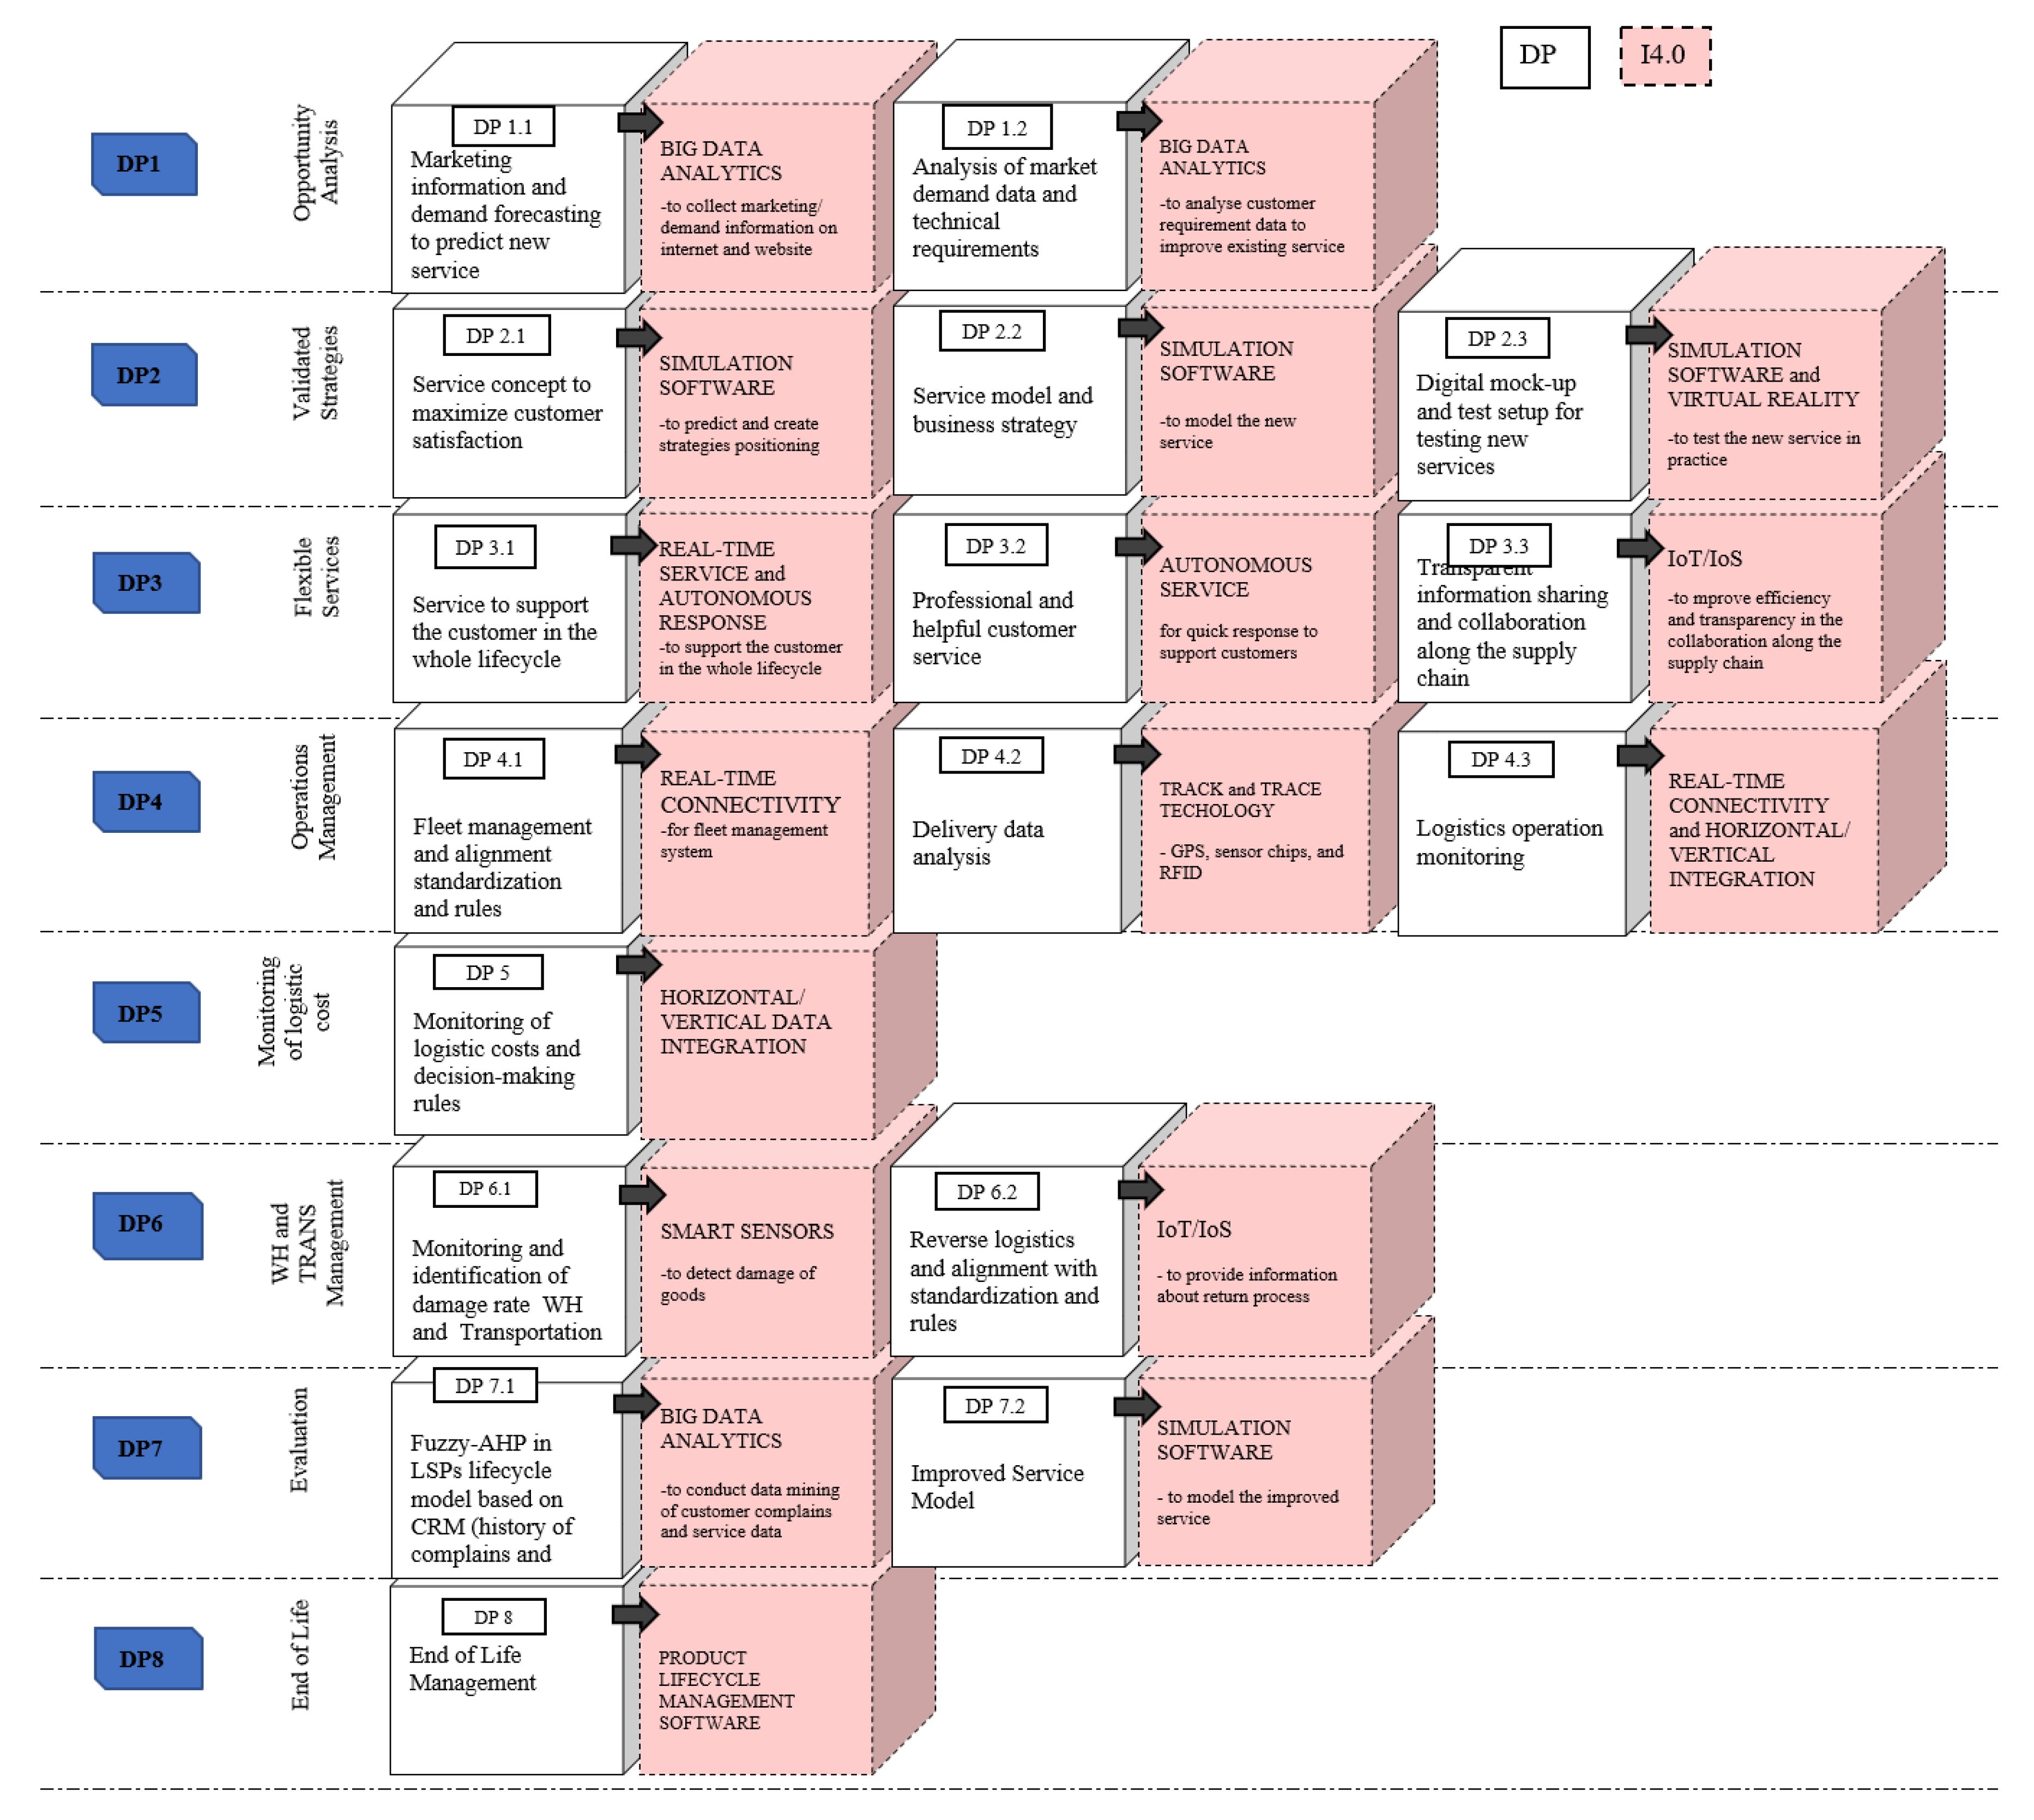
Information Technology (IT) has been widely applied in manufacturing and the supply chain [22,23]. Industry 4.0 (I4.0) was first recognized in 2011 for progressing high-technology to advance the competitiveness in quality, cost, operation, and risk [38,39,40,41]. Supporting quick response, the phenomenon to offer customer satisfaction through “the right product at the right time and suitable cost” is now compulsory. The attractiveness of I4.0 is influenced by self-automation, Artificial Intelligence (AI), virtual technology, and real-time information [42]. Demand prediction and sales forecasting are examples of how to address customer expectations [43]. The main segments of I4.0 consist of Cyber-Physical Systems (CPSs), Internet of Things (IoT), Internet of Service (IoS), and smart factories or smart manufacturing. Real-time information, track, and trace technology are imperative parts of the logistics service, leading to trust and loyalty in the business market. Axiomatic Design and I4.0 were adapted to create service innovation using the LSP Lifecycle Model which creates new activities [44]. Figure 2 shows the strategies created based on I4.0 through the entire lifecycle of the logistics service. Figure 2 presents the Design Parameters (DP) in the Axiomatic Design, responding to customer need based on the LSP Lifecycle Model [44].
3. Methodology
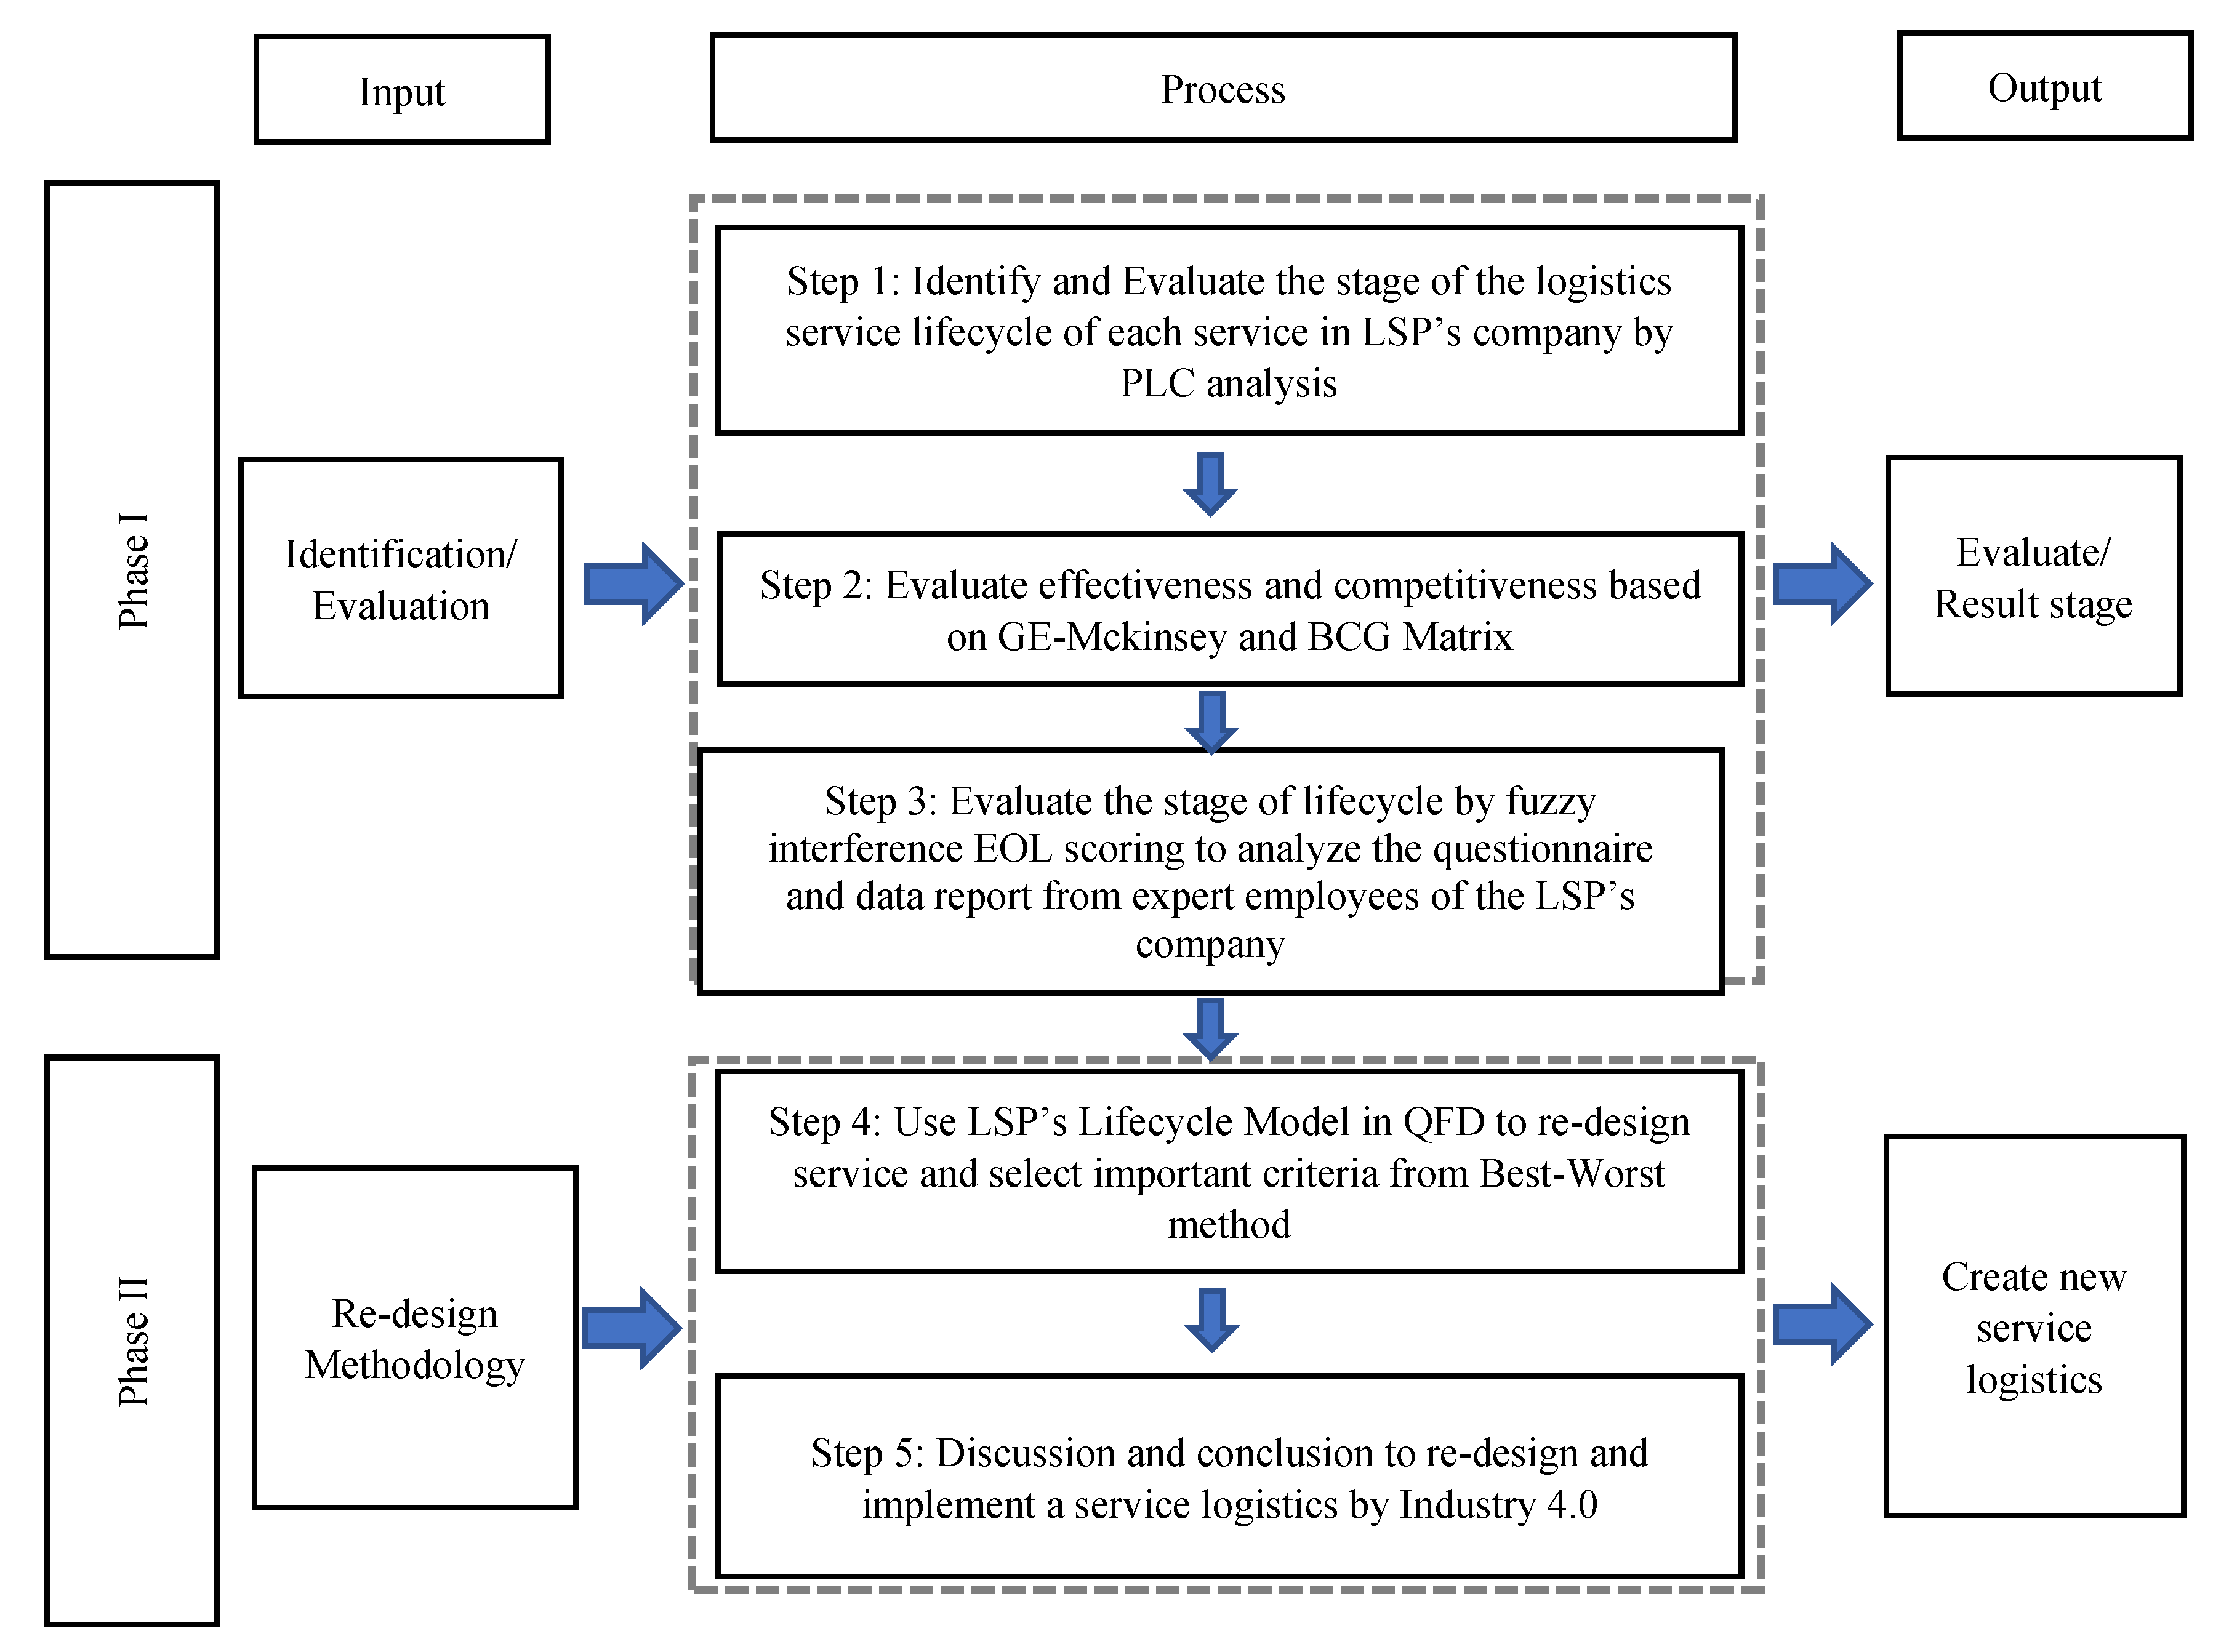
This section examines the two phases of the research methodology (see Figure 3). The first phase identified and evaluated the stage of the logistics service lifecycle. The second phase was the validation of the LSP Lifecycle Model. The study selected three case-study LSPs in Thailand.
3.1. Phase I: Identification and Evaluation of the Lifecycle
The identification and evaluation of logistics service lifecycles involve recognizing the “As-Is” status of the product or service from the current status. “As-Is” is imperative in finding the correct way to be competitive in the global market [45,46]. A stage of the lifecycle can be evaluated using Production Lifecycle Analysis (PLC Analysis), Pareto analysis, and matrix analysis to estimate the current status of the lifecycle.
- Step 1.
- PLC Analysis: The analysis consists of four stages of the lifecycle: introduction, growth, maturity, and decline. These four stages are analyzed in the market size, prime cost, profits, target customer, competitor, marketing strategy, product variety, and selling price.
- Step 2.
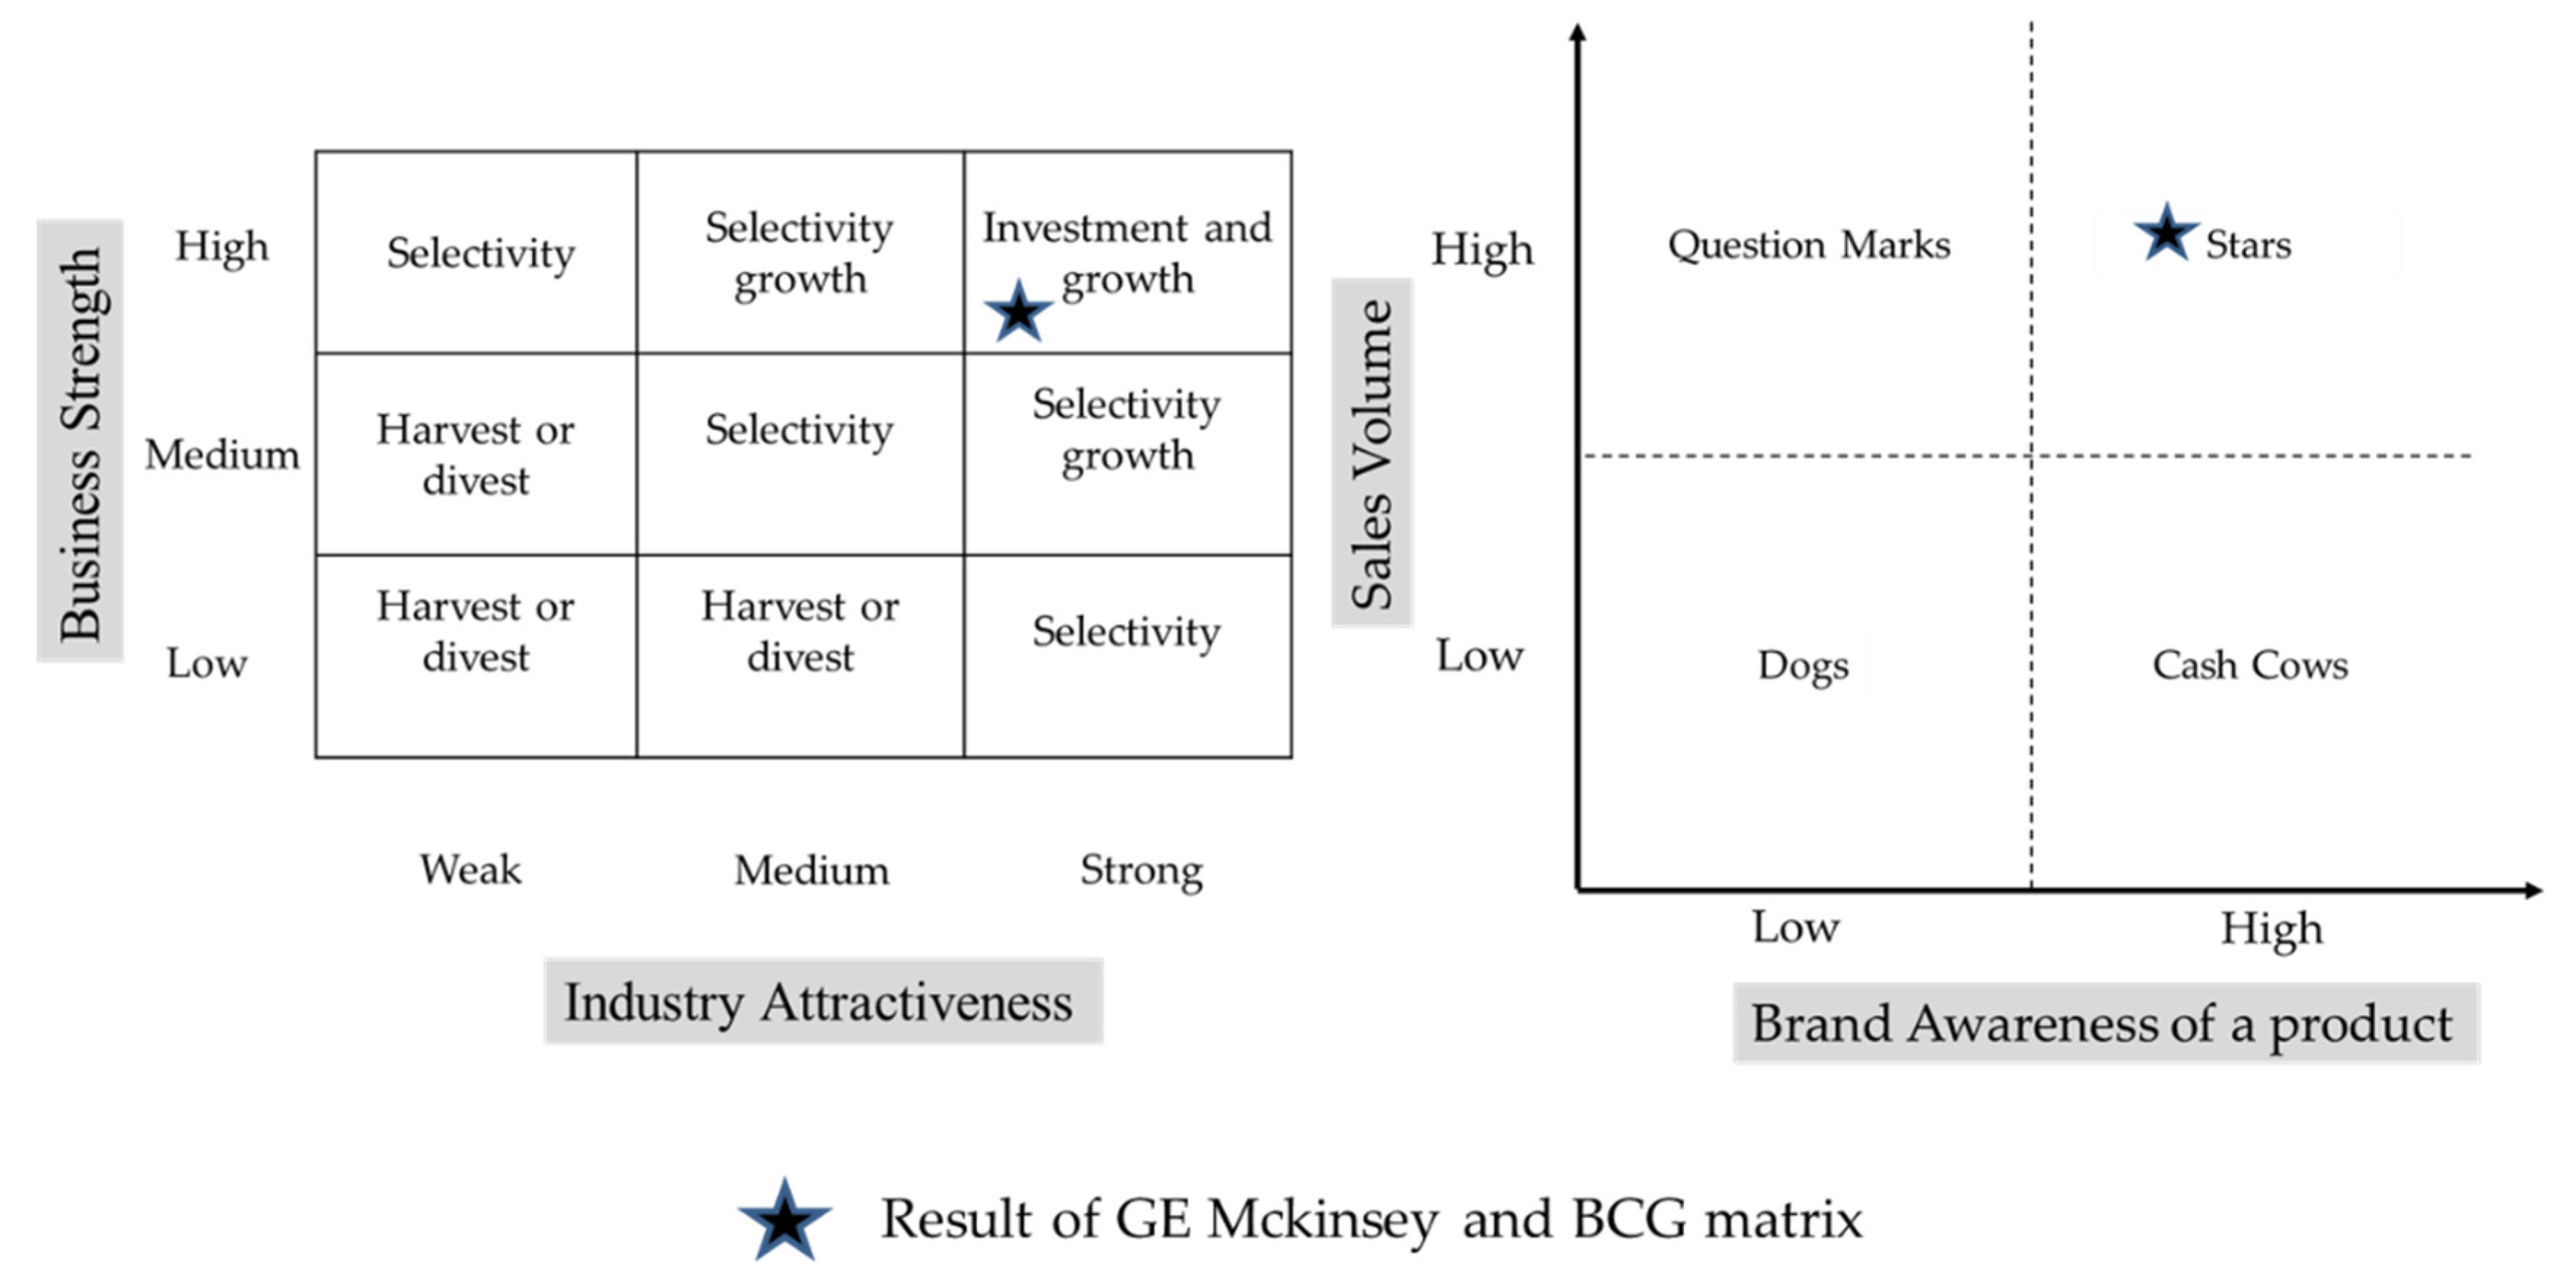
- Matrix Analysis for qualitative evaluation: The effectiveness and competitiveness of the service are evaluated. GE-Mckinsey and BCG matrix can be used to estimate the target-market in business [47]. GE-Mckinsey matrix can evaluate the performance of product transition point by industry attractiveness (x-axis) and business strength (y-axis). It shows if any are weak, medium, or strong. BCG matrix has four fields in the market: question marks, dogs, stars, and cash cows. Question marks (problem child) products are those of high growth in the market but low in the market share. This field appears for new products to launch in the market. Dogs represent a low-growth product and low market share. This field is low-profit but normally is highly produced with high inventory costs. The company should get rid of this product. Cash-cow products are the products with a high market share in the slow-growing environment. This field can be a high-profit product but the company must determine if their product is mature in the market. The company should either improve or re-design these products to respond to customer requirements. Star products are those with high market demand in the rapid-growth industry. The company needs these products.
- Step 3.
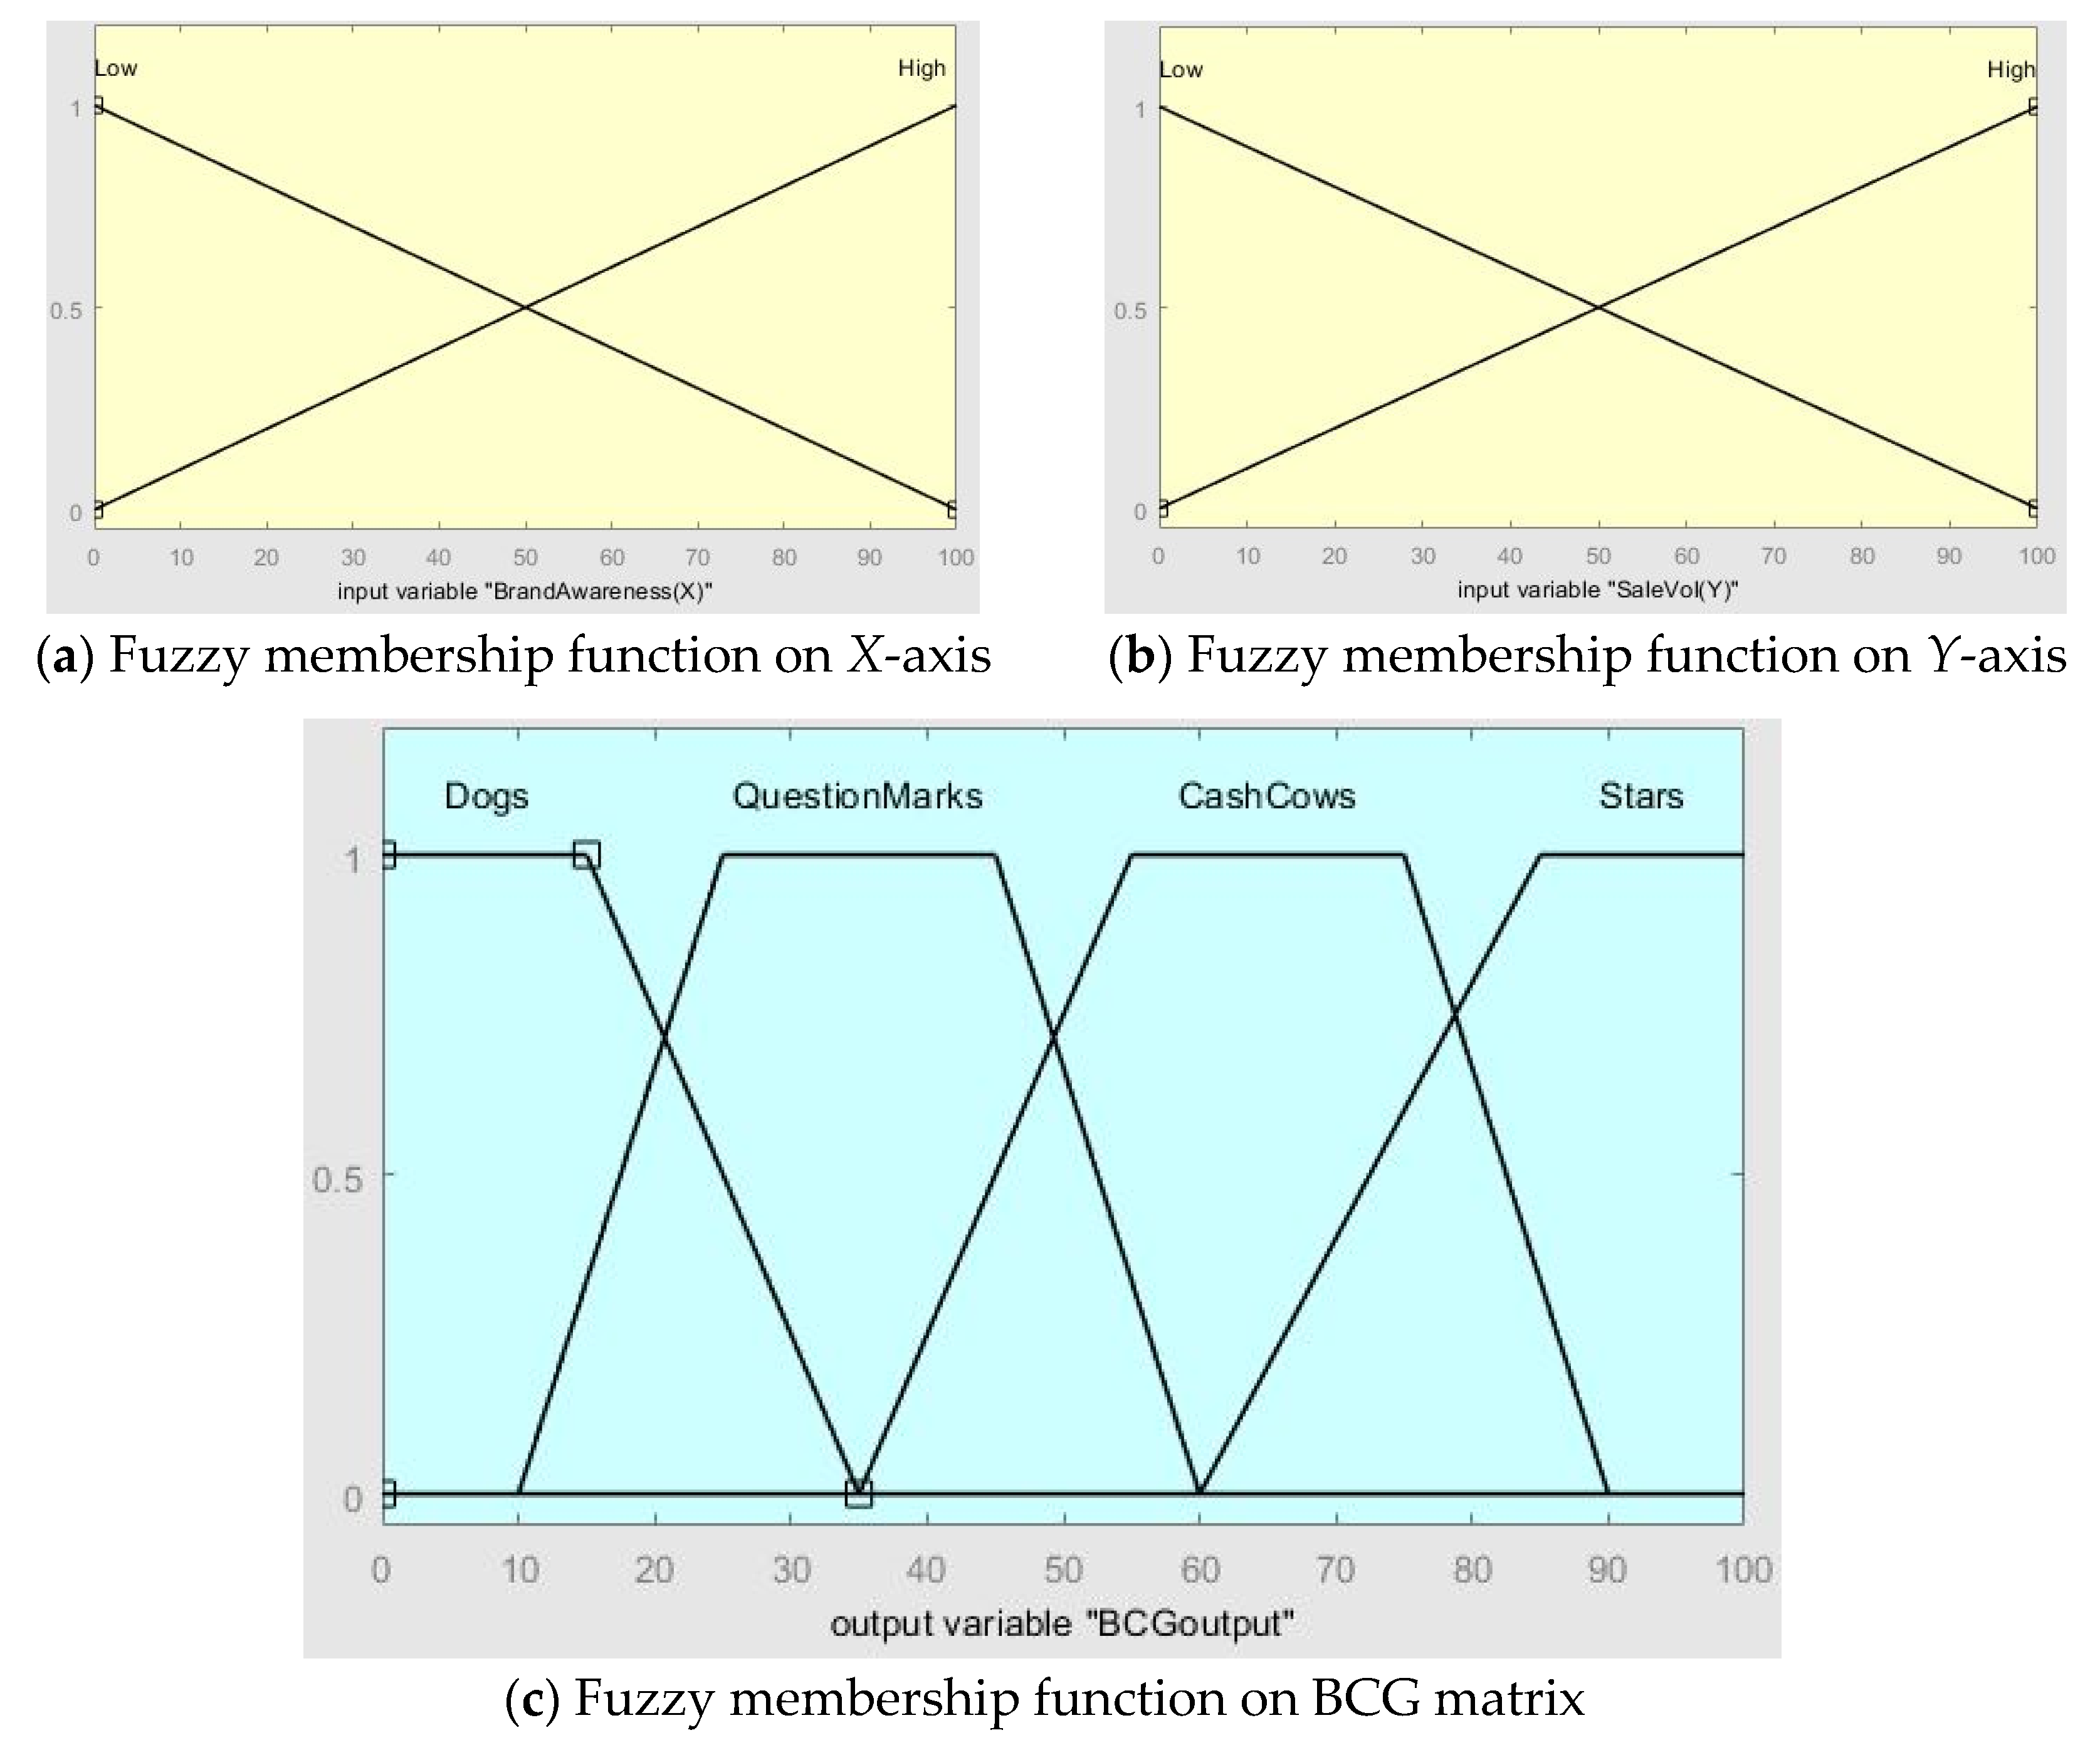
- Fuzzy Inference model: Qualitative information can be extracted from previous steps to quantify numbers using fuzzy logic. Fuzzy logic consists of three steps: fuzzification, rule evaluation, and defuzzification. The Fuzzy Inference model processes three main inputs: fuzzy of the BCG matrix, fuzzy of the GE matrix, and fuzzy of the EOL scoring. At first, the fuzzification determines the quantitative input as a value of 0 or 1. The membership function is to define the graph of the fuzzy set. For example, a fuzzy graph for the BCG matrix shows brand awareness on X-axis and sale volumes on Y-axis. Figure 4 shows the membership function on the BCG matrix, which separates 2 levels on X-Axis and Y-axis; low and high (Figure 4a,b). The second step, “If…Then rules,” shows “If…Then rules” to find the relationship of the service. The last step, defuzzification, is used to evaluate and find the numerical values of the membership, using center of gravity techniques to compute defuzzification, namely, dogs, question marks, cash cows, and stars (Figure 4c). The evaluation of EOL scoring combines the analytics of the BCG matrix (X-axis) and the GE matrix (Y-axis) to classify the stage of logistics service.
The identification and evaluation of logistics service is a key part to detecting the current status and positioning in the global market. This information is vital to improving and developing service that meets customer requirements and strengthens loyalty.
3.2. Phase II: Re-Designing Logistics Service
After identifying the stages of the logistics service, the selected logistics service in maturity and decline stages is then used as the case of re-design. The adaptation of the Best-Worst Method is for reflecting customer requirements and interest (Step 4). In Step 5, service is re-designed based on customer requirements using QFD and the application I4.0 in technical requirements.
3.2.1. Step 4: Best-Worst Method
Best-Worst method (BWM) is a recent Multi-Criteria Decision-Making (MCDM) method, developed to reduce the complexity of pairwise criteria in the AHP (Analytic Hierarchy Process) method [48,49,50,51,52,53]. Compared to AHP, BWM uses less comparison (BWM= 2n − 3, AHP= n(n − 1)/2), yet the consistency is better [48,54]. BWM is used to solve various problems, namely, supplier selection [55], location selection [50,53,56], service quality improvement [57], product design selection [49,58,59], supply-chain management [60], and performance evaluation [52,61]. BWM allows the decision-maker to select the best and the worst criteria to be transformed into the weight of each criterion using linear programming.
3.2.2. Step 5: Quality Function Deployment (QFD)
QFD is a famous product design technique that considers whether to address customer requirement and improve product quality or reduce costs and time [62,63,64,65]. The method translates “Voice of Customer” (VOC) or Customer requirement (CRs) into Engineering Characteristics (ECs) to create Design Requirements (DRs) for each phase of product development and production [64,65]. QFD adapts the CRs within the product to improve the quality of products, reduce time, costs, resources, and control the capability of production. Complete QFD consists of four phases: the product planning matrix, the part planning matrix, the process planning matrix, and the production/operation planning matrix. Information is required for both forward and backward data to develop a traceability method in all of the various phases [66]. VOC (WHATs) is combined with quality characteristics (HOWs) to create new products or to estimate costs and quality of production. This paper uses QFD to improve the matured or declined service by re-designing an appropriate lifecycle transition. VOC is defined from internal and external requirements and the service lifecycle requirement of what the customer needs [16].
4. LSP Companies and Service Re-Design: Case Study
In 2019, LSPs in Thailand have grown by 7–9% YoY according to the report from the Kasikorn Research Center [67]. This paper summarizes the results of three case studies of small, medium, and large LSP companies in Thailand. The companies provide several logistics services from local and national-wide transportation to moving services in the city area. The results of the identification and evaluation stages of the lifecycle (Step 1) are shown in Table 1. The results will be discussed in the following section. Then, the developing service logistics (Step 2) is described.
4.1. Case Study 1: Small Moving Service LSP
Case study 1 is a small LSP in the North of Thailand. The company offers a moving service which can be for office, house, or exhibition. Target groups are local customers, for example, students, schools, and offices in the Chiang Mai area. The questionnaire was answered by a senior manager in the company.
4.1.1. Identification and Evaluation Stage of the Lifecycle: Case Study 1
The results of the PLC analysis shows that the service is at the growth stage due to positive customer feedback and constant sales growth. The service is highly profitable and there are few competitors in the market. In addition, the company has a strong market strategy that guarantees package delivery. The company also offers a variety of services to fulfill customer requirements. Figure 5 shows the company is positive in the GE-Mckinsey matrix. The service is in the Investment/Growth stage due to the business strength stemming from the fully equipped moving service compared to other competitors. The service attractiveness is also high due to the demand in the exhibition market. Home and office movings are also growing as a result of the urbanization trend. The GE score is 77.31, which shows the attractiveness of this moving business. The service is in the stars stage in the BCG matrix due to high sales volume and brand awareness based on the history of the business. This service and business unit are spun off from the LSP mother company, providing service since 1988. The BCG score is 57.82. From these evaluations, it is found that the stage of the lifecycle of this service is in the medium stage, with an EOL score of 61.15. The results show the company responds well to customer needs in the industry (see Table 1).
4.1.2. Service Re-Design: Case Study 1
To improve the service by fulfilling customer requirements, the evaluation of the factor is conducted using the BWM (weight scale 1–9). The factors are prioritized from most to least important in Table 3. Design service to meet customer requirement criteria is the most significant criterion. The least important criterion is the evaluation of customer satisfaction. It leads to optimized weight for main attributes, shown in Table 2 and Table 3.
Table 4 illustrates the scores on the Important Rate (IMP), analyzed by the BWM, which are allocated in QFD. The concern is in creating and re-designing the service to respond to customer needs. The aim is to build up loyalty by offering tracking service after sales, which will support fulfilling and delivery service. The high competition in the moving market is the main part that needs innovation. I4.0 suggests the following tools: text response, real-time tracking, and real-time monitoring of moving operation. This will help the customer to manage their plans easily. Moreover, IT is adapted to replace paper and to increase customer satisfaction. Engineering Characteristics and target setting are shown in Table 5.
4.2. Case Study 2: Courier Service Provider
Case study 2 is a medium-sized LSP offering courier services. The company uses passenger buses to move passengers and parcels within the routes mostly in the North of Thailand. The prominent point of the company is the specific route and time, which the customer can use to specify the departure and arrival times. The service of interest is parcel service. Targeted customers are local businesses, people, students, and hospitals. The questionnaire was answered by a senior manager of the company.
4.2.1. Identification and Evaluation Stage of the Lifecycle: Case Study 2
The service is identified and evaluated as a growth stage due to the continuous growth of sales and profit. The service is strong with the strategy of on-time delivery and flexibility of service, from agriculture products to motorcycles. The GE-Mckinsey matrix shows that the service is at the selective-growth stage. Business strength is medium due to the limitation of vehicles and its fixed route. The customer can pick the delivery up at the station only. Industry attractiveness is at the high stage due to the popularity of e-commerce. The service area is specific to its northern route. Thus, the parcel can be delivered quickly. For the BCG matrix, the service is in the question mark stage. Sale volume is high but the brand awareness of the product is low because of several competitors in the market, both domestic and overseas. The price is the key factor. From these evaluations, the service is considered to be at the medium stage of its lifecycle. Details are shown in Table 1.
4.2.2. Service Re-Design: Case Study 2
To improve service, fulfillment is suggested. The focus is to enhance the delivery service (see Table 5). A long-term relationship is the most important factor. Evaluation of customer satisfaction and financial performance are among the most important factors. The decision-maker decides to improve on these issues to gain trust and loyalty from the customer. At the start, the company will survey for suggestions and use this information to improve the service. I4.0 is applied by developing the website. Evaluation and improving service is highly recommended to increase customer satisfaction. The data can be collected from several available platforms such as social media. The feedback data is a critical part of re-designing the service. For example, if tracking is not online and updated on the platform, the customer cannot check the delivery status. GPS and RFID can be used to address the issue. Then the customers will be able to access real-time information. On-time delivery will be possible to satisfy customer expectations; the customer should be able to access real-time information. In addition, parcel tracking and tracking information can be sent to the customer (via SMS), informing them when their package is due to arrive. Table 6 shows an example of the measurements to improve the service life cycle for the case-study company.
4.3. Case Study 3: Large LSP
Case study 3 is a large LSP in the North of Thailand. The company has more than 500 trucks and more than 1000 employees. The service is the delivery of mass products between Chiang Mai and Bangkok. Most of the customers in Chiang Mai are local small and medium Enterprises (SMEs) and farmers who sent their goods to Bangkok. On the contrary, most of the products from Bangkok are industry products, shipped to wholesalers and retailers in Chiang Mai. From the surveying of the senior manager who is responsible for the company strategy, the results are as follows.
4.3.1. Identification and Evaluation Stage of the Lifecycle: Case Study 3
The service is at the maturity stage due to the market size and low prime costs. Profit is high but is declining. Selling price is competitive-edged but it cannot be reduced because there is not much profit. The GE-Mckinsey matrix suggests that the service is at the selectivity growth stage. Industry attractiveness is at the middle stage. As a result, this business may face a lot of competition. Business strength is at a high level due to the variety of vehicles such as trucks and trailers, as well as a refrigerated container which can cater to a larger variety of customer requirements. The BCG matrix identifies the service at the cash cow stage. BCG(X) shows the middle volume of sales but BCG(Y) shows high brand awareness because the company has been in business for a long time and has gained loyalty from their customers. Identification and evaluation showed that the stage of the lifecycle is medium. Details are shown in Table 1.
4.3.2. Service Re-Design: Case Study 3
The improvement to satisfy the customer is significant and the data is suggesting that the company should re-design its delivery service. From BWM, long-term relationship criterion is the most important one. The least important criterion is end of life decomposition. Table 7 shows an example of CRM implementation for the case-study company.
5. Discussion
The study confirms the significance of technology advancement in business competitiveness. In the case of logistics management, Industry 4.0 can fulfill the needs of Smart Logistics [42,68,69,70]. However, in the case of LSPs, limited research has clearly demonstrated the benefits of implementing the Industry 4.0 concept [71,72], especially for re-designing service to accommodate customer needs depending on their lifecycle stages.
It can be seen from the case studies that the Industry 4.0 concept can be applicable for re-designing logistics services. With different growth stages and business strengths, the lifecycle stage of the service can be identified. As a result, a suitable measurement can be suggested based on customer requirements and technology readiness. Industry 4.0 tools, such as IoT, Big Data Analytics, and Virtual Technology, are found to be supportive if the LSP wishes to accommodate their customers. This will increase their competitiveness in the highly ambitious market. The implementation can be costly and complicated [73], however further study must be conducted to determine if the measures are feasible.
6. Conclusions
In the Fourth Industrial Revolution, the customers require high-quality service from LSPs. Service innovation is an important tool to compete in the world economy. This paper identified and investigated each stage of the LSP service re-design. In the first step, the status of a lifecycle state was evaluated using PLC analysis, Pareto analysis, matrix analysis (GE, BCG matrix), and fuzzy interference. The second step re-designed the matured services for attaining customer satisfaction. QFD was used to create and re-design logistics services. In the significant evaluation of criteria, BWM was applied to estimate the important criteria in LSP’s Lifecycle Model that had eight criteria. The paper showed the results from three logistics services which were at the maturity stage and that each company needed Industry 4.0 to improve their service quality. For case study 1, the most important factor was to design service that meets customer requirements. To create new service and increase information, responsiveness is an important factor to advance their operations. There are available tools of Industry 4.0 to address these issues such as simulation, virtual technology, horizontal/vertical data integration, and Big Data Analytics. As a result, the new service can be modeled and tested. The costs can be reduced. Data can be analyzed to improve the existing service to meet customer requirements. For case study 2, on-time delivery was the main point of competitiveness in the business. A long-term relationship was also the main interest. Therefore, it was suggested that the service data should be used and analyzed in order to improve service. The data should also be shared with the customers to improve their satisfaction. For case study 3, the main focus was concerned with CRM initiation. Fulfilling customer satisfaction to sustain their clients and to generate loyalty and trust was recommended. Here, IoT, IoS, and autonomous service are a few examples of what can be used for that purpose.
The paper shows that Industry 4.0 can be applied to re-design logistics service, but with caution. Although the developed LSP Lifecycle Model and the presented methodology can provide suggestive measures for LSP per their service requirements, there are some limitations. Whilst the first phase of identification and evaluation can give contemplative and multi-dimensional observation of the service of interest, the second phase of new service re-design can only be suggestive and the result is rather dynamic. The implementation of the measures to solidly validate the model is required, which can be even more challenging.
Author Contributions
Conceptualization, S.T., S.R., and K.Y.T.; methodology, S.T. and S.R.; validation, S.T., S.R., and K.Y.T.; formal analysis, S.T. and S.R.; investigation, S.R. and K.Y.T.; resources, S.T.; writing—original draft preparation, S.T.; writing—review and editing, S.R. and K.Y.T.; visualization, S.T.; supervision, S.R. and K.Y.T.; project administration, K.Y.T. All authors have read and agreed to the published version of the manuscript.
Funding
Horizon 2020: 734713.
Acknowledgments
This research is part of the project “Industry 4.0 for SMEs” from the European Union’s Horizon 2020 research and innovation program under the Marie Skłodowska-Curie grant agreement No 734713. This research work was partially supported by Chiang Mai University, Thailand.
Conflicts of Interest
The authors declare no conflict of interest.
References
- Nyadzayo, M.W.; Khajehzadeh, S. The antecedents of customer loyalty: A moderated mediation model of customer relationship management quality and brand image. J. Retail. Consum. Serv. 2016, 30, 262–270. [Google Scholar] [CrossRef]
- Zawadzki, P.; Żywicki, K. Smart product design and production control for effective mass customization in the industry 4.0 concept. Manag. Prod. Eng. Rev. 2016, 7, 105–112. [Google Scholar] [CrossRef]
- Christiane, H.; Hariolf, G. Innovation in the service sector: The demand for service-specific innovation measurement concepts and typologies. Res. Policy 2005, 34, 517–535. [Google Scholar]
- Kowalkowski, C.; Gebauer, H.; Kamp, B.; Parry, G. Servitization and deservitization: Overview, concepts, and definitions. Ind. Mark. Manag. 2017, 60, 4–10. [Google Scholar] [CrossRef]
- Lam, J.S.L.; Dai, J. Environmental sustainability of logistics service provider: An ANP-QFD approach. Int. J. Logist. Manag. 2015, 26, 313–333. [Google Scholar] [CrossRef]
- Costes, N.F.; Roussat, C. Supply Chain Integration: Views from a Logistics Service Provider. Supply Chain Forum 2011, 12, 20–30. [Google Scholar] [CrossRef]
- Goldsby, T.J.; Zinn, W.; Closs, D.J.; Daugherty, P.J.; Stock, J.R.; Fewcett, S.E.; Waller, M. Editional Reflections on 40 Years of the Journal of Business Logistics: From the Editors. J. Bus. Logist. 2019, 40, 4–29. [Google Scholar] [CrossRef] [Green Version]
- Alkhatib, S.F.; Darlington, R.; Yang, Z.; Nguyen, T.T. A novel technique for evaluating and selecting logistics service providers based on the logistics resource view. Expert Syst. Appl. 2015, 42, 6976–6989. [Google Scholar] [CrossRef]
- Pedrosa, A.D.M.; Blazevic, V.; Jasmand, C. Logistics innovation development: A micro-level perspective. Int. J. Phys. Distrib. Logist. Manag. 2015, 45, 313–332. [Google Scholar] [CrossRef]
- Tiwong, S.; Ramingwong, S. Lifecycle Management Model Review and Design for LSP. In Proceedings of the 2nd International Conference on High Performance Compilation Computing and Communications, Hong Kong, China, 15–17 March 2018; Volume 19, pp. 88–92. [Google Scholar]
- Ginting, R.; Ali, A.Y. Triz or DFMA combined with QFD as product design methodology: A review. Pertanika J. Sci. Technol. 2016, 24, 1–25. [Google Scholar]
- Chowdhury, M.M.H.; Quaddus, M.A. A multi-phased QFD based optimization approach to sustainable service design. Int. J. Prod. Econ. 2016, 171, 165–178. [Google Scholar] [CrossRef]
- Lam, J.S.L.; Bai, X. A quality function deployment approach to improve maritime supply chain resilience. Transp. Res. E Logist. Transp. Rev. 2016, 92, 16–27. [Google Scholar] [CrossRef]
- Harano, M.; Santoso, A.; Prayogo, D.N. How kansei engineering, kano and QFD improve logistics services. Int. J. Technol. 2017, 8, 1070–1081. [Google Scholar]
- Bolar, A.A.; Tesfamariam, S.; Sadiq, R. Framework for prioritizing infrastructure user expectations using Quality Function Deployment (QFD). Int. J. Sustain. Built Environ. 2017, 6, 16–29. [Google Scholar] [CrossRef]
- Ji, J.J.; Ying, P.; Ying, L. Prioritizing engineering characteristics based on customer online reviews for quality function deployment. J. Eng. Des. 2014, 25, 303–324. [Google Scholar]
- Kurtulmuşoğlu, F.B.; Pakdil, F.; Atalay, K.D. Quality improvement strategies of highway bus service based on a fuzzy quality function deployment approach. Transportmetrica 2016, 12, 175–202. [Google Scholar] [CrossRef]
- Yang, S.; Liu, J.; Wang, K.; Miao, Y. An Uncertain QFD Approach for the Strategic Management of Logistics Services. Math. Probl. Eng. 2016, 2016, 1486189. [Google Scholar] [CrossRef] [Green Version]
- Ho, W.; He, T.; Lee, C.K.M. Strategic logistics outsourcing: An integrated QFD and fuzzy AHP approach. Expert Syst. Appl. 2012, 39, 10841–10850. [Google Scholar] [CrossRef]
- Lin, Y.; Pekkarinen, S. QFD-based modular logistics service design. J. Bus. Ind. Mark. 2011, 26, 344–356. [Google Scholar] [CrossRef]
- Fonseca, L.M.; Domingues, J.P.; Pereira, M.T.; Martins, F.F.; Zimon, D. Assessment of circular economy within Portuguese organizations. Sustainability 2018, 10, 2521. [Google Scholar] [CrossRef] [Green Version]
- Rüßmann, M.; Lorenz, M.; Gerbert, P.; Waldner, M.; Justus, J.; Engel, P.; Harnisch, M. Industry 4.0: The Future of Productivity and Growth in Manufacturing Industries; Boston Consulting Group: Boston, MA, USA, 2015. [Google Scholar]
- Choi, D.; Song, B. Exploring Technological Trends in Logistics: Topic Modeling-Based Patent Analysis. Sustainability 2018, 10, 2810. [Google Scholar] [CrossRef] [Green Version]
- Wollschlaeger, M.; Sauter, T.; Jasperneite, J. The future of industrial communication automation networks in the era of the internet of things and industry 4.0. IEEE Ind. Electron. Mag. 2017, 11, 17–27. [Google Scholar] [CrossRef]
- Schumacher, A.; Erol, S.; Sihn, W. A maturity for assessing Industry 4.0 readiness and maturity of manufacturing enterprises. Procedia CIRP 2016, 52, 161–166. [Google Scholar] [CrossRef]
- Govindan, K.; Cheng, T.C.E.; Mishra, N.; Shuka, N. Big data analytic and application for logistics and apply chain management. Transport Res. E-Logist. 2018, 114, 343–349. [Google Scholar] [CrossRef]
- Ivanov, D.; Dolgui, A.; Sokolov, B. The impact of digital technology and Industry 4.0 on the ripple effect and supply chain risk analytics. Int. J. Prod. Res. 2019, 57, 829–846. [Google Scholar] [CrossRef]
- Zhang, Y.; Liu, S.; Liu, Y.; Li, R. Smart box-enabled product-service system for cloud logistics. Int. J. Prod. Res. 2016, 54, 6693–6706. [Google Scholar] [CrossRef]
- Silva, V.L.D.S.; Kovaleski, J.L.; Pagani, R.N. Technology transfer in the supply chain oriented to industry 4.0: A literature review. Technol. Anal. Strateg. 2019, 31, 546–562. [Google Scholar] [CrossRef]
- Tao, F.; Cheng, J.; Qi, Q.; Zhang, M.; Zhang, H.; Sui, F. Digital twin-driven product design, manufacturing and service with big data. Int. J. Adv. Manuf. Technol. 2017, 94, 3563–3576. [Google Scholar] [CrossRef]
- Clegg, B.; Kersten, W.; Koch, J. The effect of quality management on the service quality and business success of logistics service providers. Int. J. Qual. Reliab. Manag. 2010, 27, 185–200. [Google Scholar]
- Kilibarda, M.; Zečević, S.; Vidović, M. Measuring the quality of logistic service as an element of the logistics provider offering. Total Qual. Manag. Bus. Excell. 2012, 23, 1345–1361. [Google Scholar] [CrossRef]
- Zimon, D.; Madzik, P.; Sroufe, R. Management systems and improving supply chain processes: Perspectives of focal companies and logistics service providers. Int. J. Retail Distrib. Manag. 2020, in press. [Google Scholar] [CrossRef]
- Liu, C.L.; Lee, M.Y. Integration, supply chain resilience, and service performance in third-party logistics providers. Int. J. Logist. Manag. 2018, 29, 5–21. [Google Scholar] [CrossRef]
- Drakovic, M. Organization of outsourcing in logistics partnership between the seaports of Montenegro and Slovenia. MJSS 2013, 9, 93–113. [Google Scholar]
- Talty, M.; Moutmihi, M. From the logistics function to the logistics service: A literature Review. GJMBR 2015, 15, 1–7. [Google Scholar]
- Matt, D.T.; Rauch, E.; Fraccaroli, D. A Three level model for the design, planning and operation of changeable production systems in distributed manufacturing. In Proceedings of the 5th International Conference on Changeable, Agile, Reconfigurable and Virtual Production (CARV 2013), Munich, Germany, 6–9 October 2013; pp. 23–28. [Google Scholar]
- Ford, M. Rise of the Robots: Technology and the Threat of a Jobless Future, 1st ed.; Basic Books: New York, NY, USA, 2015. [Google Scholar]
- Hermann, M.; Pentek, T.; Otto, B. Design Principles for Industrie 4.0 Scenarios. In Proceedings of the 2016 49th Hawaii International Conference on System Sciences (HICSS), Koloa, HI, USA, 5–8 January 2016; pp. 3928–3937. [Google Scholar]
- Jabbour, A.B.L.D.S.; Jabbour, C.J.C.; Filho, M.G.; Roubaud, D. Industry 4.0 and the circular economy: A proposed research agenda and original roadmap for sustainable operations. Ann. Oper. Res. 2018, 270, 273–286. [Google Scholar]
- Kaipia, R.; Turkulainen, V. Managing integration in outsourcing relationships—The influence of cost and quality priorities. Ind. Mark. Manag. 2017, 61, 114–129. [Google Scholar] [CrossRef] [Green Version]
- Hofmann, E.; Rüsch, M. Research paper Industry 4.0 and the current status as well as future prospects on logistics. Comput. Ind. 2017, 89, 23–34. [Google Scholar] [CrossRef]
- See-To, E.W.K.; Ngai, E.W.T. Customer reviews for demand distribution and sales nowcasting: A big data approach. Ann. Oper. Res. 2018, 270, 415–431. [Google Scholar] [CrossRef]
- Tiwong, S.; Rauch, E.; Šoltysová, Z.; Ramingwong, S. Industry 4.0 for Managing Logistic Service Providers Lifecycle. In Proceedings of the 13th International Conference on Axiomatic Design (ICAD 2019), Sydney, Australia, 18–20 October 2019. [Google Scholar]
- Shen, L.; Zhou, J.; Skitmore, M.; Xia, B. Application of a hybrid Entropy–McKinsey Matrix method in evaluating sustainable urbanization: A China case study. Cities 2015, 42, 186–194. [Google Scholar] [CrossRef] [Green Version]
- Oh, J.; Han, J.; Yang, J. A fuzzy-based decision-making method for evaluating product discontinuity at the product transition point. Comput. Ind. 2014, 65, 746–760. [Google Scholar] [CrossRef]
- Oh, J.; Yang, J.; Lee, S. Managing uncertainty to improve decision-making in NPD portfolio management with a fuzzy expert system. Expert Syst. Appl. 2012, 39, 9868–9885. [Google Scholar] [CrossRef]
- Brunelli, M.; Razaei, J. A multiplicative best-worst method for multi-criteria decision making. Oper. Res. Lett. 2019, 47, 12–15. [Google Scholar] [CrossRef]
- Gupta, H.; Barua, M.K. Identifying of technological innovation for Indian MSMEs using best-worst multi-criteria decision making method. Technol. Forecast. Soc. 2016, 107, 69–79. [Google Scholar] [CrossRef]
- Tian, Z.P.; Zhang, H.Y.; Wang, J.Q.; Wang, T.L. Green supplier selection using improved TOPSIS and Best-Worst method under intuitionistic fuzzy environment. Informatica 2018, 29, 773–800. [Google Scholar] [CrossRef] [Green Version]
- Velasquez, M.; Hester, P.T. An Analysis of Multi-Criteria Decision Making Methods. Int. J. Oper. Res. 2013, 10, 56–66. [Google Scholar]
- Razaei, J. Best-Worst multi-criteria decision making method. Omega 2015, 53, 49–57. [Google Scholar] [CrossRef]
- Safarzadeh, S.; Khansefid, S.; Barzoki, M.R. A group multi-criteria decision-making based on best-worst method. Comput. Ind. Eng. 2018, 126, 111–121. [Google Scholar] [CrossRef]
- Sadjadi, S.; Karimi, M. Best-worst multi-criteria decision-making method: A robust approach. Decis. Sci. Lett. 2018, 7, 323–340. [Google Scholar] [CrossRef]
- Aboutorab, H.; Saberi, M.; Asadabadi, M.R.; Hussain, O. ZBWM: The Z-number extension of Best Worst Method and its application for supplier development. Expert Syst. Appl. 2018, 107, 115–125. [Google Scholar] [CrossRef]
- Kheybari, S.; Kazemi, M.; Razaei, J. Bioethanol facility location selection using best-worst method. Appl. Energy 2019, 242, 612–623. [Google Scholar] [CrossRef]
- Gupta, H. Evaluating service quality of airline industry using hybrid best worst method and VIKOR. J. Transp. Manag. 2018, 68, 35–47. [Google Scholar] [CrossRef]
- Omrani, H.; Alizadeh, A.; Emrouznejad, A. Finding the optimal combination of power plants alternatives: A multi response Taguchi-neural network using TOPSIS and fuzzy best-worst method. J. Clean. Prod. 2018, 203, 210–223. [Google Scholar] [CrossRef] [Green Version]
- Maghsoodi, A.; Mosavat, M.; Hafezalkotob, A.; Hafezalkotob, A. Hybrid hierarchical fuzzy group decision-making based on information axioms and BWM: Prototype design selection. Comput. Ind. Eng. 2019, 127, 788–804. [Google Scholar] [CrossRef]
- Ahmadi, H.B.; Sarpong, S.; Razaei, J. Assessing the social sustainability of supply chains using Best Worst Method. Resour. Conserv. Recycl. 2017, 126, 99–106. [Google Scholar] [CrossRef]
- Salimi, N.; Razaei, J. Evaluating firms’ R&D performance using best worst method. Eval. Program Plan. 2018, 66, 147–155. [Google Scholar]
- Yang, L.; Xing, K. Innovative Conceptual Design Approach for Product Service System based on TRIZ. In Proceedings of the 10th International Conference on Service Systems and Service Management (ICSSSM), Hong Kong, China, 17–19 July 2013. [Google Scholar]
- Liao, C.N.; Kao, H.P. An evaluation approach to logistics service using fuzzy theory quality function deployment and goal programming. Comput. Ind. Eng. 2014, 68, 54–64. [Google Scholar] [CrossRef]
- Delice, E.K.; Güngör, Z. A new mixed integer linear programming model for product development using quality function deployment. Comput. Ind. Eng. 2011, 57, 906–912. [Google Scholar] [CrossRef]
- Franceschini, F.; Galetto, M.; Maisano, D.; Mastrogiacomo, L. Prioritization of engineering characteristics in QFD in the case of customer requirements orderings. Int. J. Prod. Res. 2015, 53, 3975–3988. [Google Scholar] [CrossRef]
- Sharma, N.; Singhi, R. Logistics and supply chain management quality improvement of supply chain process Through Vendor Managed Inventory: A QFD Approach. J. Supply Chain Manag. 2018, 7, 23–33. [Google Scholar]
- Growth of E-commerce and Logistics (in Thai). Available online: https://kasikornbank.com/th/business/sme/KSMEKnowledge/article/KSMEAnalysis/Pages/E-Commerce_Logistic.aspx (accessed on 28 December 2017).
- Barreto, L.; Amaral, A.; Pereira, T. Industry 4.0 implications in logistics: An overview. Procedia Manuf. 2017, 13, 1245–1252. [Google Scholar] [CrossRef]
- Witkowski, K. Internet of things, big data, industry 4.0—Innovative solutions in logistics and supply chains management. Procedia Eng. 2017, 182, 763–769. [Google Scholar] [CrossRef]
- Maslarić, M.; Nikoličić, S.; Mirčetić, D. Logistics response to the industry 4.0: The physical internet. Open Eng. 2016, 6, 2391–5439. [Google Scholar] [CrossRef]
- Zsifkovits, H.; Woschank, M.; Ramingwong, S.; Wisittipanich, W. State-of-the-Art Analysis of the Usage and Potential of Automation in Logistics. In Industry 4.0 for SMEs; Palgrave Macmillan: Cham, Switzerland, 2020; pp. 193–212. [Google Scholar]
- Dallasega, P.; Woschank, M.; Zsifkovits, H.; Tippayawong, K.; Brown, C.A. Requirement Analysis for the Design of Smart Logistics in SMEs. In Industry 4.0 for SMEs; Palgrave Macmillan: Cham, Switzerland, 2020; pp. 147–162. [Google Scholar]
- Ramingwong, S.; Manopiniwes, W.; Jangkrajarng, V. Human factors of thailand toward industry 4.0. Manag. Res. Pract. 2019, 11, 15–25. [Google Scholar]
Figure 1.
Interactions and relations in the Logistics Service Provider (LSP) Lifecycle Model [10]. Three lifecycle phases: BOL, Beginning of Life; MOL, Middle of Life; and EOL, End of Life.
Figure 1.
Interactions and relations in the Logistics Service Provider (LSP) Lifecycle Model [10]. Three lifecycle phases: BOL, Beginning of Life; MOL, Middle of Life; and EOL, End of Life.

Figure 2.
The implementation of Industry 4.0 (I4.0) in the LSP Lifecycle Model [44]. DP, Design Parameter.
Figure 2.
The implementation of Industry 4.0 (I4.0) in the LSP Lifecycle Model [44]. DP, Design Parameter.

Figure 3.
Phases of the research methodology. PLC, Production Lifecycle; QFD, Quality Function Deployment.
Figure 3.
Phases of the research methodology. PLC, Production Lifecycle; QFD, Quality Function Deployment.

Figure 4.
Fuzzy interference model in membership function for the BCG matrix.

Figure 5.
The analysis of GE Mckinsey and BCG matrix for Case Study 1.


Table 1.
The results of the identification and evaluation stage of the lifecycle of the case study LSP.
Table 1.
The results of the identification and evaluation stage of the lifecycle of the case study LSP.
| Service | PLC | GE (X) | GE (Y) | GE | GE Score | BCG (X) | BCG (Y) | BCG | BCG Score | EOL | EOL Score |
|---|---|---|---|---|---|---|---|---|---|---|---|
| Case Study 1 | Growth | 75 | 80 | Investment/ Growth | 77.31 | 70 | 65 | Stars | 57.82 | Medium | 61.15 |
| Case Study 2 | Growth | 70 | 55 | Selectivity/ Growth | 53.15 | 15 | 70 | Question Mark | 39.44 | Medium | 50.00 |
| Case Study 3 | Maturity | 65 | 75 | Selectivity/ Growth | 62.45 | 70 | 15 | Cash cows | 39.44 | Medium | 52.24 |
Table 2.
Comparison vectors for the best and worst criteria: Case Study 1.
| Best to Others | Create Service Innovation | Design Service to Meet Customer Requirement | Long-Term Relationship | Operations Performance | Financial Performance | Risk Management | Evaluation of Customer Satisfaction | End of Life Decomposition |
|---|---|---|---|---|---|---|---|---|
| Best Criterion: | ||||||||
| Long-Term Relationship | 4 | 1 | 3 | 5 | 2 | 8 | 9 | 7 |
| Others to Worst | Worst criterion: End of life decomposition | |||||||
| Create Service Innovation | 6 | |||||||
| Design Service to Meet Customer Requirements | 9 | |||||||
| Long-Term Relationship | 7 | |||||||
| Operations Performance | 4 | |||||||
| Financial Performance | 8 | |||||||
| Risk Management | 2 | |||||||
| Evaluation of Customer Satisfaction | 1 | |||||||
| End of Life Decomposition | 3 | |||||||
Table 3.
Optimized weight for the main criterion: Case Study 1.
| Criterion | Weights | |
|---|---|---|
| Create Service Innovation | 0.1023 | 0.0731 |
| Design Service to Meet Customer Requirements | 0.3361 | |
| Long-Term Relationship | 0.1364 | |
| Operations Performance | 0.0818 | |
| Financial Performance | 0.2046 | |
| Risk Management | 0.0511 | |
| Evaluation of Customer Satisfaction | 0.0292 | |
| End of Life Decomposition | 0.0584 |
is used as an indicator for the comparison.
Table 4.
House of Quality (HoQ): Case Study 1. IMP, Important Rate.
| Technical Requirement | IMP | BOL | MOL | EOL | ||||||
|---|---|---|---|---|---|---|---|---|---|---|
| Customer Need | Collect and Analyse Data from Customer Suggestions and Marketing data | Design and Test Service to Satisfy Customer Requirements | Implement Customer Relationship Management Initiation | Improve Efficiency of Logistics Operations | Reduce Logistics Cost | Analyse and Evaluate the Risk of Warehouse and Transportation | Evaluate and Improve Service Life Cycle | Evaluate the End of Life Cycle | ||
| BOL | Create Service Innovation | 0.1023 | 9 | |||||||
| Design Service to Meet Customer Requirements | 0.3361 | 9 | ||||||||
| Long-term Relationship | 0.1364 | 3 | ||||||||
| MOL | Operations Performance | 0.0818 | 9 | |||||||
| Financial Performance | 0.2046 | 9 | ||||||||
| EOL | Risk Management | 0.0511 | 1 | |||||||
| Evaluation of Customer Satisfaction | 0.0292 | 3 | ||||||||
| End of Life Decomposition | 0.0584 | 3 | ||||||||
| Importance of Technical Indicators | 0.92 | 3.02 | 0.41 | 0.74 | 1.84 | 0.05 | 0.09 | 0.18 | ||
| Relative Importance of Technical Indicators | 12.71 | 41.74 | 5.65 | 10.16 | 25.41 | 0.71 | 1.21 | 2.42 | ||
Table 5.
Details of service re-design and improvement: Case Study 1.
| Engineering Characteristics | Target Setting | |
|---|---|---|
| FR2. | Design and test service to satisfy customer requirements | Simulation and virtual technologies to create and test company strategies |
| FR2.1 Understand the added value for the customer in service innovation | Using simulation software to predict and create strategic positioning | |
| FR2.2 Design the new/adapted service offer | Using simulation software and other tools to model the new service | |
| FR2.3 Test the new service for practical applicability | Using simulation software and virtual reality to test the new service in practice | |
| FR4. | Reduce logistics cost | Horizontal/vertical data integration to enable sophisticated business intelligence for cost controlling, use paperless strategies to reduce cost |
| FR1. | Create service innovation | Big data analytics to collect and analyze customer requirement data and marketing demand |
| FR1.1 Identify customer requirements and opportunities to generate new service | Using Big Data Analytics to collect marketing/demand information on internet and website | |
| FR1.2 Innovate existing service to increase customer satisfaction | Using Big Data Analytics to analyze customer requirement data and evaluation data from the customer to improve existing service | |
Table 6.
Details of service re-design and improvement: Case Study 2.
| Engineering Characteristics | Target Setting | |
|---|---|---|
| FR7 | Evaluate and improve the service life cycle | Big data analytics and simulation |
| FR7.1 | Evaluate the service life cycle | Collecting Data from the branch, application online (Facebook, line) and feedback data |
| FR7.2 | Re-design and improve service after evaluation | Simulation software to model the improved service |
Table 7.
Details of service re-design and improvement: Case Study 3.
| Engineering Characteristics | Target Setting | |
|---|---|---|
| FR3 | Implement CRM initiation | Internet of Things/service and real-time autonomous service to support customer |
| FR3.1 | Focus long term partnership | Real-time service, track and trace technology for support product delivery |
| FR3.2 | Respond quickly to the customer | Autonomous service for quick response to support customers, Application Technology to offer the client |
| FR3.3 | Increase supplier relationship | Internet of Things/Service to improve efficiency and transparency in the collaboration along the supply chain (e.g., responsive information platform) |
© 2020 by the authors. Licensee MDPI, Basel, Switzerland. This article is an open access article distributed under the terms and conditions of the Creative Commons Attribution (CC BY) license (http://creativecommons.org/licenses/by/4.0/).
Share and Cite
MDPI and ACS Style
Tiwong, S.; Ramingwong, S.; Tippayawong, K.Y. On LSP Lifecycle Model to Re-design Logistics Service: Case Studies of Thai LSPs. Sustainability 2020, 12, 2394. https://0-doi-org.brum.beds.ac.uk/10.3390/su12062394
AMA Style
Tiwong S, Ramingwong S, Tippayawong KY. On LSP Lifecycle Model to Re-design Logistics Service: Case Studies of Thai LSPs. Sustainability. 2020; 12(6):2394. https://0-doi-org.brum.beds.ac.uk/10.3390/su12062394
Chicago/Turabian StyleTiwong, Sunida, Sakgasem Ramingwong, and Korrakot Yaibuathet Tippayawong. 2020. "On LSP Lifecycle Model to Re-design Logistics Service: Case Studies of Thai LSPs" Sustainability 12, no. 6: 2394. https://0-doi-org.brum.beds.ac.uk/10.3390/su12062394
Note that from the first issue of 2016, this journal uses article numbers instead of page numbers. See further details here.