Influence of the Built Environment on Community Flood Resilience: Evidence from Nanjing City, China


1
School of Architecture, Nanjing Tech University, Nanjing 211816, China
2
College of Urban and Environmental Sciences, Peking University, Beijing 100871, China
3
Ministry of Education Key Laboratory for Geographic Information Science, School of Geographical Sciences, and Institute of Eco-Chongming, East China Normal University, Shanghai 200241, China
*
Authors to whom correspondence should be addressed.
Sustainability 2020, 12(6), 2401; https://0-doi-org.brum.beds.ac.uk/10.3390/su12062401
Submission received: 31 January 2020
/
Revised: 13 March 2020
/
Accepted: 17 March 2020
/
Published: 19 March 2020
Abstract
:With the acceleration of global climate change and urbanization, many large and medium-sized cities in China have been frequently subjected to heavy rains and floods. Thus, the question of how to reduce the impact of floods and achieve rapid recovery has attracted much attention. We use the urban community as the basic unit to examine the living environment, internal facilities, and surrounding environment characteristics of six different types of communities in the Jianye District of Nanjing City. First, we use factor analysis and the binary logistic regression model to analyze pre-disaster preparation, disaster response, and post-disaster recovery. Second, we analyze the resilience of the community at different stages. Then, we explore the influencing factors of the built environment on the resilience of the community. Results show that the built-up environmental factors, such as topography, riverfront, building coverage ratio, green space rate, and land use diversity, have a significant impact on community resilience. Finally, we proposed several suggestions for improving the flood resilience of Nanjing City.
1. Introduction
Global warming and unplanned urbanization increase urban flooding events [1]. Lives and properties of urban residents have been greatly threatened. According to Columbia University’s International Earth Science Information Network Center (CIESIN), at least 233 cities out of 633 large global cities are exposed to the threat of urban flooding. Flooding causes a series of losses, such as financial deficits, housing collapses, and casualties. Hence, strategies for adapting to urban flooding must be considered, especially by a city that is prone to floods [2,3].
The severity of urban flooding is not only related to precipitation, but also affected by the built environment and vulnerability of an urban area [4,5,6]. The built environment plays an important role in community resilience. For example, impervious surface runoff will increase the risk of flooding, and low-lying roads will also cause waterlogging [7,8,9]. By contrast, green infrastructure can mitigate urban surface water flooding risk. Thus, improving the spatial layout of an impervious surface is an effective way to target green infrastructure retrofits and flooding risk reduction [10,11]. Traditionally, built environment studies were conducted in the context of travel behavior [12,13,14], health [15], and energy efficiency [16]. According to recent studies on flood-preventing constructions in Western countries, resilience from urban flooding is caused by several factors, including mixed old and new buildings [17,18], narrow public spaces [19] insufficient water-resistance of building materials [18], the lack of consideration for climate change elements in urban planning [20,21], and the natural aging of drainage systems [22]. Distance to the coast or public service facilities will also affect the perceptions of urban residents about their vulnerability to flood [23]. Given that the relationship between the built environment and disaster has been confirmed [4,24], preventive measures, such as construction of dams, serve to reduce vulnerability to flooding.
Community resilience is an increasingly employed perspective to understand and cope with disaters [25]. Although built environment remains a fundamental aspect of this resilience, its relationship with social structure is emphasized in this framework. In the context of this research, community resilience refers to strategies and actions taken to respond to actual urban flooding. From this perspective, Kim and Hastak [26] regard the built environment as the space to construct social networks. They believe that different types of built environments create different levels of social networks. Residential segregation gathers vulnerable groups in specific spaces; hence, social vulnerability has become increasingly important in disaster prevention and management [27,28,29,30]. As an important part of a green infrastructure, green space plays a role in reducing the impact of climate change on the development of human society [31,32,33]. Given this role, developed countries are more inclined to social prevention of flooding than engineering flood control, such as improving property, disaster prevention, and design and planning of urban flood control [15,21,24,34,35,36,37,38,39], as discussed by Lang et al [35]. Thus, the objective of urban planners is to improve the built environment, which is conducive to constructing a flexible community before disasters take place.
Community resilience to flooding disasters and the role of the built environment have been evaluated in different countries [40,41]. However, several shortcomings are noted in the literature. First, most previous studies were conducted at the community level with multi-dimensional variables, including economic, social, cultural, and natural variables [42,43,44]. They have rarely examined resilience from an individual perspective. Second, flooding does not occur in all places, and it can complement the assessment of resilience in areas where flooding does not occur. Most existing resilience assessments ignore the time dimension, which is necessary in the assessment of resilience from pre-disaster preparation, emergency response, and post-disaster recovery. Third, despite the fact that how the built environment influences community resilience has become crucial in dealing with urban flooding, only a few studies have been done on how the former affects the latter in fighting against flooding [4,34,45,46]. Taking China for example, from 2008 to 2010, according to the survey of waterlogging in 351 Chinese cities by the Bureau of Housing and Construction, 213 cities once suffered water logging to varying degrees, which accounted for a ratio of 62%. Moreover, waterlogging occurs over three times a year in 137 cities, including northern and western cities like Shenyang and Xi’an with drought and little rainfall [47]. Nanjing often suffers from waterlogging, especially during the rainy season. The community (Shequ) is the smallest unit of urban management in China [48,49]. With the rapid urbanization process, various types and levels of communities have emerged under China’s socialist market economy. Measuring the comprehensive level and stage characteristics of resilience in different communities is necessary. Research on Chinese cities will also be useful for other developing and transitional countries.
This work aims to address the literature gap concerning the resilience issue on the built environment under the context of flooding. Using the case of Nanjing, we aim to (1) measure the comprehensive resilience level in different types of communities, (2) evaluate the three stages of community flood resilience, (3) and identify the impact of the built environment on community flood resilience.
2. Methods
2.1. Study Area and Data
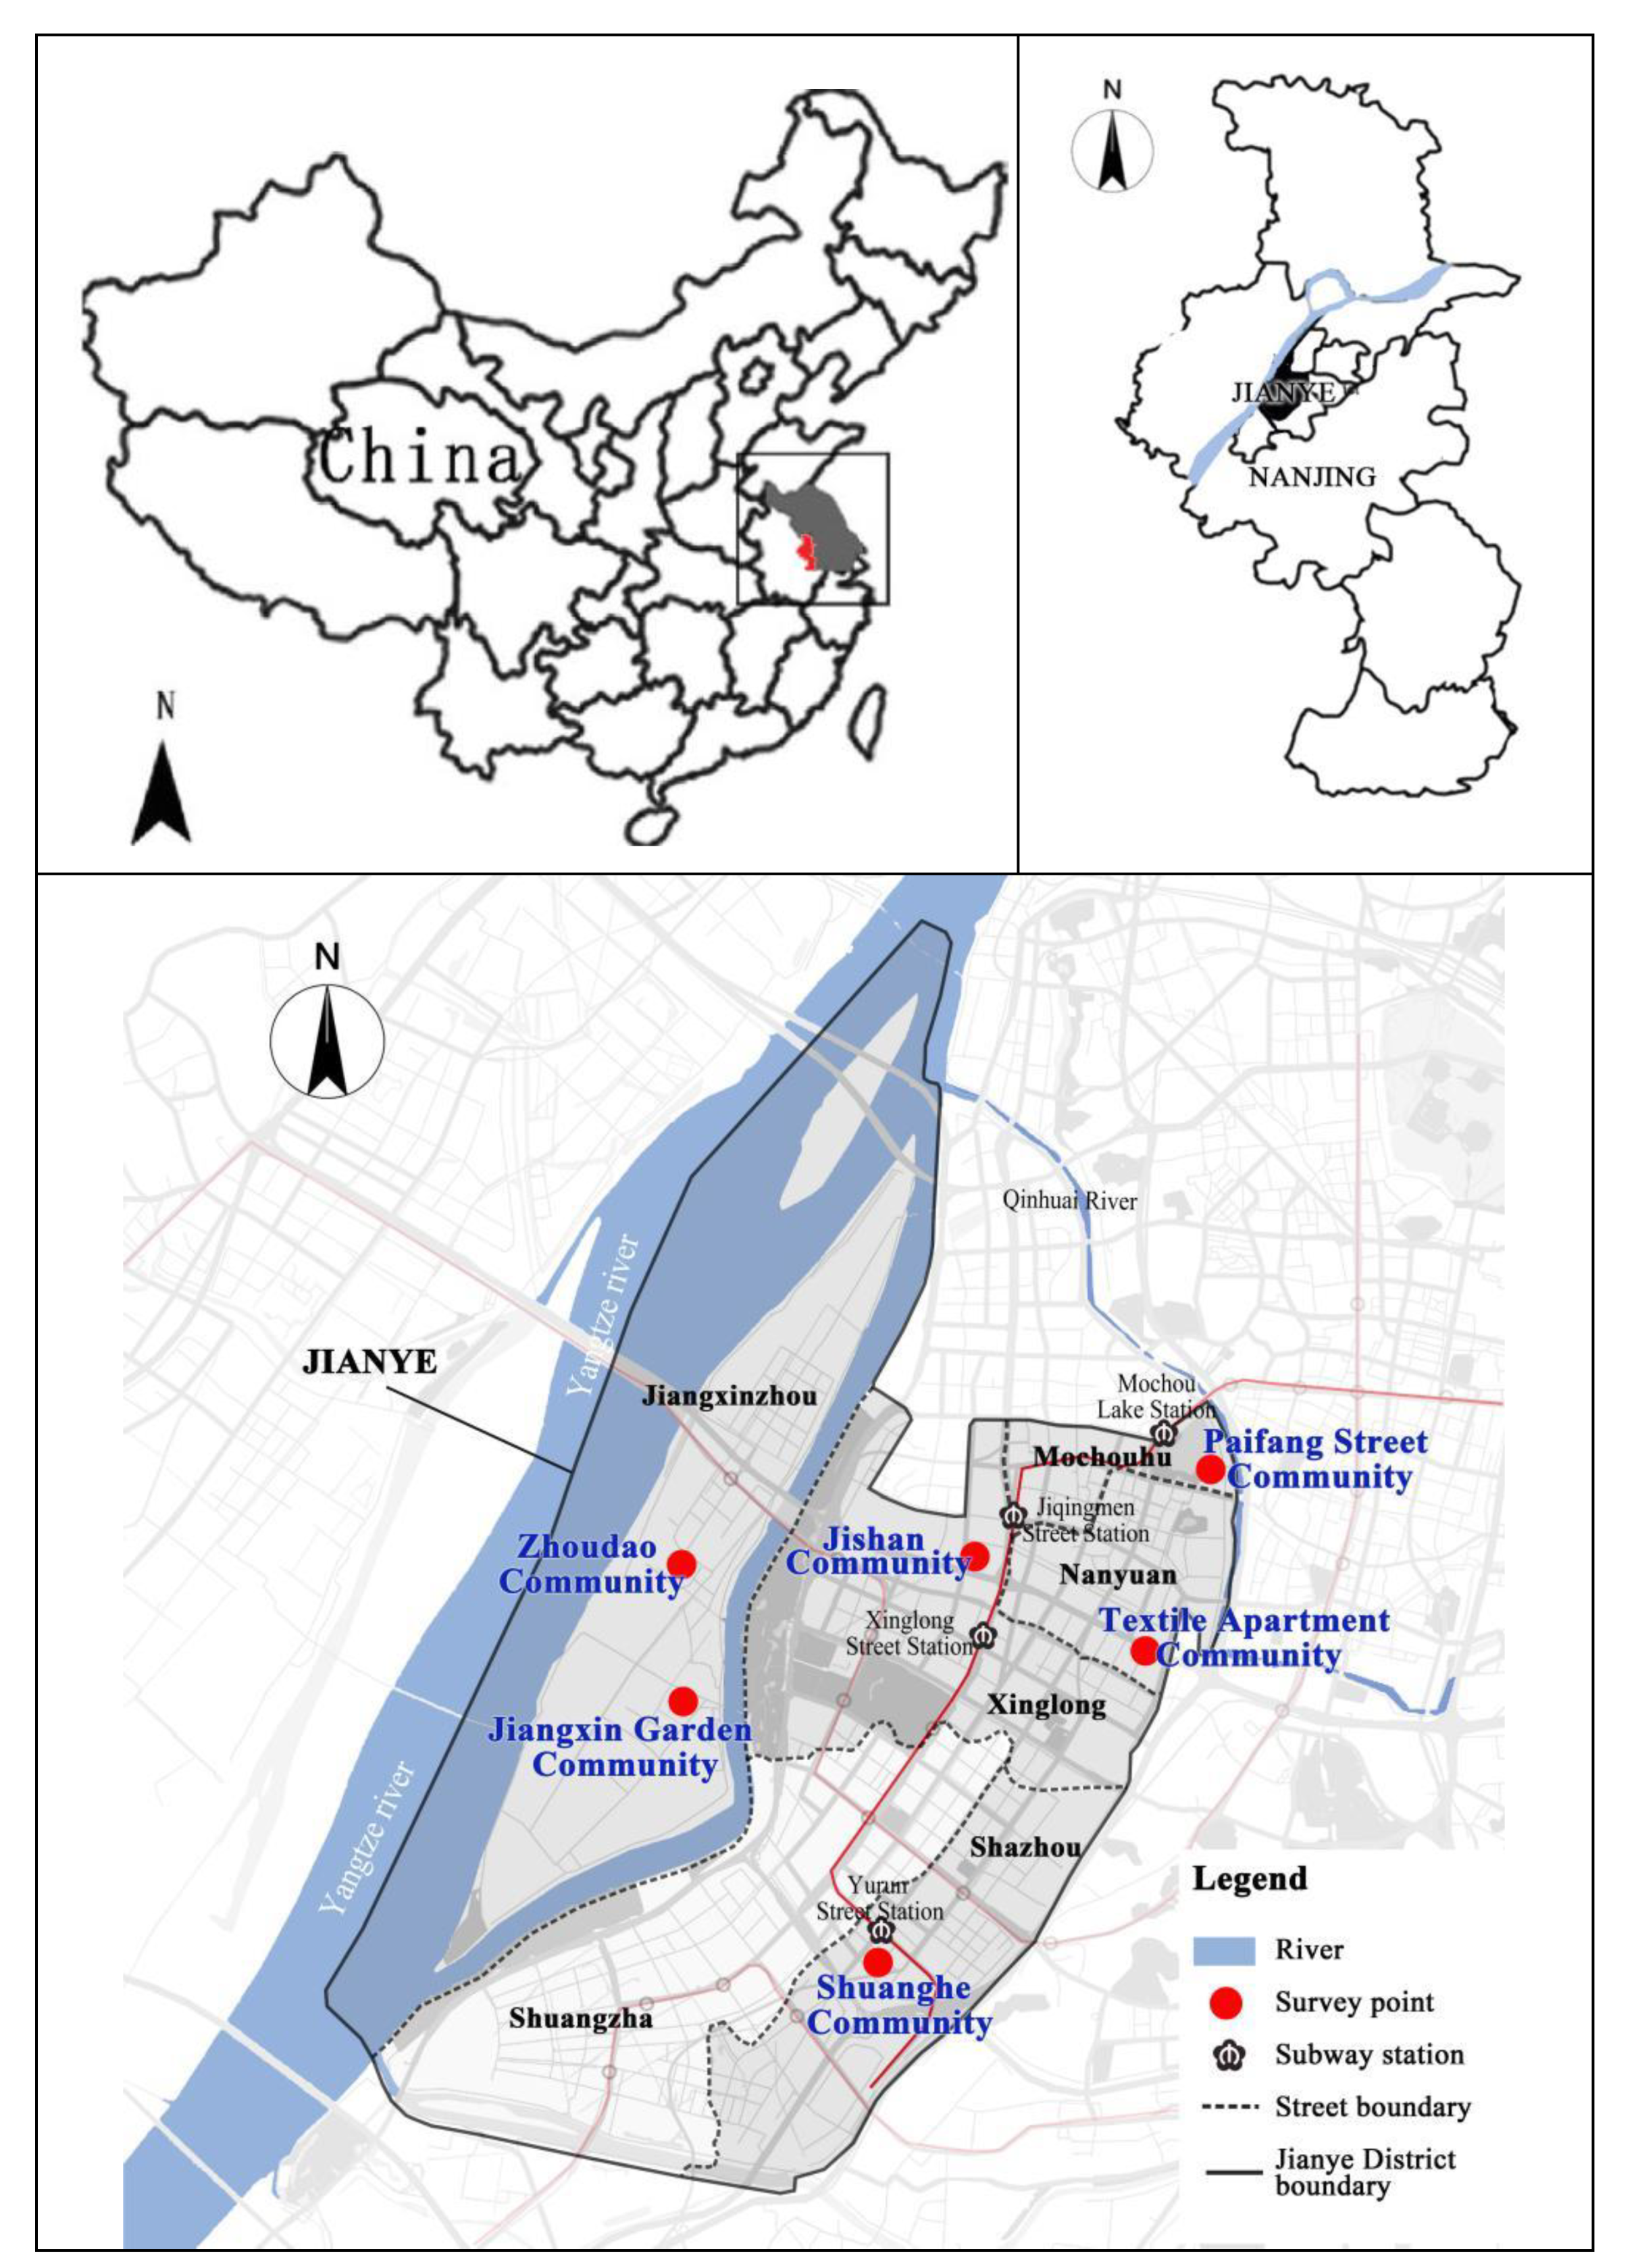
Nanjing (31°14′–32°37′N, 118°22′–119°14′E) is an important central city in China and the provincial capital of Jiangsu Province. Jianye District is adjacent to the Qinhuai River in the east and the Yangtze River in the west, and covers an area of 80.83 square kilometers (Figure 1). In 2017, 6 subdistricts and 60 communities with 472,600 permanent residents, under the jurisdiction of the Jianye District, were seriously affected by rainstorms and floods. From April to June 2018, we conducted surveys in six communities with typical examples of waterlogging in Jianye District: Jishan Community, Shuanghe Community, Zhoudao Community, Jiangxin Garden Community, Textile Apartment Community, and Paifang Street Community. The six communities were selected on the basis of their proximity to rivers, low-lying terrains, and past history of waterlogging. They are under the jurisdiction of five subdistricts, including Xinglong, Shazhou, Jiangxinzhou, Nanyuan, and Mochou Lake.
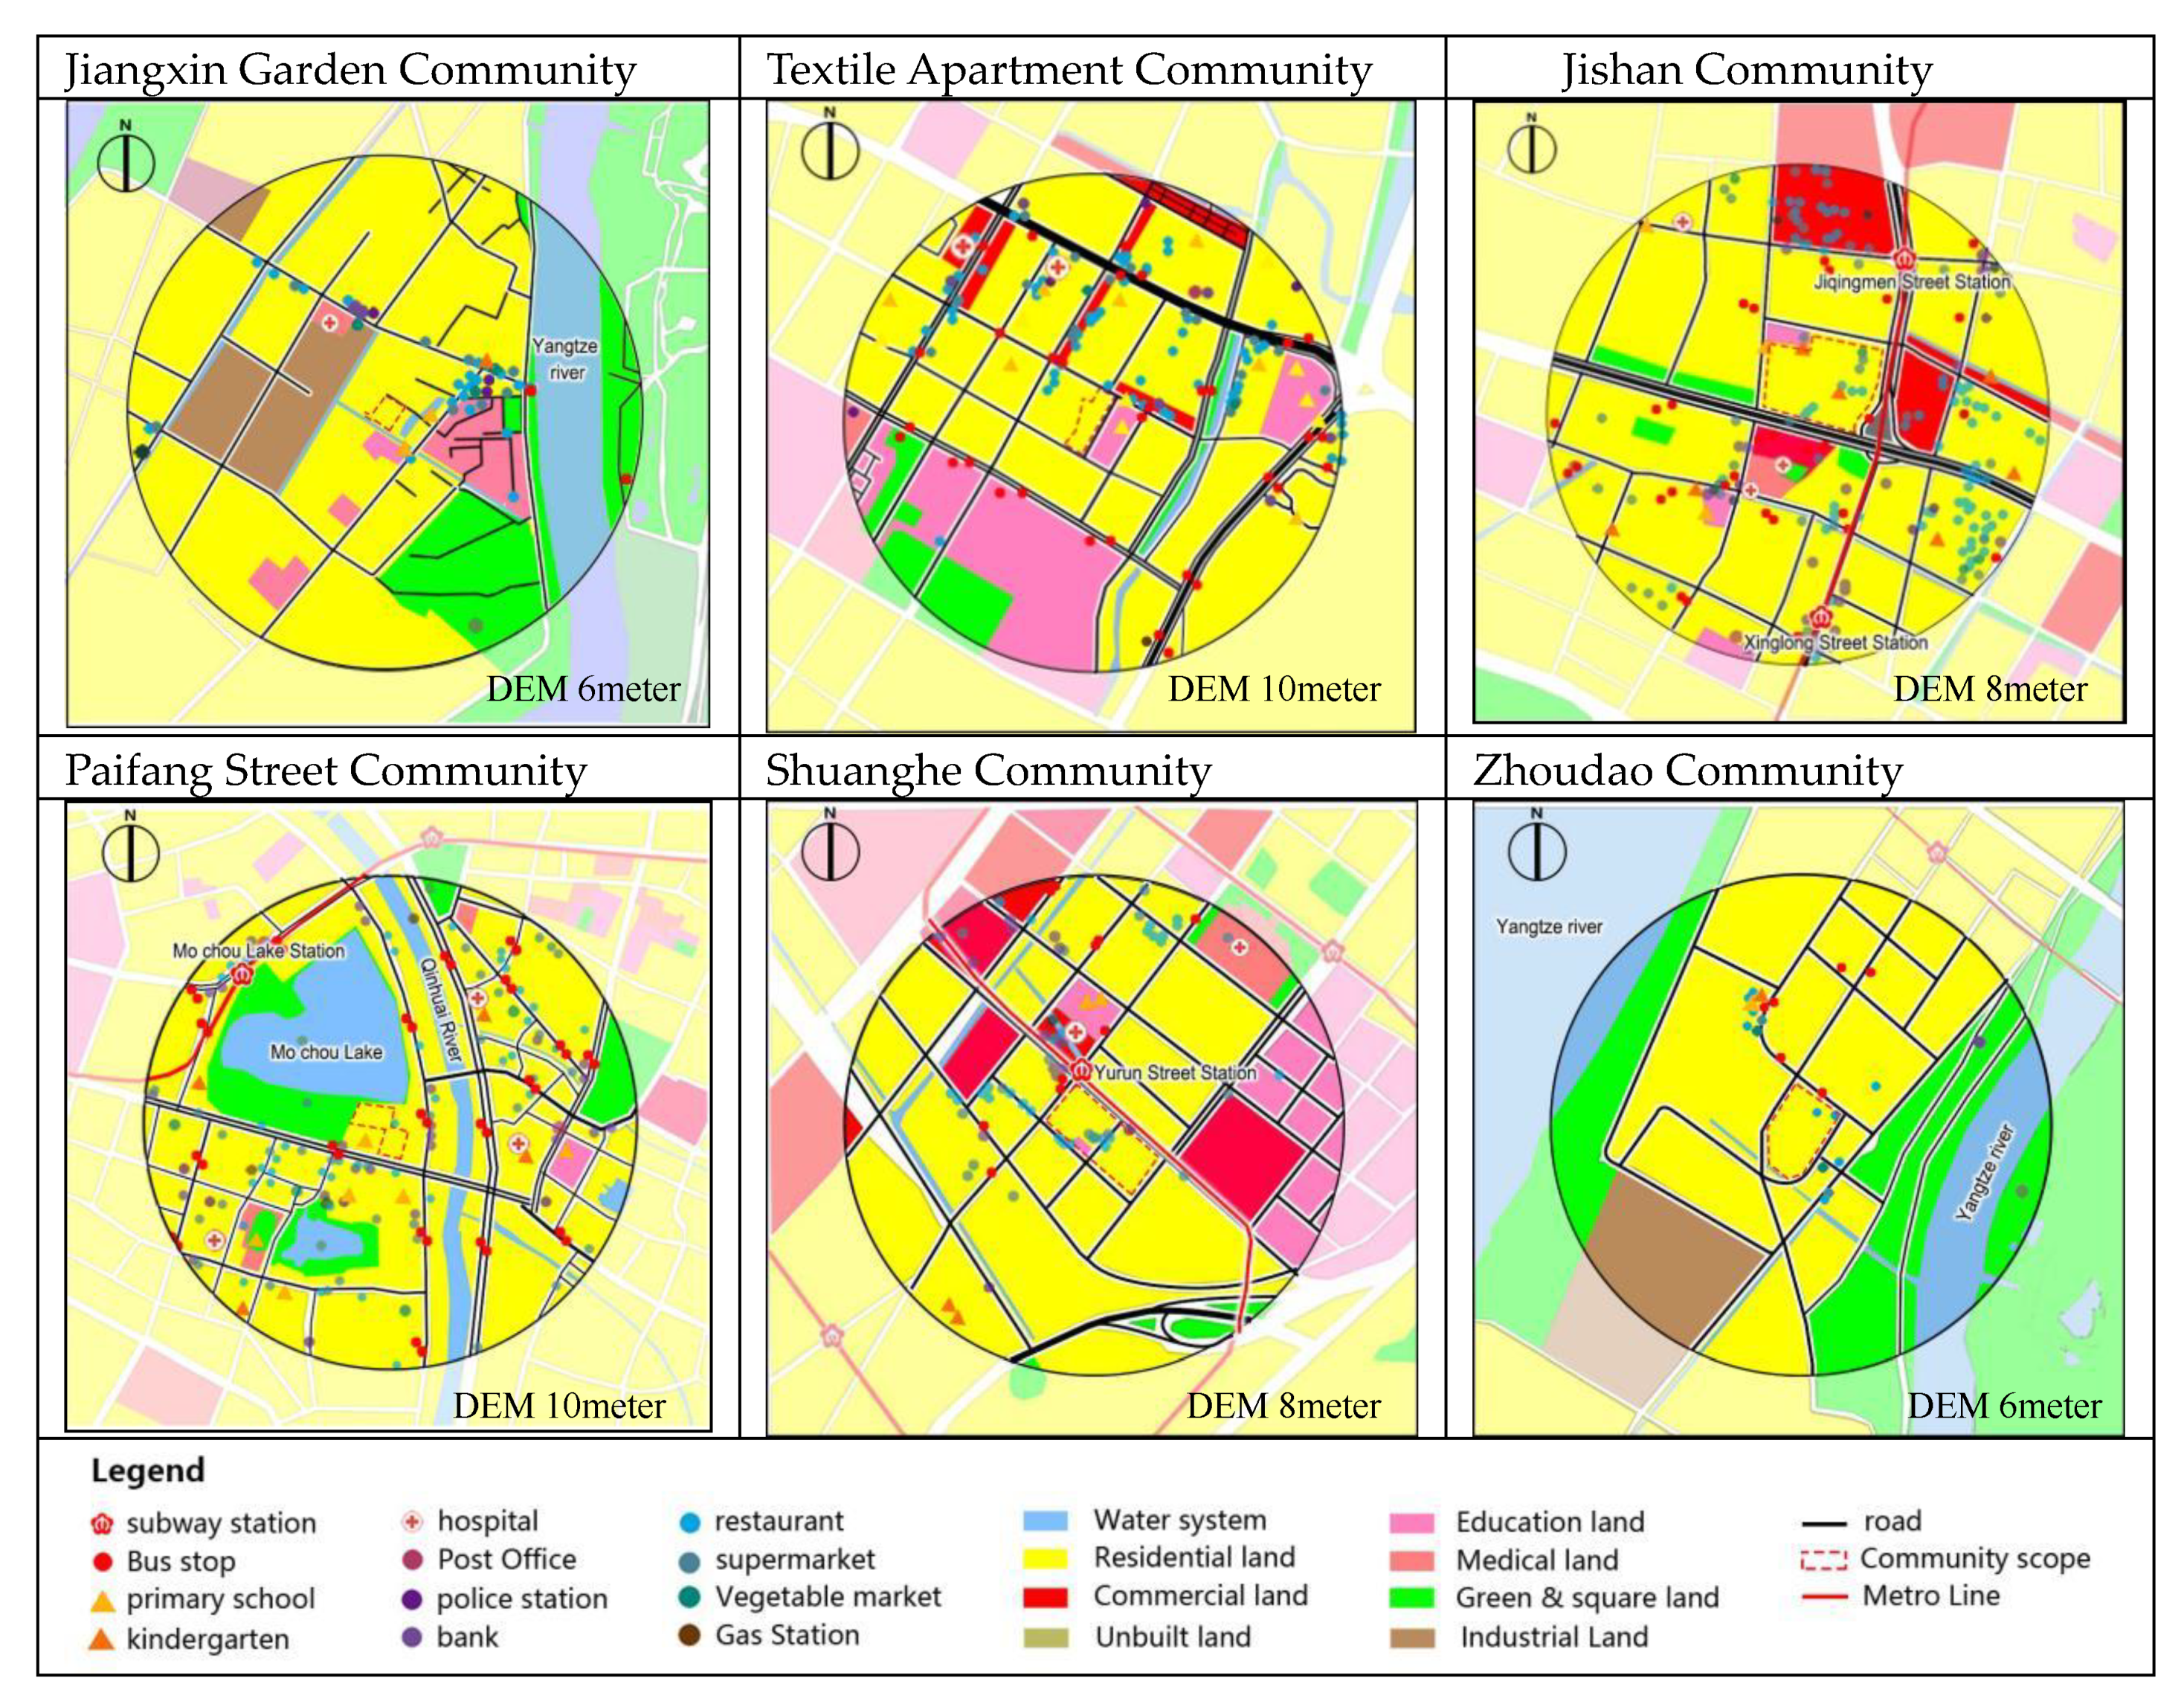
On the basis of community topography, water accumulation, surrounding facilities, and other relevant factors, the six communities can be divided into three gradients. The first gradient included the Shuanghe Community and the Zhoudao Community, which are characterized by high elevation. Shuanghe Community, located in Yurun Street Station of Hexi New City Metro Line 2, is a high-income commercial housing community with wide areas green space coverage. Zhoudao Community is located in Jiangxinzhou, which is an affordable residential area with a single surrounding land type. The second gradient included the Jishan Community, Jiangxin Garden Community, and Paifang Street Community, featuring a low elevation. Jishan community is close to the Jiqingmen Street Metro Station, which has lots of affordable housing with various types of land. Jiangxin Garden Community is located in Jiangxinzhou, which is a small property rights housing with farmlands and a greenbelt nearby. Paifang Street Community is adjacent to Mochou Lake. The houses were built on the funds collected by proprietors, which are relatively old with well-equipped facilities. The third gradient is the Textile Apartment community with comparable elevation. Houses of this estate were built on the basis of housing reform without an underground garage, which is close to the South River. Compared to the land use and the density of surrounding facilities in the Jiangxin Community, the Textile Apartment Community more well-equipped facilities and better forms of land use. However, the Jiangxin Garden Community is not sufficiently developed, thereby indicating different types of land use compared to those of the other two communities (Figure 2).
The research was conducted at two levels. We use “communities” to indicate neighborhoods, and “residents” are individual respondents. At the community level, we designed a basic information form to collect detailed information about the built environment of communities, including the number of building stories, terrain, green space coverage, year of construction, proximity to water and highways, internal facilities, and the surrounding environment. Table 1 shows the basic construction status of the surveyed communities. At the individual level, we surveyed residents’ experiences, knowledge, and attitudes about flooding. The questionnaire was composed of three parts. The first part includes basic information, such as gender, age, education level, occupation, and income. The second part includes historical flood memory, such as sources of information and response measures. The third part includes 26 indicators of community resilience. A total of 247 questionnaires were collected in the six typical communities using accidental and snowball sampling. A total of 236 questionnaires were valid and the effective rate of the questionnaires was 95.5% (Table 2). We compared sex, age, and educational structures of the sample with those of the total population as reported in the city’s latest statistical yearbook [50] and found high consistency, indicating the citywide representativeness of the sample.
2.2. Methods
2.2.1. Variables
Questionnaires on community resilience are divided into three stages: pre-disaster preparation, emergency response, and post-disaster recovery (Table 3). Specifically, pre-disaster preparation is concerned with the establishment of disaster prevention systems and knowledge of flooding, including seven factors. Emergency response includes the efficiency of emergency evacuation, emergency rescue, and community emergency rescue, which are measured by eleven factors. As for post-disaster recovery, both infrastructure and public space are affected, including through eight different factors [34,35,51] All of these aspects of community resilience were evaluated by community residents. Likert scales were used to collect their evaluation and attitude to the preparation of the community in the 26 aspects. The preparation can be done by different stakeholders and the results reflect the comprehensive outcome of the collaborative efforts of the entire community.
In this study, flood resilience is regarded as the dependent variable, and respondents’ attitude to the problem of “whether the community can recover quickly after the flood” is regarded as an important standard to judge resilience. “Yes” indicates that the community can recover quickly after a flood, whereas “no” means the opposite.
Empirical studies have shown that the factors of the built environment, such as proximity to water, building surface, and building structure, have a significant impact on flood resilience [52]. Thus, the explanatory variables are selected accordingly as well. In this study, the geometric center of the survey community is taken as the center, and the 1-km-radius area is taken as the research scope. Indicators of the built environment in the relevant studies are modified, and related indicators that focus on flood resilience are identified [14]. Wilby [53] summarized impacts of climate change on the built environment focusing on four aspects: urban ventilation and cooling, urban drainage and flood risk, water resources, and outdoor space. Ewing and Cervero [54] put forward 5D dimensions, including density, design, diversity, destination accessibility, and distance to public transportation [14,54] Given that 5D dimensions on built environments are widely used in research, we adopt the Cervero and Ewing method to evaluate our community built environment. The density of the built environment is evaluated by assessing the building coverage ratio, building layers, and road network density. The built environment is assessed by proximity to rivers, topography, building age, and the plot ratio. Diversity indicators are evaluated by the ratio of green space and the diversity of land use (Table 4). The accessibility of the built environment destination is evaluated by the accessibility of public transport and the subway. The distance between the nearest subway station and the nearest bus station is used to assess the distance between the built environment and transportation facilities. In addition, individual characteristics of residents, including gender, age, household registration, and income, are regarded as control variables.
2.2.2. Model
- (1)
- Factor analysis
Principal Component Analysis (PCA) is known as a dimension reduction method, which is important to present the data in a more concentrated way. Factor analysis is conducted by using the PCA method in factor extraction to simplify the factor structure of a group of original variables [55,56]. Generally, linear combination used to determine factors is given as:
Fik = score of community i on factor k;
Xij = value of original variable j for community i which is standardized in PCA;
Wjk = factor loading of variable j on factor k representing the proportion of variance of variable j explained by factor k.
The comprehensive score of community i is then calculated by using a weighted sum method.
Si = comprehensive factor score of community i representing the resilience of the community;
λk = the eigenvalue of factor k.
The following 26 indicators are categorized into pre-disaster preparation, emergency response, and post-disaster recovery. It should be noted that although the three stages are important for improving our understanding of the community resilience on urban flooding, they are not absolutely distinct from each other. The factor analysis is conducted first on all variables and then on each set of the three variables to evaluate the community resilience as a whole and its three stages.
- (2)
- Logistic Regression
The explanatory variable of this study is whether the community can recover quickly after a flood. Therefore, this paper selects the logistic regression model for study. Whether a community can recover quickly after a flood is determined as the dependent variable, that is, a 0-1 dependent variable. The rapid recovery is defined as 1, while the rapid recovery is defined as 0. The model is expressed as:
In the formula, p is the probability of rapid recovery after a community flood; is the factors that affect the community’s rapid recovery after a community flood; α is a constant term, and represents the natural log value of the ratio between the community’s rapid recovery and non-rapid recovery after a community flood when all the independent variables are 0. is the partial regression coefficient of a Logistic regression.
- (3)
- In-Depth interviews (Table 5), we completed one-on-one, in-depth qualitative interviews with interviewers trained in qualitative methods. We provided an in-depth interview questions guide as follows.
3. Results and Discussion
3.1. Flood Resilience of Different Communities
To distinguish the resilience of different types of communities, the factor analysis method was used to sort out 26 indicators of community resilience. These indicators were derived mainly from previous literature on community resilience and urban flood [34,35,51]. Test results show that the KMO statistic is 0.799. In addition, Bartlett’s sphericity test (p = 0. 000 < 0.05) was adopted, indicating that the correlation coefficient matrix is significantly different from an identity matrix and that a factor analysis is necessary and suitable for this analysis. The result of factor analysis identified 7 principal components, of which the rate variance contribution accumulates to 73.6%, including most of the original variables (Table 6). Thus, the 26 indicators are divided into 7 categories. The first principal component (F1), named as the emergency preparation factor, includes emergency material distribution and credit efficiency of emergency facilities. The second principal component (F2), named the infrastructure factor, includes the power supply system, water supply system, and gas system. The third principal component (F3), called the pre-disaster rescue factor, includes evacuation skills and flood warning levels. The fourth principal component (F4), called the emergency evacuation factor, includes the service radius of emergency shelters and evacuation places. The fifth principal component (F5), called the public space factor, includes squares and green spaces. The sixth principal component (F6), called the disaster prevention system factor, includes the community emergency response and comprehensive command system, as well as flood emergency plans. The seventh principal component (F7), called the emergency medical factor, includes an emergency medical rescue system (Table 6).
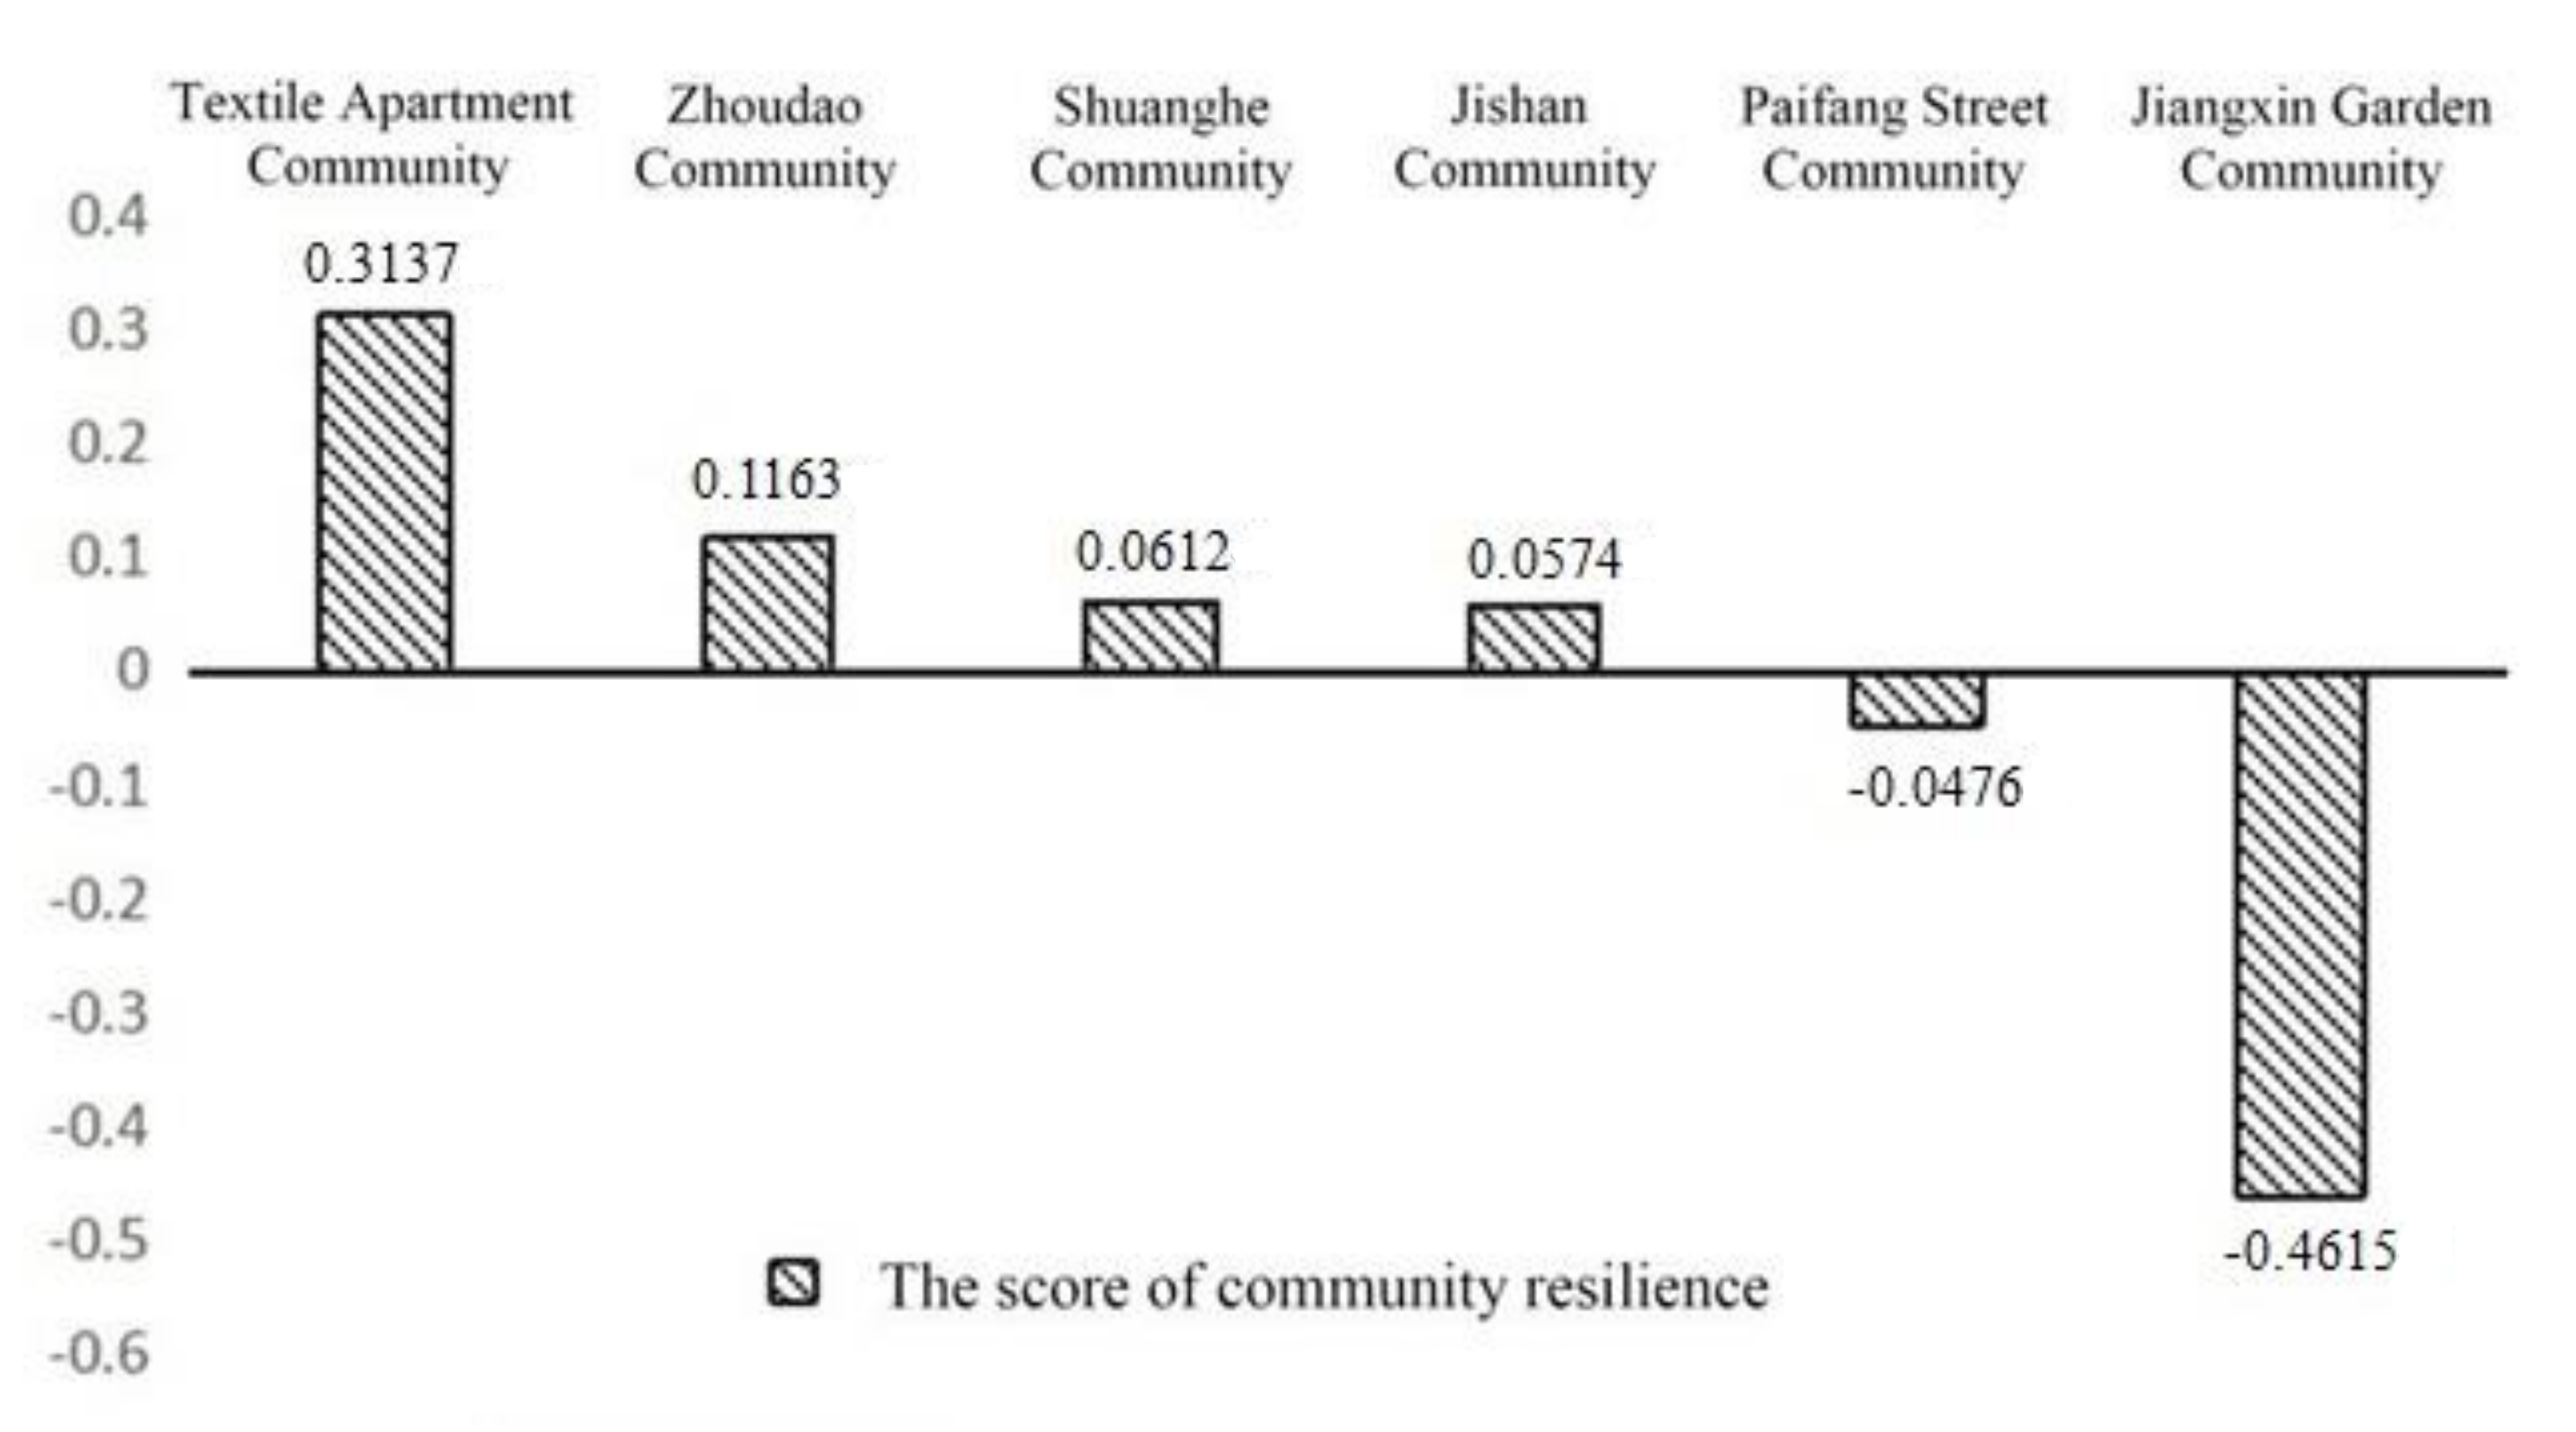
The comprehensive factor score of each community can be obtained by using the weighted sum method from Equation (2). Its score shows the level of resilience in the various indicators of the community, and a score of less than zero indicates that it is below the average.
S = 0.2073F1 + 0.1833F2 + 0.1727F3 + 0.1471F4 + 0.1181F5 + 0.1054F6 + 0.0662F7
The higher scores belong to the Textile Apartment, Zhoudao Community, Shuanghe Garden, and Jishan community, whereas the lower scores belong to Paifang Street and Jiangxin Garden Community (Figure 3). An in-depth interview was conducted to better understand the comprehensive scores. For example, the Textile Apartment had the highest score because of its good organizational resilience. Their information bulletin board was effectively used to inform residents on how to prevent flood risk. However, a high-level resilience cannot always save a community from flooding or waterlogging as they are influenced by many other factors such as rainstorms. The Jiangxin Garden Community with the lowest score is greatly affected by rainstorms. Moreover, the Jiangxin Garden Community is prone to waterlogging after a rainstorm, which cannot be discharged quickly.
3.2. Different Stages of Community Flood Resilience
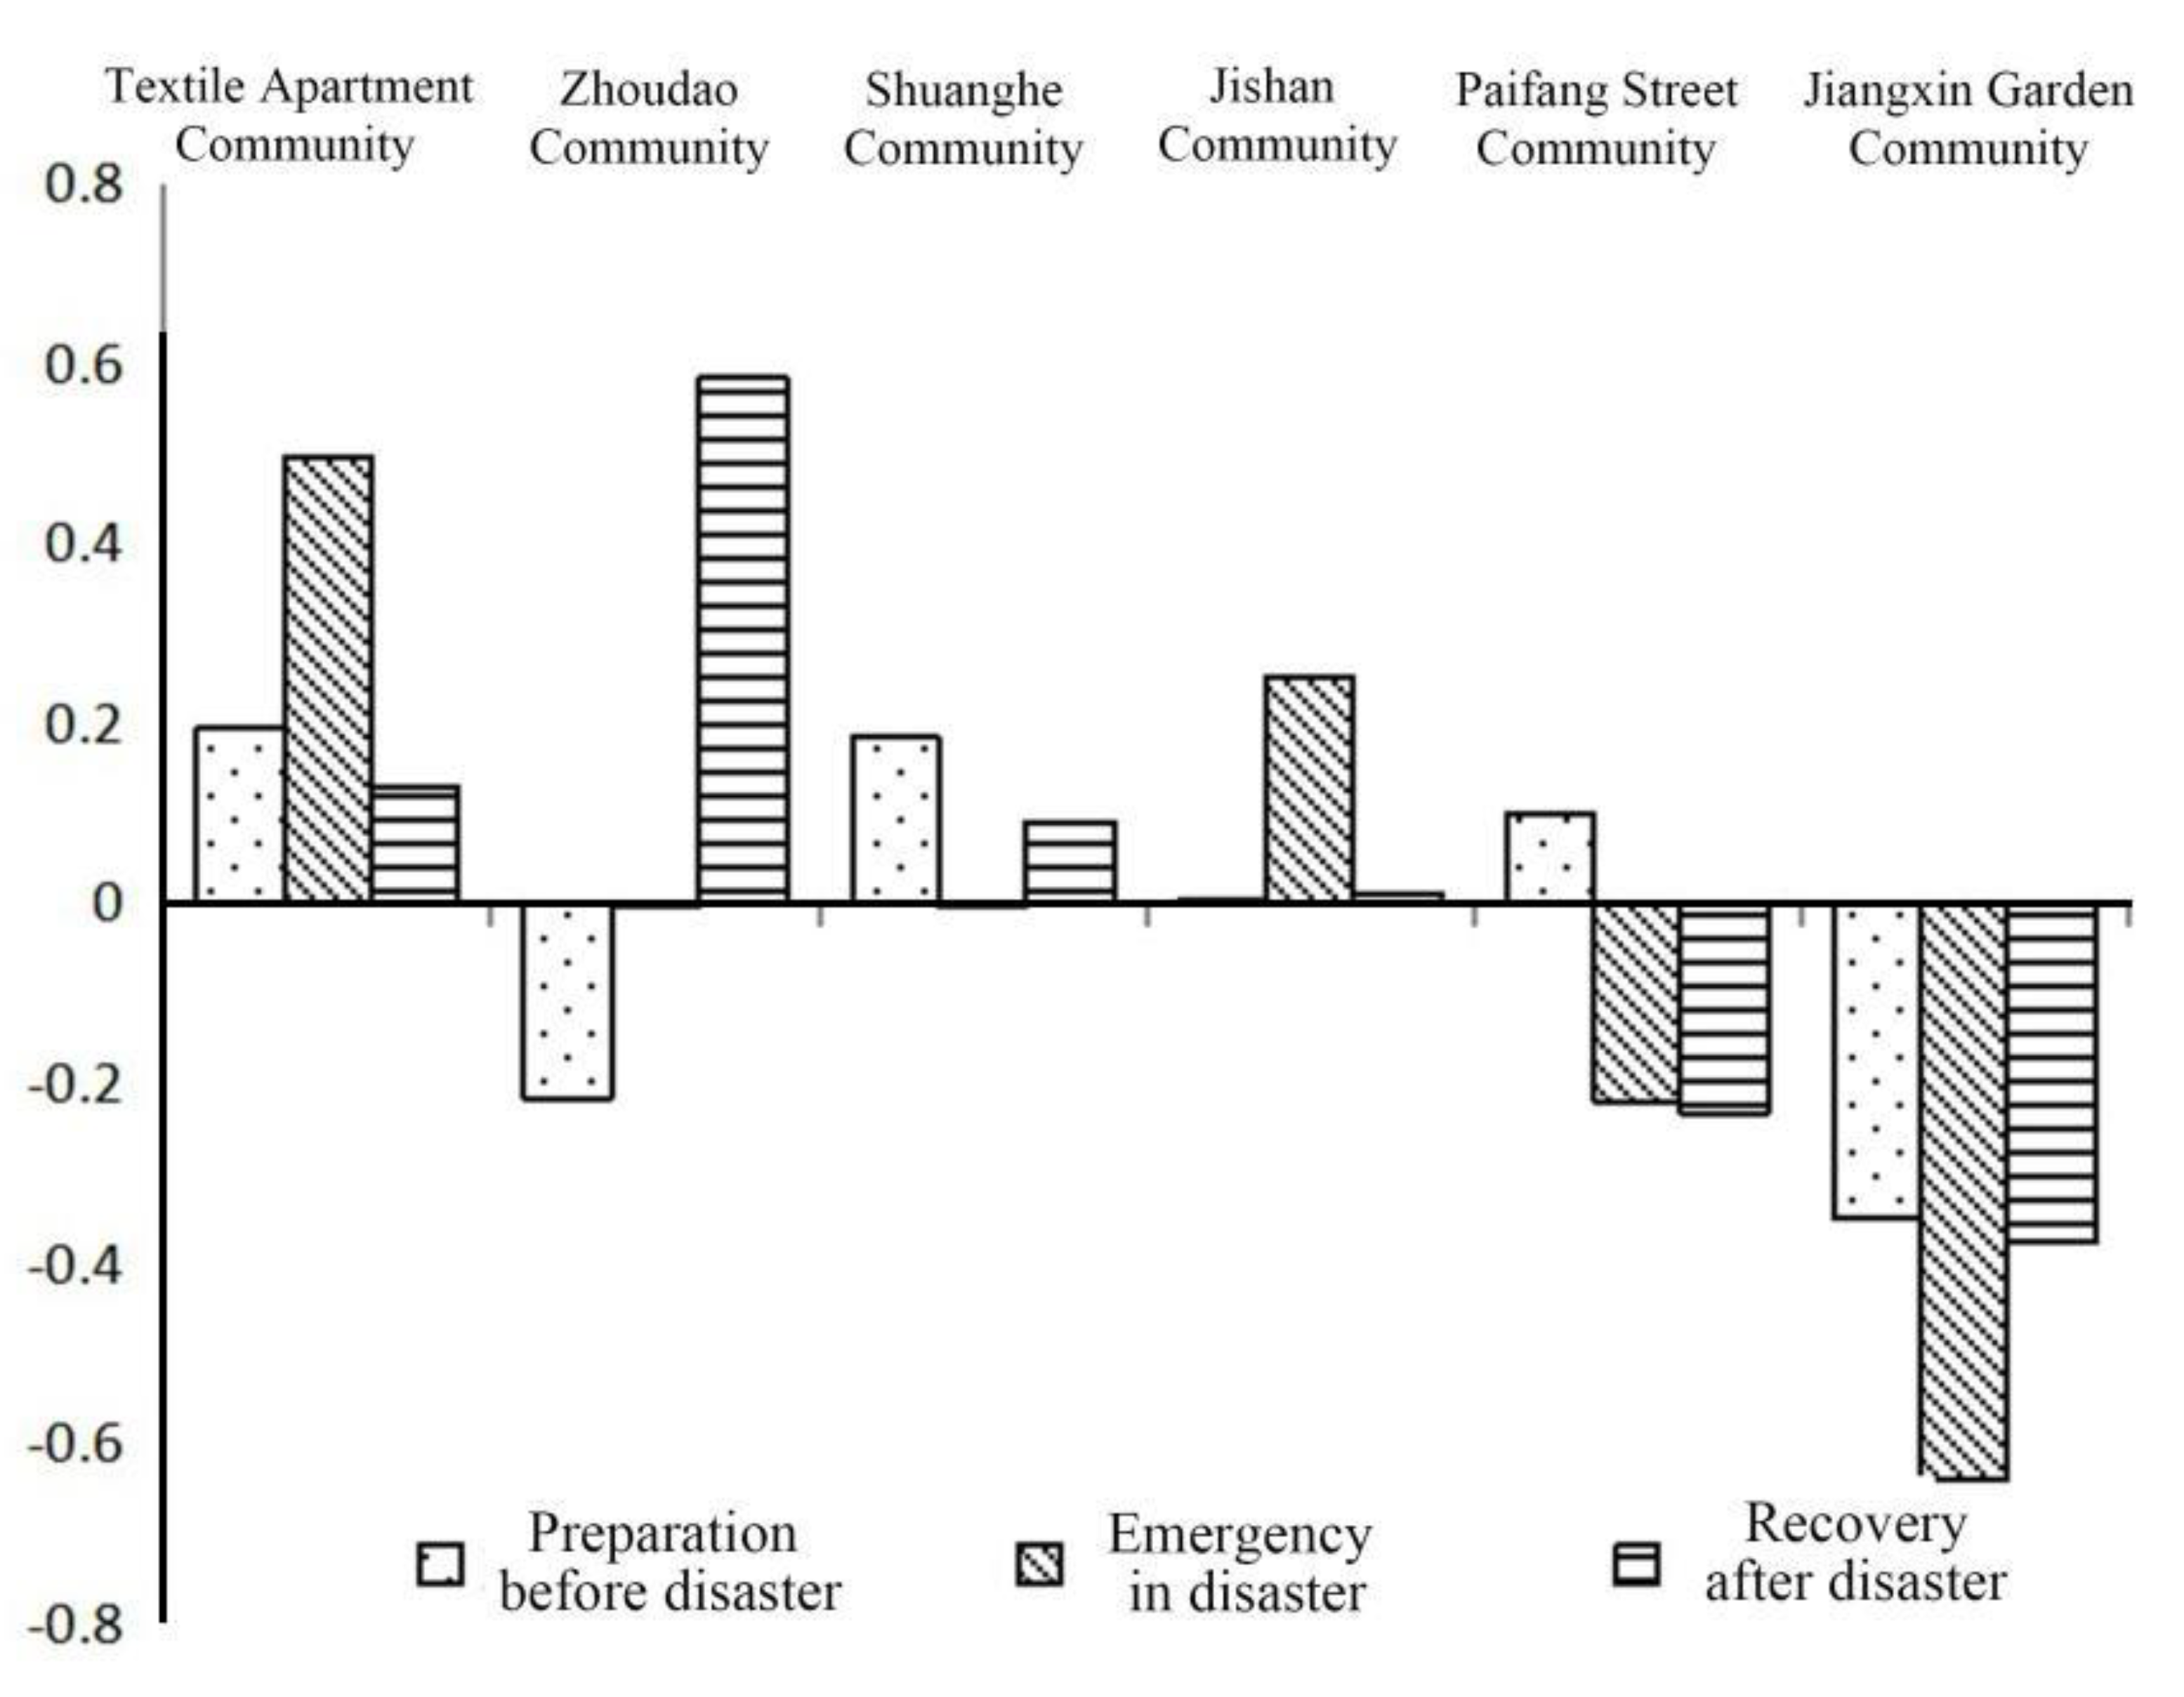
Factor analysis was conducted on these three sets of variables. Two factors (Fpre1 and Fpre2) were extracted from the seven variables representing pre-disaster preparation. Three and two factors were extracted for the other two sets of variables. On the basis of these factors and by using Equation (2), the comprehensive scores of resilience at stages of pre-disaster preparation (Spre), emergency response (Sem), and post-disaster recovery (Spost) could be calculated for each community.
Spre = 0.5273Fpre1 + 0.4727Fpre2
Sem = 0.3197Fem1+ 0.3435Fem2+ 0.2514Fem3
Spost = 0.5864Fpost1 + 0.4135Fpost2
Figure 4 shows that the Textile Apartment Community and Zhoudao Community occupy the highest scores in the emergency response and post-disaster recovery, respectively, whereas the Jiangxin Garden Community has the lowest scores in all three stages. According to the survey, the Textile Apartment Community and Shuanghe Community did a good job in conducting information dissemination before a disaster, which is reflected in the timely update of the community bulletin board. Moreover, a good geographical location, good traffic accessibility, and good neighborhood relationships played an additional positive role prior to disasters. However, the Jiangxin Garden Community and Paifang Street Community almost completely rely on the government without self-rescue actions, resulting in a low score.
3.3. Impact of the Built Environment on Community Flood Resilience
Resilience is an important criterion for judging community resilience. Further analysis was carried out on whether ‘community floods can quickly recover after a flood’ as the dependent variable and the built environment as the independent variable. To avoid imprecise estimate and other problems caused by multicollinearity, we dropped independent variables that were highly correlated with other variables. Specifically, if two variables have a correlation coefficient higher than 0.5, one should be dropped. We calculated the variance inflation factor (VIF) and found high VIFs for these highly correlated variables. The one with a lower VIF was retained in the model. After such a filtering process, we selected community terrain, proximity to the rivers, the building coverage ratio, the green space rate, number of building layers, and land diversity for analysis. The VIFs of these variables are all lower than 3 in the model, indicating that there is no serious multicollinearity. Using SPSS 22.0, the binary logistic regression analysis of community flood resilience was adopted. The comprehensive test of the coefficients shows that the regression equation is significant; the likelihood of the coefficients is 102.435, and the P-value is 0. 000, which indicates that the model is reasonable. The log-likelihood function value of −2 times is 219.28, and the NagelkerkeR2 value is 0. 466. The accuracy rate of the total prediction model after regression is 80.6%, indicating that the model has a good fits (Table 7 and Table 8).
(1) Resilience is composed of four factors, namely, resilience ethos, situation awareness, management of keystone vulnerability, and adaptive capacity [57]. In high terrains, less water is accumulated during heavy rain, and the water level recedes rapidly. This low level of vulnerability saves a community from most floods and simultaneously makes recovery from possible floods easy for a community. In this context, vulnerability is low and resilience is high in a community with a high terrain. Significance of the coefficient reached 0.043, indicating a positive relationship between community resilience and terrain. Take the Jishan Community as an example. Its score of community flood resilience is 0.0574, ranking fourth. This result is far lower than that of the Textile Apartment, which ranks first. Compared with surrounding roads, the Jishan community is in a low-lying area. When a rainstorm occurs, rain water flows from external roads into the community. Owing to the slope between the inside and the entrance of the community, water logging often occurs.
(2) Proximity to rivers has a significant impact on community flood resilience, with the significance level reaching 0.000. Three of the six surveyed communities are close to a body of water. For example, Paifang Street Community is adjacent to Mochou Lake, whereas the Zhoudao Community and Jiangxin Garden Community, located in Jiangxinzhou, are close to the Yangtze River. Proximity to a river will not affect a community’s disaster prevention capacity. The reason for this is that proximity to water will increase vulnerability given the high level of exposure to an increase in the water levels [25]. Take Jiangxin Garden Community as an example. Its score of community flood resilience is −0.4615, which is the lowest among the six communities. Surveys show that the level of water-logging within a community rise during rainstorms and pavements are flooded, thus making it likely to be impassable for pedestrians.
(3) The percentage of building coverage has a significant association with community flood resilience. The level of significance reached 0.000. This figure indicates that higher density levels of community buildings are more likely to occupy larger construction areas, thus leaving only a few areas for usable land. The building coverage ratio is closely related to the rate of imperviousness. A high building coverage ratio indicates major proportions of the total area of the building coverage compared to the total land area, reflecting the rate of vacant land and occupied area within a certain range. Generally speaking, a negative correlation exists between the average number of floors and the building coverage ratio. For example, the coverage ratio of old residential areas is relatively high with hardly any surplus space for public service facilities and green space. Such a condition is not conducive to rainwater drainage, thus reducing community recovery. Currently, the problem of rainfall flood disasters in old settlements is becoming increasingly serious. Take Paifang Street Community as an example. The score of resilience to rainfall flood is −0.0476, ranking the second lowest among the six communities. Completed in 1995, the community is located in the old area of Nanjing with the highest building coverage ratio among the six communities. Owing to its proximity to Mochou Lake and its low terrain, water logging easily occurs during rainstorms. In addition, the lack of property management is the reason for low community flood resilience.
(4) The level of significance between green space ratio and community flood resilience is 0.001, indicating a significant association between them. Generally speaking, for a higher ratio of green space in the community, the vegetation coverage ratio is also higher, and waterlogging can be quickly eliminated during rainstorms. Therefore, communities with high ratios of community green space tend to be resilient. As far as the field surveys are concerned, the green space ratio of the Zhoudao Community is the highest, followed by the ratios for the Shuanghe Community, Textile Apartment, Jishan Community, Paifang Street Community, and Jiangxin Garden Community. The interiors of the Zhoudao Community, Paifang Street Community, and Jiangxin Garden Community are mostly paved with concrete cement, whereas the Jishan Community, Shuanghe Community, and Textile Apartment are inlaid with straw bricks. Take the Shuanghe Community as an example. Its resilience score is 0.0612, ranking third among the six communities with a high ratio of green space. Waterlogging generally does not occur during rainstorms. In addition, the terrain of the community is higher than surrounding roads; thus, rainwater will be discharged to the road through the entrance to the community.
(5) The diversity of land use has a significant impact on community flood resilience, with the significance reaching 0.001. This figure indicates that a greater diversity of land use enhances community resilience. For example, communities with multiple types of land use, such as education, commercial, and office land within 1 km are more resilient than those with merely residential land within the same range. One possible reason may be residents’ access to rich resources nearby. Take the Textile Apartment as an example. The score of resilience in this highly residential area is 0.3171, the highest among the six residential areas. Land use has different types, such as residential, commercial, education and scientific research, medicine and health, and green space.
4. Conclusions
Differences between built environments lead to different levels of flood resilience. According to the analysis of community resilience during stages of pre-disaster preparation, emergency response, and post-disaster recovery, the resilience scores of six communities in the latter two stages are higher, whereas the score for pre-disaster preparation is lower. The results indicate that pre-disaster preparation does not receive enough attention. Results from six different communities provide insights into a range of physical and social factors associated with community resilience, including topography, proximity to rivers, building coverage ratio, green space ratio, land diversity, and social organization. Vulnerability and resilience of a community are influenced by multiple factors. They are a result of the interaction among exposure, sensitivity, and adaptation [25]. Therefore, communties must deal with these multiple and interconnected issues in order to systematically improve flood resilience.
High elevation, a low coverage ratio of buildings, and a high green space ratio are indeed helpful for improving community flood resilience, which is confirmed by the practical investigation of newly construction communities. For example, the Zhoudao Community was constructed in 2016. Jianye District in Hexi New Town is adjacent to the Yangtze River with low topography. In recent years, Jianye District has suffered from flooding in the main roads during heavy rains. Therefore, the proper integration of blue, green, and gray infrastructure should always be considered in future urban planning. Moreover, innovation in drainage facilities, rainwater and sewage diversion, and management system should be carried out to reduce the vulnerability of communities under the impacts of rainstorm and flood. Settlements built-up 20 years ago often have high building coverage ratios. They generally have low scores of community flood resilience in the surveys. The finding proves that old settlements are weak in handling and dealing with external impact. In recent years, the Nanjing Government has done substantial work in the ‘urban double repair’ and ‘rainwater and sewage diversion’ projects. Therefore, the issue of waterlogging has been eliminated in many communities, and vulnerability has been improved. The main reason for the impact of resilience is that various purposes of land use, such as education and scientific research, business, transportation, municipal facilities, and green space reflect varying functions of a community. However, which types of land use combination are resilient needs to be further discussed. In addition, when analyzing the relationship between the built environment and flood resilience, the design principles of a resilient community should be considered, including connectivity, multicentricity, diversity, volatility, self-organization, learning and innovation ability, and versatility.
The discussion on the construction of a resilient community is not only limited in urban planning, but applies in many other disciplines like landscape architecture. Therefore, we should focus more on interdisciplinary perspectives when discussing resilient design and construction. Apart from the proportion of green space, distribution and connectivity should be considered in the planning of green space. In addition to the proportion and section of roads, the role of community roads in drainage should not be ignored. In the planning of communities and the surrounding environment, special attention should be paid to enhancing water management for communities near rivers. In terms of accessibility to community traffic, connectivity and accessibility between the community and public service facilities should be further optimized to make urban communities livable and resilient.
Author Contributions
Y.C.: Conceptualization, Methodology, Writing - Original Draft, Writing-Review & Editing, Project administration, Funding acquisition. T.L.: Conceptualization, Resources, Writing-Review & Editing, Supervision, Funding acquisition. R.C.: Formal analysis, Data Curation. M.Z.: Investigation, Formal analysis, Data Curation, Writing-Original Draft. All authors have read and agreed to the published version of the manuscript.
Funding
This research was funded by the National Natural Science Foundation of China (41701186, 41801146, 41571488), the Humanity and Social Science Youth Foundation of Ministry of Education (17YJCZH029, 18YJC840022), and the College Student Innovation and Entrepreneurship Training Program of Jiangsu Province (201910291071Z).
Conflicts of Interest
The authors declare no conflict of interest.
References
- Kulp, S.A.; Strauss, B.H. New elevation data triple estimates of global vulnerability to sea-level rise and coastal flooding. Nat. Commun. 2019, 10, 1–12. [Google Scholar]
- Torabi, E.; Dedekorkut-Howes, A.; Howes, M. Adapting or maladapting: Building resilience to climate-related disasters in coastal cities. Cities 2018, 72, 295–309. [Google Scholar] [CrossRef]
- Chen, R.; Zhang, Y.; Xu, D.; Liu, M. Climate Change and Coastal Megacities: Disaster Risk Assessment and Responses in Shanghai City. In Climate Change, Extreme Events and Disaster Risk Reduction; Springer: Berlin/Heidelberg, Germany, 2017; pp. 203–216. [Google Scholar]
- Brody, S.; Zahran, S.; Vedlitz, A.; Grover, H. Examining the Relationship Between Physical Vulnerability and Public Perceptions of Global Climate Change in the United States. Environ. Behav. 2007, 40, 72–95. [Google Scholar] [CrossRef] [Green Version]
- Kienberger, S.; Contreras, D.; Zeil, P. Spatial and Holistic Assessment of Social, Economic, and Environmental Vulnerability to Floods—Lessons from the Salzach River Basin, Austria. In Assessment of Vulnerability to Natural Hazards; Elsevier BV: Amsterdam, The Netherlands, 2014; pp. 53–73. [Google Scholar]
- Fekete, A. Validation of a social vulnerability index in context to river-floods in Germany. Nat. Hazards Earth Syst. Sci. 2009, 9, 393–403. [Google Scholar] [CrossRef] [Green Version]
- Du, S.; Shi, P.; Van Rompaey, A.; Wen, J. Quantifying the impact of impervious surface location on flood peak discharge in urban areas. Nat. Hazards 2015, 76, 1457–1471. [Google Scholar] [CrossRef]
- Booth, D.; Hartley, D.; Jackson, R.; Jackson, C.R. FOREST COVER, IMPERVIOUS-SURFACE AREA, AND THE MITIGATION OF STORMWATER IMPACTS. JAWRA J. Am. Water Resour. Assoc. 2002, 38, 835–845. [Google Scholar] [CrossRef]
- Brody, S.D.; Blessing, R.; Sebastian, A.; Bedient, P.B. Examining the impact of land use/land cover characteristics on flood losses. J. Environ. Plan. Manag. 2014, 57, 1252–1265. [Google Scholar] [CrossRef]
- Epps, T.; Hathaway, J. Using spatially-identified effective impervious area to target green infrastructure retrofits: A modeling study in Knoxville, TN. J. Hydrol. 2019, 575, 442–453. [Google Scholar] [CrossRef]
- Li, L.; Uyttenhove, P.; Vaneetvelde, V. Planning green infrastructure to mitigate urban surface water flooding risk–A methodology to identify priority areas applied in the city of Ghent. Landsc. Urban Plan. 2020, 194, 103703. [Google Scholar] [CrossRef]
- Zhao, P. The Impact of the Built Environment on Bicycle Commuting: Evidence from Beijing. Urban Stud. 2014, 51, 1019–1037. [Google Scholar] [CrossRef]
- Handy, S.; Cao, X.; Mokhtarian, P. Correlation or causality between the built environment and travel behavior? Evidence from Northern California. Transp. Res. Part D Transp. Environ. 2005, 10, 427–444. [Google Scholar] [CrossRef] [Green Version]
- Cervero, R.; Kockelman, K. Travel demand and the 3Ds: Density, diversity, and design. Transp. Res. Part D Transp. Environ. 1997, 2, 199–219. [Google Scholar] [CrossRef]
- Carlson, C.; Aytur, S.; Gardner, K.; Rogers, S. Complexity in Built Environment, Health, and Destination Walking: A Neighborhood-Scale Analysis. J. Hered. 2012, 89, 270–284. [Google Scholar] [CrossRef] [Green Version]
- Kivimaa, P.; Hildén, M.; Huitema, D.; Jordan, A.; Newig, J. Experiments in climate governance – A systematic review of research on energy and built environment transitions. J. Clean. Prod. 2017, 169, 17–29. [Google Scholar] [CrossRef] [Green Version]
- Mojtahedi, S.; Oo, B.; Mojtahedi, M. Coastal buildings and infrastructure flood risk analysis using multi-attribute decision-making. J. Flood Risk Manag. 2016, 9, 87–96. [Google Scholar] [CrossRef]
- Shrestha, H.D. Vulnerability Assessment and Retrofitting of Existing Buildings in Aceh and Transfer of Knowledge to the Community. Disaster Risk Reduction 2015, 1, 219–239. [Google Scholar]
- Silva, M.M.; Costa, J.P. Flood Adaptation Measures Applicable in the Design of Urban Public Spaces: Proposal for a Conceptual Framework. Water 2016, 8, 284. [Google Scholar] [CrossRef] [Green Version]
- Brown, J.D.; Damery, S.L. Managing flood risk in the UK: Towards an integration of social and technical perspectives. Trans. Inst. Br. Geogr. 2002, 27, 412–426. [Google Scholar] [CrossRef]
- Liao, K.-H.; Le, T.A.; Van Nguyen, K.; Le, A.T. Urban design principles for flood resilience: Learning from the ecological wisdom of living with floods in the Vietnamese Mekong Delta. Landsc. Urban Plan. 2016, 155, 69–78. [Google Scholar] [CrossRef]
- Schmitt, T.G.; Thomas, M.; Ettrich, N. Analysis and modeling of flooding in urban drainage systems. J Hydrol. 2004, 299, 300–311. [Google Scholar] [CrossRef]
- Wu, S.-Y.; Yarnal, B.; Fisher, A. Vulnerability of coastal communities to sea-level rise: a case study of Cape May County, New Jersey, USA. Clim. Res. 2002, 22, 255–270. [Google Scholar] [CrossRef] [Green Version]
- Haigh, R.; Amaratunga, D. An integrative review of the built environment discipline’s role in the development of society’s resilience to disasters. Int. J. Disaster Resil. Built Environ. 2010, 1, 11–24. [Google Scholar] [CrossRef]
- Birkmann, J.; Cardona, O.D.; Carreño, M.L.; Barbat, A.H.; Pelling, M.; Schneiderbauer, S.; Kienberger, S.; Keiler, M.; Alexander, D.; Zeil, P.; et al. Framing vulnerability, risk and societal responses: The MOVE framework. Nat. Hazards 2013, 67, 193–211. [Google Scholar] [CrossRef]
- Kim, J.; Hastak, M. Social network analysis: Characteristics of online social networks after a disaster. Int. J. Inf. Manag. 2018, 38, 86–96. [Google Scholar] [CrossRef]
- Cutter, S.L.; Boruff, B.; Shirley, W.L. Social Vulnerability to Environmental Hazards*. Soc. Sci. Q. 2003, 84, 242–261. [Google Scholar] [CrossRef]
- Emrich, C.T.; Cutter, S.L. Social Vulnerability to Climate-Sensitive Hazards in the Southern United States. Weather. Clim. Soc. 2011, 3, 193–208. [Google Scholar] [CrossRef]
- Cutter, S.L.; Finch, C. Temporal and spatial changes in social vulnerability to natural hazards. Proc. Natl. Acad. Sci. USA 2008, 105, 2301–2306. [Google Scholar] [CrossRef] [Green Version]
- Contreras, D.; Chamorro, A. The spatial dimension in the assessment of socio-economic vulnerability challenges for an application on an urban scale, a systematic review. Nat. Hazards Earth Syst. Sci. Discuss. 2019, 1–43. [Google Scholar]
- Byrne, J.; Lo, A.Y.; Jianjun, Y. Residents’ understanding of the role of green infrastructure for climate change adaptation in Hangzhou, China. Landsc. Urban Plan. 2015, 138, 132–143. [Google Scholar] [CrossRef] [Green Version]
- Lennon, M.; Scott, M.; O’Neill, E. Urban Design and Adapting to Flood Risk: The Role of Green Infrastructure. J. Urban Des. 2014, 19, 745–758. [Google Scholar] [CrossRef]
- Thorne, C.R.; Lawson, E.; Ozawa, C.; Hamlin, S.; Smith, L. Overcoming uncertainty and barriers to adoption of Blue-Green Infrastructure for urban flood risk management. J. Flood Risk Manag. 2018, 11, S960–S972. [Google Scholar] [CrossRef]
- Aerts, J.C.; Botzen, W.J.W.; Emanuel, K.; Lin, N.; De Moel, H.; Michel-Kerjan, E. Evaluating Flood Resilience Strategies for Coastal Megacities. Sci. 2014, 344, 473–475. [Google Scholar] [CrossRef] [PubMed]
- Lang, M.; Golz, S.; Klijn, F.; Samuels, P. Resilience in the built environment: How to evaluate the impacts of flood resilient building technologies? EDP Sci. 2016, 7, 13001. [Google Scholar]
- Saidu, I.; Lal, M.D.; Idris, S.; Dharmasiri, L.M. Development of built environment and its implication on flood risk in Gombe Metropolis, Nigeria. Afr. J. Environ. Sci. Technol. 2016, 10, 111–116. [Google Scholar] [CrossRef]
- Pistrika, A.; Tsakiris, G.; Nalbantis, I. Flood Depth-Damage Functions for Built Environment. Environ. Process. 2014, 1, 553–572. [Google Scholar] [CrossRef] [Green Version]
- Stokols, D.; Lejano, R.P.; Hipp, J.R. Enhancing the Resilience of Human–Environment Systems: A Social Ecological Perspective. Ecol. Soc. 2013, 18, 33–46. [Google Scholar] [CrossRef] [Green Version]
- Berkes, F.; Ross, H. Community Resilience: Toward an Integrated Approach. Soc. Nat. Resour. 2013, 26, 5–20. [Google Scholar] [CrossRef]
- Saavedra, C.; Budd, W.W. Climate change and environmental planning: Working to build community resilience and adaptive capacity in Washington State, USA. Habitat Int. 2009, 33, 246–252. [Google Scholar] [CrossRef]
- Joerin, J.; Shaw, R.; Takeuchi, Y.; Krishnamurthy, R.R. Assessing community resilience to climate-related disasters in Chennai, India. Int. J. Disaster Risk Reduct. 2012, 1, 44–54. [Google Scholar] [CrossRef]
- Meyer, V.; Scheuer, S.; Haase, D. A multicriteria approach for flood risk mapping exemplified at the Mulde river, Germany. Nat. Hazards 2008, 48, 17–39. [Google Scholar] [CrossRef]
- Kubal, C.; Haase, D.; Meyer, V.; Scheuer, S. Integrated urban flood risk assessment – adapting a multicriteria approach to a city. Nat. Hazards Earth Syst. Sci. 2009, 9, 1881–1895. [Google Scholar] [CrossRef] [Green Version]
- Scheuer, S.; Haase, D.; Meyer, V. Exploring multicriteria flood vulnerability by integrating economic, social and ecological dimensions of flood risk and coping capacity: From a starting point view towards an end point view of vulnerability. Nat. Hazards 2011, 58, 731–751. [Google Scholar] [CrossRef]
- Haer, T.; Botzen, W.J.W.U.; Aerts, J.C. The effectiveness of flood risk communication strategies and the influence of social networks—Insights from an agent-based model. Environ. Sci. Policy 2016, 60, 44–52. [Google Scholar] [CrossRef]
- Aerts, J.C.J.H.; Botzen, W.J.; Clarke, K.C.; Cutter, S.L.; Hall, J.W.; Merz, B.; Michel-Kerjan, E.; Mysiak, J.; Surminski, S.; Kunreuther, H. Integrating human behaviour dynamics into flood disaster risk assessment. Nat. Clim. Chang. 2018, 8, 193–199. [Google Scholar] [CrossRef] [Green Version]
- Xie, Y. Development of drainage planning in view of frequent urban waterlogging disasters. Chin. J. City Plan Rev. 2013, 37, 45–50. [Google Scholar]
- Wong, T.-C.; Han, S.S.; Zhang, H. Population Mobility, Urban Planning and Management in China; Springer: Berlin/Heidelberg, Germany, 2015; pp. 1–13. [Google Scholar]
- Rowe, P.G.; Forsyth, A.; Kan, H.Y. China’s Urban Communities: Concepts, Contexts, and Well-being; Birkhäuser: Basel, Switzerland, 2016; pp. 22–41. [Google Scholar]
- Statistics, N.M.B. Nanjing Statistical Yearbook. Nanjing Municipal Bureau Statistics: Nanjing, China, 2019; pp. 30–58. [Google Scholar]
- Felsenstein, D.; Lichter, M. Social and economic vulnerability of coastal communities to sea-level rise and extreme flooding. Nat. Hazards 2014, 71, 463–491. [Google Scholar] [CrossRef]
- Zahran, S.; Brody, S.D.; Peacock, W.G.; Vedlitz, A.; Grover, H. Social vulnerability and the natural and built environment: A model of flood casualties in Texas. Disasters 2008, 32, 537–560. [Google Scholar] [CrossRef]
- Wilby, R.L. A review of climate change impacts on the built environment. Built Environ. 2008, 33, 31–45. [Google Scholar] [CrossRef] [Green Version]
- Ewing, R.; Cervero, R. Travel and the Built Environment. J. Am. Plan. Assoc. 2010, 76, 265–294. [Google Scholar] [CrossRef]
- Williams, B.; Onsman, A.; Brown, T. Exploratory factor analysis: A five-step guide for novices. Australas. J. Paramedicine 2010, 8, 1–13. [Google Scholar] [CrossRef] [Green Version]
- Costello, A.B.; Osborne, J. Best practices in exploratory factor analysis: Four recommendations for getting the most from your analysis. Pract. Assess. Res. Evaluation 2005, 10, 7. [Google Scholar]
- McManus, S.; Seville, E.; Vargo, J.; Brunsdon, D. Facilitated Process for Improving Organizational Resilience. Nat. Hazards Rev. 2008, 9, 81–90. [Google Scholar] [CrossRef] [Green Version]
Figure 1.
Location of the case study area.

Figure 2.
Comparison of Land Use and Surrounding Facilities Density between six communities.

Figure 3.
Flood resilience of community differences.

Figure 4.
Flood resilience at different stages for the relevant communities.


Table 1.
Basic information of the communities.
| Name | Type | Land Area (m2) | Construction Year | Building | Floor Area Ratio (%) | Green Ratio (%) |
|---|---|---|---|---|---|---|
| Jishan | Affordable | 56,521 | 2003 | small high-story | 2.3 | 35 |
| Textile Apartment | Reform | 24,436 | 2000 | multiple-story | 107 | 30 |
| Shuanghe | Commercial | 69,000 | 2005 | high-story | 1.74 | 35 |
| Paifang Street | Reform | 10,254 | 1995 | multiple-story | 2.4 | 40 |
| Zhoudao | Affordable | 232,000 | 2016 | high-story | 1.68 | 30 |
| Jiangxin Garden | Small property | 12,522 | 2001 | multiple-story | 1.63 | 18 |
Table 2.
The attribute of samples.
| Item | Classification | Number of People | Proportion (%) |
|---|---|---|---|
| Sex | Male | 118 | 49.8 |
| Female | 118 | 50.2 | |
| Age | 16–34 | 41 | 17.3 |
| 35–60 | 85 | 36.2 | |
| Over 60 | 110 | 46.5 | |
| Education | Primary school | 50 | 21.3 |
| Junior high school | 54 | 23 | |
| High school | 41 | 17.2 | |
| Undergraduate Postgraduate | 90 1 | 38.1 0.4 | |
| Length of residence | Less than 1 year | 4 | 1.6 |
| 3–5 years | 10 | 4.1 | |
| 5–10 years | 8 | 3.3 | |
| Over 10 years | 214 | 91 | |
| Income | Below 30,000 yuan | 91 | 38.5 |
| 30,000–50,000 yuan | 26 | 11.1 | |
| 50,000–100,000 yuan | 56 | 23.5 | |
| over 100,000 yuan | 63 | 26.9 | |
| Hu kou | Town | 198 | 83.8 |
| Countryside | 38 | 16.2 | |
| Hukou Location | Local | 215 | 90.9 |
| Migrant | 21 | 9.1 |
Table 3.
The 26 indicators of community resilience.
| Stage | Category | Variable |
|---|---|---|
| Pre-disaster preparation | Disaster prevention system | Flood emergency plan |
| Community emergency response system | ||
| Flood knowledge | Disaster education and training | |
| Emergency evacuation knowledge | ||
| Evacuation skills | ||
| Flood warning level | ||
| Disaster information update | ||
| Emergency response | Emergency evacuation efficiency | Emergency vehicle passage |
| Emergency shelter | ||
| Evacuation service radius | ||
| Emergency rescue efficiency | Operational efficiency of emergency facilities | |
| Emergency supplies | ||
| Rescue accessibility | ||
| Emergency medical services | ||
| Community response efficiency | Property service quality | |
| Government bailouts | ||
| Community organization | ||
| Neighborhood mutual aid | ||
| Post-disaster recovery | Infrastructure | Building |
| Road | ||
| Power supply system | ||
| Water supply system | ||
| Gas system | ||
| Public space | Green space | |
| Square | ||
| Underground garage |
Table 4.
Explanation of variables.
| Conceptual Dimension | Variable | Measurement① | Unit |
|---|---|---|---|
| Density | Building coverage ratio | The proportion of all kinds of building base area in the community land area | % |
| Number of floors | The total number of floors of residential buildings within the community | floor | |
| Road network density | To investigate community geometric center as the center, within a radius of 1 km of road total length | km | |
| Design | Proximity to river | Is there any water body (river, pond, etc.) within 1 km of the community? Yes (1), no (0) | - |
| Community Elevation② | Compared with the surrounding elevation, the community is very low (1), low (2), comparable (3), high (4) | - | |
| Year of Construction | The actual completion time of buildings within the community | Number of year | |
| Floor Area Ratio (FAR) | The ratio of the total building area of all buildings within the community to the area of the plot | ||
| Diversity | Green space ratio | Proportion of the total residential area of all types of green land within the community. low (1 for less than 25%), medium (2 for 25% to 30%) and high (3 for higher than 30%) | % |
| Land diversity | The number of land types within 1 km around the community, low (1for less than 3 types of land use), medium (2 for 4 to 5 types) and high (3 for more than 5 types) | Rank | |
| Destination Accessibility | Bus accessibility | According to the number of bus stations within 1 km around the community, the number is divided into low (1 for less than 3 station), medium (2 for 4 to 5 station and high (3 for more than 5 stations), | Rank |
| Subway accessibility | According to the number of subway stations within 1 km around the community, the number is divided into low (1 for no station), medium (2 for 1 station) high (3 for more than 2 stations), in Ascending order① | Rank | |
| Distance to Transit | Distance to the nearest subway station | Community’s geometric center as the center of the circle, linear distance to the nearest subway station | m |
| Distance to the nearest bus station | Community’s geometric center as the center of the circle, linear distance to the nearest bus station | m | |
| Control variables: individual characteristics of residents | Gender | Male = 1, female = 0 | - |
| Age | 16–34 years old (1), 35-55 years old (2), over 55 years old (3) | - | |
| Annual income | Below 30,000 yuan (1), 30,000–50,000 yuan (2), 50,000–100,000 yuan (3), and over 100,000 yuan (4) | - | |
| Residence | Urban (1), rural (2) | - |
Note: ① At the community level, the land diversity, bus accessibility, subway accessibility, and similar factors are more meaningful in a relative sense rather than an absolute one. For that, we used ordinal rather than interval measures for them. The clustering method was used to determine the points of division. ② The community elevation was measured in a relative way. In detail, ‘very low’ means the elevation of the community is at least 6 m lower than that of the surrounding area; ‘low’ means the difference ranged from –6 m to –9 m; ‘comparable’ means the difference ranged from −8 m to 10 m; and ‘high’ means the community is at least 10 m higher than the surrounding areas.
Table 5.
In-depth interview question guide for commuity residents.
| 1. Which places in your community are areas where rainstorms are likely to cause stagnant water? |
| 2. What do you think are the reasons for the stagnant water in the community? |
| 3. What do you think the community management department (property) has done in terms of providing weather warnings, information statuses, and information updates before the onset of heavy rains? |
| 4. Does the community have facilities such as weather bulletin boards? |
| 5. In the face of heavy rain and flood, did the community manager carry out any rescue measures? What are the specific counter measures? Are you satisfied with the implementation strength and efficiency of the community in this regard? |
| 6. Is a river or a pond located near your community? Does it affect the stagnant water in the community? |
| 7. When stagnant water is a serious problem, has the government paid attention to the situation of the community and has it taken any responsive measures, such as distributing supplies? |
| 8. What rectifications has the community carried out after experiencing stagnant water? |
| 9. What suggestions do you have for improving the stagnant water situation in your community? Do you think some areas in the community need improvement? |
| 10. Have you considered moving out of the community when the stagnant water situation is serious? Why? |
Table 6.
Factor Analysis of an urban community built environment.
| Factor | Evaluation Index System | Load Factor | The Eigenvalue | Variance Contribution Rate % | Cumulative Variance Contribution Rate % |
|---|---|---|---|---|---|
| F1 emergency preparedness factor | emergency supplies distribution | 0.848 | 3.970 | 15.269 | 15.269 |
| efficiency of emergency facilities | 0.803 | ||||
| F2 infrastructure factor | power supply system | 0.896 | 3.509 | 13.496 | 28.765 |
| water supply system | 0.864 | ||||
| gas system | 0.832 | ||||
| F3 pre-disaster relief factor | evacuation skill | 0.819 | 3.306 | 12.714 | 41.479 |
| flood warning level | 0.808 | ||||
| F4 emergency evacuation factor | emergency shelter | 0.915 | 2.817 | 10.833 | 52.312 |
| service radius of evacuation place | 0.908 | ||||
| F5 public space factor | Square | 0.844 | 2.261 | 8.696 | 61.003 |
| green space | 0.778 | ||||
| F6 disaster prevention system factor | integrated community emergency response command system | 0.793 | 2.018 | 7.760 | 68.767 |
| flood emergency plan | 0.708 | ||||
| F7 emergency medical factors | emergency medical aid system | 0.713 | 1.267 | 4.873 | 73.640 |
Table 7.
Statistical description of the independent variables.
| Variables | Proportions and Statistical Indices | |
|---|---|---|
| Explanatory variables | The topography | high (4)—27.1% comparable (3) —0%, low (2)—56.7%, very low (1)—16.2% |
| Proximity to river | Yes (1)—70.4%, no (0)—29.6% | |
| Building coverage ratio | Mean=0. 202; Standard Deviation=0. 067; Maximum=0.34; Minimum=0.15 | |
| Green space ratio | low (1)—27.1%, medium (2)—63.2%, high (3)—9.7% | |
| Land diversity | low (1)—25.9%, medium (2)—17.4%, high (3)—56.7% | |
| Number of floors | Mean=9.156; Standard Deviation=6.3855; Maximum=25; Minimum=1 |
Note: Proportions of cases are provided for categorical and ordinal variables, and statistical statistical indices are provided for interval variables. Description of control variables are shown in Table 2.
Table 8.
Binary logistic regression results for the flood resilience of urban community built environments.
Table 8.
Binary logistic regression results for the flood resilience of urban community built environments.
| Variable | B | Standard Error | Wald | Significance | Exp(B) |
|---|---|---|---|---|---|
| The elevation | 1.540 | 0.761 | 4.100 | 0.043 | 4.664 |
| Proximity to river | −12.952 | 3.717 | 12.143 | 0.000 | 0.000 |
| Building coverage ratio | 2.109 | 0.540 | 15.256 | 0.000 | 8.243 |
| Number of floors | 0.165 | 0.089 | 3.439 | 0.064 | 1.180 |
| Green space ratio | −10.379 | 3.266 | 10.103 | 0.001 | 0.000 |
| Land diversity | −7.872 | 2.164 | 13.233 | 0.000 | 0.000 |
© 2020 by the authors. Licensee MDPI, Basel, Switzerland. This article is an open access article distributed under the terms and conditions of the Creative Commons Attribution (CC BY) license (http://creativecommons.org/licenses/by/4.0/).
Share and Cite
MDPI and ACS Style
Chen, Y.; Liu, T.; Chen, R.; Zhao, M. Influence of the Built Environment on Community Flood Resilience: Evidence from Nanjing City, China. Sustainability 2020, 12, 2401. https://0-doi-org.brum.beds.ac.uk/10.3390/su12062401
AMA Style
Chen Y, Liu T, Chen R, Zhao M. Influence of the Built Environment on Community Flood Resilience: Evidence from Nanjing City, China. Sustainability. 2020; 12(6):2401. https://0-doi-org.brum.beds.ac.uk/10.3390/su12062401
Chicago/Turabian StyleChen, Yi, Tao Liu, Ruishan Chen, and Mengke Zhao. 2020. "Influence of the Built Environment on Community Flood Resilience: Evidence from Nanjing City, China" Sustainability 12, no. 6: 2401. https://0-doi-org.brum.beds.ac.uk/10.3390/su12062401
Note that from the first issue of 2016, this journal uses article numbers instead of page numbers. See further details here.