Article

Pb(II) Bio-Removal, Viability, and Population Distribution of an Industrial Microbial Consortium: The Effect of Pb(II) and Nutrient Concentrations

Department of Chemical Engineering, Faculty of Engineering, Built Environment and Information Technology, University of Pretoria, Pretoria 0002, South Africa
*
Author to whom correspondence should be addressed.
Sustainability 2020, 12(6), 2511; https://0-doi-org.brum.beds.ac.uk/10.3390/su12062511
Submission received: 3 February 2020 / Revised: 2 March 2020 / Accepted: 15 March 2020 / Published: 23 March 2020
(This article belongs to the Special Issue Process Integration and Optimisation for Sustainable Systems)

Abstract

:
This study presents the effect of aqueous Pb(II) and nutrient concentrations on the Pb(II)-removal, biomass viability, active species identities, and population distribution of an industrial Pb(II) resistant microbial consortium. The studied consortium has previously shown to be highly effective at precipitating Pb(II) from solution. At all conditions tested (80 and 500 ppm Pb(II), and varying nutrients conditions) it was found that circa 50% of Pb(II) was removed within the first 3 h, with the absence of any visual changes, followed by a slower rate of Pb(II) removal accompanied by the formation of a dark precipitate. The Pb(II) removal was found to be independent of microbial growth, while growth was observed dependent on the concentration of Pb(II), nutrients, and nitrates in the system. SEM analysis indicated viable bacilli embedded in precipitate. These findings indicate that precipitation occurs on the surface of the biomass as opposed to an internal excretion mechanism. BLAST (Basic Local Alignment Search Tool) results indicated Klebsiella pneumoniae as the active species responsible for Pb(II) bioprecipitation for both the 80 and 500 ppm isolated colonies, while a diverse population distribution of organisms was observed for the streak plate analyses. A quicker microbial generation rate was observed than what was expected for Klebsiella pneumoniae, indicating that the overall consortial population contributed to the growth rates observed. This study provided insights into the factors affecting Pb(II) bio-removal and bioprecipitation by the investigated industrially obtained consortium, thereby providing invaluable knowledge required for industrial application.

1. Introduction

Lead (Pb) is an abundant and pernicious environmental contaminant posing significant human health risks; the maximum safe concentration of Pb in drinking water is estimated at 0.01 ppm [1]. Serious human health risks include immunological, neurological, cardiovascular, reproductive, as well as developmental impacts [2]. The recovery of Pb, as opposed to the mere removal of Pb from the environment, is of prime interest as the United States Geological Survey estimates that only 17 years’ supply of global raw workable Pb reserves is available [3]. Pb has an annual consumption rate of about 5 million t/a [4] with a total of 83.3 × 10⁶ t reserve remaining worldwide [3].
Various chemical and physical methods have been implemented historically to remove Pb from polluted wastewaters, but few are financially and environmentally sustainable. Bioremediation is a cost-effective solution for the removal and recovery of heavy metals from solution. Various microorganisms have exhibited the capacity to remediate Pb(II) from polluted environments with the aid of various methods by reducing the mobility and bioavailability of Pb(II), including bioaccumulation, surface biosorption, extracellular sequestration, and bioprecipitation [5]. Studies investigating biological Pb(II) removal are summarized in Table 1.
The current research team has shown in previous studies that effective removal and recovery of Pb is possible using an industrially obtained microbial consortium, with the formation of a dark grey precipitate when using Luria Bertani broth (LB) as growth substrate [10]. The precipitate in question was identified as predominantly PbS and a fractional amount of elemental Pb under anaerobic conditions [11].
This study aimed to determine the effect of Pb(II) concentration and availability of nutrients on Pb(II) removal, growth, active Pb(II) precipitating microbes, and population distribution of the industrially obtained Pb(II)-resistant consortium. Experiments were conducted under anaerobic batch conditions at 35 °C. The study is applicable as a sustainable method is yet to be developed to not only remove but also recover Pb(II) from polluted wastewater. This method of bio-removal could provide an ideal removal method for large-scale implementation in various industries as a simple cost-effective method to remediate and rehabilitate Pb-containing effluents or environmental Pb contamination.

2. Materials and Methods

2.1. Project Overview

The experimental procedures implemented in this study are summarized in Table 2 below. For comparison, the Pb(II) and substrate concentrations used were adopted from previous studies conducted by this team [9,12].

2.2. Materials

All batch reactor experiments were set up anaerobically in 100 mL serum bottles. A Pb stock solution was prepared with Pb(NO3)2 (Merck, Kennelworth, NJ, USA). Standard Miller Luria Bertani (LB) Broth (Sigma Aldrich, St Louis, MO, USA) was used as rich growth media made to a final concentration of 25 mg/L or simulated LB broth, which consists of double the amount of nutrients and a decreased concentration of NaCl. Metabolic activity measurements were conducted with the aid of 3-(4,5-dimethylthiazol-2-yl)-2,5-diphenyl tetrazolium bromide (MTT) and the organic solvent dimethyl sulfoxide (DMSO) at a wavelength of 550 nm (Sigma Aldrich, St. Louis, MO, USA). Nitrate levels were tested using a nitrate testing kit (Merck, Darmstadt, Germany) and measured photometrically using a Spectroquant Nova 600 (Merck, Darmstadt, Germany).

2.3. Microbial Culture

The specific Pb(II)-resistant microbial consortium was obtained from a borehole at an automotive battery recycling plant in Gauteng, South Africa. The inoculum was prepared by adding 1 g of Pb(II)-contaminated soil to a mixture of LB broth and 80 ppm Pb(II) in an anaerobic 100 mL serum bottle, and incubated for 24 h at 32 °C at 120 rpm. Glycerol was added to the matured inoculum to a final ratio of 20% v/v and stored cryogenically at −77 °C. The precultures were thereafter prepared from the cryogenically stored inoculum by adding one loop of inoculum to a 100 mL anaerobic serum bottle containing a mixture of LB broth and either 80 ppm Pb(II) or 500 ppm Pb(II). The reactors were purged with nitrogen gas for 3 min and sealed with a rubber stopper and metal clamp to enable an anaerobic environment, and they were incubated at 30 °C and 120 rpm for 3 d to test for contamination before inoculation of the experiments.

2.4. Experimental

The Pb(II) stock solution and growth medium (standard or simulated LB) were prepared and autoclaved separately, after which they were cooled to room temperature. The Pb(II) stock solution was added to the growth medium in a biological safety cabinet under sterile conditions. A 0.2 mL sample of inoculum (prepared pre-culture) was added to the serum bottles. The serum bottles were each purged with nitrogen gas for 3 min and sealed to ensure anaerobic conditions. The batch reactors were placed in a shaker incubator at 120 rpm and 35 °C for the duration of the experiment. All datasets were conducted in triplicate to ensure repeatability. Controlled sampling and analytical conditions were maintained to minimize experimental error. Abiotic controls were conducted to confirm that any changes that occur in the reactors are of biological and not chemical origin. The abiotic controls were run for a period of 72 h with no added inoculant to the reactor and incubating with the batch reactors to ensure equivalent conditions

2.5. Sampling

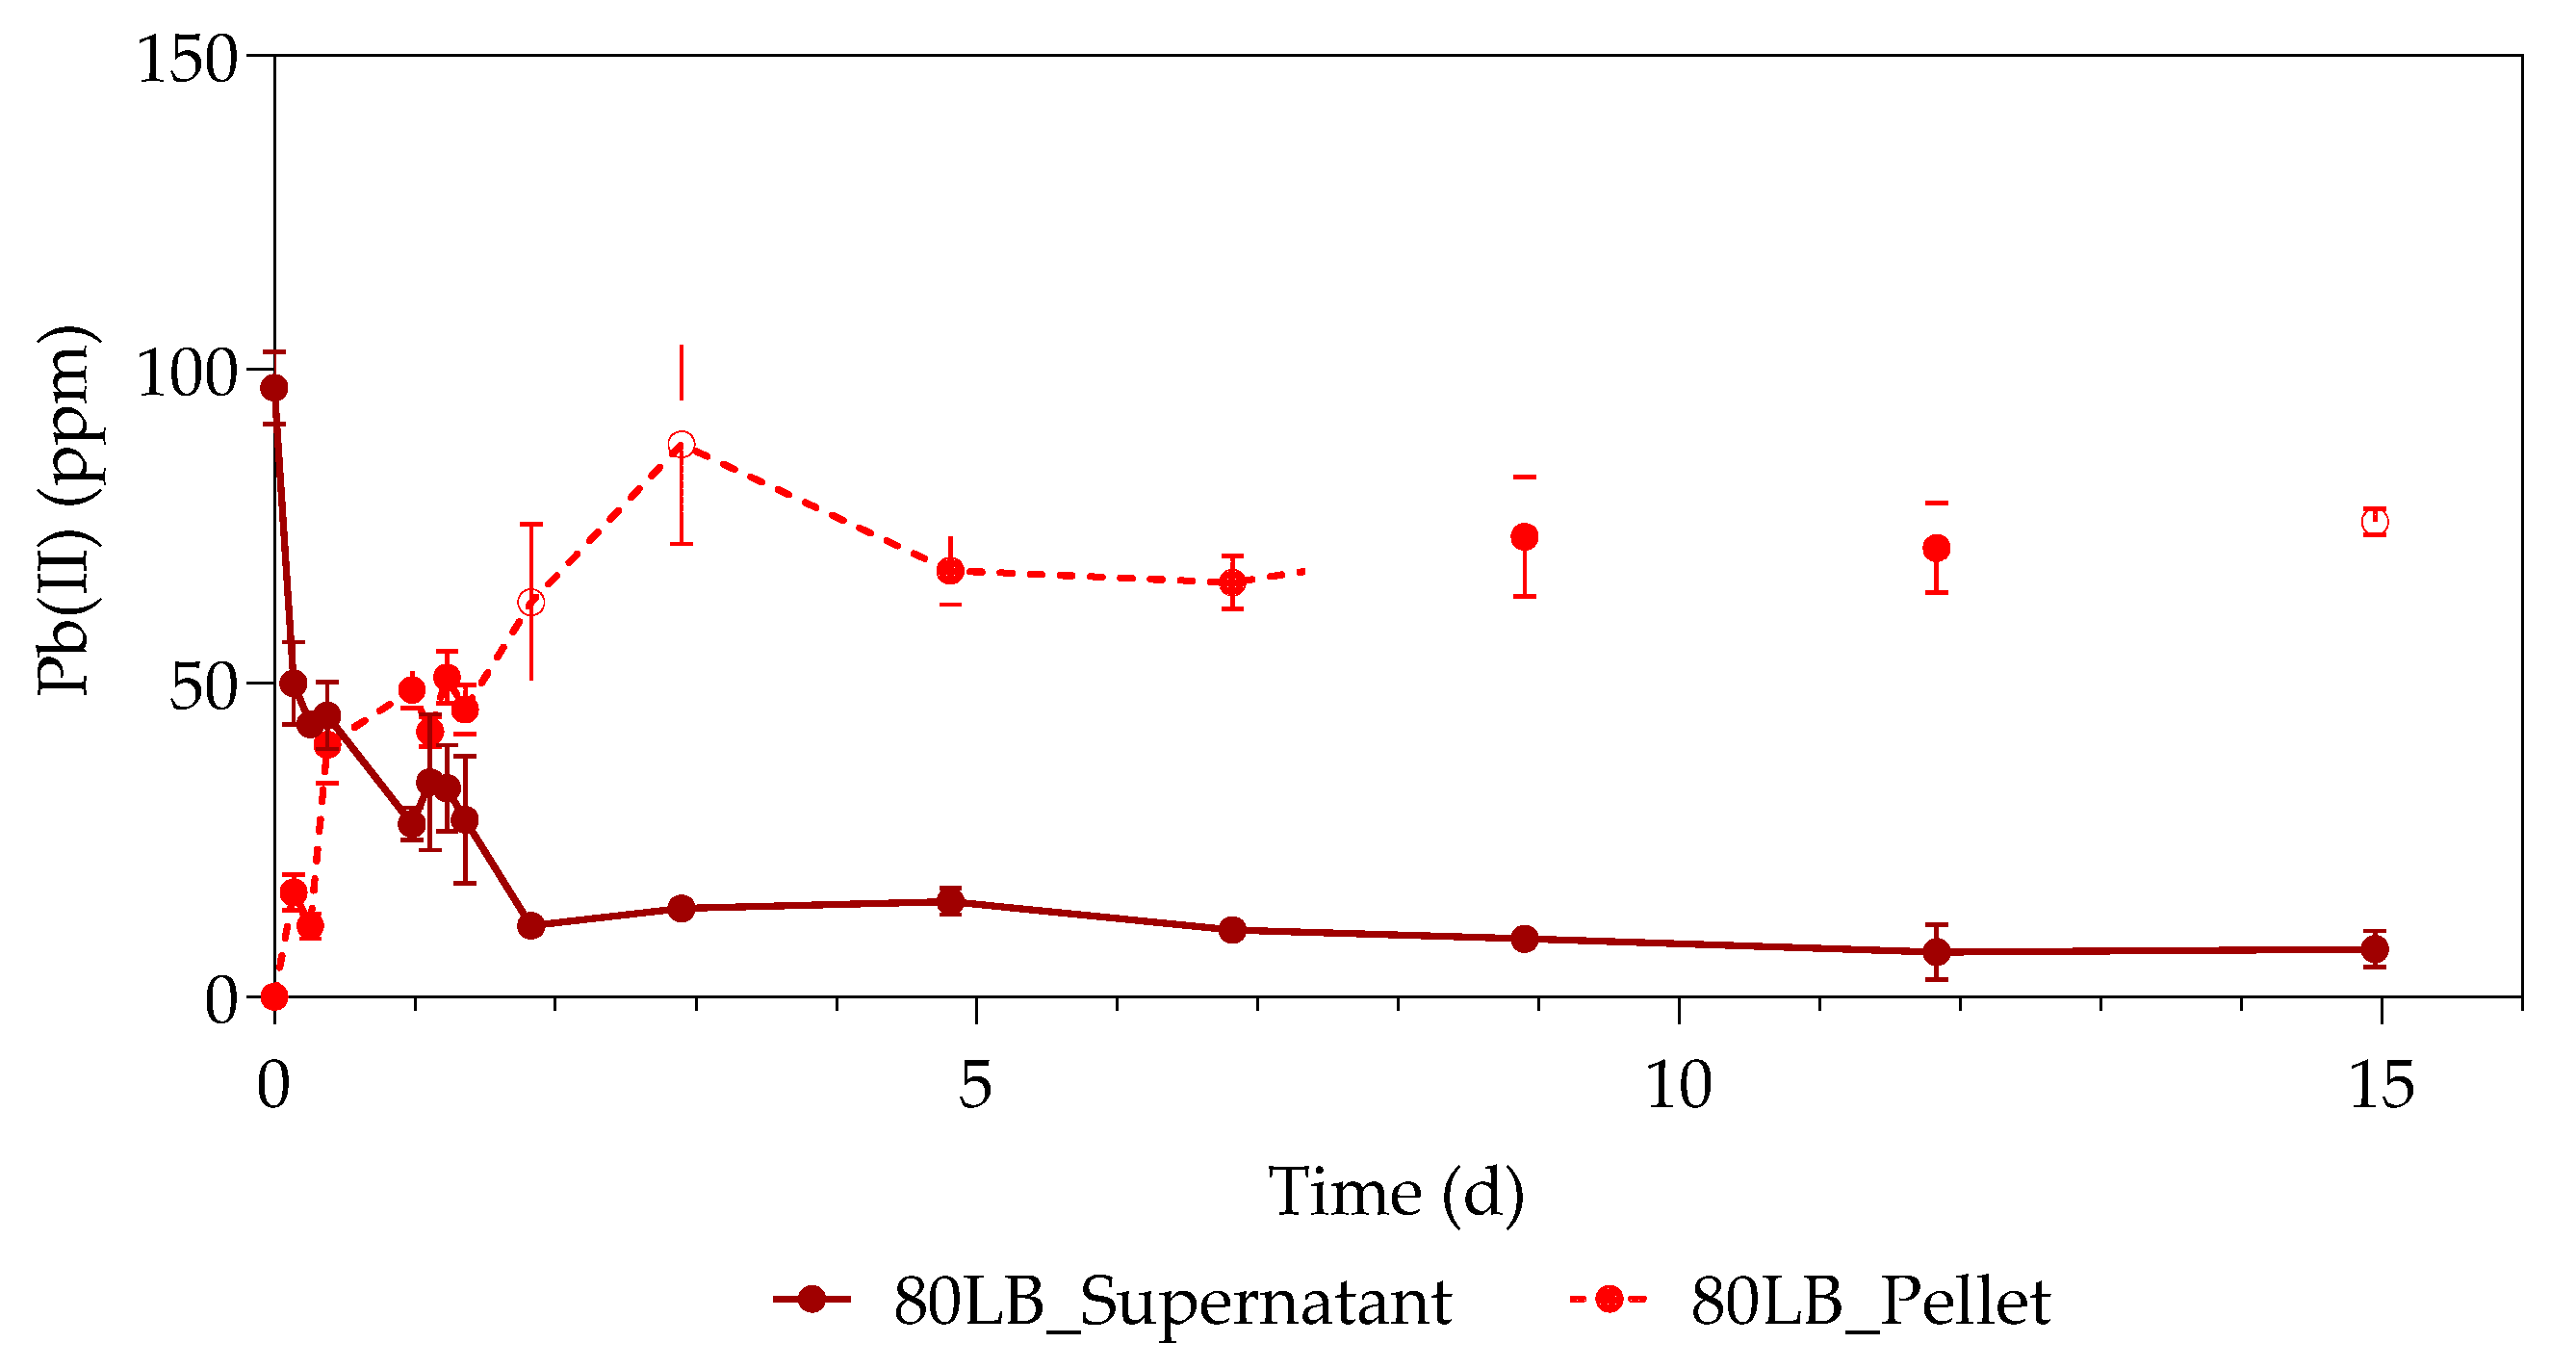
The first part of the study (all the datasets) was conducted over a period of 33 h, with samples taken every 3 h at 3, 6, 9, 24, 27, 30, and 33 h. The second part of the study (only samples containing 80 ppm with standard LB and 500 ppm with simulated LB) was extended for a duration of 15 days, taking samples every day from the 48 h onwards. The sealed serum bottles were shaken thoroughly before sampling, after which a hypodermic needle and sterile syringe were used to pierce the rubber stopper.

2.6. Batch Reactor Analysis

For each 1 mL sample, the residual aqueous Pb(II) in the sample supernatant and the Pb precipitated in the pellet were measured using an atomic absorption spectrometer (Perkin Elmer AAnalyst 400, Waltham, MS, USA) with a Pb Lumina hollow cathode lamp. The aqueous Pb(II) in the supernatant was directly analyzed from the respective 1 mL samples, while the precipitated pellet was digested in 0.1 mL 55% nitric acid (Glassworld, Johannesburg, South Africa) and 0.1 mL distilled water. Once the pellet was completely liquidized, water was added to a total volume of 1 mL dissolved sample and analyzed for Pb content.
Metabolic activity was quantified with a method using 3-(4,5-dimethylthiazol-2-yl)-2,5-diphenyl tetrazolium bromide (MTT) and spectrophotometric measurements at 550 nm. MTT is a water-based yellow dye that can be reduce to water-insoluble purple formazan crystals by dehydrogenase enzymes in viable cells. The crystals were then extracted with the aid of the organic solvent DMSO. Metabolic activity measurements were performed as soon as possible after sampling and quantified spectrophotometrically at 550 nm [13]. Two sets of analyses were performed—one with biomass and the other without—to account for background interference and medium interaction with the MTT and DMSO. The samples were filtered with 25 mm nylon syringe filters with 0.45 μm pores (Anatech, Randburg, South Africa), to be recorded as the samples without biomass. The rest of the analysis was conducted by diluting the sample (with or without biomass), adding MTT, and finally incubated for precisely one hour at 35°C. The samples were then extracted with DMSO. The absorbance at 550 nm of the DMSO solution was measured and used as an indication of metabolic activity and, therefore, growth.
The supernatants and digested pellets of the samples were analyzed by using the TOC-V (option for liquid samples) on the Total Organic Carbon Analyzer (SHIMADZY, Kyoto, Japan) to test for their total organic carbon (TOC) content. The liquid samples (supernatant and digested pellet) were diluted, placed in 30 mL sample vials, and tested on the autosampler. Sodium persulfate and phosphoric acid were used by the instrument as oxidizers, with nitrogen as carrier gas. A method was created with a calibration curve using sucrose (Merck, Darmstadt, Germany).
The samples used for nitrate testing were stored and measured at a later stage with a nitrate testing kit. Nitrate ions reacted with a form of benzoic acid in sulfuric acid to form a red nitro solution that was measured photometrically using the Spectroquant Nova 600 (Merck, Darmstadt, Germany).

2.7. Microbial Plate Preparation for Characterization

Spread and streak plates were prepared for the purpose of microbial characterization. A simulated LB agar was made and contained 20 g/L tryptone, 10 g/L yeast extract, 1 g/L NaCl, and 15 g/L agar (Sigma Aldrich, St Louis, MO, USA) as opposed to standard LB agar that contained 25 g/L LB (10 g/L tryptone, 5 g/L yeast extract, 10 g/L NaCl) and 15 g/L agar. The agar and Pb(II) stock solutions were autoclaved separately. The molten agar solutions were subsequently spiked with Pb(II) to produce 80 and 500 ppm concentrations. The agar was then poured into sterile petri dishes and left to solidify.
The serially diluted spread plates were prepared using the appropriate pre-cultures. The pre-cultures were diluted 4 times serially, each time diluting the previous concentrate 10 times with sterilized distilled water. The plates were evenly spread with a sterilized glass rod after adding 0.1 mL of the final dilution on each plate.
Streak plates were also prepared by dipping a sterile inoculation loop in the relevant pre-cultures and streaking it across the plate. Once all the plates were prepared, they were sealed with parafilm (Bemis, Oshkosh, WI, USA) and placed upside down in an airtight glass jar with an AneroGenTM sachet (Oxoid, Thermo Scientific, Basingstoke, Hampshire, UK), to ensure anaerobic conditions. The jars were incubated at 35 °C for seven days to allow for sufficient growth, followed by analysis.

2.8. Microbial Characterization

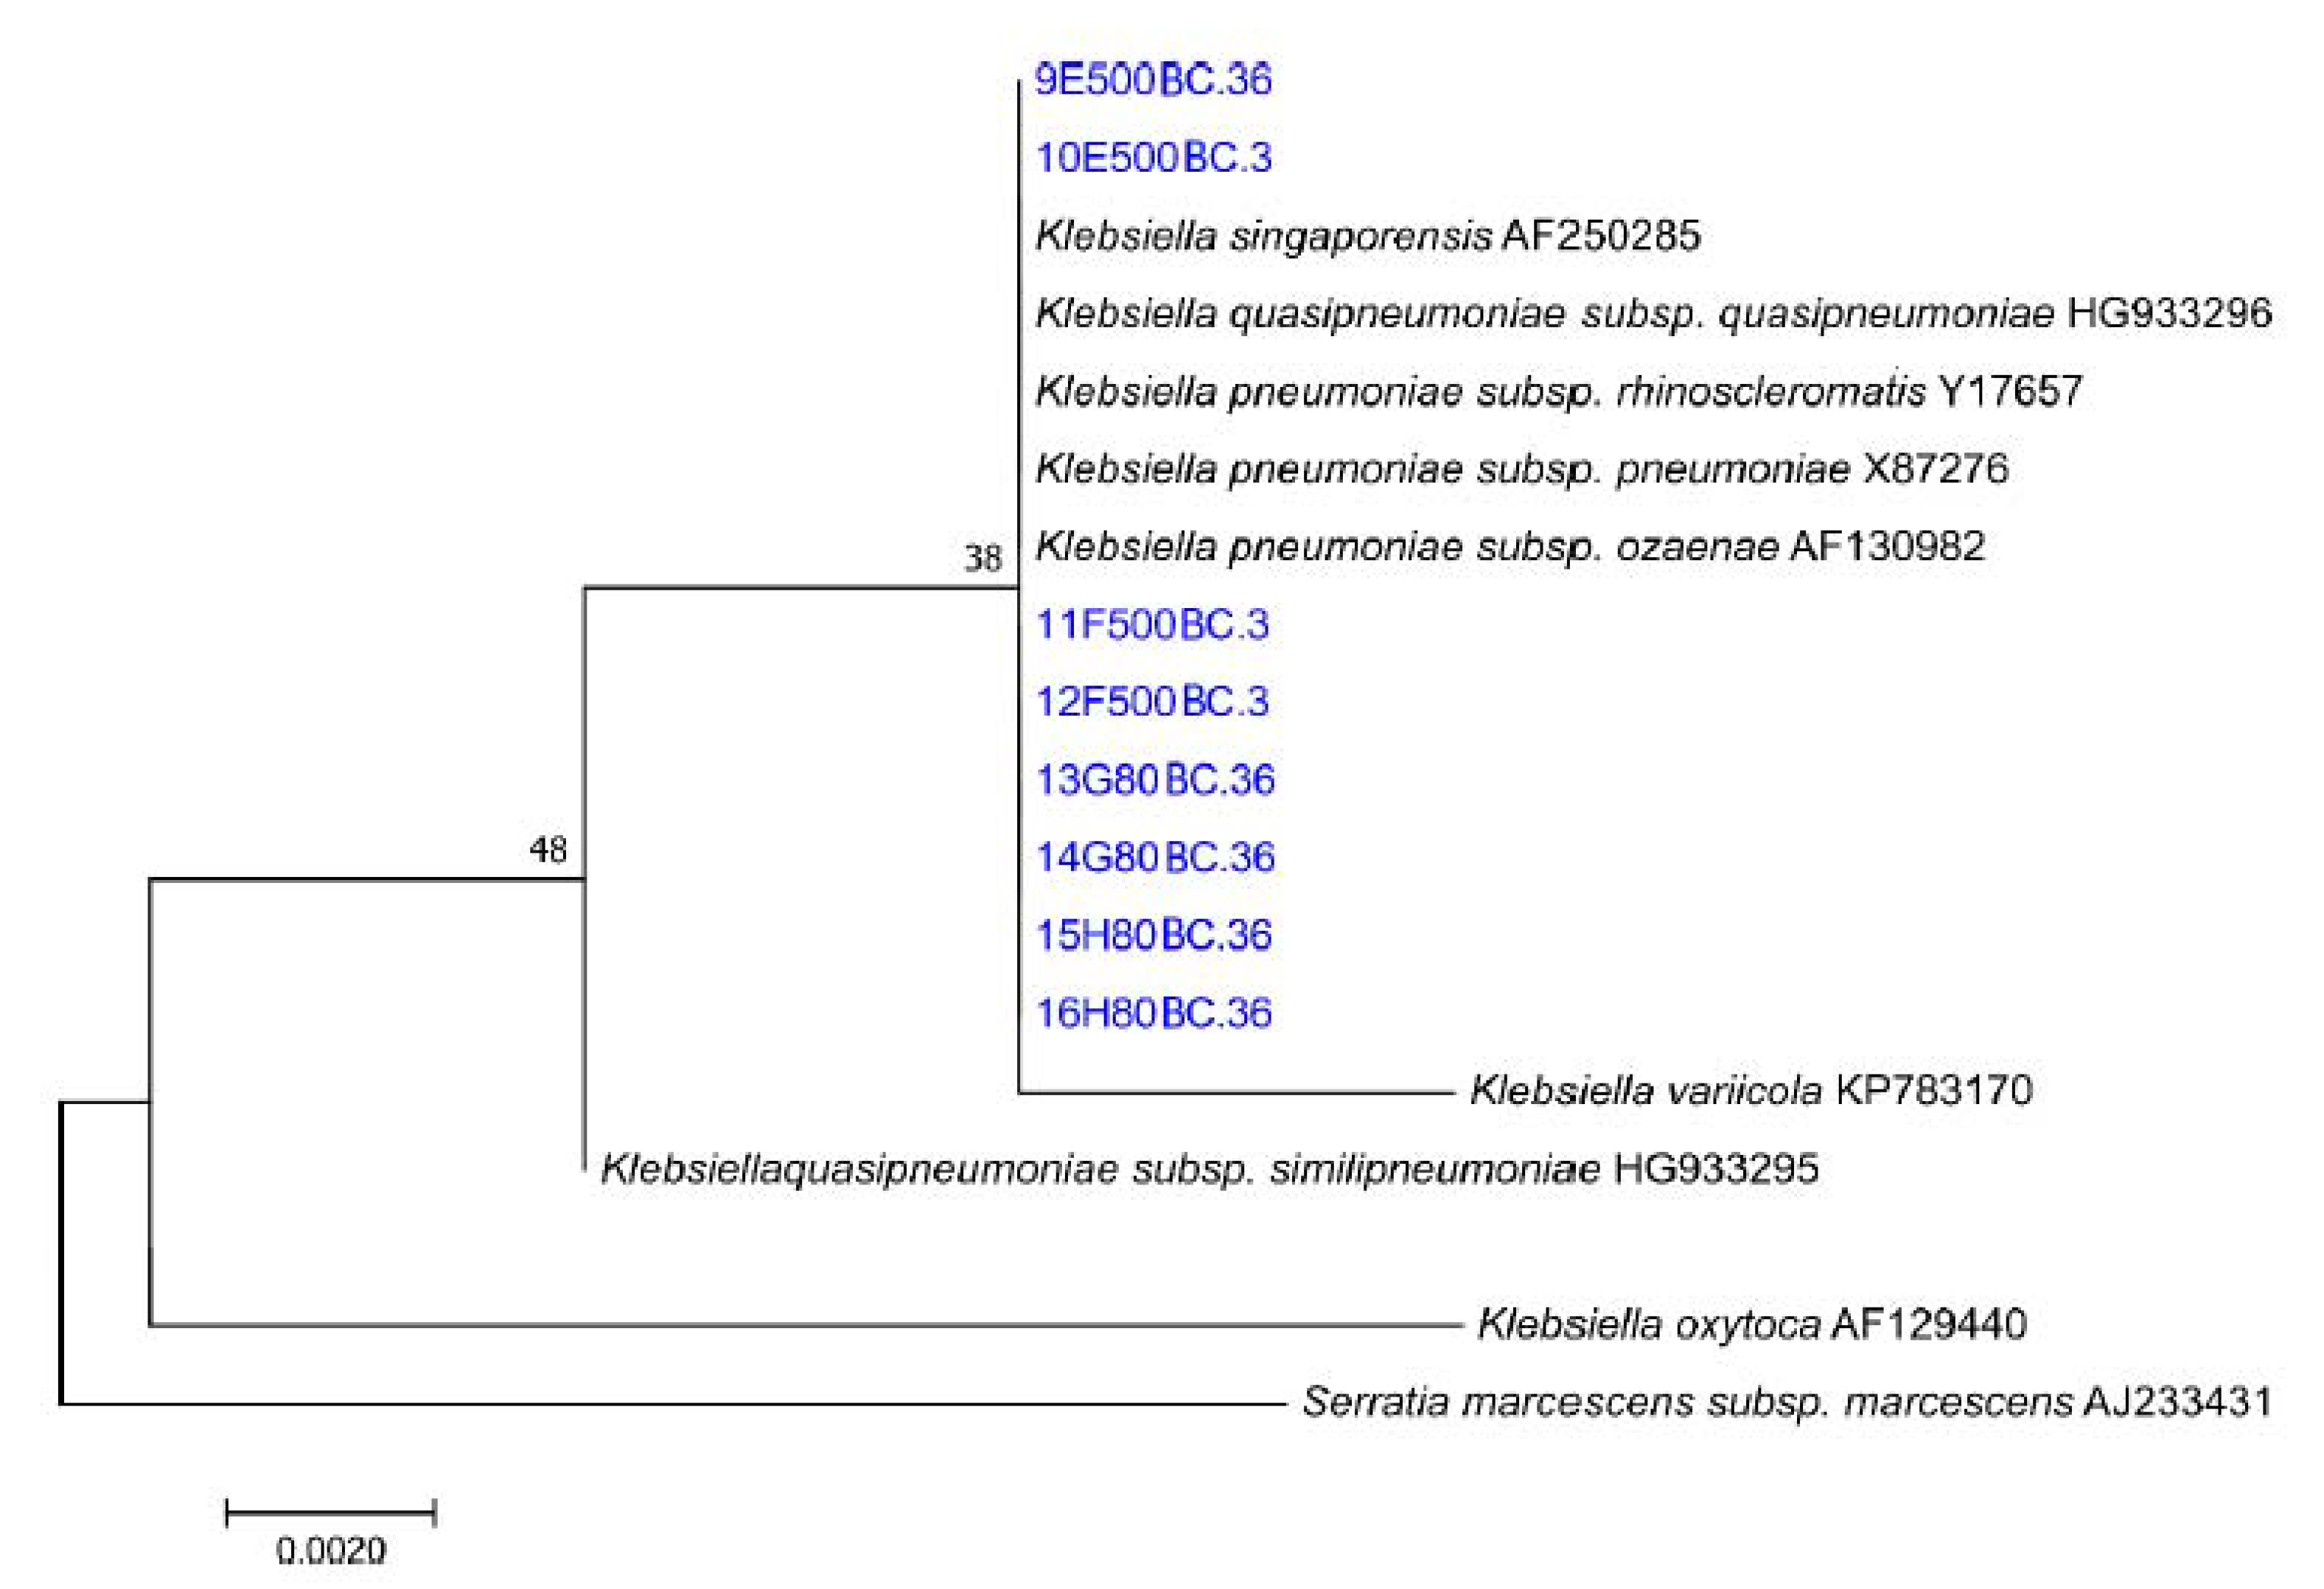
Four colonies were identified on each spread plate: two that represented the dominant color (dark brown/black) and shape of the overall colonies present and two that appeared to differ from the rest. Each selected colony was isolated and cultivated. The strain identification was based on the ±700 bp partial sequence of the 16S rRNA gene of the organisms. The sequences were compared against the GenBank of the National Center for Biotechnology in the United States of America with the aid of a basic BLAST (Basic Local Alignment Search Tool) search. The phylogenetic neighbors were obtained using the BLAST program against a database of type strains of valid published prokaryotic names (http://www.ezbiocloud.net/) for each isolated sample.
Streak plate analysis involved trimming data and only using >q20 reads. Every read was BLASTED, and the data saved. The top hit for every BLAST result was recorded and noted of how many times each species appeared as a hit. The read count is the measurement of the number of reads that matched the relevant organism name.

2.9. SEM Analysis

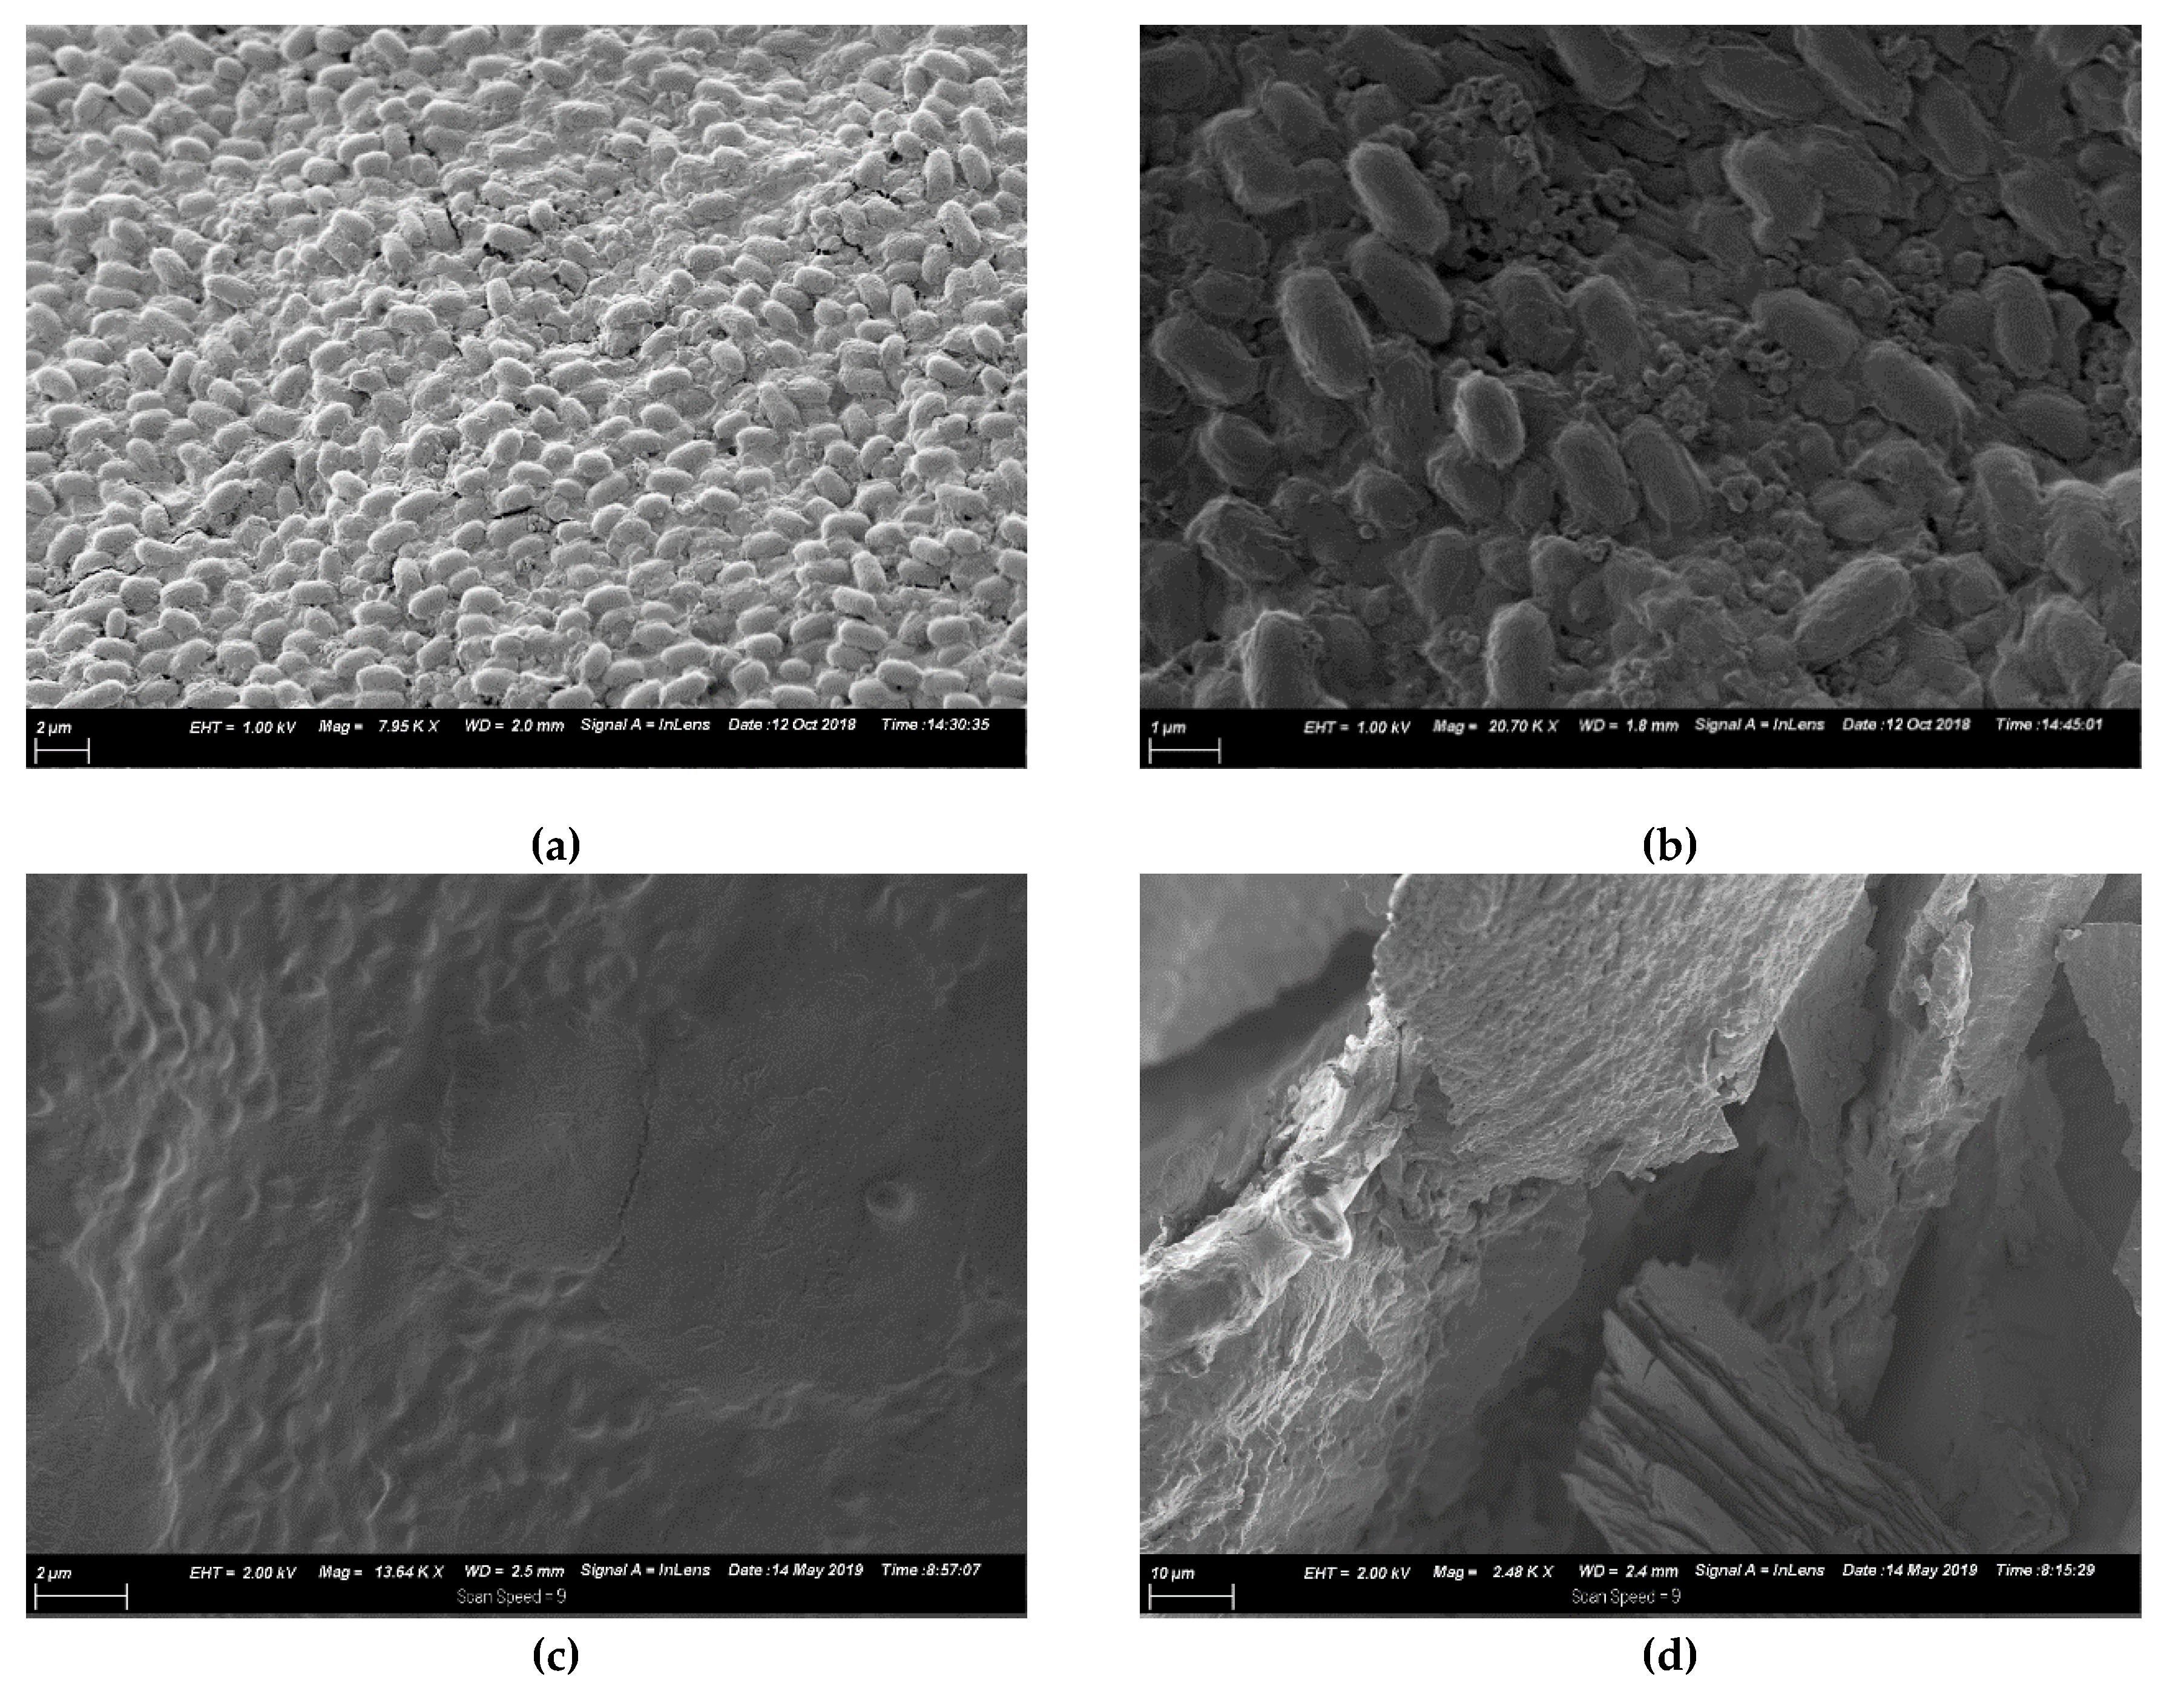
The morphology of the precipitate was investigated using scanning electron microscopy (SEM) and X-ray photoelectron spectroscopy (XPS). The main advantages of these methods are that the precipitate can remain in its original form for analysis, and only a small amount of precipitate sample is required to complete the analysis.

Sample Preparation and Analysis

The appropriate samples were centrifuged at 9000 rpm and 20 °C for 10 min. The precipitate was centrifuged and washed 6 times. The samples were subsequently dried in anaerobic sterile glass jars with an anaerobic indicator (Oxoid, Thermo Scientific, Basingstoke, Hampshire, UK) and AneroGenTM sachet (Oxoid, Thermo Scientific, Basingstoke, Hampshire, UK) in the presence of silica gel. The jars were subsequently sealed and left to dry overnight. The samples were analyzed using a Zeiss Ultra PLUS FEG scanning electron microscope (SEM).

3. Results

3.1. Pb(II) Removal

The visual results for the initial 33 h of Pb(II) removal are presented in Table 3 below. The first visual changes only occurred after 6 h, with the initial change only that of growth, not precipitation. Precipitation only appeared after 24 h for most of the 80LB reactors and at 27 h for the 500Sim reactors, followed with complete color change after 33 h. It was observed that some of the reactors in triplicate lagged its peers (80LB R1), but the measurements taken for all analyses did not evidence significant differences to the other coupled reactors, and a visual anomaly was concluded. The same was observed in die 500LB reactors with a single reactor changing color dramatically quicker than the rest. Again, little difference was observed in measurements obtained. The 500LB reactors did not express such a dramatic color change as the 500Sim reactors.
From the abiotic controls (Table 3), it was observed that no visible changes took place in the reactors. The Pb(II) concentrations were measured and found to be nearly unchanged. The initial Pb(II) measurement was measured as 85 ppm, and after 72 h 86.5 ppm, indicating a small variation in Pb(II) concentration (1.8%). This is within the standard accuracy of the AAnalyst 400 of 1% to 3% specified by the supplier [14]. From these findings, it can be concluded that any precipitation and Pb(II) removal was of biological origin.
All the experiments were conducted in triplicate and the standard deviations plotted as error bars for all data. The supernatant Pb(II) removal results are presented in Figure 1 below. The Pb(II) concentrations in the digested pellets are presented below in Figure 2. Both the respective 500 and 80 ppm datasets finished at near-identical Pb(II) concentrations despite the difference in initial nutrient concentrations, with 500Sim resulting at 245.38 ± 22.74 ppm, 500LB at 262.22 ± 22.31 ppm, 80Sim at 24.50 ± 3.09 ppm, and 80LB at 28.29 ± 8.32 ppm. Most of the Pb(II) was removed within the first 3 h, roughly 50% for all the reactors. The samples with standard LB (thus, half the amount of nutrients) removed Pb(II) slightly quicker than those containing simulated LB for both concentrations. A sharp decrease in Pb(II) removal was observed in all the reactors for the first 3 h followed by a slower decrease in Pb(II) concentration. From these findings, it could be concluded that the reactors did not experience substrate depletion within the first 3 h of rapid Pb(II) removal.
The Pb(II) balance between the supernatant and pellet was calculated and presented in Figure 3. The initial drop in the balance during the first few hours as opposed to the end of 33 h, followed with an increase closer to the original concentration, may indicate an adsorption mechanism in which Pb(II) adsorbed onto biomass. The lack of visual evidence of precipitation supports this hypothesis.
The results obtained during the 15 d experiments on samples containing 80 ppm Pb(II) with standard LB and 500 ppm Pb(II) with simulated LB are discussed in the following section. The Pb(II) concentrations in the supernatants and digested pellets for 80LB are presented in Figure 4 below. From the data gathered, it was observed that 92.6% ± 3.88% of Pb(II), in the 80LB run, was removed from solution by day 12. Rapid Pb(II) removal was observed within the first 3 h where 48.5 % ± 5.26% of Pb(II) was already removed. Rapid removal was followed by a slow, yet substantial decrease in Pb(II) up to day 2. A plateau in Pb(II) readings was observed from day 2 at 71.6% ± 0.283% from which a slow decrease in Pb(II) concentrations was observed.
The 15 d Pb(II) removal results for 500Sim are presented in Figure 5 below. It was recorded that 71.6% ± 3.64% of Pb(II) was removed by day 15. Similar trends were observed in the 500 ppm samples as for the 80 ppm samples with a rapid decrease in Pb(II) concentrations within the first 3 h, with 41.3% ± 1.79% of Pb(II) removed. Again, a slower, substantial decrease continues up to day 2, followed by a steady plateau on day 2 with a slow decrease in Pb(II) concentrations.

3.2. Metabolic Activity (Growth)

The metabolic activity datasets for all experiments collected within the first 33 h are presented in Figure 6 below. It was recorded that the 500Sim samples were overall the most metabolically active, with a maximum measurement of 12.2 ± 0.987 absorbance units. The remaining datasets achieved similar readings with 80Sim at 8.29 ± 0.510 absorbance units, followed by the 500LB (7.24 ± 1.09) and finally 80LB (5.98 ± 1.09). An initial lag (plateau) was observed in all the experiments in the first 3 h, corresponding the lack of visual evidence coupled with rapid Pb(II) removal. It can be proposed that the samples containing lower Pb(II) concentrations have reached their stationary phases (plateau) after roughly half a day (little increase is evident in the metabolic activity readings) as opposed to the samples containing higher Pb(II) concentrations, which might achieve the stationary phase, as observed in the data gathered.
The metabolic activity measurements for the extended study of 15 d with 80LB are presented in Figure 7 below. A maximum absorbance of 7.15 ± 0.136 absorbance units was measured at 21 h (0.87 d), and this coincides with the matching visual results observed at 21 h. A substantial metabolic activity rate increase (of about 14 times) was observed between 6 h (0.26 d) and 9 h (0.38 d) when the measurements increased from 0.403 ± 0.00754 to 5.46 ± 0.517 absorbance units. Finally, a plateau was reached after 2 d and 21 h (2.90 d) with absorbance readings ranging between 4.75 ± 0.118 and 3.51 ± 0.294.
The metabolic activity measurements for the 15 d 500Sim experiment are plotted below in Figure 8. A maximum absorbance measurement was recorded after 1 d and 20 h (1.83 d) with a reading of 12.5 ± 0.823 absorbance units. The largest increase (about 18 times increase) in metabolic activity was measured between 6 h (0.26 d) and 9 h (0.38 d) with an increase from of 0.256 ± 0.0770 to 4.72 ± 0.498. Finally, a plateau was reached after 8 d and 21 h (8.9 d) of absorbance readings ranging between 6.22 ± 0.638 and 6.59 ± 0.724.
The results from Figure 6 hint at an independence of microbial growth from the substrate concentration; the microorganisms did not consume more substrate merely because it was available. It is apparent that growth and Pb(II) removal remained comparable, especially when considering the 80Sim and 80LB runs. To further investigate the impact of substrate on growth and to assess whether the growth was independent of substrate presence, the concentration of substrate in solution was quantified by total organic carbon (TOC) as a “black box” parameter. This was due to the complexity of the substrate (LB broth) and would provide a measure of the carbon available in the reactor to the organism.

3.3. Total Organic Carbon

The TOC results obtained are presented in Figure 9 below. Various fluctuations were observed throughout the duration of measurements. It was, however, clear that a dramatic overall drop in TOC was not evident, with total organic carbon removals of between 10% and 25% in all the reactors. The results indicate that carbon depletion was not a factor to account for during analysis of results. The measurements do indicate a dramatic initial drop in TOC during the first 3 h in the simulated LB reactors.
The data gathered over the extended period of 15 d for TOC are evaluated in the following section. The TOC measurements in the supernatant and pellet for 80LB and 500Sim are presented below in Figure 10 and Figure 11, respectively. Again, a very small decrease in supernatant TOC measurements was observed, where 31.9% of TOC was removed from the 80 ppm solution and 12.4% from the 500 ppm solution. Both the pellets observed a large increase in initial TOC followed with a plateau. This increase was quite small in comparison to the total organic carbon available in the system. It can thus be concluded that substrate depletion did not have an effect on metabolic activity or Pb(II) removal results.

3.4. Nitrates

Nitrate measurements were obtained as it was anticipated to be of importance as all experiments were conducted under anaerobic conditions, suggesting that anaerobic respiration might be present. It has previously been shown that insignificant pH drops were observed for the consortium under investigation [9], meaning that acidogenesis as an energy pathway was active in the reactor. During denitrification, nitrate is used as alternative electron acceptor (as opposed to oxygen), and various bacteria are known to be denitrifiers; therefore, further investigation was required.
The nitrate levels for all the 33 h experiments are presented in Figure 12 below. A rapid decline in nitrates was observed from 6 h to 1 d for the 500 ppm samples. A gradual decrease was, however, observed for the 80Sim samples, as opposed to a rapid decrease for the 80LB samples within the first 3 to 9 h, both to a nitrate concentration of almost zero. All the reactors reached a limit on the first day, after which little to no decline was observed.
The nitrate measurements for the extended experiments are presented below. The measurements gathered for 80LB can be observed in Figure 13a and 500Sim in Figure 13b. These measurements decreased sharply for both the 80LB and 500Sim experiments, with a sudden drop within the first 9 h and small fluctuations in readings until the 3rd day with a slower decline, which was then subsequently followed with a nearly depleted nitrate reading.

3.5. Microbial Characterisation

Microbial characterization was conducted on 80LB and 500Sim. The results for 80LB and 500Sim are presented in the form of a phylogenetic tree in Figure 14 below. It is abundantly clear that the only active species (colonies clearly exhibiting precipitation) detected was Klebsiella pneumoniae in both 80LB and 500Sim. The samples in blue refer to the various colonies chosen (from 9–16), and the number after the first alphabetical letter refers to either the 500 or 80 ppm colony.
Klebsiella pneumoniae is known to be an immobile facultative anaerobe and shaped as capsulate Gram-negative rods, 1–2 μm in length. Klebsiella pneumoniae is known to respire nitrate anaerobically [15].
The preliminary results from a BLAST analysis of the consortium at the specific conditions revealed that the cultures consisted of multiple species as summarized in Table 4. These results reveal that the active species (K. pneumoniae) is not the most prevalent species in the sample, indicating that most organisms in the sample have Pb(II)-resistant properties, while not contributing to the Pb precipitation mechanism observed. It is, however, likely that the non-precipitating organisms are responsible for some of the initial Pb(II) biosorption observed in the initial 3 h [16]. Another observation worth exploring is that the species Ralstonia solanacearum was not measured in any appreciable quantities in the 80 ppm Pb samples while being the predominant species at 500 ppm Pb. R. solanacearum has been shown to exhibit highly effective Pb biosorption properties [17].

3.6. SEM Morphology

Morphology investigations were conducted on samples from the 80LB and 500Sim reactors at termination of the 15 d experiment. The micrograph images presented in Figure 15a–d are of 80LB and 500Sim at different magnifications, respectively. Viable rod-like capsulate microbial cells were observed, which corresponds with the characterization of the bacteria as mostly bacilli shaped species, including K. pneumonia. These microbial cells are clearly imbedded in precipitate, which indicates an external precipitation mechanism rather than an internal excretion mechanism. The 500Sim samples do, however, indicate a significantly higher precipitate-to-microbe ratio, as it was hard to locate evident bacterial cells even at a high magnification, which correspond to the higher concentration of Pb(II) present. The difficulty in identifying individual cells corroborate the hypothesis that the cells are embedded in precipitate, and cells are only observed in underlying shapes in Figure 15c and in broken pieces of precipitate in Figure 15d.

3.7. Specific Growth Rate

The specific growth rate of the microbial consortium µ (per day) was calculated for the initial phase of growth for the 33 h experiment (shown in Figure 6) for the various experimental conditions. The specific growth rate was calculated by dividing the first derivative with time of the metabolic activity curve by the measured metabolic activity, as in Equation (1) [18].
d X d t = μ × X
where X refers to the metabolic activity measurements. Under excess substrate conditions, i.e., constant μ or μmax (maximum growth rate of the organism), the generation period can be calculated using Equations (2) and (3):
ln ( X X o ) = μ m a x
Generation time:
t 2 = ln ( 2 ) μ m a x
where Xo refers to the initial metabolic activity measured, t denotes the experimental time elapsed, t2 indicates the generation time, and ln(2) is the natural logarithm of 2. The calculated μ and t2 values are presented in Table 5 below. It is clear from the results that the system experienced significant inhibition as a result of the presence of Pb(II), with a marked reduction in the maximum growth rate and, therefore, an increase in the generation time with increased Pb(II) concentration.
From literature, it was found that Klebsiella pneumoniae on average regenerates only after 2.31 h, which is considerably longer then what was observed in these findings. The findings in Table 5 are likely a result of the system containing a microbial consortium, as opposed to a pure culture. The presence of various bacterial identities would inherently influence the overall growth rate. It is known that different species exhibit different generation times; Bacillus sp., Enterococcus sp., and Clostridium sporogenes have t2 times of 49, 26, and 6 min, respectively [19]. From the overall culture characterization (Table 4), all three species were present in the consortium.

4. Discussion

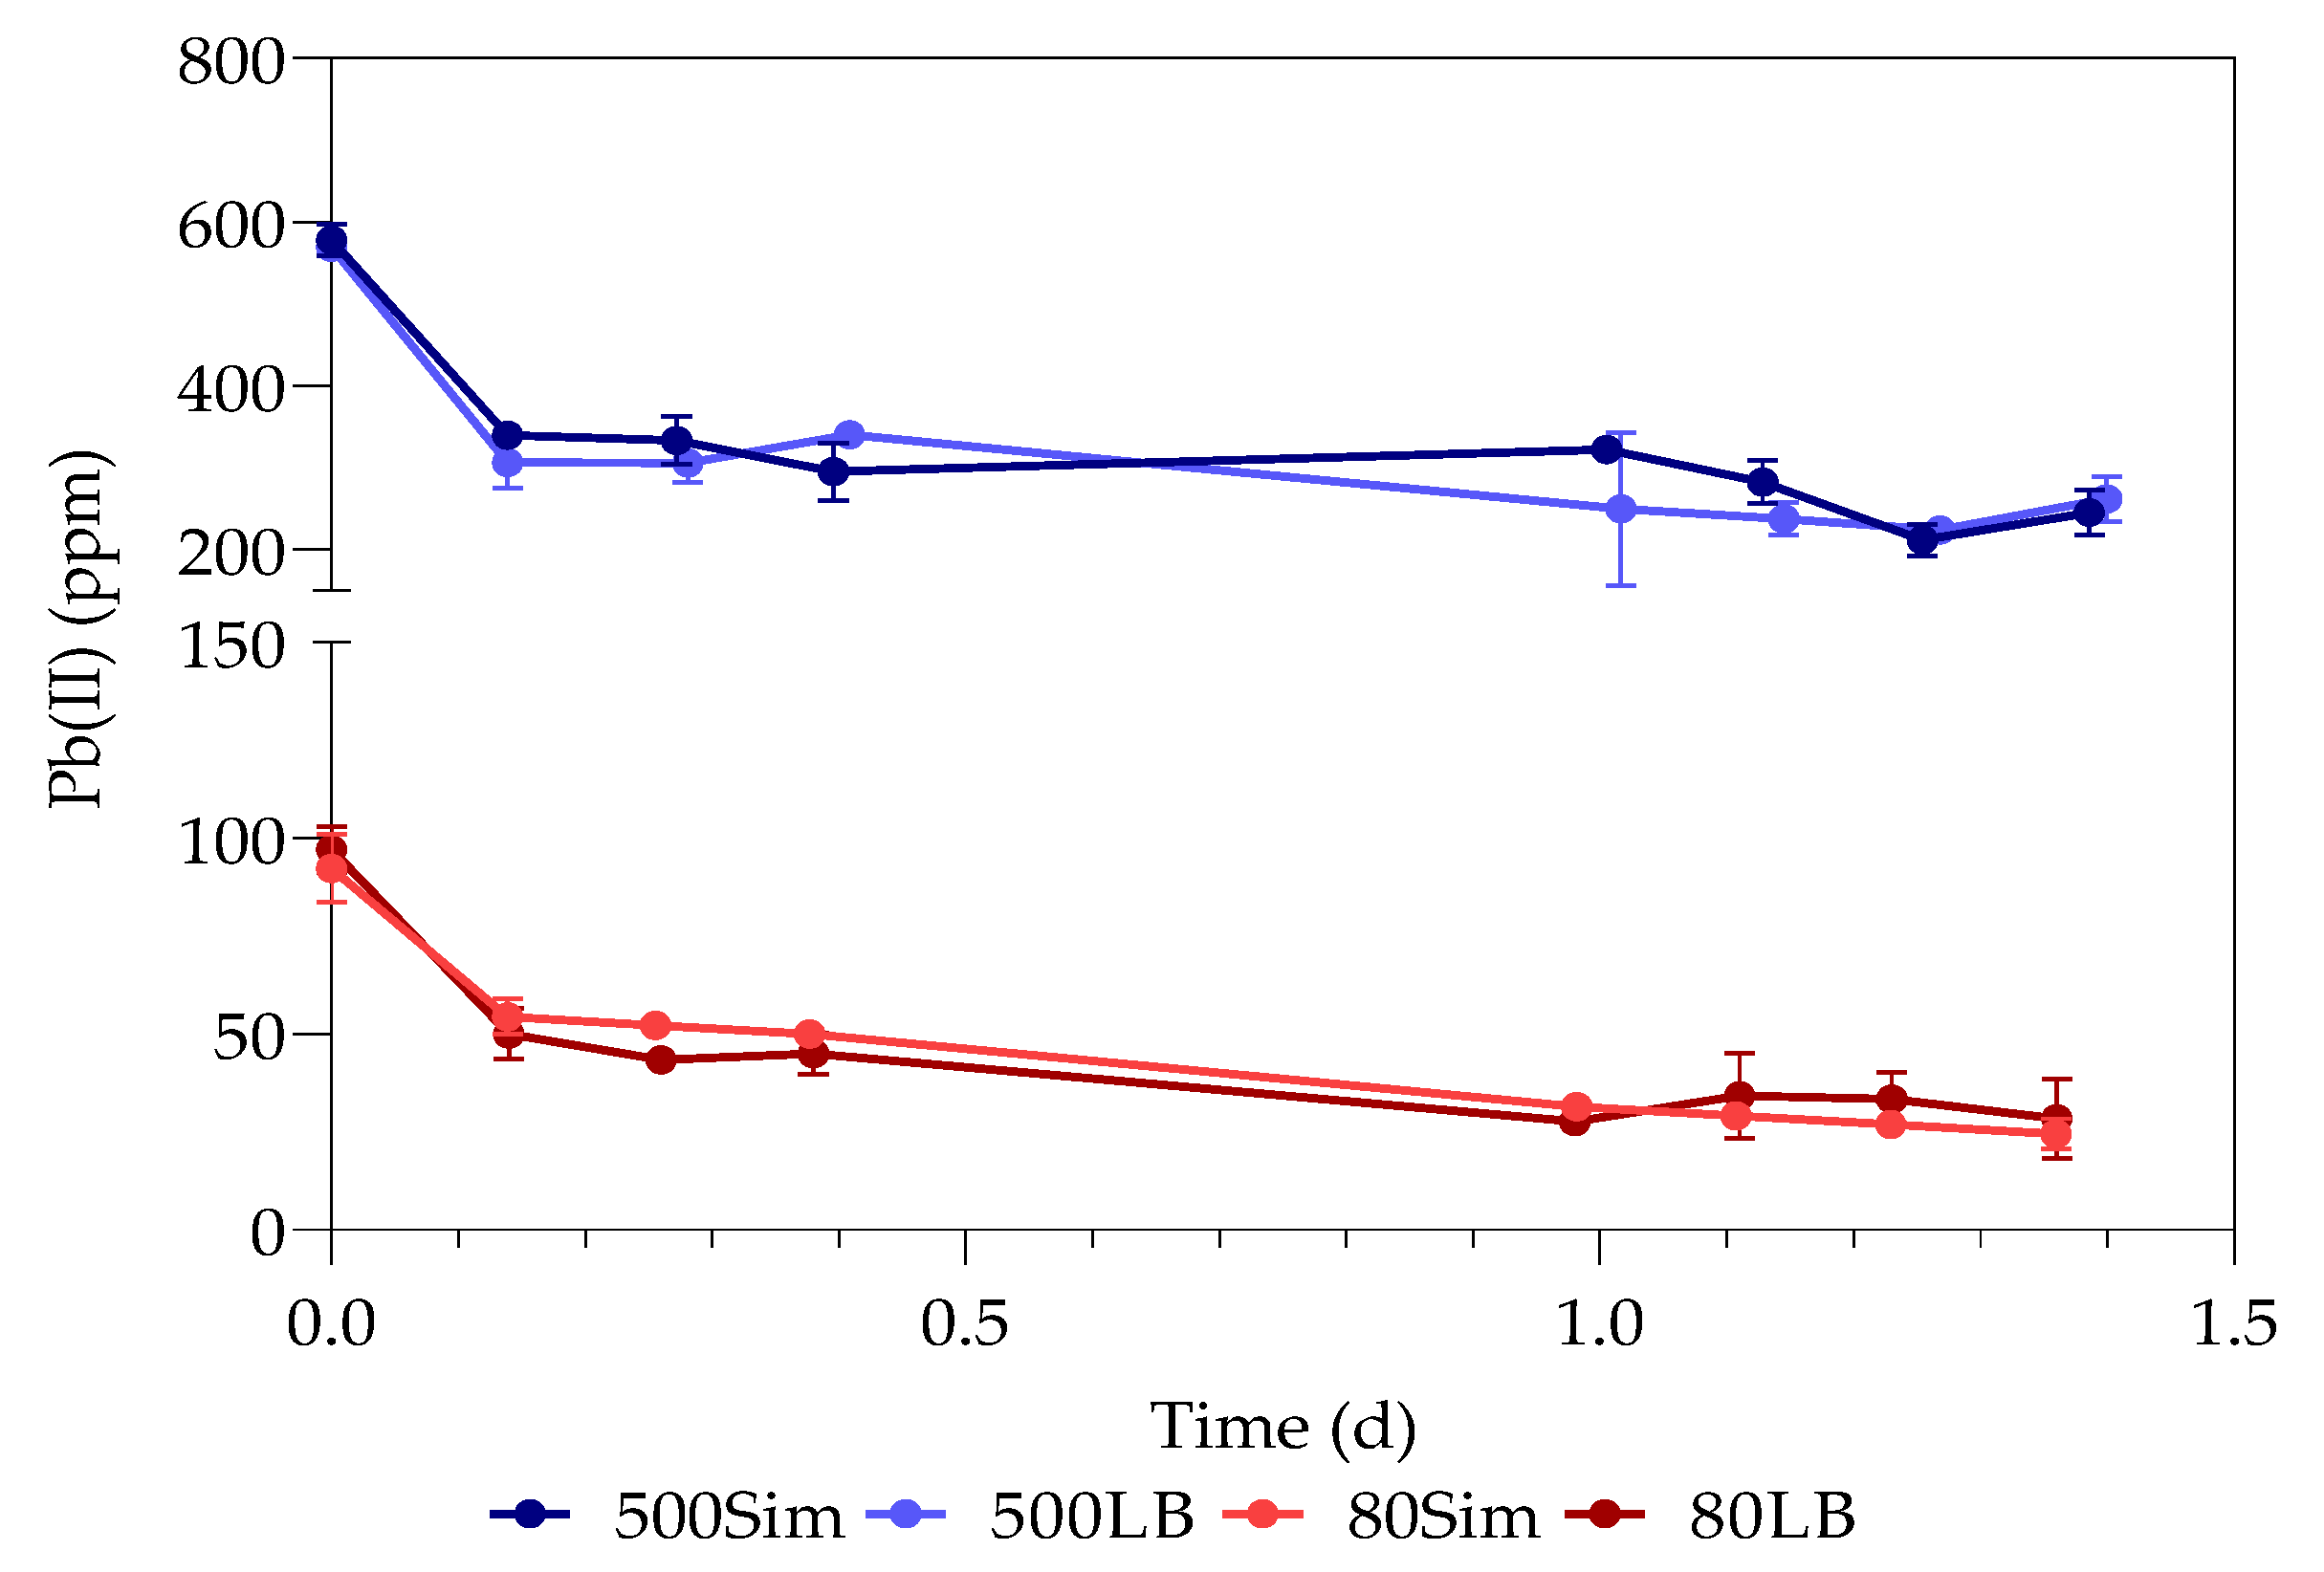
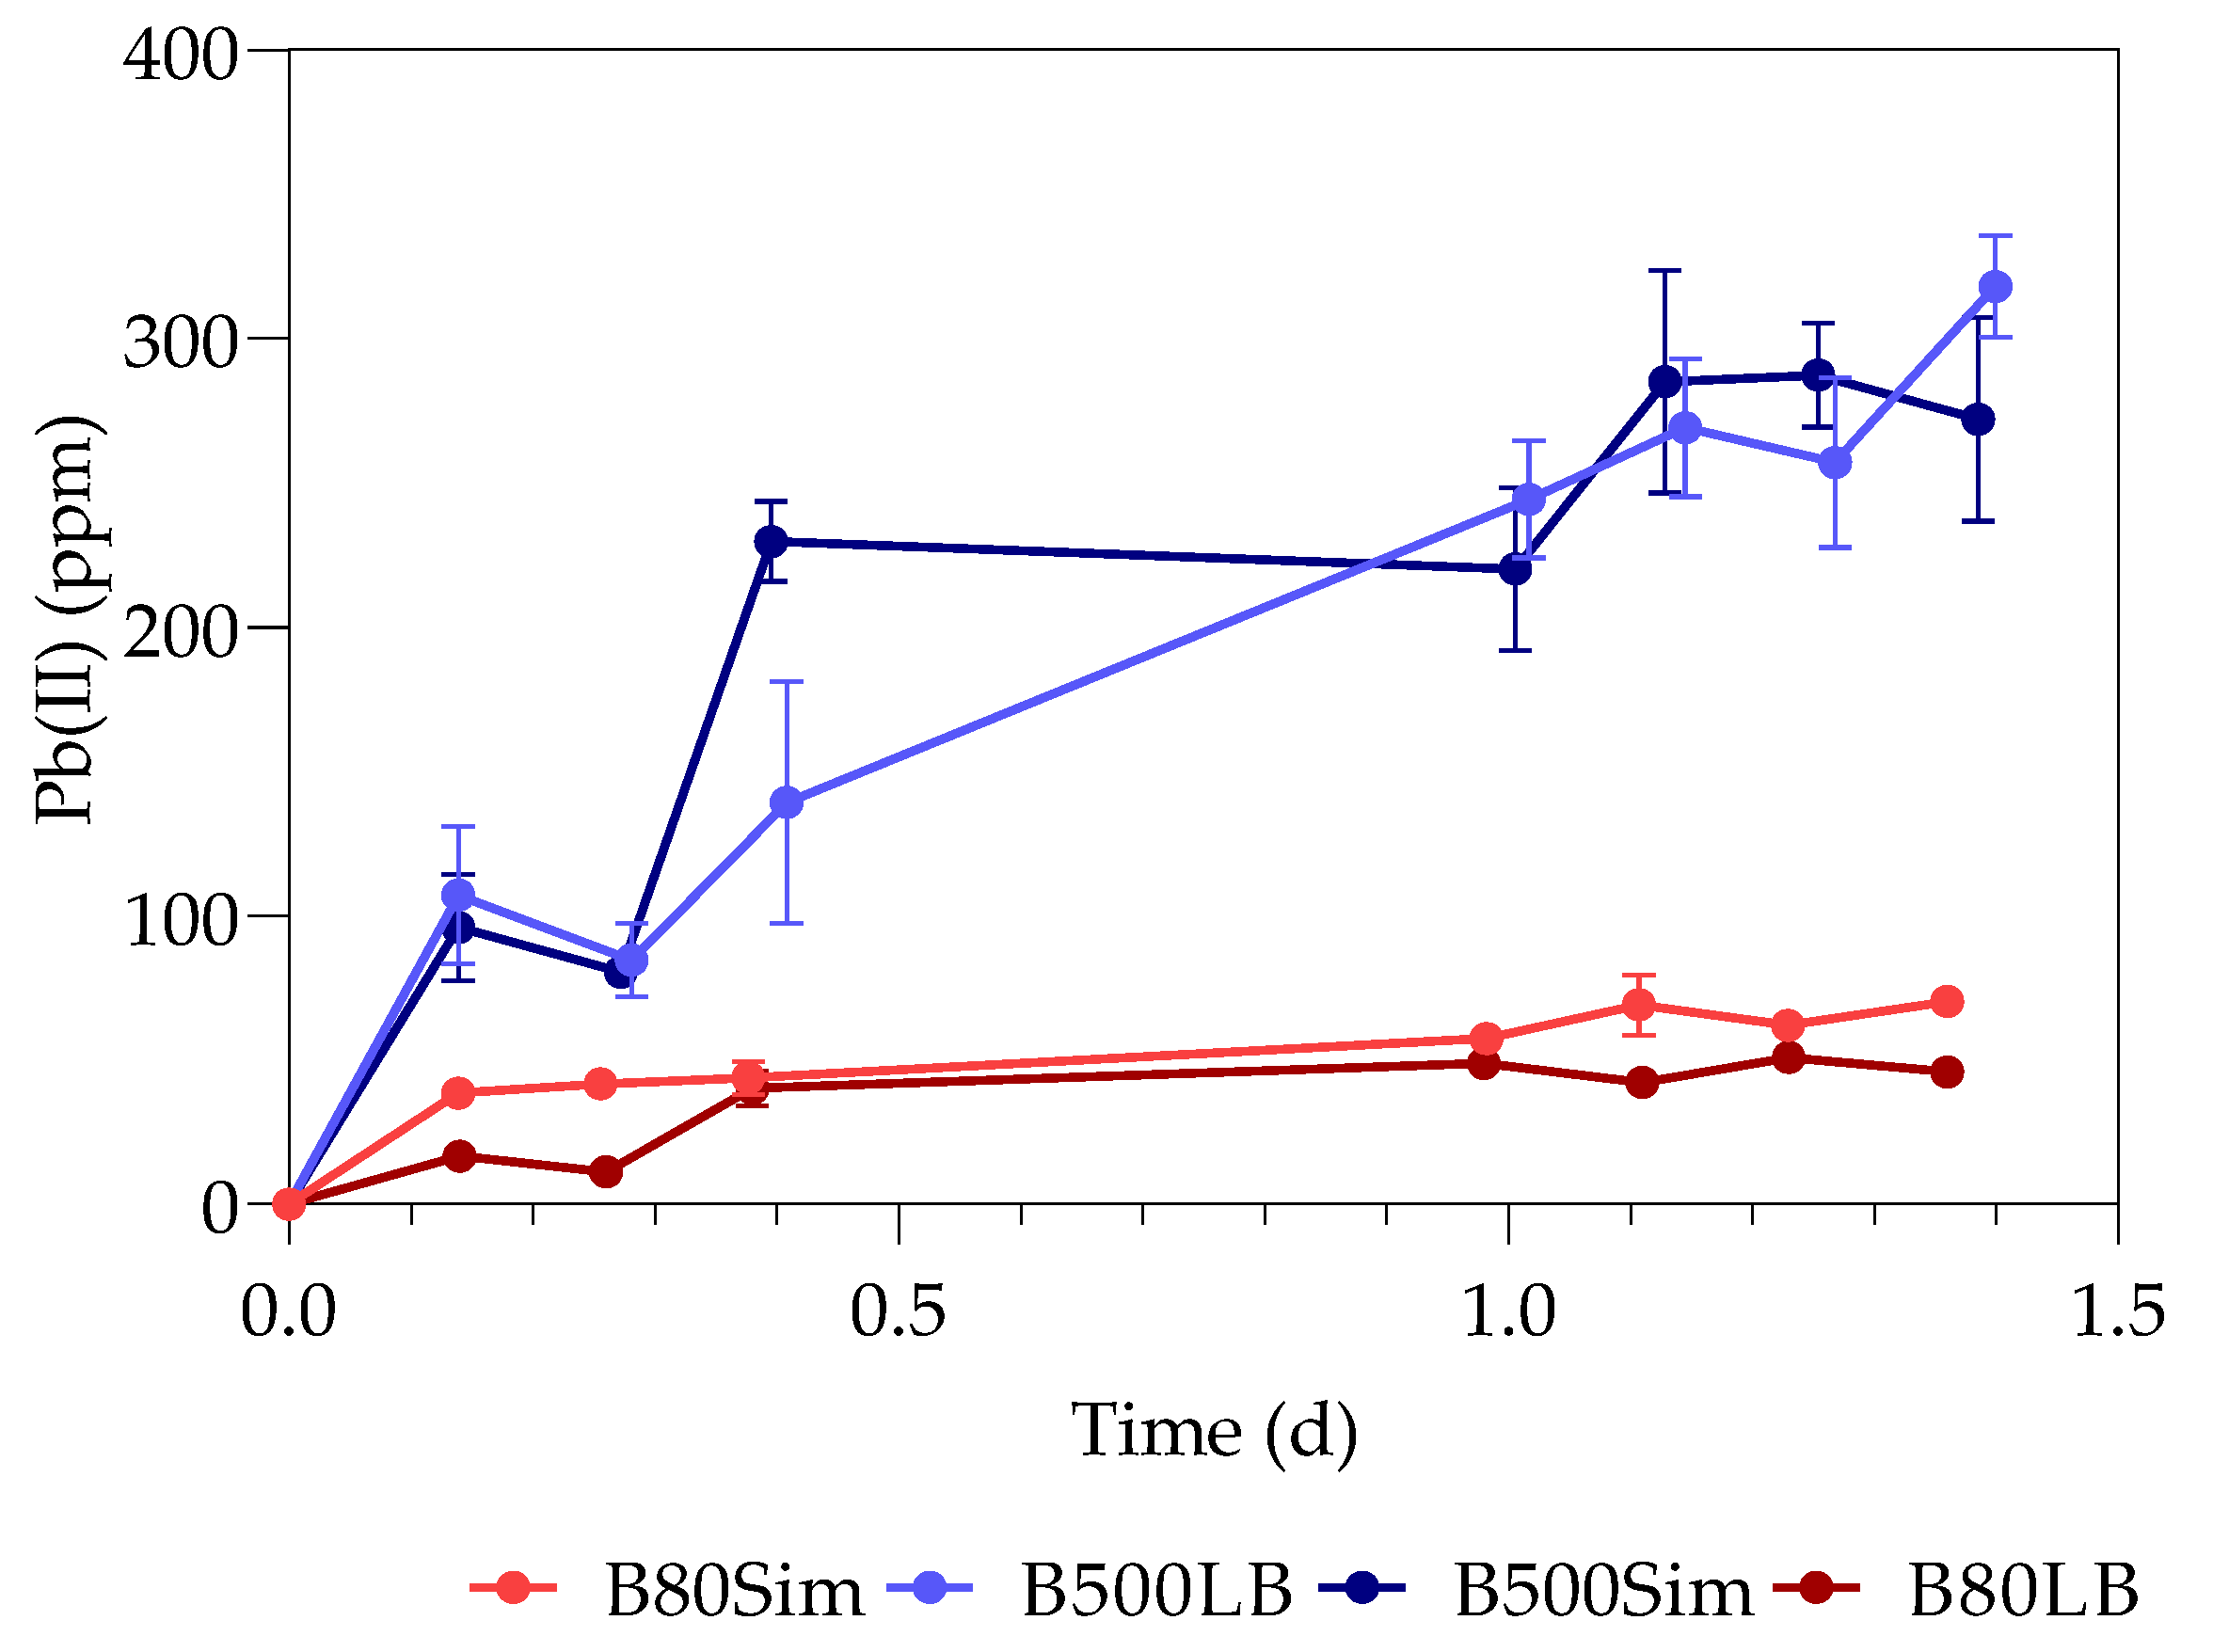
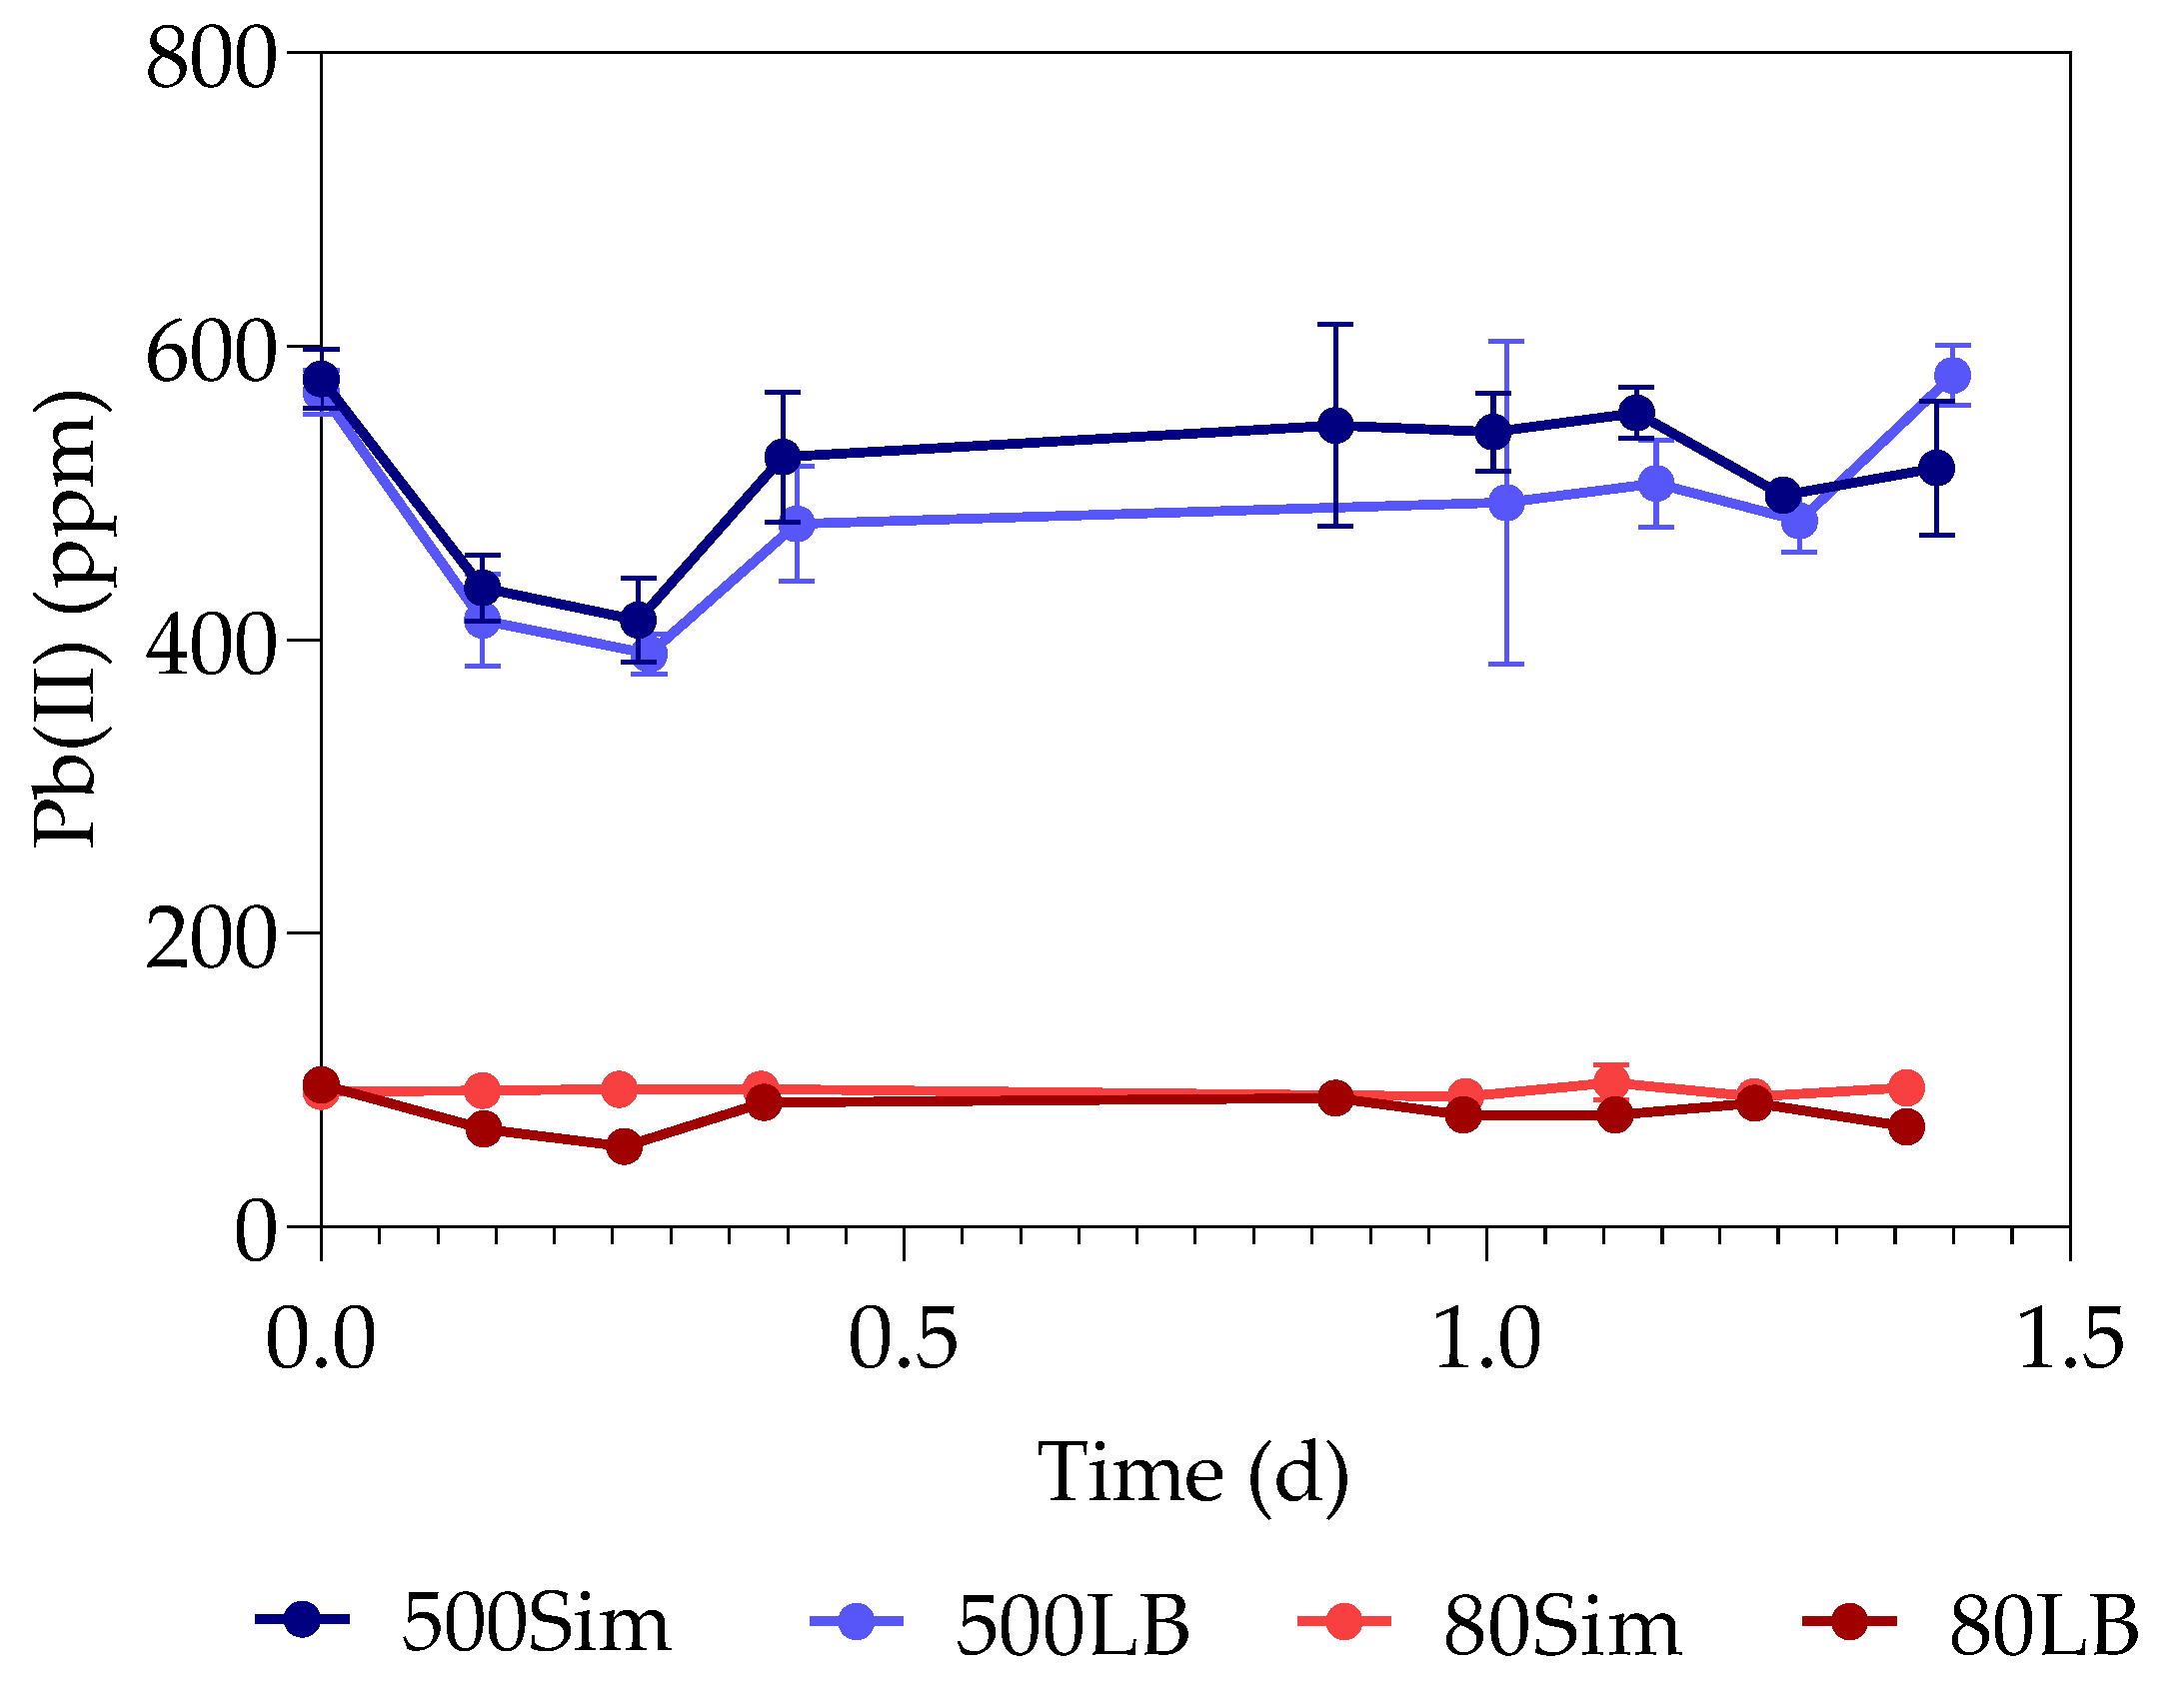
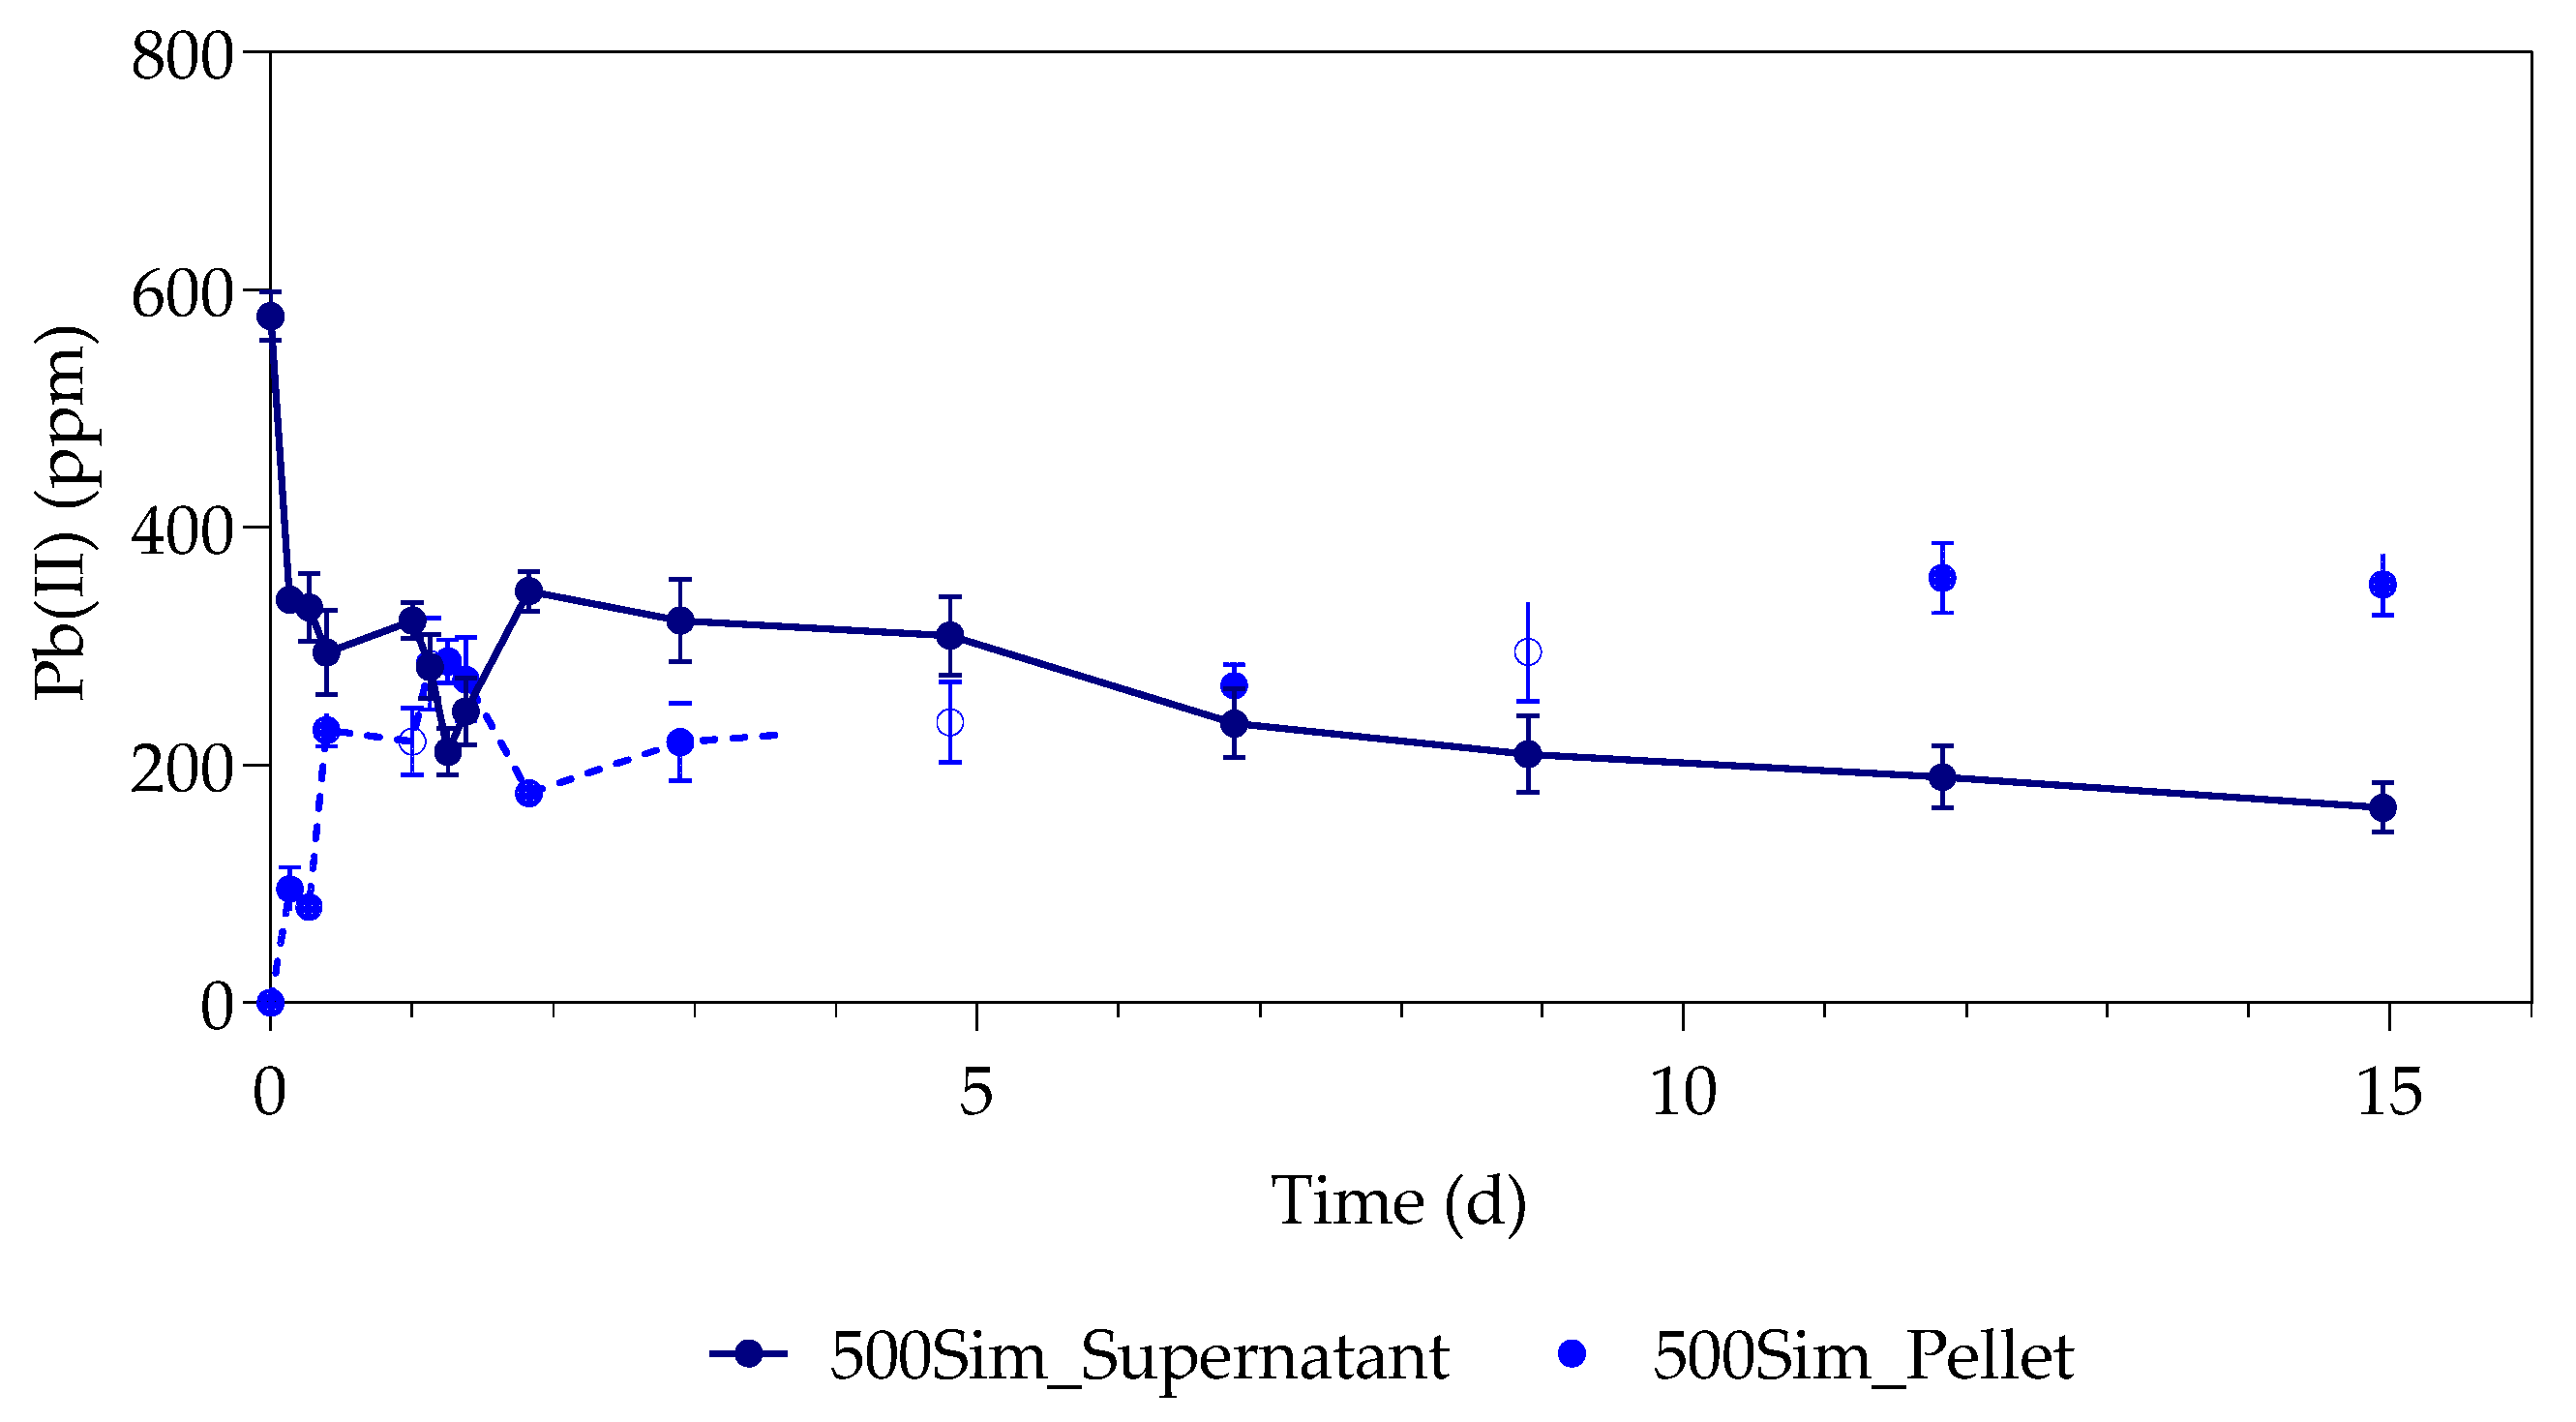
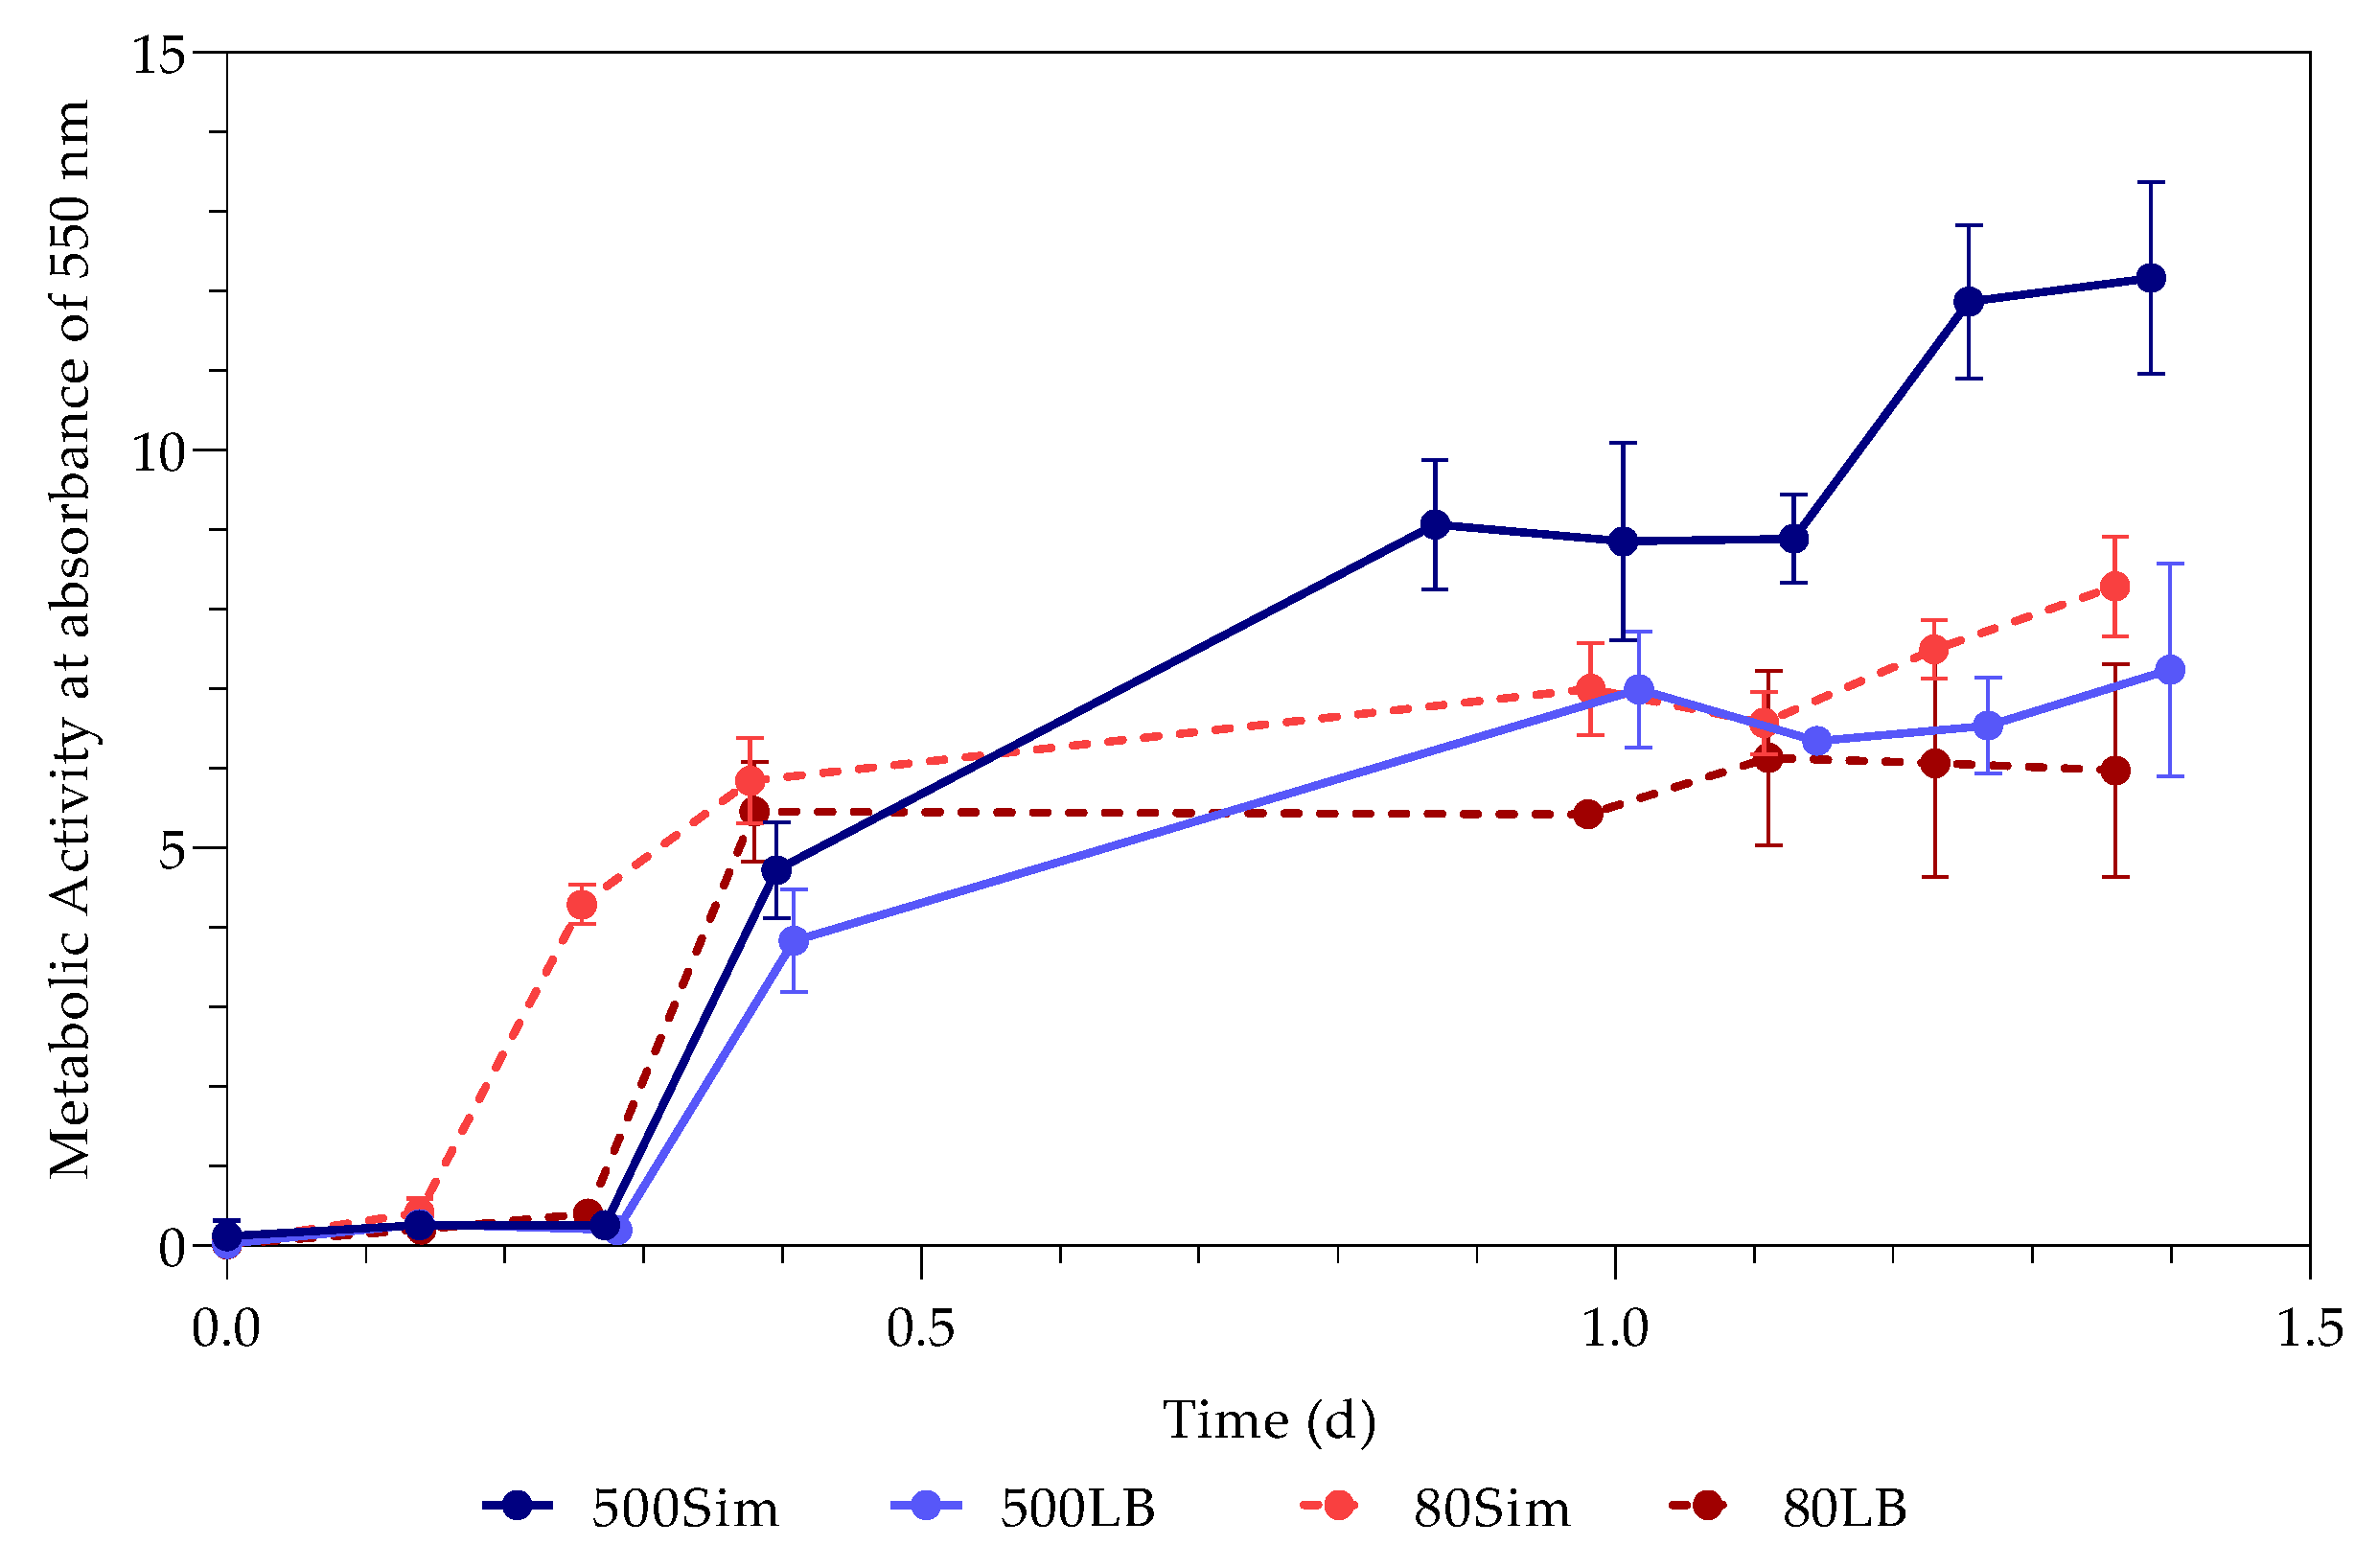
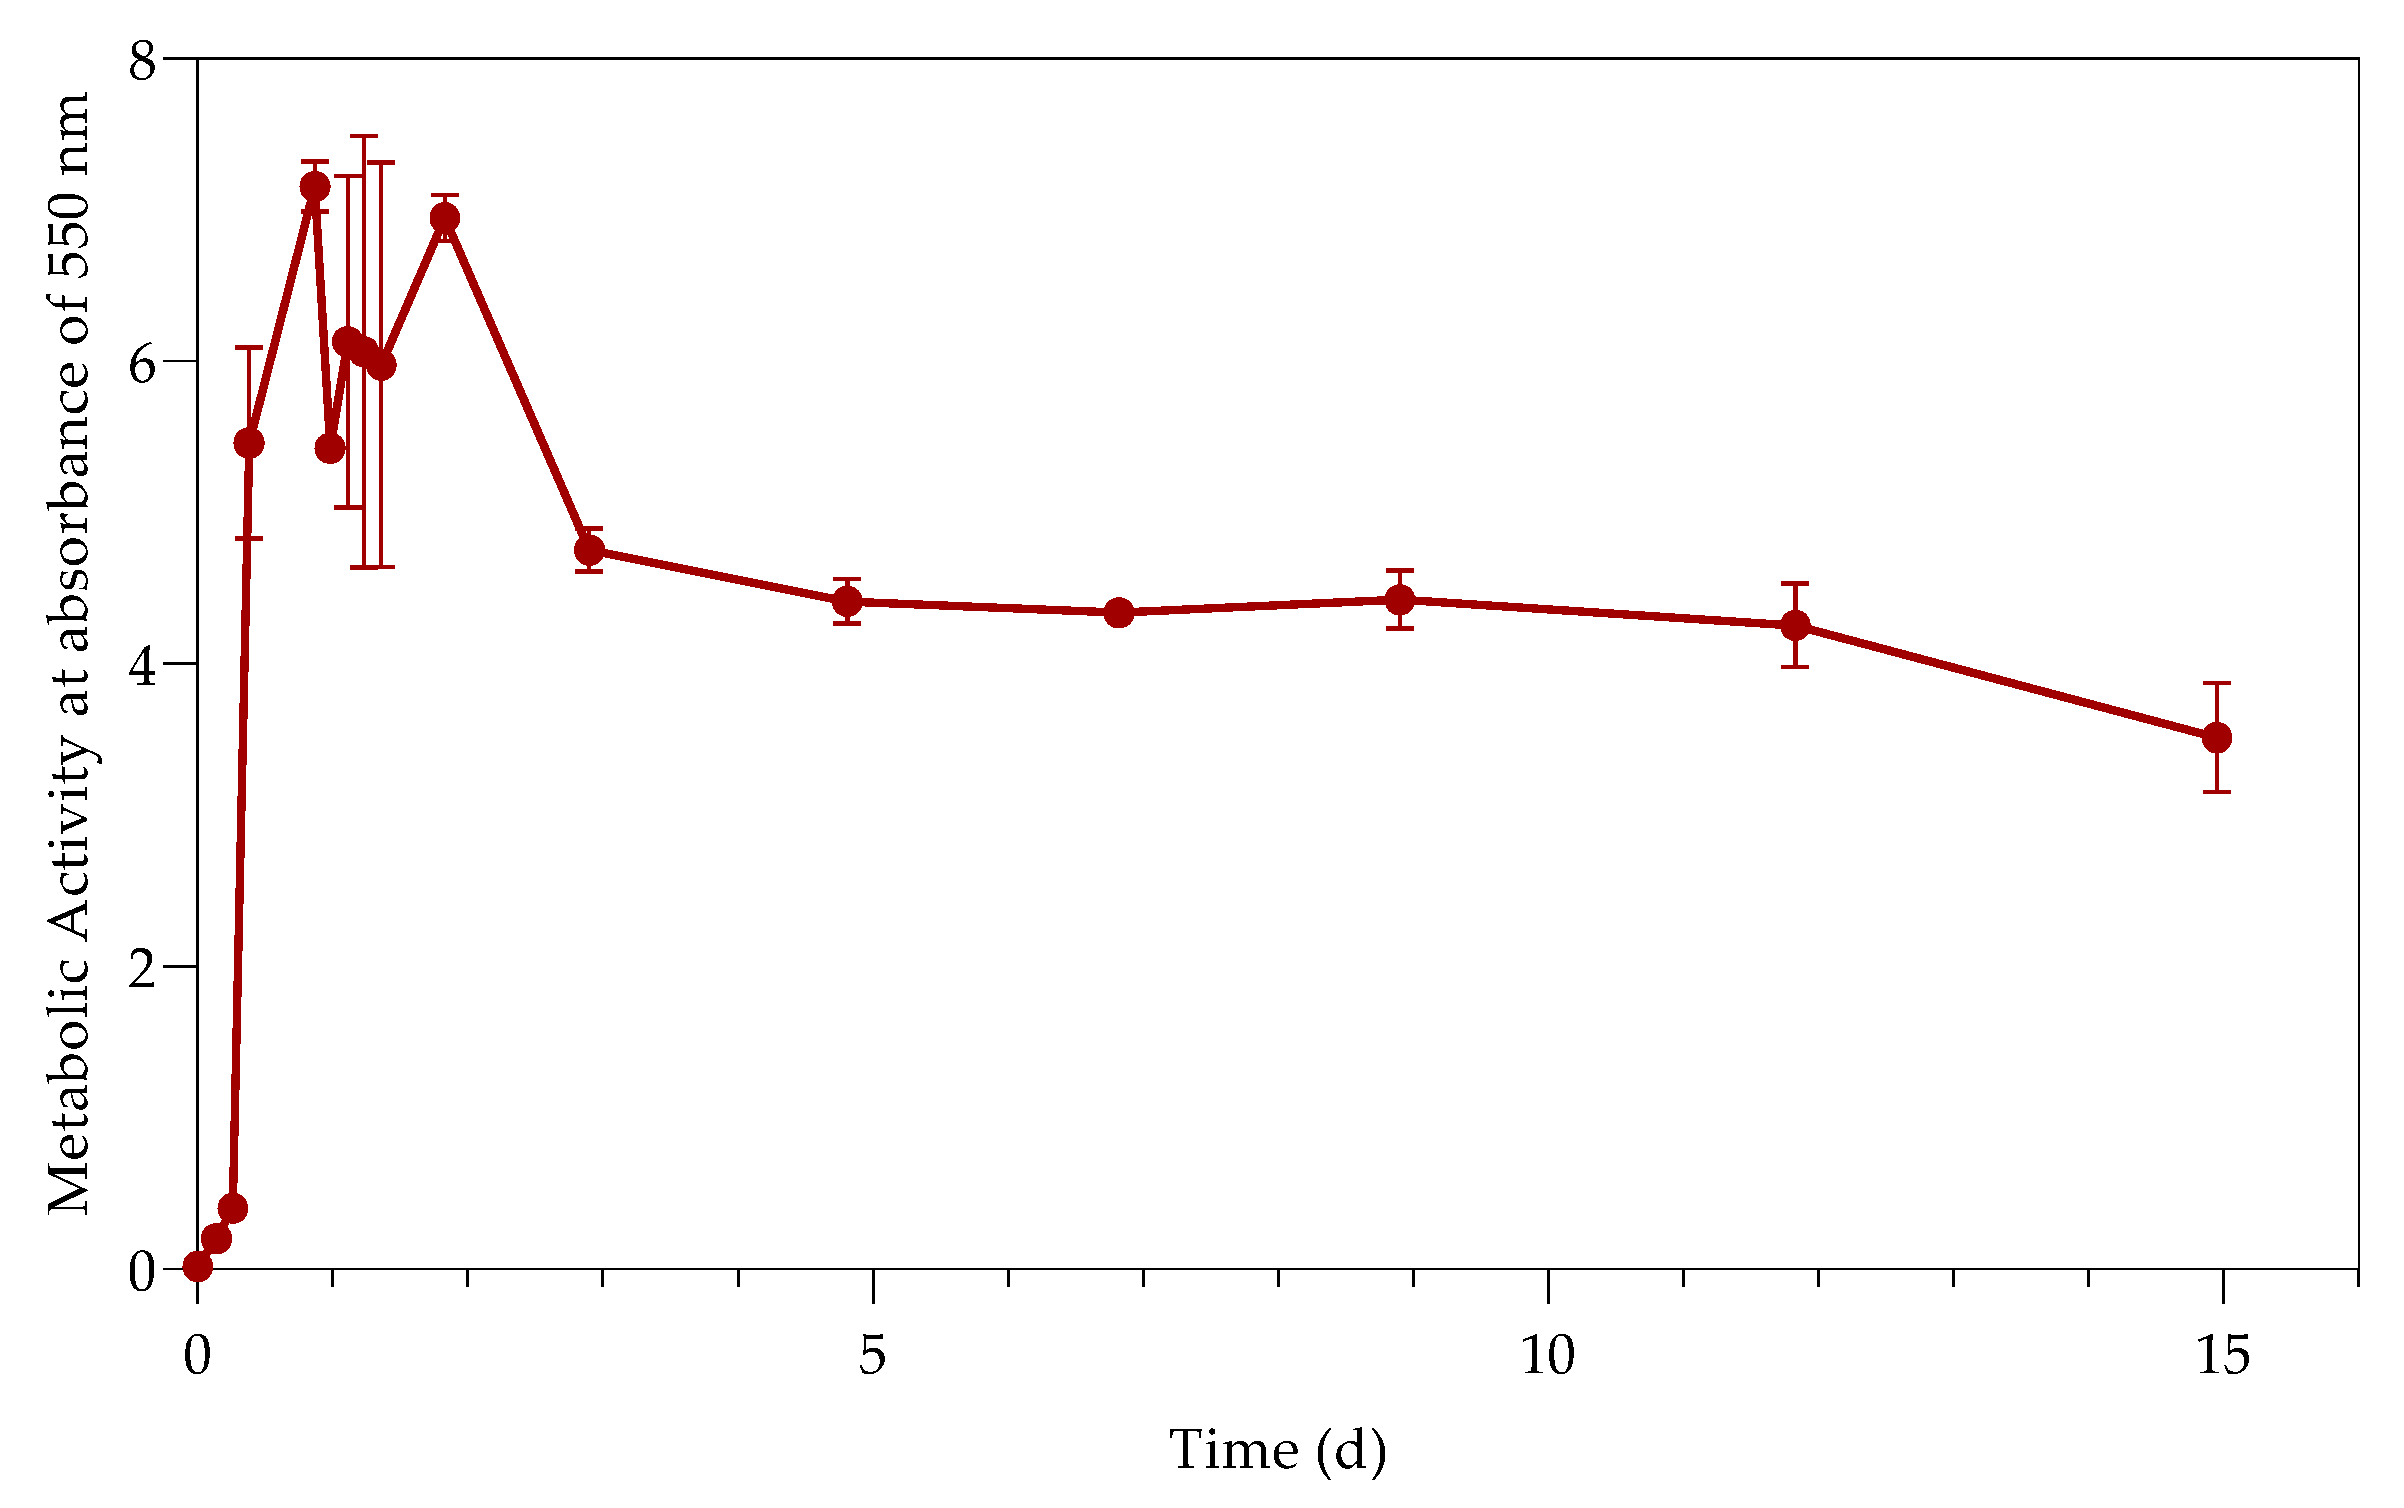
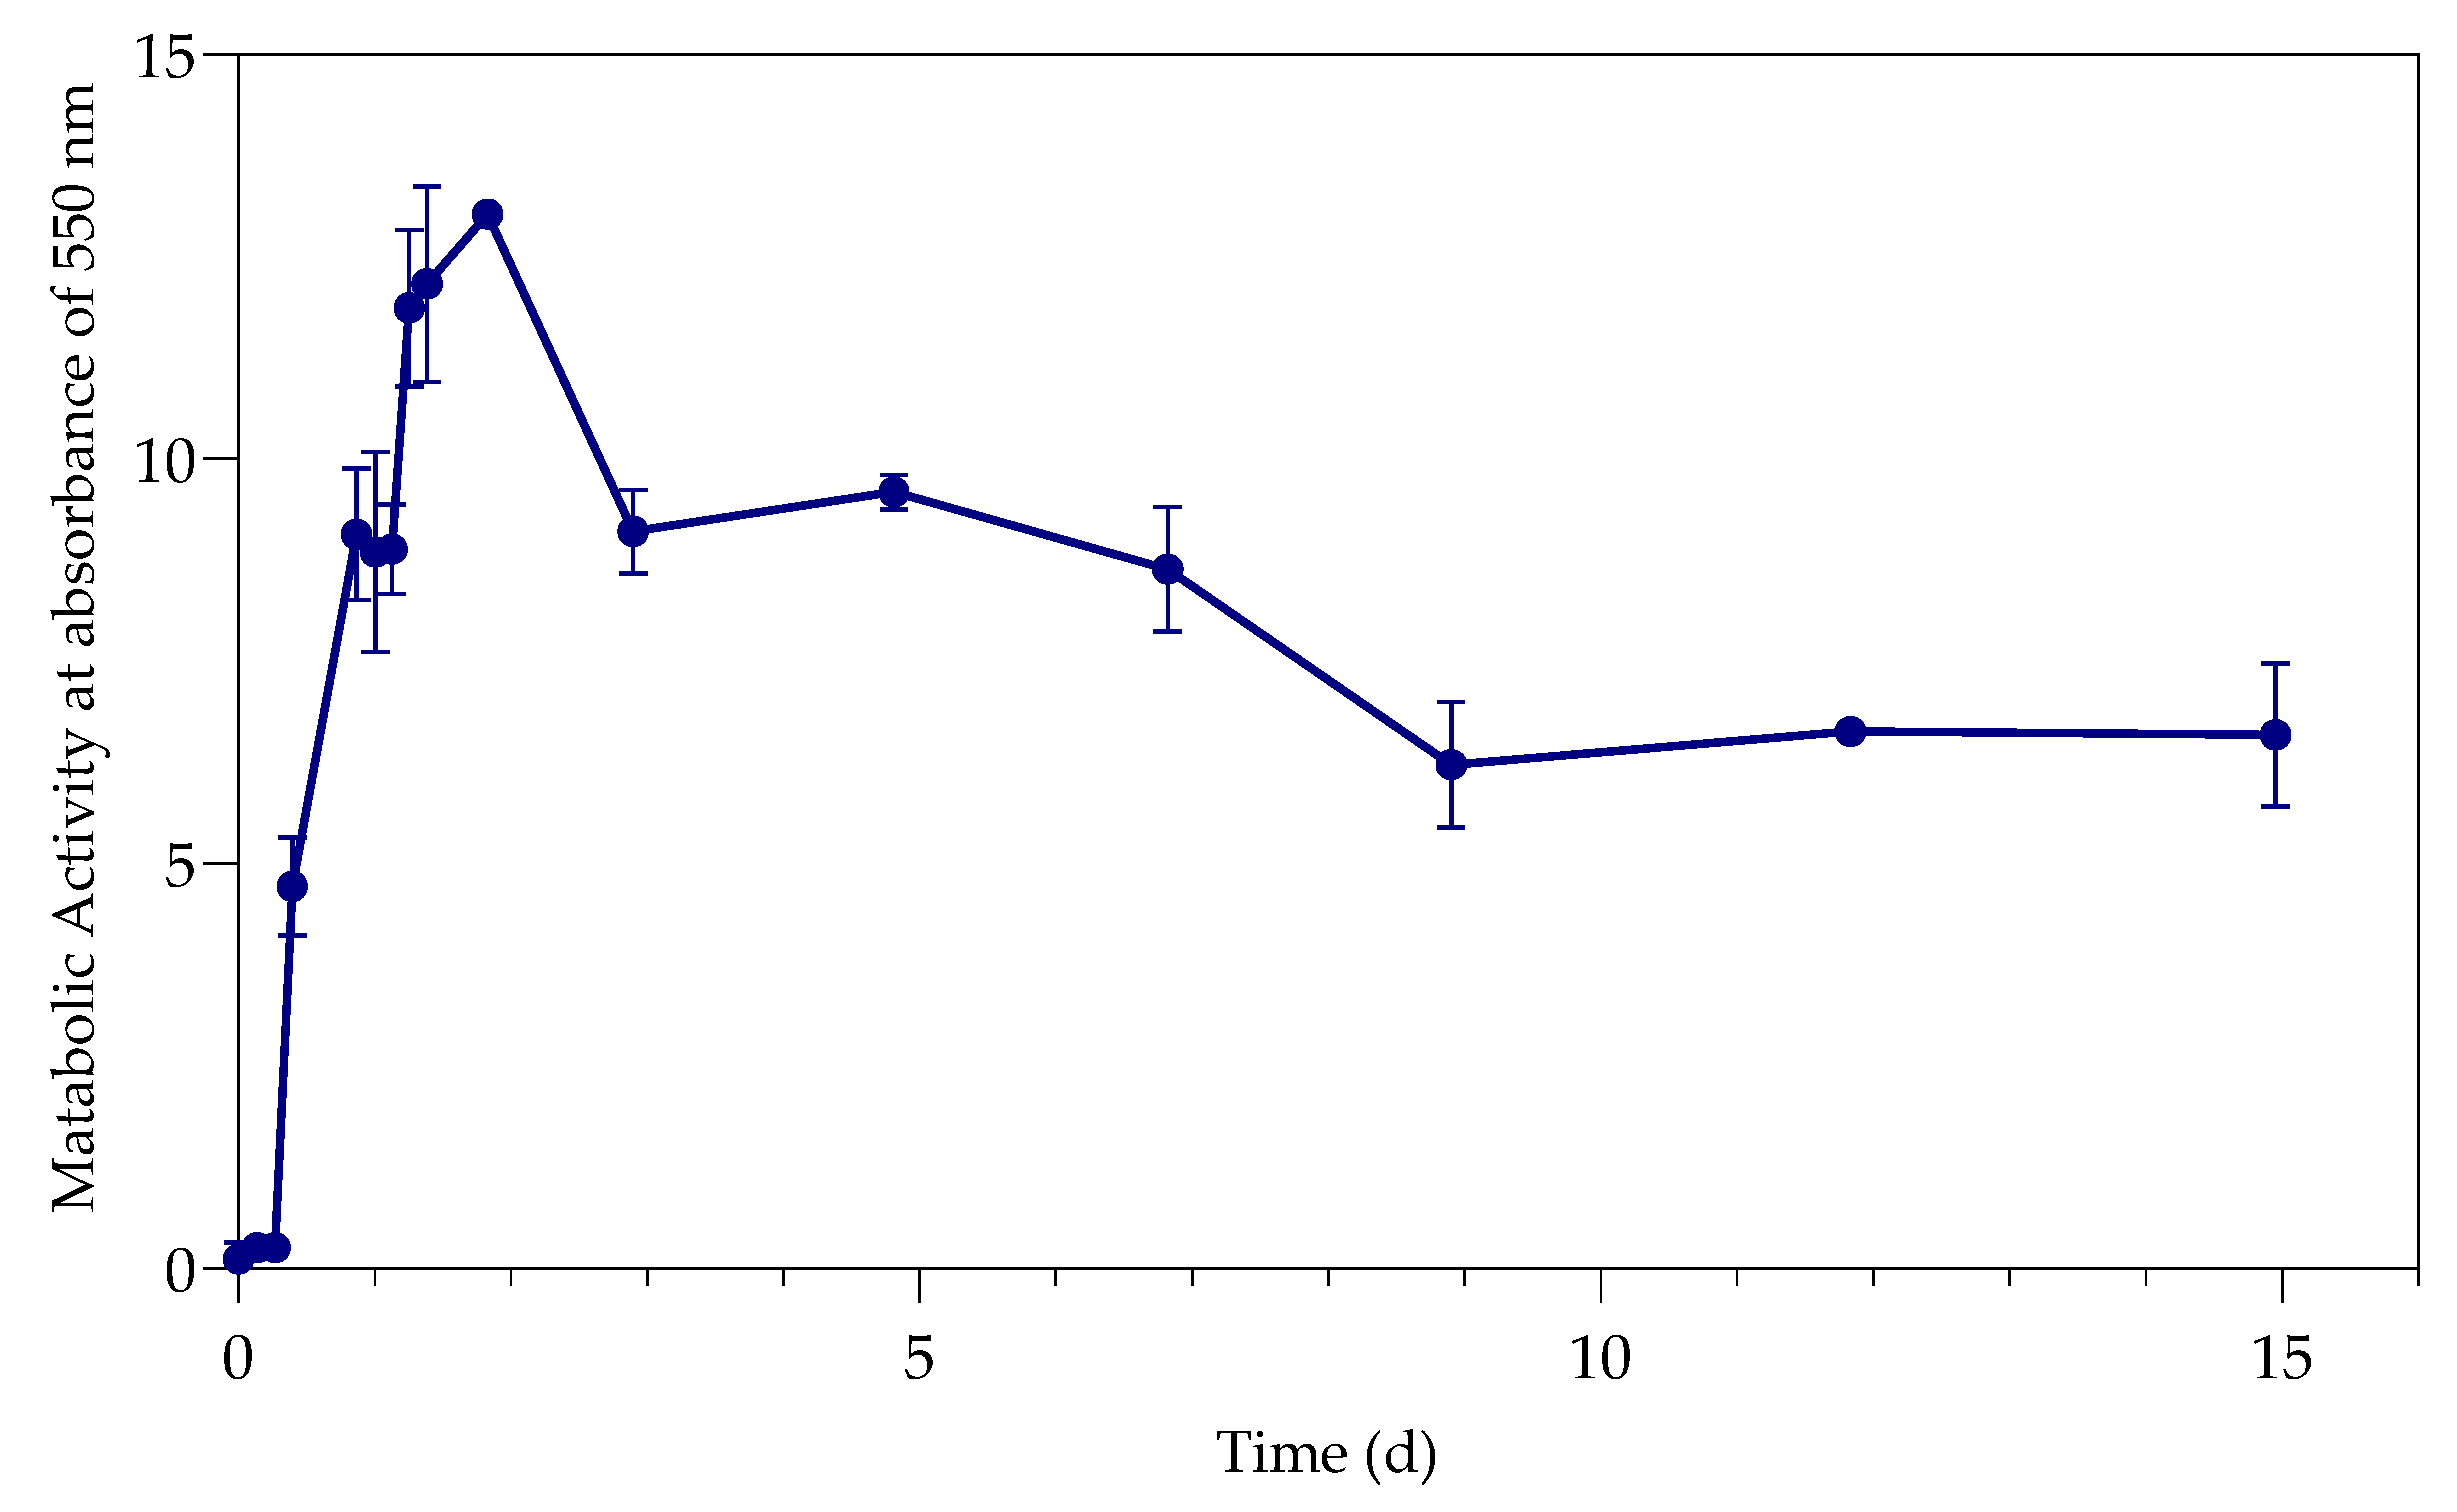
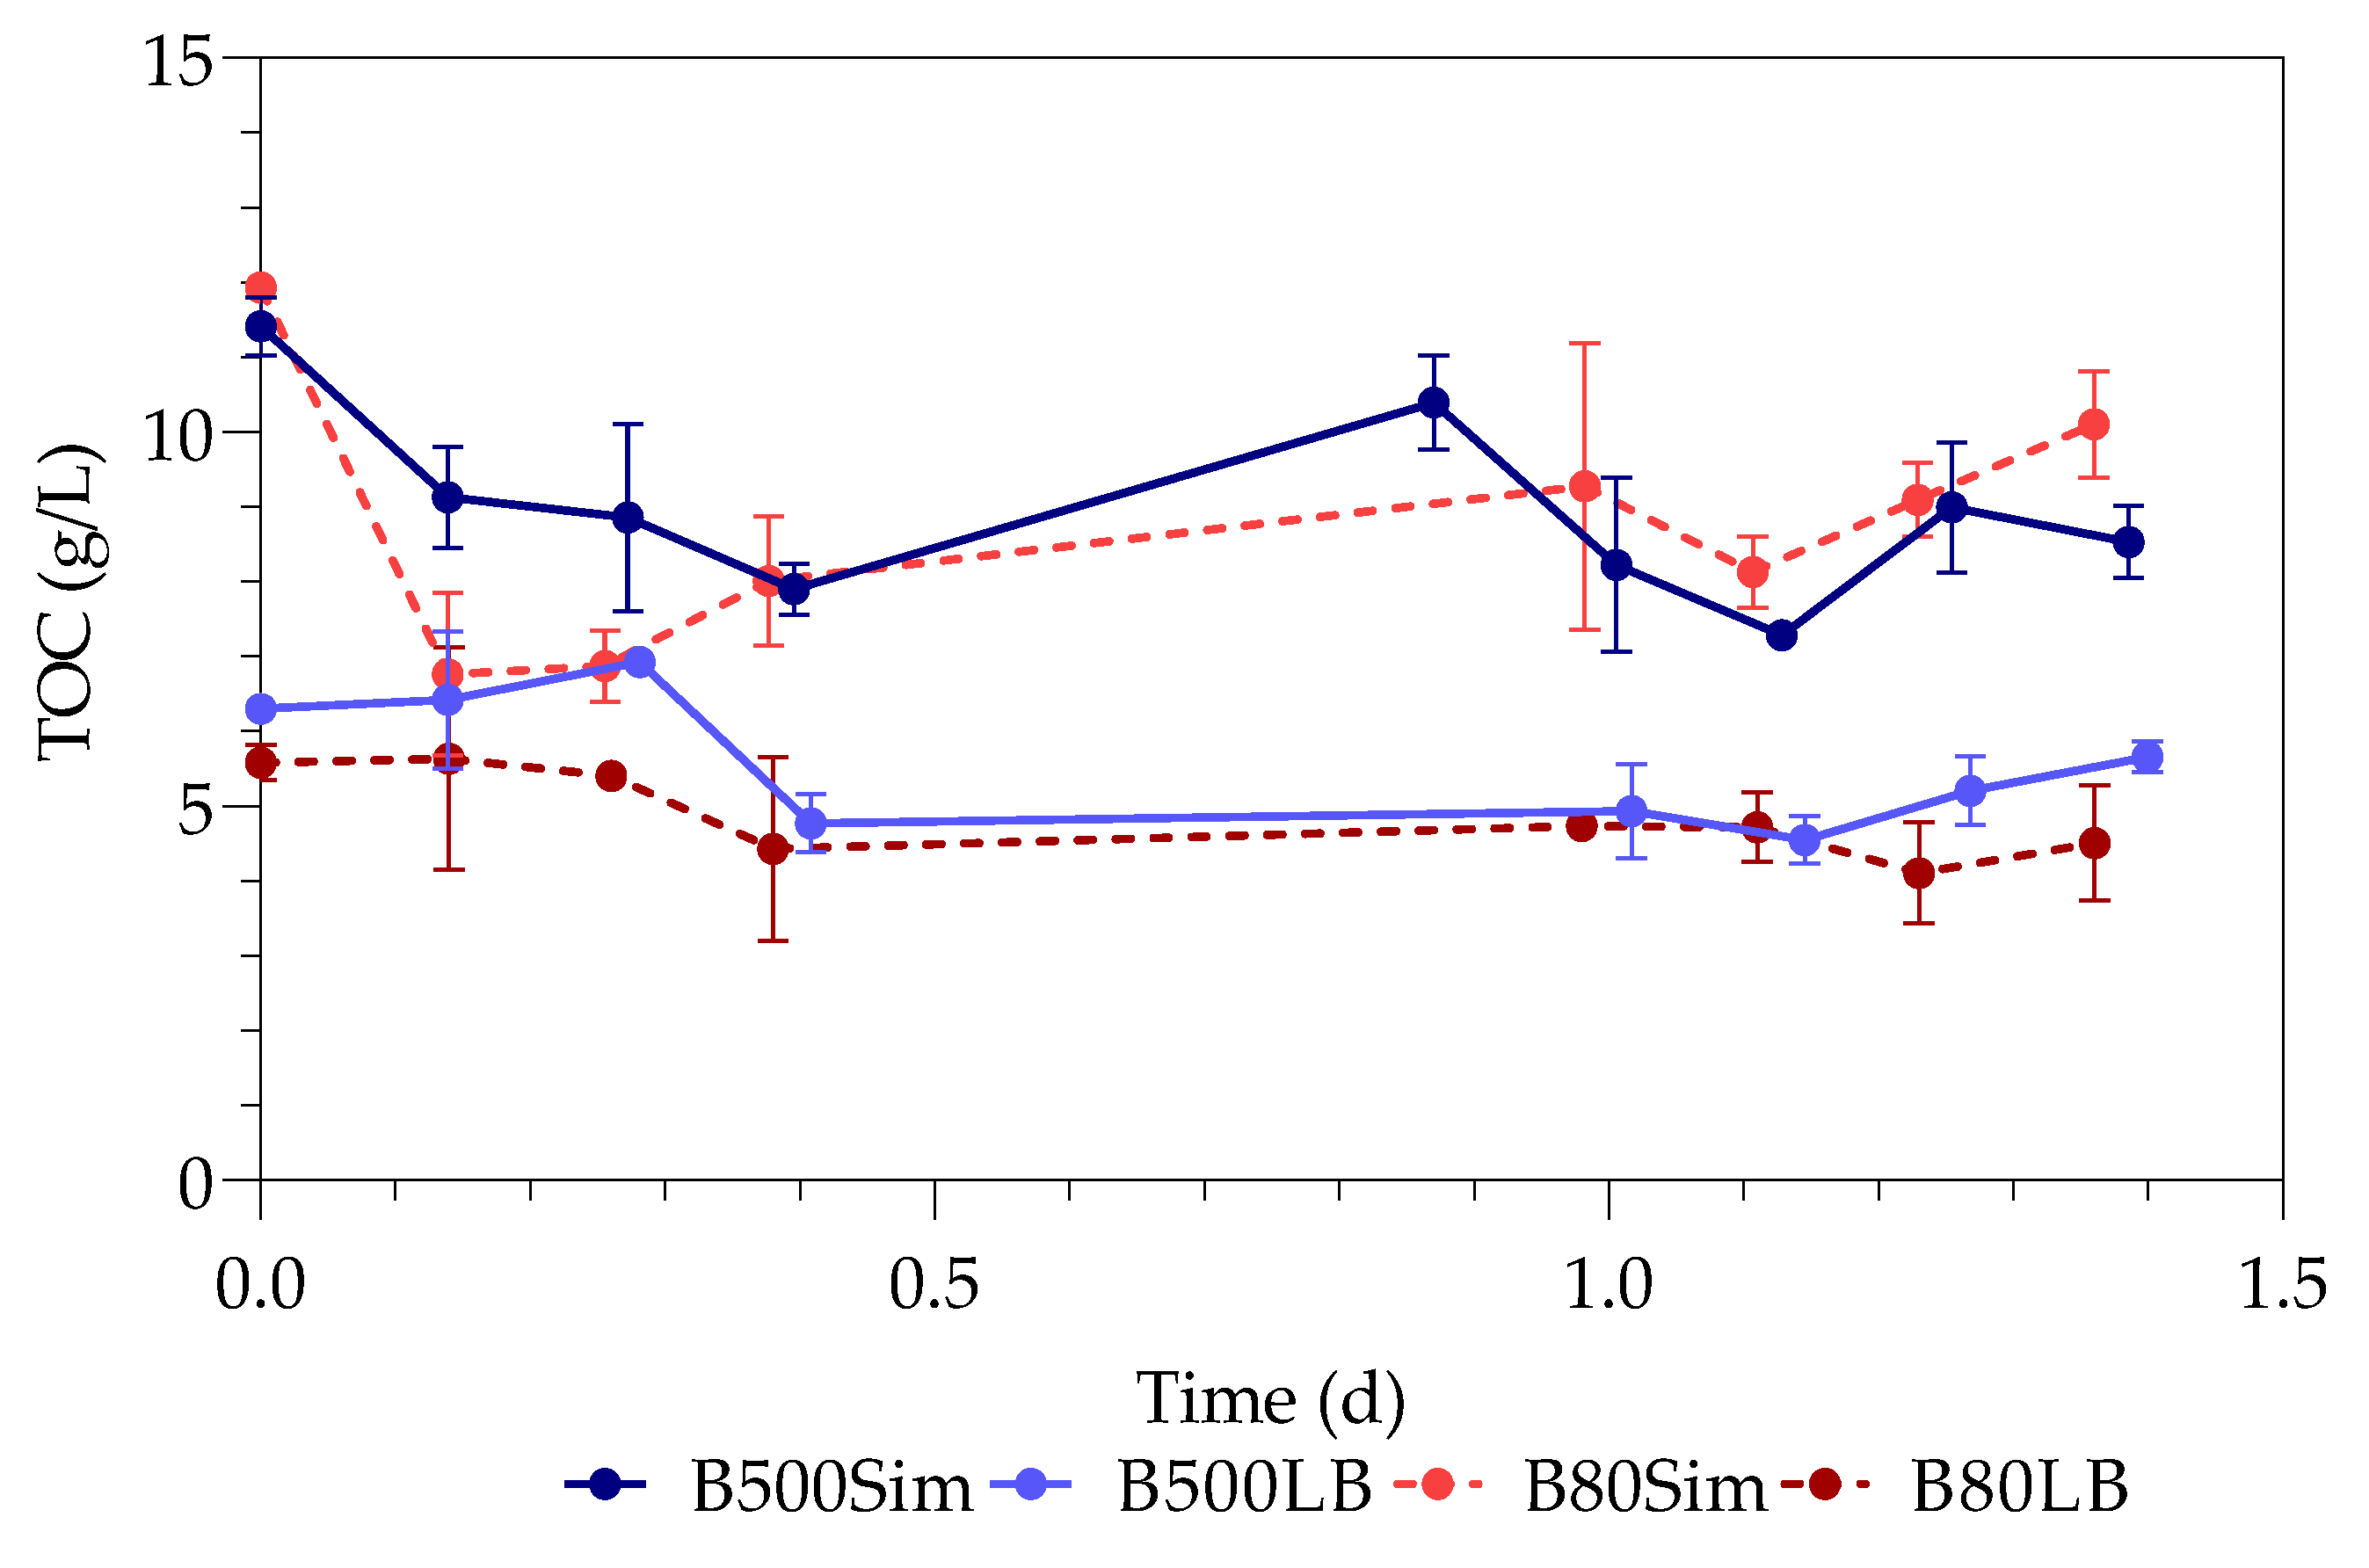
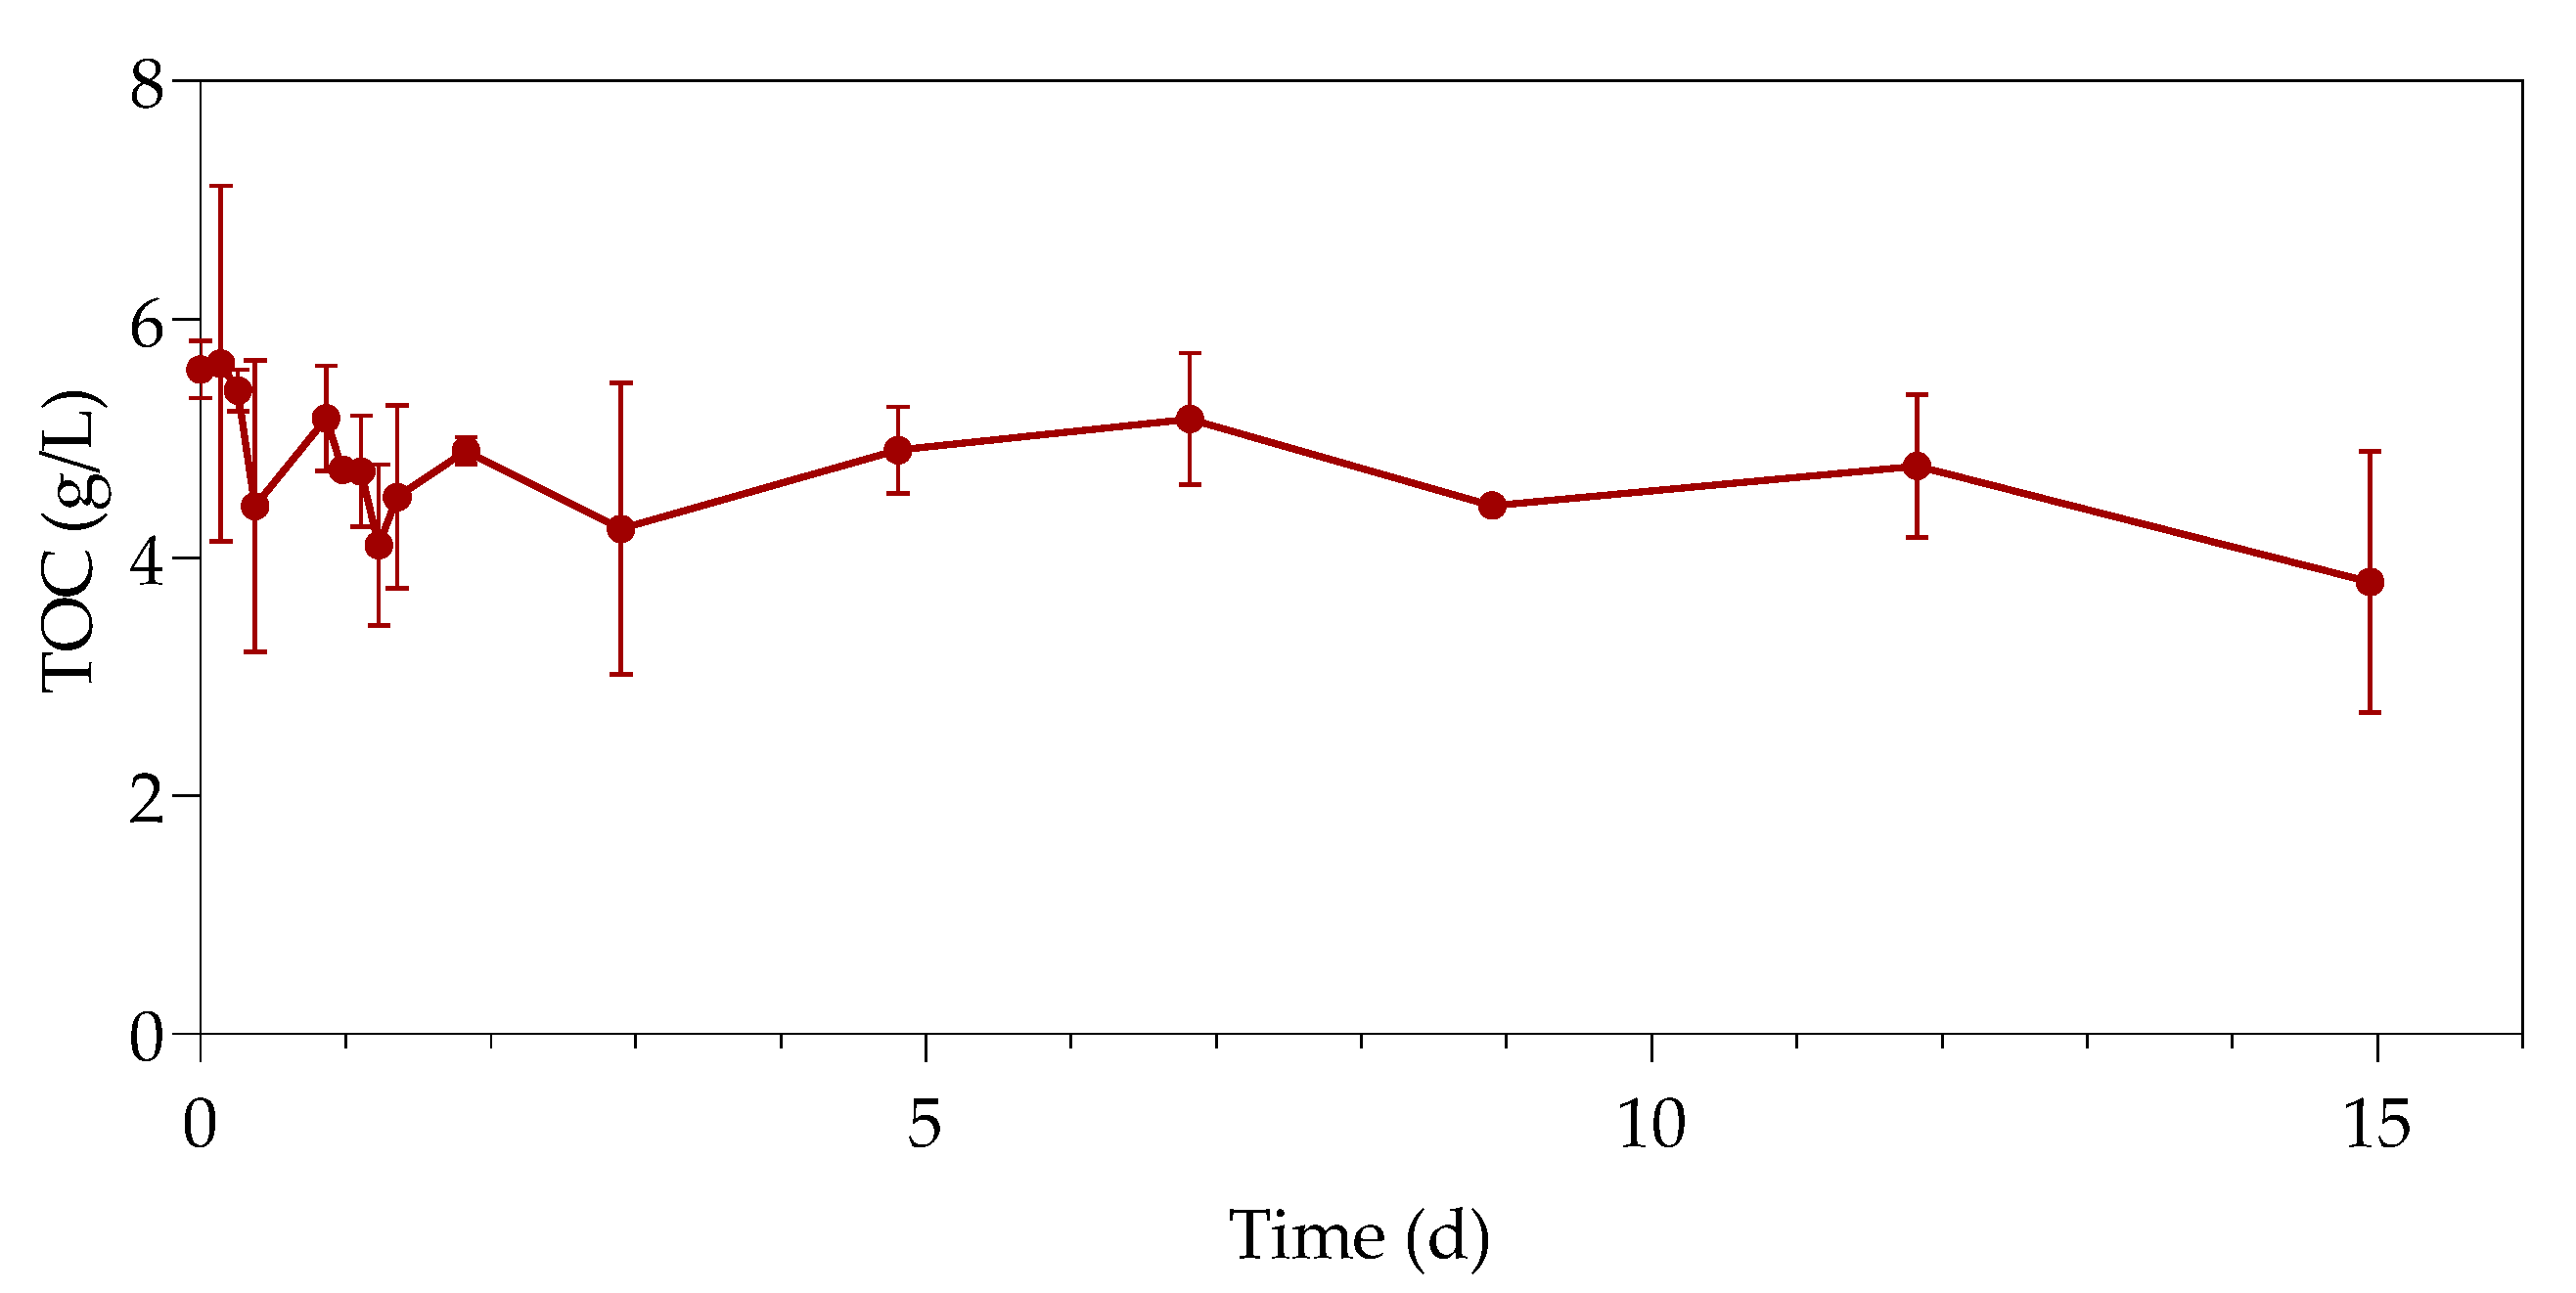
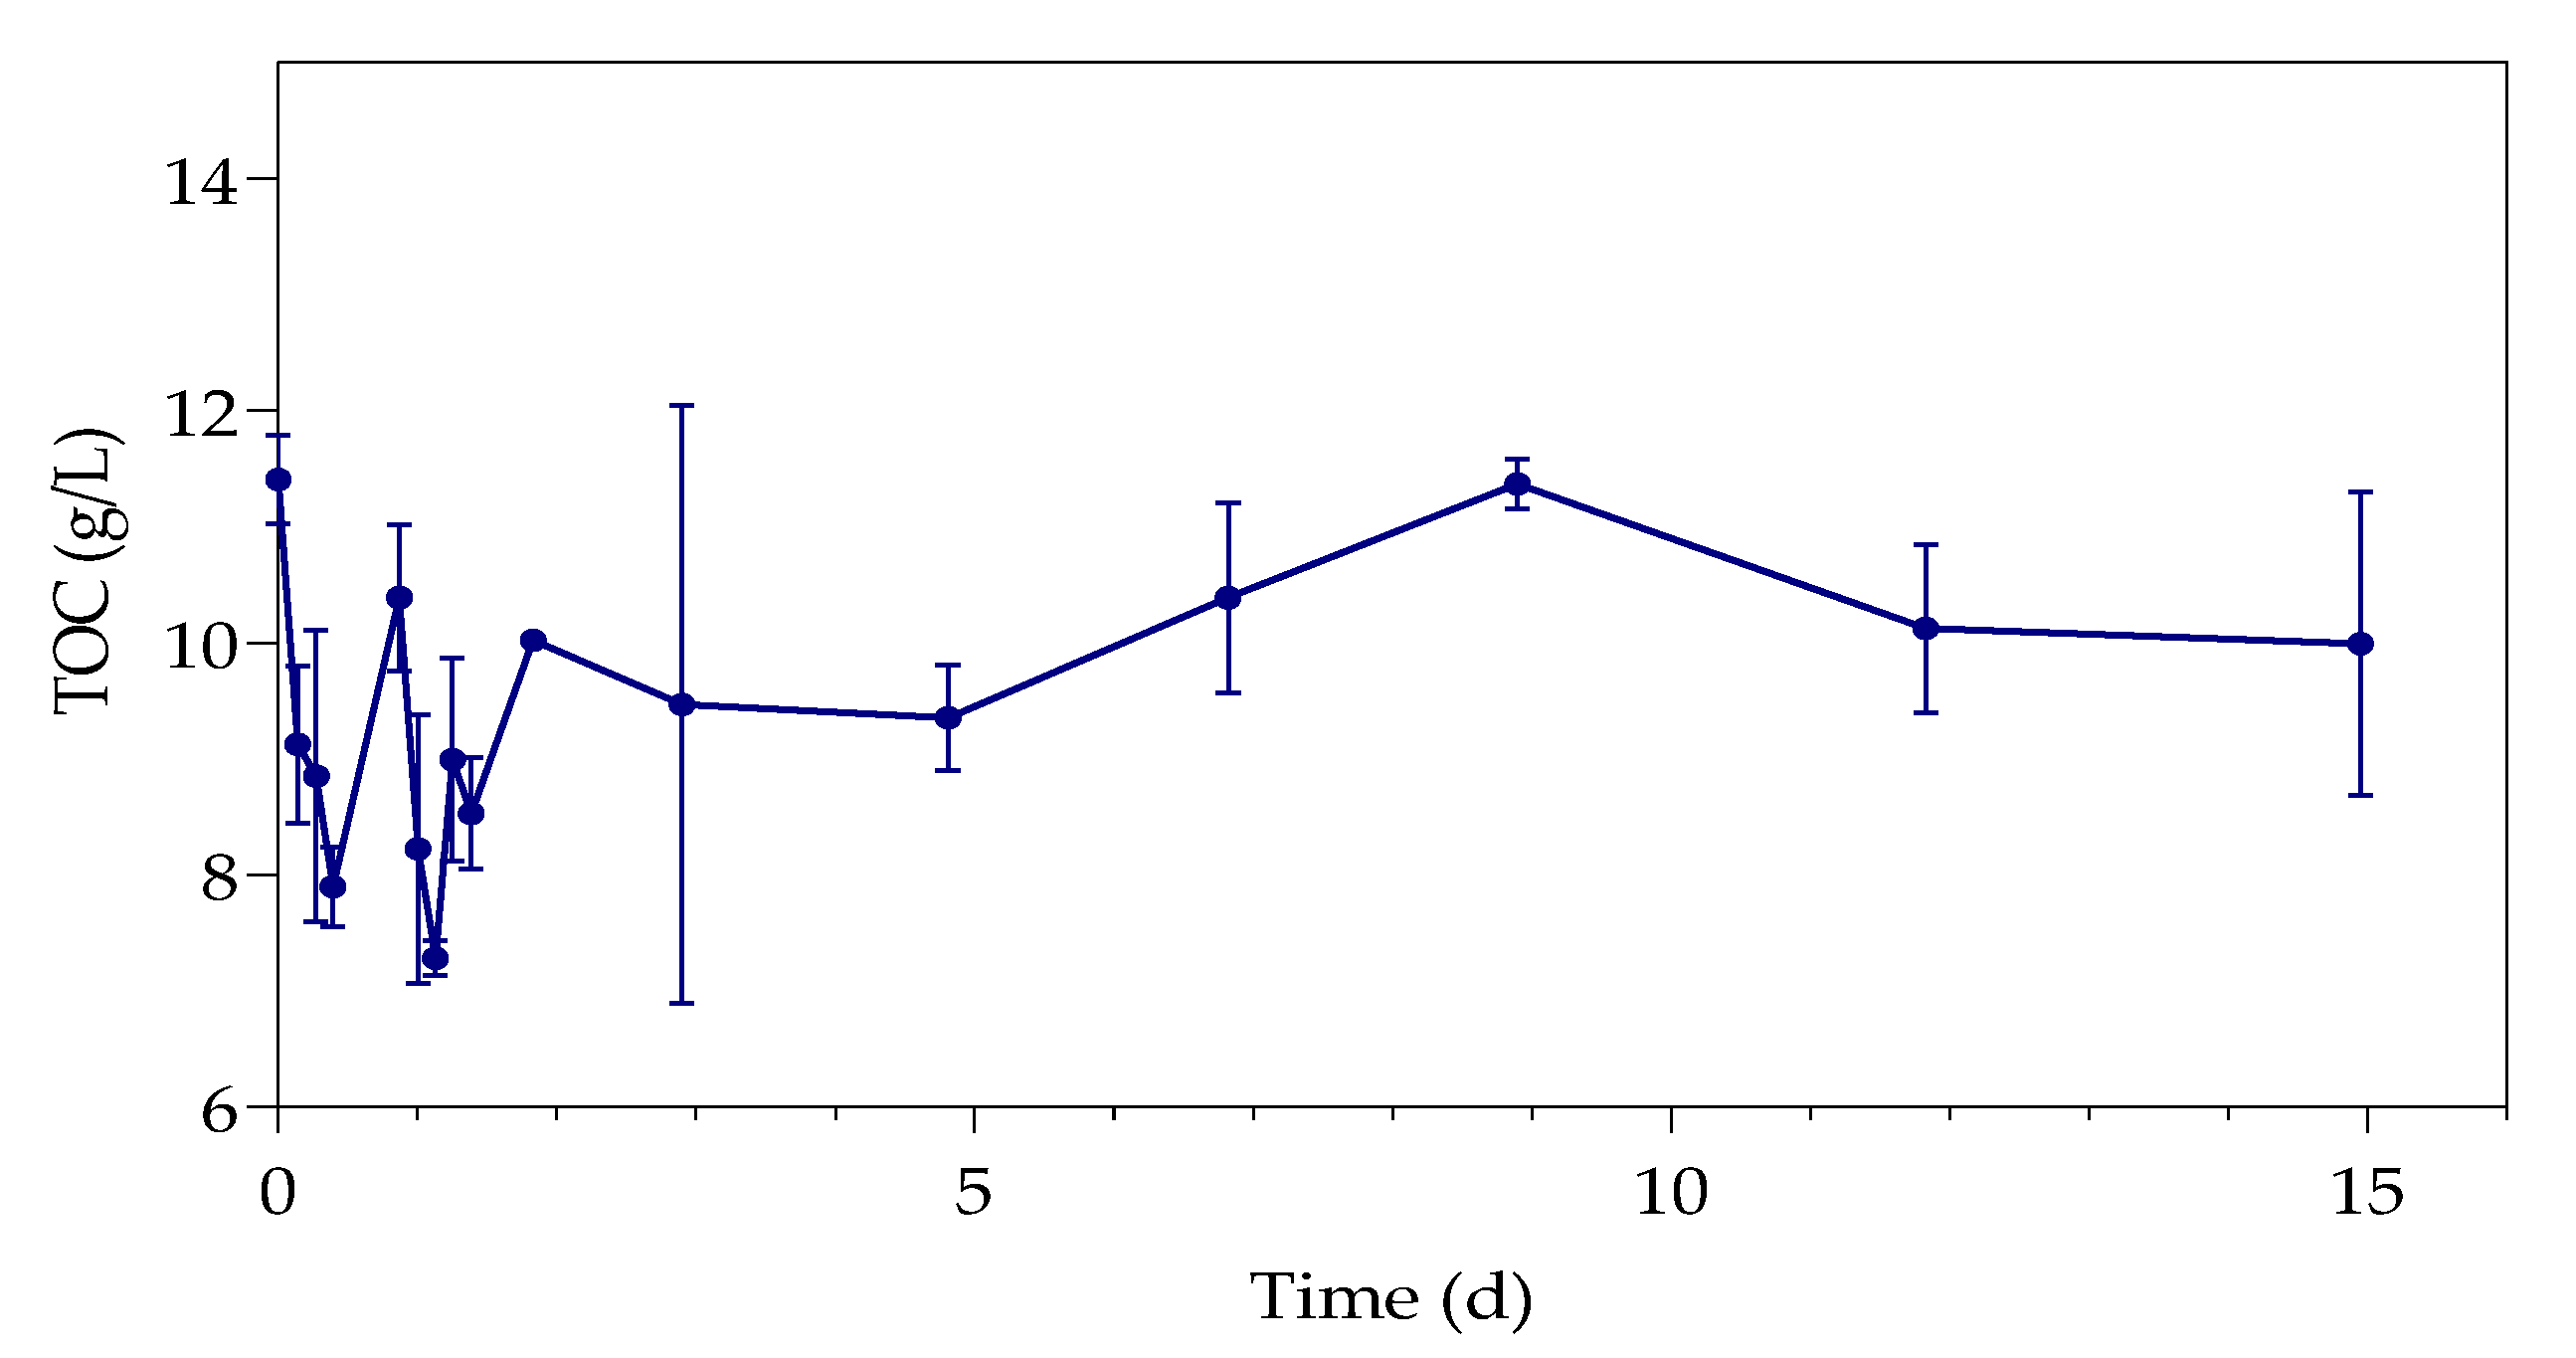
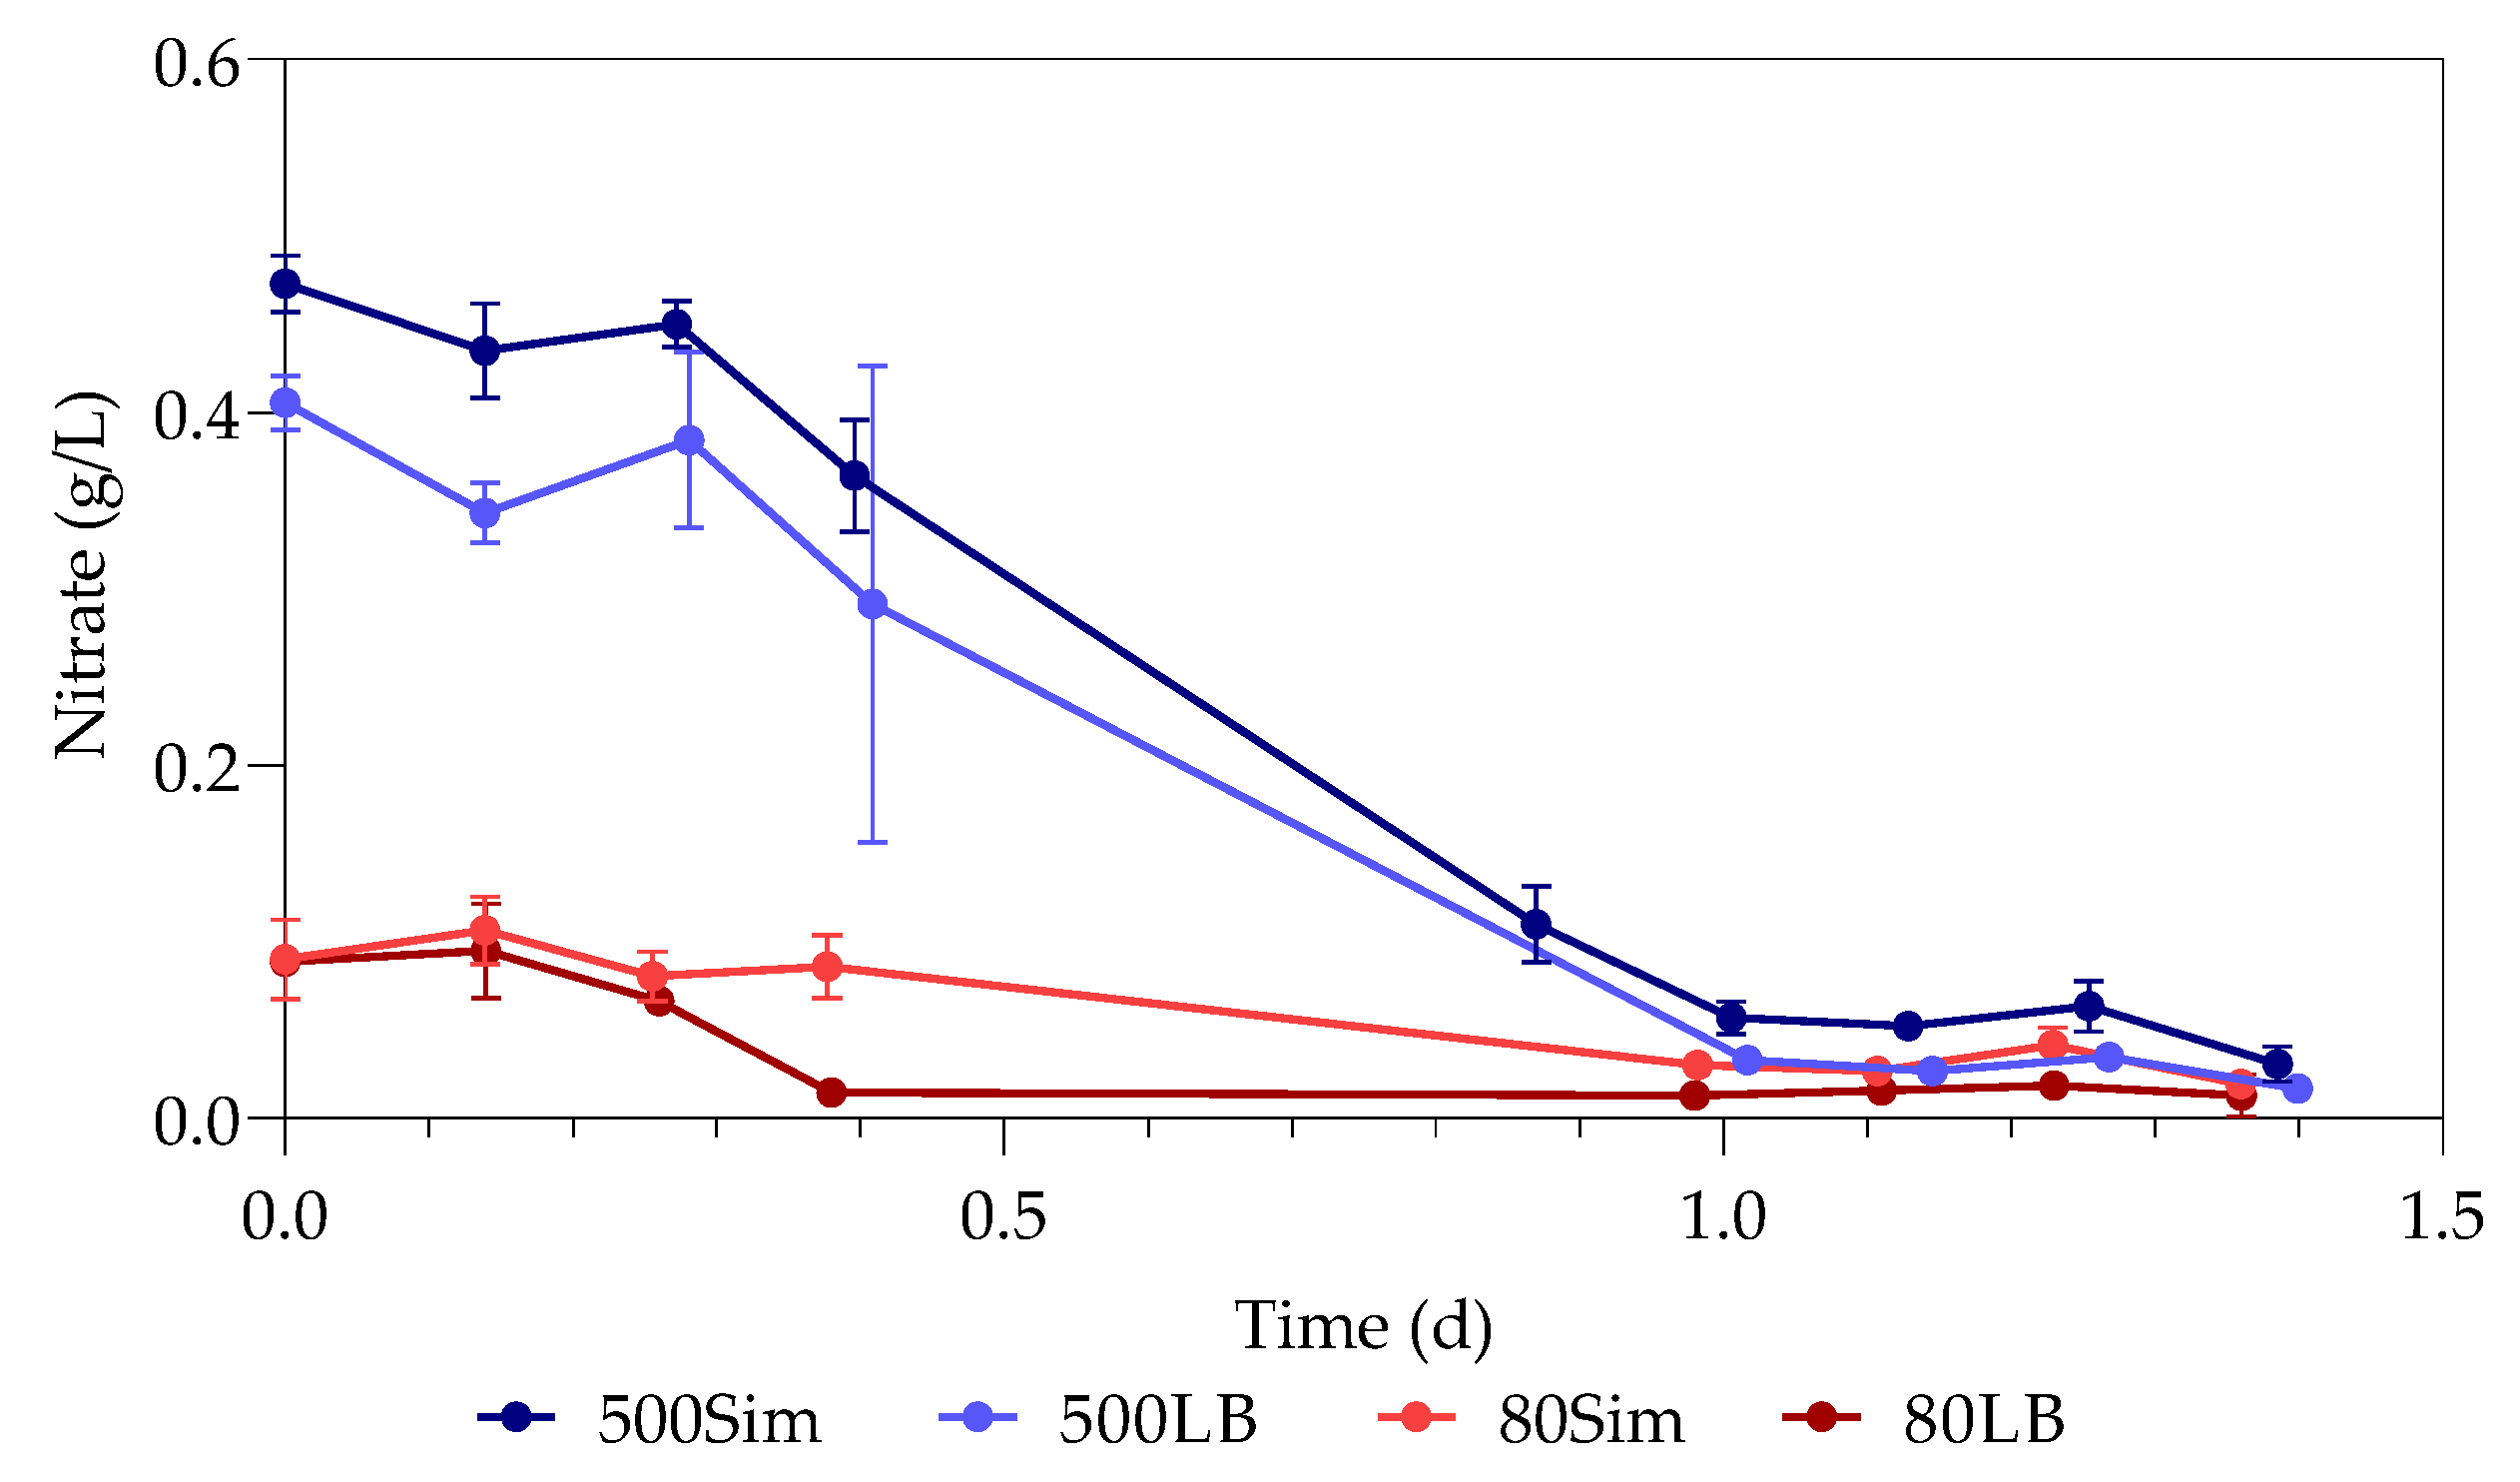
The study investigated the effect of Pb(II) and nutrient concentrations on Pb(II) bio-removal, microbial growth, active species, and population distribution of an industrially obtained Pb(II)-resistant consortium. The results demonstrated that the removal of Pb(II) from solution was independent of microbial metabolic activity and nutrient availability; the majority of Pb(II) removal (≈50%) took place during the first 3 h in the absence of observable changes in reactor medium, indicating a biosorption mechanism present. Metabolic activity was dependent on the amount of nitrate available, and a lag in initial growth may indicate a detoxification mechanism at work during the initial few hours of rapid Pb(II) removal. A small drop in total organic carbon indicates that substrate depletion was not a contributing factor to any growth changes.
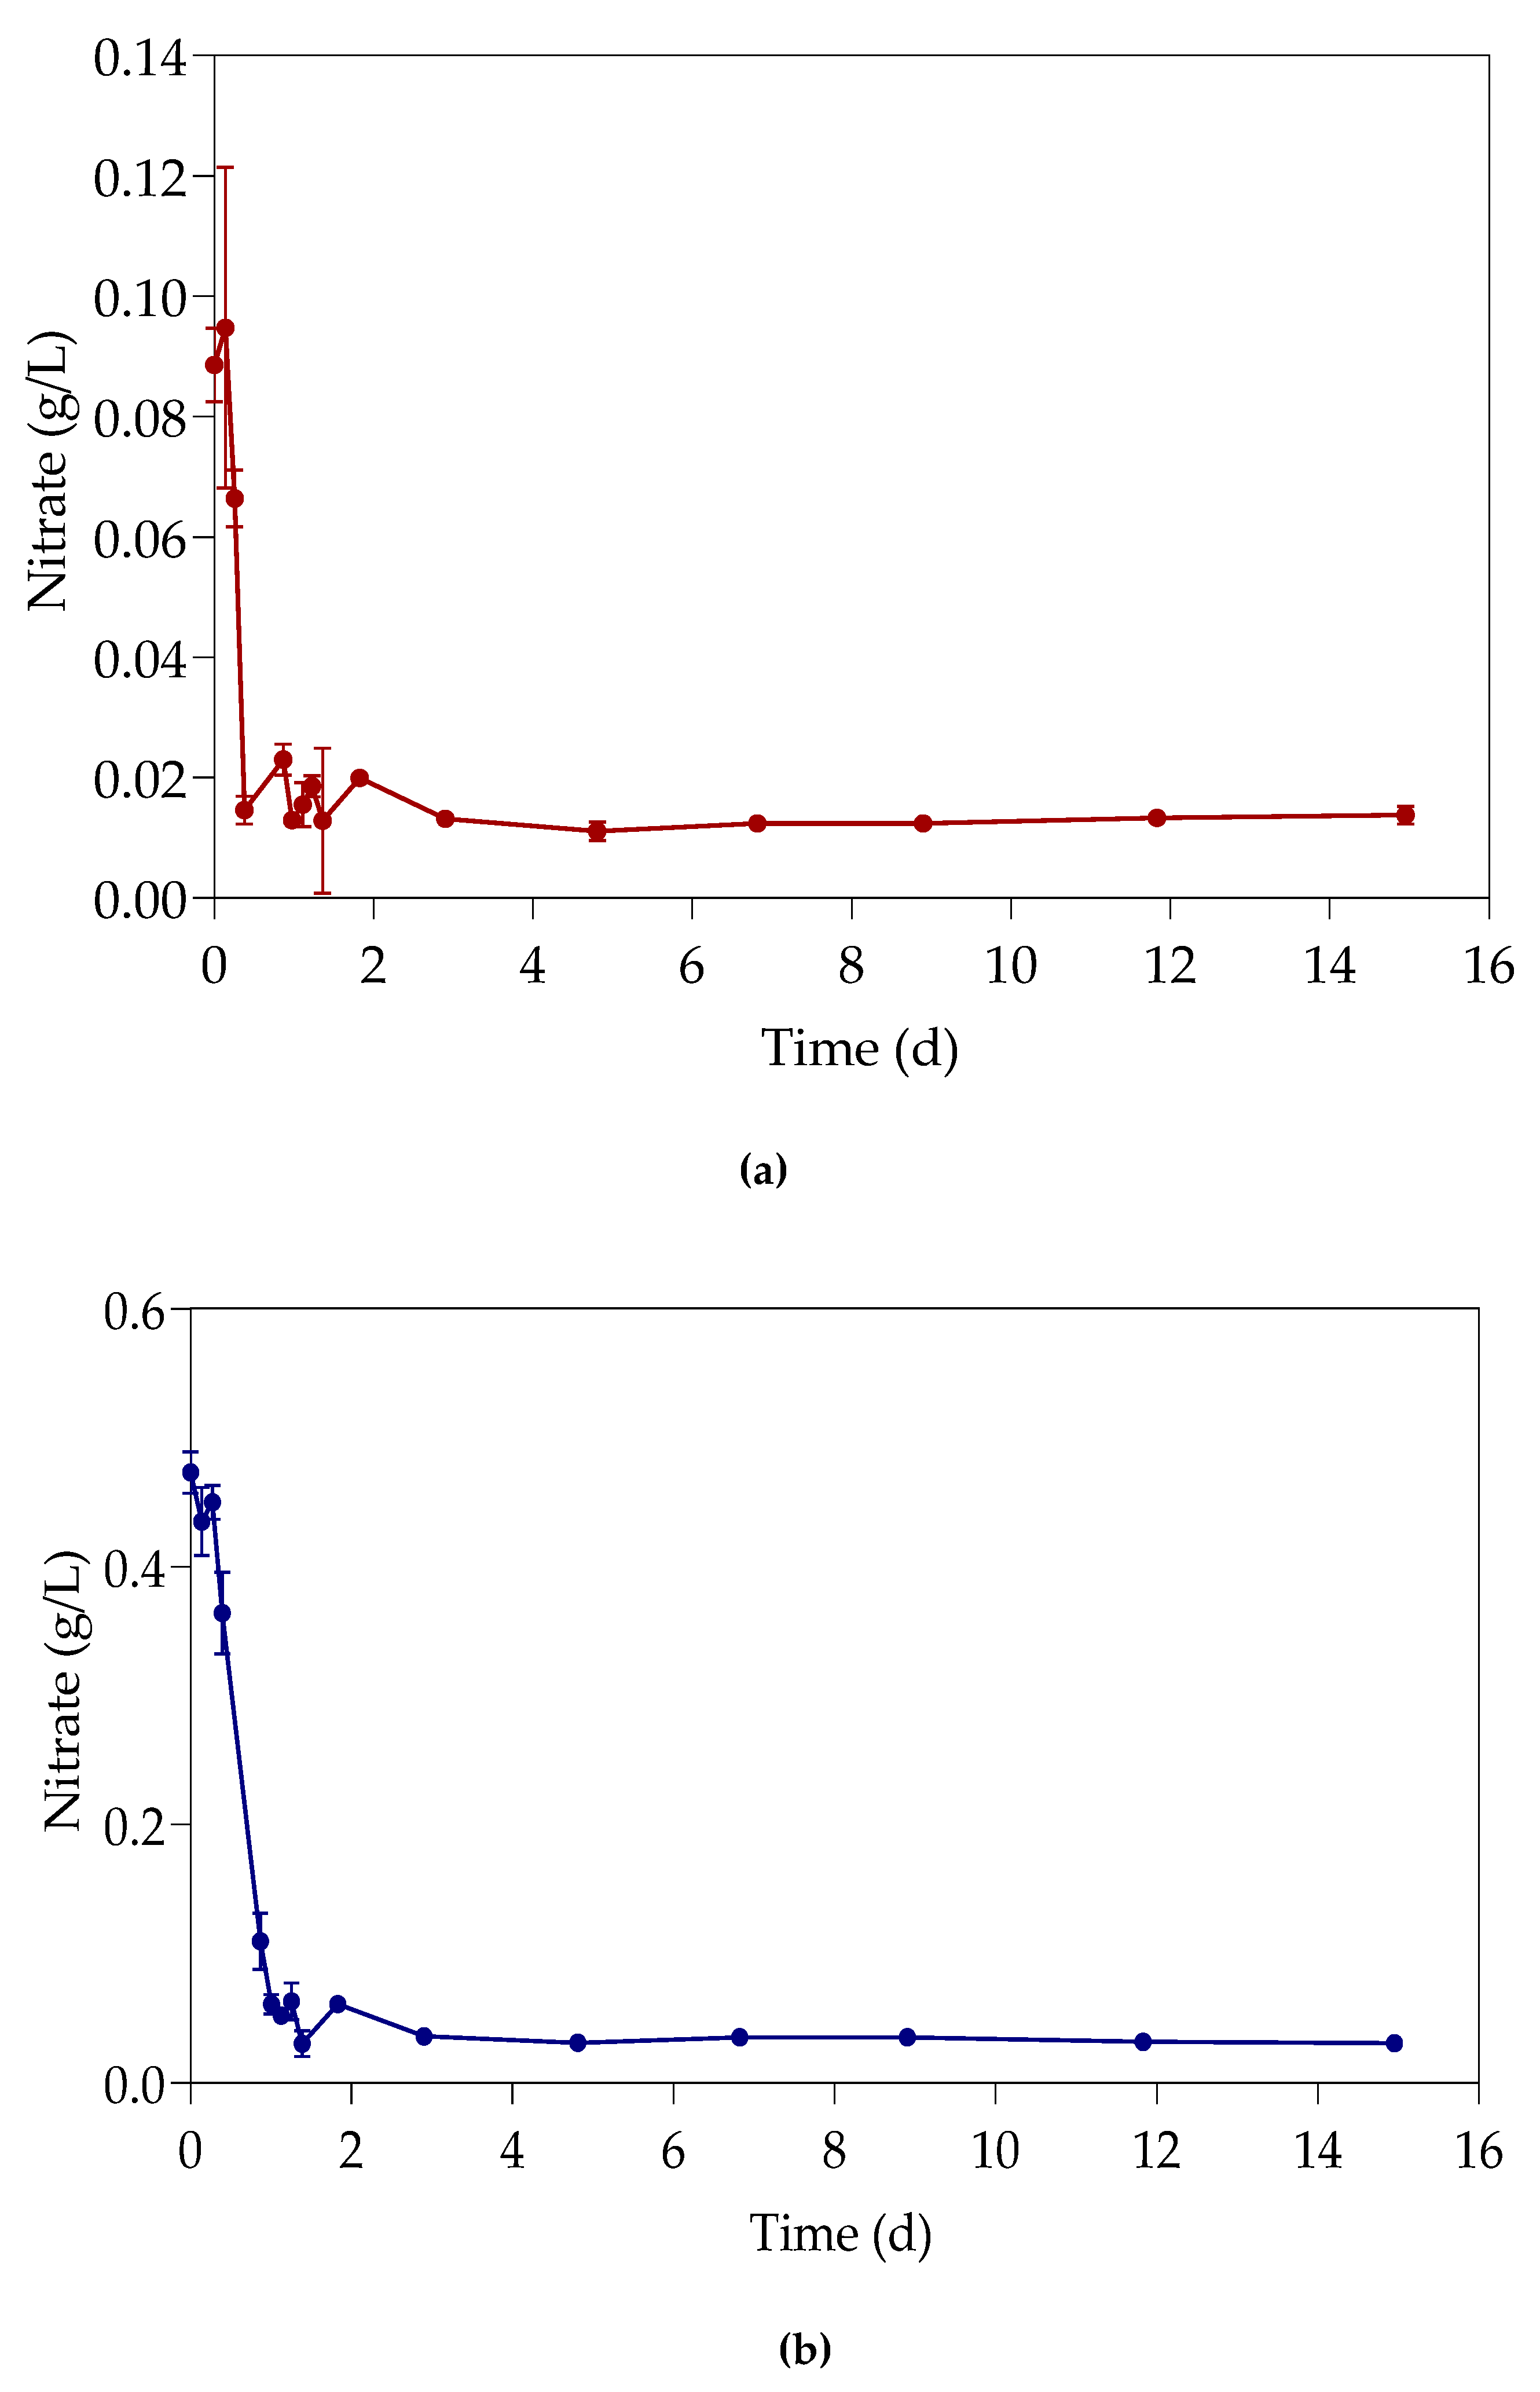
The consumption of nitrates during initial exponential growth provides evidence for anaerobic respiration/denitrification present. Anaerobic respiration is the metabolic process during which microbes transfer electrons to terminal electron acceptors other than oxygen. It is crucial when the bacteria require the removal of surplus electrons to maintain an internal redox balance in the microbial cell. Compounds such as nitrate or metals (such as Pb(II)) have been used as electron acceptors for oxidizing NAD(P)H to NAD(P)+ [20]. It is proposed that nitrates are used as alternative electron acceptors in the absence of oxygen, during the first few hours of exponential growth, where the nitrate levels presented a decrease coupled with a growth increase. Sulphur is released at the same time during denitrification with the enzyme nitrate reductase from cysteine and methionine [21], two amino acids present in the substrate, which in turns binds with Pb(II) to form PbS. When the nitrates are depleted a second alternative electron sink is required. It is highly likely that the remaining Pb(II) was then converted to Pb, as observed in a previous study conducted and published by this team [9]. The exact mechanism should, however, be verified in future investigations as a conclusive answer could not yet be drawn.
The presence of various species in both the 80 and 500 ppm samples indicated a diverse consortium with Pb-resistant capabilities; however, the results from the spread-plate experiment evidence that Klebsiella pneumoniae was the dominant species responsible for Pb(II) precipitation. The dominance of the effective Pb biosorbent Ralstonia solanacearum species at 500 ppm Pb provides credence to the hypothesis that a biosorption mechanism is responsible for the initial Pb(II) removal observed in the initial 3 h. Preliminary unpublished experiments conducted by this team found that the consortium of bacteria performs better at Pb(II) removal as opposed to a refined single species, but conclusive results are required, and further studies will be implemented into the investigation of a synergistic co-existence between various microbial entities present during Pb(II) removal.
The specific growth rates were calculated under the various conditions with Pb(II) inhibition. It was found that the overall generation time for the consortium was comparatively quick. The rapid rate of generation was attributed to various microbial entities present in the sample, each with different generation times and growth rates.
It was concluded from the morphology studies that viable bacterial cells are embedded in abundance in the precipitate. This indicated a precipitation mechanism rather than an external excretion mechanism.
The findings from this study elucidate the possible mechanisms of Pb(II) removal and subsequent precipitation and will be implemented in conjunction with a proposed kinetic model to develop a design and implementation strategy for continuous bio removal and recovery of Pb(II) from industrial effluents.

Author Contributions

Conceptualization, H.G.B. and C.H.; methodology, C.H.; formal analysis, C.H.; investigation, H.G.B. and C.H.; resources, H.G.B. and E.M.N.C.; writing—original draft preparation, C.H.; writing—review and editing, H.G.B. and E.M.N.C.; supervision, H.G.B. and E.M.N.C.; project administration, H.G.B. and E.M.N.C.; funding acquisition, H.G.B. and E.M.N.C. All authors have read and agreed to the published version of the manuscript.

Funding

This work is based on the research supported in part by the National Research Foundation of South Africa (Grant Numbers 106938 and 121891).

Conflicts of Interest

The authors declare no conflicts of interest.

References

  1. Duruibe, J.O.; Ogwuegbu, M.O.C.; Egwurugwu, J.N. Heavy metal pollution and human biotoxic effects. Int. J. Phys. Sci. 2007, 2, 112–118. [Google Scholar]
  2. Substances Agency for Toxic and Disease Registry. Toxicological Profile for Lead. Available online: https://www.atsdr.cdc.gov/toxprofiles/tp.asp?id=96&tid=22 (accessed on 24 July 2019).
  3. U.S. Geological Survey. Mineral Commodity Summaries 2019. Available online: https://pubs.usgs.gov/periodicals/mcs2020/mcs2020.pdf (accessed on 5 January 2020).
  4. International Lead Association. Lead Production & Statistics. Available online: https://www.ila-lead.org/lead-facts/lead-production--statistics (accessed on 6 May 2019).
  5. Pan, X.; Chen, Z.; Li, L.; Rao, W.; Xu, Z.; Guan, X. Microbial strategy for potential lead remediation: A review study. World J. Microbiol. Biotechnol. 2017, 33, 1–7. [Google Scholar] [CrossRef]
  6. Hee, J.; Bolan, N. Lead immobilization and bioavailability in microbial and root interface. J. Hazard. Mater. 2013, 261, 777–783. [Google Scholar] [CrossRef] [PubMed]
  7. Aiking, H.; Govers, H.; Van’t Riet, J. Detoxification of mercury, cadmium, and lead in Klebsiella aerogenes NCTC 418 growing in continuous culture. Appl. Environ. Microbiol. 1985, 50, 1262–1267. [Google Scholar] [CrossRef] [PubMed] [Green Version]
  8. Bowman, N.; Patel, D.; Sanchez, A.; Xu, W.; Alsaffar, A.; Tiquia-arashiro, S.M. Lead-resistant bacteria from Saint Clair River sediments and Pb removal in aqueous solutions. Appl. Microbiol. Biotechnol. 2018, 102, 2391–2398. [Google Scholar] [CrossRef] [PubMed]
  9. Brink, H.G.; Hörstmann, C.; Peens, J. Microbial Pb(II)-precipitation: The influence of oxygen on Pb(II)-removal from aqueous environment and the resulting precipitate identity. Int. J. Environ. Sci. Technol. 2019, 17, 409–420. [Google Scholar] [CrossRef]
  10. Brink, H.G.; Mahlangu, Z. Microbial Lead(II) precipitation: The influence of growth substrate. Chem. Eng. Trans. 2018, 64, 439–444. [Google Scholar]
  11. Brink, H.G.; Hörstmann, C.; Feucht, C.B. Microbial Pb (II) Precipitation: Minimum Inhibitory Concentration and Precipitate Identity. Chem. Eng. Trans. 2018, 74, 1453–1458. [Google Scholar]
  12. Peens, J.; Wu, Y.W.; Brink, H.G. Microbial Pb (II) Precipitation: The Influence of Elevated Pb (II) Concentrations. Chem. Eng. Trans. 2018, 64, 1453–1458. [Google Scholar]
  13. Wang, H.; Cheng, H.; Wang, F.; Wei, D.; Wang, X. An improved 3-(4,5-dimethylthiazol-2-yl)-2,5-diphenyl tetrazolium bromide (MTT) reduction assay for evaluating the viability of Escherichia coli cells. J. Microbiol. Methods 2010, 82, 330–333. [Google Scholar] [CrossRef] [PubMed]
  14. Perkin-Elmer. Atomic Spectroscopy a Guide to Selecting the Appropriate Technique and System. Available online: www.perkinelmer.com/atomicspectroscopy (accessed on 17 August 2019).
  15. Kikuchi, S.; Ishimoto, M. Nitrate respiration of Klebsiella pneumoniae on amino acids, especially on serine. Z. Allg. Mikrobiol. 1980, 20, 405–413. [Google Scholar] [CrossRef] [PubMed]
  16. Tiquia-arashiro, S.M. Lead absorption mechanisms in bacteria as strategies for lead bioremediation. Appl. Microbiol. Biotechnol. 2018, 102, 5437–5444. [Google Scholar] [CrossRef] [PubMed]
  17. Pugazhendhi, A.; Manogari, G. New insight into effective biosorption of lead from aqueous solution using Ralstonia solanacearum: Characterization and mechanism studies. J. Clean. Prod. 2018, 174, 1234–1239. [Google Scholar] [CrossRef]
  18. Kirchman, D.L. Calculating microbial growth rates from data on production and standing stocks. Mar. Ecol. Prog. Ser. 2002, 233, 303–306. [Google Scholar] [CrossRef]
  19. Bionumbers. Available online: https://bionumbers.hms.harvard.edu/search.aspx (accessed on 25 February 2020).
  20. Kim, C.; Ainala, S.K.; Oh, Y.; Jeon, B.; Park, S.; Kim, J.R. Metabolic Flux Change in Klebsiella pneumoniae L17 by Anaerobic Respiration in Microbial Fuel Cell. Biotechnol. Bioproc. Eng. 2016, 260, 250–260. [Google Scholar] [CrossRef]
  21. Cerqueira, N.M.; Gonzalez, P.J.; Brondino, C.D.; Romão, C.C.; Moura, I.; Mouraet, J.J. The Effect of the Sixth Sulfur Ligand in the Catalytic Mechanism of Periplasmic Nitrate Reductase. J. Comput. Chem. 2009, 30, 2466–2484. [Google Scholar] [CrossRef] [PubMed]
Figure 1. Pb(II) concentrations with time for 80 and 500 ppm with standard LB or simulated LB.
Sustainability 12 02511 g001
Figure 2. Pellet Pb(II) concentrations with time for 80 and 500 ppm with standard LB or simulated LB.
Sustainability 12 02511 g002
Figure 3. The Pb(II) balance calculated with the supernatant and pellet with time for 80 and 500 ppm with standard LB or simulated LB.
Sustainability 12 02511 g003
Figure 4. 80LB Pb(II) removal with time.
Sustainability 12 02511 g004
Figure 5. 500Sim Pb(II) removal with time.
Sustainability 12 02511 g005
Figure 6. Metabolic activity with time for 80 and 500 ppm with standard LB or simulated LB.
Sustainability 12 02511 g006
Figure 7. 80LB metabolic activity with time.
Sustainability 12 02511 g007
Figure 8. 500Sim metabolic activity with time.
Sustainability 12 02511 g008
Figure 9. Total organic carbon in the supernatants with time for B80 and B500 with standard LB or simulated LB.
Sustainability 12 02511 g009
Figure 10. B80LB total organic carbon against time.
Sustainability 12 02511 g010
Figure 11. B500Sim total organic carbon against time.
Sustainability 12 02511 g011
Figure 12. Nitrate concentrations with time for 80 and 500 ppm with standard LB or simulated LB.
Sustainability 12 02511 g012
Figure 13. 80LB (a) and 500Sim (b) nitrate concentration against time.
Sustainability 12 02511 g013
Figure 14. Phylogenetic tree for the microbial culture results.
Sustainability 12 02511 g014
Figure 15. SEM micrographs of 80LB at 2 µm (a) and 1 µm (b) magnification and of 500Sim at 2 µm (c) and 10 µm (d) magnification.
Sustainability 12 02511 g015
Table 1. A summary of different studies conducted in Pb(II) bioremediation.
BacteriaPb SpeciesMechanismDescriptionProductReference
Enterobacter cloacaePb-contaminated soilsPrecipitationMobilizing insoluble Phosphoric compounds to precipitate Pb(II)Pb10(PO4)6(OH)2Hee and Bolan [6]
Klebsiella aerogenes NCTC 418PbCl2PrecipitationReleasing Sulfide from insoluble Sulfur compounds to precipitate Pb(II)PbSAiking et al. [7]
Klebsiella michiganensisPb(NO3)2BiosorptionBiosorption of Pb(II) to extracellular polymeric substances (EPS)Not mentionedBowman et al. [8]
Consortium (this research team)Pb(NO3)2Dissimilatory precipitationSulfide released from insoluble Sulfur compounds to bind with Pb(II), oxidation-reduction to produce elemental Pb and PbOPbS, PbO and elemental PbBrink et al. [9]
Table 2. The project variables and overall layout.
Independent Variables
Pb(II) 80 ppm500 ppm
Nutrients Standard LB broth
  • 10 g/L Tryptone
  • 5 g/L Yeast Extract
Simulated LB broth
  • 20 g/L Tryptone
  • 10 g/L Yeast Extract
Standard LB broth
  • 10 g/L Tryptone
  • 5 g/L Yeast Extract
Simulated LB broth
  • 20 g/L Tryptone
  • 10 g/L Yeast Extract
NitratesPb(NO3)2Pb(NO3)2Pb(NO3)2Pb(NO3)2
Dependent Variables
  • Pb(II) removal
  • Metabolic Activity (growth) at 550 nm
  • Nitrate removal
  • Total organic carbon
Table 3. Visual changes over time for the different conditions investigated.
Time (h)B80LBB80SimB500LBB500Sim
0 Sustainability 12 02511 i001 Sustainability 12 02511 i002 Sustainability 12 02511 i003 Sustainability 12 02511 i004
6 Sustainability 12 02511 i005 Sustainability 12 02511 i006 Sustainability 12 02511 i007 Sustainability 12 02511 i008
9 Sustainability 12 02511 i009 Sustainability 12 02511 i010 Sustainability 12 02511 i011 Sustainability 12 02511 i012
24 Sustainability 12 02511 i013 Sustainability 12 02511 i014 Sustainability 12 02511 i015 Sustainability 12 02511 i016
27 Sustainability 12 02511 i017 Sustainability 12 02511 i018 Sustainability 12 02511 i019 Sustainability 12 02511 i020
33 Sustainability 12 02511 i021 Sustainability 12 02511 i022 Sustainability 12 02511 i023 Sustainability 12 02511 i024
Control
0 Sustainability 12 02511 i025
72 Sustainability 12 02511 i026
Table 4. Streak plate characterization of 80LB and 500Sim.
80LB500Sim
BLAST Hit %BLAST Hit %
(Clostridium) bifermentans25.74Ralstonia solanacearum33.54
Klebsiella pneumoniae21.52(Clostridium) bifermentans25.41
Listeria monocytogenes20.36Klebsiella pneumoniae23.81
HIV-1 isolate15.82Clostridium bifermentans6.26
Uncultured bacterium6.12Uncultured bacterium 4.57
Uncultured organism2.43Clostridium sporogenes3.76
No hits2.22Uncultured klebsiella 1.44
Clostridium bifermentans1.58Uncultured clostridium 0.41
Human immunodeficiency1.48Clostridium sp.0.26
Bacillus sp.0.74HIV-1 isolate 0.22
Listeria phage0.32Uncultured organism 0.09
Pediococcus pentosaceus0.32Enterococcus casseliflavus0.08
Uncultured klebsiella0.21Uncultured enterobacteriales 0.06
Table 5. Calculated growth rates with estimated constants.
Experiment μ m a x t 2   ( Generation   Time )
B80Sim23.80.029 d = 0.55 h = 33 min 12 sec
B80LB23.60.029 d = 0.55 h = 33 min 12 sec
B500Sim13.10.053 d = 1 h 16 min = 76.2 min
B500LB13.20.053 d = 1 h 16 min = 76.2 min

