Life Cycle Environmental and Cost Performance of Prefabricated Buildings


1
School of Environmental Engineering, the University of Kitakyushu, Kitakyushu 8080135, Japan
2
iSMART, Qingdao University of Technology, Qingdao 266033, China
*
Authors to whom correspondence should be addressed.
Sustainability 2020, 12(7), 2609; https://0-doi-org.brum.beds.ac.uk/10.3390/su12072609
Submission received: 5 March 2020
/
Revised: 17 March 2020
/
Accepted: 18 March 2020
/
Published: 25 March 2020
Abstract
:Global greenhouse gas (GHG) emissions from the construction industry continue to increase at an annual rate of 1.5%. It is particularly important to understand the characteristics of the building life cycle to reduce its environmental impact. This paper aims to assess the environmental impact of prefabricated buildings and traditional cast-in-situ buildings over the building life cycle using a hybrid model. A case study of a building with a 40% assembly rate in Japan was employed for evaluation. It concluded that the total energy consumption, and carbon emissions of the prefabricated building was 7.54%, and 7.17%, respectively, less than that of the traditional cast-in-situ building throughout the whole life cycle. The carbon emissions reduction in the operation phase reached a peak of 4.05 kg CO2/year∙m2. The prefabricated building was found to cost less than the traditional cast-in-situ building, reducing the price per square meter by 10.62%. The prefabricated building has advantages in terms of reducing global warming, acid rain, and health damage by 15% reduction. With the addition of the assembly rate, the carbon emissions and cost dropped, bottoming out when the assembly rate was 60%. After that, an upward trend was shown with the assembly rate increasing. Additionally, this study outlined that the prefabricated pile foundations is not applicable due to its high construction cost and environmental impact.
1. Introduction
The Intergovernmental Panel on Climate Change (IPCC) [1] indicated that if the current growth rate of greenhouse gas emissions is maintained, the global average temperature will increase by 1.5 °C from 2030 to 2052, which will cause serious damage to the ecological environment. The United Nations Environment Programme (UNEP) points out that the construction industry consumes 40% of the energy, 30% of the raw materials, and 25% of the solid waste available globally and produces 36% of the total greenhouse gas (GHG) emissions [2]. The global GHG emissions from the construction industry continue to grow at an annual rate of 1.5% [3]. In developed countries, the construction industry also accounts for a high proportion of carbon emissions. Carbon emissions generated by building operation and construction account for 50%, 33%, and over 40% of the total social output in the UK, Japan, and the US, respectively [4]. Therefore, it is particularly important to understand the characteristics of in the process of construction, operation, and replacement during the life cycle of a building to reduce the environmental impact. Prefabricated buildings are buildings that use prefabricated components and prefabricated construction technology, combined with new energy-saving technology, which improves the building quality, reduces energy consumption, shortens the construction period, and saves money in the building life cycle [5,6,7,8].
Prefabricated buildings have been developed rapidly since World War II and are widely used all over the world [9]. The term used to describe “prefabricated buildings” is slightly different in various countries and regions, for example, “prefabrication”, “pre-assembly”, “modularization”, and “off-site manufacturing” [10]. “Modular housing” is used in America [11], “prefabricated housing” in Japan and mainland China [12,13], “prefabricated buildings” in the Australia [8]; “prefabrication” in Hong Kong and Singapore [14,15], and “off-site production” in European countries [16], which refers not only to prefabs but also to elements like reinforcement structures (e.g., cages for columns) that are manufactured offside and mounted on site. The environmental impacts of prefabricated buildings and traditional cast-in-situ buildings have been compared using process models. The results showed that the GHG emissions of prefabricated buildings in the construction stage were less than those of traditional cast-in-situ buildings [17]. A similar comparative study on the consumption of materials and energy in the construction process was conducted. It showed that, compared with traditional buildings, prefabricated buildings have less wood and water usage while causing less damage to the environment and health [18]. Case studies have shown that the embodied energy content of a typical concrete frame and block construction accounts for 66% of typical concrete frame structures [19]. The thermal insulation optimization of prefabricated buildings can effectively reduce the energy consumption for heating and cooling. The durability is also better [20]. By adopting a mature recycling system, concrete waste generated from the demolition of buildings can be efficiently recycled, thereby reducing recycling costs and environmental impact [21]. The recovery rate of metallic materials and concrete is higher than that of other non-metallic materials. Non-recycled, non-metallic materials are usually shipped to landfills as waste [22]. Analysis of the carbon footprint and energy footprint of these two types of buildings showed that prefabricated buildings have reduced carbon emissions and energy consumption [23].
In the practical and theoretical fields, research on prefabricated buildings has mainly focused on the performance of building components, economic benefits, and the impact of a single stage specifically on the environment, but studies from the perspective of the whole life cycle of prefabricated buildings have been rare [24,25,26]. It is necessary to extend the prefabricated building study boundaries to the whole life cycle period. Prefabricated buildings have developed completely in Japan. From 1970 until now, it has developed to the fourth generation, forming a complete industrial chain from design and construction to construction operation and demolition [27]. In addition, the basic data on buildings and environment in Japan are complete, thereby providing a stable basis for the research and exploration to investigate the impact of prefabricated buildings on the environment during their life cycle [28]. Moreover, Japan has a high urbanization rate and a high level of building industrialization [29]. Therefore, the use of Japanese prefabricated buildings as the research object has significance for the development of the construction industry in other countries.
As a widely recognized environmental impact analysis tool, life cycle assessment (LCA) can be divided into two types according to the differences in the calculation process and research purposes: attribution and consequence [30,31]. The attribution LCA model is suitable for relevant studies on the impact of the building environment [15,32]. There are three kinds of mathematical model for the attribution LCA—the input-output model (I-O model), the process-based model, and the hybrid model [32,33]. The I-O model is based on the economic input and output table of a country or region, which can measure the impact on resource consumption and environment in various ranges, taking into account the sectoral dependence of related sectors of construction [34]. However, this model has homogeneity, data timeliness, and uncertainty [35]. The process-based analysis model quantifies the energy and resource usage of buildings at different stages and improves the accuracy of the results [36]. However, the data collection of this model is complex and requires high data accuracy. Meanwhile, the definition of the model’s scope may also cause errors [37]. The hybrid model combines the characteristics of the process model with those of the I-O model to reduce errors [38].
The common definition of a life cycle is the entire process from the cradle to the grave, which corresponds to the scope of this paper from the design to the demolition stage. The life cycle of a prefabricated building is divided into three phases in this paper: construction, use, and demolition. The life cycle of a prefabricated building is divided into three phases—construction, use, and demolition in this paper. The purpose of this study is to analyze the energy consumption and carbon emissions of Japanese prefabricated buildings across the life cycle from the macro perspective. In view of the characteristics and limitations of the process-based model and the I-O model, the hybrid model is selected as the calculation method. In Section 2, the mixed model is used to respectively explain the supply chain activities and production processes of prefabricated buildings during different processes. In addition, the calculation methods are introduced. In Section 3 and Section 4, the energy consumption and environmental impact characteristics of prefabricated buildings are analyzed under different working conditions through data collection and processing, and the advantages of prefabricated buildings are analyzed through a compassion with traditional buildings. Section 5 provides the conclusions and further describes possible measures to conserve energy and reduce environmental impacts.
2. Methods
2.1. Research Scope
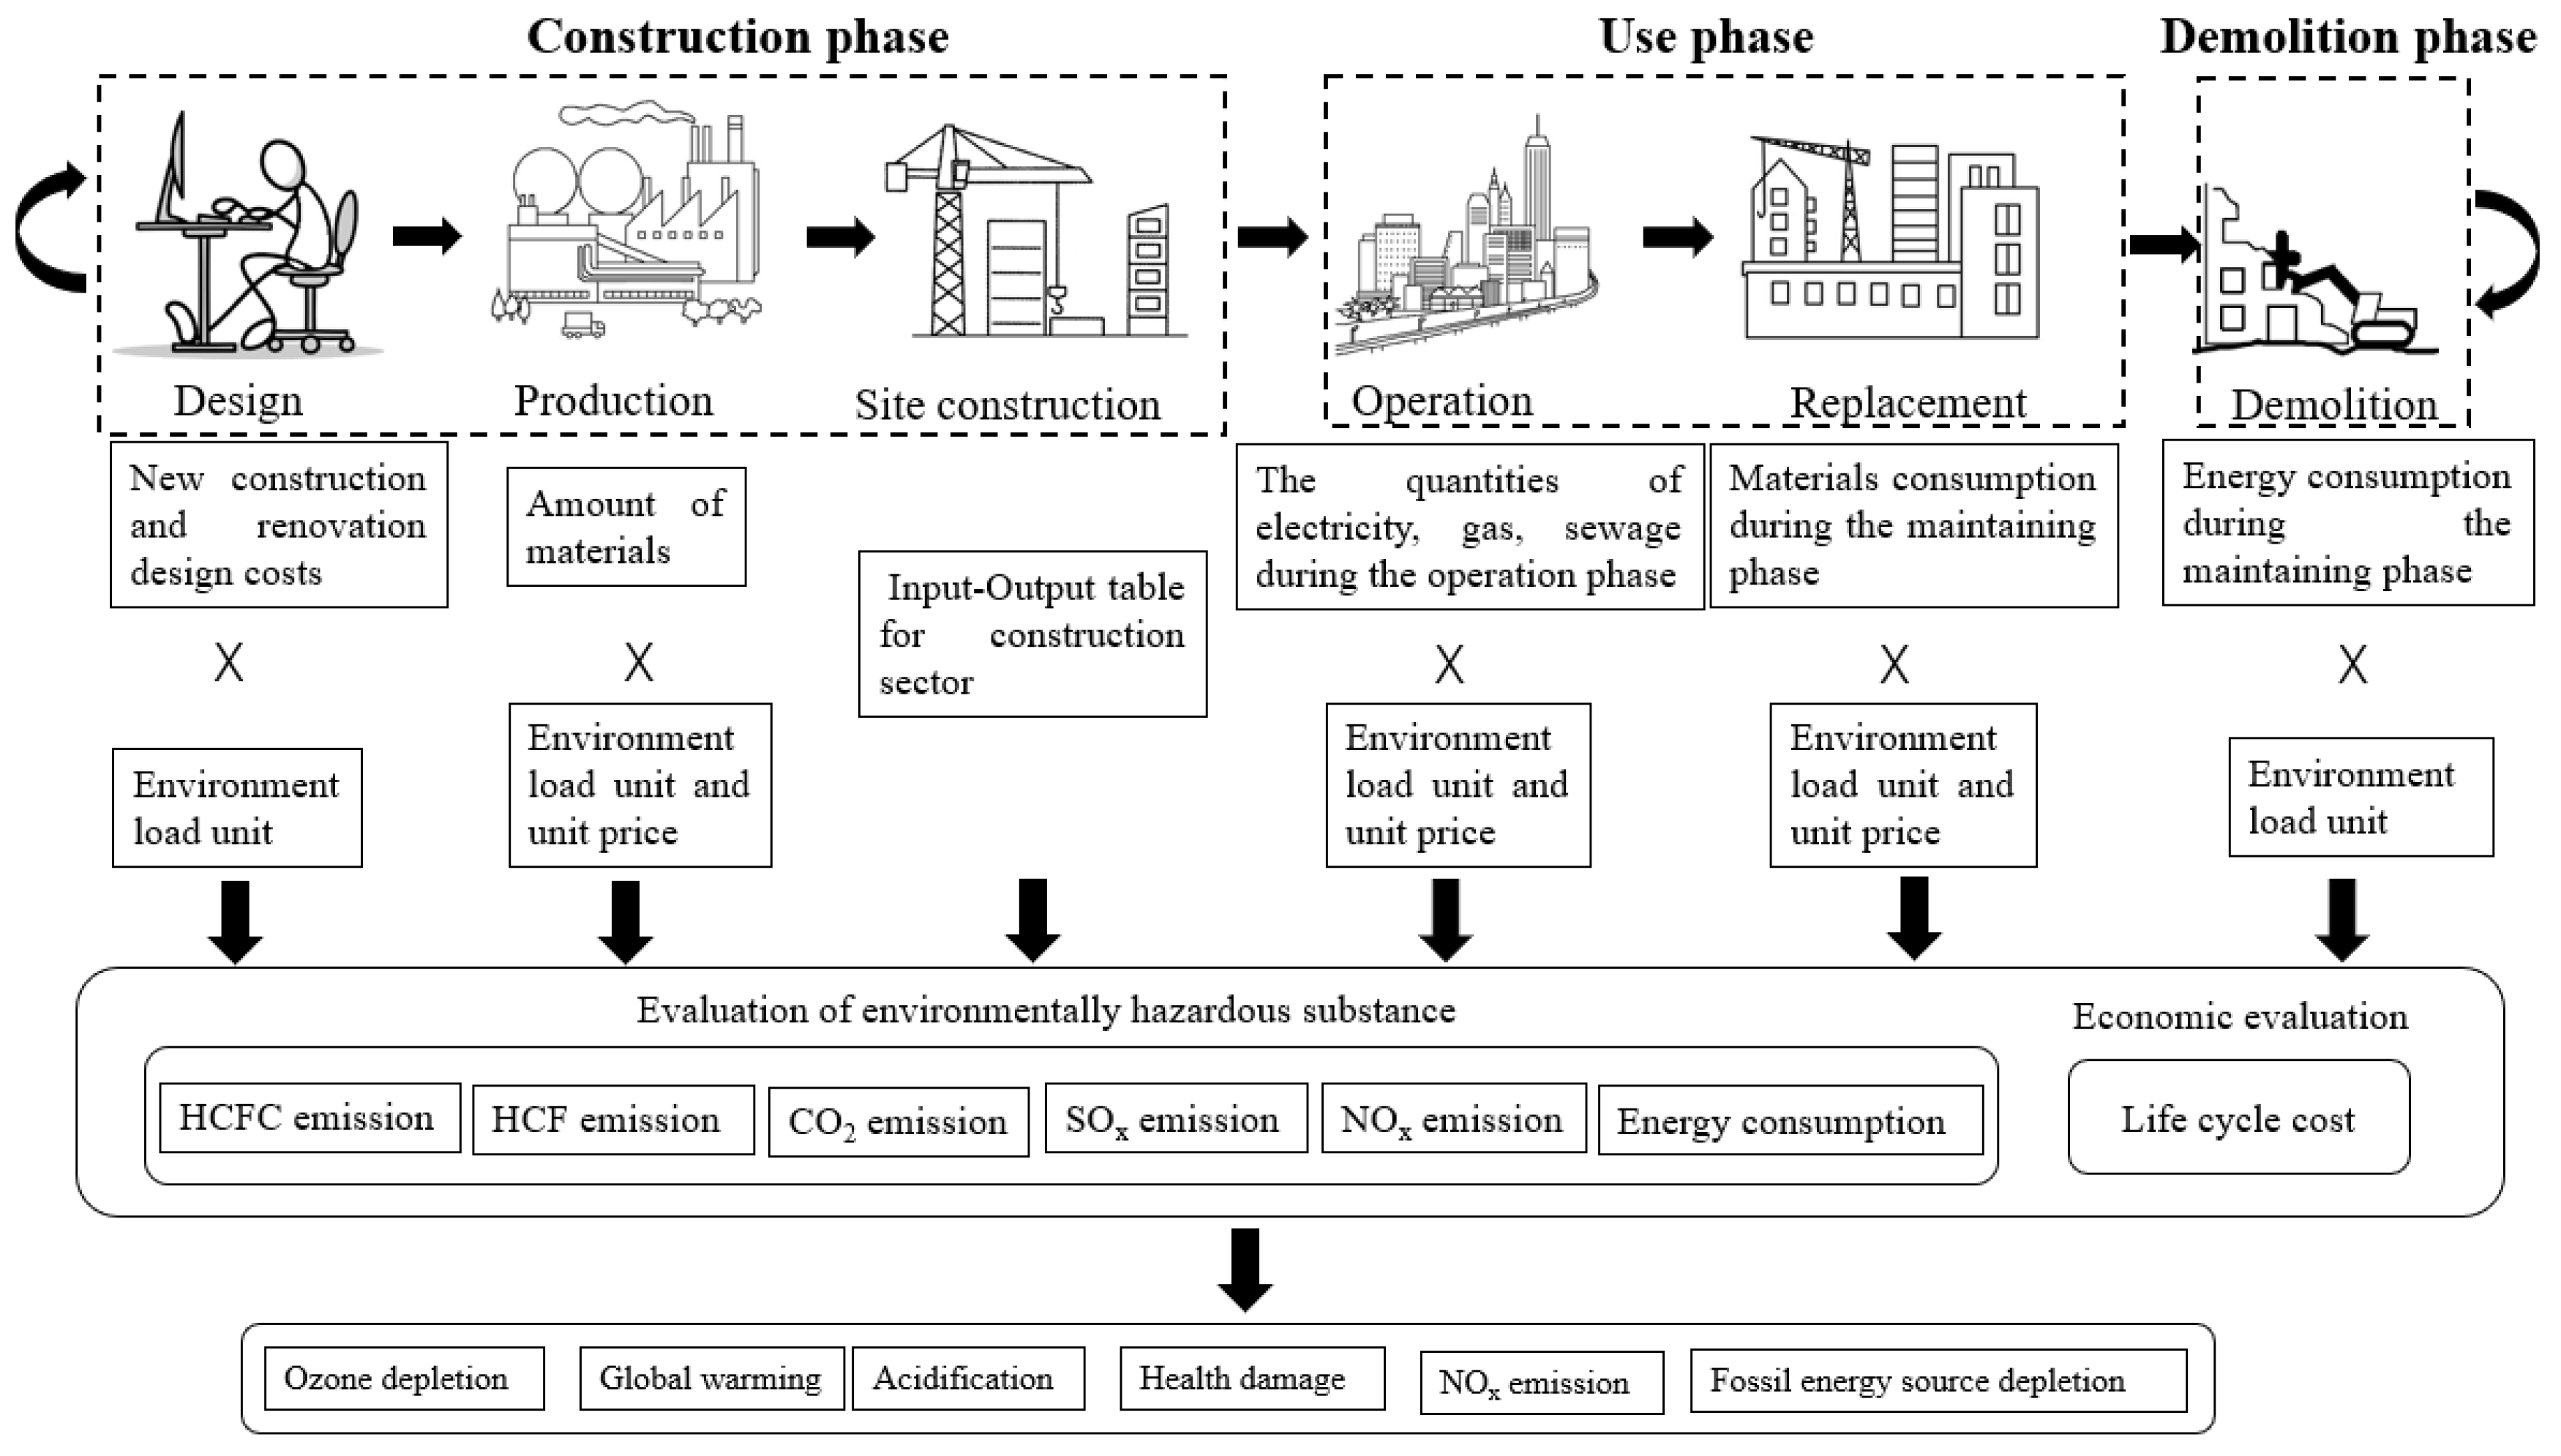
The environmental impact (EI) during the life cycle of a building can be divided into three phases: the construction phase (including the design, material production, and site construction stages), the use phase (including the operation and replacement stages), and the demolition phase [39]. It can be expressed by Equation (1):
where , , and stand for the EI from the construction phase, the use phase, and the demolition phase, respectively.
The hybrid model can be presented as
where is the I-O model, and represents the process-based model. The I-O model is used for the analysis of production processes. The process-based model is for other processes. The two data sources are different, one is macroeconomic data for the I-O analysis, and the other is physical data for the process analysis. The I-O analysis method converts the monetary value of all relevant sectors into the final emissions at production. The process-based model converts the material usage and the corresponding environmental load into emissions for the operation and demolition phases. Figure 1 shows the calculation system for the LCA.
2.2. Input–Output Model
The input–output table is an important tool to analyze the economic and technical relationship between production sectors, which can be traced to the embodied environmental impact of a specific sector of various materials and services. In terms of the activities of various industrial sectors of the national economy, different industries are interrelated through the supply and demand of products. The development of each industry needs other industrial sectors to provide production factors for it, and the output of each industrial sector may be the input of other industrial sectors [40]. Simultaneously, a complete consumption relationship among sectors can be quantified [41]. Table 1 describes the correlations among different sectors, which can be used to calculate the intermediate consumption among sectors. The original input-output table was expanded (Table 1) to directly represent the material inputs of the sector, where , , , and stand for the total output, final demand, intermediate use, and value added, respectively. and are the direct energy or carbon input of sector i because of the intermediate use and final use of sector j, respectively. is the total amount of direct energy or carbon input of sector i.
The method has become the mainstream method used to study the environmental impact from the macro perspective (country, region, sector, etc.) [42]. Based on the “input = output” equilibrium theory, the Leontief matrix is used to represent the relationship between the total input and total output [40], which can be described as shown in Equation is as follows (3):
where and are the total input of the sector and the final demand of the sector, respectively; E is the identity matrix; is the direct consumption coefficient matrix representing the value of unit i consumed by unit j; is the Leontief matrix.
Generally, rough division will reduce the measurement accuracy, but division that is too detailed increase the complexity of the calculation. The division in the I-O model can adopt the method of equal proportion division without changing the direct consumption coefficient of other sectors [30]. Expanding the original input-output table can directly show the material inputs of the sector. In Equation (4), and are the total output and innovation value of sector I, respectively. is the usage amount provided by sector i to sector j, and the final demand of supply of each sector is . , i represents all material emissions of sector i (including direct and indirect material emissions).
According to Table 1, the balanced equation of material consumption can be expressed as follows:
where is a diagonal matrix that includes the emission coefficients for all sectors. Combined with Equation (3), the rewritten equation is as follows [43]:
The relationship between the sectoral final material emissions and sectoral final demand is clearly expressed by Equation (5). Therefore, can be simplified by the coefficient η which shows the relationship between the final material emissions and the final demand. Taking sector j for example, the relation between the total material emissions of relevant sectors in sector j and the final demand can be expressed in vertical coefficients, i.e., [38]
2.3. Process-Based Model
The operation phase can be divided into two parts: application and modification. In the process-based model, the EI of the building can be expressed as follows:
where i is a kind of building material, is the amount of building materials (electricity, sewage, maintenance materials, etc.) used, and is the environmental load factor of the building materials per unit of production. It should be noted that the time background and economic background should be considered in order to select the appropriate environmental load factors. The factors of materials can be found in relevant data [46].
The environmental impact during the demolishing phase is mainly related to transportation and material disposal. According to the relevant literature [36], transportation can be calculated according to the following equation:
where (km) is the distance from the demolition site i to the recycling company, represents the quantity of materials, and represents the environmental load factor of the building materials of different modes of transport.
3. Data Collection
This study took a real-life prefabricated building case, which is located in Kitakyushu, Japan, and investigated its environmental performance. The construction life is 80 years—more information is detailed in Table 2. Three observation spots—including the site of the case prefabricate building, the data center that stores architectural drawings and related engineering documentation, and the prefabrication factory—were selected with the purpose of containing all related data in detail. Various measuring methods were employed for data collection. The process for each research point comprised a content evaluation of drawings and documentation of case building, for instance, the construction schedule and plan, the bill of quantities, the inventories of prefabricated components, and construction technology specifications, etc., were analyzed in detail. All of the drawings and documentation were verified and validated by all participants and experts to guarantee the data quality. Research data from the building were collected from the construction diary, records, and calculation reports (Table 3) [47]. The quantity and monetary value of major materials were recorded. In the operation and replacement phase, the energy consumption data were based on the actual monitoring data, which came from the operation records of related equipment. The software AIJ-LCA&LCW ver.4.04 (Architectural Institute of Japan-Life Cycle Assessment and Life Cycle Waste, 2006, Japan), developed by Architectural Institute of Japan, was used to perform data calculations. The emission factors and I-O databases for all applications were unique and consistent with the location of the building.
In this study, “prefabricated public building” (PPB) stands for the public building using prefabrication construction investigated in this case study, and “traditional public building” (TPB) refers to the assumed public building using cast-in-situ construction.
To maintain consistency, the relevant data from different stages in the life cycle of conventional buildings were assumed based on prefabricated building materials and energy consumption. The assumption of the amount of building materials used in the traditional construction method was based on existing research findings, as shown in Table 4 [6,7,15,18]. PPBs use steel templates, which can be reused to produce prefabricated components. However, the wooden templates used in TPBs are disposable. In the operation stage, PPBs adopts factory prefabricated built-in thermal insulation technology with better thermal performance. According to the conclusions of Takeuchi, the energy consumption of air conditioning in prefabricated buildings can be reduced by 25% [20]. Service life is equal to the life span of the building structure. TPBs adopts the on-site construction insulation layer operation method, which has a service life of 25 years. In the demolition and recovery stage, different definitions are made for the components of the two kinds of buildings. The demolition and recovery rate of the building components and internal products of PPBs is higher than that of TPBs [6,48]. The recovery rates of different components of the two kinds of buildings were respectively assumed.
4. Results and Discussion
Based on the scope and data defined above, the environmental impacts of the two buildings’ life cycles were compared and evaluated. The results were used to compare the differences between the PPB and TPB. The characteristics of the environmental impact of the two kinds of buildings at different stages of the life cycle were evaluated in detail. In addition, the PPB with different assembly rates and with prefabricated foundation were calculated separately. The effects of the assembly rate and prefabricated foundation on the carbon emissions of the building throughout the life cycle were analyzed.
4.1. Material Consumption
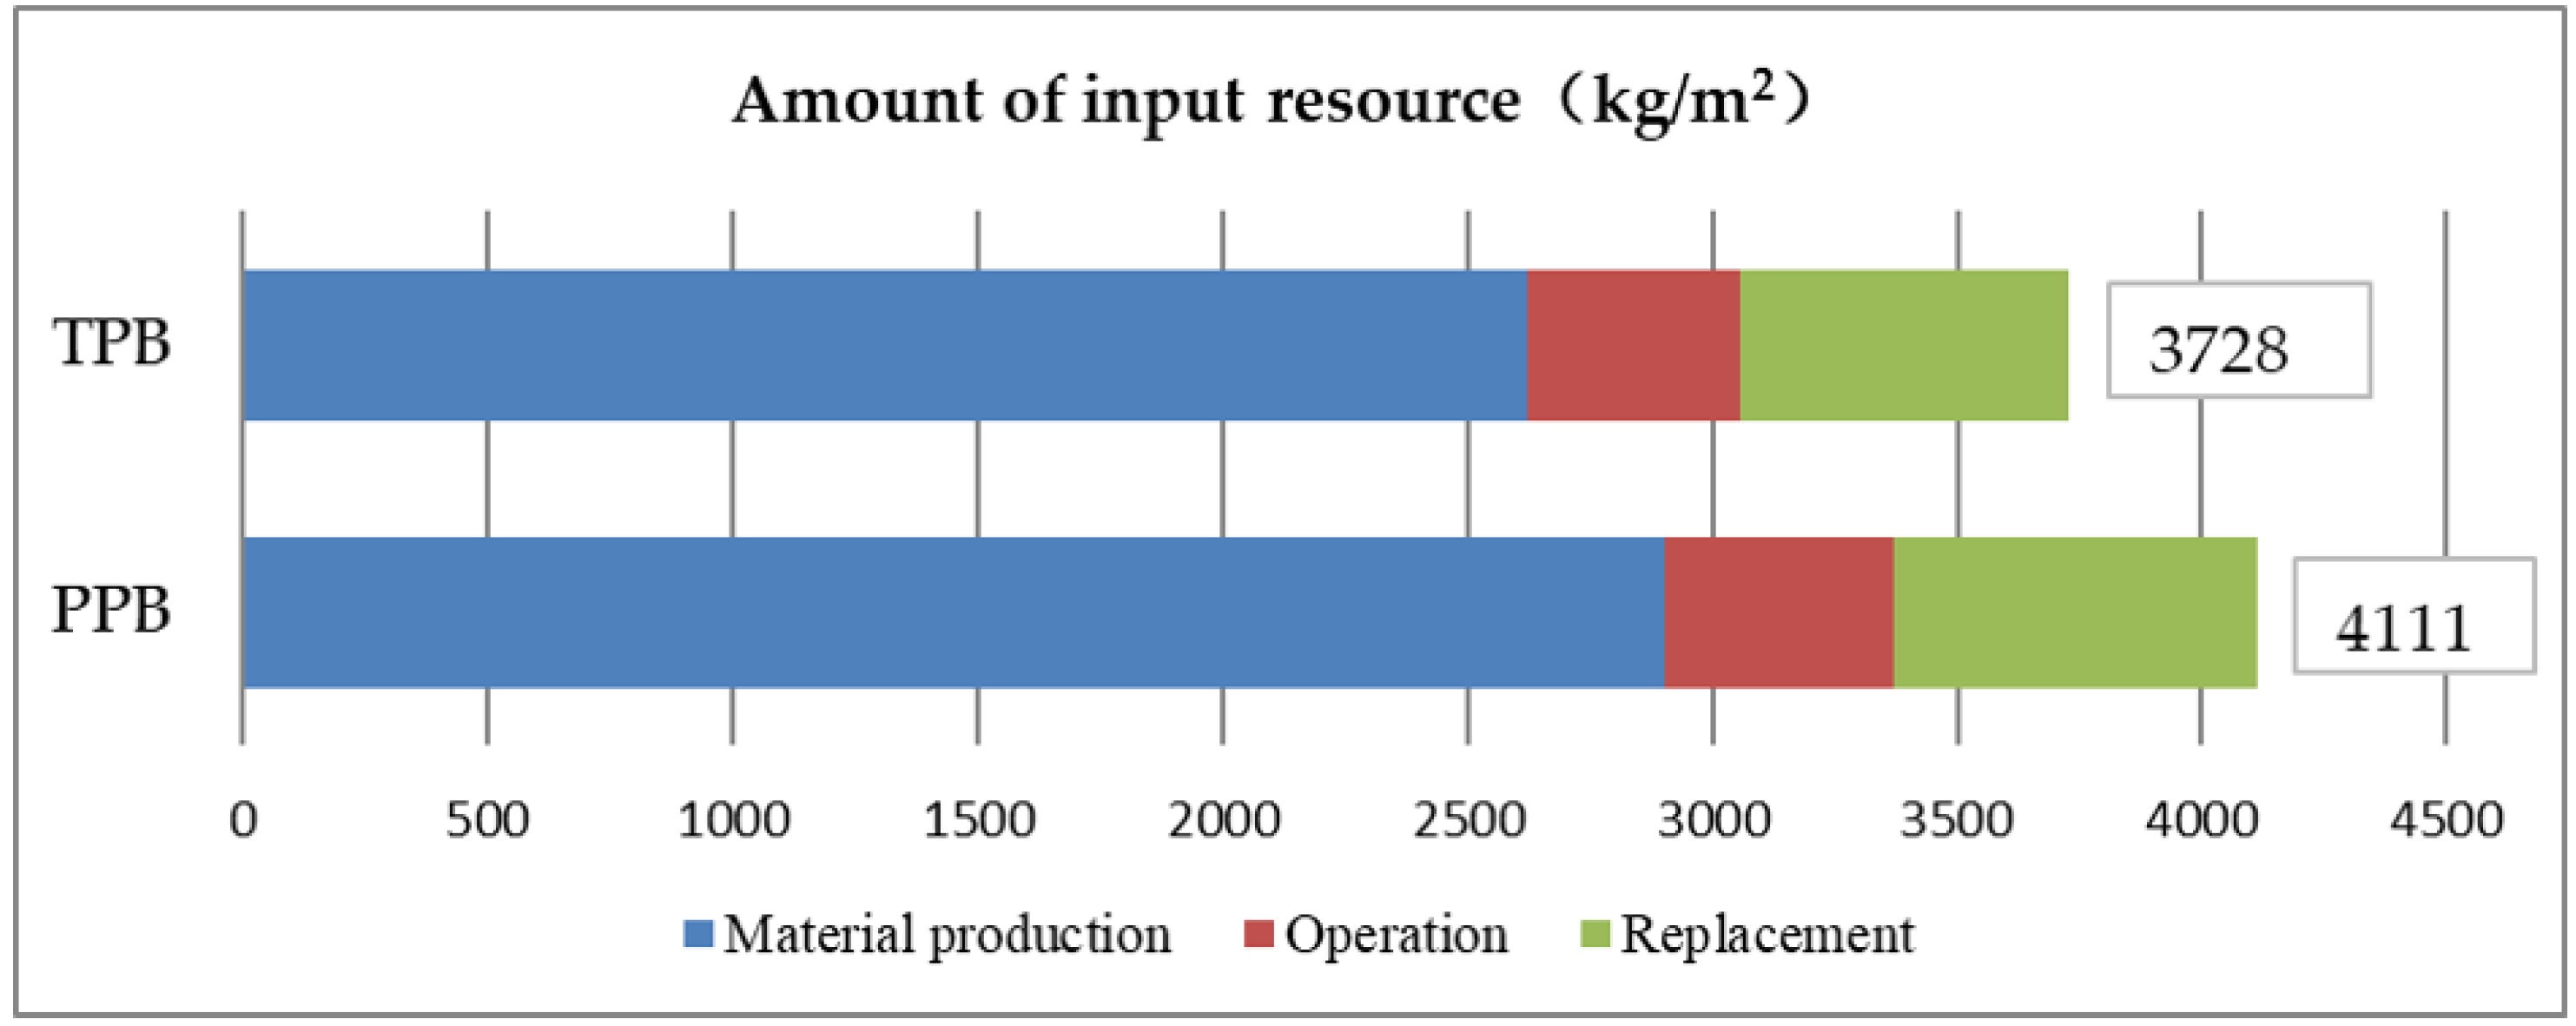
In order to facilitate the comparison between them, the total consumption of building materials was converted into the resource unit demand (kg/m2). Figure 2 illustrates the amount of input resources for the PPB and TPB. The resource consumption of PPB was found to be 3728 kg/m2, 9.32% lower than that of TPB. Resources were saved by 9.59% in the construction process. The main reason for this is that PPBs use prefabricated components, which can effectively reduce the consumption of concrete, steel, and wood. Fabricated members use steel templets in the process of being produced, avoiding the use of wood templets. Thermal insulation is located between the layers of the PPB concrete structure without the need for mortar as a bonding material, thereby reducing mortar consumption. Additionally, building components were produced in a factory with highly accurate control, which effectively reduced the waste of concrete and steel. The resource inputs for the maintenance and replacement of the PPB components maintaining and replacement were 7.01% and 9.72% less than those of on-situ production, respectively, due to the longer product life of prefabricated components and lower material change rate in the life cycle of the PPB.
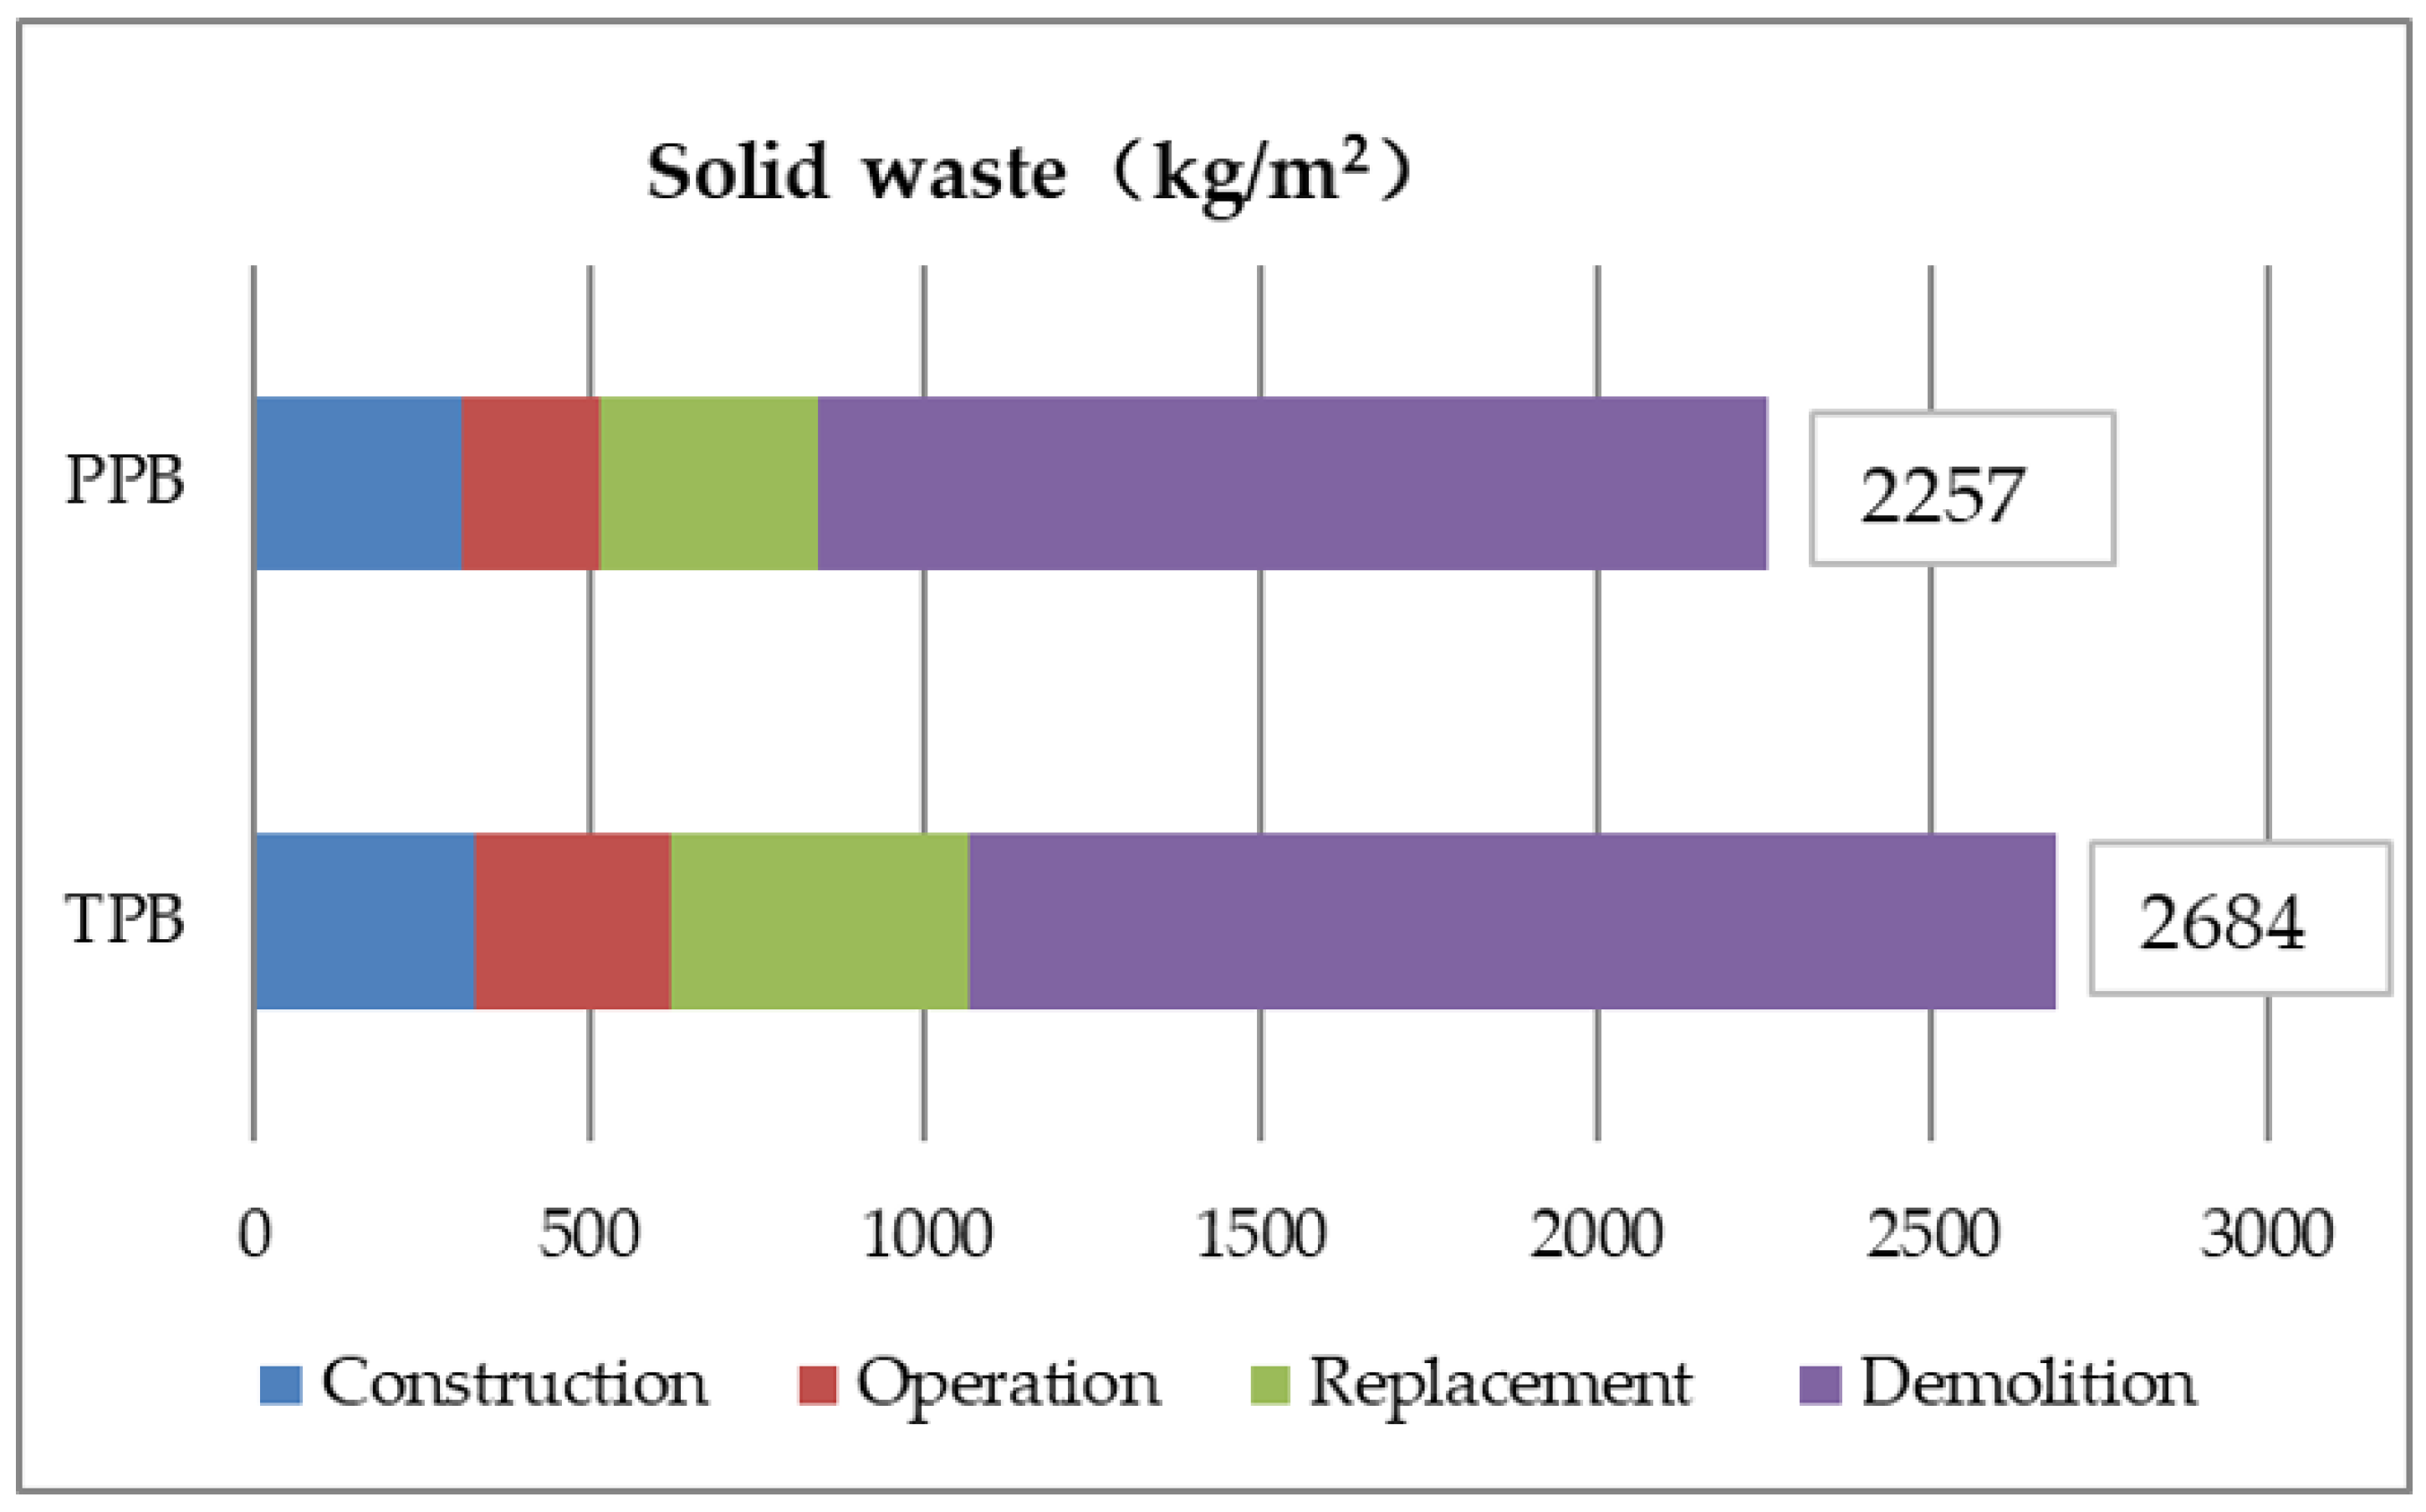
Construction waste is produced during construction, repair, and modification and demolition. Figure 3 illustrates the amount of waste generated by the two types of buildings. The most waste was generated in the process of material replacement and demolition. During these two processes, building components such as doors, windows, and partition walls cannot be reused because of their inevitable destruction. The total solid waste from the PPB was found to be 2257 kg/m2, 15.90% less than that of the TPB. The TPB generated 330 kg/m2 and 289 kg/m2 of solid waste during the processes of construction and replacement, which is 12.49% and 5.76% more than PPB, respectively.
The qualified rate of building components produced in a factory is higher than that of on-site production, which reduces the generation of waste at the source. The factory is a relatively closed and stable environment with little external interference, which can reduce the loss and interference of the natural environment and human factors on materials. At the same time, the large-scale application of industrial machinery is conducive to the stable construction, thus improving the quality of products. In addition, some prefabricated components with special technologies were produced in the factory, such as insulation panels sandwiched between two layers of concrete, effectively improving the service life and reducing the renewal cycle of building components. On the contrary, due to the limitations of on-site construction, the thermal insulation layer is attached to the outer surface of the wall. Due to the poor durability, this will increase the replacement frequency of components, leading to extra construction waste. Furthermore, the organizational structure of the factory is relatively simple. On the contrary, the construction site is composed of many construction departments; the organizational structure is more complex. This also leads to the reduction of the recycling efficiency and recovery rate. Moreover, in the field investigation of this research, the factory classified and recycled most of the building materials. However, some construction materials in the construction site were disordered, making it difficult to effectively recycle some construction materials.
4.2. LCA-Based EI Assessment Results and Discussion
The whole process from the design to the demolition of a building will influence the environment, thus the negative impact should be reduced out at every stage of the life cycle. Using the data collected, including the quantity of building materials, energy consumption, and recovery rates of different building materials, the building impact on the environment, carbon emissions and cost during their life cycle can be calculated.
4.2.1. Comparison of Energy Consumption between the PPB and TPB during Their Respective Life Cycles
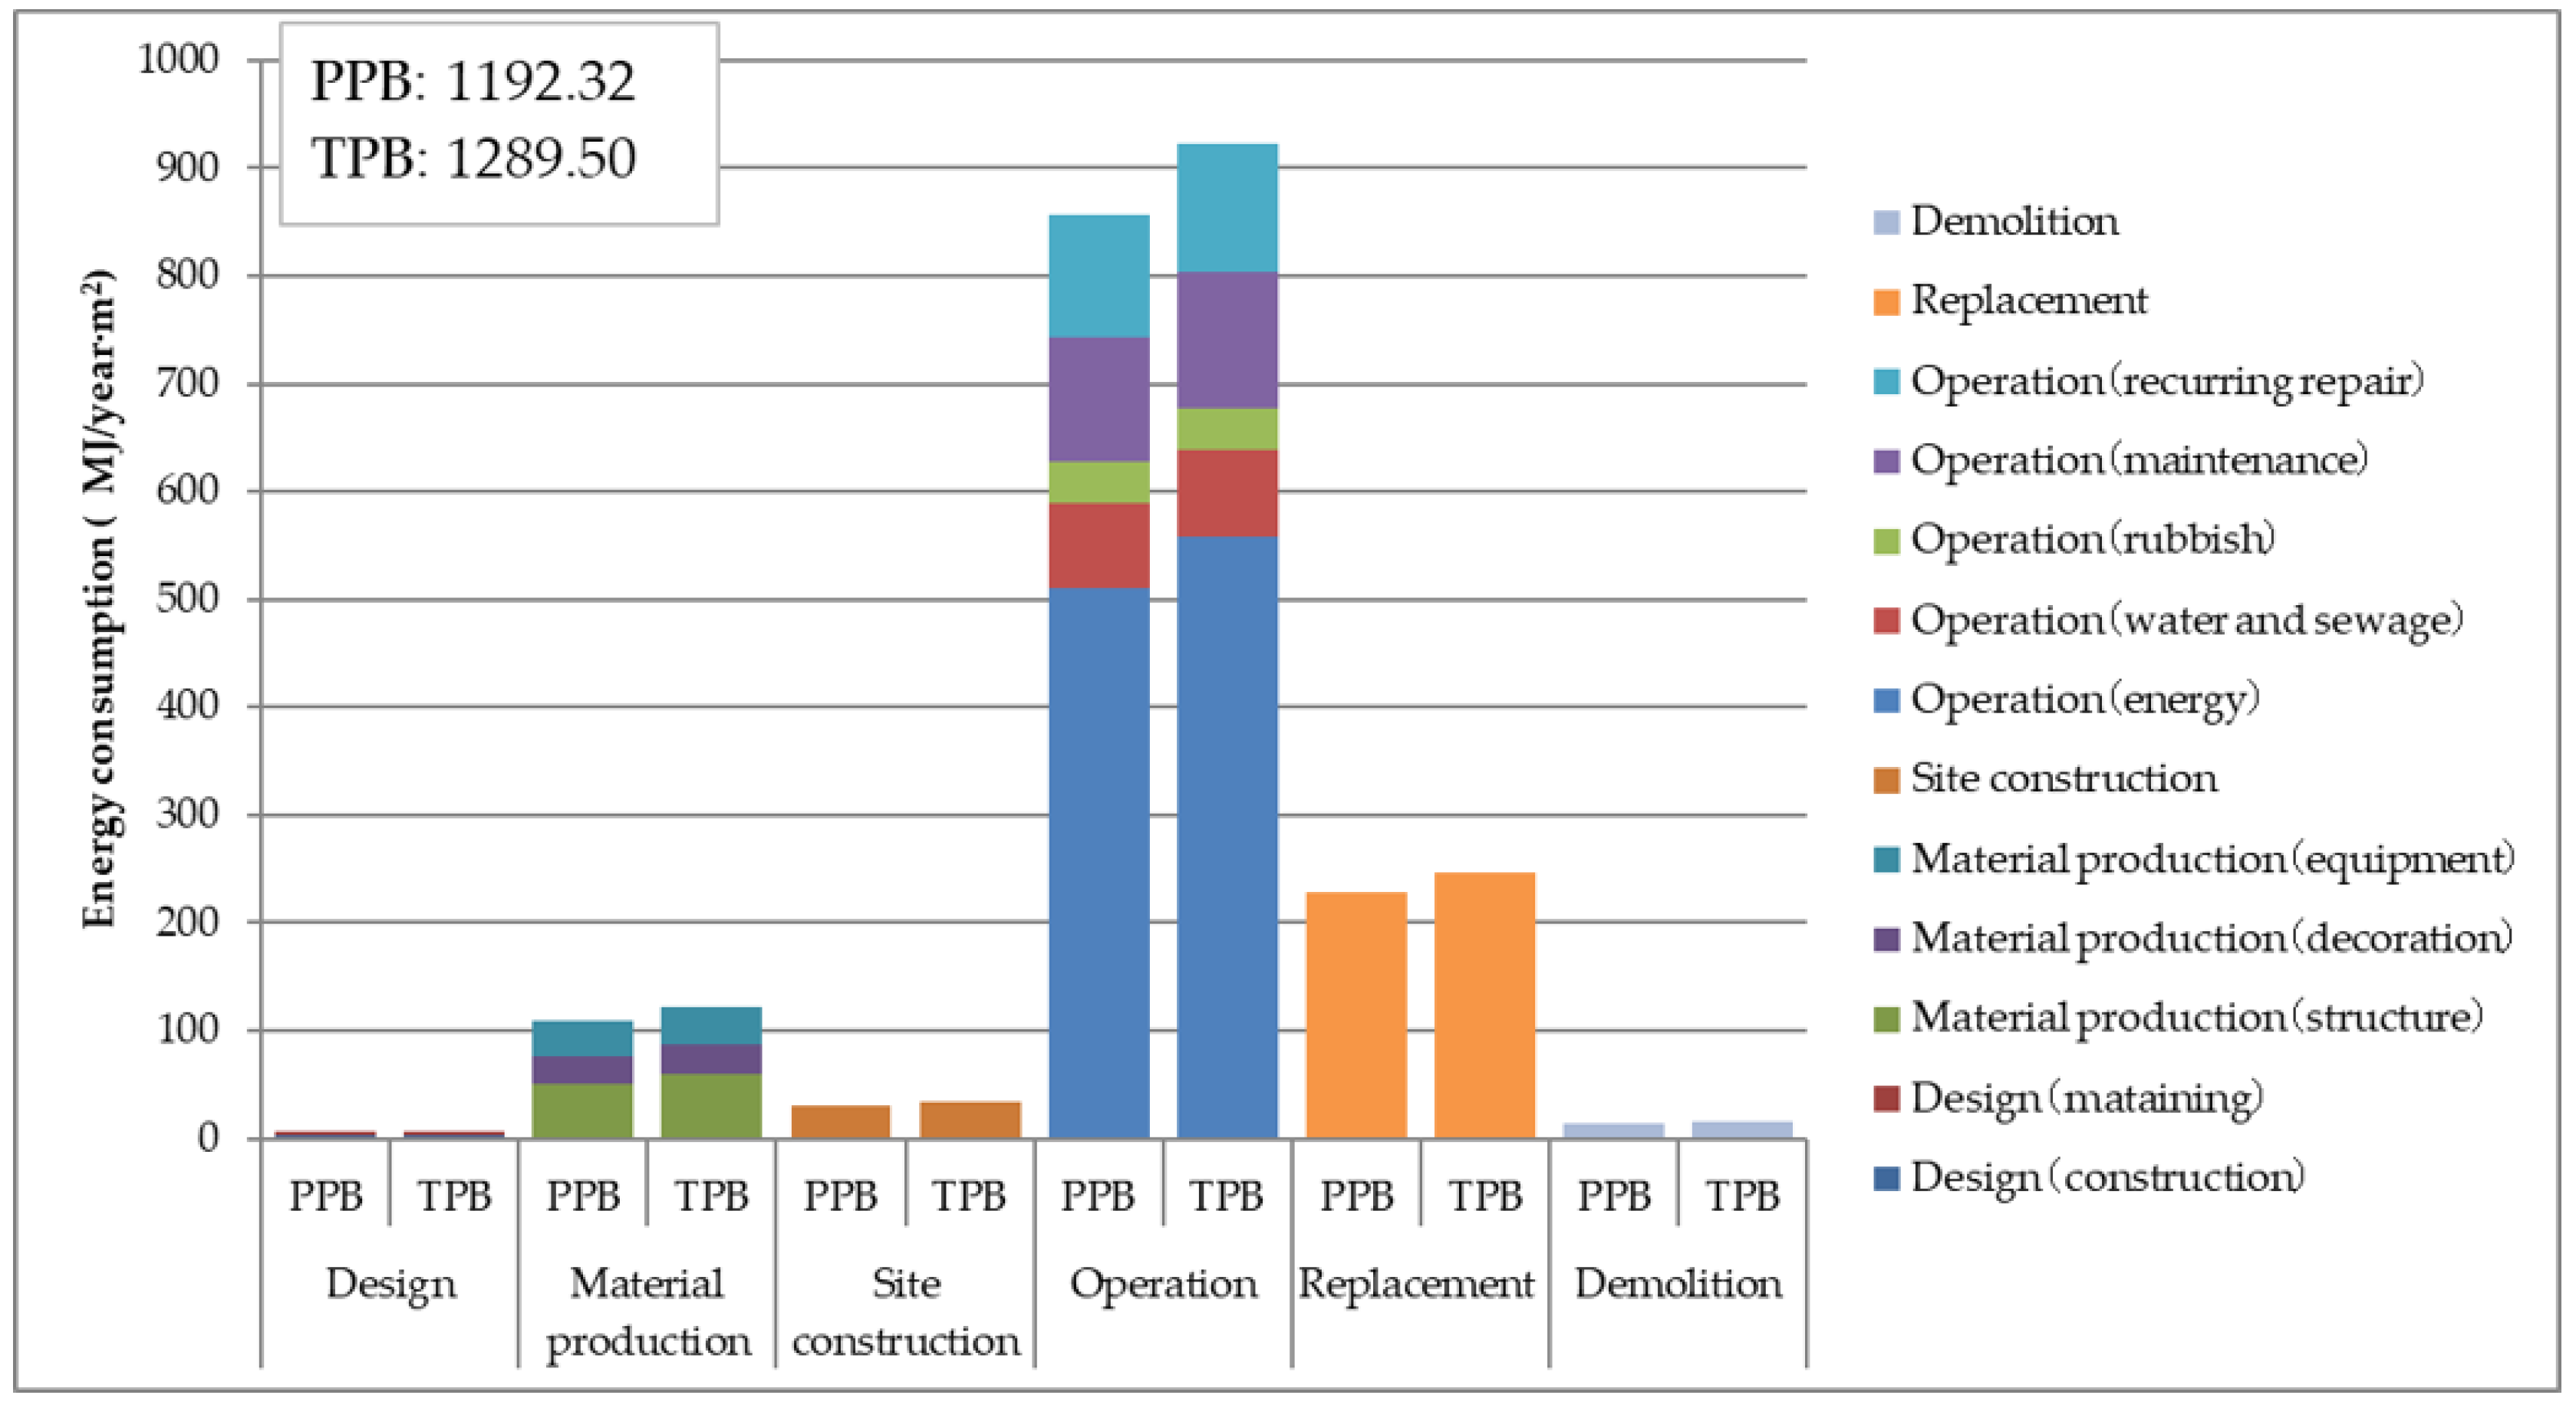
There is great energy saving potential in the operation phase where the most energy is consumed. Following that, energy consumption in the building material production phase is the second greatest during the life cycle. The site construction and demolition phases account for less energy than others due to their shorter durations. However, from a macro perspective, there are a huge number of construction projects every year. Correspondingly, the sum of energy consumption in these two phases will rise dramatically. The energy saving potential during these two phases should be considered as well.
Figure 4 summarizes the energy consumption of the two kinds of building during their life cycles. The total energy consumption of the PPB was found to be 7.54% less than that of the TPB. The PPB was shown to use less energy than the TPB at every stage. The energy saving effect in the operation stage was the most significant, reducing by 66.62 MJ/year∙m2. The PPB can reduce energy consumption by 10.93% and 7.1% in the construction phase and replacement stage, respectively. The demolition phase was shown to consume the least energy with 1.823 MJ/year∙m2, but the energy saving ratio was as high as 11.29%. The energy consumption reduction in the operation stage mainly comes from two aspects. First, energy consumption due to air-conditioning usage is lower in the PPB than in the TPB because of higher thermal insulation of the PPB. Moreover, prefabricated components have higher durability, which reduces the replacement of building components in the operation stage.
Energy saving in the design stage is not obvious in the perspective of the building life cycle. However, during this stage, the PPB can still save 10.28% more energy than the TPB. The modular design applied, which uses fixed building modules and components and recycles components after building demolition, dramatically saves design time and money. It guides and standardizes the demolition and recycling process in the following stage. At the same time, modular design and construction improve the efficiency of supervision work, so that energy consumption is reduced in the design stage.
The energy savings of the PPB in the site construction process are mainly realized through two aspects: one is the reduction of energy consumption brought by material savings; the other is energy saving due to the improvement in equipment efficiency. The energy consumption in the site construction process mainly comes from the application of field machinery. The PPB reduces the mechanical consumption in the field construction and improves the efficiency. During the site construction process of the PPB, lifting equipment is used to lift complete building components, such as prefabricated beams, walls, floors, stairs, and so on. On the contrary, the equipment is often used to lift single building materials or building accessories, such as steel bars or formwork, in the site construction of the TPB. Therefore, the efficiency of equipment in the site construction of the PPB is improved obviously. Although the industrial production of prefabricated components increases the consumption of fuel and electricity compared with TPB, their application can avoid the installation of some building materials on the construction site, including the insulation layer, concrete, steel bars, etc. It can eliminate the requirement for concrete pump trucks and lifting machinery, thereby reducing the consumption of fuel and electricity, achieving energy saving.
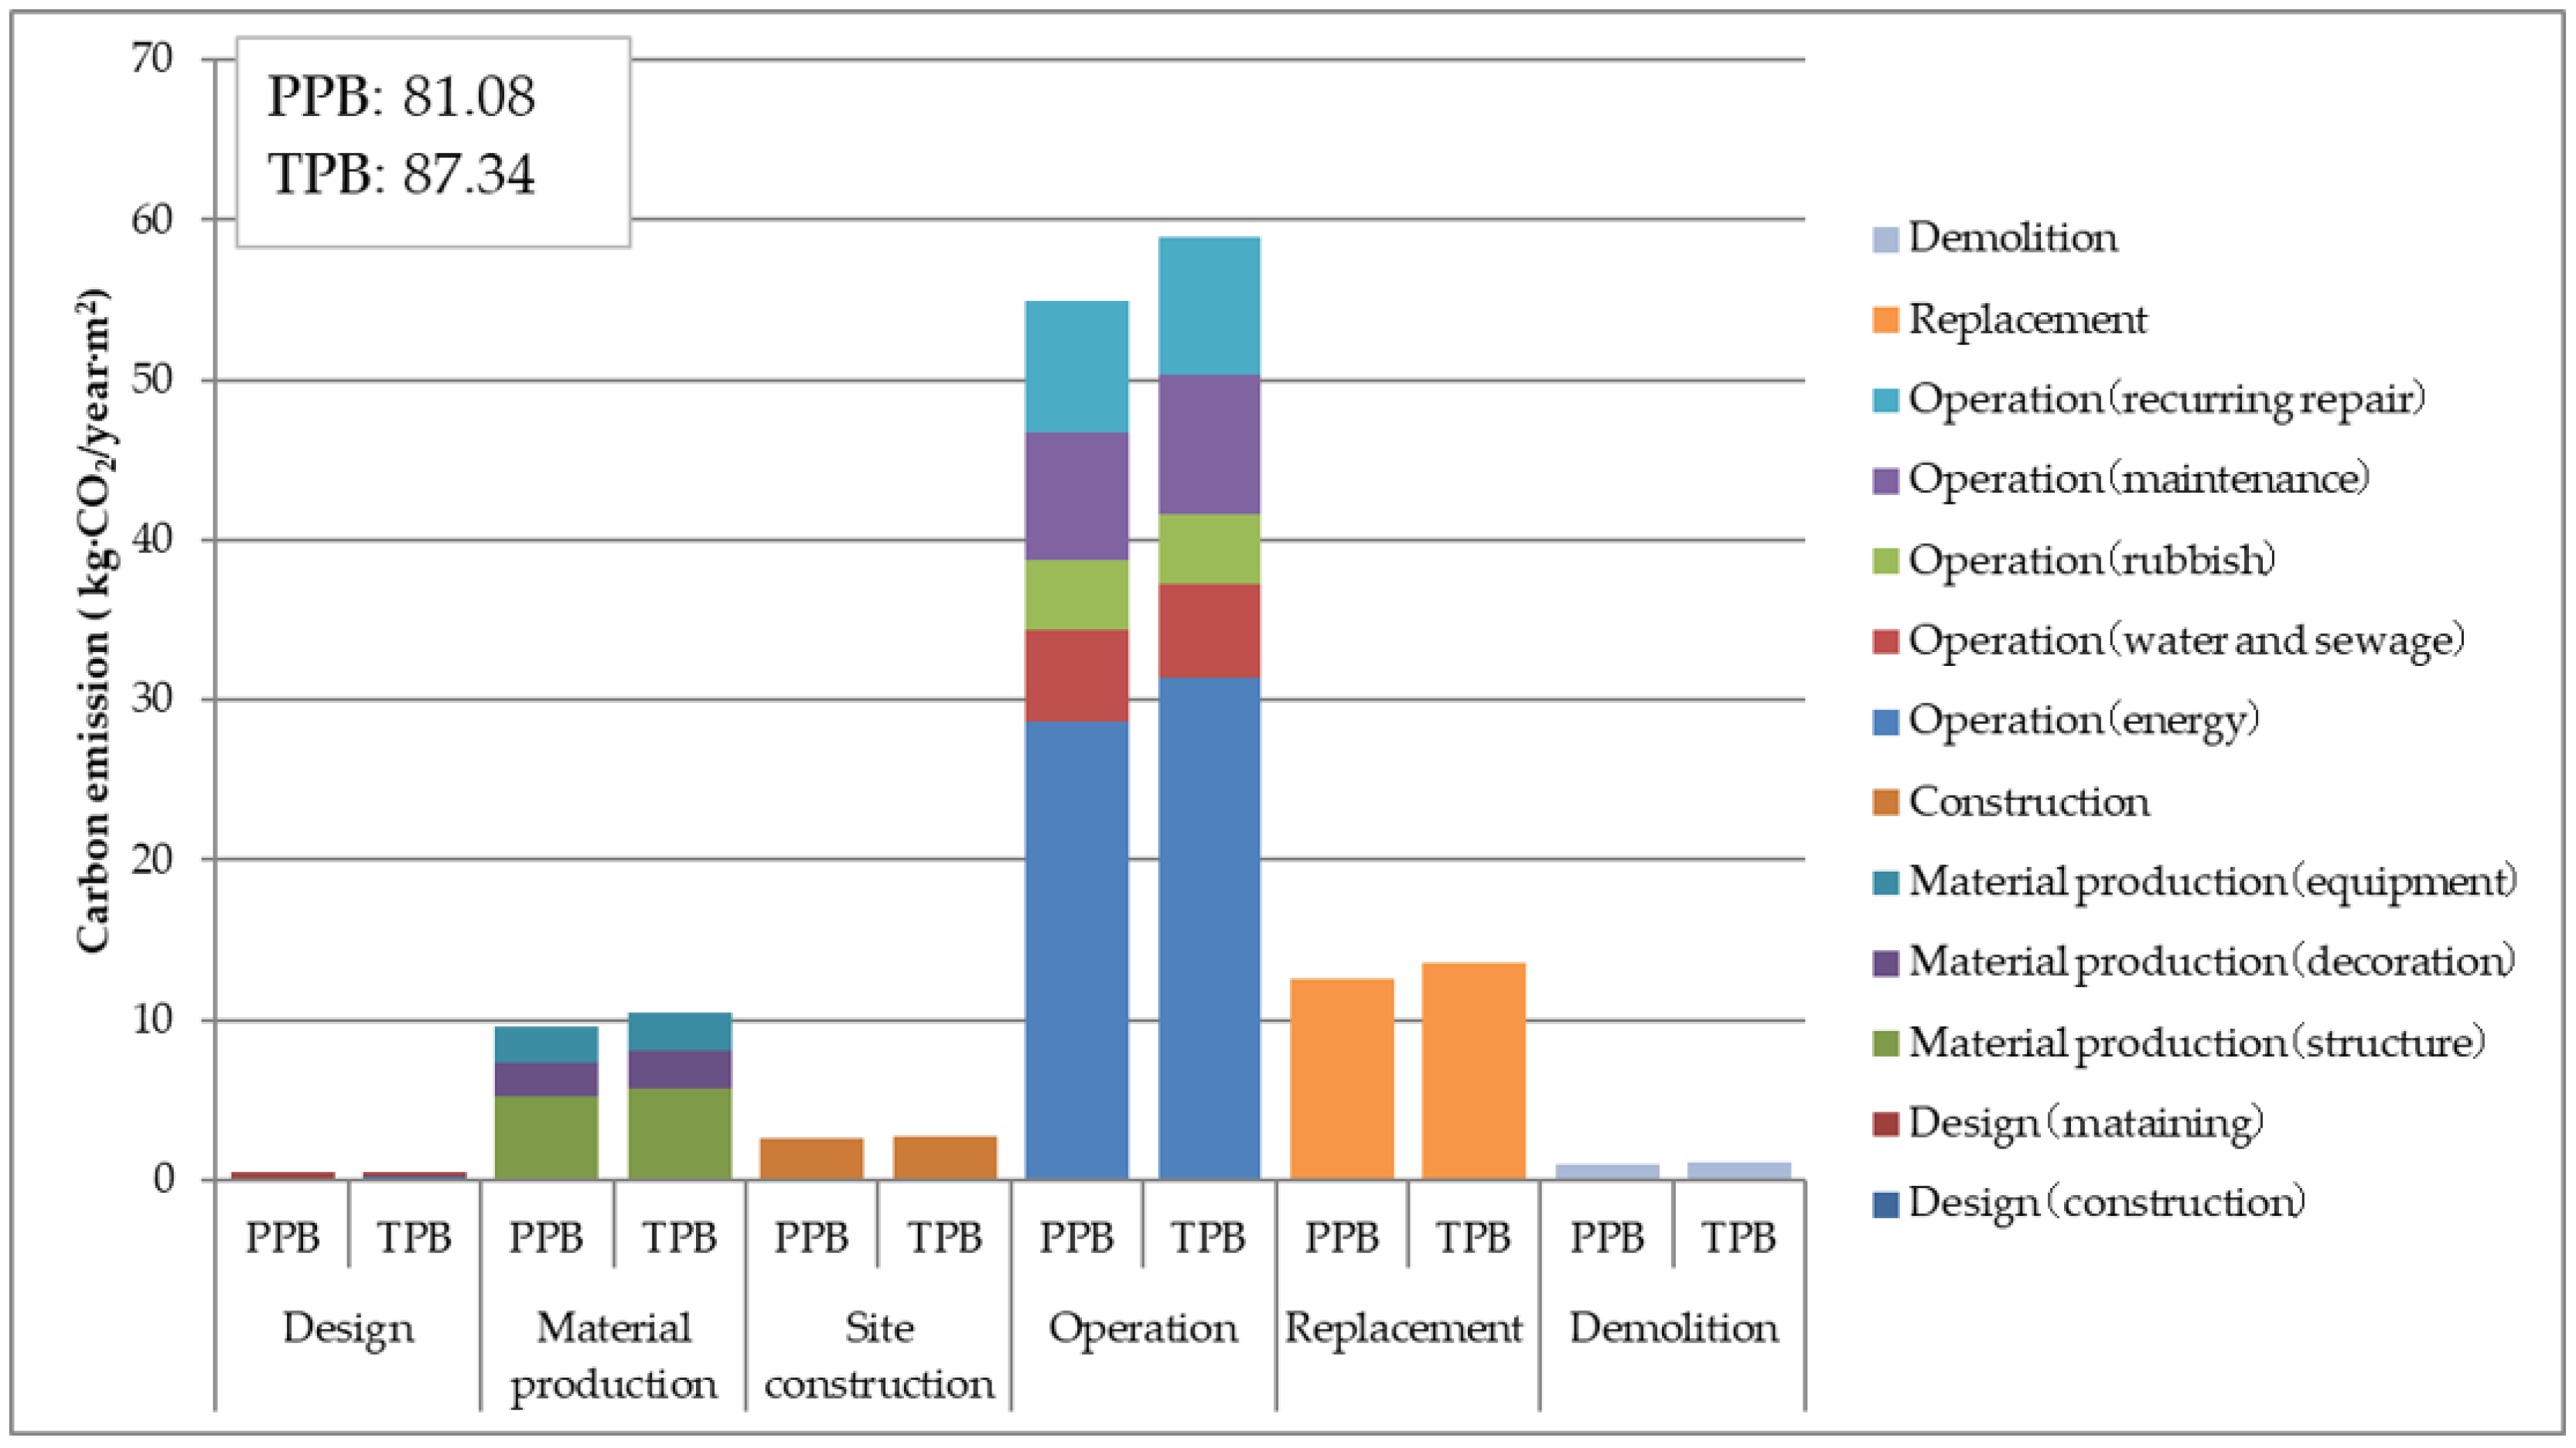
4.2.2. Comparison of Carbon Emissions between the PPB and TPB during Their Respective Life Cycles
At every stage of the life cycle, the carbon emissions of the PPB were found to be less than those produced by the TPB (Figure 5). More precisely, the total carbon emissions of the PPB were 81.08 kg CO2/year∙m2, 6.26 kg CO2/year∙m2 (7.17%) less than the TPB. During the design, material production, and site construction phase, the emissions of the PPB were 12.623 kg∙CO2/year∙m2, 8.29% lower than the TPB. The carbon emissions of the PPB during the operation phase were reduced by the greatest amount: 4.05 kg CO2/year∙m2. In contrast, in the replacement and demolition phase, the emissions only reduced by 1.069 kg CO2/year∙m2 in the TPB. In the process of building material production and building site construction in the PPB, carbon emissions decreased with less usage of wood formwork and fuel conservation by construction machinery.
The thermal insulation panels used in the PPB reduce the energy consumption from air conditioning. Consequently, the carbon emissions were found to be reduced during the use phase (including the operation and replacement stages). Therefore, the thermal insulation performance optimization of the PPB is an efficient way to achieve energy saving carbon emission reduction during the life cycle. Increasing the thickness of the insulation layer is a general method to improve the thermal insulation performance. However, this will also lead to an increase in carbon emissions in the production stage of building materials. Therefore, when the sum of the two influencing factors reaches the minimum value, the optimal insulation thickness can be obtained to reduce carbon emissions. Different thermal climate zones have varying optimal insulation thicknesses. It is suggested that, in prefabricated production, different thicknesses of thermal insulation should be specified based on the thermal climate zone to reduce the carbon emissions throughout the life cycle of the building. Factory-made insulation walls have a long service life and low maintenance frequency. Correspondingly, from a building life cycle perspective, carbon emissions from the maintenance of prefabricated buildings are reduced.
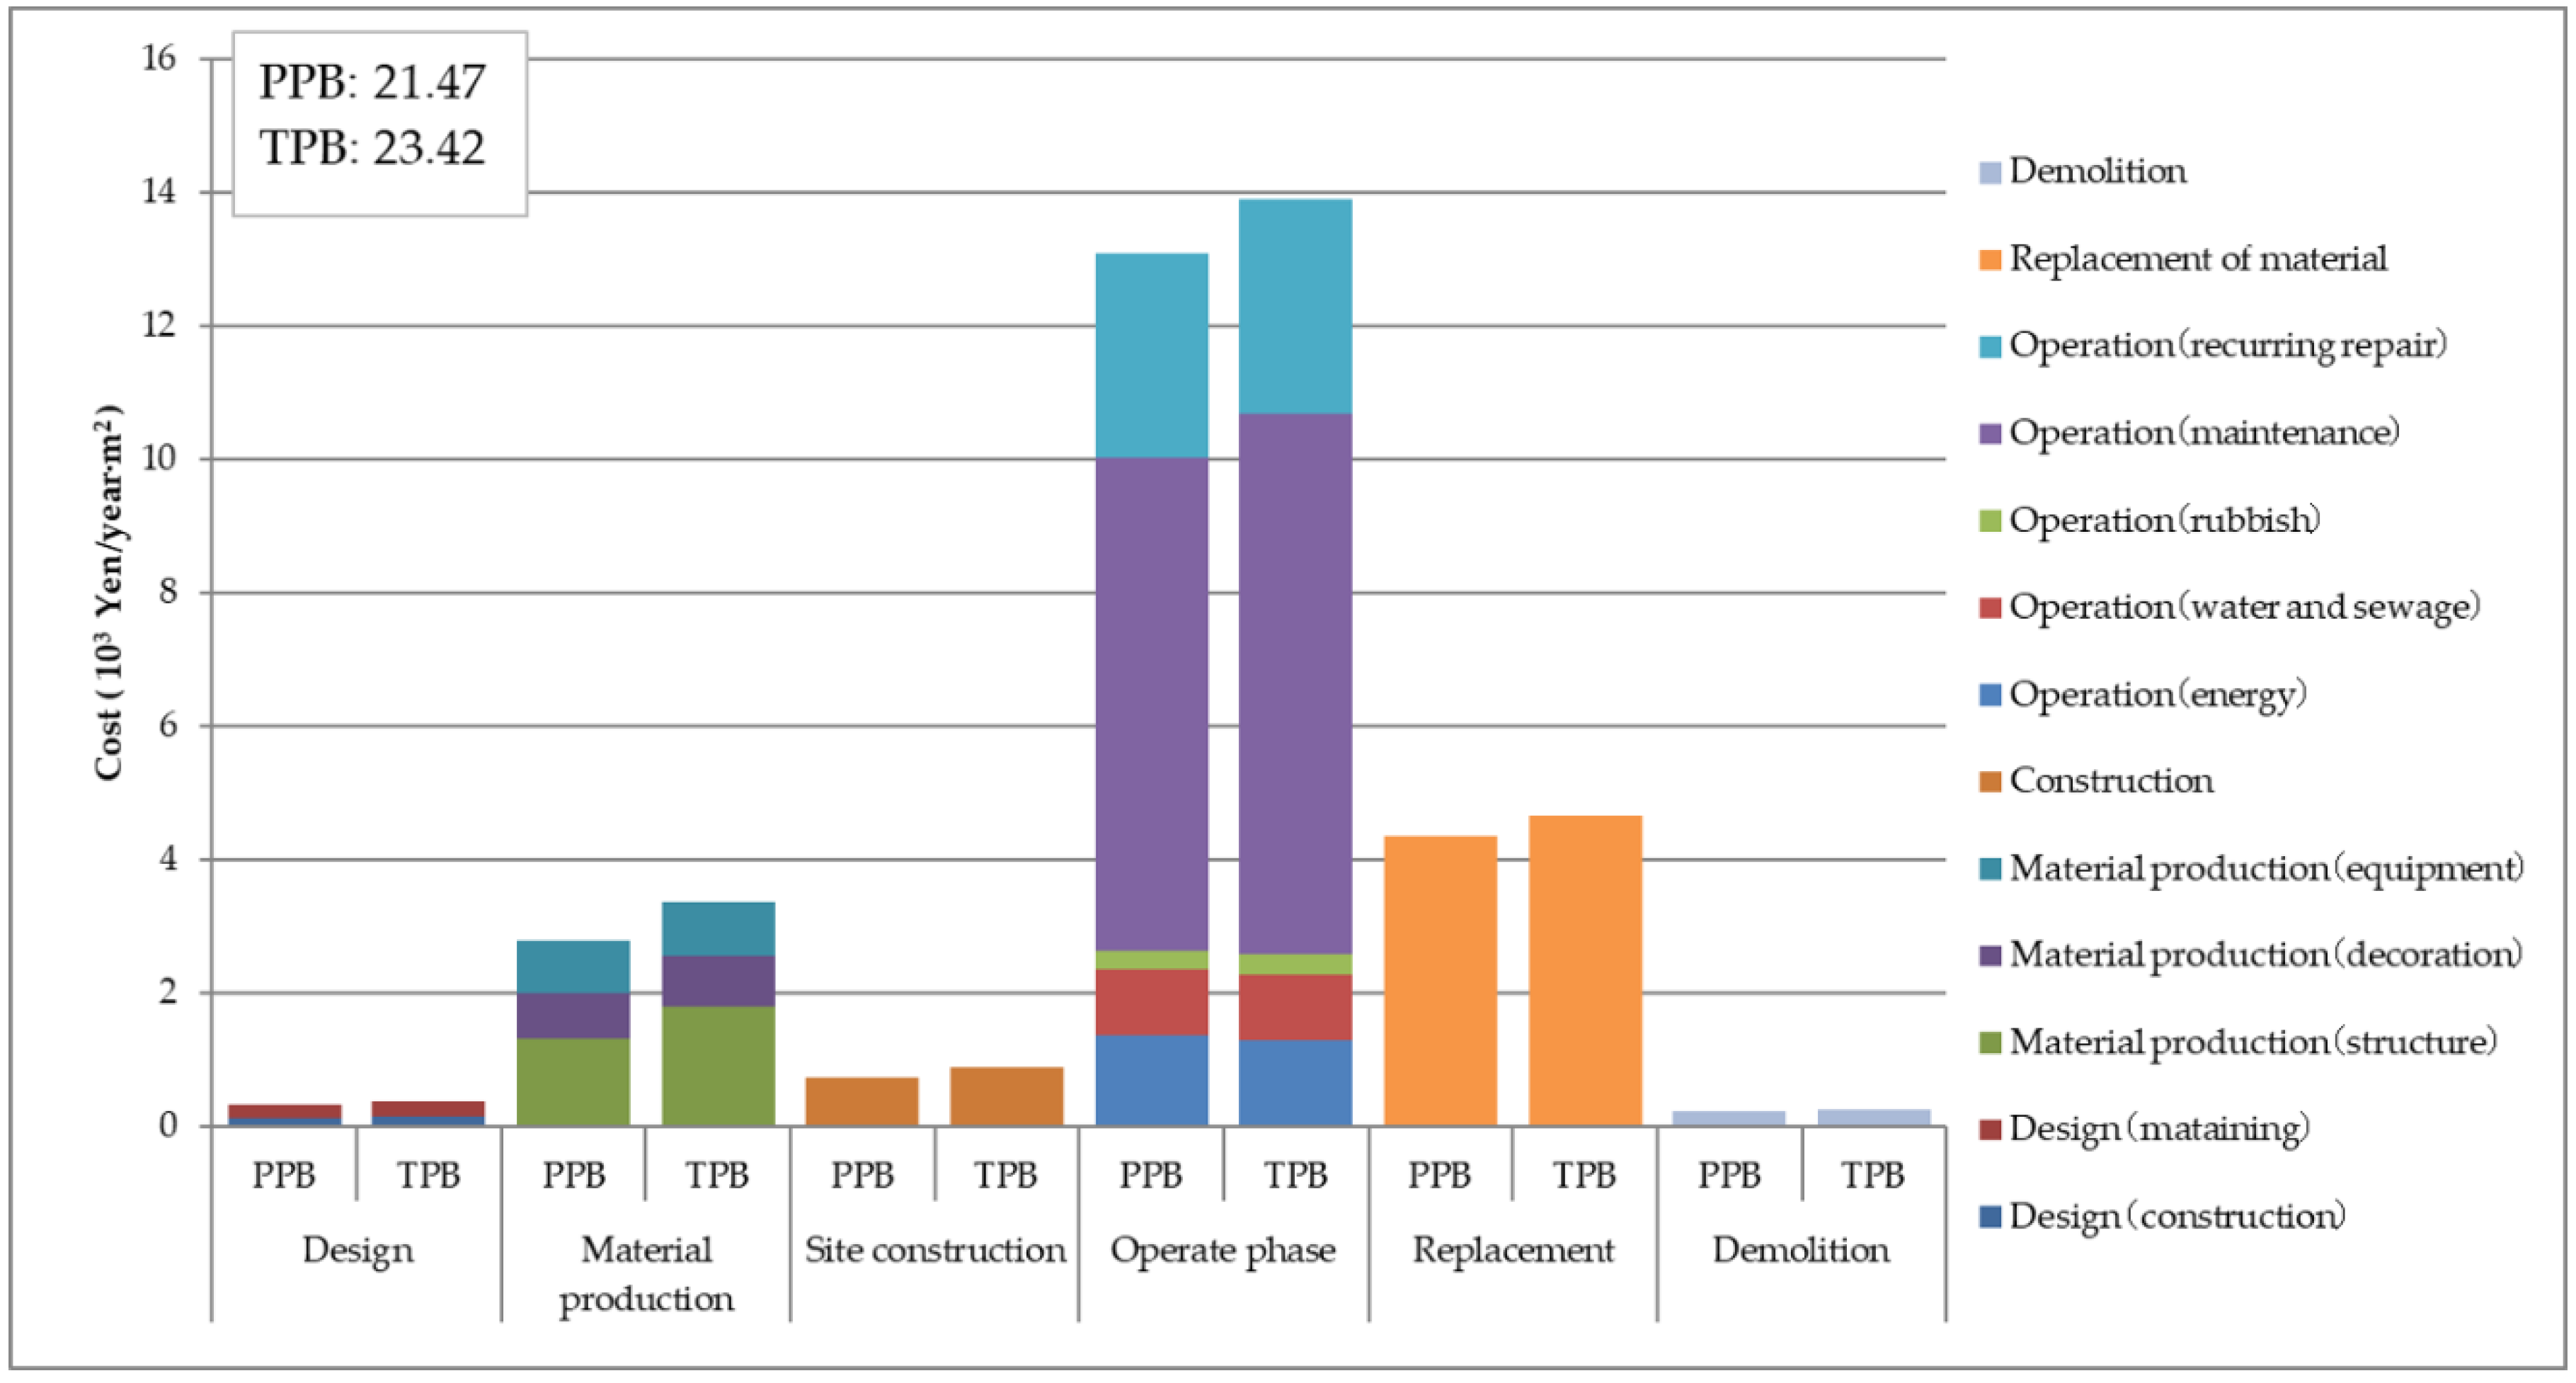
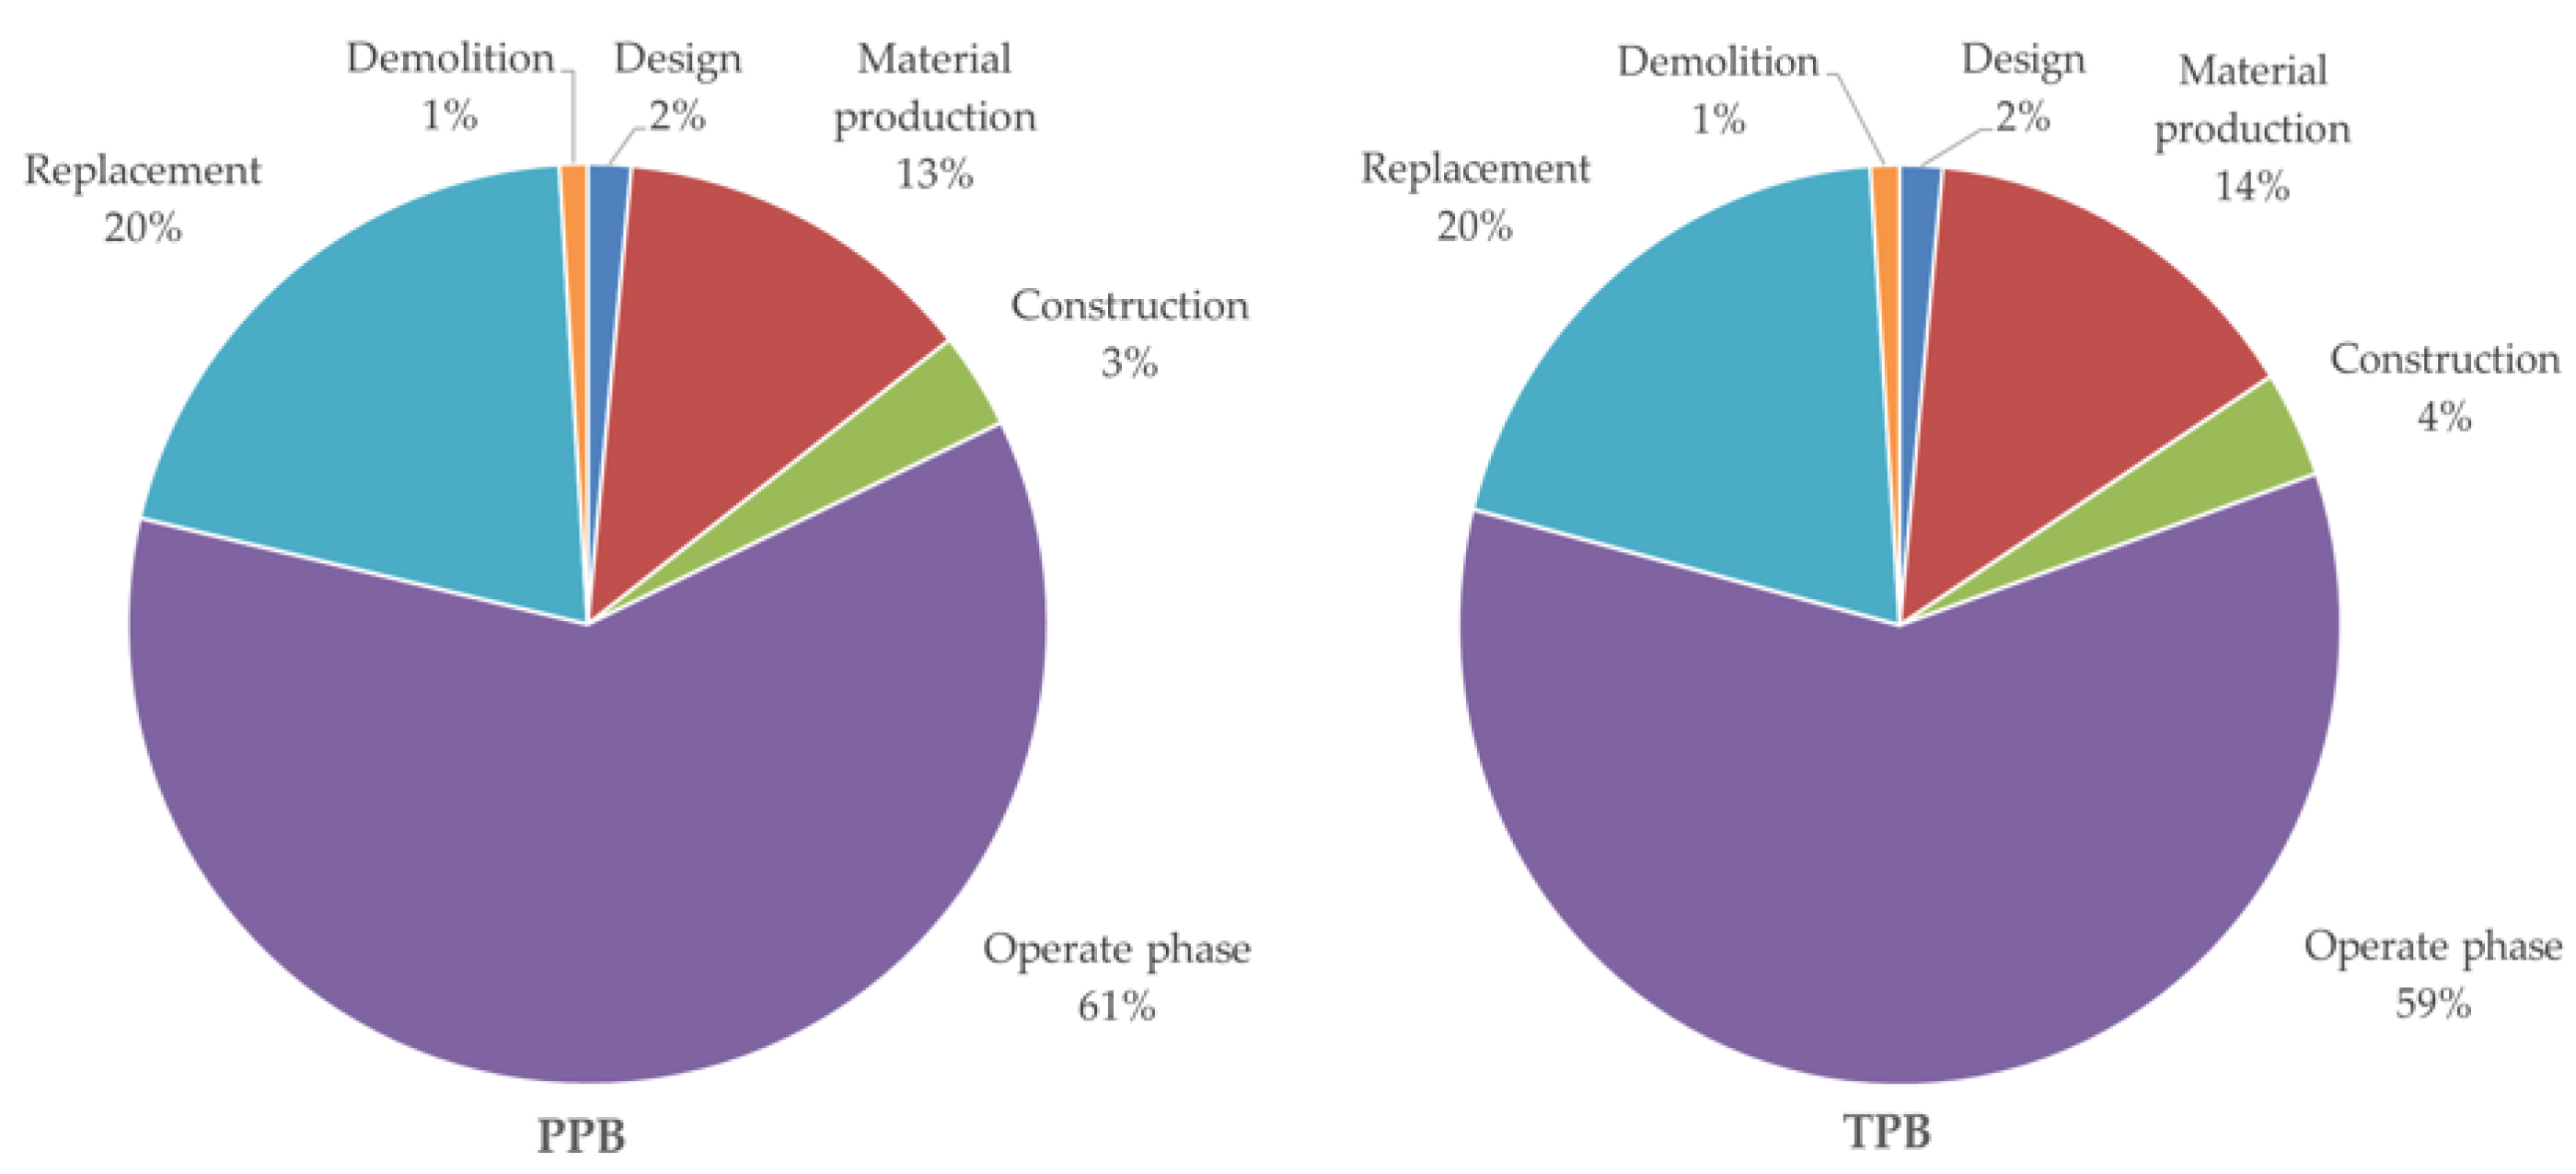
4.2.3. Comparison of Cost between the PPB and TPB during Their Respective Life Cycles
It was necessary to conduct an economic analysis from the perspective of the whole life cycle. Energy saving in each stage of building is of great significance to the reduction of the environmental load. The promotion, application, and economy of energy saving technology should also be considered. Pure energy saving without considering the cost will limit the market application potential of the technology. It can be seen from the calculation results (Figure 6 and Figure 7) that the cost of the two types of building in the operation stage accounts for approximately 60% of the total throughout the life cycle, while the construction phase accounts for nearly 20% of the total. However, the material manufacture and construction should be considered comprehensively, as they are closely related to the energy consumption of the building operation stage. The PPB was found to cost less than the TPB at all stages of their life cycle, reducing the price per square meter by 10.62%. The construction phase cost was found to be reduced by 17.08% compared with that of the TPB. The use stage cost was shown to be reduced by 5.97%, and the demolition stage was found to be reduced by 16%.
The reasons for this are detailed in the following evaluation. First, Japan has a complete industrial chain of prefabricated components for material production and construction. This effectively reduces the production cost of fabricated components. At the same time, the prefabricated construction method shortens the construction period and saves labor costs. In addition, the rejection rate of cast-in-situ components in field construction is higher than that of prefabricated components, which increases the input of raw materials. Furthermore, construction machinery is used more frequently than prefabricated construction, which also increases the construction cost of traditional buildings.
Generally, the quality of prefabricated components is higher than that of cast-in-situ components. Some special construction methods improve the service life of components as well, which can reduce the renewal frequency of building components in the operation and replacement stage. Moreover, the prefabricated insulation partition effectively improves the insulation performance of the building, which reduces the energy consumption in the operation process. Essentially, this indicates that the money is saved.
Finally, in the demolition stage of the building, industrial components adopt a modular design, which can be reused easily. These products are used extensively during the construction process, which means that plenty of products can be reused. In other words, it can effectively improve the bulk recycling utilization of building components. Some long-life parts—such as metal doors and windows, steel stairs, and light shields—can be reused after a simple repair. As a consequence, the recovery rate of components of the PPB is higher than those from the TPB, reducing the cost of the demolition stage. Moreover, the production of construction waste is reduced in the PPB, which means the waste treatment cost can be reduced as well.
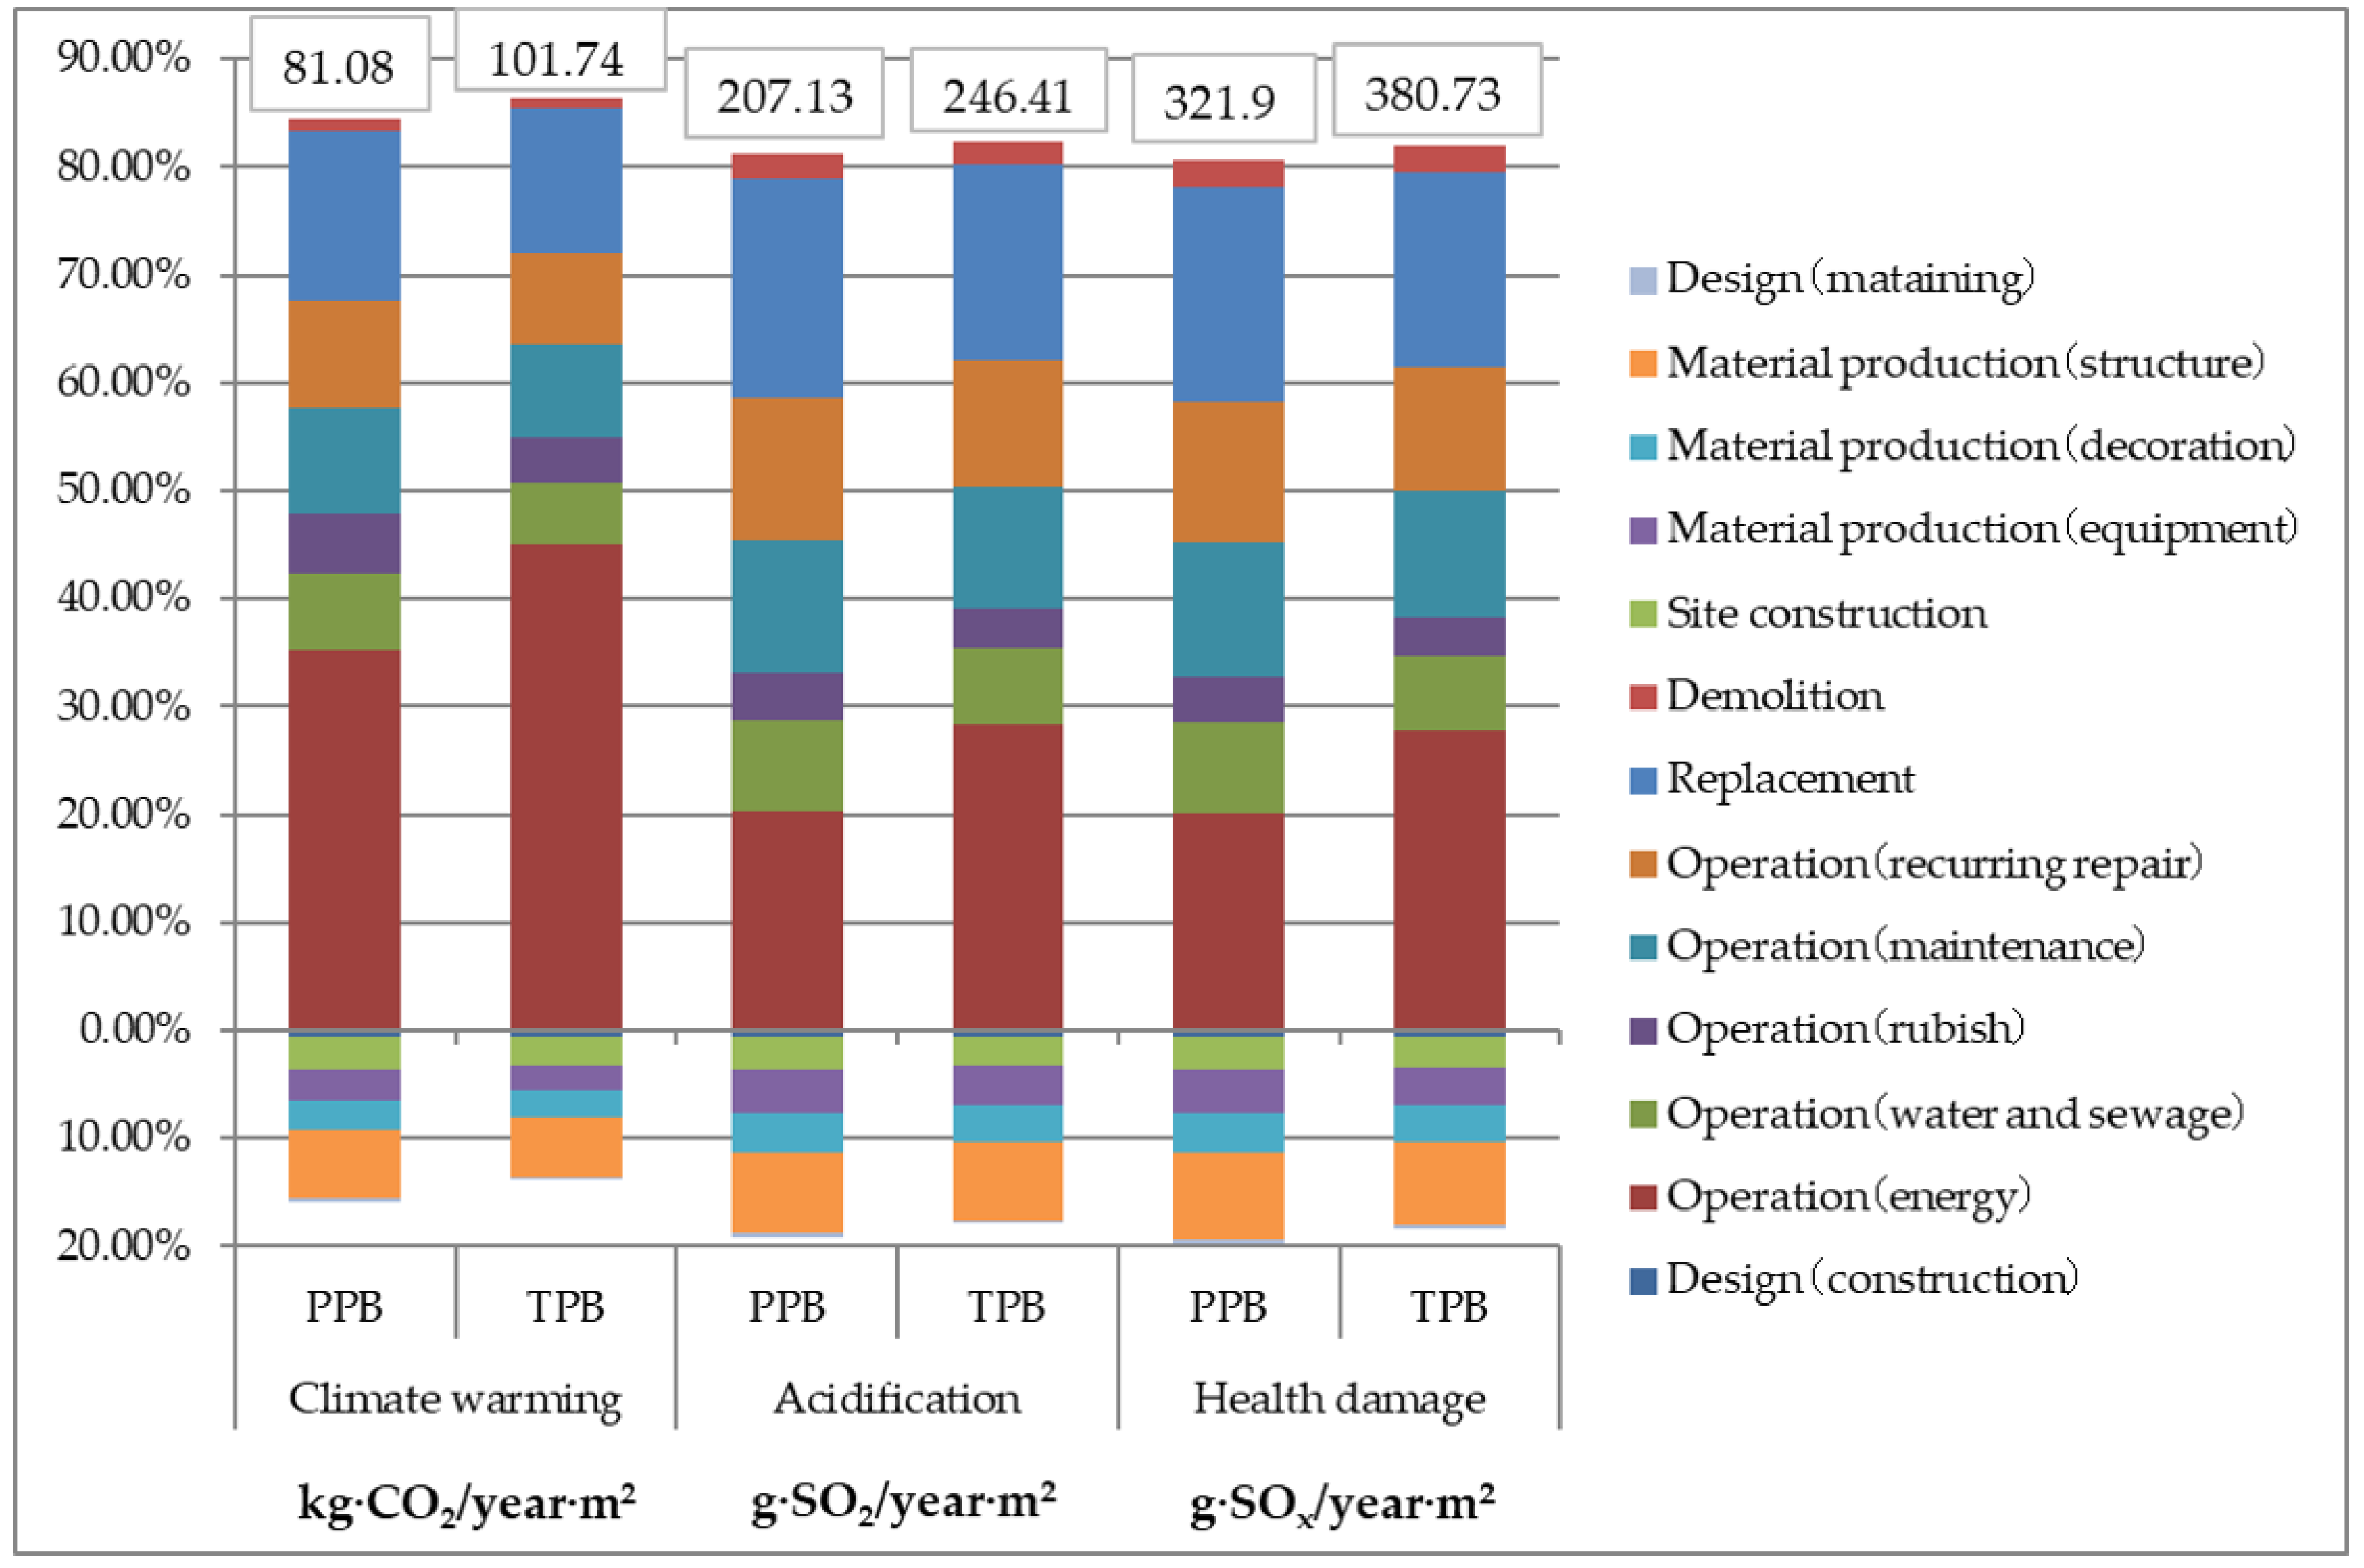
4.2.4. Comparison of Ecosystem Damage between the PPB and TPB during Their Respective Life Cycles
The performance of two kinds of building in terms of ecosystem damage is indicated in Figure 8. The bars under the x-axis describe the percentage of energy consumed during the material production and site construction stage, while the bars above the x-axis indicate the proportion of energy consumption during the use and demolition phase. The PPB was found to perform better at reducing global warming, acid rain, and health damage in every stage by more than 15%. This can be explained by the fact that PPB construction and operation consumes fewer materials and less energy, leading to eutrophication and global warming, for instance, materials such as steel, concrete, and wood and energy sources such as electricity and natural gas. Additionally, the emissions of harmful gases, such as CH4, SO2, CO2, and NOx, in the production of relevant materials and the use of fossil fuel is further reduced, thereby achieving the goal of reducing the environmental impact.
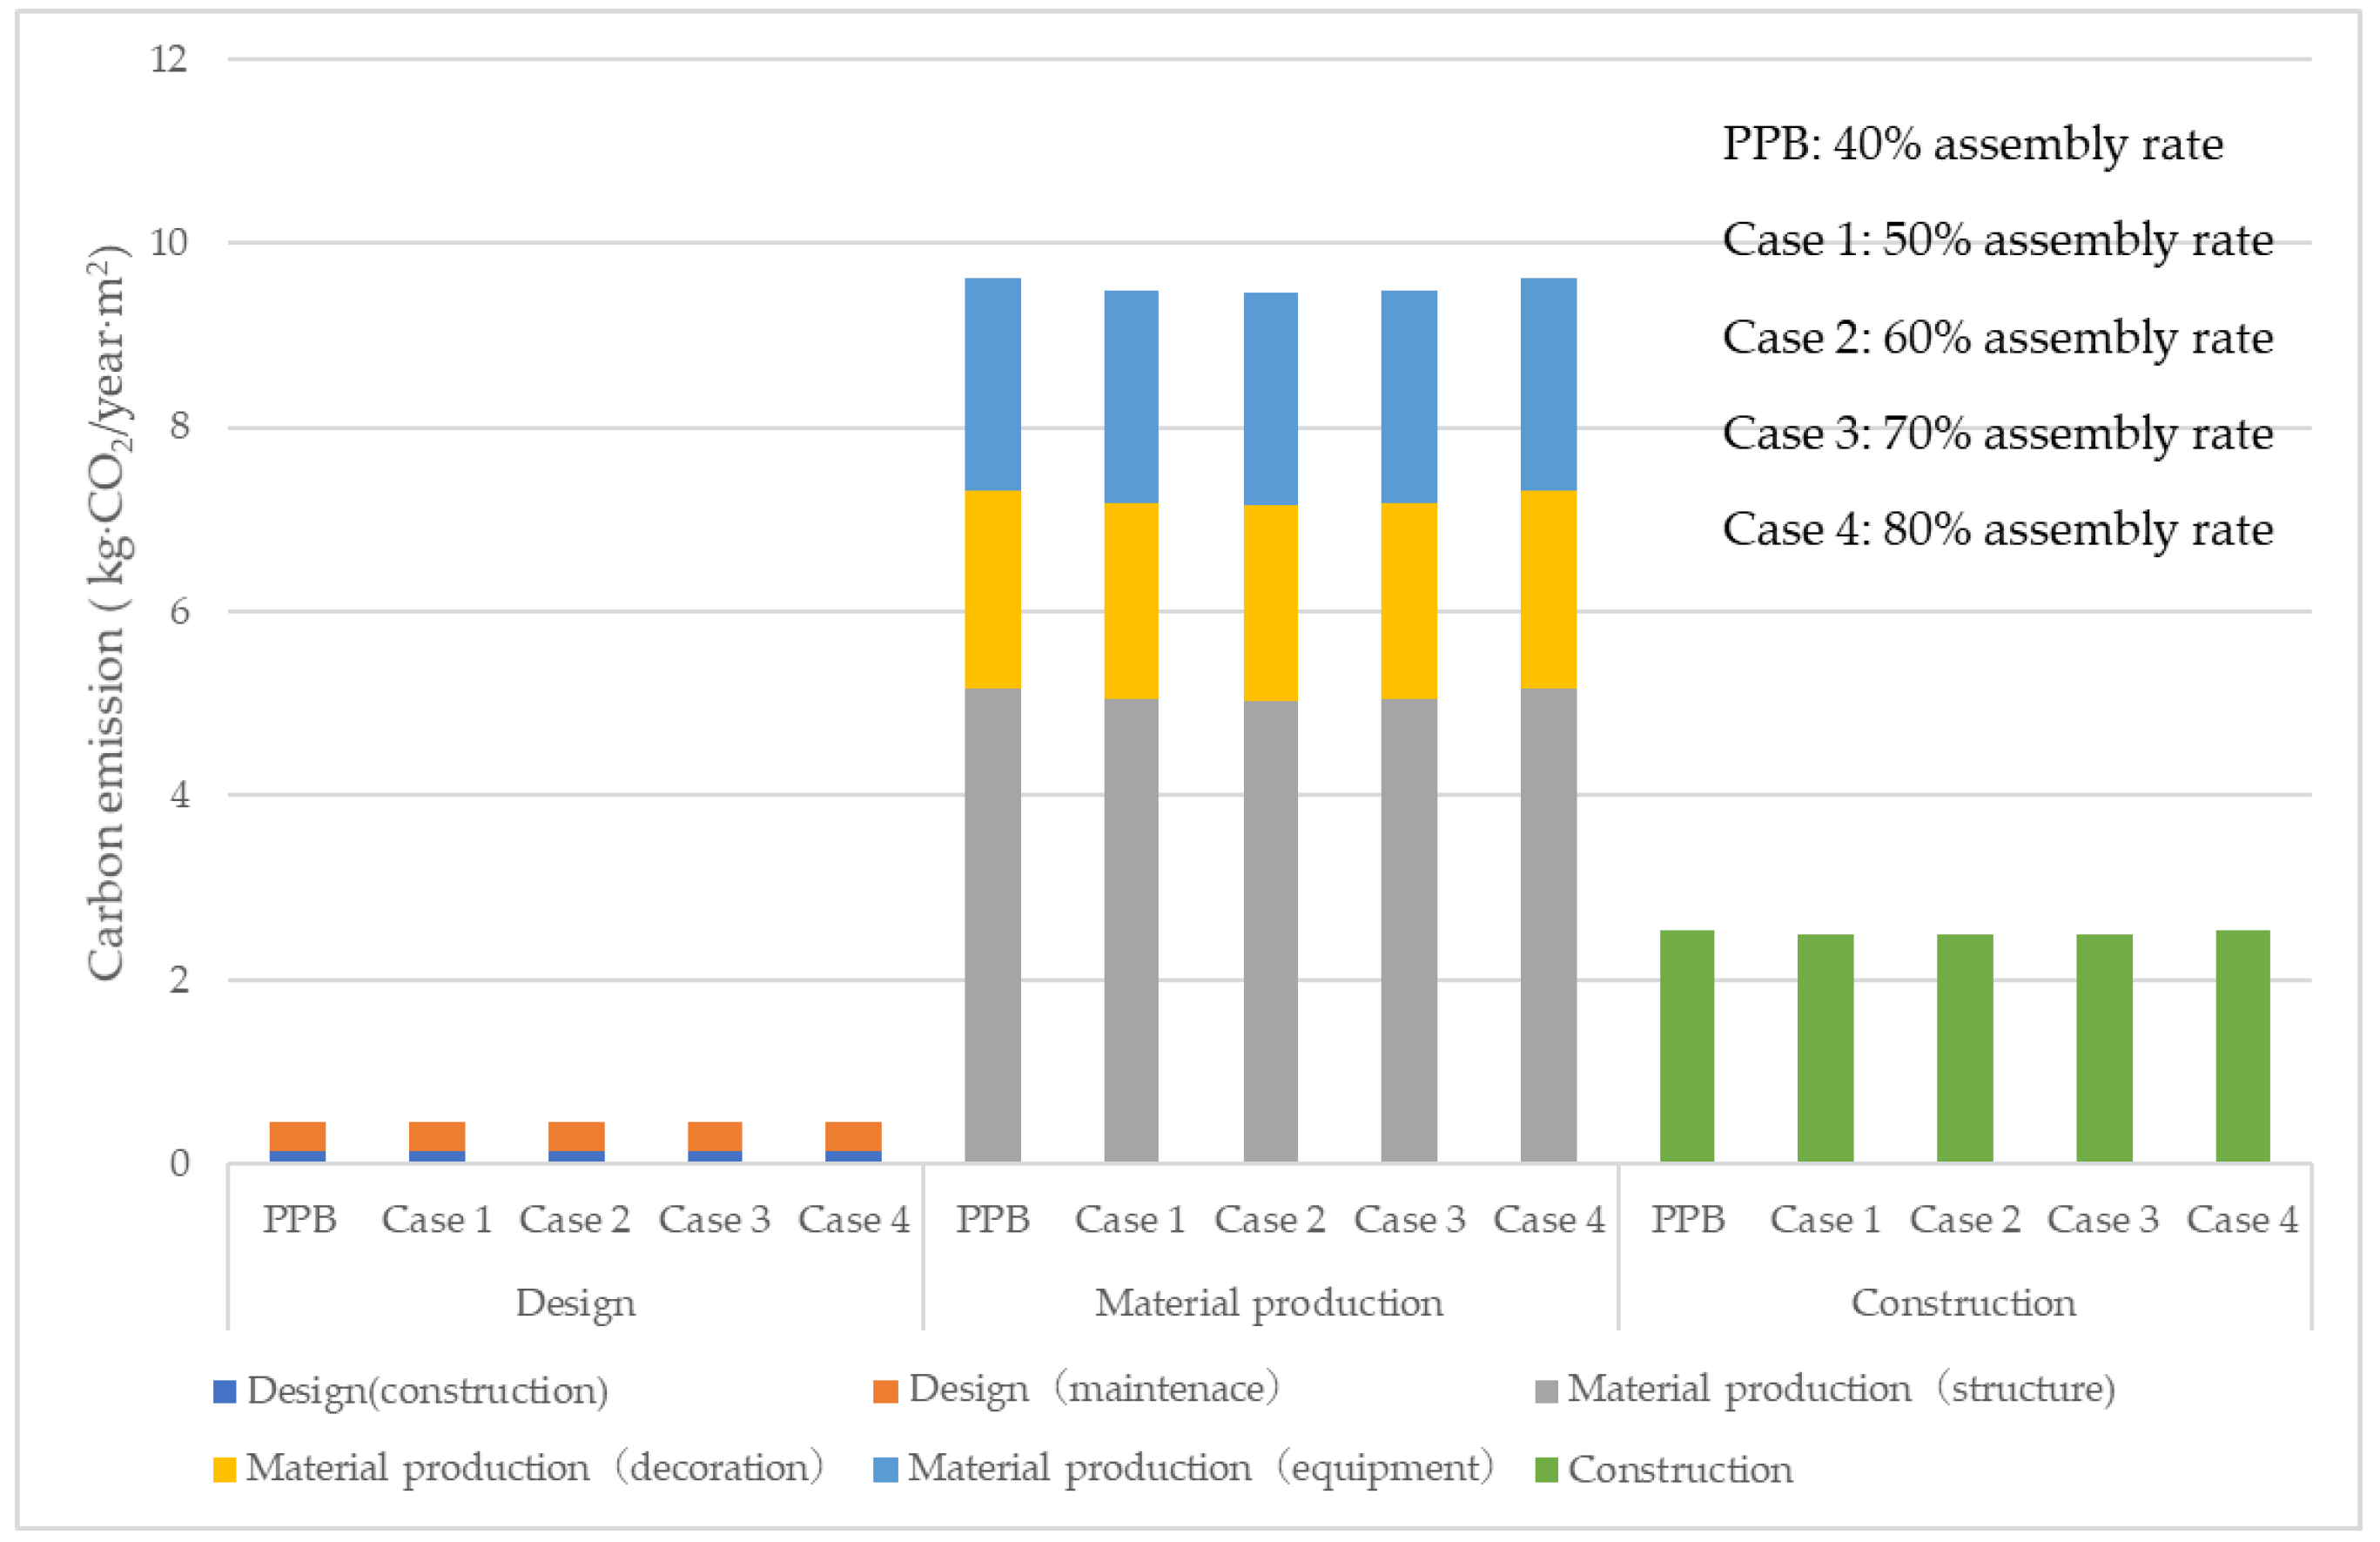
4.2.5. Comparison of Different Assembly Rates and Prefabricated Components
The case studies conclude that the carbon emissions and cost of prefabricated buildings are superior to those of cast-in-situ buildings. Accordingly, the impact of the assembly rate on the carbon emissions of prefabricated buildings was analyzed from the perspectives of carbon emissions and economy. Most previous research on prefabricated buildings has focused on building components on the ground but has rarely involved prefabricated pile foundations. Thus, further analyses of the impact of prefabricated pile foundations on carbon emissions were conducted. The influences of structures with different assembly rates (Cases 1–4) and prefabricated pile foundations (Case 5) on the carbon emissions of PPB during the life cycle are indicated in Figure 9 and Figure 10. As we can see from the bar charts, the carbon emissions of prefabricated buildings decrease when the assembly rate rises, bottoming out when the assembly rate is 60%. Then, the emissions increase generally when the assembly rate is added. This can be explained by the following three aspects. The first point with respect to this is that the main body of the building structure is basically formed when the prefabrication rate of the structure exceeds 60%. After this, increasing the assembly rate cannot effectively reduce the use of wood formwork.
Second, as the rate of assembly goes up, some special shapes and structures with fewer applications need to be prefabricated in factories, which will increase the carbon emissions as well. This is because, during the prefabrication process of these components, the reuse ratio of the steel template is not obvious, and the production processing duration of these components is longer. Besides, the particularity of these components also causes a reduction in production efficiency, resulting in the waste of materials and excessive energy consumption in the production process.
Finally, in the site construction stage, when some special-shaped components (such as special-shaped beams and t-shaped floor slabs) are assembled on site, the construction difficulty will increase the working hours and mechanical energy consumption required, leading to an increase in carbon emissions as well.
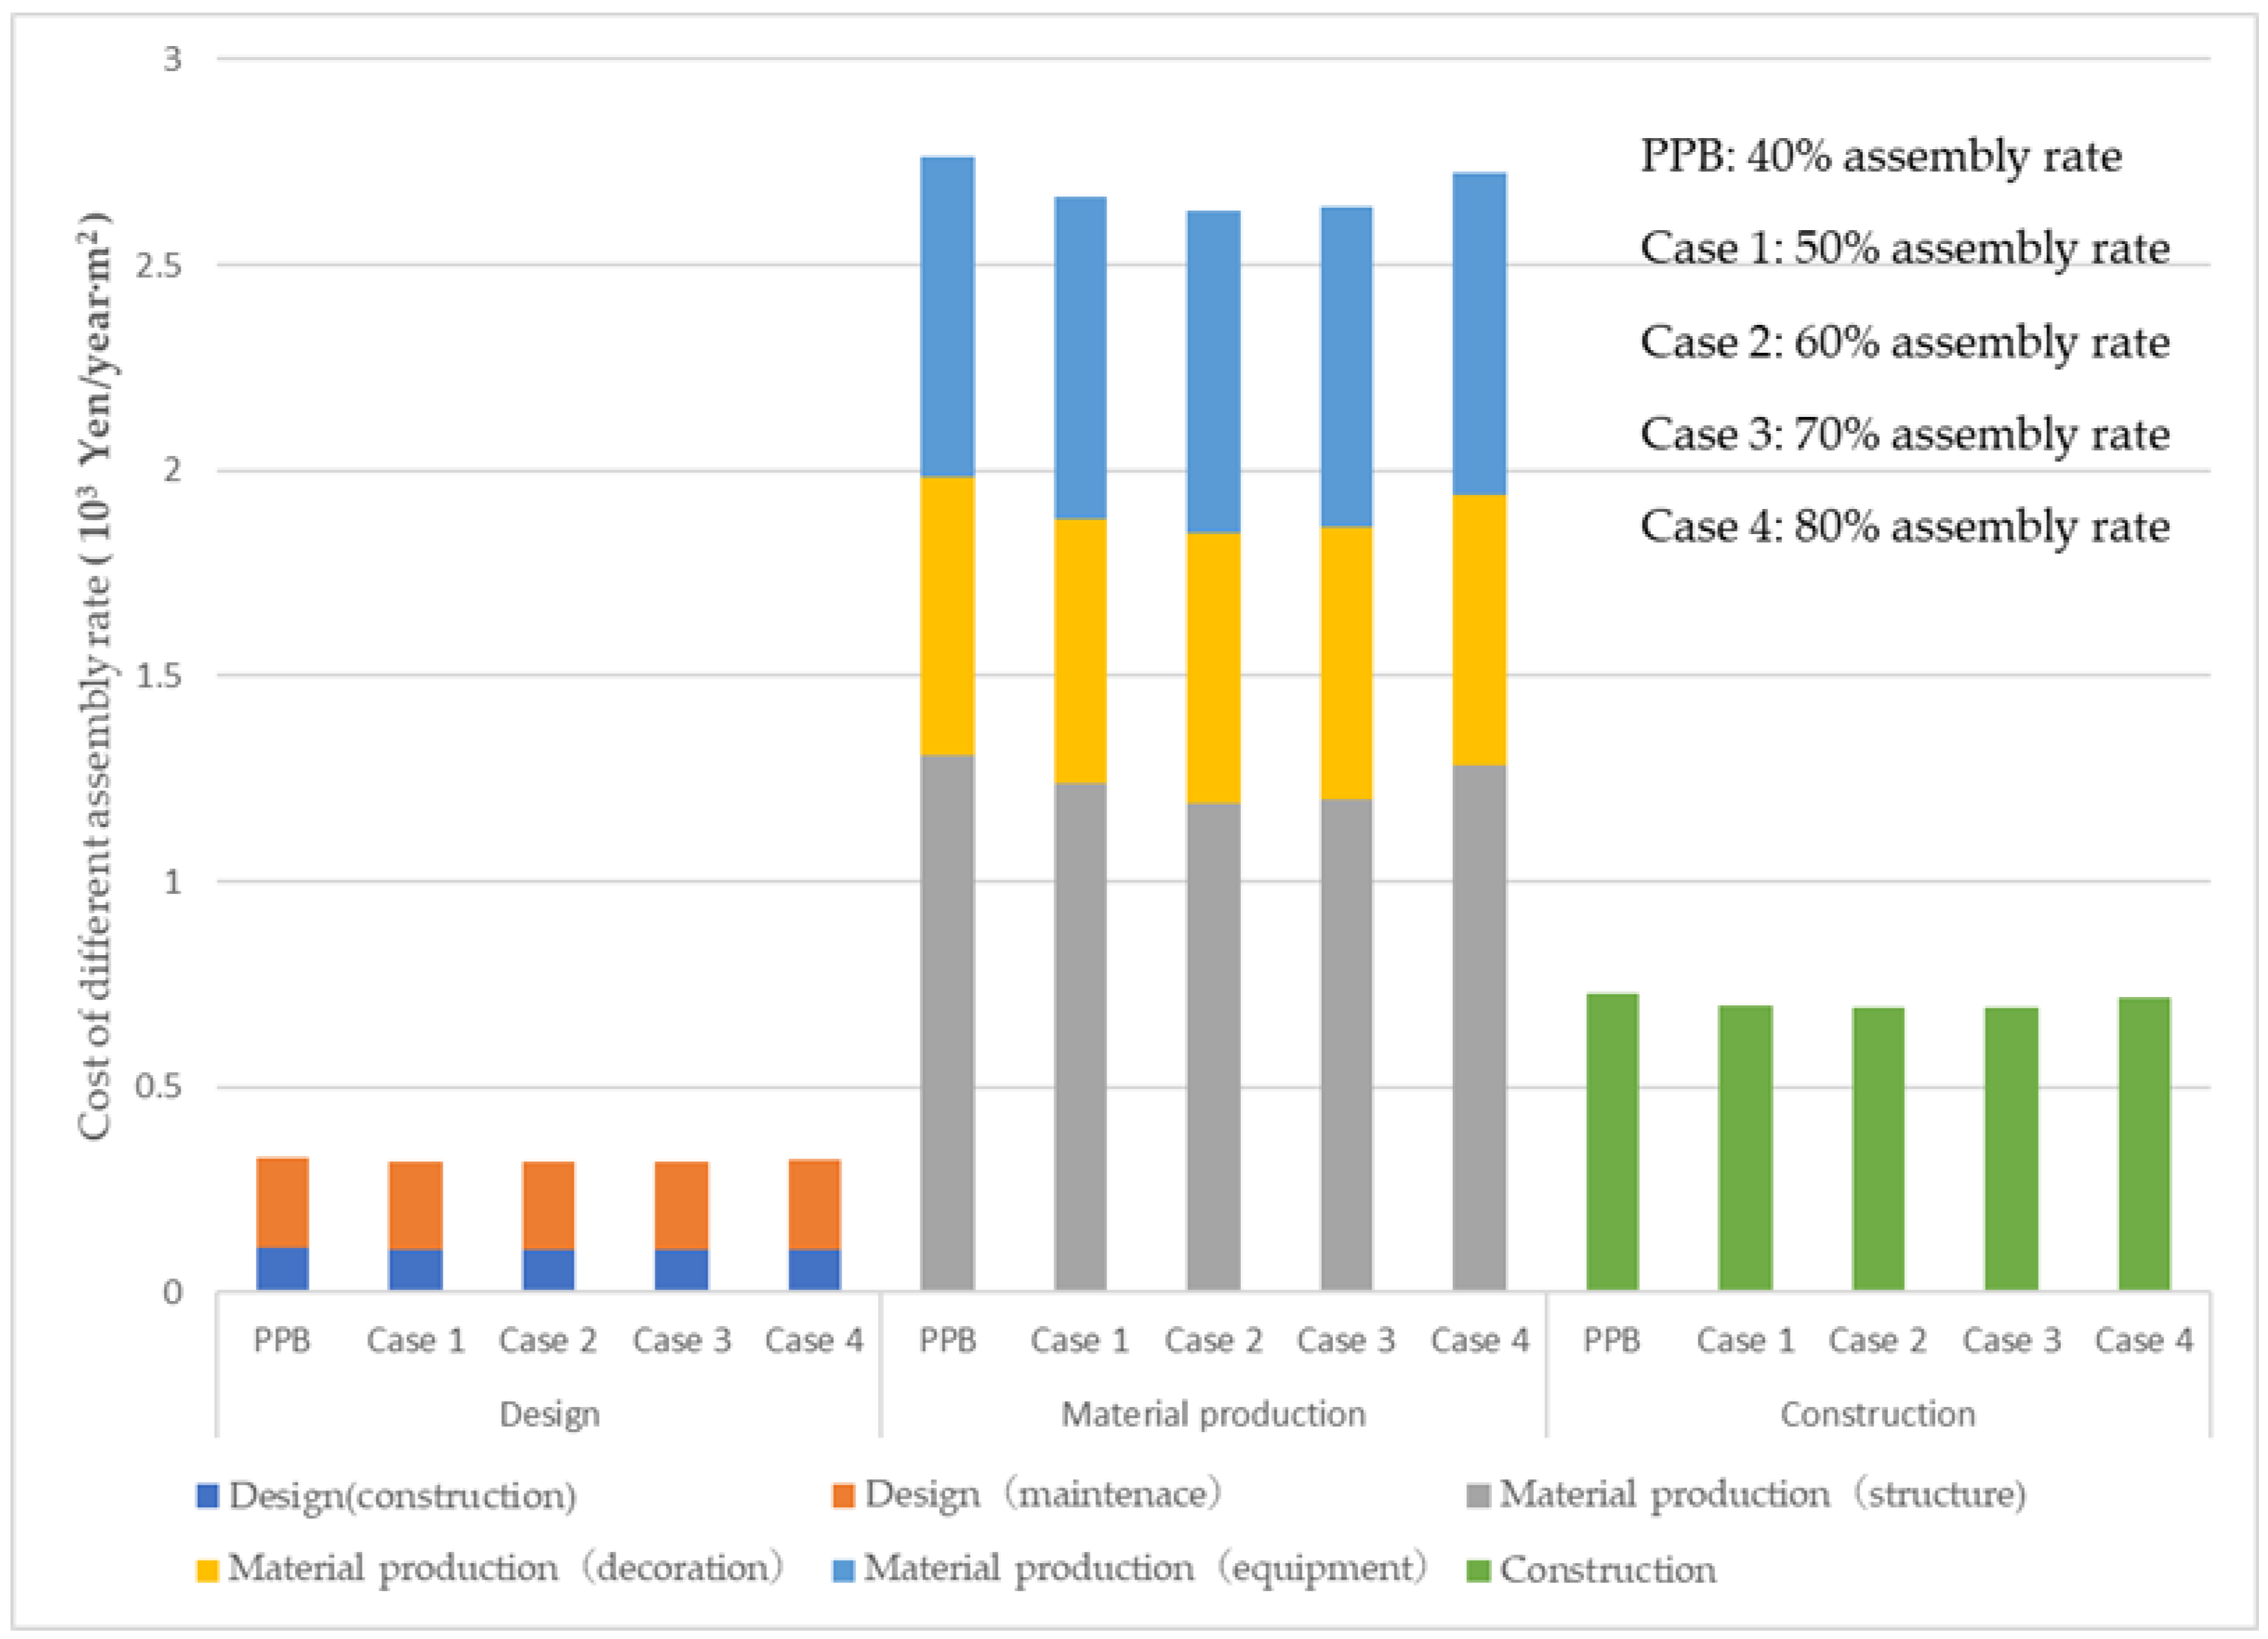
The relationship between the cost of prefabricated buildings and the assembly rate shows a similar trend to that shown in Figure 11. More specifically, the cost of prefabricated buildings drops firstly, reaching the lowest value when the assembly rate is 60%. After that, an upward trend is shown as the assembly rate increases. It is evident that, with less usage of some building components, the production cost of the components in the prefabrication production process rises significantly. Moreover, the construction cost is greater.
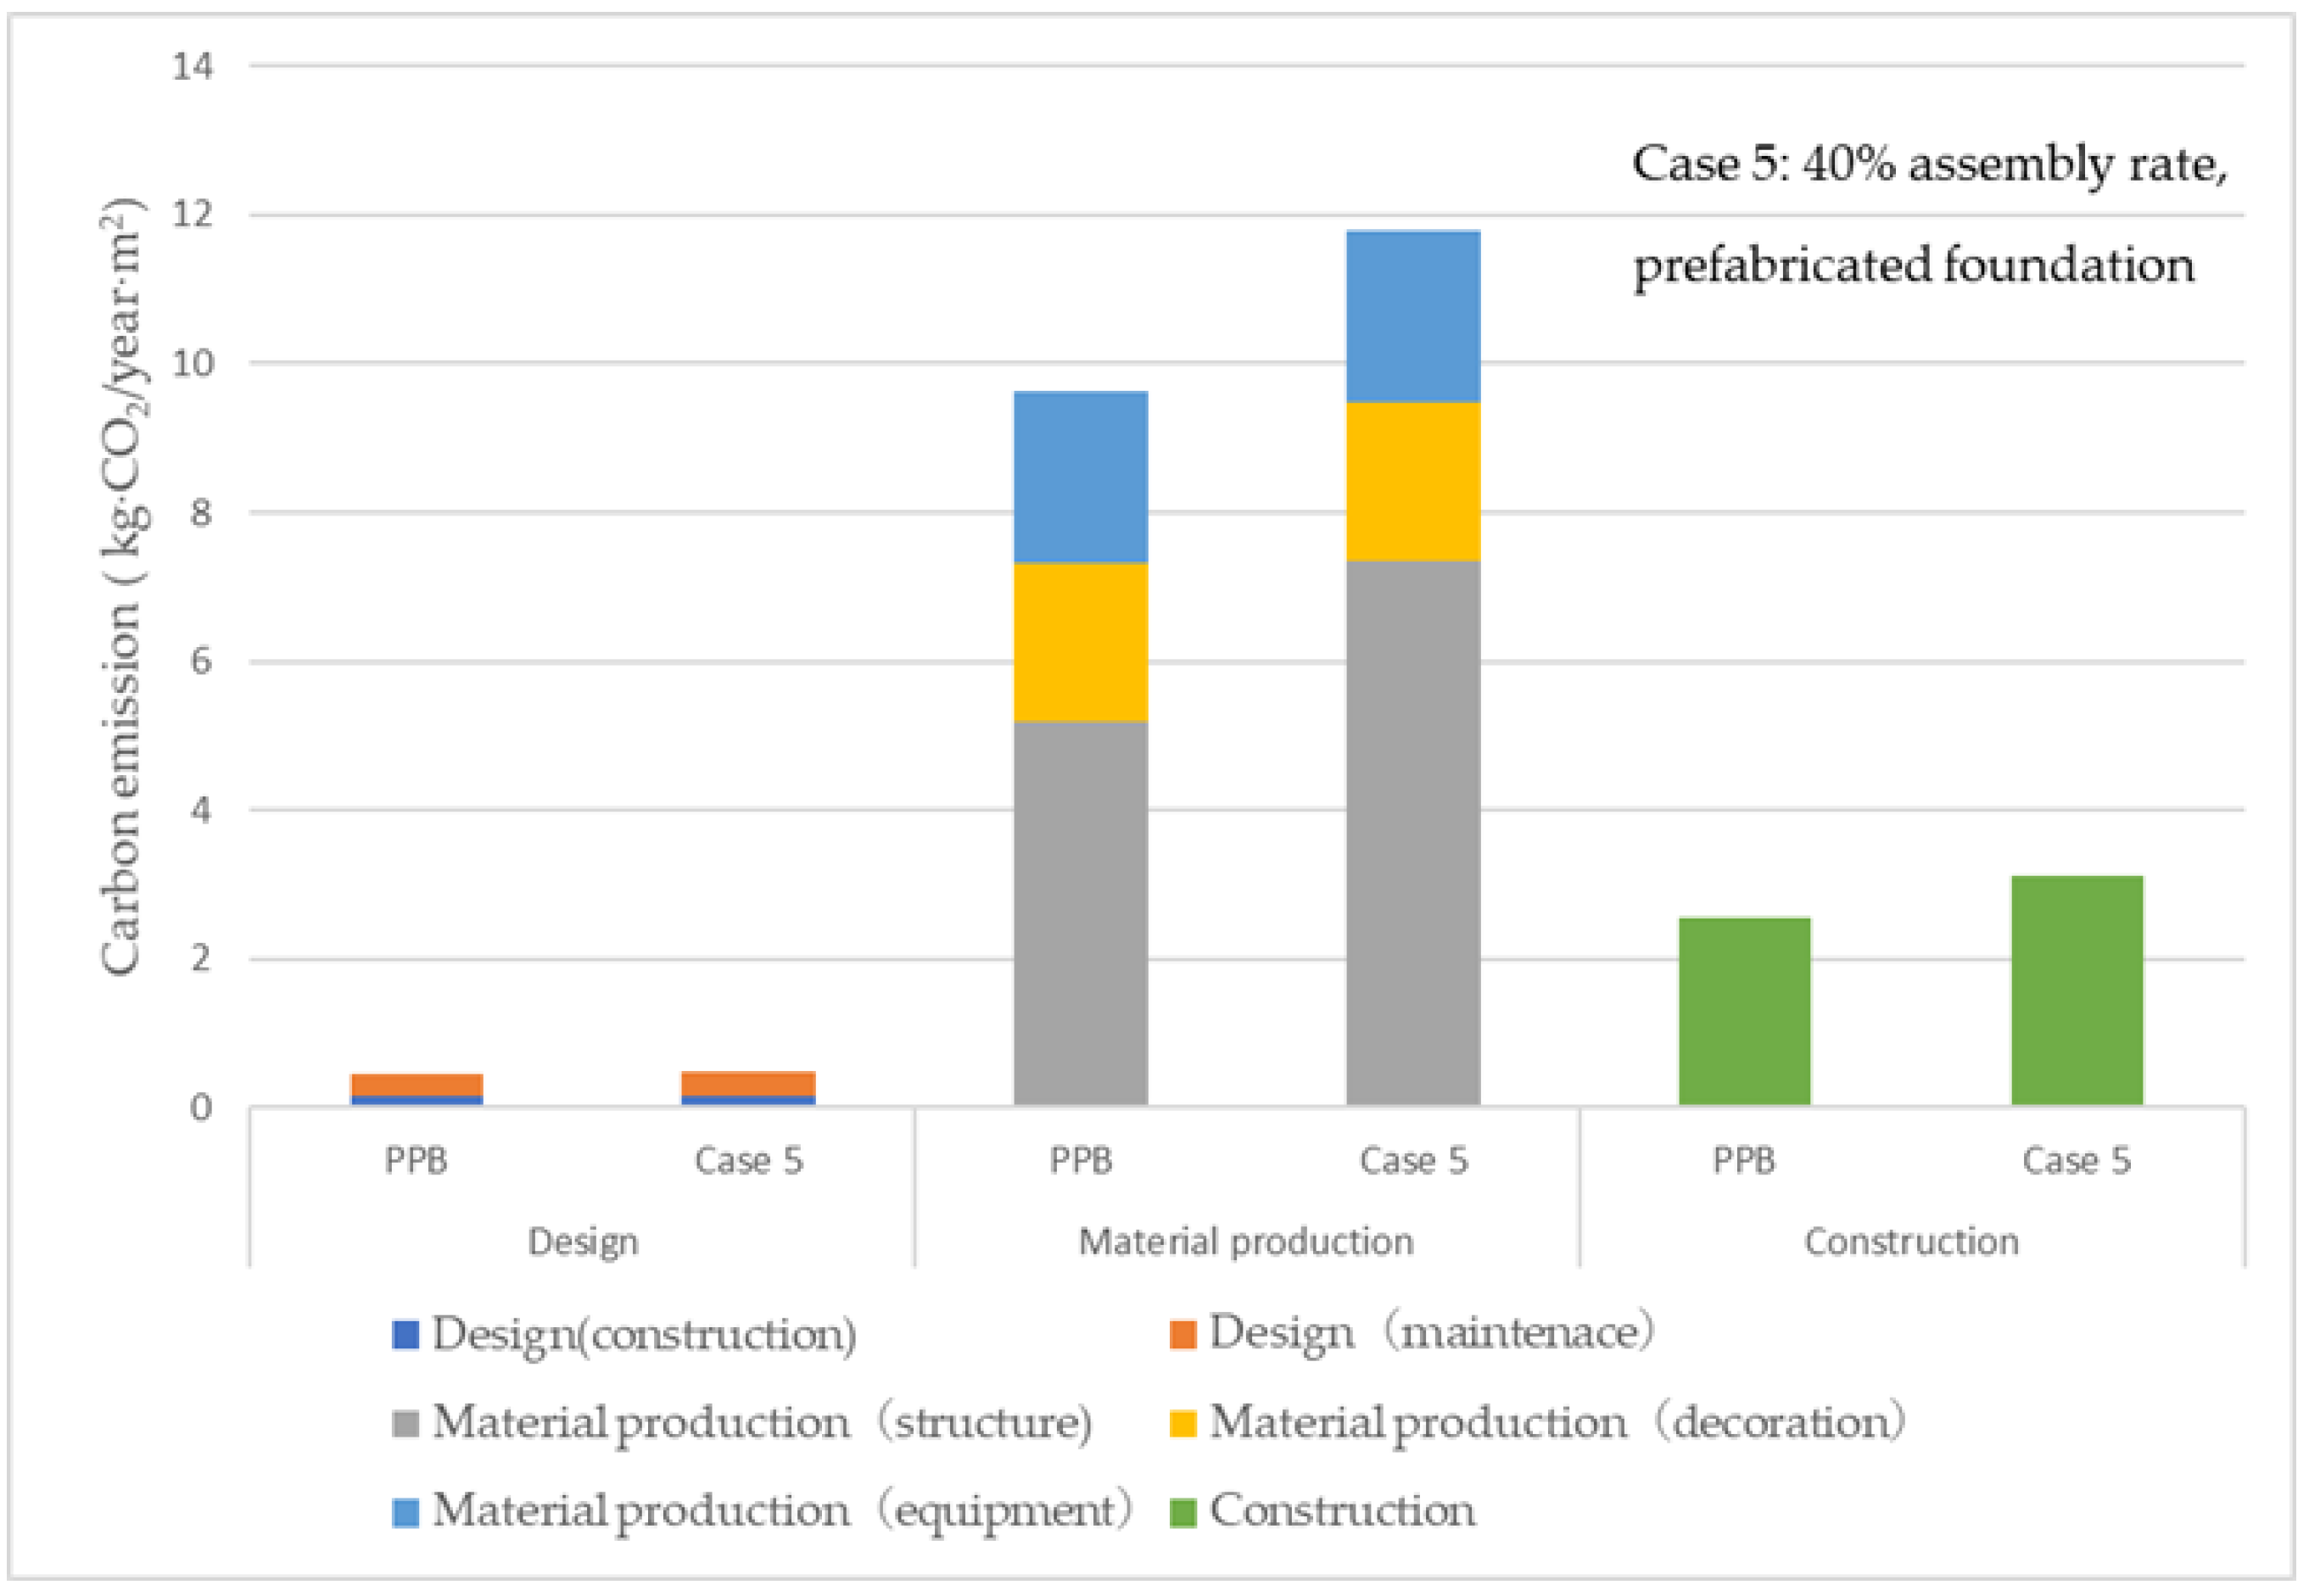
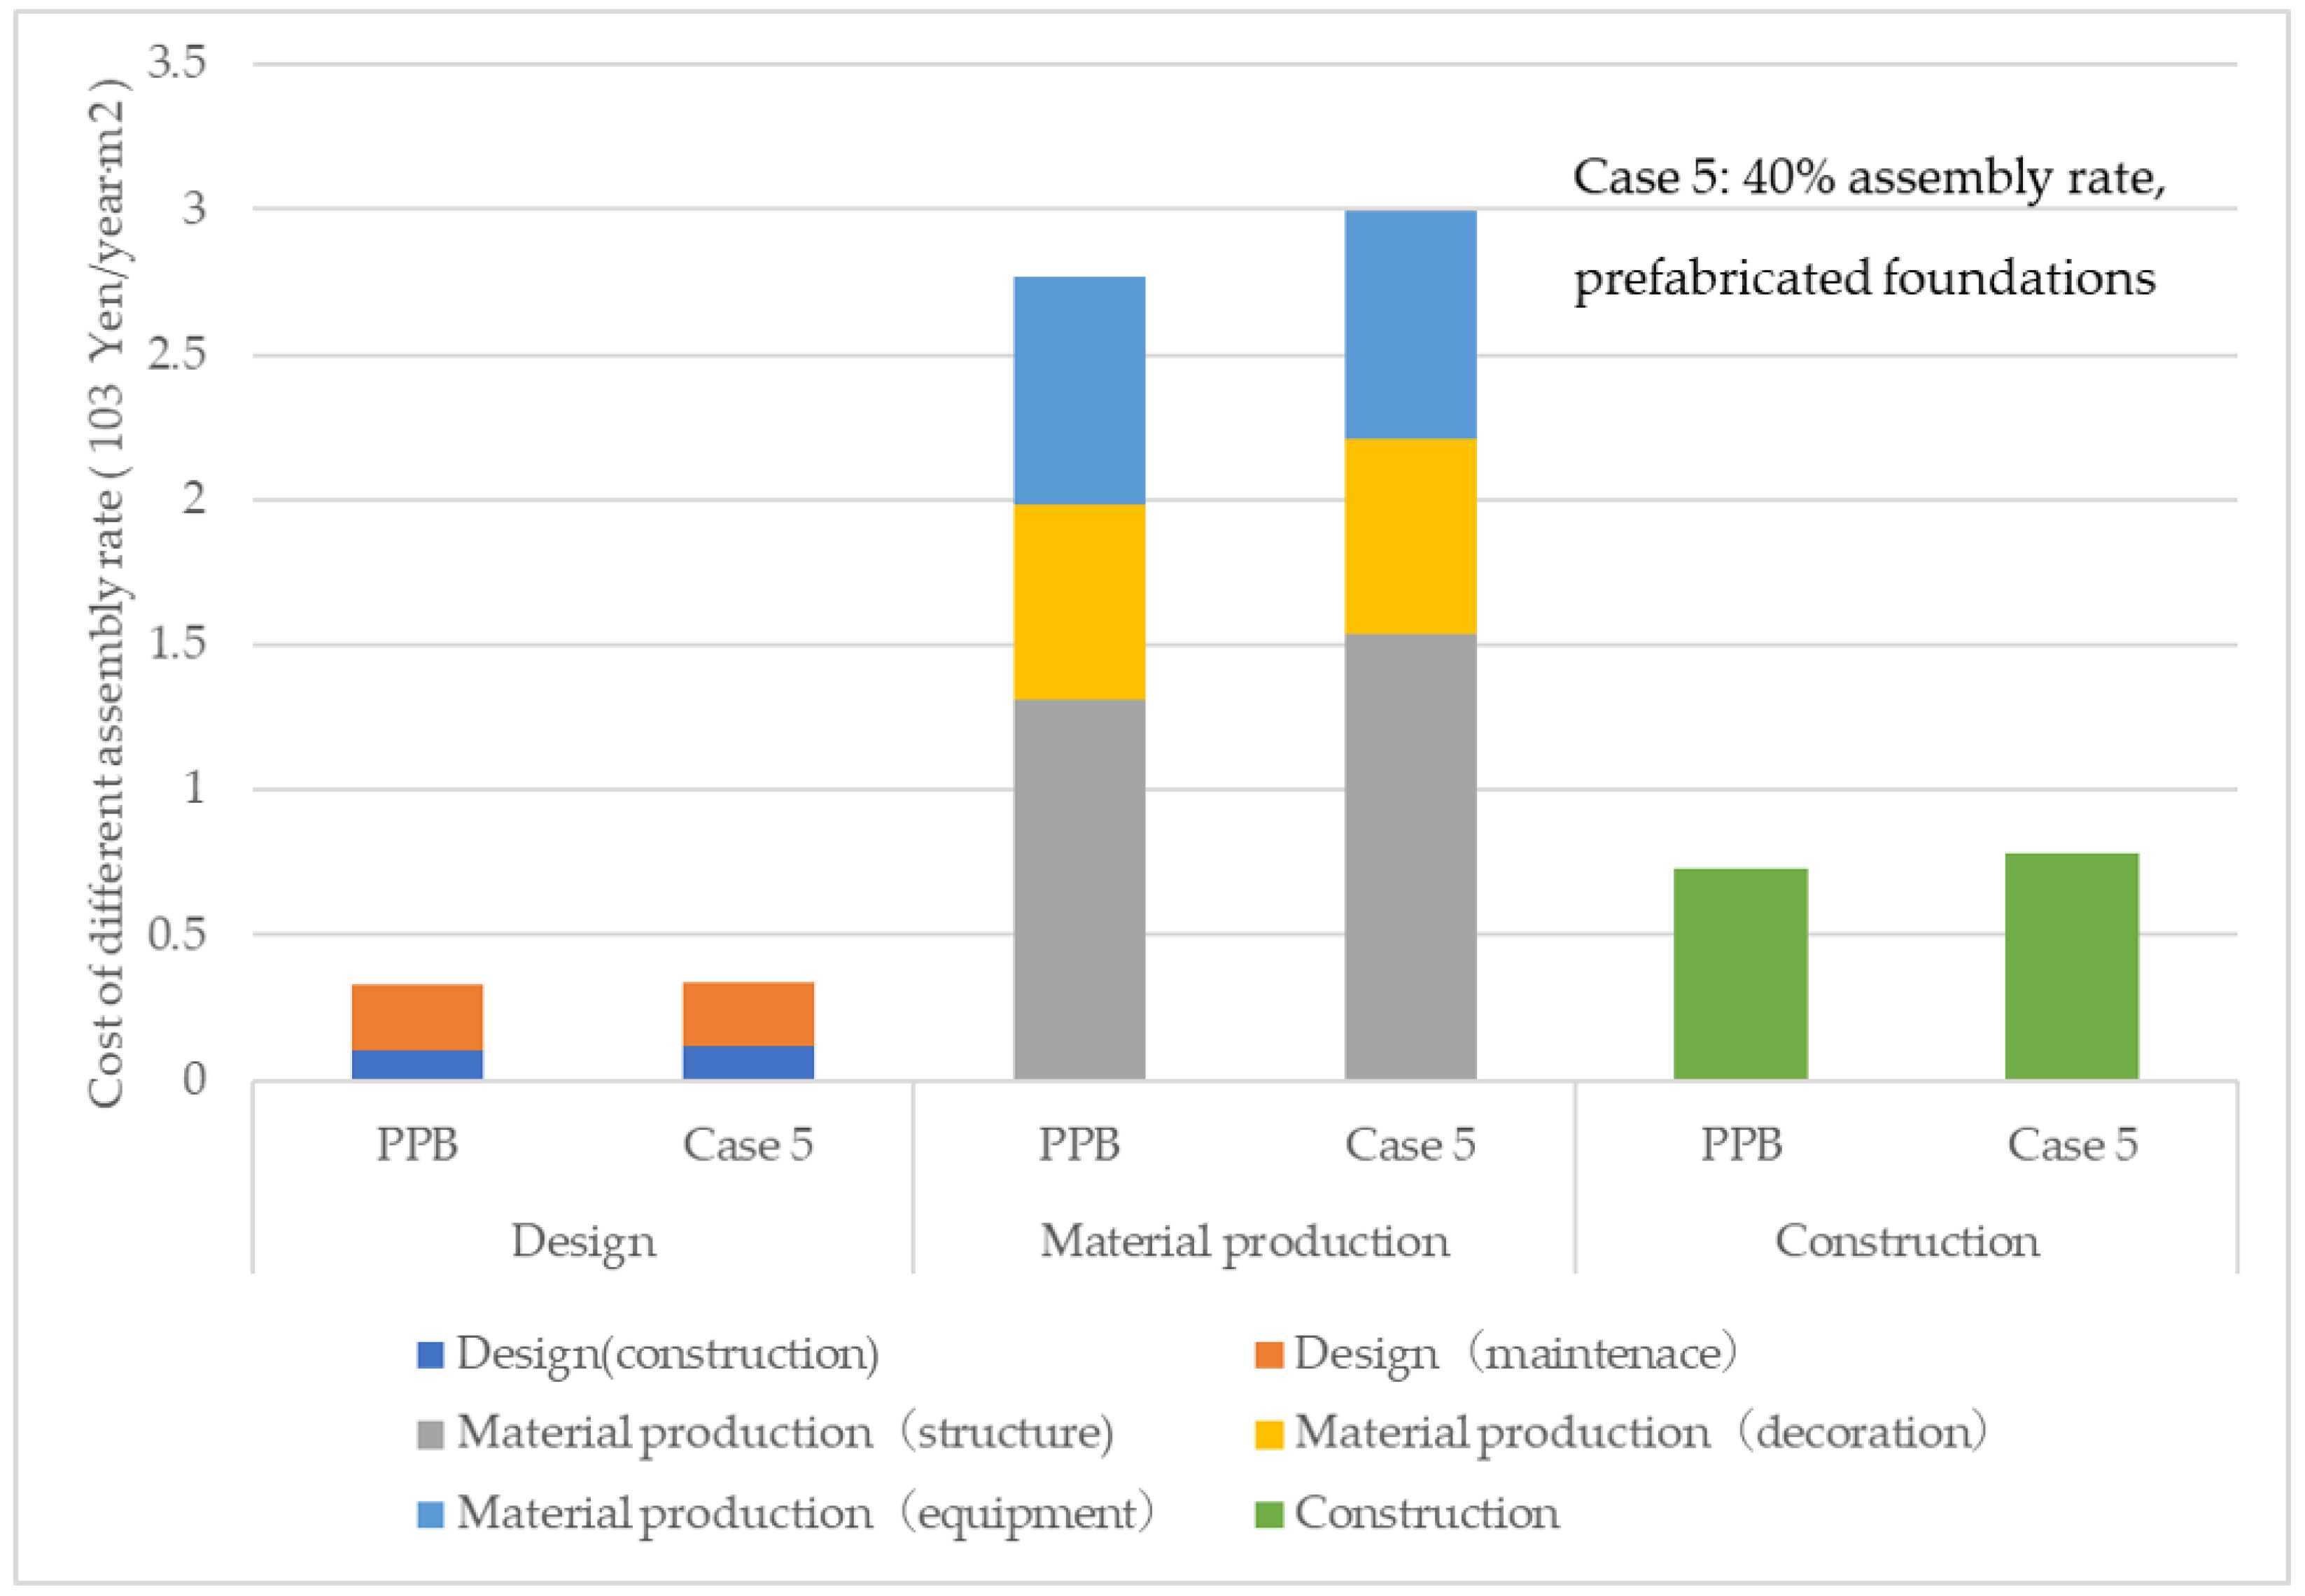
The comparative study (Figure 12) of the PPB and case 5 outlines that prefabricated pile foundations increase the carbon emissions of component manufacturing and construction dramatically. The reason for this is that there is a small number of building foundations with special shapes and large volume employed that make the material utilization rate of the prefabricated component production process lower, and the production cycle longer. For example, the steel formwork of prefabricated pile foundation has poor versatility, thereby increasing the consumption of steel. Steel is considered to have a major environmental impact factor, of which the impact occurs during the production and processing. In addition, it has a considerable impact on resource depletion and harmful gas emissions. Consequently, the use of prefabricated piles will increase the carbon emissions of buildings obviously. In the site construction stage, compared with cast-in-situ foundations, the use of prefabricated foundations requires more hoisting equipment to be employed. Furthermore, the precast foundation is not convenient for construction due to the high accuracy requirement of foundation positioning in construction, which increases the construction time and leads to an increase in carbon emissions in the construction stage.
5. Conclusions
This study analyzed the impact of each stage of the life cycle of prefabricated buildings on the environment based on a hybrid model. The application of the model was based on existing data to guarantee the integrity of the system boundary and the accuracy of the calculation results. In the case study, the influences of prefabricated buildings and traditional cast-in-situ buildings on the environment during the life cycle were compared. Moreover, the carbon emissions of prefabricated buildings with prefabricated pile foundations and different assembly rates were studied.
Compared with the TPB, the PPB has a reduced EI at all stages. The most significant energy consumption reduction was found to occur in the operation stage, 66.62 MJ/year∙m2, due to factory-prefabricated insulation, which improves the thermal performance and durability of the walls. The energy saving effect during the construction phase was also shown to be obvious: 17.94 MJ/year∙m2. Although the energy saving in the demolition phase was found to be the least with 1.823 MJ/year∙m2, the energy saving ratio was as high as 11.29%. During the construction phase, the use of wood formwork was significantly reduced by using prefabricated components. The consumption of materials at the construction site was also reduced. The PPB was shown to have reduced carbon emissions and energy usage by 7.17% and 7.54%, respectively. Prefabricated buildings also showed higher recycling rates than traditional buildings. The performance of ecosystem damage of the PPB was found to be better than that of the TPB, which can reduce global warming, acid rain, and health damage by 15%.
The analysis of buildings with different assembly rates indicated that the carbon emissions of PPB will increase and then decrease as the assembly rate increases. The assembly rate has the best improvement effect on carbon emissions during the construction process and has little impact on the operation and design stage. With the assembly rate rising gradually, the carbon emissions and cost of prefabricated buildings drops, bottoming out when the assembly rate is 60%. After that, there is an upward trend as the assembly rate increases. The prefabricated pile foundation is not suitable for fabricated components, which will significantly increase the carbon emissions and cost during the construction phase. Therefore, it is suggested that the cast-in-situ construction method should be adopted for the building foundations.
The use of prefabricated buildings in Japan effectively reduces the EI and energy consumption. The results are based on Japan’s construction industry structure and social production level, which can help recognized the current prefabricated buildings development in Japan. The successful construction experience could provide useful information and guidance for other countries. This paper concluded various environment performance improvement potential in different building construction phase, which can help to make targeted measures to implement and promote prefabrication technologies for specific phase. The comparison of prefabricated buildings with different assembly rates points out that an excessively high assembly rate will not decrease the carbon emissions and energy consumption of the building, which remind some countries where prefabricated buildings development are just in its infancy that do not blindly seek for excessively high assembly rates.
In the initial stage of prefabricated building development, due to the incomplete supporting industry, the energy consumption of units for the prefabricated component production process may be increased. Prefabricated building development also faces many challenges. It requires high precision in the manufacture of components, which requires excellent ability of workers and strict management of prefabricated factories. The construction duration will be delayed if the prefabs are damaged during lifting or transport. Generally, prefabricated factories have to be close to the construction site to provide convenience for transportation. The durability and safety of prefabricated buildings depends on the assembly of prefabricated components, which also requires strict management of the construction sites and professions of workers. Therefore, the prefabricated building and traditional cast-in-situ building methods still coexist. Multiple factors are considered when deciding which type of building is appropriate. It is suggested that experienced and mature design companies and prefabricated parts from manufacturers are considered in the early stage of the industry’s development, which will help to improve their application. Considering the characteristics of carbon emissions during the life cycle of Japanese prefabricated buildings, it is necessary to give priority to prefabricated components of walls to improve the thermal insulation performance of buildings, which can significantly reduce the carbon emissions during the life cycle of buildings.
Author Contributions
Conceptualization, H.W.; methodology, H.W.; software, H.W.; validation, H.W., Y.Z. and W.G.; formal analysis, H.W.; investigation, H.W.; resources, H.W.; data curation, H.W.; writing—original draft preparation, H.W.; writing—review and editing, Y.Z., W.G., S.K.; visualization, H.W.; supervision, W.G.; project administration, H.W. All authors have read and agreed to the published version of the manuscript.
Funding
This research received no external funding.
Conflicts of Interest
The authors declare no conflict of interest.
References
- Intergovernmental Panel on Climate Change. Global Warming of 1.5 °C. Available online: https://www.ipcc.ch/site/assets/uploads/sites/2/2019/06/SR15_Full_Report_High_Res.pdf (accessed on 17 March 2020).
- WBCSD. Picking up the Pace—Accelerating Public Policies for Positive Outcomes: A WBCSD Analysis of Company Case Studies on Biodiversity and Ecosystems Regulation. Available online: https://www.wbcsd.org/Programs/Redefining-Value/Business-Decision-Making/Assess-and-Manage-Performance/Resources/Picking-up-the-Pace-Accelerating-public-policies-for-positive-outcomes (accessed on 17 March 2020).
- Pérez-Lombard, L.; Ortiz, J.; Pout, C. A review on buildings energy consumption information. Energy Build. 2008, 40, 394–398. [Google Scholar] [CrossRef]
- Ikaga, T.; Murakami, S.; Kato, S.; Shiraishi, Y. Forecast of CO2 Emissions from Construction and Operation of Buildings in Japan up to 2050. J. Asian Arch. Build. Eng. 2010, 1, 149–156. [Google Scholar] [CrossRef] [Green Version]
- Gibb, A.G.F. Pre-Assembly in Construction a Review of Recent and Current Industry. Available online: https://repository.lboro.ac.uk/articles/Pre-assembly_in_Construction_CRISP_/9461033 (accessed on 17 March 2020).
- Tam, V.W.Y.; Tam, C.M.; Zeng, S.X.; Ng, W.C.Y. Towards adoption of prefabrication in construction. Build. Environ. 2007, 42, 3642–3654. [Google Scholar] [CrossRef] [Green Version]
- Jaillon, L.; Poon, C.S. The evolution of prefabricated residential building systems in Hong Kong: A review of the public and the private sector. Autom. Constr. 2009, 18, 239–248. [Google Scholar] [CrossRef]
- Navaratnam, S.; Ngo, T.; Gunawardena, T.; Henderson, D. Performance Review of Prefabricated Building Systems and Future Research in Australia. Buildings 2019, 9, 38. [Google Scholar] [CrossRef] [Green Version]
- Li, H.; Guo, H.L.; Skitmore, M.; Huang, T.; Chan, K.Y.N.; Chan, G. Rethinking prefabricated construction management using the VP-based IKEA model in Hong Kong. Constr. Manag. Econ. 2011, 29, 233–245. [Google Scholar] [CrossRef] [Green Version]
- Song, J.; Fagerlund, W.R.; Haas, C.T.; Tatum, C.B.; Vanegas, J.A. Considering Prework on Industrial Projects. J. Constr. Eng. Manag. 2005, 131, 723–733. [Google Scholar] [CrossRef]
- Kim, D. Preliminary Life Cycle Analysis of Modular and Conventional Housing in Benton Haror, Michigan. Ph.D. Thesis, University of Michigan, Ann Arbor, MI, USA, 2008. [Google Scholar]
- Goda, J. Overview of Prefabricated Housing in Japan. Available online: https://mafiadoc.com/outline-of-prefabricated-housing-in-japan_599c92ca1723dd08400c054c.html (accessed on 6 September 2019).
- Wu, H.; Qian, Q.K.; Straub, A.; Visscher, H. Exploring transaction costs in the prefabricated housing supply chain in China. J. Clean. Prod. 2019, 226, 550–563. [Google Scholar] [CrossRef] [Green Version]
- Ting, S.K.; Jin, H.F. Prefabrication in the Singapore Construction Industry Human Resource Problem in the Singapore Construction. Available online: http://www.iaarc.org/publications/proceedings_of_the_17th_isarc/prefabrication_in_the_singapore_construction_industry.html (accessed on 17 March 2020).
- Hong, J.; Shen, G.Q.; Mao, C.; Li, Z.; Li, K. Life-cycle energy analysis of prefabricated building components: An input-output-based hybrid model. J. Clean. Prod. 2016, 112, 2198–2207. [Google Scholar] [CrossRef] [Green Version]
- Nadim, W.; Goulding, J.S. Offsite production: A model for building down barriers A European construction industry perspective. Eng. Constr. Arch. Manag. 2011, 18, 82–101. [Google Scholar] [CrossRef]
- Mao, C.; Shen, Q.; Pan, W.; Ye, K. Major Barriers to Off-Site Construction: The Developer’s Perspective in China. J. Manag. Eng. 2013, 31, 04014043. [Google Scholar] [CrossRef]
- Cao, X.; Li, X.; Zhu, Y.; Zhang, Z. A comparative study of environmental performance between prefabricated and traditional residential buildings in China. J. Clean. Prod. 2015, 109, 131–143. [Google Scholar] [CrossRef]
- Stephan, A.; Stephan, L. Life cycle energy and cost analysis of embodied, operational and user-transport energy reduction measures for residential buildings. Appl. Energy 2016, 161, 445–464. [Google Scholar] [CrossRef]
- Takeuchi, M. External Insulation PC Method to Realize a Human- and Earth-Friendly Uuter Wall. Concrete engineering 2010, 48, 98–101. [Google Scholar] [CrossRef]
- Dosho, Y. Development of a Sustainable Concrete Waste Recycling System. J. Adv. Concr. Technol. 2007, 5, 27–42. [Google Scholar] [CrossRef] [Green Version]
- Ochsendorf, J.; Norford, L.K.; Brown, D.; Durschlag, H.; Hsu, S.L.; Love, A.; Santero, N.; Swei, O.; Webb, A.; Wildnauer, M. Methods, Impacts, and Opportunities in the Concrete Building Life Cycle. Available online: https://dspace.mit.edu/handle/1721.1/105108 (accessed on 17 March 2020).
- Bonamente, E.; Merico, M.C.; Rinaldi, S.; Pignatta, G.; Pisello, A.L.; Cotana, F.; Nicolini, A. Environmental impact of industrial prefabricated buildings: Carbon and Energy Footprint analysis based on an LCA approach. Energy Procedia 2014, 61, 2841–2844. [Google Scholar] [CrossRef] [Green Version]
- Hong, J.; Shen, G.Q.; Li, Z.; Zhang, B.; Zhang, W. Barriers to promoting prefabricated construction in China: A cost–benefit analysis. J. Clean. Prod. 2018, 172, 649–660. [Google Scholar] [CrossRef]
- Li, C.Z.; Hong, J.; Fan, C.; Xu, X.; Shen, G.Q. Schedule delay analysis of prefabricated housing production: A hybrid dynamic approach. J. Clean. Prod. 2018, 195, 1533–1545. [Google Scholar] [CrossRef]
- INATOMI, Y.; Yoshitake, I.; Sugimoto, K.; Maedad, S.; Miura, F. The carbon emissions of precast concrete. J. JSCE 2009, 65, 87–96. [Google Scholar]
- JPA. A Survey of Completed Prefabricated Housing Units and Production Capacity; Japan Prefabricated Construction Suppliers and Manufacturers Association: Tokyo, Japan, 2017. [Google Scholar]
- Suzuki, M.; Oka, T.; Okada, K. The estimation of energy consumption and CO2 emission due to housing construction in Japan. Energy Build. 1995, 22, 165–169. [Google Scholar] [CrossRef]
- Li, W. Urbanization Development in China and Japan. Available online: https://www.mof.go.jp/pri/international_exchange/visiting_scholar_program/ws1908_2.pdf (accessed on 15 September 2019).
- JRC. International Reference Life Cycle Data System (ILCD) Handbook—General Guide for Life Cycle Assessment—Detailed Guidance; Publications Office of the European Union: Luxembourg, 2010; ISBN 978-92-79-19092-6. [Google Scholar]
- The International Standards Organization. Environmental Management—Life Cycle Assessment—Principles and Framework; ISO: Geneva, Switzerland, 2006; Volume 2006, pp. 1–28. [Google Scholar]
- Suh, S.; Huppes, G. Methods for life cycle inventory of a product. J. Clean. Prod. 2005, 13, 687–697. [Google Scholar] [CrossRef]
- Atmaca, A. Life cycle assessment and cost analysis of residential buildings in south east of Turkey: Part 1—review and methodology. Int. J. Life Cycle Assess. 2016, 21, 831–846. [Google Scholar] [CrossRef]
- Pomponi, F.; D’Amico, B. Carbon Mitigation in the Built Environment: An Input-output Analysis of Building Materials and Components in the UK. Procedia CIRP 2018, 69, 189–193. [Google Scholar] [CrossRef]
- Treloar, G.J.; Love, P.E.D.; Holt, G.D. Using national input/output data for embodied energy analysis of individual residential buildings. Constr. Manag. Econ. 2002, 19, 49–61. [Google Scholar] [CrossRef]
- Zhang, Z.; Wang, B. Research on the life-cycle CO2 emission of China’s construction sector. Energy Build. 2016, 112, 244–255. [Google Scholar] [CrossRef]
- Nässén, J.; Holmberg, J.; Wadeskog, A.; Nyman, M. Direct and indirect energy use and carbon emissions in the production phase of buildings: An input-output analysis. Energy 2007, 32, 1593–1602. [Google Scholar] [CrossRef]
- Zhang, X.; Wang, F. Hybrid input-output analysis for life-cycle energy consumption and carbon emissions of China’s building sector. Build. Environ. 2016, 104, 188–197. [Google Scholar] [CrossRef]
- Ramesh, T.; Prakash, R.; Shukla, K.K. Life cycle energy analysis of buildings: An overview. Energy Build. 2010, 42, 1592–1600. [Google Scholar] [CrossRef]
- Leontief, W. Environmental Repercussions and the Economic Structure: An Input-Output Approach. Rev. Econ. Stat. 1970, 52, 262–271. [Google Scholar] [CrossRef]
- Hendrickson, C.; Horvath, A. Economic Input―Output Models for Environmental. Environ. Sci. Technol. 1998, 32, 184A–191A. [Google Scholar] [CrossRef]
- Treloar, G.J. Economic Systems Research Extracting Embodied Energy Paths from Input—Output Tables: Towards an Input—Output-based Hybrid Energy Analysis Method Extracting Embodied Energy Paths from Input-Output Tables: Towards an Input-Output-based Hybrid Energy. Econ. Syst. Res. 2006, 37–41. [Google Scholar] [CrossRef]
- Tian, X.; Chang, M.; Tanikawa, H.; Shi, F.; Imura, H. Structural decomposition analysis of the carbonization process in Beijing: A regional explanation of rapid increasing carbon dioxide emission in China. Energy Policy 2013, 53, 279–286. [Google Scholar] [CrossRef]
- Shao, L.; Chen, G.Q.; Chen, Z.M.; Guo, S.; Han, M.Y.; Zhang, B.; Hayat, T.; Alsaedi, A.; Ahmad, B. Systems accounting for energy consumption and carbon emission by building. Commun. Nonlinear Sci. Numer. Simul. 2014, 19, 1859–1873. [Google Scholar] [CrossRef]
- Onat, N.C.; Kucukvar, M.; Tatari, O. Scope-based carbon footprint analysis of U.S. residential and commercial buildings: An input-output hybrid life cycle assessment approach. Build. Environ. 2014, 72, 53–62. [Google Scholar] [CrossRef]
- IPCC 2008. IPCC Guidelines for National Greenhouse Gas Inventories—A Primer; Institute for Global Environmental Strategies: Hayama, Japan, 2008. [Google Scholar]
- MLIT. Essentials for Calculating Building Materials; Ministry of Land, Infrastructure, Transport and Tourism: Tokyo, Japan, 2003.
- Asam, C. Recycling Prefabricated Concrete Components—A Contribution to Sustainable Construction. 2008. Available online: http://www.irbnet.de/daten/iconda/CIB11828.pdf (accessed on 17 March 2020).
Figure 1.
The calculation system for the life cycle assessment (LCA).

Figure 2.
Comparison of input resource between a prefabricated public building (PPB) and a TPB.

Figure 3.
Comparison of solid waste between the PPB and TPB.

Figure 4.
Comparison of energy consumption between the PPB and TPB during their respective life cycles.
Figure 4.
Comparison of energy consumption between the PPB and TPB during their respective life cycles.

Figure 5.
Comparison of carbon emissions produced during the construction of the PPB versus TPB during their respective life cycles.
Figure 5.
Comparison of carbon emissions produced during the construction of the PPB versus TPB during their respective life cycles.

Figure 6.
Comparison of cost between the PPB and TPB during their respective life cycles.

Figure 7.
Percentage of cost at various stages of the PPB and TPB in their respective life cycles.

Figure 8.
Comparison of ecosystem damage between the PPB and TPB during their respective life cycles.
Figure 8.
Comparison of ecosystem damage between the PPB and TPB during their respective life cycles.

Figure 9.
Carbon emissions of different assembly rates.

Figure 10.
Comparison of carbon emission between the PPB and PPB with prefabricated foundations.

Figure 11.
Cost of different assembly rates.

Figure 12.
Comparison of cost between the PPB and PPB with prefabricated foundations.


Table 1.
Extended input–output table.
| Output Sectors | Indirect Use | Final Demand | Total Output | ||||||
|---|---|---|---|---|---|---|---|---|---|
| Input Sectors | Sector 1 | Sector 2 | … | Sector n | Consume | Accumulating Capital | Total | ||
| Indirect inputs | Sector 1 | X11 | X12 | … | X1n | II | Y1 | X1 | |
| Sector 2 | X21 | X22 | … | X2n | Y2 | X2 | |||
| … | I | … | … | ||||||
| Sector n | Xn1 | Xn2 | … | Xnn | Yn | Xn | |||
| Value added | V1 | V2 | … | Vn | - | ||||
| Material inputs | Sector 1 | F11 | F12 | … | F1n | N1 | Ff,1 | ||
| Sector 2 | F21 | F22 | … | F2n | N2 | Ff,2 | |||
| … | IV | … | … | ||||||
| Sector n | Fn1 | Fn2 | … | Fnn | Nn | Ff,n | |||
Table 2.
Basic information about the prefabricated building case.
| Application | Levels above Ground | Floor Area (m2) | Building Structure | Total Project Cost (JPY) | Project Cost (JPY/m2) | Foundation Type | Prefabrication Rate of Structure |
|---|---|---|---|---|---|---|---|
| Public buildings | 5 | 33500 | CF | 847.7 × 10⁷ | 20.53 × 10⁵ | Pile | 0.4 |
Table 3.
Material consumption of the prefabricated building case (unit building area).
| Materials | Units | Quantity | Materials | Units | Quantity |
| Reinforcing bar | kg/m2 | 77.53 | SBS waterproof roll | m2/m2 | 0.34 |
| Other steel | kg/m2 | 1.61 | PVC downpipe | m/m2 | 0.05 |
| Shaped steel | kg/m2 | 50.21 | Timber formwork | t/m2 | 6.17 |
| Aluminum | t/m2 | 0.54 | Gypsum board | t/m2 | 12.18 |
| Precast column/beam | m3/m2 | 0.18 | Carpet | m2/m2 | 0.35 |
| Precast slab | m2/m2 | 0.82 | Vinyl tile | m2/m2 | 0.65 |
| Premixed mortar | m3/m2 | 0.02 | Wallpaper | m2/m2 | 0.78 |
| Concrete block | m3/m2 | 0.04 | Door and window | m2/m2 | 0.29 |
| Premixed concrete | m3/m2 | 0.26 | Wood product | m3/m2 | 0.02 |
| Cement | t/m2 | 47.67 | Glass fiber membrane | m2/m2 | 0.08 |
| Polystyrene board (EPS) | m2/m2 | 0.63 | - | - | - |
Table 4.
Assumption of traditional public building (TPB) material consumption.
| Percentage of Material Saving | Steel | Concrete | Timber | Mortar | Heat Insulation | Other Decoration Materials | Energy Consumption |
|---|---|---|---|---|---|---|---|
| PPB | 1 | 1 | 1 | 1 | 1 | 1 | 1 |
| TPB | 1.3 | 1.2 | 1.7 | 1.2 | 1.25 | 1.15 | 1.25 |
© 2020 by the authors. Licensee MDPI, Basel, Switzerland. This article is an open access article distributed under the terms and conditions of the Creative Commons Attribution (CC BY) license (http://creativecommons.org/licenses/by/4.0/).
Share and Cite
MDPI and ACS Style
Wang, H.; Zhang, Y.; Gao, W.; Kuroki, S. Life Cycle Environmental and Cost Performance of Prefabricated Buildings. Sustainability 2020, 12, 2609. https://0-doi-org.brum.beds.ac.uk/10.3390/su12072609
AMA Style
Wang H, Zhang Y, Gao W, Kuroki S. Life Cycle Environmental and Cost Performance of Prefabricated Buildings. Sustainability. 2020; 12(7):2609. https://0-doi-org.brum.beds.ac.uk/10.3390/su12072609
Chicago/Turabian StyleWang, He, Yinqi Zhang, Weijun Gao, and Soichiro Kuroki. 2020. "Life Cycle Environmental and Cost Performance of Prefabricated Buildings" Sustainability 12, no. 7: 2609. https://0-doi-org.brum.beds.ac.uk/10.3390/su12072609
Note that from the first issue of 2016, this journal uses article numbers instead of page numbers. See further details here.