Assessing Urban Risk to Extreme Heat in China


1
College of Urban and Environmental Science, Northwest University, Xi’an 710127, China
2
Shaanxi Key Laboratory of Earth Surface System and Environmental Carrying Capacity, Xi’an 710127, China
*
Author to whom correspondence should be addressed.
Sustainability 2020, 12(7), 2750; https://0-doi-org.brum.beds.ac.uk/10.3390/su12072750
Submission received: 1 March 2020
/
Revised: 23 March 2020
/
Accepted: 25 March 2020
/
Published: 1 April 2020
Abstract
:Many cities are experiencing persistent risk in China due to frequent extreme weather events. Some extreme weather events, such as extreme heat hazard, have seriously threatened human health and socio-economic development in cities. There is an urgent need to measure the degree of extreme heat risk and identify cites with the highest levels of extreme heat risk. In this study, we presented a risk assessment framework of extreme heat and considered risk as a combination of hazard, exposure, and vulnerability. Based on these three dimensions, we selected relevant variables from historical meteorological data (1960–2016) and socioeconomic statistics in 2016, establishing an indicator system of extreme heat risk evaluation. Finally, we developed an extreme heat risk index to quantify the levels of extreme heat risk of 296 prefecture-level cities in China and revealed the spatial pattern of extreme heat risk in China in 2016 and their dominant factors. The results show that (1) cities with high levels of extreme heat hazard are mainly located in the south of China, especially in the southeast of China; (2) the spatial distribution of the extreme heat risk index shows obvious agglomeration characteristics; (3) the spatial distribution of the extreme heat risk is still mostly controlled by natural geographical conditions such as climate and topography; (4) among the four types of hazard-dominated, exposure-dominated, vulnerability-dominated, and low risk cities, the number of vulnerability-dominated cities is the largest. The results of this study can provide support for the risk management of extreme heat disasters and the formation of targeted countermeasures in China.
1. Introduction
In recent years, global climate change has led to a conspicuous increase in the frequency and intensity of extreme weather events, which has posed a serious threat to human well-being [1]. According to the Global Risk Report for four consecutive years from 2017 to 2020, extreme weather events have become the most prominent risk facing the human society [2]. Of all extreme weather events, extreme heat has a high probability of occurrence, a wide range of impact, and a large risk, which have severely affected human health, economic development, and infrastructure. During a record-setting heat wave in Chicago in July 1995, there were at least 700 excess deaths, most of which were classified as heat-related [3]. In summer 2003, a major heat wave occurred in Europe, causing approximately 30,000 deaths, with nearly 15,000 in France [4]. The heat wave that hit California for two weeks in 2006 led to an excess of at least 140 deaths [5]. In 2013, southern China suffered a high temperature event that broke heat records of the past 141 years, which affected 66,600 km2 of crops, and the electricity load reached a record high. Meanwhile, persistent extreme heat caused great economic losses, marking an increase in morbidity and mortality [6]. Studies show a total economic loss of 27.49 billion CNY for Nanjing in 2013 due to the heat wave [7] and 167 excess deaths in Shanghai’s Pudong New Area [8]. Relevant research reports indicate that global extreme heat events will occur more frequently and for longer durations, and the risk to human society will also be more serious in the future [9]. How to mitigate the risk of extreme heat, adapt to future climate change, and establish a climate-safe society have become major realistic challenges facing humanity today.
Risk of extreme heat vary widely due to geographical heterogeneity. How to scientifically measure risk level, assess different characteristics among cities or areas, and identify the leading factors of extreme heat risk are important to provide targeted mitigation and adaptation measures. Previous studies evaluated extreme heat risk based on vulnerability. On the one hand, some scholars use morbidity and mortality data to build multiple models between temperature and heat-associated deaths to assess the population health vulnerability risk caused by extreme heat [10,11,12,13]. Some studies found that extreme heat is only a trigger, the differences in demographic characteristics are a direct factor in mortality [14]. Therefore, the assessment results of these studies mainly reflect the risk differences of different social groups. The elderly, children, and disadvantaged groups are often faced with greater vulnerability and risk [15,16,17]. These studies mainly focus on human health and paid insufficient attention to the hazard themselves. Furthermore, the research scales are usually local, which has difficulty reflecting the geographical heterogeneity. From the perspective of countermeasures, these studies are more directed to the prevention for different groups [18], but it is difficult to provide specific guidance for mitigation and adaptation in different regions.
On the other hand, some scholars developed various heat vulnerability indexes from exposure, sensitivity, and adaptive capacity to assess risk of spatial units in different levels [12,19,20,21], such as census tract [22], neighborhood [23], county [24], and metropolitan area [25]. These studies quantify relative heat risk spatially, which is important for identifying vulnerable units and making corresponding countermeasures. However, the above studies are mainly focused on the micro-scale, while few studies have been conducted on the urban or regional level. In previous researches, variables or indicators of the three dimensions (exposure, sensitivity, and adaptive capacity) not only differed greatly, but also focused too much on socio-economic aspects, and the dynamic analysis of extreme heat hazard was insufficient. In addition, previous studies did not provide a unified framework for vulnerability or risk assessment, which resulted in an ambiguous relationship among the three dimensions and multifarious calculation methods for heat vulnerability indices.
There are three main issues in the study of extreme heat events and their risks in China. The first is spatiotemporal dynamics of extreme heat hazard. Related studies use long-term observed temperature data from meteorological stations to explore the geographical patterns and temporal variations of extreme heat events at the national or regional level in China [26,27,28]. The second is assessing the impacts and potential risks of extreme heat on human health [29,30,31,32], agricultural production [33,34], economic development [7], psychological perception [35], etc. The third is constructing heat vulnerability index or heat risk index by integrating hazard, exposure, sensitivity, and adaptive capacity to assess extreme heat risk at urban or regional level [36,37,38]. Overall, compared with European and American countries, the research on extreme heat risk in China started later and there is still a gap with international academics. Furthermore, existing researches mainly focus on the field of health vulnerability, but studies on measurement and assessment of extreme heat risk at different spatial units are obviously insufficient.
Based on the present situation, this research aims to (1) develop a risk analysis framework of extreme heat from three dimensions including hazard, exposure, and vulnerability, and select corresponding indicators based on these dimensions to construct a risk assessment index; (2) quantify the extreme heat hazard and vulnerability, and depict the spatiotemporal characteristics of extreme heat hazard and distribution of vulnerability for Chinese cities, respectively; and (3) reveal risk pattern of extreme heat in Chinese cities, identify the leading factors of extreme heat risk in each city, and divide different types of risk zones.
2. Material and Methods
2.1. Risk Assessment Framework of Extreme Heat
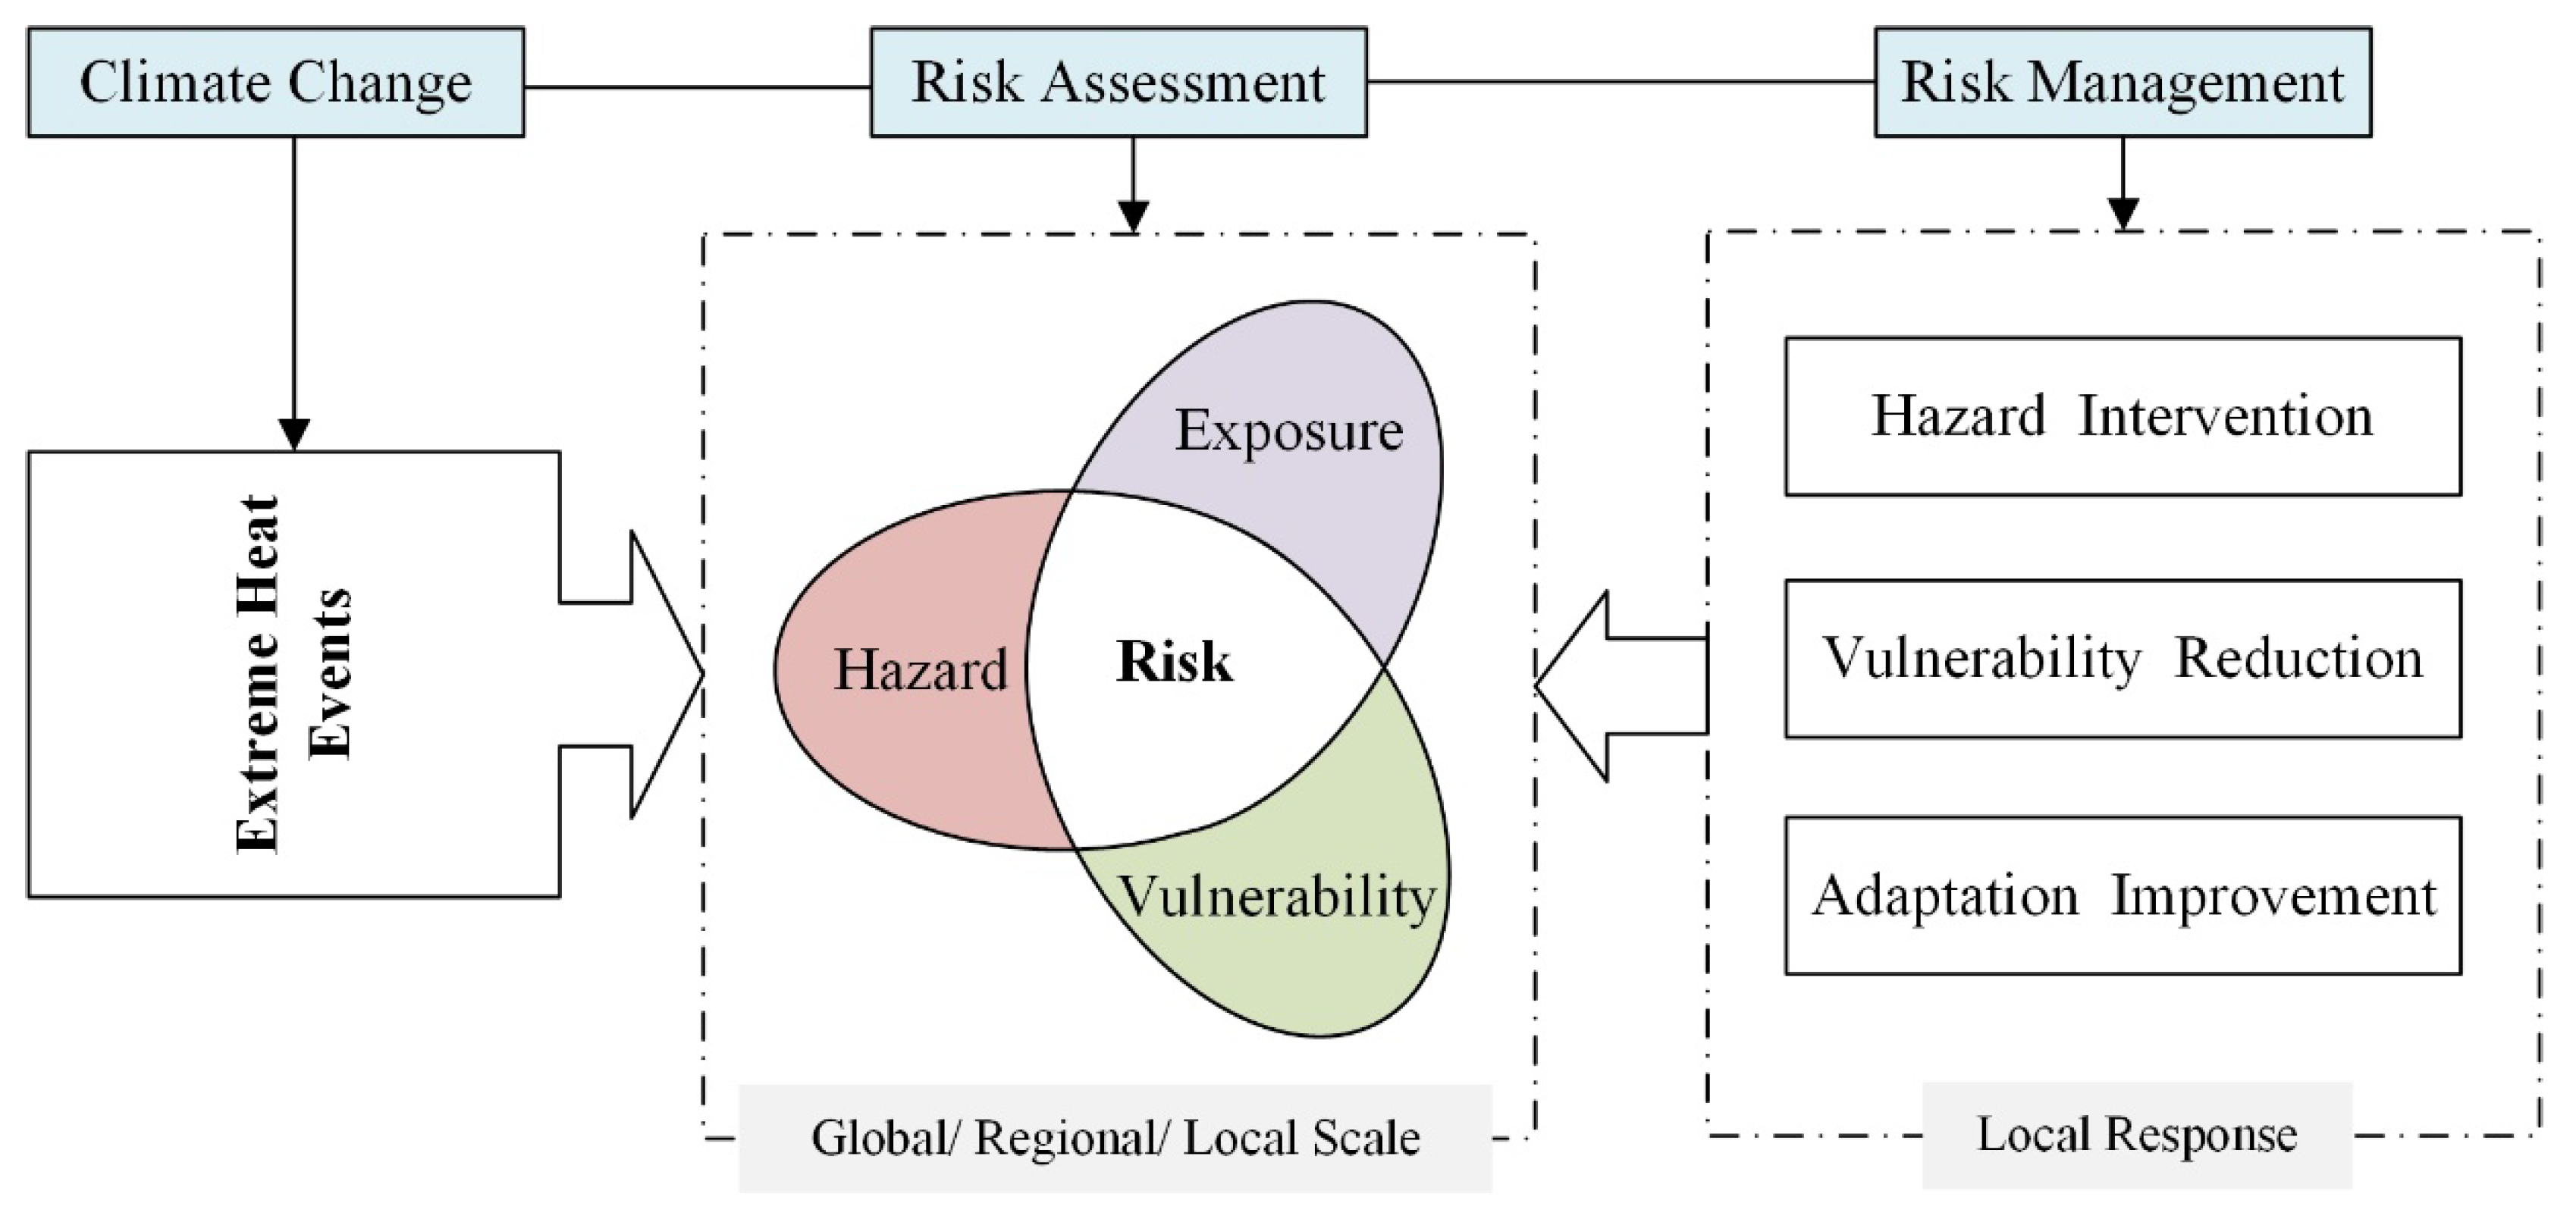
Risk is often represented as probability of occurrence of hazardous events or trends multiplied by the impacts if these events or trends occurring [39]. The IPCC’s (Intergovernmental Panel on Climate Change) fifth assessment report provides a climate-related analysis framework for risk. This framework describes risk as a comprehensive function of hazard, exposure, and vulnerability, and believes that risk results from the interaction of these three dimensions. As a typical extreme weather disaster, IPCC’s risk framework can be applied to analyze extreme heat events. Therefore, we built the Risk Assessment Framework of Extreme Heat (RAFEH) based on the risk framework of IPCC. In this framework (Figure 1), extreme heat risk is composed of the three dimensions of heat hazard, exposure, and vulnerability. In this paper, heat hazard refers to extreme heat events and their direct and indirect impacts on health, livelihoods, infrastructure, service provision, etc. Exposure is whether human social systems, subsystems, or components could be adversely affected by disaster. It can be understood as the proximity of people or systems to extreme heat hazard. Vulnerability encompasses a variety of concepts and elements including sensitivity or susceptibility to harm and lack of capacity to cope and adapt [39]. Vulnerability reflects the predisposition of evaluation units to be adversely affected by extreme heat, which can be determined by the sensitivity and adaptive capacity. Based on the framework, we selected a series of indicators from hazard, exposure, and vulnerability to assess the risk level of extreme heat in major cities of China.
2.1.1. Variables for Extreme Heat Hazard
The degree of hazard depends on the physical attributes of the disaster event [40]. In this paper, we attempted to examine the spatial-temporal changes in physical attributes of extreme heat as a hazard factor. According to the China Meteorological Administration, a hot day is defined as a day when the daily maximum temperature reaches or exceeds 35 °C. If this lasts three days or more, this is called a heat wave event. In this study, we adopted the above definitions to identify hot days and heat wave events in Chinese cities from 1960 to 2016. Furthermore, we defined five variables to describe the characteristics of urban extreme heat hazard in China (Table 1). Hot days (HDs) refer to the days with the daily maximum temperature (DMT) ≥ 35 °C. Heat intensity (HI) is the average of the daily maximum temperature for all hot days. Heat wave frequency (HWF) describes the number of heat wave events occurring in a given time. Heat wave duration (HWD) is the sum of the days in the heat wave’s length in days. Heat wave intensity (HWI) refers to the cumulative value of the daily maximum temperature exceeding the threshold (35 °C) during the heat wave events.
2.1.2. Variables for Extreme Heat Exposure
Exposure describes to what extent humans, natural assets, or material goods are located in places endangered by climatic changes and their consequences [41]. Some approaches use the exposed population or area as a variable for the risk analysis [42,43,44]. In terms of urban extreme heat exposure, it is clear that cities with large population or high-density population are relatively more likely to be affected by extreme heat hazard. Therefore, we selected the total population and population density to measure the extreme heat exposure of the city.
2.1.3. Variables for Extreme Heat Vulnerability
Vulnerability is a measure of both the sensitivity of a population to natural hazard and its ability to respond to and recover from the impacts of hazard [45]. According to the RAFEH mentioned above, we considered vulnerability as a combination of sensitivity and adaptive capacity, and selected corresponding variables from these two dimensions to construct vulnerability indicators (Table 1).
In terms of extreme heat sensitivity, the more sensitive groups are the elderly and children. Many studies have shown that children and the elderly have higher morbidity and mortality in extreme hot weather [5,10,16,46]. Therefore, we selected the proportion of the population under 5 years old and over 65 years old as two sensitivity variables. In addition, the increase of urban building density and impervious surface area caused by urbanization can significantly alter the surface energy budget and leads to higher temperature than rural areas, namely the urban heat island effect [47,48]. Warmer air caused by the urban heat island increases heat load stress of urban residents, potentially raising the threat of mortality [49]. This means that residents living in cities suffer from higher risk of extreme heat [50]. Hence, the proportion of urban population was also used as one of the sensitivity indicators.
Adaptive capacity is the general ability of institutions, systems, and individuals to adjust to potential harm, to take advantage of opportunities, or to cope with the consequences of climate variability and change [51]. In terms of adaptive capacity to extreme heat, it is used to depict ability of a city to respond or adapt to extreme heat hazard. It can be measured by some variables such as the economic level, medical resources, cooling facilities, and information acquisition capabilities, etc. In this study, we selected six variables to examine urban adaptive capacity to extreme heat hazard (Table 1). Economic level reflects the economic ability of a city to cope with extreme heat hazard. Educational level indicates the risk perception level of urban resident to extreme heat hazard. Medical level measures the health protection resources of a city. Information level describes the ability to obtain warning information of extreme heat hazard. Water and green space have the effect of mitigating extreme heat risk, which reflect the city’s ability to cope with extreme heat hazard.
2.2. Data Source and Processing
2.2.1. Data Source
In view of the availability of research data, in this paper, the objects of risk assessment to extreme heat were 296 prefecture-level cities in the China City Statistical Yearbook. The Hong Kong Special Administrative Region of China, the Macao Special Administrative Region of China, and Taiwan Province, as well as autonomous prefectures or leagues of some minority nationality areas were outside the scope of this study.
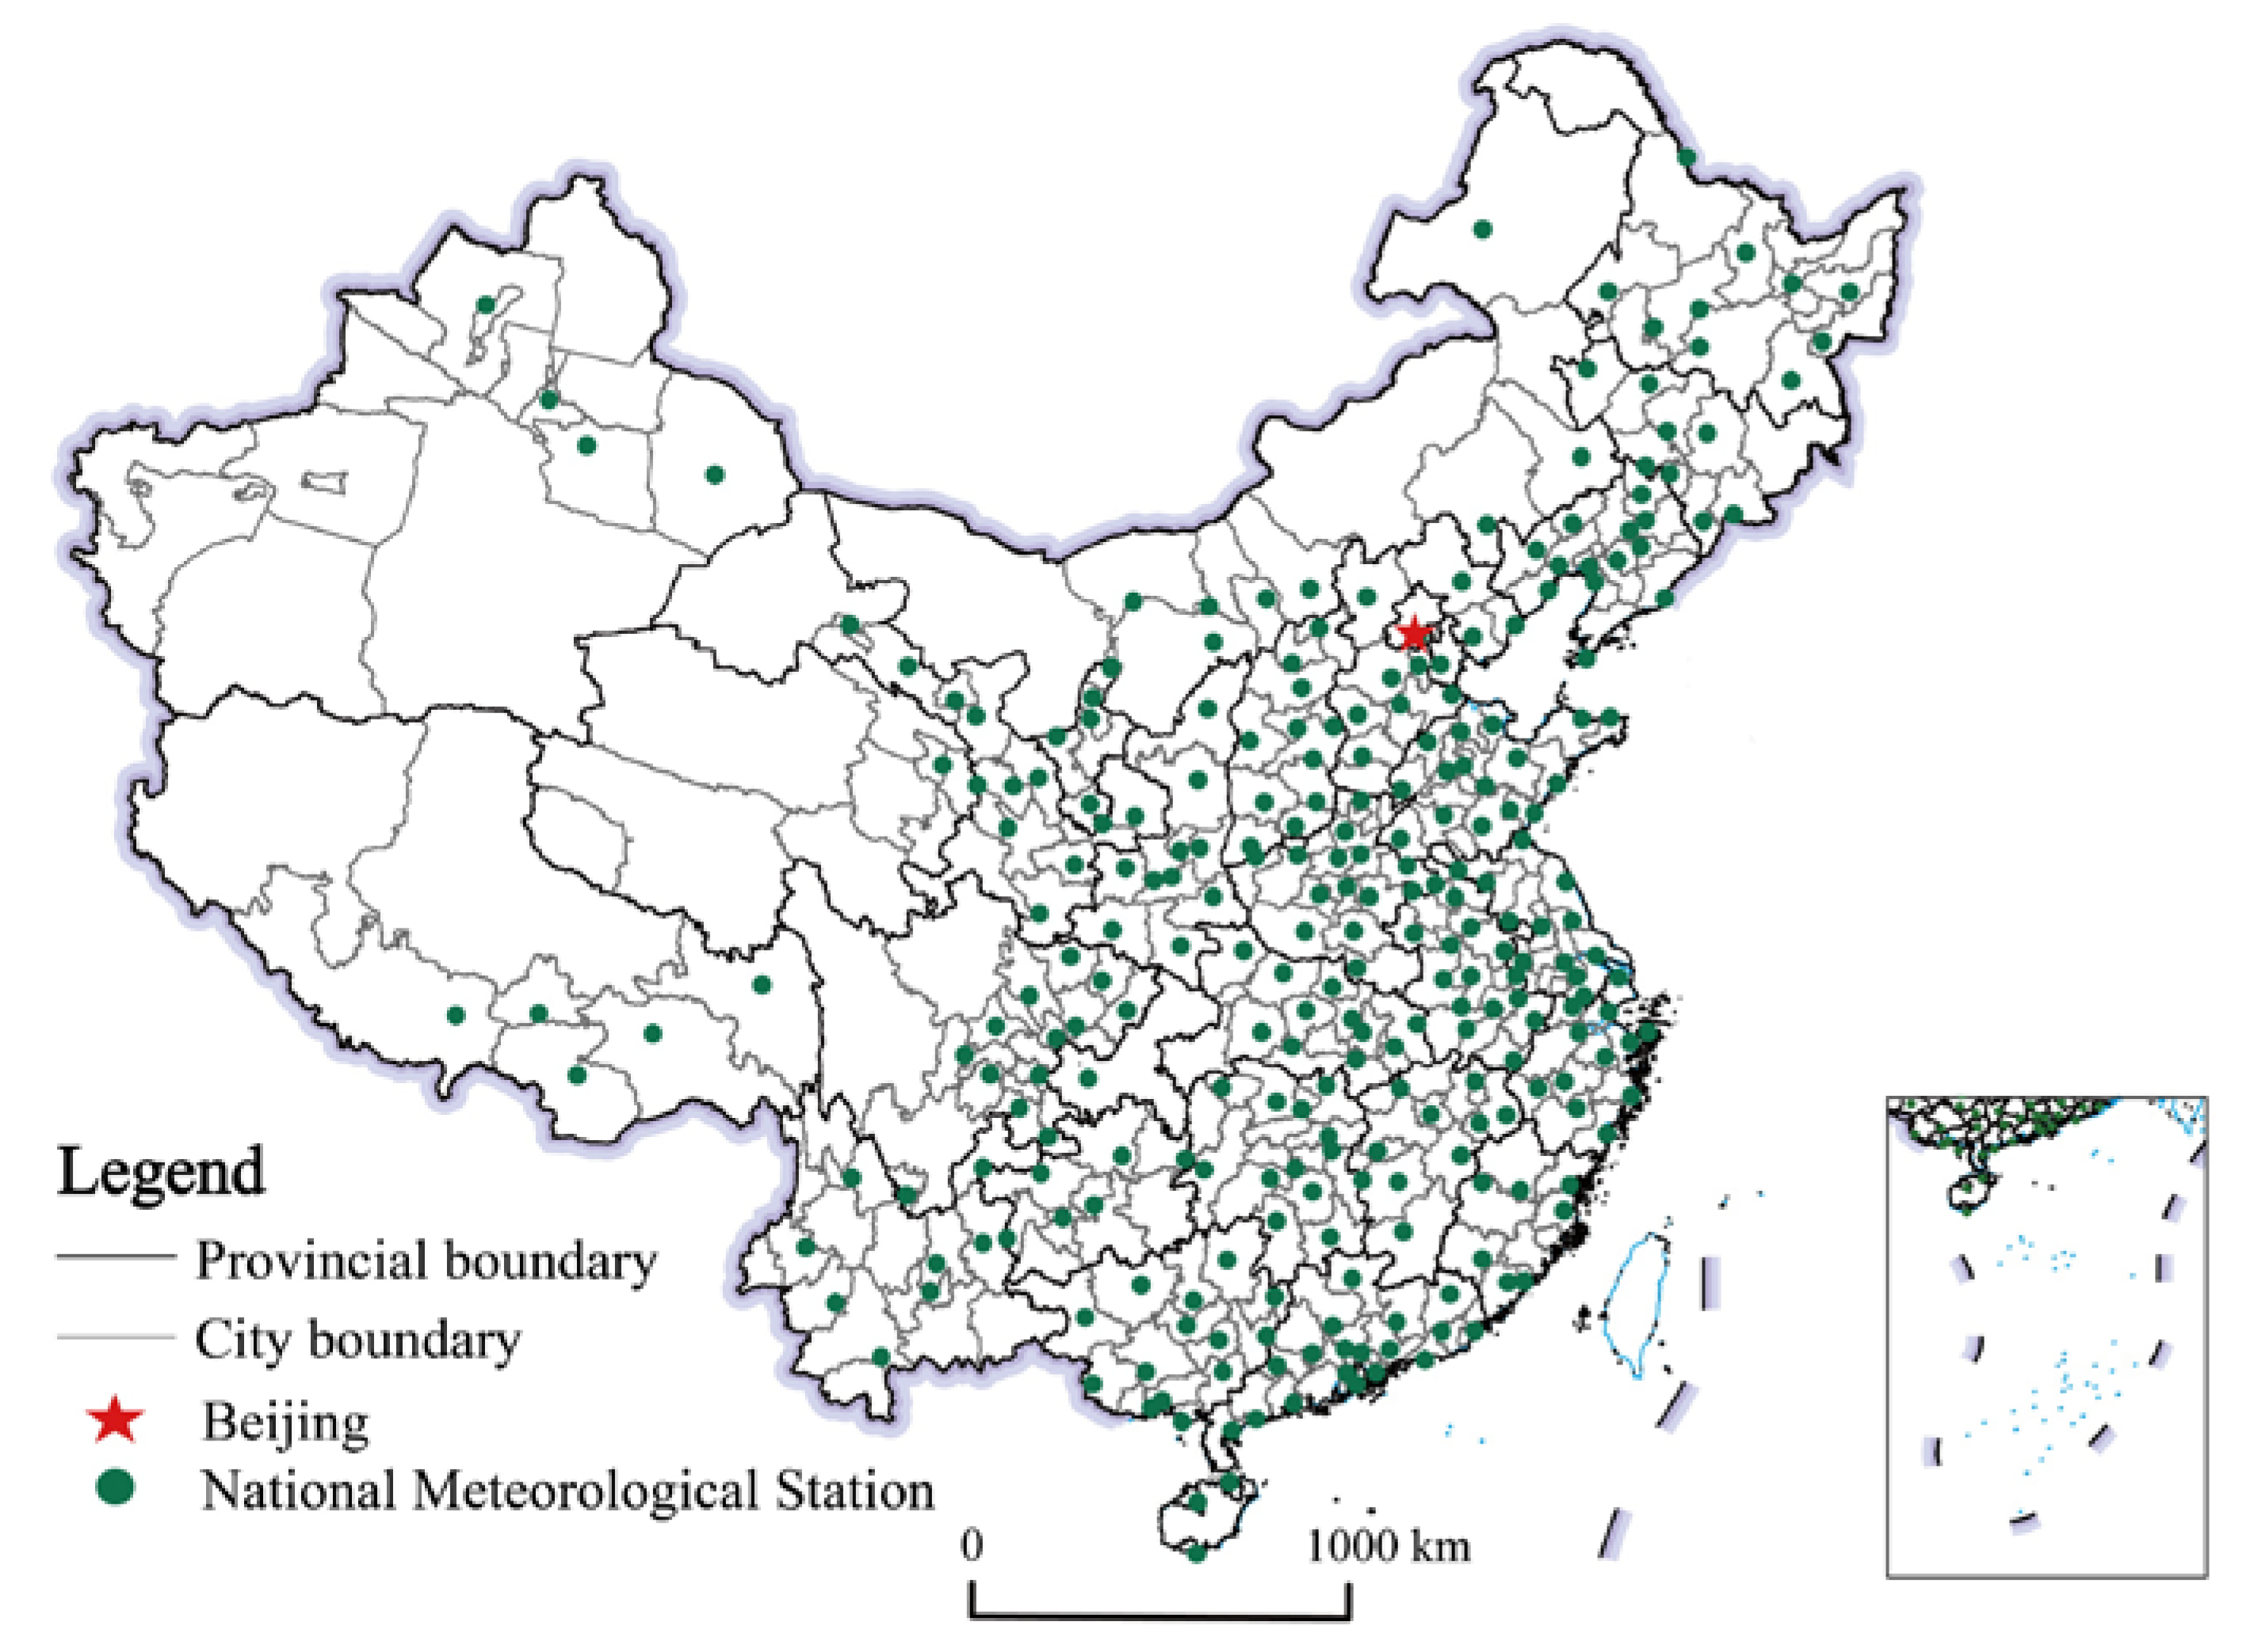
The temperature data used for the analysis of extreme heat hazard in this paper were from the dataset of daily climate data from Chinese surface stations for global exchange (V3.0) on the China Meteorological Data Service Center (http://data.cma.cn/en). We selected a national meteorological station in each city and collected daily maximum temperature data from 1960 to 2016. Because there are no national meteorological stations in 23 cities, or part of the annual data is missing, we used national meteorological stations data from adjacent cities to replace them. Finally, the daily maximum temperature data of 273 national meteorological stations from 1960 to 2016 were collected (Figure 2). The socioeconomic statistical data used for the analysis of exposure and vulnerability were derived from China City Statistical Yearbook (2017), the Sixth National Census of China (2010), and the statistical yearbooks of each city.
2.2.2. Data Processing
In view of different scales and magnitudes of the variables in Table 1, a standardization of the initial value was required. This was undertaken using the method in Equation (1):
where Yij is the standardized value of the indicator; xij is the original value of the indicator; xjmin and xjmax are the minimum and maximum value of each indicator, respectively; i is the number of the city; and j is the serial number of the indicator. (i=1, 2, … m; j=1, 2, … n).
Entropy is a common objective weighting method. It reflects the importance of indicators by calculating the difference between the numerical values of the objective indicators [52]. Compared with the subjective weighting method, the weights obtained through entropy have higher reliability and accuracy [53]. Therefore, the entropy method was applied to calculate the weight of each indicator. The calculation steps of this method are as follows:
Step 1: Calculate the proportion of indicators
where Pij represents the proportion of i city in the j indicator; Yij is the standardized value of the indicator.
Step 2: Calculate the entropy value
where ej represents the entropy of indicator j.
The extreme heat risk index (EHRI) was developed based on risk assessment framework mentioned above. The EHRI was calculated as a combination of hazard, exposure, and vulnerability. Within the model, separated quantifications of hazard index, exposure index, and vulnerability index were given to determine variations in extreme heat risk levels. Compared with addition and subtraction, multiplication and division could express the synergistic relationship among various indexes more effectively [36,54]. Therefore, the EHRI value was calculated using a multiplicative model described by Equation (5):
where HIi is the hazard index in city i, EIi is the exposure index in city i, and VIi corresponds to the vulnerability index of city i. HIi and EIi were calculated using a weighted summation method. VIi was calculated by sensitivity index and adaptive capacity index. As mentioned above, sensitivity has a positive effect on the vulnerability, while adaptive capacity has a negative effect on the vulnerability. Therefore, the VIi is calculated using the ratio of SIi to AIi. The VIi is in proportion to SIi, and in contrast to AIi. SIi and AIi were also calculated using a weighted summation method. After calculating HIi, EIi, and VIi and normalizing each to a scale of 0 to 1, the final EHRI value was calculated and obtained using Equation (5).
3. Results
3.1. Extreme Heat Hazard
3.1.1. Extreme Heat Characteristics
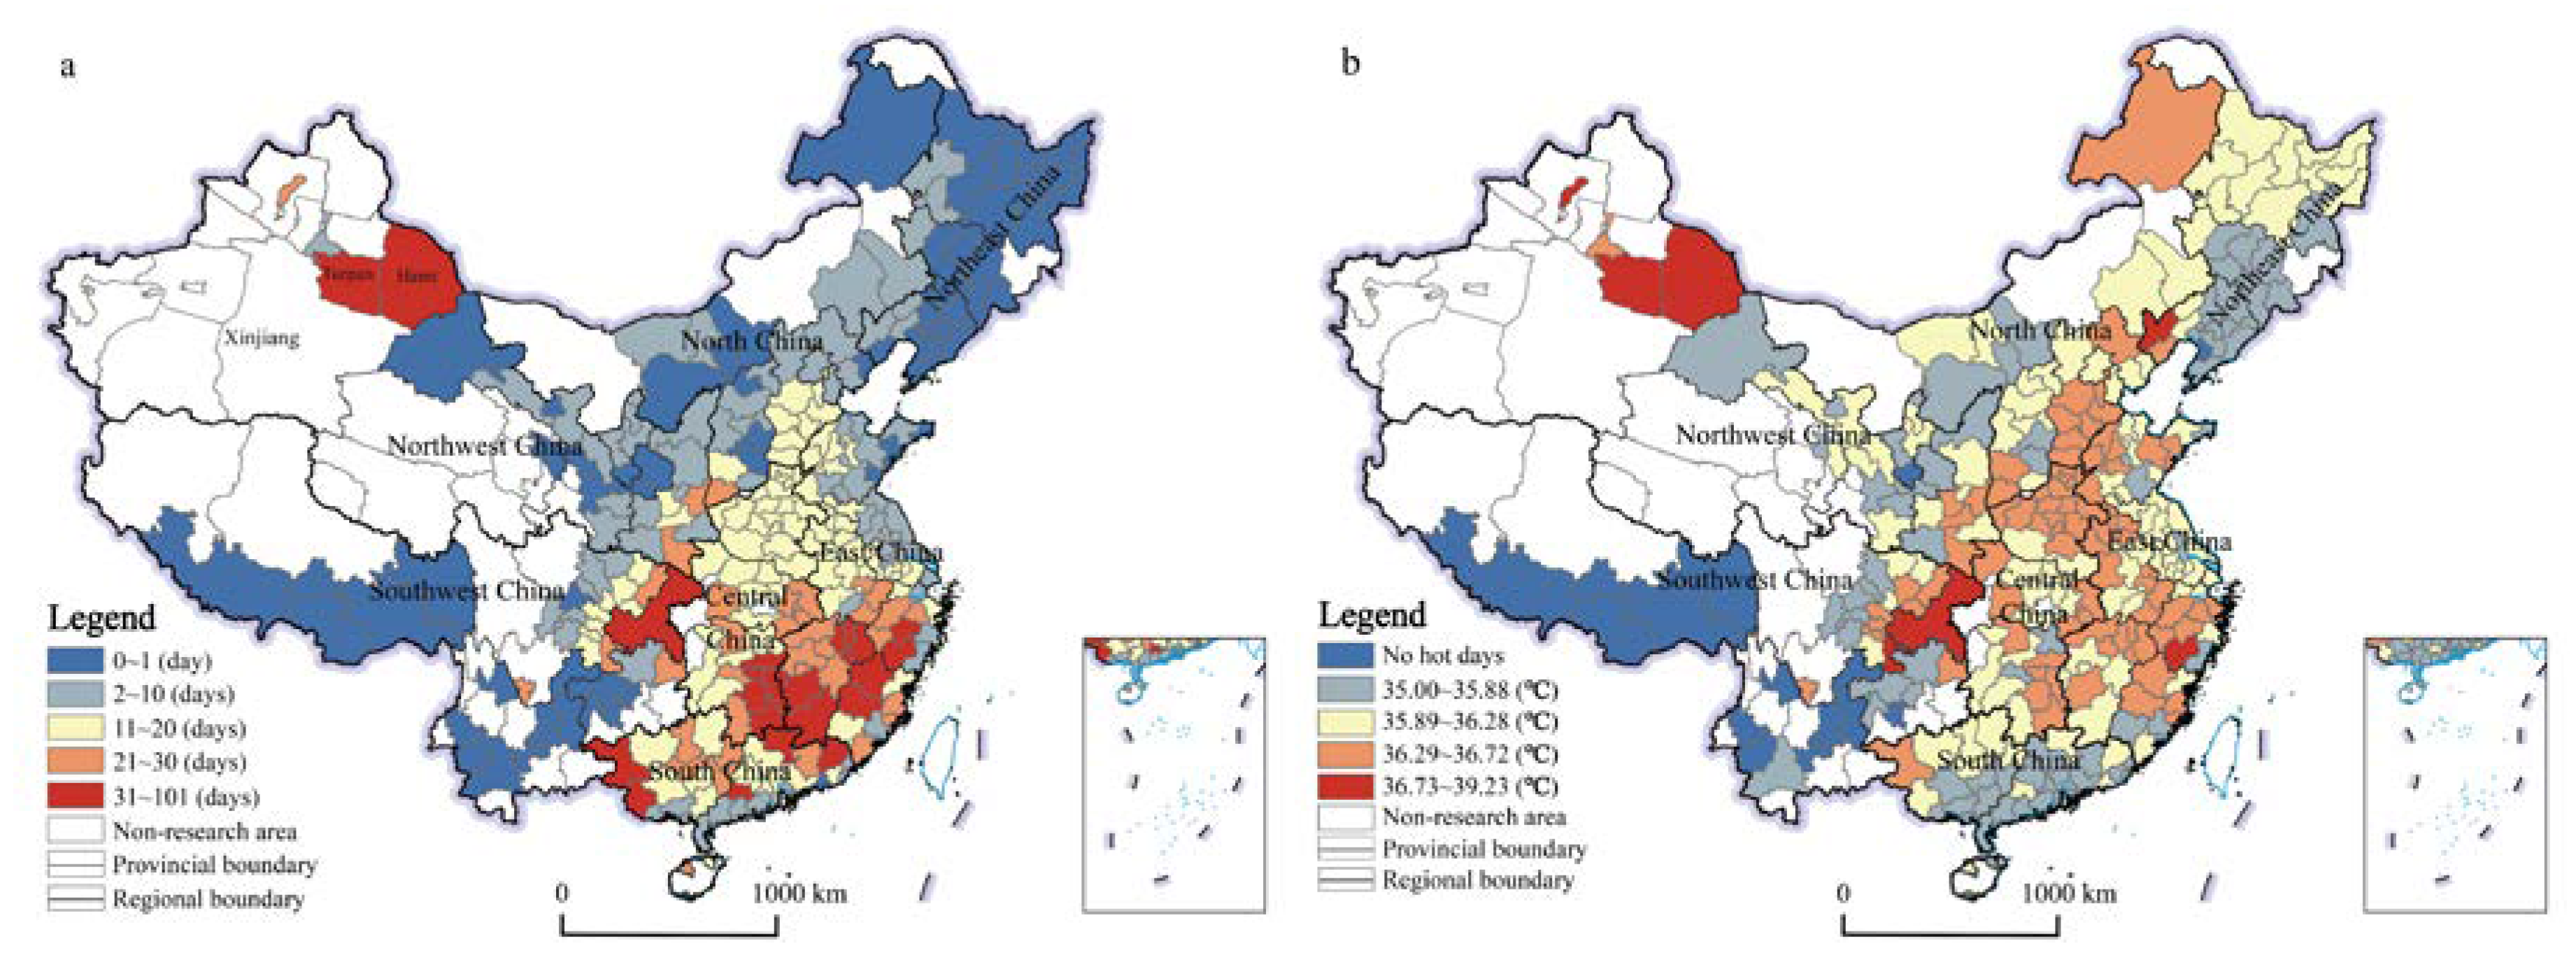
According to the five variables of extreme heat hazard, the HDs, HI, HWF, HWD, and HWI were identified and counted in 296 cities in China from 1960 to 2016. The resulting values of each variable were grouped into five categories using natural breaks method to show the characteristics and spatial distributions of extreme heat variables at the prefecture-level city in ArcGIS software. Natural breaks method is a standard classification method in ArcGIS. Natural breaks classes are based on natural groupings inherent in the data. Class breaks are identified that best group similar values and that maximize the differences between classes. Figure 3a shows that the annual average HDs in 23 cities exceed 30 days, and the annual average HDs in 38 cities range from 20 to 30 days. The spatial distribution shows that, except for Hami and Turpan of Xinjiang Uygur Autonomous Region in the north of China, higher HDs values are mainly located in the south of China, especially in western East China, eastern Central China, and South China. In terms of annual average HI, seven cities present the highest HI values, and these cities are more spatially dispersed (Figure 3b). In addition, it can be found that although the annual average HDs in the north of China are less than that in the south of China, the HI values in the north of China are generally higher than in the south.
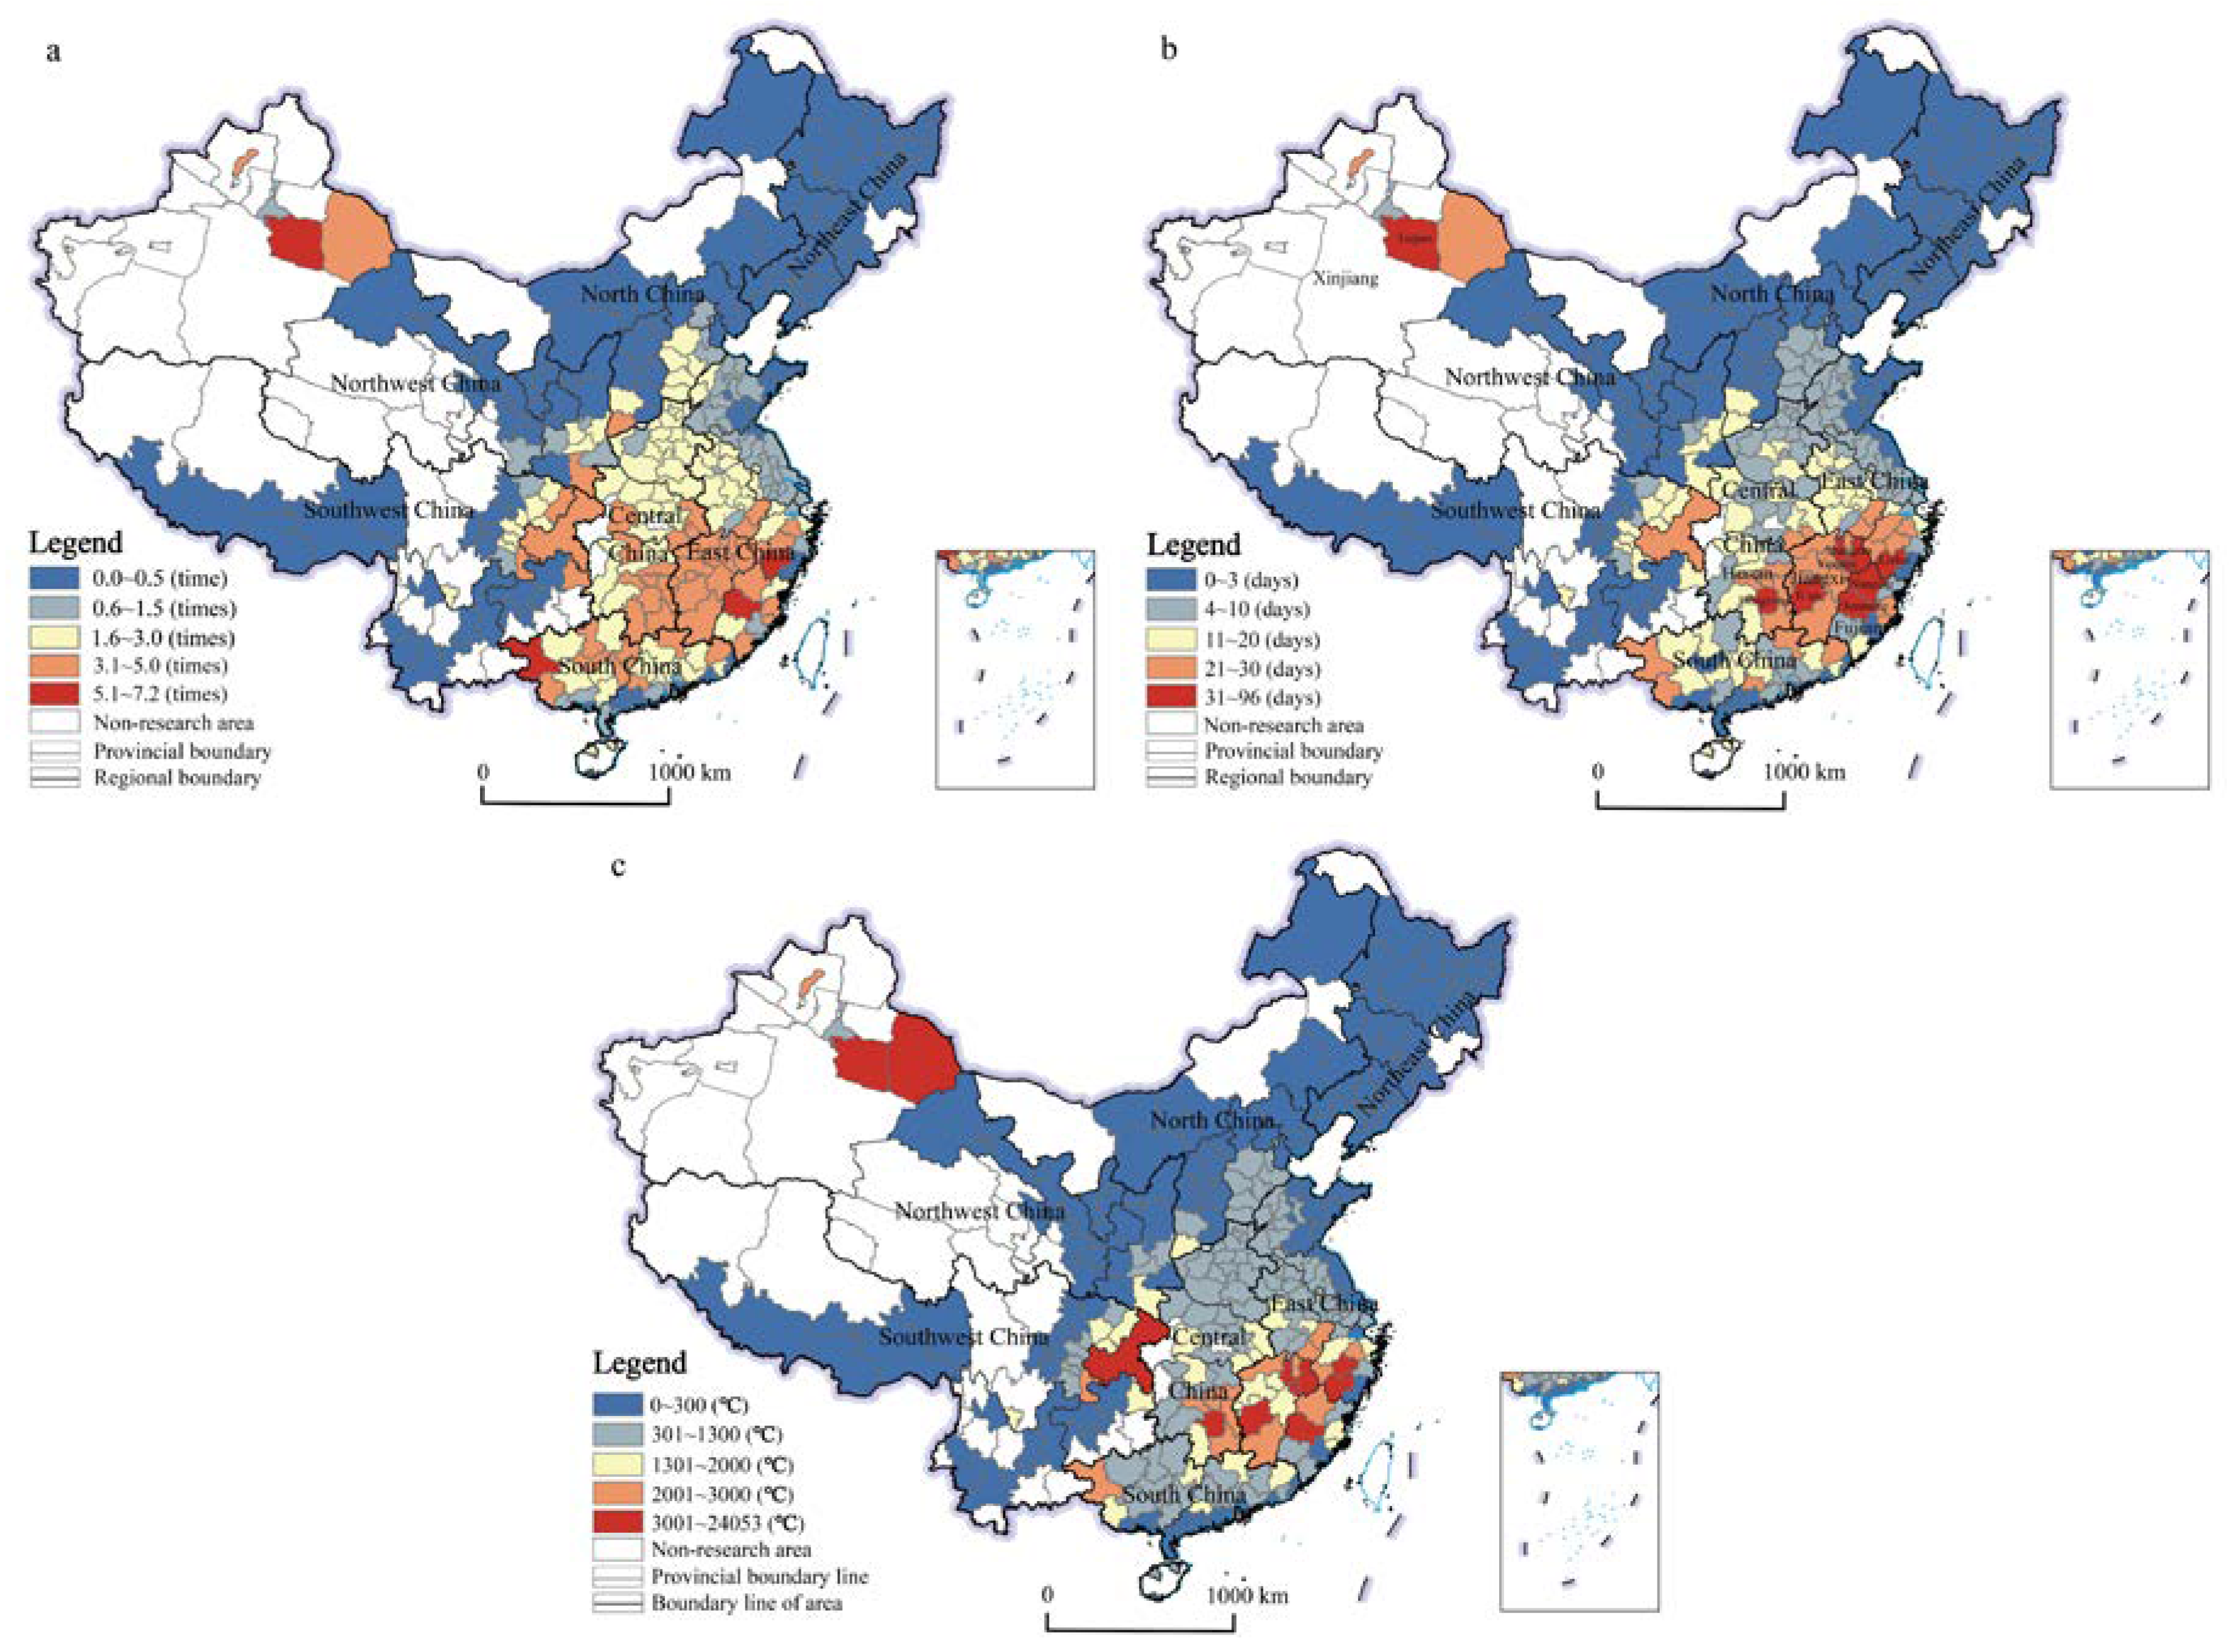
Figure 4a shows that the annual average HWF in 54 cities exceed three times. Among the 54 cities, there are 20 cities with annual average HWF exceeding four times, and four cities exceeding five times. Higher HWF values are mainly concentrated in the south of China, especially in southern East China and eastern Central China. In the north of China, heat wave events mainly occurred in southern North China. Figure 4b shows that the annual average HWD in 39 cities exceed 20 days, of which eight cities present the highest HWD values exceeding 30 days. Turpan has the highest annual average HWD value with 96 days, followed by Lishui (Zhejiang province), Sanming (Fujian province), Yingtan (Jiangxi province), Shangrao (Jiangxi province), Nanping (Fujian province), Hengyang (Hunan province), and Ji’an (Jiangxi province). These cities are mainly concentrated in southern East China. Figure 4c shows that the cumulative HWI values in 26 cities exceed 2000 °C from 1960 to 2016, of which 10 cities present the highest cumulative HWI values exceeding 3000 °C.
Among all cities in China, Turpan has the largest values of HDs, HI, HWF, HWD, and HWI. There are two main reasons: (1) The climate type in the northwest of China is temperate continental desert climate with large evaporation and very little rainfall; (2) the topography of Turpan is a basin at an altitude of –155 m, which is the lowest place in China. Turpan city is surrounded by mountains, and the heat generated by subtropical high pressure cannot be dissipated.
3.1.2. Spatial Pattern of Extreme Heat Hazard
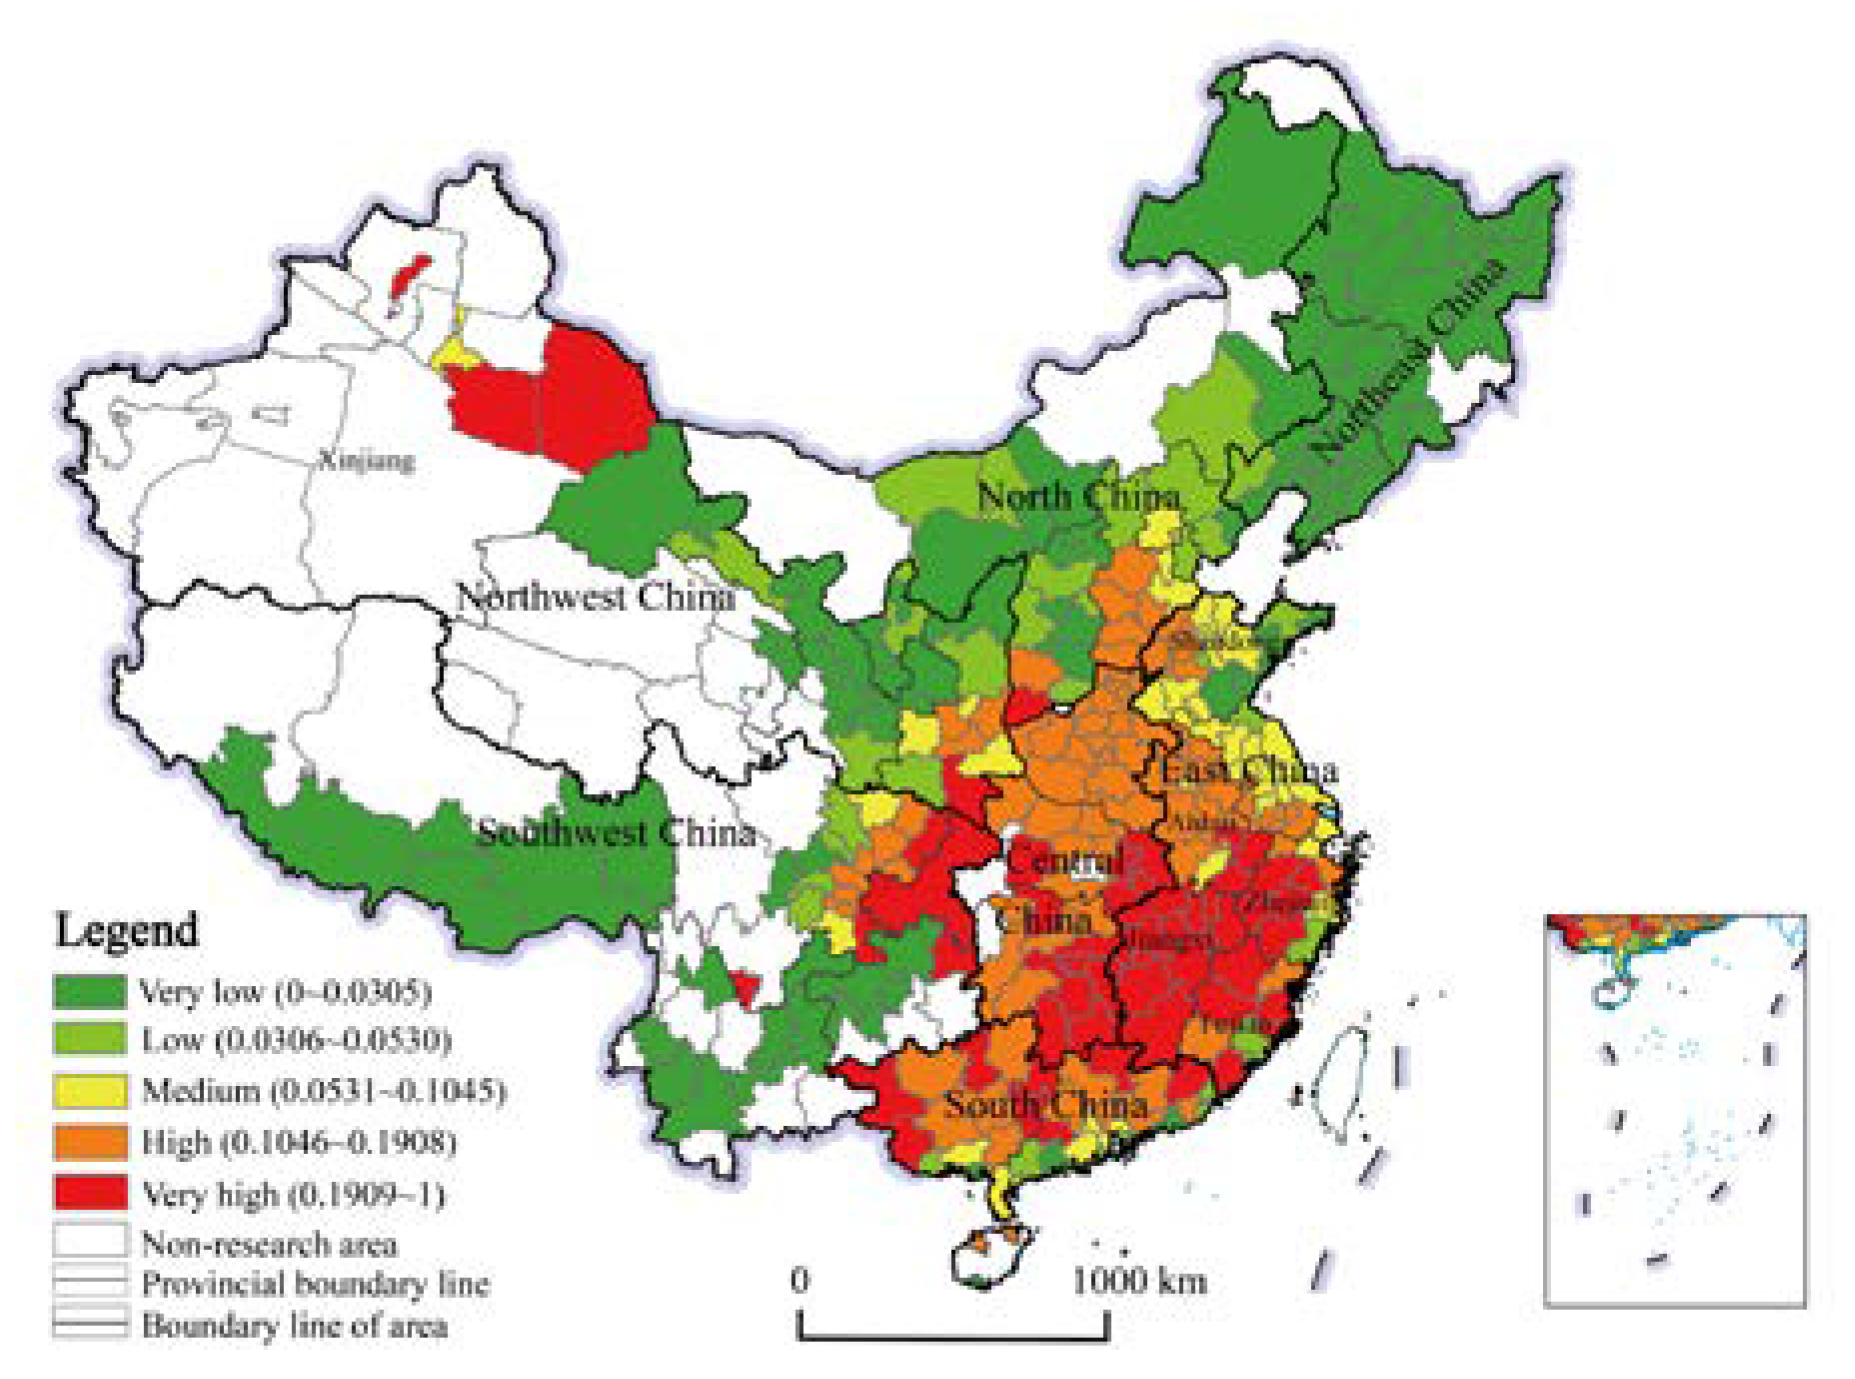
In order to reveal the spatial pattern of extreme heat hazard of China’s cities, the extreme heat hazard index of each city was calculated using a weighted summation method based on the annual average values of HDs, HI, HWF, HWD, and HWI of each city from 1960 to 2016. The values of hazard index were grouped into five categories using the natural breaks method in ArcGIS software. The results are shown in Figure 5. Very high values (0.1909~1) of hazard index were found in 56 cities located in southern East China, southeastern Central China, northeastern Southwest China, and Xinjiang, such as the whole Jiangxi province, inland areas of Fujian province (e.g., Sanming, Nanping, Fuzhou, Putian), southwestern Zhejiang province (e.g., Lishui, Jinhua, Hangzhou, Quzhou), southern Anhui province (e.g., Wuhu, Xuancheng, Huangshan), etc. Overall, the cities with the highest levels of hazard index are mainly distributed in the south of China, while there are relatively few cities in the north of China. High values (0.1046~0.1908) of hazard index were found in 82 cities concentrated in inland China and South China. Medium values (0.0531~0.1045) of hazard index were found in 34 cities concentrated in eastern North China and coastal areas of East China. Lower values (0~0.0530) of hazard index were found in 124 cities located in Northeast China, northern North China, Southwest China, Northwest China, and Shandong Peninsula.
3.2. Extreme Heat Exposure and Vulnerability
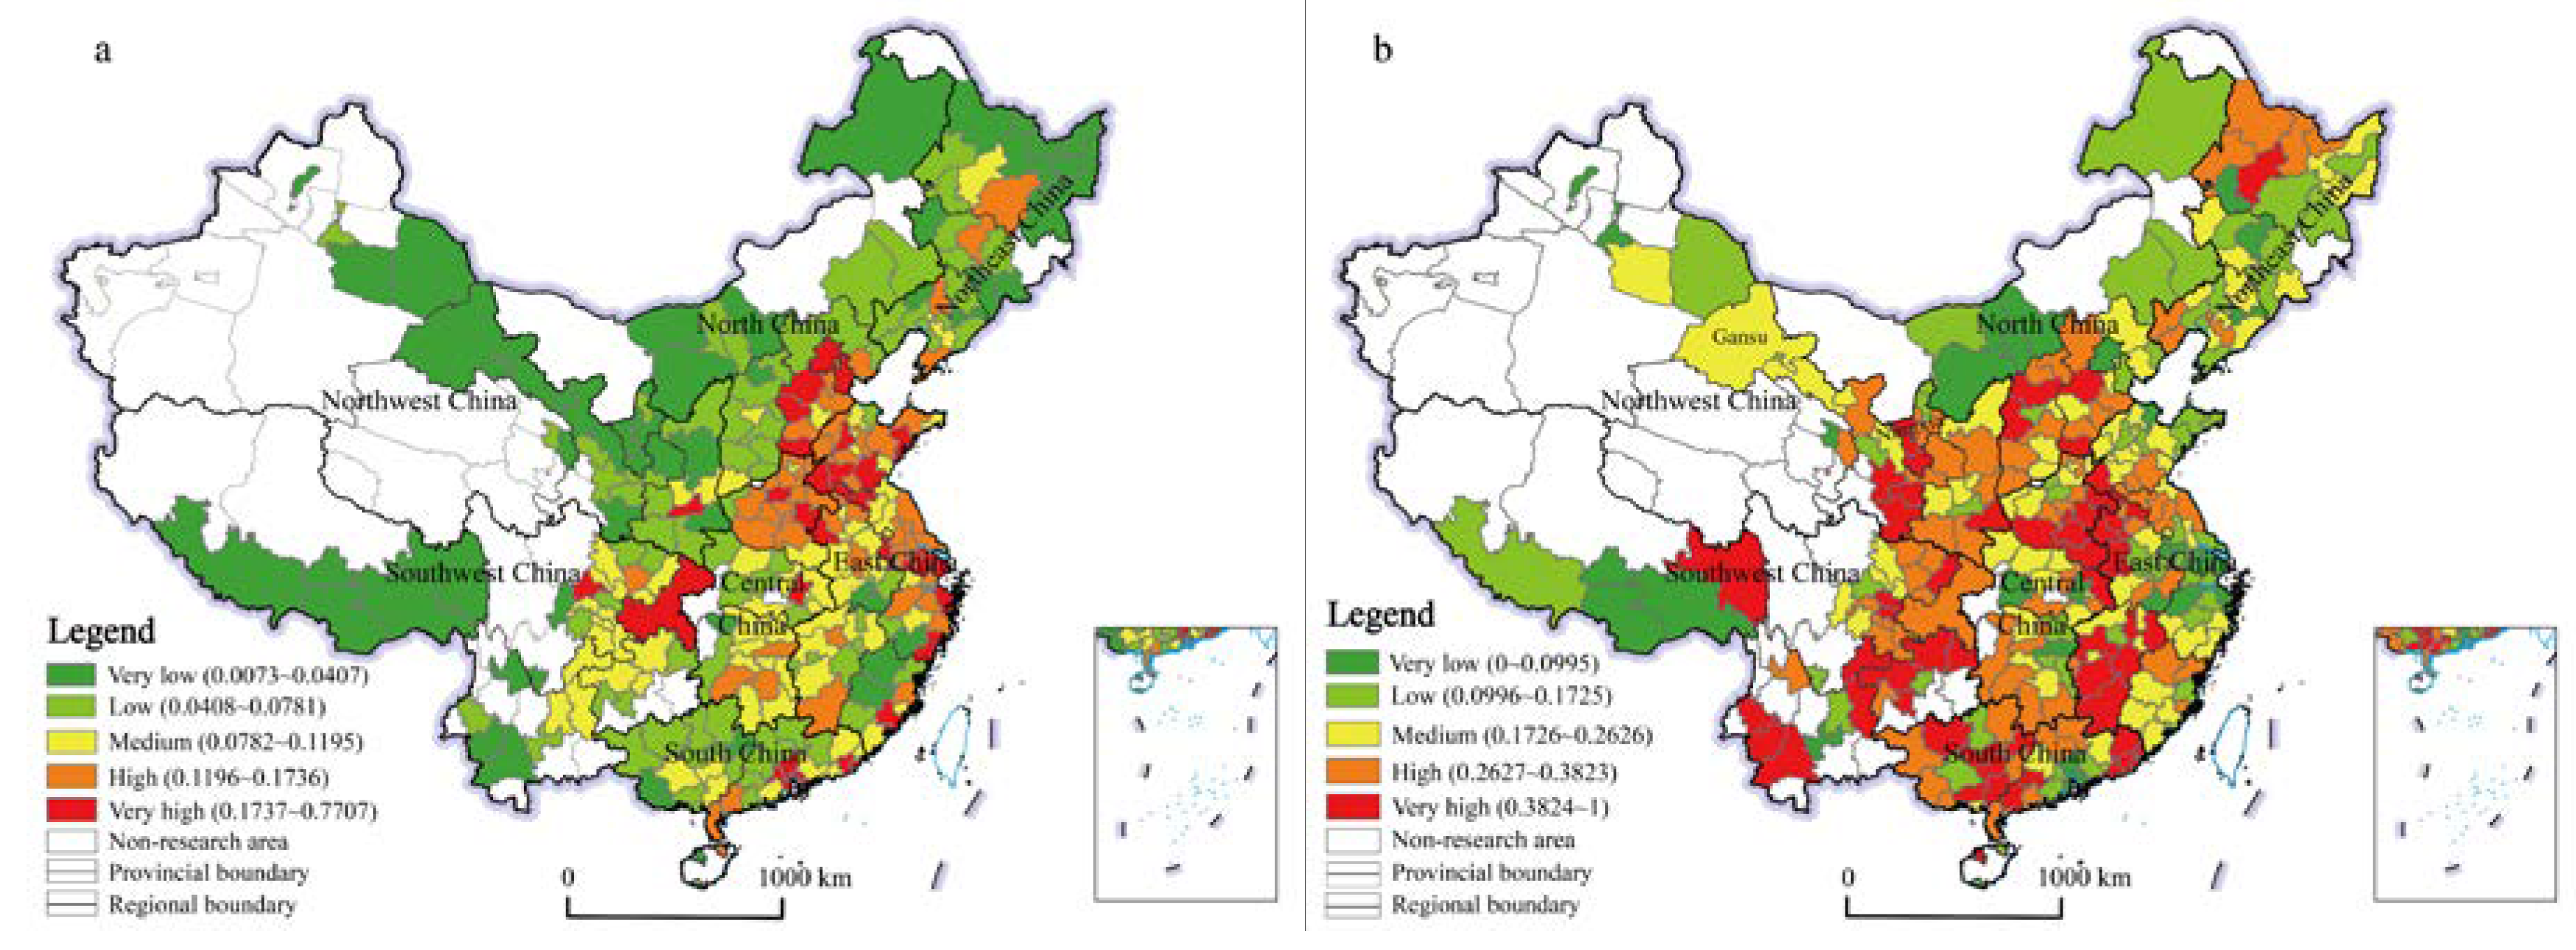
The extreme heat exposure index was calculated using a weighted summation method based on total population and population density of each city in 2016. The values of exposure index were grouped into five categories using natural breaks method in ArcGIS software. The results are shown in Figure 6a.
After calculating the urban sensitivity index and adaptive capacity index, vulnerability index of extreme heat was calculated using Equation (5). The values of vulnerability index were grouped into five categories using natural breaks method in ArcGIS software. The results show that the spatial distribution of the urban vulnerability index is relatively scattered (Figure 6b). Very high values (0.3824~1) of vulnerability index were found in 57 cities located in western East China, northeastern Central China, central, southern, and eastern Southwest China, central and eastern South China, eastern Gansu province, western Ningxia province, and other cities in North China. High values (0.2627~0.3823) of vulnerability index were found in 71 cities concentrated in eastern Northwest China, southern North China, northern and central East China, south of Central China, northeastern Southwest China, northeastern South China. Medium values (0.1726~0.2626) of vulnerability index were found in 74 cities concentrated in Central China, Northwest China, East China, and Northeast China. Lower values (0~0.1725) of vulnerability index were found in 94 cities located in central and northern coastal areas of Eastern China, Northeastern China, North China, and Southwest China.
3.3. Urban Extreme Heat Risk
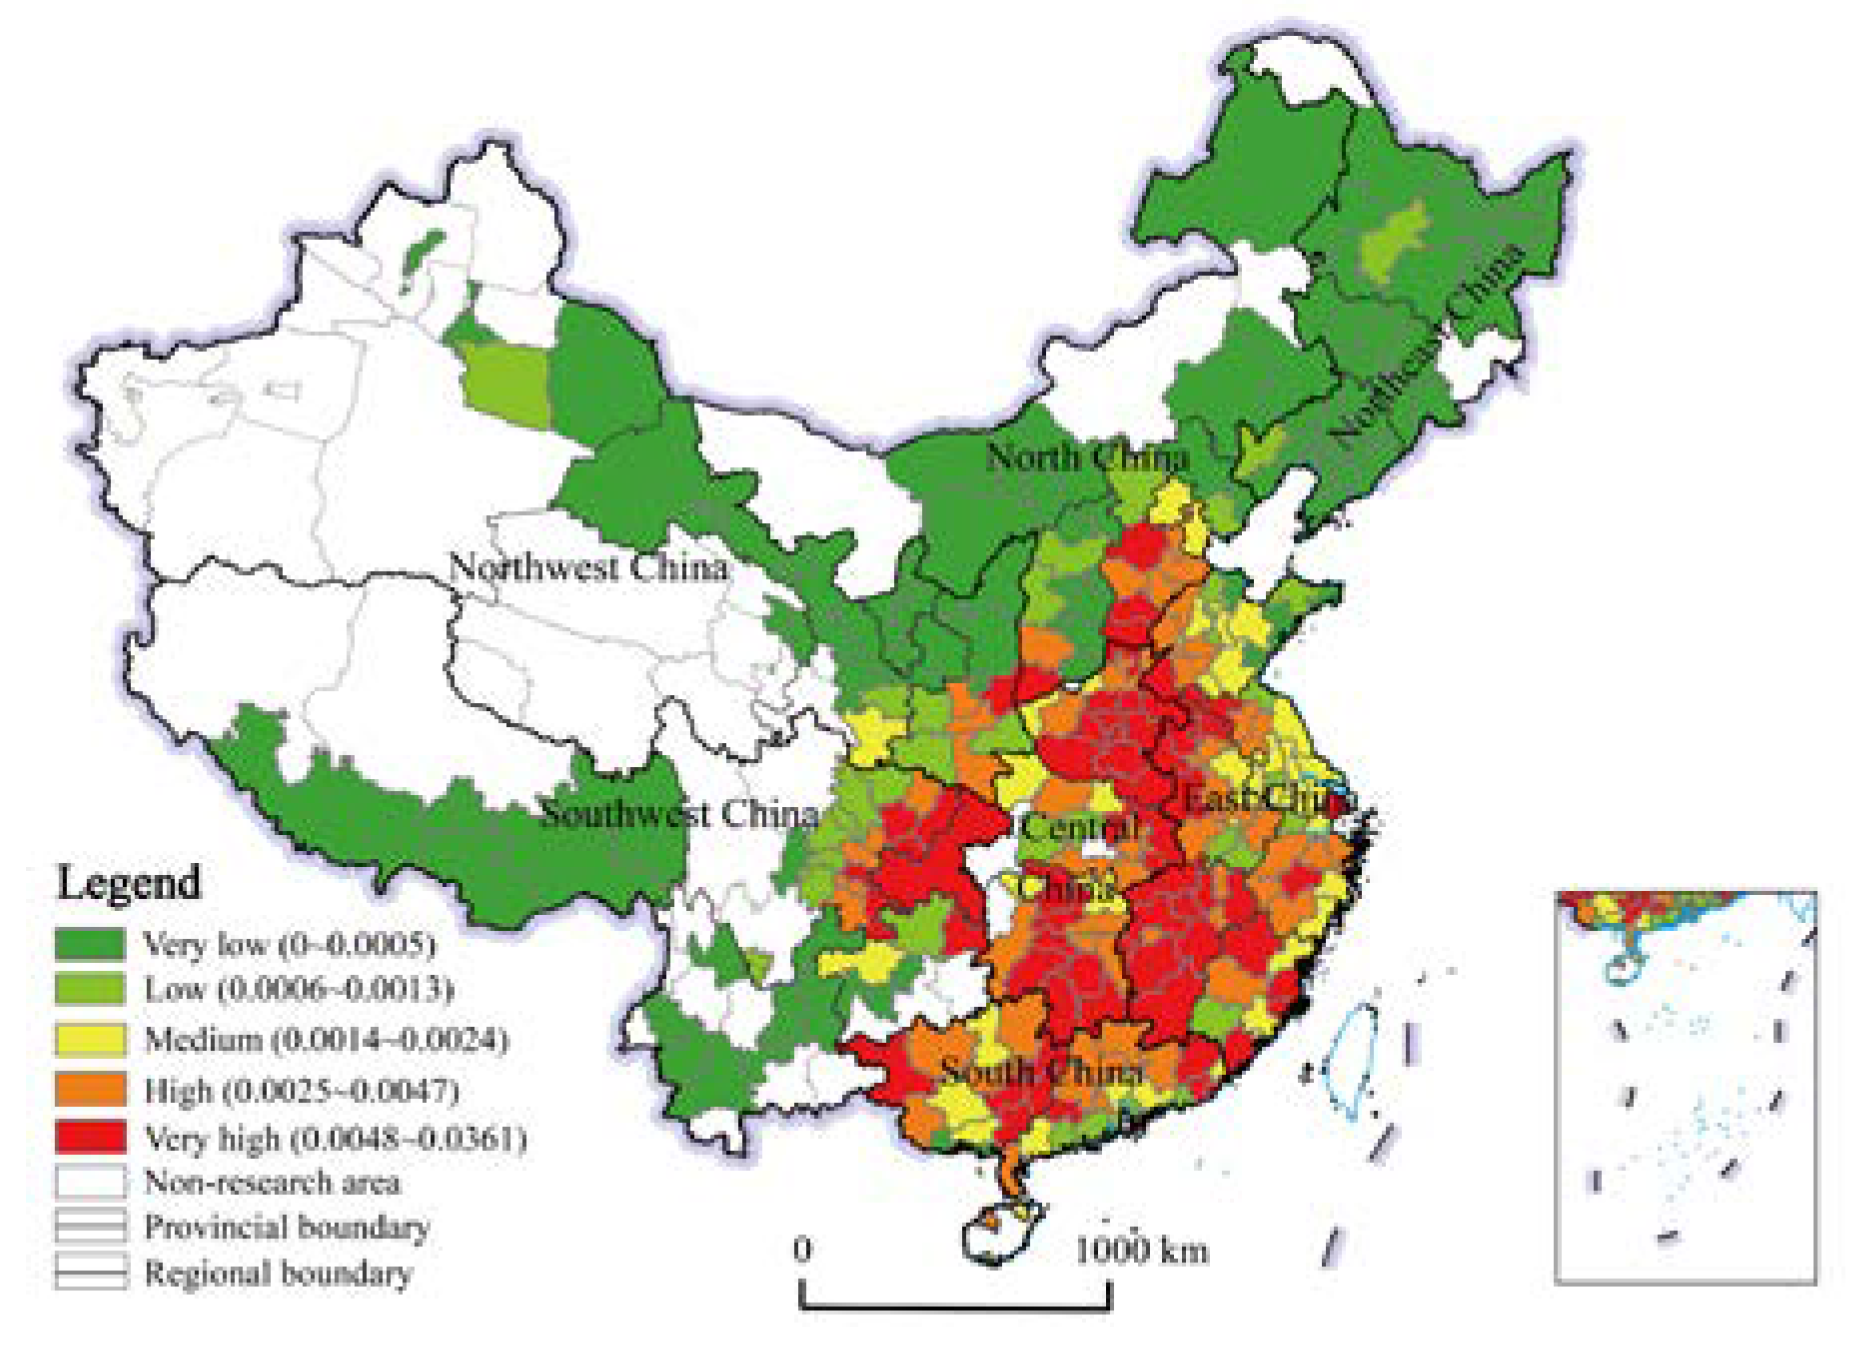
The EHRI of each city was calculated using Equation (5), and the values of EHRI were grouped into five categories using natural breaks method in ArcGIS software (Figure 7). The results show that the EHRI at the same level has obvious spatial agglomeration characteristics. Very high values (over 0.0048) of EHRI were found in 48 cities located in northeastern and southern Central China, southwestern East China, eastern Southwest China, and some cities in South China. High values (0.0025~0.0047) of EHRI were found in 58 cities concentrated in Central China, central East China, and central South China. Medium values (0.0014~0.0024) of EHRI were found in 64 cities concentrated in western Central China, coastal areas and northern South China. Lower values (0~0.0013) of EHRI were found in 126 cities located in Northeast China, Northwest China, Southwest China, and northern North China.
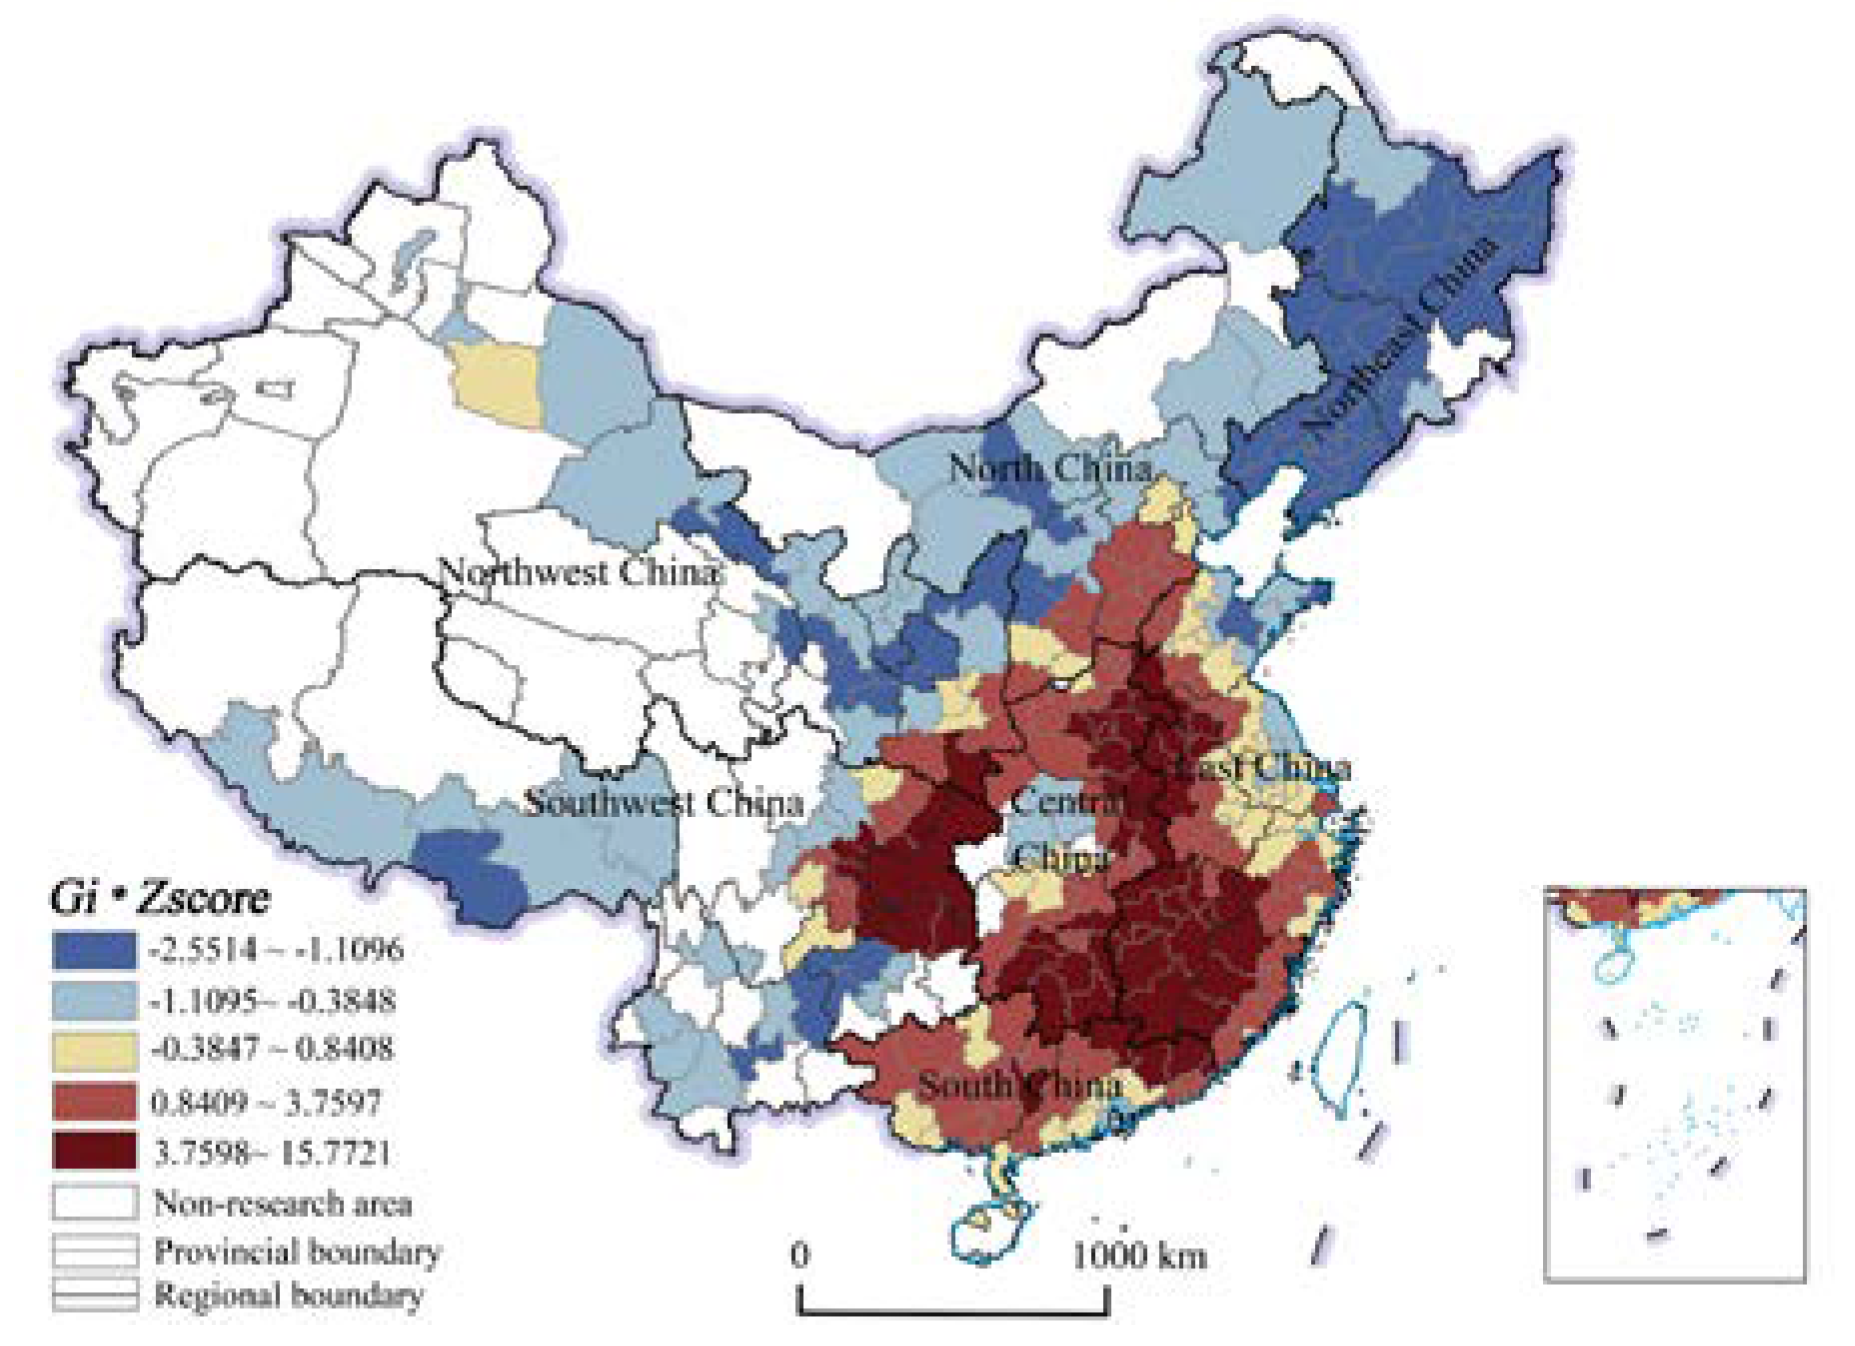
To reveal the variation in the EHRI spatial pattern, the Getis-Ord Gi* statistic for the EHRI of each city was calculated using the Hot Spot Analysis tool of ArcGIS. The Gi* statistic is a Z score that indicates where high or low EHRI values are spatially clustered [55,56]. If the Gi* is positive and statistically significant, the city is identified as a hot spot, which implies it is surrounded by other cities with high EHRI values. If the Gi* is negative and statistically significant, the city is identified as a cold spot, which indicates it is surrounded by other cities with low EHRI values. Figure 8 shows the results of EHRI hotspot analysis. The hotspot areas (values ranging from 3.7598 to 15.7721) are mainly concentrated in northern and eastern Central China, western East China, eastern Southwest China, and northeastern South China. The secondary hotspot areas (values ranging from 0.8409 to 3.7597) are mainly distributed around hotspots. The cold spots (values ranging from −2.5514 to −1.1096) and the secondary cold spots (values ranging from −1.1095 to −0.3848) are mainly located in Northeast China, Northwest China, and Southwest China.
3.4. Dominant Factors of Urban Extreme Heat Risk
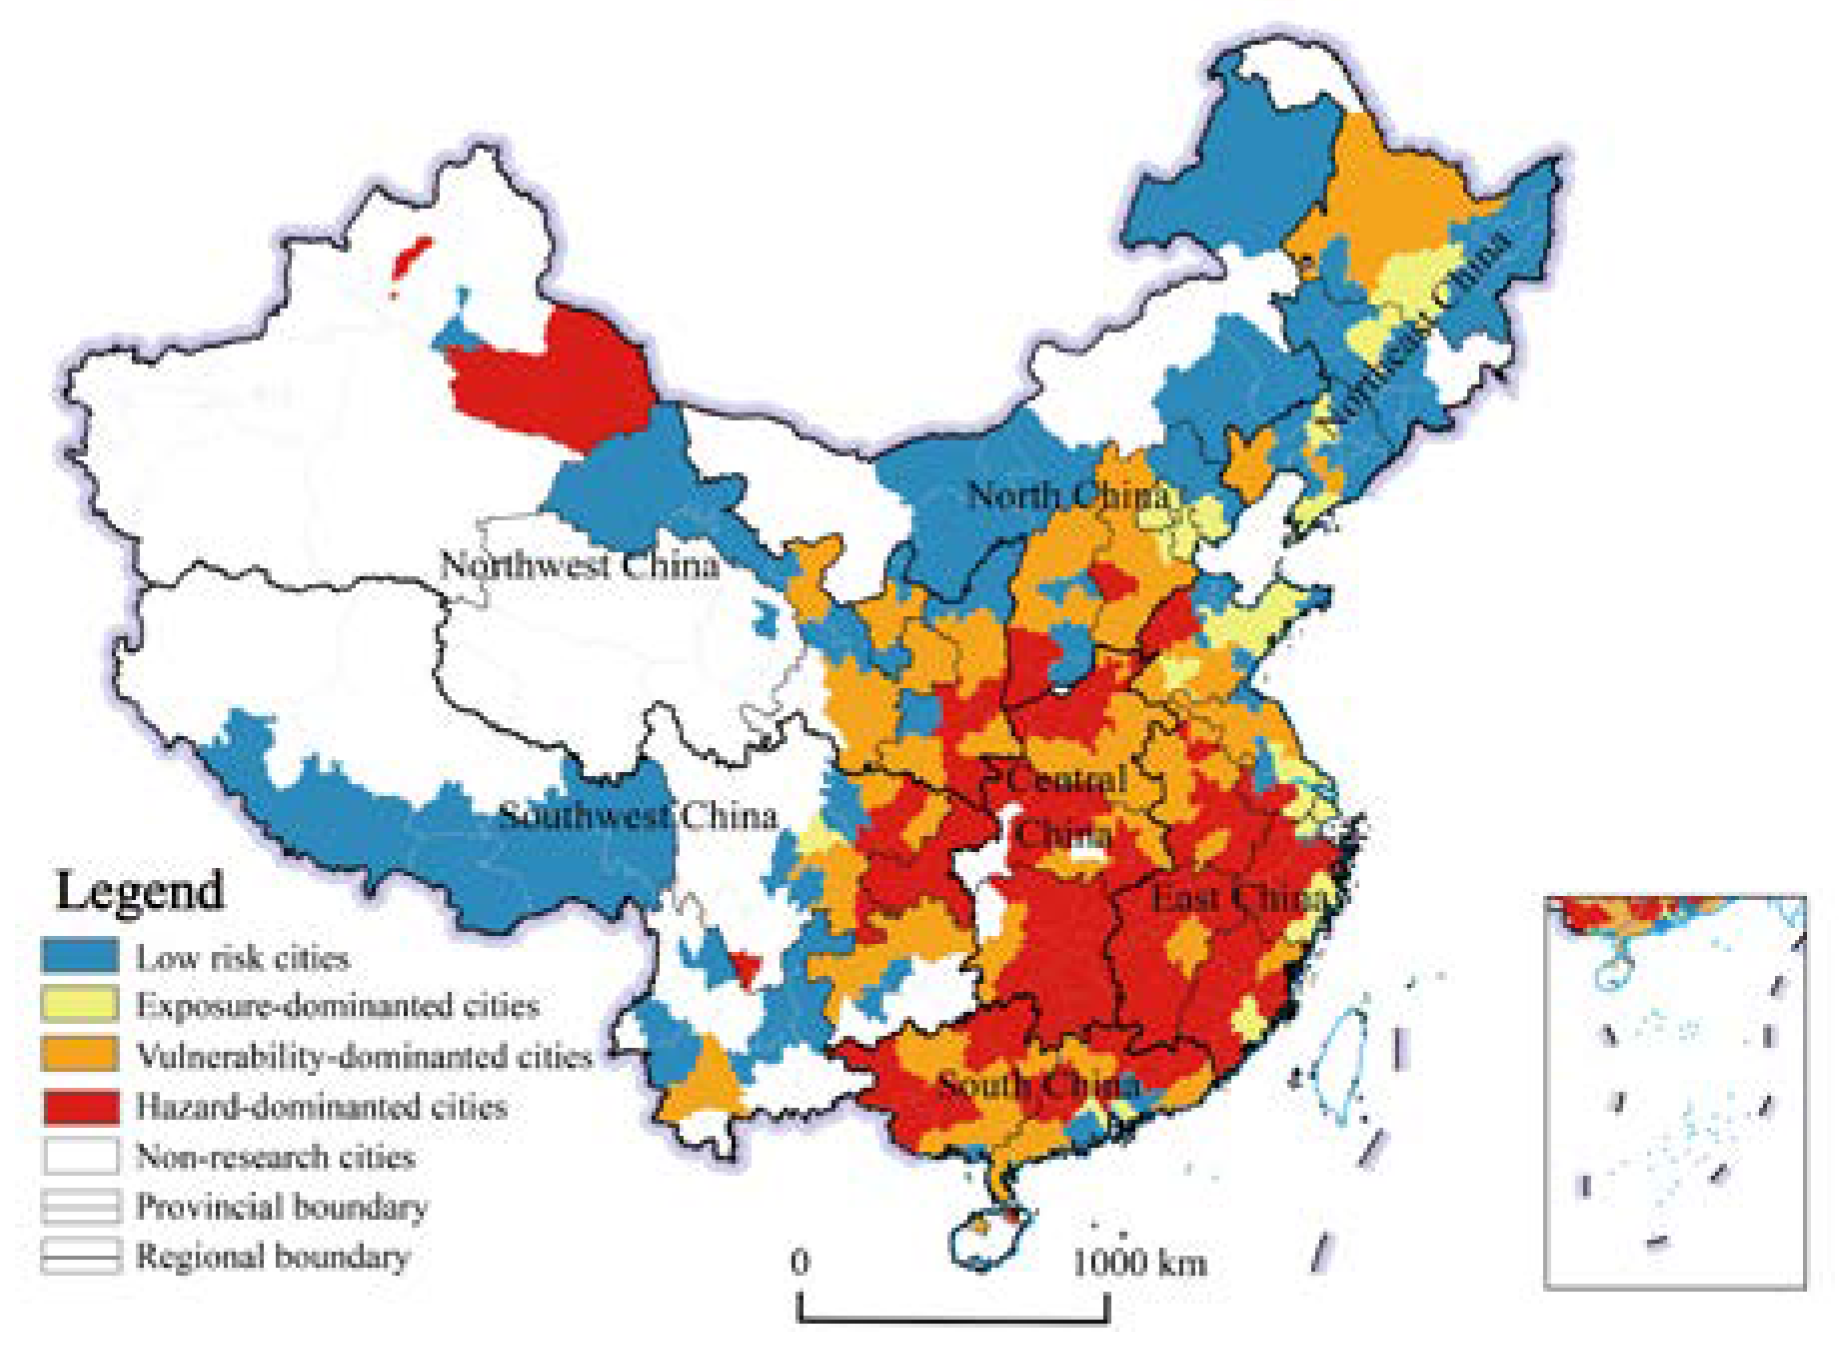
In order to explore the dominant factors of urban extreme heat risk, the values of hazard index, exposure index, and vulnerability index of each city were divided into two categories, namely high level and the low level, using the natural breaks method in ArcGIS software. According to the combination relationship between different indexes, the overlapping method was adopted to classify the dominant factor types of urban extreme heat risk. There are four dominated types: (1) Cities with high hazard index level and low vulnerability index level are classified as hazard-dominated type; (2) cities with high vulnerability index level and low hazard index level are classified as vulnerability-dominated type; (3) cities with low hazard index level, low vulnerability index level, and high exposure index level are classified as exposure-dominated type; and 4) cities with low values for three indexes are classified as low risk type. Figure 9 shows the spatial distribution of these four types of cities in China. The number of hazard-dominated cities, exposure-dominated cities, vulnerability-dominated cities, and low risk cities in China is 80, 27, 107, and 82, and the percentage of total cities is 27.03%, 9.12%, 36.15%, and 27.70%, respectively.
In terms of distribution of various types, the hazard-dominated cities are mainly located in East China, accounting for 47.5% of total hazard-dominated cities in China. The exposure-dominated cities are also mainly concentrated in East China, accounting for 52.9% of total exposure-dominated cities in China, mainly due to a large population in East China, accounting for 26.9% of China’s population. The vulnerability-dominated cities are distributed in all regions, with the largest number in Central China, accounting for 28.0% of total vulnerability-dominated cities in China. The low risk cities are mainly distributed in Northeast China, Southwest China, North China, and Northwest China, with the largest number in Northeast China, which accounts for 26.8% of total low risk cities in China.
In terms of different regions, the number of low risk cities in Northeast China, North China, and Southwest China is the largest, accounting for 64.71%, 45.45%, and 47.37% of the total regional cities, respectively. The number of vulnerability-dominated cities and low risk cities in Northwest China is the same, both of which account for 39.39% of the total regional cities. In South China and Central China, the number of vulnerability-dominated cities is the greatest, accounting for 42.11% and 71.43% of the total regional cities, respectively. The number of hazard-dominated cities in East China is the largest, accounting for 48.72% of the total regional cities (Table 2).
4. Discussion and Conclusion
4.1. Discussion
In this paper, we establish the Risk Assessment Framework of Extreme Heat based on the risk analysis of IPCC to understand the extreme heat risk as a comprehensive function of hazard, exposure, and vulnerability and develop an extreme heat risk index to measure the risk of extreme heat risk in 296 prefecture-level cities in China.
In previous studies, scholars had different descriptions for the concepts of hazard, exposure, and vulnerability. In terms of hazard, according to existing literatures [26,57], we selected some variables from the extreme heat disaster itself, such as the intensity, frequency, and duration of disaster. Based on these variables, we described the characteristics of extreme heat hazard from 1960 to 2016 in cities and reveal the spatial pattern of extreme heat hazard in Chinese cities. In terms of exposure, many studies [58,59,60] use alternative indicators related to the disaster itself, while we believe that exposure to disaster means being in a situation where it might affect people. Therefore, we chose population exposure to measure the probability that a city may be affected by extreme heat hazard. Here, our hypothesis is that a city with large population or higher population density is relatively more likely to be affected by extreme heat hazard, that is, the city’s exposure degree is higher. Therefore, we selected the total population and population density to measure the extreme heat exposure of the city. In terms of vulnerability, some studies consider it as a combination of exposure, sensitivity, and adaptive capacity [23,41,61,62]. We believe that vulnerability is an inherent attribute of a place, and it can be completely independent of external disasters. That is to say, regardless of whether the disaster has an impact on the place or not, the potential vulnerability of the place exists. However, when disasters occur, the places with greater vulnerability face greater risk and the consequences will also be more serious. Therefore, instead of considering the impact of external disaster events, we measured vulnerability from local sensitivity and adaptive capacity.
Based on the different understandings above, this paper chose different alternative indicators and risk assessment methods. In our opinion, considering the availability of prefecture-level city data, the framework and indicator system constructed in this paper is more conducive to describing the characteristics of extreme heat hazard in Chinese cities, revealing the pattern of extreme heat risk in Chinese cities, and better realizing the comparison of the levels of extreme heat risk in different cities.
From the spatial pattern of urban risk to extreme heat in China, we can find that the formation of this spatial pattern is still mainly controlled by natural geographical conditions such as climate and topography. First, cities with high risk levels of extreme heat are mainly concentrated in the eastern monsoon region of China. In contrast, urban risk levels of extreme heat in the arid and semi-arid regions of the northwest and the Qinghai-Tibet Plateau are very low. Second, in the eastern monsoon region, the boundary between the north of China and the south of China (0 °C isotherm) further outlines the basic pattern of extreme heat risk in Chinese cities. The majority of cities with high risk levels are located in the south of the 0 °C isotherm, while in the north of the 0 °C isotherm, the number of cities with high risk levels of extreme heat decreases as latitude increases. In our view, it is very difficult to change the natural geographical pattern that affects the risk of extreme heat in Chinese cities. In this case, how cities adapt to extreme heat environment becomes even more important. Therefore, actively adjusting urban systems and improving the city’s adaptive capacity are the most important and realistic choices to deal with extreme heat risk.
The attitude of the international community towards climate change has shifted from passive response to active adaptation, with more emphasis on systematic behavioral adjustment to mitigate the adverse effects of risk. With respect to extreme heat hazard, many cities have developed corresponding action plans and adaptation countermeasures, such as the Heat Wave Plan for England, Toronto Hot Weather Response Plan, and Chicago Climate Action Plan [63,64]. Although related actions such as early warning of high temperature weather, online reports of heat stroke cases, and protection of outdoor workers have been carried out in China, specialized planning actions and systematic adaptation countermeasures for different cities have not yet been formed. In terms of urban planning, due to a long-term lack of awareness of climate change adaptation, cities are severely inadequate in their ability to resist, recover, and adapt to risk of uncertainty [65]. It is encouraging that the Chinese government launched a pilot project of climatic adaptability cities in 2017, which required that climate change risk and extreme weather events must be considered in urban planning, but there is still a long way to go.
Some limitations should also be recognized in this paper. First, considering the integrality and reliability of the data from national meteorological stations, this study used data from national meteorological stations to analyze the extreme heat risk of prefecture-level cities. In the future, data from some non-national meteorological stations can also be used to reveal the spatial pattern of extreme heat hazard at the county level in China. Second, heat-related morbidity or mortality is an important indicator to verify the risk assessment results. Unfortunately; however, such data are very difficult to obtain in China. Third, compared with prefecture-level cities, the concentration of population and socio-economic elements in municipal districts is higher. Coupled with the impact of the urban heat island effect, the risk of extreme heat may be more prominent. However, it is very difficult to collect population and socio-economic statistics at the municipal district level. In the future, the author will select typical cities to carry out systematic research to further improve the research content of this article.
4.2. Conclusion
In this study, we constructed a risk assessment framework of extreme heat to understand the extreme heat risk from three dimensions (including hazard, exposure, and vulnerability), collected meteorological data from 1960 to 2016 and socioeconomic statistics, developed an extreme heat risk index and evaluation indicator system, revealed spatial pattern of urban extreme heat risk in 2016, and explored its dominant factors and distribution of different types.
This study led to several conclusions. First, cities with high levels of extreme heat hazard are mainly concentrated in the south of China, especially in the southeast of China. Overall, the urban hazard index to extreme heat showed a trend of gradually increasing from north to south and from west to east. Second, the extreme heat risk index in Chinese cities shows a significant agglomeration characteristic. Cities with high levels of extreme heat risk are mainly concentrated in northern and eastern Central China, western East China, eastern Southwest China, and northeastern South China, while cities with low levels of extreme heat risk are mainly located in Northeast China, Northwest China, and Qinghai-Tibet Plateau. The formation of this spatial pattern is still mainly controlled by natural geographical conditions such as climate and topography. Finally, the number of hazard-dominated cities, exposure-dominated cities, vulnerability-dominated cities, and low risk cities in China accounts for 27.03%, 9.12%, 36.15%, and 27.70% of the total number of cities, respectively.
Author Contributions
Conceptualization, X.H.; data curation, Y.L., Y.G., D.Z. and M.Q.; methodology, Y.L.; project administration, X.H.; visualization, Y.L., Y.G., D.Z. and M.Q.; writing—original draft, X.H. All authors have read and approved the final manuscript.
Funding
This research was funded by the “The Program of National Natural Science Foundation of China” (NO.41971178), “Open Fund of Shaanxi Key Laboratory of Earth Surface System and Environmental Carrying Capacity” (No.SKLESS201807).
Conflicts of Interest
The authors declare no conflicts of interest.
References
- IPCC. Climate Change 2014: Synthesis Report. Contribution of Working Groups I, II and III to the Fifth Assessment Report of the Intergovernmental Panel on Climate Change; World Meteorological Organization: Geneva, Switzerland, 2014. [Google Scholar]
- WEF. Global Risk Report 2020; World Economic Forum: Cologny, Switzerland, 2020. [Google Scholar]
- Semenza, J.C.; Rubin, C.H.; Falter, K.H.; Selanikio, J.D.; Flanders, W.D.; Howe, H.L. Heat-related deaths during the July 1995 heat wave in Chicago. N. Engl. J. Med. 1996, 335, 84–90. [Google Scholar] [CrossRef]
- Fouillet, A.; Rey, G.; Laurent, F.; Pavillon, G.; Bellec, S.; Guihenneuc-Jouyaux, C.; Clavel, J.; Jougla, E.; Hemon, D. Excess mortality related to the August 2003 heat wave in France. Int. Arch. Occup. Environ. Health 2006, 80, 16–24. [Google Scholar] [CrossRef] [PubMed] [Green Version]
- Knowlton, K.; Rotkin-Ellman, M.; King, G.; Margolis, H.G.; Smith, D.; Solomon, G.; Trent, R.; English, P. The 2006 California heat wave: Impacts on hospitalizations and emergency department visits. Environ. Health Perspect. 2009, 117, 61–67. [Google Scholar] [CrossRef] [PubMed]
- Qin, D.H.; Zhang, J.Y.; Shan, C.C. China National Assessment Report on Risk Management and Adaptation of Climate Extremes and Disasters; Science Press: Beijing, China, 2015. [Google Scholar]
- Xia, Y.; Li, Y.; Guan, D.B.; Tinoco, D.M.; Xia, J.J.; Yan, Z.W.; Yang, J.; Liu, Q.Y.; Huo, H. Assessment of the economic impacts of heat waves: A case study of Nanjing, China. J. Clean. Prod. 2018, 171, 811–819. [Google Scholar] [CrossRef] [Green Version]
- Sun, X.; Sun, Q.; Zhou, X.; Li, X.; Yang, M.; Yu, A.; Geng, F. Heat wave impact on mortality in Pudong New Area, China in 2013. Sci. Total Environ. 2014, 493, 789–794. [Google Scholar] [CrossRef] [PubMed]
- IPCC. Summary for Policymakers. In Global warming of 1.5 °C. An IPCC Special Report on the Impacts of Global Warming of 1.5 °C above Pre-Industrial Levels and Related Global Greenhouse Gas Emission Pathways; World Meteorological Organization: Geneva, Switzerland, 2018. [Google Scholar]
- Rey, G.; Fouillet, A.; Bessemoulin, P.; Frayssinet, P.; Dufour, A.; Jougla, E.; Hemon, D. Heat exposure and socio-economic vulnerability as synergistic factors in heat-wave-related mortality. Eur. J. Epidemiol. 2009, 24, 495–502. [Google Scholar] [CrossRef]
- Laaidi, K.; Zeghnoun, A.; Dousset, B.; Bretin, P.; Vandentorren, S.; Giraudet, E.; Beaudeau, P. The impact of heat islands on mortality in Paris during the August 2003 heat wave. Environ. Health Perspect. 2012, 120, 254–259. [Google Scholar] [CrossRef] [Green Version]
- Heaton, M.J.; Sain, S.R.; Greasby, T.A.; Uejio, C.K.; Hayden, M.H.; Monaghan, A.J.; Boehnert, J.; Sampson, K.; Banerjee, D.; Nepal, V.; et al. Characterizing urban vulnerability to heat stress using a spatially varying coefficient model. Spat. Spatio-Temporal Epidemiol. 2014, 8, 23–33. [Google Scholar] [CrossRef]
- Madrigano, J.; Ito, K.; Johnson, S.; Kinney, P.L.; Matte, T. A Case-Only Study of Vulnerability to Heat Wave-Related Mortality in New York City (2000–2011). Environ. Health Perspect. 2015, 123, 672–678. [Google Scholar] [CrossRef]
- Putnam, H.; Hondula, D.M.; Urban, A.; Berisha, V.; Iñiguez, P.; Roach, M. It’s not the heat, it’s the vulnerability: Attribution of the 2016 spike in heat-associated deaths in Maricopa County, Arizona. Environ. Res. Lett. 2018, 13, 094022. [Google Scholar] [CrossRef] [Green Version]
- Tran, K.V.; Azhar, G.S.; Nair, R.; Knowlton, K.; Jaiswal, A.; Sheffield, P.; Mavalankar, D.; Hess, J. A cross-sectional, randomized cluster sample survey of household vulnerability to extreme heat among slum dwellers in ahmedabad, india. Int. J. Environ. Res. Public Health 2013, 10, 2515–2543. [Google Scholar] [CrossRef] [Green Version]
- Gronlund, C.J.; Berrocal, V.J.; White-Newsome, J.L.; Conlon, K.C.; O’Neill, M.S. Vulnerability to extreme heat by socio-demographic characteristics and area green space among the elderly in Michigan, 1990–2007. Environ. Res. 2015, 136, 449–461. [Google Scholar] [CrossRef] [PubMed] [Green Version]
- Xiao, J.; Spicer, T.; Jian, L.; Yun, G.Y.; Shao, C.; Nairn, J.; Fawcett, R.J.B.; Robertson, A.; Weeramanthri, T.S. Variation in Population Vulnerability to Heat Wave in Western Australia. Front. Public Health 2017, 5, 64. [Google Scholar] [CrossRef] [PubMed] [Green Version]
- D’Ippoliti, D.; Michelozzi, P.; Marino, C.; de’Donato, F.; Menne, B.; Katsouyanni, K.; Kirchmayer, U.; Analitis, A.; Medina-Ramón, M.; Paldy, A.; et al. The impact of heat waves on mortality in 9 European cities-results from the EuroHEAT projects. Environ. Health 2010, 9, 37. [Google Scholar] [CrossRef] [PubMed] [Green Version]
- Inostroza, L.; Palme, M.; de la Barrera, F. A Heat Vulnerability Index: Spatial Patterns of Exposure, Sensitivity and Adaptive Capacity for Santiago de Chile. PLoS ONE 2016, 11, e0162464. [Google Scholar] [CrossRef] [Green Version]
- Mushore, T.D.; Mutanga, O.; Odindi, J.; Dube, T. Determining extreme heat vulnerability of Harare Metropolitan City using multispectral remote sensing and socio-economic data. J. Spat. Sci. 2017, 63, 173–191. [Google Scholar] [CrossRef]
- Mendez-Lazaro, P.; Muller-Karger, F.E.; Otis, D.; McCarthy, M.J.; Rodriguez, E. A heat vulnerability index to improve urban public health management in San Juan, Puerto Rico. Int. J. Biometeorol. 2018, 62, 709–722. [Google Scholar] [CrossRef]
- Voelkel, J.; Hellman, D.; Sakuma, R.; Shandas, V. Assessing Vulnerability to Urban Heat: A Study of Disproportionate Heat Exposure and Access to Refuge by Socio-Demographic Status in Portland, Oregon. Int. J. Environ. Res. Public Health 2018, 15, 640. [Google Scholar] [CrossRef] [Green Version]
- Rinner, C.; Patychuk, D.; Bassil, K.; Nasr, S.; Gower, S.; Campbell, M. The Role of Maps in Neighborhood-level Heat Vulnerability Assessment for the City of Toronto. Cartogr. Geogr. Inf. Sci. 2010, 37, 31–44. [Google Scholar] [CrossRef]
- Maier, G.; Grundstein, A.; Jang, W.; Li, C.; Naeher, L.P.; Shepherd, M. Assessing the Performance of a Vulnerability Index during Oppressive Heat across Georgia, United States. Weather Clim. Soc. 2014, 6, 253–263. [Google Scholar] [CrossRef]
- Sheridan, S.C.; Dixon, P.G. Spatiotemporal trends in human vulnerability and adaptation to heat across the United States. Anthropocene 2017, 20, 61–73. [Google Scholar] [CrossRef]
- Ding, T.; Qian, W.H.; Yan, Z.W. Changes in hot days and heat waves in China during 1961–2007. Int. J. Climatol. 2009, 30, 1452–1462. [Google Scholar] [CrossRef]
- Ding, T.; Ke, Z.J. Characteristics and changes of regional wet and dry heat wave events in China during 1960–2013. Theor. Appl. Climatol. 2014, 122, 651–665. [Google Scholar] [CrossRef]
- Yin, Z.; Yin, J.; Zhang, X.W. Multi-scenario-based hazard analysis of high temperature extremes experienced in China during 1951–2010. J. Geogr. Sci. 2013, 23, 436–446. [Google Scholar] [CrossRef]
- Zhu, Q.; Liu, T.; Lin, H.; Xiao, J.; Luo, Y.; Zeng, W.; Zeng, S.; Wei, Y.; Chu, C.; Baum, S.; et al. The spatial distribution of health vulnerability to heat waves in Guangdong Province, China. Glob. Health Action 2014, 7, 25051. [Google Scholar] [CrossRef] [PubMed] [Green Version]
- Bai, L.; Woodward, A.; Cirendunzhu; Liu, Q. County-level heat vulnerability of urban and rural residents in Tibet, China. Environ. Health 2016, 15, 3. [Google Scholar] [CrossRef] [Green Version]
- Chen, Q.; Ding, M.; Yang, X.; Hu, K.; Qi, J. Spatially explicit assessment of heat health risk by using multi-sensor remote sensing images and socioeconomic data in Yangtze River Delta, China. Int. J. Health Geogr. 2018, 17, 15. [Google Scholar] [CrossRef]
- Yang, J.; Yin, P.; Sun, J.; Wang, B.; Zhou, M.; Li, M.; Tong, S.; Meng, B.; Guo, Y.; Liu, Q. Heatwave and mortality in 31 major Chinese cities: Definition, vulnerability and implications. Sci. Total Environ. 2019, 649, 695–702. [Google Scholar] [CrossRef]
- Zhang, S.; Tao, F.L.; Zhang, Z. Changes in extreme temperatures and their impacts on rice yields in southern China from 1981 to 2009. Field Crops Res. 2016, 189, 43–50. [Google Scholar] [CrossRef] [Green Version]
- Zhang, L.L.; Zhang, Z.; Chen, Y.; Wei, X.; Song, X. Exposure, vulnerability, and adaptation of major maize-growing areas to extreme temperature. Nat. Hazards 2018, 91, 1257–1272. [Google Scholar] [CrossRef]
- Huang, L.; Yang, Q.; Li, J.; Chen, J.; He, R.; Zhang, C.; Chen, K.; Dong, S.G.; Liu, Y. Risk perception of heat waves and its spatial variation in Nanjing, China. Int. J. Biometeorol. 2018, 62, 783–794. [Google Scholar] [CrossRef] [PubMed]
- Xie, P.; Wang, Y.L.; Liu, Y.X.; Peng, J. Incorporating social vulnerability to assess population health risk due to heat stress in China. Acta Geogr. Sin. 2015, 70, 1041–1051. [Google Scholar] [CrossRef]
- Shui, W.; Chen, Z.C.; Deng, J.M.; Li, Y.J.; Wang, Q.F.; Wang, W.L.; Chen, Y.P. Evaluation of urban high temperature vulnerability of coupling adaptability in Fuzhou, China. Acta Geogr. Sin. 2017, 72, 830–849. [Google Scholar] [CrossRef]
- He, C.; Ma, L.; Zhou, L.; Kan, H.; Zhang, Y.; Ma, W.; Chen, B. Exploring the mechanisms of heat wave vulnerability at the urban scale based on the application of big data and artificial societies. Environ. Int. 2019, 127, 573–583. [Google Scholar] [CrossRef]
- IPCC. Climate Change 2014: Impacts, Adaptation, and Vulnerability. Summaries, Frequently Asked Questions, and Cross-Chapter Boxes. In A Contribution of Working Group II to the Fifth Assessment Report of the Intergovernmental Panel on Climate Change; World Meteorological Organization: Geneva, Switzerland, 2014. [Google Scholar]
- Ho, H.C.; Knudby, A.; Walker, B.B.; Henderson, S.B. Delineation of Spatial Variability in the Temperature-Mortality Relationship on Extremely Hot Days in Greater Vancouver, Canada. Environ. Health Perspect. 2017, 125, 66–75. [Google Scholar] [CrossRef] [Green Version]
- Leal Filho, W.; Echevarria Icaza, L.; Neht, A.; Klavins, M.; Morgan, E.A. Coping with the impacts of urban heat islands. A literature based study on understanding urban heat vulnerability and the need for resilience in cities in a global climate change context. J. Clean. Prod. 2018, 171, 1140–1149. [Google Scholar] [CrossRef] [Green Version]
- Turner, B.L.; Kasperson, R.E.; Matson, P.A.; McCarthy, J.J.; Corell, R.W.; Christensen, L.; Eckley, N.; Kasperson, J.X.; Luers, A.; Martello, M.L.; et al. A framework for vulnerability analysis in sustainability science. Proc. Natl. Acad. Sci. USA 2003, 100, 8074–8079. [Google Scholar] [CrossRef] [Green Version]
- Aminipouri, M.; Knudby, A.; Ho, H.C. Using multiple disparate data sources to map heat vulnerability: Vancouver case study. Can. Geogr./Le Géographe Canadien 2016, 60, 356–368. [Google Scholar] [CrossRef]
- Dongo, K.; Kablan, A.K.M.; Kouamé, F.K. Mapping urban residents’ vulnerability to heat in Abidjan, Côte d’Ivoire. Clim. Dev. 2018, 10, 600–613. [Google Scholar] [CrossRef]
- Cutter, S.L.; Finch, C. Temporal and spatial changes in social vulnerability to natural hazards. Proc. Natl. Acad. Sci. USA 2008, 105, 2301–2306. [Google Scholar] [CrossRef] [Green Version]
- Chow, W.T.L.; Chuang, W.C.; Gober, P. Vulnerability to Extreme Heat in Metropolitan Phoenix: Spatial, Temporal, and Demographic Dimensions. Prof. Geogr. 2012, 64, 286–302. [Google Scholar] [CrossRef]
- Kuang, W.H.; Liu, Y.; Dou, Y.Y.; Chi, W.F.; Chen, G.S.; Gao, C.F.; Yang, T.R.; Liu, J.Y.; Zhang, R.H. What are hot and what are not in an urban landscape: Quantifying and explaining the land surface temperature pattern in Beijing, China. Landsc. Ecol. 2014, 30, 357–373. [Google Scholar] [CrossRef]
- Dadashpoor, H.; Azizi, P.; Moghadasi, M. Land use change, urbanization, and change in landscape pattern in a metropolitan area. Sci. Total Environ. 2019, 655, 707–719. [Google Scholar] [CrossRef] [PubMed]
- Tan, J.; Zheng, Y.; Tang, X.; Guo, C.; Li, L.; Song, G.; Zhen, X.; Yuan, D.; Kalkstein, A.J.; Li, F. The urban heat island and its impact on heat waves and human health in Shanghai. Int. J. Biometeorol. 2010, 54, 75–84. [Google Scholar] [CrossRef]
- Li, H.; Zhou, Y.; Li, X.; Meng, L.; Wang, X.; Wu, S.; Sodoudi, S. A new method to quantify surface urban heat island intensity. Sci. Total Environ. 2018, 624, 262–272. [Google Scholar] [CrossRef]
- Ebi, K.L.; Kovats, R.S.; Menne, B. An approach for assessing human health vulnerability and public health interventions to adapt to climate change. Environ. Health Perspect. 2006, 114, 1930–1934. [Google Scholar] [CrossRef] [Green Version]
- Qu, Y.; Liu, Y. Evaluating the low-carbon development of urban China. Environ. Dev. Sustain. 2016, 19, 939–953. [Google Scholar] [CrossRef]
- Phillips, S.J.; Anderson, R.P.; Schapire, R.E. Maximum entropy modeling of species geographic distributions. Ecol. Model. 2006, 190, 231–259. [Google Scholar] [CrossRef] [Green Version]
- Ebert, U.; Welsch, H. Meaningful environmental indices: A social choice approach. J. Environ. Econ. Manag. 2004, 47, 270–283. [Google Scholar] [CrossRef]
- Jiang, M.; Xin, L.J.; Li, X.B.; Tan, M.H. Spatiotemporal Variation of China’s State-Owned Construction Land Supply from 2003 to 2014. Sustainability 2016, 8, 1137. [Google Scholar] [CrossRef] [Green Version]
- Huang, X.; Huang, X.J.; Liu, M.M.; Wang, B.; Zhao, Y.H. Spatial-temporal Dynamics and Driving Forces of Land Development Intensity in the Western China from 2000 to 2015. Chin. Geogr. Sci. 2020, 30, 16–29. [Google Scholar] [CrossRef] [Green Version]
- Anderson, G.B.; Bell, M.L. Heat waves in the United States: Mortality risk during heat waves and effect modification by heat wave characteristics in 43 U.S. communities. Environ. Health Perspect. 2011, 119, 210–218. [Google Scholar] [CrossRef] [PubMed] [Green Version]
- Uejio, C.K.; Wilhelmi, O.V.; Golden, J.S.; Mills, D.M.; Gulino, S.P.; Samenow, J.P. Intra-urban societal vulnerability to extreme heat: The role of heat exposure and the built environment, socioeconomics, and neighborhood stability. Health Place 2011, 17, 498–507. [Google Scholar] [CrossRef] [PubMed]
- Aubrecht, C.; Ozceylan, D. Identification of heat risk patterns in the U.S. National Capital Region by integrating heat stress and related vulnerability. Environ. Int. 2013, 56, 65–77. [Google Scholar] [CrossRef] [PubMed]
- Macnee, R.G.D.; Tokai, A. Heat wave vulnerability and exposure mapping for Osaka City, Japan. Environ. Syst. Decis. 2016, 36, 368–376. [Google Scholar] [CrossRef]
- Wilhelmi, O.V.; Hayden, M.H. Connecting people and place: A new framework for reducing urban vulnerability to extreme heat. Environ. Res. Lett. 2010, 5, 014021. [Google Scholar] [CrossRef]
- Ge, Y.; Dou, W.; Dai, J.P. A New Approach to Identify Social Vulnerability to Climate Change in the Yangtze River Delta. Sustainability 2017, 9, 2236. [Google Scholar] [CrossRef] [Green Version]
- Abeling, T. According to plan? Disaster risk knowledge and organizational responses to heat wave risk in london, uk. Ecosyst. Health Sustain. 2017, 1, 1–8. [Google Scholar] [CrossRef]
- Pan, H.Z.; Page, J.; Zhang, L.; Chen, S.; Cong, C.; Destouni, G.; Kalantari, Z.; Deal, B. Using comparative socio-ecological modeling to support Climate Action Planning (CAP). J. Clean. Prod. 2019, 232, 30–42. [Google Scholar] [CrossRef]
- Luo, X.L.; Yu, C.W.; Zhou, D.; Gu, Z.L. Challenges and adaptation to urban climate change in China: A viewpoint of urban climate and urban planning. Indoor Built Environ. 2019, 28, 1157–1161. [Google Scholar] [CrossRef]
Figure 1.
Risk assessment framework of extreme heat.

Figure 2.
Major cities and national meteorological stations in China.

Figure 3.
Spatial distribution of urban hot days (a) and heat intensity (b) in China.

Figure 4.
Spatial distribution of urban heat wave frequency (a), heat wave duration (b) and heat wave intensity (c) in China.
Figure 4.
Spatial distribution of urban heat wave frequency (a), heat wave duration (b) and heat wave intensity (c) in China.

Figure 5.
Spatial pattern of urban extreme heat hazard in China.

Figure 6.
Spatial pattern of urban exposure index (a) and vulnerability index (b) in China.

Figure 7.
Spatial pattern of extreme heat risk index in China.

Figure 8.
Hot spot and cold spot areas of extreme heat risk index in China.

Figure 9.
Spatial distribution of different dominant factor cities.


Table 1.
Variables for risk assessment of extreme heat.
| Dimension | Variable Name | Unit | Weight | Details | Data Source |
|---|---|---|---|---|---|
| Hazard | Hot days (HDs) | Days | 0.1877 | Days with DMT ≥ 35 °C | Dataset of daily climate data (1960–2016) from Chinese surface stations on China Meteorological Data Service Center |
| Heat intensity (HI) | °C | 0.0197 | Average of DMT for all HDs | ||
| Heat wave frequency (HWF) | Time | 0.2026 | Number of heat wave events | ||
| Heat wave duration (HWD) | Days | 0.3355 | Heat wave’s length in days | ||
| Heat wave intensity (HWI) | °C | 0.2545 | Cumulative value of DMT ≥ 35 °C during heat waves | ||
| Exposure | Total population | Million | 0.3740 | Large population means more people exposed in risk | China City Statistical Yearbook (2017) |
| Population density | Person/km2 | 0.6260 | High population density means more people exposed in risk | ||
| Vulnerability Sensitivity | Percent of children | % | 0.3734 | Percentage of the population under 5 years old | National Census of China (2010) |
| Percent of the elderly | % | 0.2468 | Percentage of the population over 65 years old | ||
| Percent of urban population | % | 0.3798 | Percentage of urban population in total population | ||
| Adaptive capacity | Economic level | CNY | 0.1841 | Per capita GDP | China City Statistical Yearbook (2017) |
| Educational level | % | 0.2176 | Percentage of the population attended high school and above | ||
| Medical level | Person | 0.1415 | Number of physicians per 10,000 people | ||
| Information level | % | 0.2678 | Percentage of the population with mobile phone | ||
| Water supply | m3 | 0.1045 | Per capita water supply | ||
| Green space | m2 | 0.0845 | Per capita green space area |
Note: The DMT is daily maximum temperature.
Table 2.
Number of different dominated types of urban extreme heat risk in different area of China.
| Country/Area | Total | Hazard- Dominated Cities | Percentage | Exposure- Dominated Cities | Percentage | Vulnerability-Dominated Cities | Percentage | Low Risk Cities | Percentage |
|---|---|---|---|---|---|---|---|---|---|
| China | 296 | 80 | 27.03% | 27 | 9.12% | 107 | 36.15% | 82 | 27.70% |
| Northeast China | 34 | 0 | 0 | 4 | 11.76% | 8 | 23.53% | 22 | 64.71% |
| Northwest China | 33 | 7 | 21.21% | 0 | 0 | 13 | 39.39% | 13 | 39.39% |
| South China | 38 | 13 | 34.21% | 4 | 10.53% | 16 | 42.11% | 5 | 13.16% |
| Central China | 42 | 12 | 28.57% | 0 | 0 | 30 | 71.43% | 0 | 0 |
| East China | 78 | 38 | 48.72% | 14 | 17.95% | 17 | 21.79% | 9 | 11.54% |
| North China | 33 | 3 | 9.09% | 4 | 12.12% | 11 | 33.33% | 15 | 45.45% |
| Southwest China | 38 | 7 | 18.42% | 1 | 2.63% | 12 | 31.58% | 18 | 47.37% |
© 2020 by the authors. Licensee MDPI, Basel, Switzerland. This article is an open access article distributed under the terms and conditions of the Creative Commons Attribution (CC BY) license (http://creativecommons.org/licenses/by/4.0/).
Share and Cite
MDPI and ACS Style
Huang, X.; Li, Y.; Guo, Y.; Zheng, D.; Qi, M. Assessing Urban Risk to Extreme Heat in China. Sustainability 2020, 12, 2750. https://0-doi-org.brum.beds.ac.uk/10.3390/su12072750
AMA Style
Huang X, Li Y, Guo Y, Zheng D, Qi M. Assessing Urban Risk to Extreme Heat in China. Sustainability. 2020; 12(7):2750. https://0-doi-org.brum.beds.ac.uk/10.3390/su12072750
Chicago/Turabian StyleHuang, Xiaojun, Yanyu Li, Yuhui Guo, Dianyuan Zheng, and Mingyue Qi. 2020. "Assessing Urban Risk to Extreme Heat in China" Sustainability 12, no. 7: 2750. https://0-doi-org.brum.beds.ac.uk/10.3390/su12072750
Note that from the first issue of 2016, this journal uses article numbers instead of page numbers. See further details here.