Decoupling of Land Use Intensity and Ecological Environment in Gansu Province, China


1
Key Laboratory of Land Surface Pattern and Simulation, Institute of Geographic Sciences and Natural Resources Research, Chinese Academy of Sciences, Beijing 100101, China
2
College of Tourism and Urban-Rural Planning, Chengdu University of Technology, Chengdu 610059, China
3
College of management science, Chengdu University of Technology, Chengdu 610059, China
*
Authors to whom correspondence should be addressed.
Sustainability 2020, 12(7), 2779; https://0-doi-org.brum.beds.ac.uk/10.3390/su12072779
Submission received: 13 February 2020
/
Revised: 19 March 2020
/
Accepted: 27 March 2020
/
Published: 1 April 2020
(This article belongs to the Section Sustainable Urban and Rural Development)
Abstract
:Land is the carrier of the production and living activities of human society and the basis of survival and development of all living organisms. With the continuous development of the social economy, the unreasonable use of land is becoming more and more serious, aggravating the deterioration of the ecological environment. Most studies in this field have mainly focused on land use changes and the corresponding impacts on the ecological environment, but relatively few studies have delinked the relationship between land use intensity and the ecological environment. Based on data on these two factors for Gansu Province from 1998 to 2017, we used the Tapio decoupling model to evaluate the decoupling relationship between land use intensity and ecological environment. From 1998 to 2017, the comprehensive land use intensity in Gansu province increased by 107.77%, and the comprehensive ecological environment index increased by 63.76%. In general, the relationship between land use intensity and ecological environment experienced five states, namely weak decoupling, strong negative decoupling, strong decoupling, expansive negative decoupling, and declining decoupling. During 1999–2013 and 2013–2016, land use intensity and ecological environment had decoupled, and the main reasons were as follows: (1) The Chinese government introduced a series of farmland protection policies and measures, controlled the area of newly added construction land, and reduced urban land expansion; (2) ecological restoration projects for mountains, forests, fields, lakes, and grassland strengthened the environmental protection in Gansu Province; and (3) in the process of economic development, the increased investment of technology and capital improved the land use efficiency, finally realizing the “double growth” of land use intensity and environmental quality. Based on these results, land use intensity and environmental quality are not necessarily contradictory, and a moderate improvement of land use efficiency and environmental protection can probably result in increased land use intensity and higher environmental quality.
1. Introduction
Land is the material basis of human survival [1]. During the development from an agricultural to an industrial society, the upgrading of economic and industrial structures is closely related to the change of land use types. With the development of society and economy, humans often overstrain the bearing capacity of land while pursuing the highest output and the optimal benefits, which often leads to numerous ecological and environmental problems such as land degradation, land desertification, and soil erosion. Therefore, several studies have focused on the mutual relationship between land use intensity and the ecological environment.
Land use intensity refers to the degree of land transformation by a series of economic and technological measures and is an important driving force for global environmental change [2]. Studies on land use intensity have started with investigations of intensive land use, including intensive agricultural land use and intensive urban land use [3,4]. Saarinen’s organic evacuation theory and Weber’s industrial location theory and agricultural land rent theory have laid a theoretical foundation for studies on intensive land use (land use intensity). On this basis, intensive land use types or land use intensity modes such as “smart growth” [5,6] and “compact development” [3,7,8] are further extended. With the deepening of related studies, some researchers have pointed out several problems in the concept of land use intensity itself. For example, Kuemmerle considered that the complexity of the concept of land use intensity and the lack of assessment data could lead to an insufficient understanding of the concept [9].
The assessment index and method are the key contents of land use intensity research, and numerous studies have been performed in this context. In terms of the assessment index of land use intensity, Ellis et al. [10] selected land use types and population density as the main indices and generated the map of global land use intensity changes. Erb et al. [11] monitored and analyzed land use intensity changes by using three indices: land input, land output, and the impacts of land use intensity changes on land production activities (such as carbon storage and biodiversity changes). In terms of the assessment methods of land use intensity, Asselen et al. [12] used the global agricultural production efficiency map as a measurement index to measure land use intensity and calculated the global yield and efficiency of crops under different land use intensities. Liu et al. [13] used the decision tree method to generate a map of China’s land use intensity and found significant regional differences. In another study, Yan et al. [2] established a classification system of land use intensity and systematically evaluated China’s land use intensity and carrying capacity.
The earliest studies that combined land use with the ecological environment could be found in Man and Nature, published by Marsh in the 1860s [14]. In his book, Marsh pointed out that human misuse of natural resources was the source of ecological degradation. In the following period, studies on land use and ecological environment stagnated until the 1960s, when the global energy crisis broke out. Since then, studies on the impacts of land use on the ecological environment have been receiving extensive attention in land research, especially in land use planning. For example, the master plan for land use formulated by the United Kingdom focused on the impacts of different land use types on the ecological environment.
Since the beginning of the 21st century, the emergence of some new technologies and methods has further been promoting research on the relationship between land use and ecological environment. Using these new technologies and methods, researchers are assessing the effects of urbanization on the ecological environment. For example, Chen et al. [15] summarized the impact mechanism of urbanization on ecological environment using literature statistics and analysis software such as Spss and Citespace. They also predicted the frontier research hotspots of the effects of urbanization on ecological environment. In addition, Lei et al. [16] and He et al. [17] simulated the coupling relationship between urbanization and air quality using CCDM (Coupling Coordination Degree Model). For the same research topic, Zhao et al. [18] discerned the interrelationship between urbanization and land use in the Yangtze River Delta of China, using an improved EKC (Environment Kuznets Curve) model. It is concluded that the coordination and coupling process in Yangtze River Delta of China has changed significantly, that is, changing from the “low symbiosis” stage to the “bursting development” stage [18]. In addition, Wang [19] established an index system to quantitatively analyze the relationship between urban development and the ecological environment in Bohai Rim of China. It was found that the dependence of human activities on ecological resources gradually increases over time.
In spite of the effects of urbanization on the ecological environment, researches on the impacts of land use change on the living environment also received many concerns. For example, Lu et al. [20] discerned the changes in land use by remote sensing technology, and assessed the changes in ecosystem service resulting from land use change. Wu et al. [21] identified the land use and land cover changes in Hangzhou of China by interpreting land satellite images. They found that the increase of human activities is the main reason for the decrease of ecosystem service. In addition, Debnath et al. [22] assessed the impacts of river migration on land use change in India.
In summary, the current researches on the relationship between land use and the ecological environment focus on the coupling relationship between land use change and the ecological environment. In addition, the effects of land use change on the environment received much concerns. Relatively speaking, there are few studies focusing on discerning the decoupling relationship between land use intensity and ecological environment. In fact, changes in land use intensity is a very important research topic worldwide. Therefore, taking Gansu Province, an ecologically fragile region in China, as an example, we built a decoupling model to assess the relationship between changes in land use intensity and environment.
2. General Situation of the Study Area
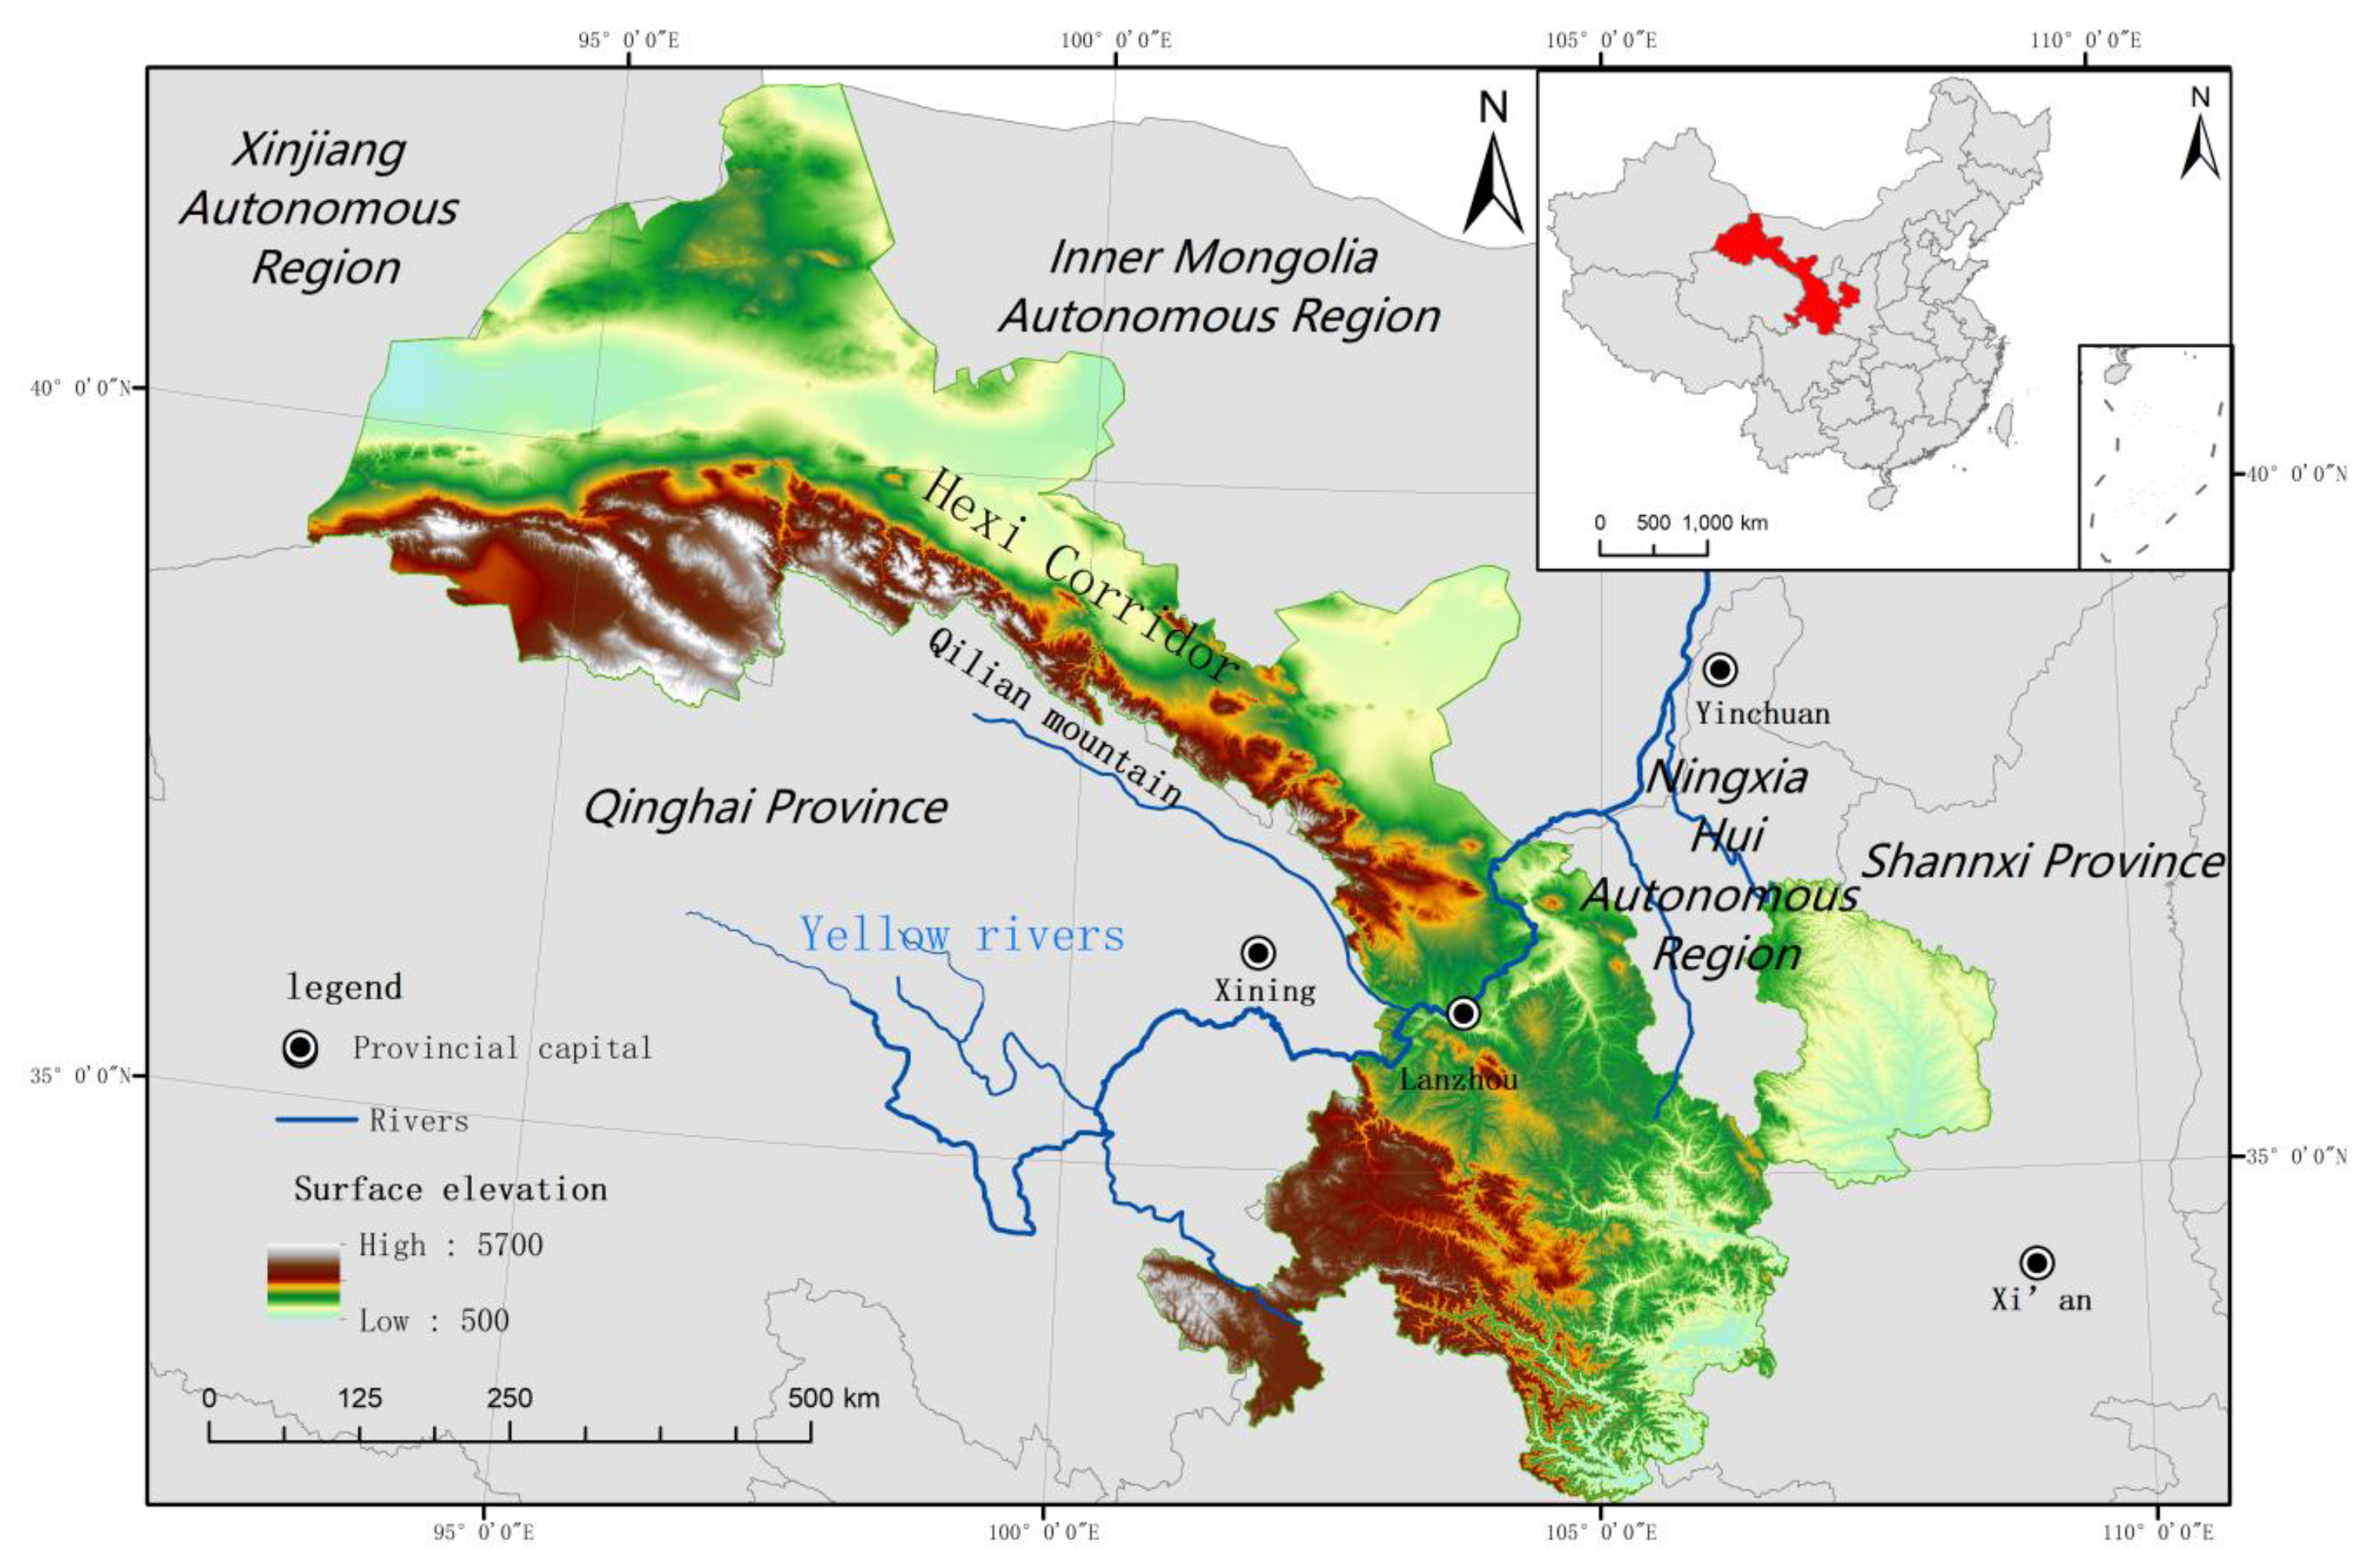
Gansu Province is located in western China within the range of 32°11′N-42°57′N and 92°13′E-108°46′E (Figure 1), representing a long and narrow corridor. It is located at the intersection of the monsoon region in eastern China, the semi-arid region in northwestern China, and the Qinghai-Tibet high cold region, and the structure of the ecological landscape shows significant differences in different zones. Gansu Province has a typical continental climate with a relatively large annual temperature variation of -13-17°C; average annual precipitation is less than 300 mm. The rainy and the hot period fall within the same season, and arid and semi-arid regions account for up to 75% of the total area. From the perspective of topography, the terrain is high in the west and low in the east, and the regions adjacent to the Qinghai-Tibet Plateau are consecutive mountainous areas with elevations above 4000 m. In the central and western regions with elevations below 2000 m, the flood plains and desert oases are well developed. Due to the impacts of climate, topography, and sea-land location, unused land (desert, Gobi, alpine rock mountains, bare rocks, and low-lying salt and alkali land) is widely distributed in Gansu, accounting for 41.85% of the total land area of the province. Unused land is mainly distributed in the west, while woodland and grassland are mainly distributed in the east.
3. Data Sources and Research Methods
3.1. Research Methods
3.1.1. Selection of Assessment Indices
We selected appropriate indices to assess the land use intensity and environmental situation in Gansu Province. Based on previous studies [23,24,25,26] and the actual situation of the study area, and following the principles of scientificity, relevance, hierarchy, ease of operation, and feasibility, we selected the assessment indices of land use intensity in Gansu Province mainly from the three aspects of land use structure, land use input, and land use output, which involve a total of five assessment indices. The ecological indices mainly include the normalized differential vegetation index (NDVI) and the greening ratio of built-up areas (Table 1).
Land use structure refers to the proportion weights of different types of land. Different types of land have different land use means and thus different impacts on the ecological environment. Generally speaking, the area increase of forest land and grassland contributes to the improvement of the ecological environment; construction land mainly involves the hardening of original land, while the production behaviors of the secondary and tertiary industries on construction land are more likely to cause environmental pollution. In addition, the same land use types may have different ecological and environmental impacts due to different inputs and outputs. To describe the intensity differences of different land use types, we adopted the research results of Zhuang et al. [27]. In this research, the intensity of different land use types was divided into four grades according to the capacity of keeping natural balance status of certain land use type under the influences of social and economic activities. In the intensity division system, the numbers 1 to 4 were used to describe the land use intensity, in which 1 represents the unused land, 2 represents other land use types, 3 represents the farmland, and 4 represents the construction land [26]. The land use intensity gradually increased from 1 to 4. The formula for calculating the intensity of land use structure is as follows:
where LUSI represents the intensity of land use structure, n represents the category of land use, m represents the specific land type, Dm represents the grade of land use intensity of the m-th land use type, and Am represents the percentage of the area of the m-th land use structure intensity grade.
Here, we used the population density as an index of land use input. Land use output is an important index to reflect land use efficiency. Generally, without considering the external factors, for the same land use types, higher crop yield, gross domestic product (GDP), and fiscal revenue per unit of land can represent a higher land use intensity.
The quality of the ecological environment can be measured by the ecological environment comprehensive index. In this study, two indices, namely the NDVI and the greening ratio of built-up areas, were selected to represent the level of the ecological environment comprehensive index. The NDVI can monitor the changes of ground vegetation and is the best indicator for characterizing vegetation growth state and spatial distribution density; the higher the NDVI, the better the environmental quality. The calculation steps of the NDVI in Gansu Province from 1998 to 2017 can be divided into the following three steps:
Step 1. Definition of the calculation expression of NDVI as
where represents the normalized differential vegetation index, represents the near-infrared band, and represents the red band.
Step 2. Screening of satellite images by GEE. Since the time period of this study is from 1998 to 2017, we selected Landsat5 and Landsat 7 remote sensing images as the data sources considering the data availability. The remote sensing images were selected according to the time series and image quality. The remote sensing images of Landsat5 were used from 1998 to 2000 while the images of Landsat7 were used from 2001 to 2017. According to the characteristics of images, B4 is the near-infrared band and B3 is the red band. Yearly images were used for the research. In addition, the cloud cover of the images had to be less than 10%.
Step 3. Based on the screened images, and according to the NDVI calculation formula, the NDVI was calculated and the data were synchronized to cloud disk, finally generating the NDVI grid images of Gansu Province from 1998 to 2017.
The greening ratio of built-up areas is also an important indicator when measuring environmental quality, and generally, the higher the greening ratio of built-up areas, the better the environmental quality.
3.1.2. Data Normalization
For the assessment index system composed of multiple factors, there are great differences in the dimension, the order of magnitude, and the index properties of the original data of different indices. To eliminate the format inconsistencies, the original data were nondimensionalized by the maximum difference normalization method. Since there are positive and negative index attributes, different standards are used in the dimensionless process. The normalization formula is as follows [16]:
Positive indices:
Negative indices:
where is the original value of the j-th index in the i-th year, is the maximum value of the j-th index in the i-th year, is the minimum value of the j-th index in the i-th year, and is the normalized value of the j-th index in the i-th year.
3.1.3. Determination of Index Weights
To avoid the subjectivity of assessment indices and to make the assessment indices more scientific and reasonable, we adopted the entropy method to determine their weights. The weight values are listed in Table 1. The specific steps to determine the weights are as follows [17,28,29]:
Step 1. Calculation of the proportion of the j-th index in the i-th year:
where is the normalized value.
Step 2. Calculation of the entropy of the index:
Step 3. Calculation of the difference coefficient :
Step 4. Calculation of the weight of each index:
3.1.4. Decoupling Assessment Model and Calculation of Decoupling Elasticity Value
The calculation of the decoupling model for land use intensity and the ecological environment is specialized as follows.
1. Land use intensity comprehensive index.
Land use intensity is determined by comprehensively considering the normalized land use intensity, population density, crop yield per unit of land, GDP per unit of land, and fiscal revenue per unit of land. The formula is as follows:
where F (x) is the comprehensive score of the land use intensity system, is the weight of the i-th assessment index of land use intensity, is the normalized value of the i-th assessment index of land use intensity, and m is the number of land use intensity systems.
2. Ecological environment comprehensive index.
The status of the ecological environment mainly considers the two indices, normalized NDVI and the greening ratio of built-up areas. The calculation formula of the ecological environment composite index is as follows:
where G(y) is the comprehensive score of ecological environment system; is the weight of the j-th assessment index of ecological environment; is the normalized value of the j-th assessment index of the ecological environment, and n is the number of ecological environmental systems.
3. Calculation method of decoupling elasticity index.
The decoupling assessment model of land use intensity and environmental quality in Gansu Province can be developed by referring to Tapio et al. [30,31,32,33]:
where represents the decoupling elasticity index of the (n+1)-th year, represents the land use intensity of the (n + 1)-th year, represents the land use intensity of the n-th year, represents the environmental quality of the (n + 1)-th year, and represents the environmental quality of the n-th year.
4. Decoupling elasticity critical value and division of coordinate values.
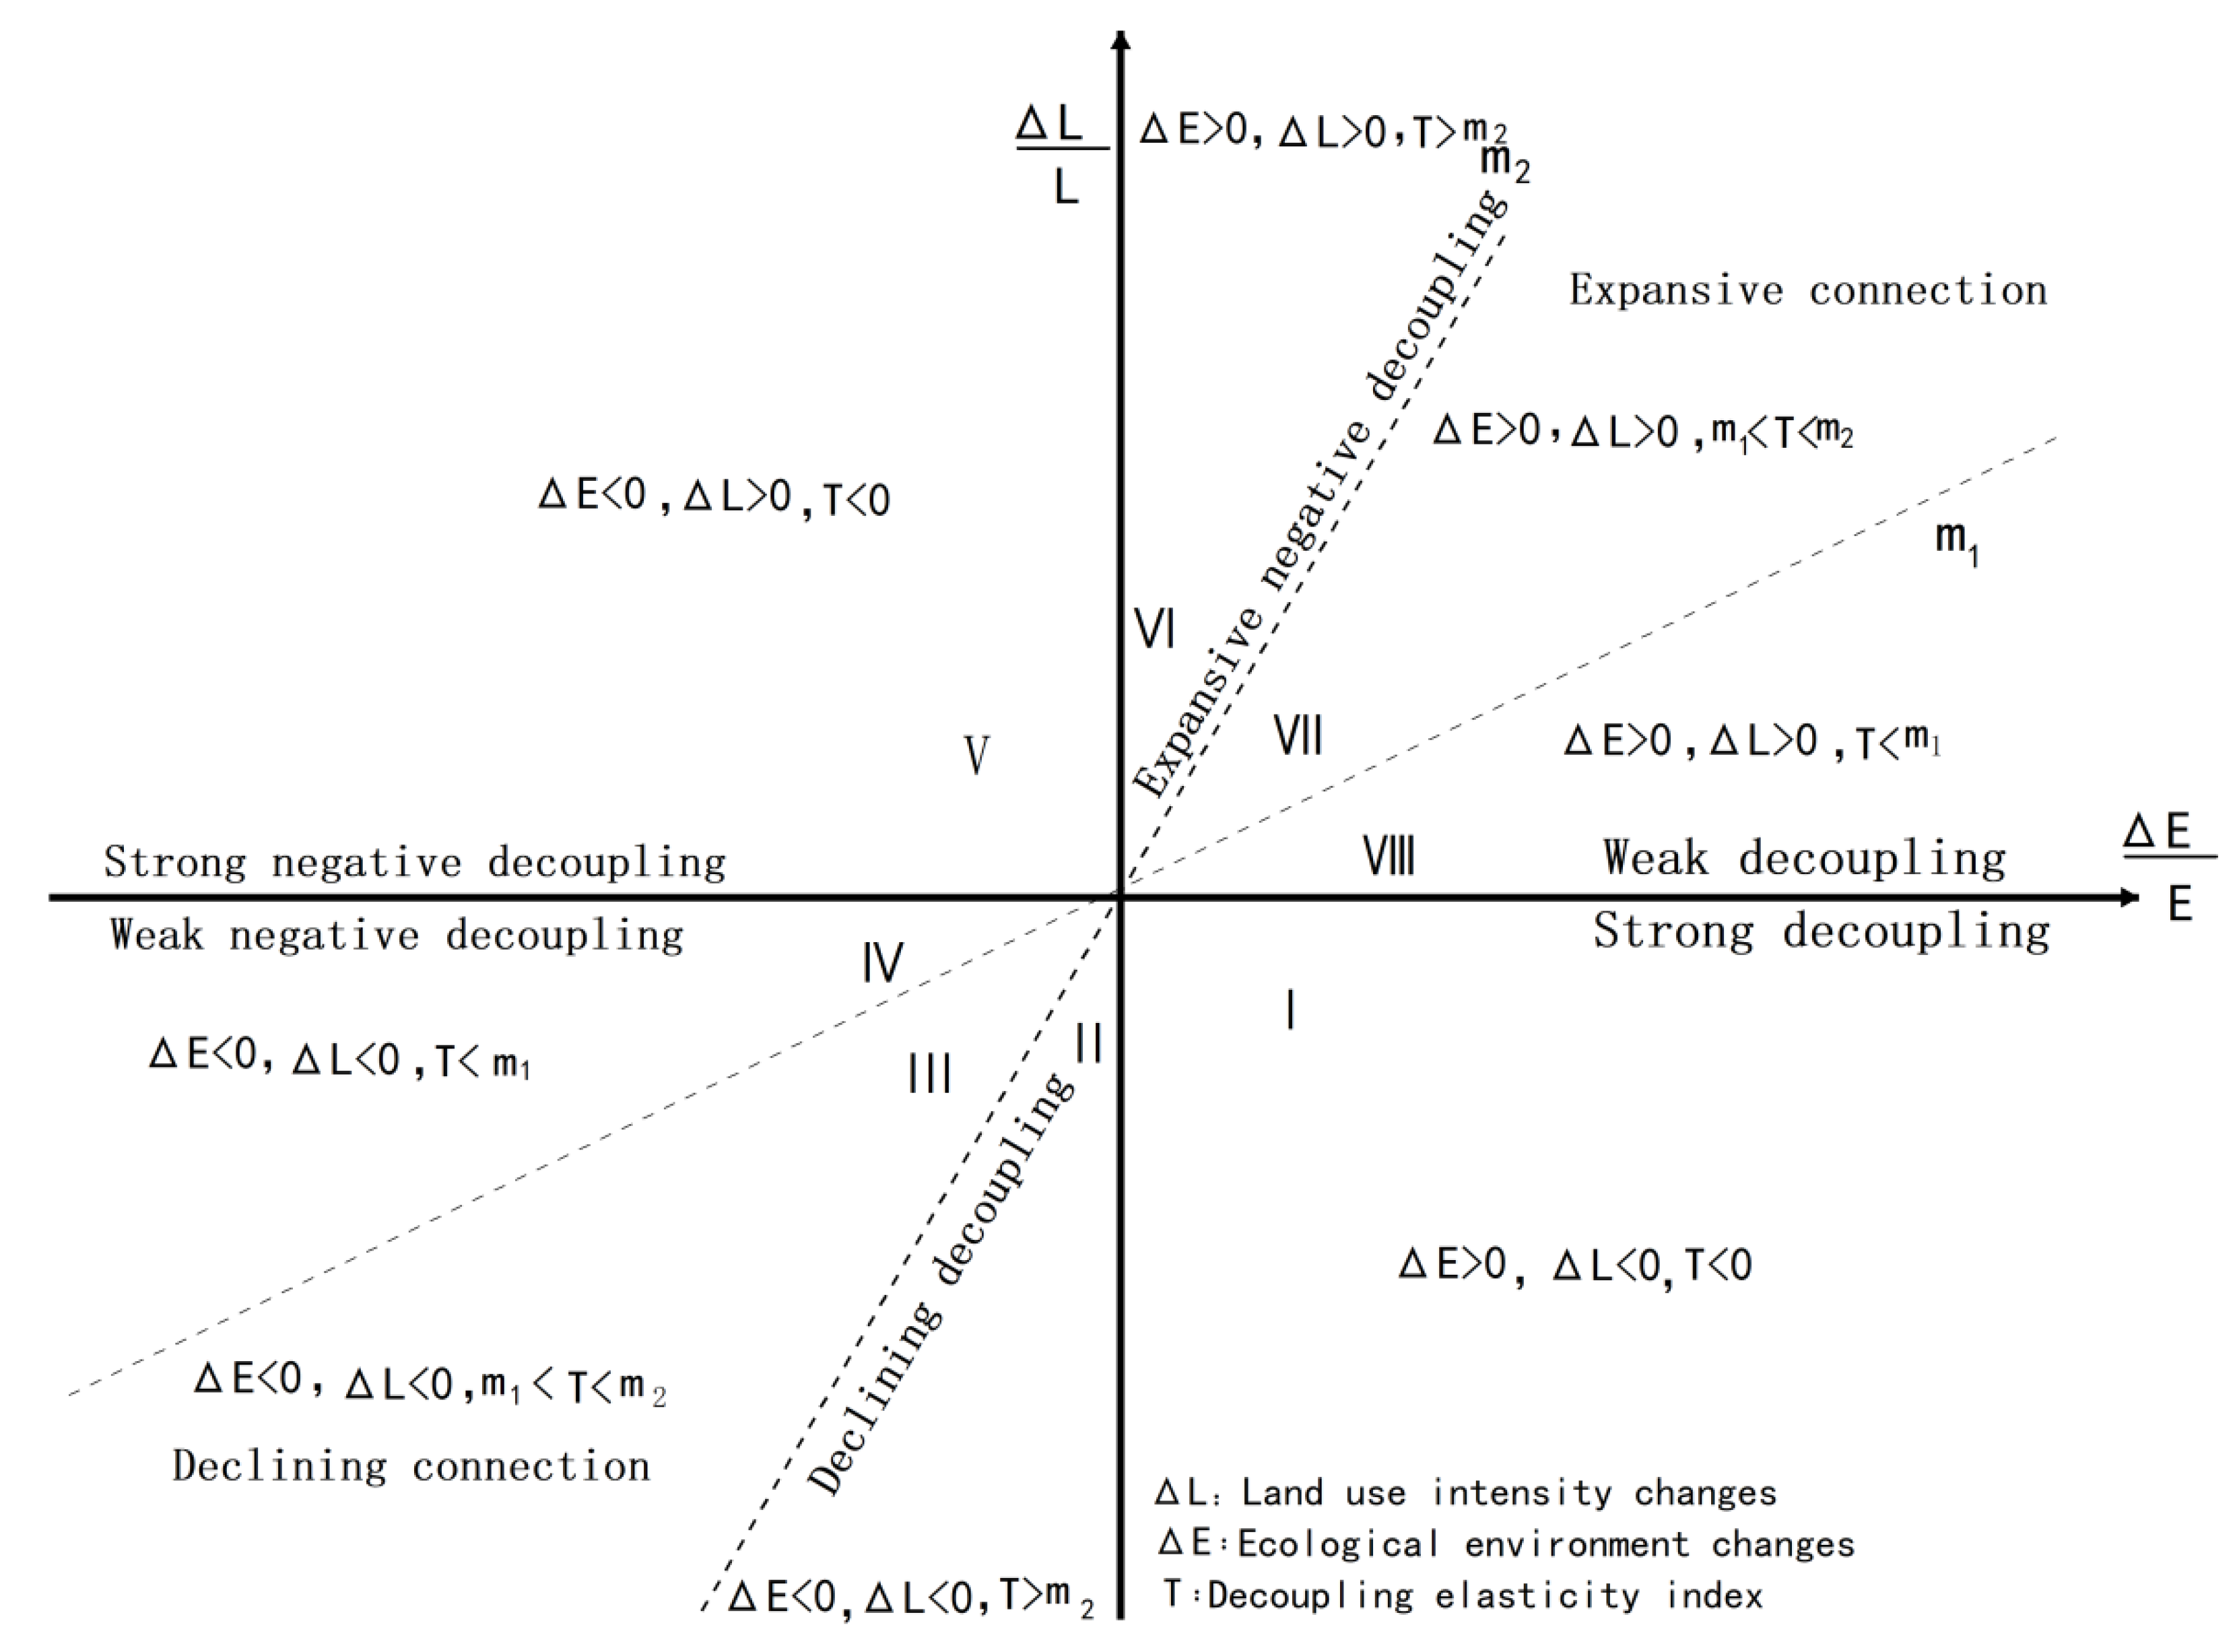
According to previous studies [34,35,36], the critical values of decoupling elasticity are expressed by m1 and m2, with values of 0.8 and 1.2, respectively. With changes in labor and technology input, the land use intensity and the environmental quality may be decoupled. However, under certain circumstances, the relationship between the two may be recovered or reversed, that is, the relationship becomes a strong negative decoupling or recoupling. Based on the above analysis and by referring to similar research [30], the coordinate chart of the decoupling degree suitable for land use intensity and environmental quality in this paper can be established (Figure 2).
Along with the improvement of environmental quality ( > 0), the land use intensity decreases () and the decoupling elasticity index T is negative (T < 0). In this case, environmental quality and land use intensity are “decoupled”, which is the ideal state in which land use intensity and ecological environment coordinate with each other best (as shown in Zone I in Figure 2).
Along with the degradation of environmental quality ( < 0), the land use intensity increases () and the decoupling elasticity index T is negative (T < 0). In this case, the environmental quality and land use intensity are “negatively decoupled”, which is referred to as a strong negative decoupling. This is the least ideal state for the relationship between land use intensity and ecological environment (as shown in Zone V in Figure 2).
In addition to the above two kinds of decoupling states, there are six more states: “declining decoupling” (T > m2, as shown in Zone II in Figure 2), “declining connection”(m1 < T < m2, as shown in Zone III in Figure 2), “weak negative decoupling (T< m1, as shown in Zone IV in Figure 2), “expansive negative decoupling” (T > m2, as shown in Zone VI in Figure 2), “expansive connection” (m1<T<m2, as shown in Zone VII in Figure 2), and “weak decoupling” (T< m1, as shown in Zone III in Figure 2). For these six decoupling states, the relationship between land use intensity and ecological environment ranges between strong decoupling and strong negative decoupling.
3.2. Data Sources
The data used in this study consisted of land use intensity data and environmental quality data. Land use intensity data, precipitation data, and greening ratio of built-up areas were mainly obtained from the Statistical Yearbook of Gansu Province (1998–2017) [37], while the NDVI data were obtained by band calculation of remote sensing images and subsequent processing with the GEE data platform [38].
4. Results
4.1. Land Use Intensity Changes in Gansu Province
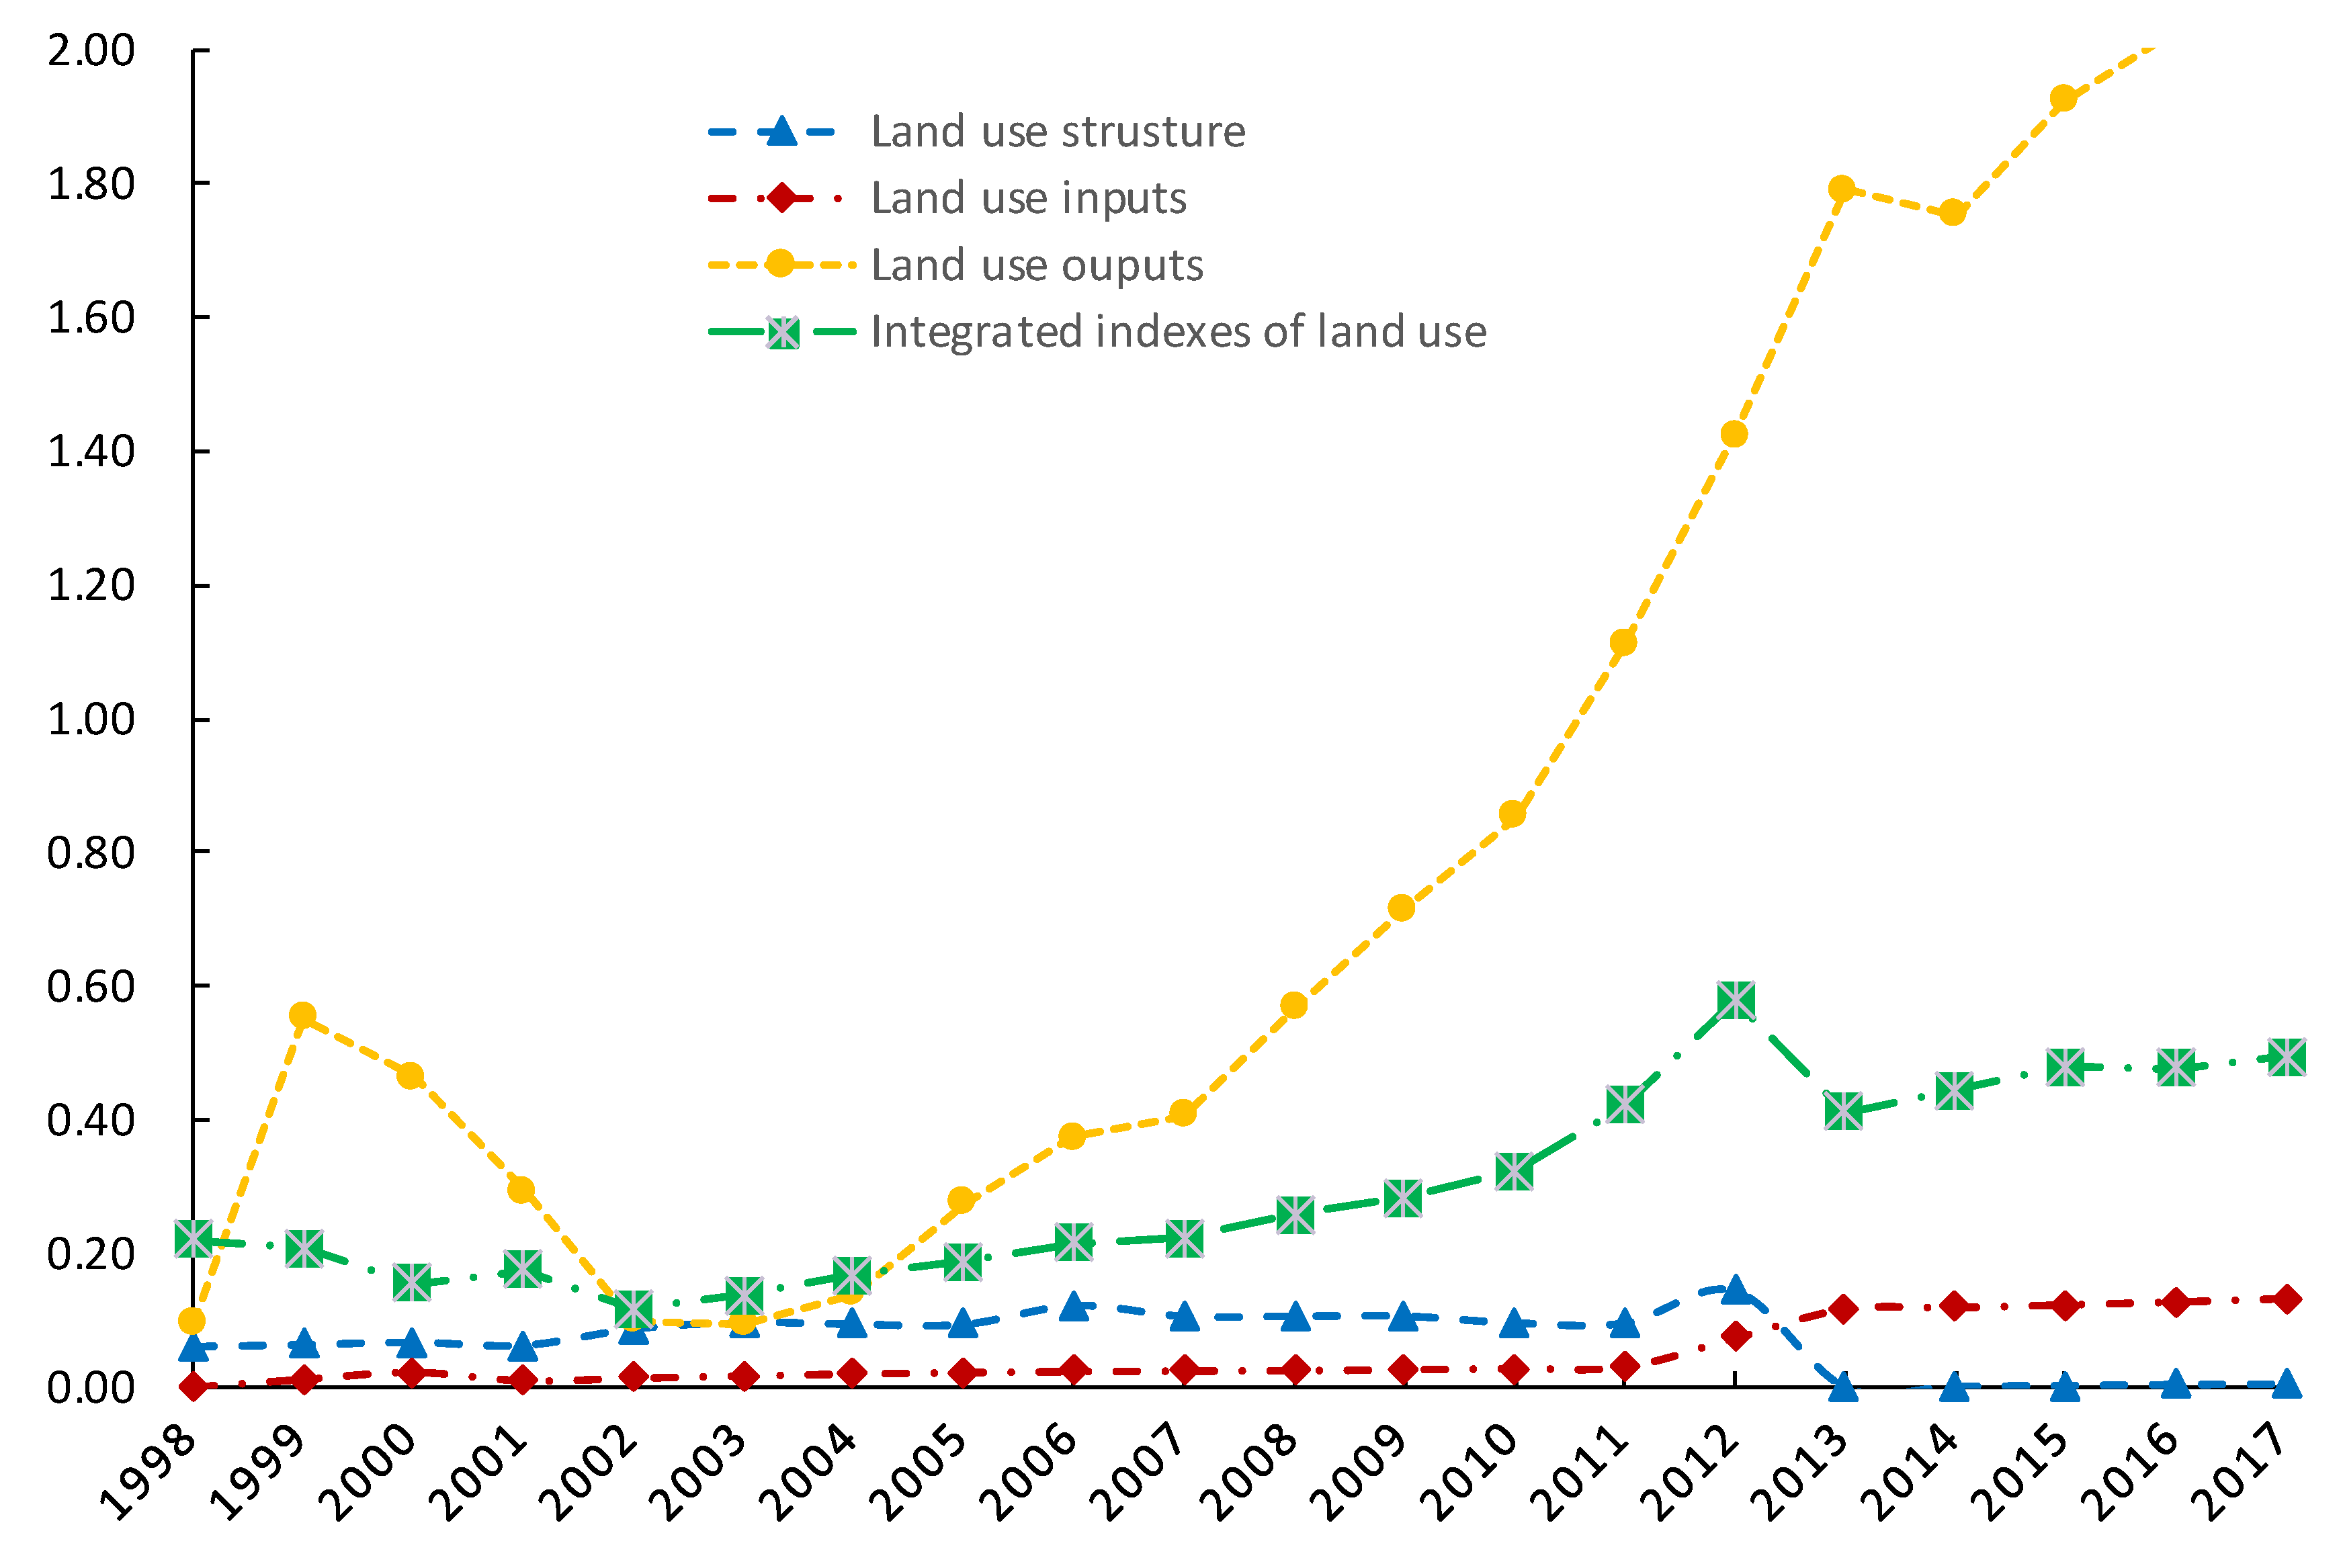
From 1998 to 2017, the land use structure, land use input, and land use output in Gansu Province showed different change trends (Figure 3). Overall, land use structure intensity presented a decreasing trend, while the total land use intensity, the land use output and the land use input showed an increasing trend. In general, the comprehensive level of land use intensity in Gansu Province was greatly affected by the land use input level. For example, from 1998 to 2012, the land use input showed a stable state, while the land use structure intensity increased and reached its maximum in 2012. In turn, the land use composite level index increased over the same period and reached its peak in 2012. In contrast, from 2012 to 2013, the intensity of integrated land use, land use structure intensity and land use output all showed a decrease trend. After 2013, the land use structure intensity and land use input kept stable while the overall land use intensity increased due to the increase of land use inputs. During this period, the Chinese government implemented a lot of strict policies of land conservation, strengthening the control on the general plan and the annual plan for land use, and improving the standards for land conservation, which significantly improved the efficiency and benefits of land use.
4.2. Ecological Environmental Quality Changes
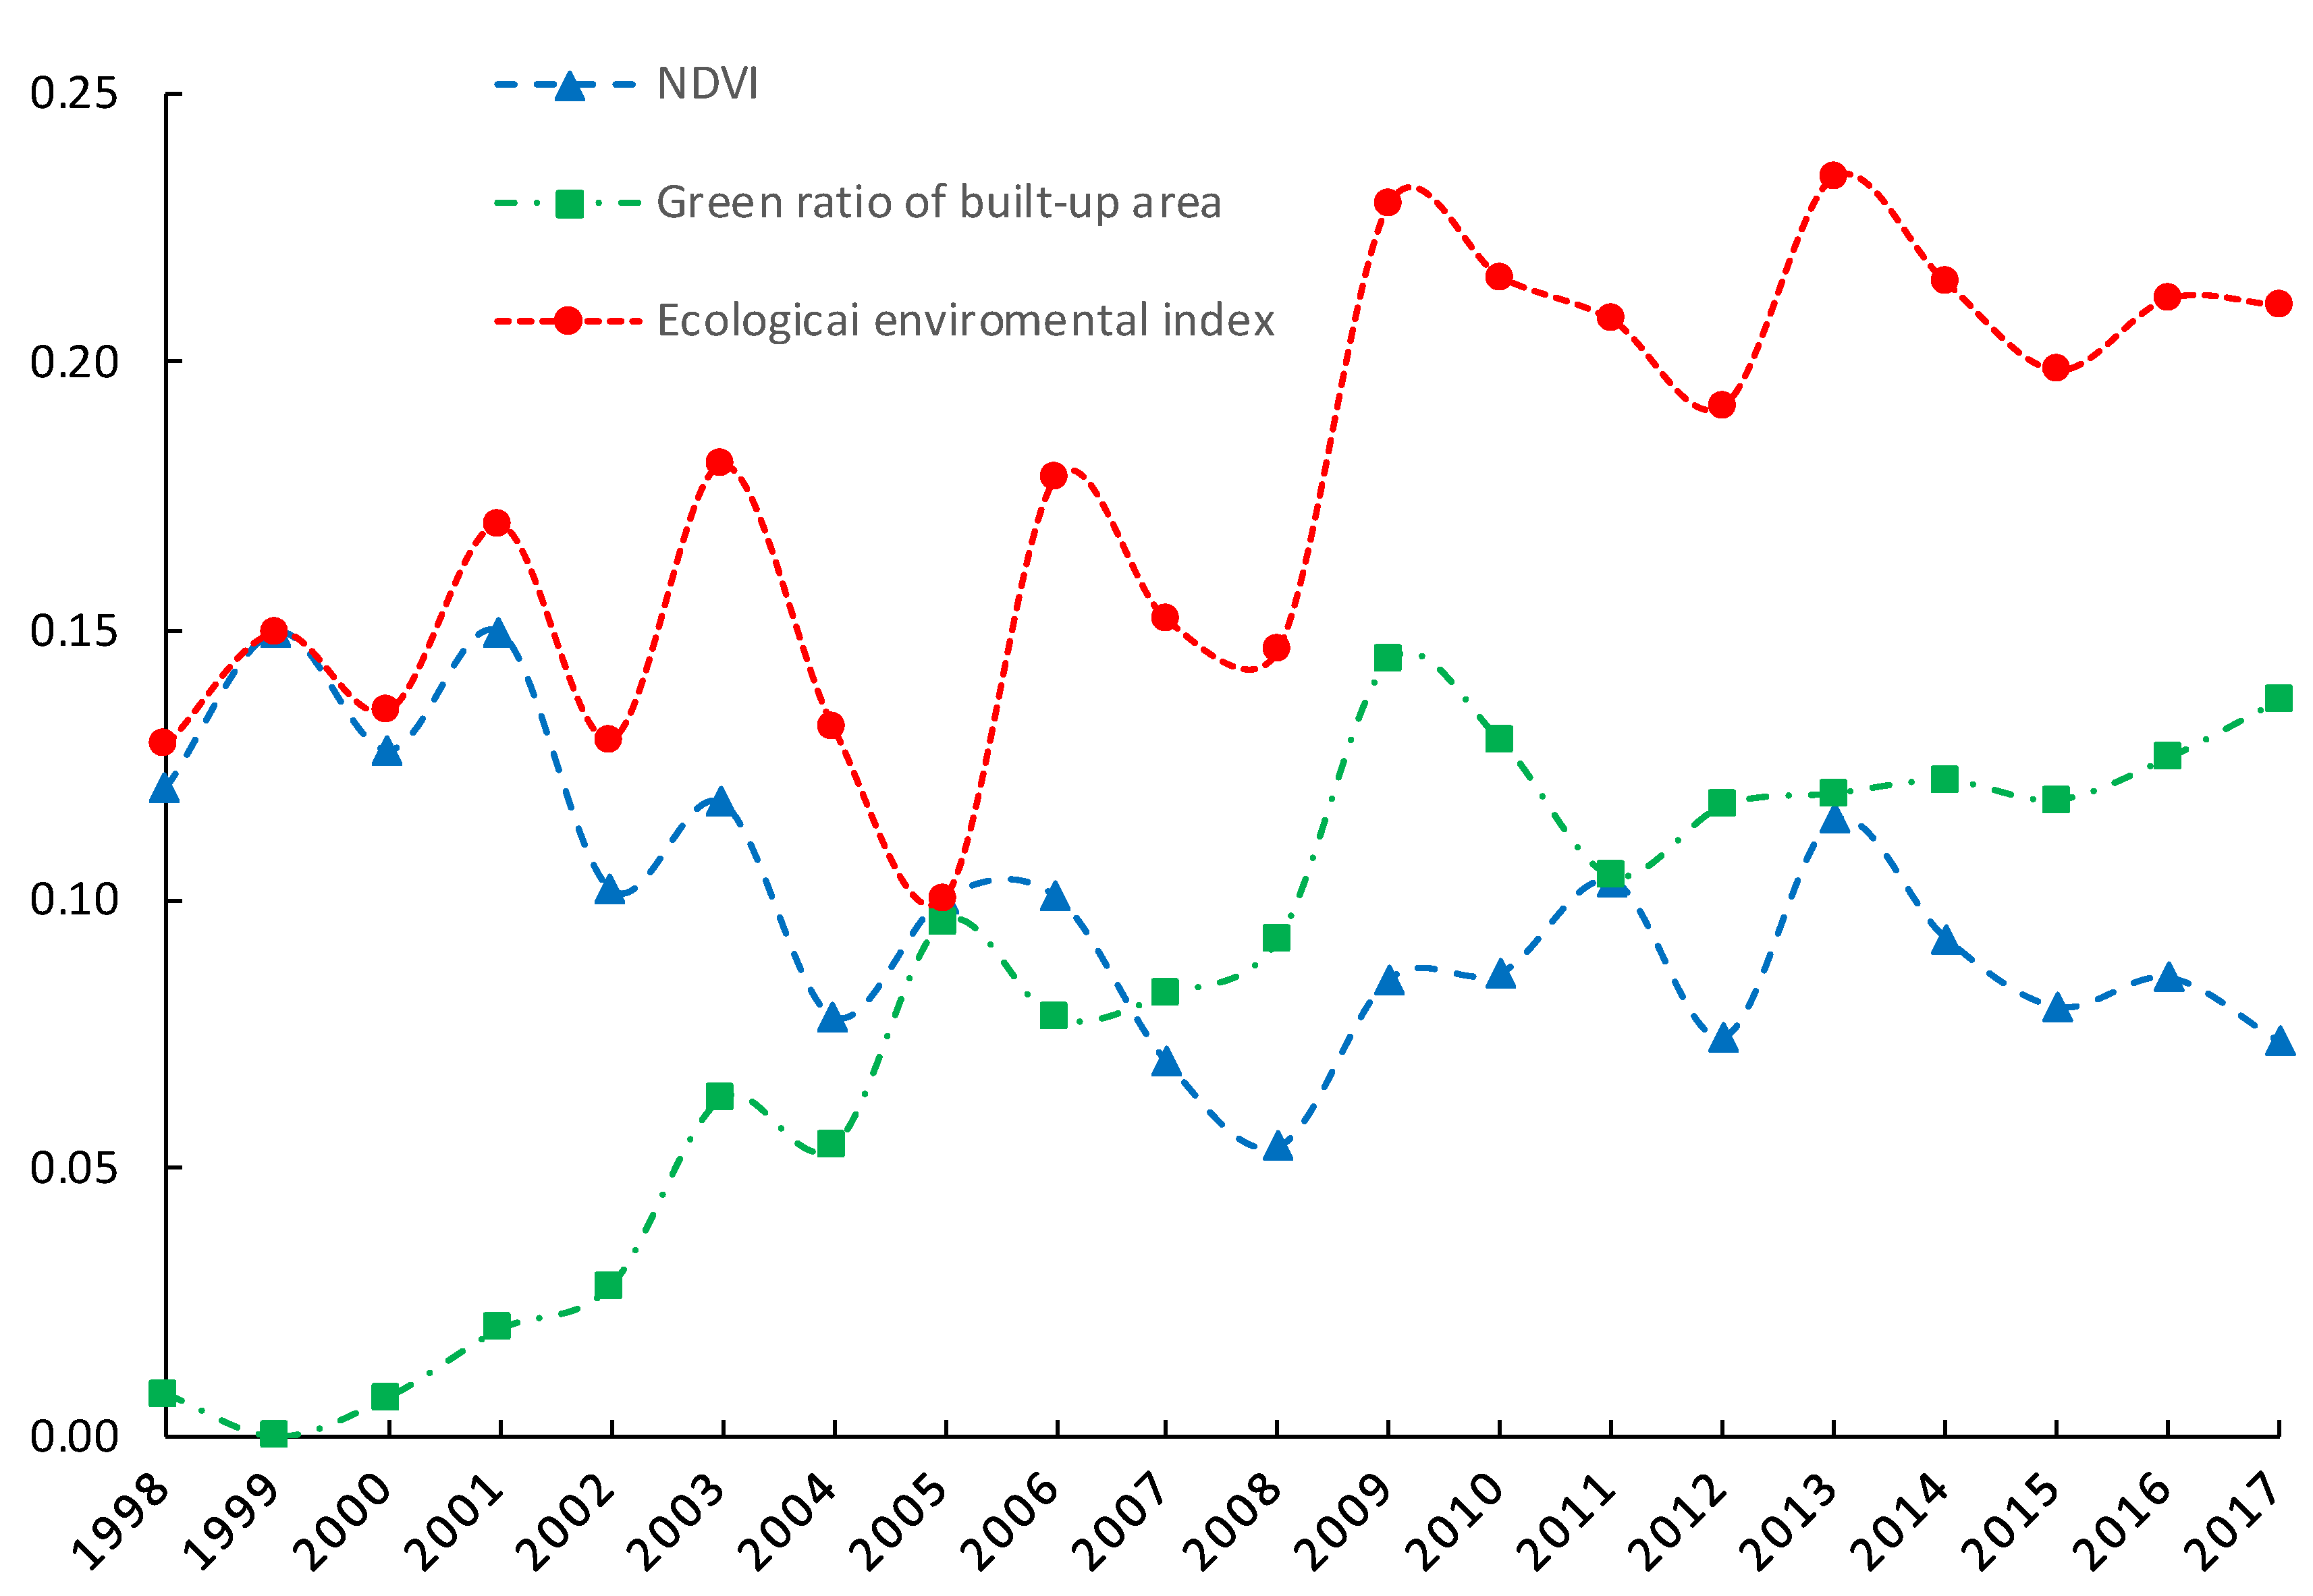
The change of the comprehensive quality of the ecological environment in Gansu Province is a dynamic process (Figure 4). From the perspective of the fluctuating balance level, the balance level of the environmental index is the highest, followed by that of the NDVI; the greening ratio of built-up areas showed the lowest level. From the perspective of fluctuating characteristics, the trends of the environmental index and the NDVI are basically the same, and the fluctuation range as well as the increasing or decreasing intervals are highly consistent. Prior to 2013, the ecological environment index and the NDVI presented a fluctuating decreasing trend, followed by a steady increase. By contrast, the fluctuation of the greening ratio in built-up areas was gentle, with a small fluctuation range. Before 2013, the greening ratio in built-up areas fluctuated approximately following the curve of the trig function; after that, it was relatively stable. From the perspective of the maximum and minimum points, the maximum value of the eco-environment index and the greening rate of the built-up area both appeared in 2009 while the minimum value of the eco-environment index appeared in 2005. In addition, NDVI decreased slowly during this period. The greening rate of the built-up area decreased significantly from 2009 to 2011. However, the minimum value of the greening rate of the built-up area appeared in 1999 when the ecological environment index was also at a low level.
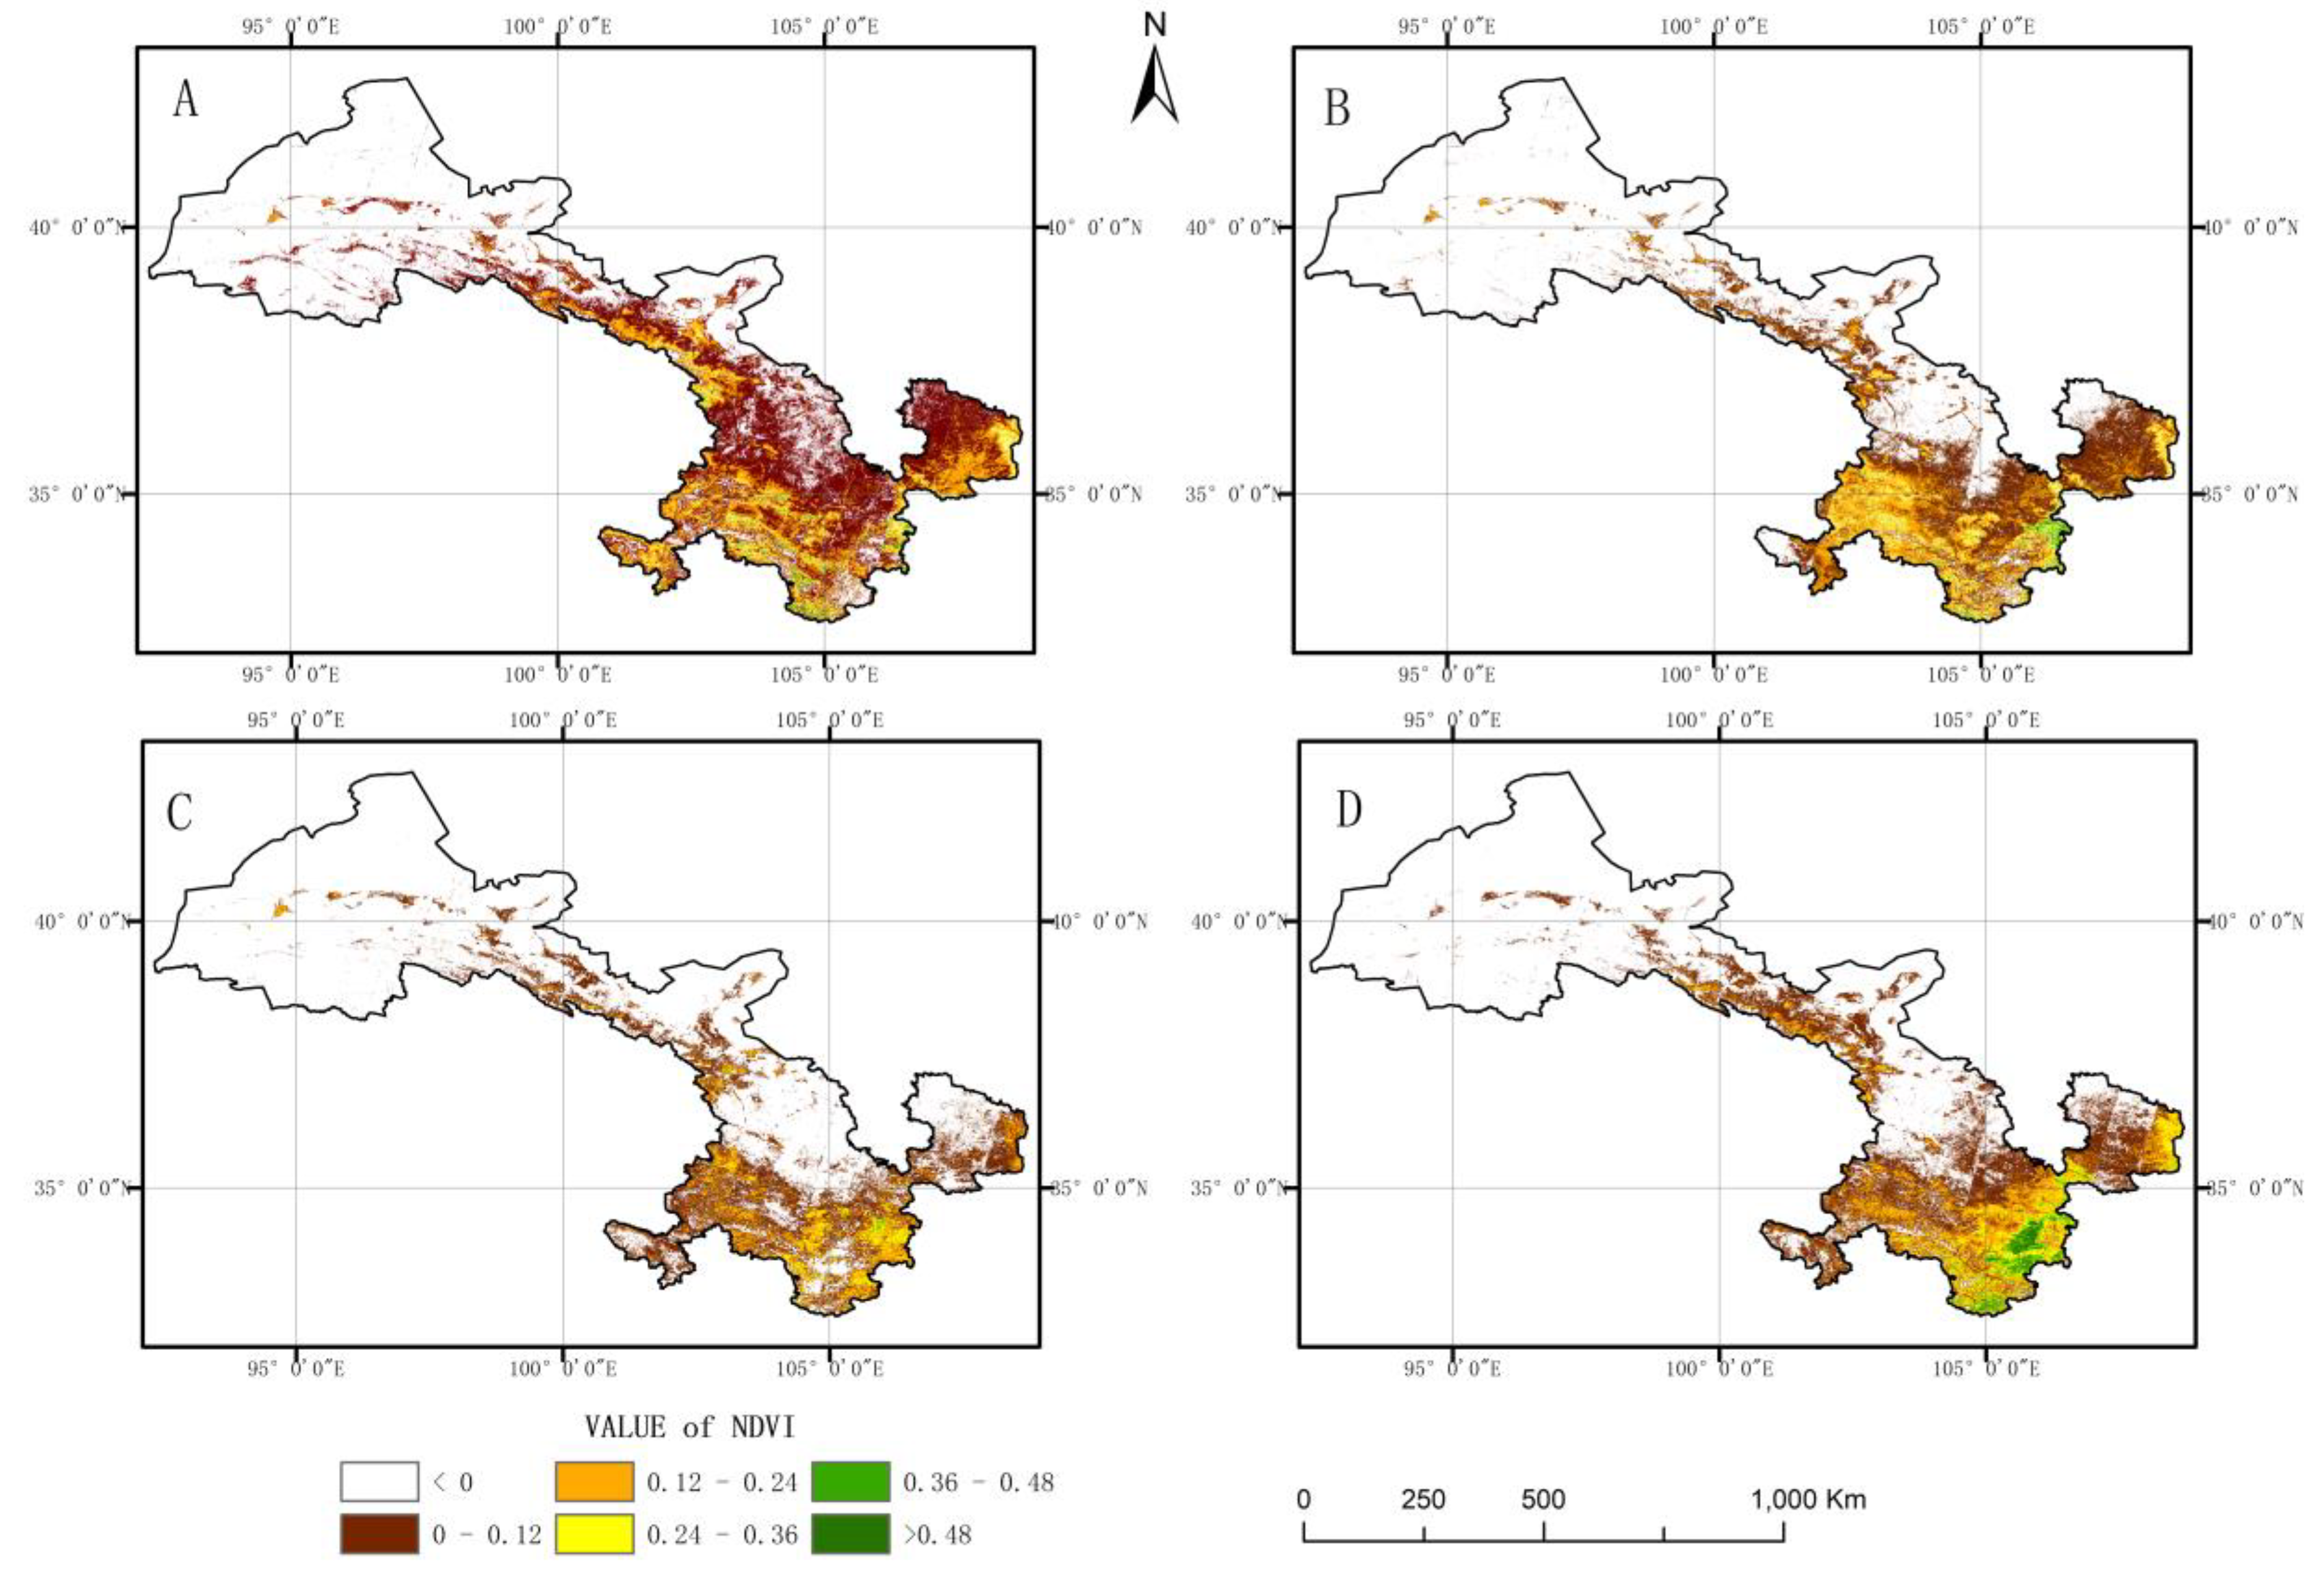
Based on the spatial distribution of the NDVI (Figure 5), the vegetation coverage in Gansu Province gradually declined from south to north. In the southern regions and the urban areas of the province, including Gannan, Tianshui, Longnan, Pingliang, and Qingyang, vegetation coverage was high, and the NDVI value was greater than zero. In some counties and districts of Longnan, the NDVI value was even above 0.48. By contrast, the regions north of Lanzhou and Baiyin showed a relatively small vegetation coverage. Except for the southern regions of Zhangye and Wuwei, with a low vegetation coverage, the NDVI values of other regions, such as Jiuquan, Jinchang, Baiyin, and Lanzhou, were below zero.
From 1997 to 2004, the vegetation coverage in Gansu Province decreased, especially in the central region of Gansu province. The NDVI value of central region changed from greater than zero in 1997 to less than zero in 2004. Nerveless, during the same period, the NDVI value of southern Gansu province increased. In particular, the NDVI value of some regions in southern Gansu province was as high as 0.36. From 2004 to 2011, the vegetation coverage of Gansu decreased slightly, especially in central Gansu. From 2011 to 2017, the NDVI of Gansu increased significantly. In 2017, the average NDVI value of southern Gansu was higher than 0.36. In addition, in central Gansu, NDVI values of some regions changed from less than zero in 2011 to greater than zero in 2017.
4.3. Decoupling Analysis of Land Use Intensity and Environmental Quality
According to Figure 2 and previous related researches [39,40,41,42,43], we divided the decoupling states of land use intensity and environmental quality in Gansu Province from 1998 to 2017 into five categories (Figure 2 and Table 2), including weak decoupling, strong negative decoupling, strong decoupling, expansive negative decoupling and declining decoupling. The duration of the five decoupling states accounted for 20%, 50%, 15%, 5%, and 10% of the total duration in the study area, respectively. In general, the time period showing strong decoupling accounted for 15% of the total study period.
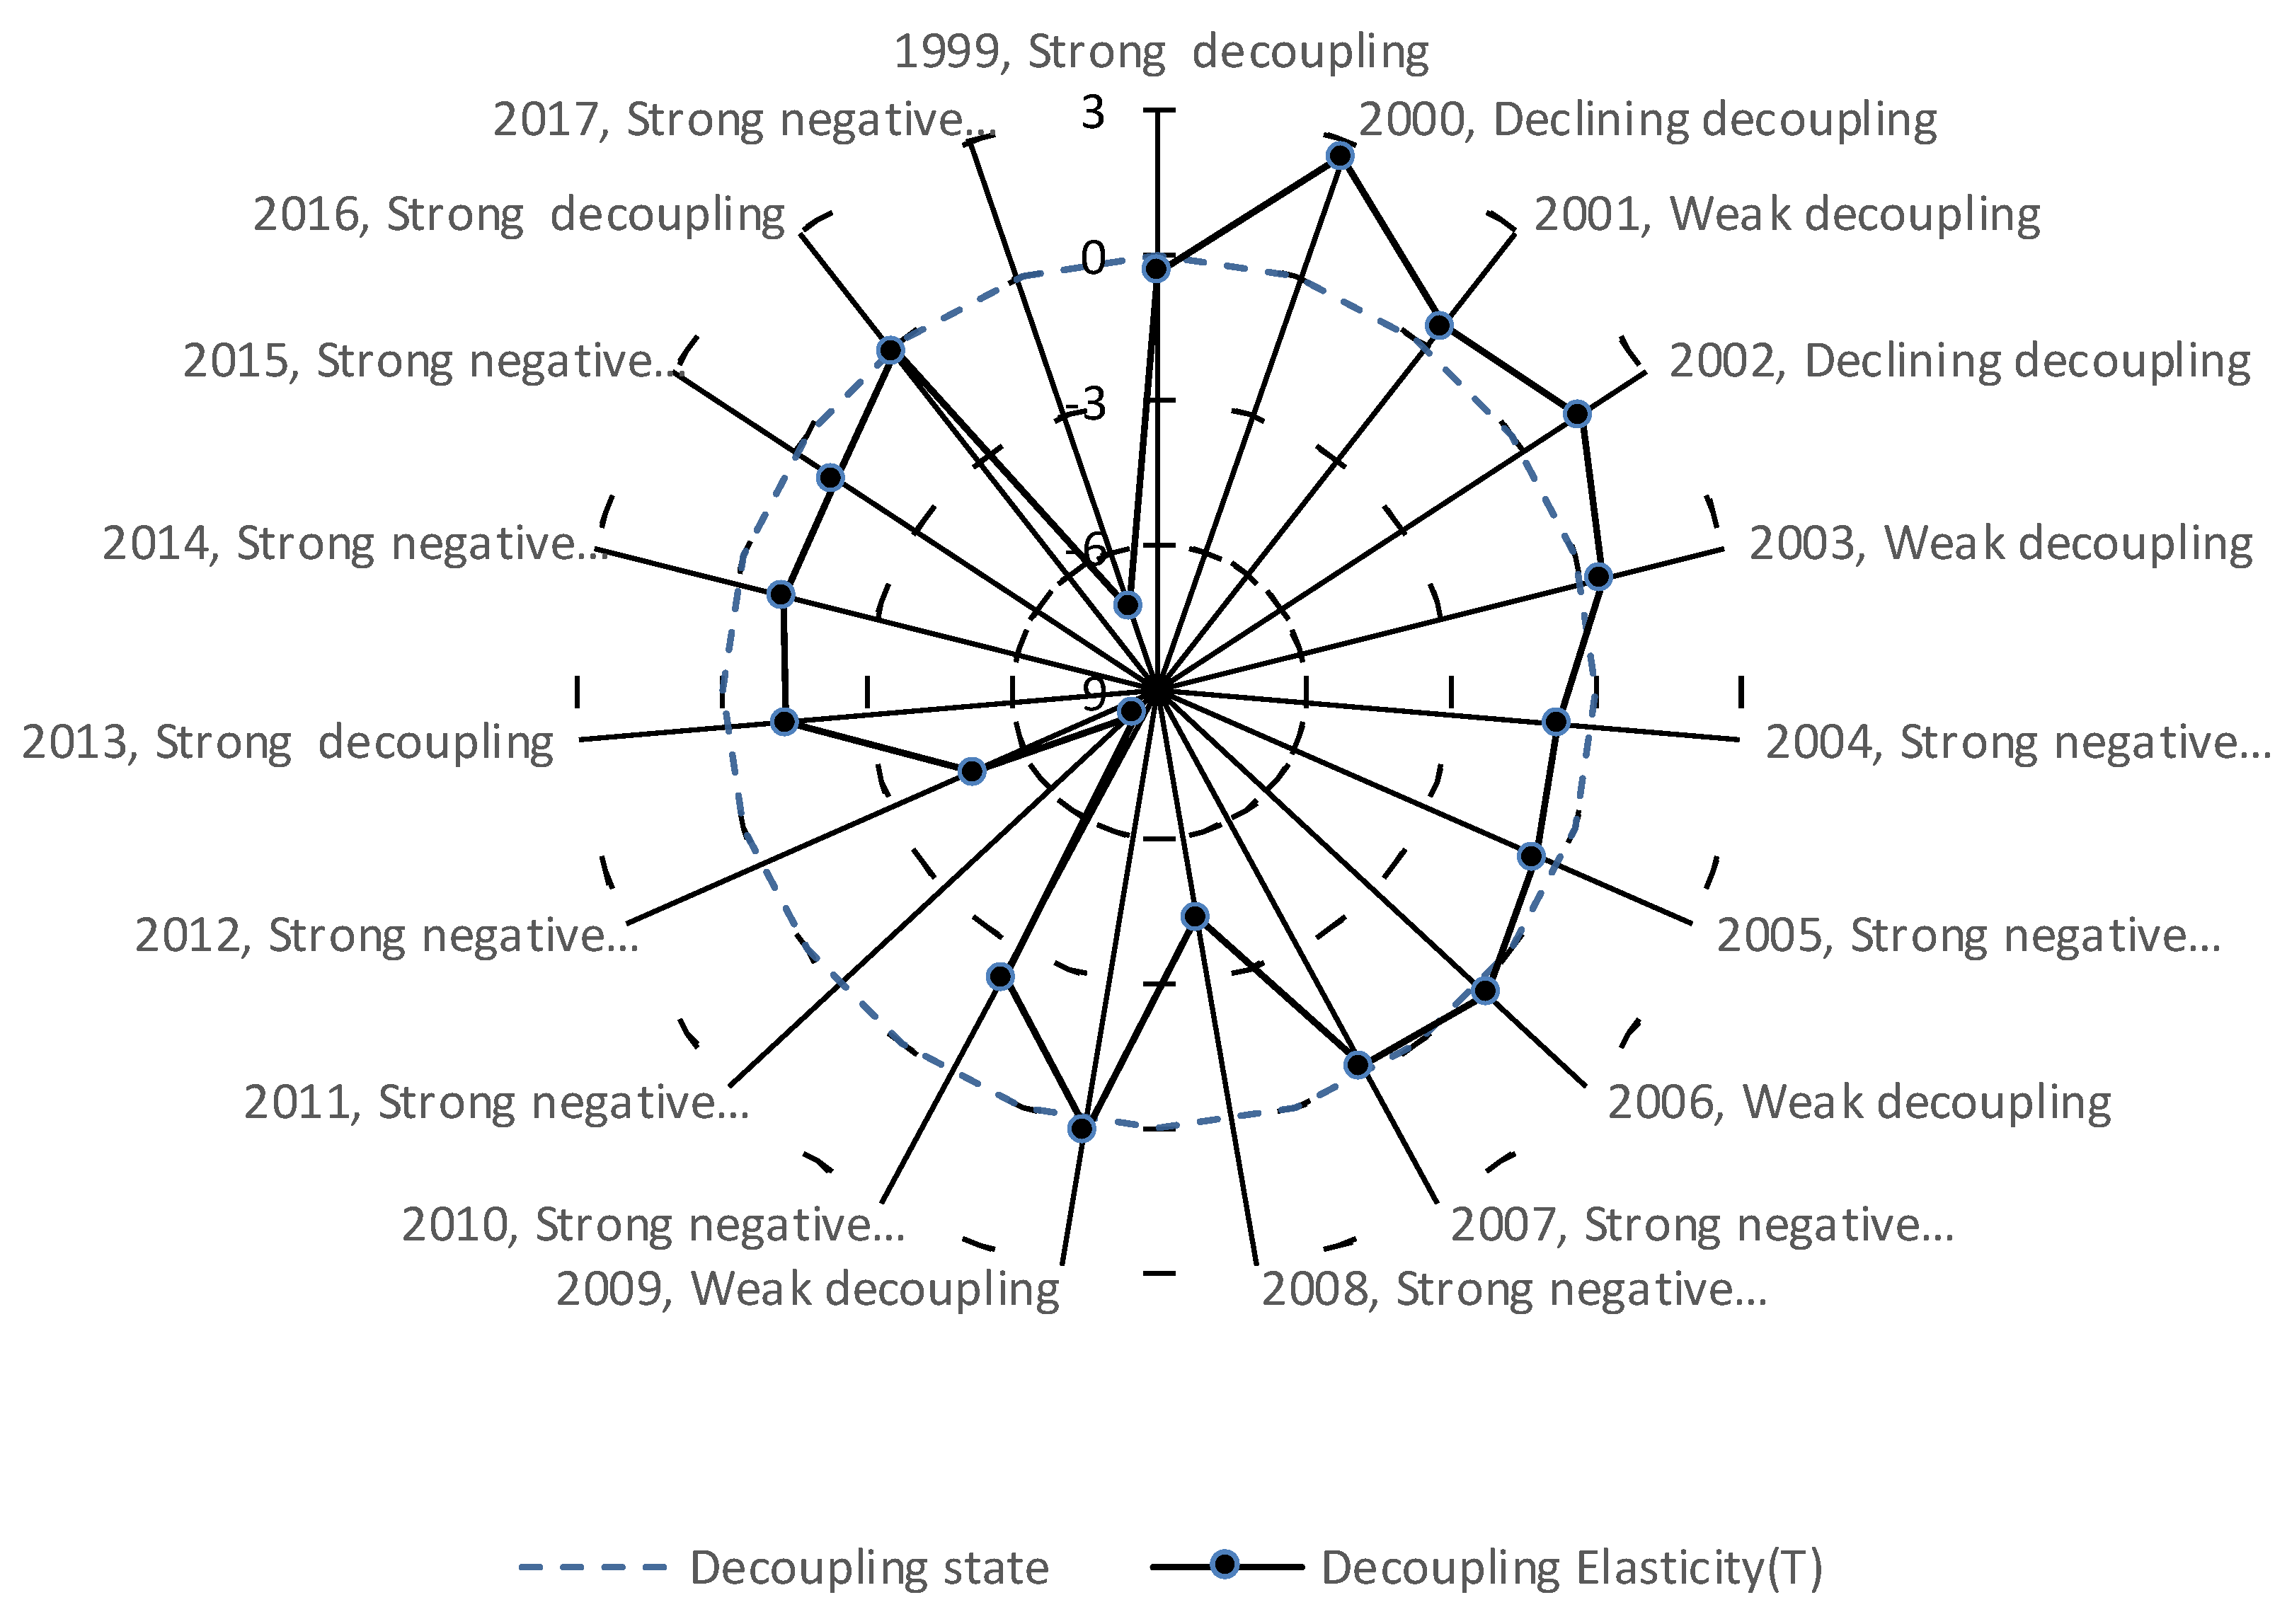
According to the decoupling elasticity curve of land use intensity and environmental quality (Figure 6), the decoupling state changed from expansive negative decoupling to strong decoupling from 1998 to 1999, representing a transformation from the non-ideal to ideal state. The decoupling elasticity index values for 1998 and 2009 were 292.21 and −0.33, respectively. From 1998 to 1999, the growth rate of land use intensity in Gansu decreased by 7.32% while the ecological environment increased by 2.1%. The strong decoupling existing during 1998-1999 was a favorable relationship for land use intensity and ecological environment aiming at sustainable development. From 2000 to 2004, the decoupling state of Gansu experienced a change from decline decoupling to weak decoupling, and to strong negative decoupling. The decoupling elasticity index was 2.67, 0.53, 1.39, 0.44, and−0.76, respectively. However, in 2004, the relationship between land use intensity and ecological environment became a strong negative decoupling which is harmful to sustainable development.
From 2005 to 2013, the decoupling state of land use intensity and environmental quality in Gansu Province changed from strong negative decoupling to weak decoupling and strong decoupling. The decoupling elasticity index values from 2005 to 2013 were −0.52, 0.20, −0.21, −4.29, 0.18, −2.28, −8.31, −4.81, and −1.31, respectively, representing the transition from the most unfavorable state to the best one. From 2014 to 2016, the state of decoupling changed from strong negative decoupling to strong decoupling and corresponding decoupling. The elasticity indexes were −1.01, −1.02, and −0.11, respectively. Two kinds of reasons accounted for these changes. First, the proposal of resource-conserving and environmentally friendly development and the implementation of related policies, reduced the negative impacts of increasing land use intensity on the ecological environment. Second, the green development strategy proposed by the Chinese government led to the increase of government investments in environmental pollution control, improving the ecological environment.
5. Discussion and Conclusions
In this paper, taking Gansu Province as an example, we selected land use intensity and environmental quality indices and revealed the decoupling relationship between these two factors for the period from 1998 to 2017 by using the decoupling method. The decoupling elasticity state of land use intensity and the ecological environment in Gansu Province experienced the following five states: weak decoupling, strong negative decoupling, strong decoupling, expansive negative decoupling and declining decoupling, respectively. In general, the time period of strong decoupling accounted for 15% of the study period.
The reasons for the changes in decoupling state are mainly due to the increased investment in technology and capital, which has improved land use efficiency. However, the relationship between land use intensity and ecological environmental quality alternately changed between decoupling and recoupling. The other reason that helped improving the decoupling state between the land use intensity and environmental quality is the implementation of related land use policies such as the strict cropland protection policy and the ecological restoration policy. In particular, technique progress has an important potential influence on the decoupling state. The technique progress could help improve energy efficiency and production methods as well as the environmental governance capabilities. Thus, technique progress could help achieve the decoupling of land use intensity from environment quality.
As a whole, the increase of land use intensity and the improvement of environmental quality are not necessarily contradictory. Improving techniques, increasing the input of labor and capital, and implementing proper land use policies could help achieve the win-win of land use intensity and ecological quality.
Author Contributions
Conceptualization, W.S.; methodology, Y.Z. and W.S.; formal analysis, Y.Z., S.F., and W.S.; investigation, W.S. and Y.Z.; resources, W.S.; writing—original draft preparation, Y.Z., W.S., S.F., D.Y.; writing—review and editing, W.S.; supervision, W.S. and S.F. All authors have read and agreed to the published version of the manuscript.
Funding
This research was funded by the Second Tibetan Plateau Scientific Expedition and Research (Grant No. 2019QZKK0603), the National Natural Science Foundation of China (Grant No. 41671177), the Key Research and Development Program of China (Grant Nos. 2016YFA0602402 and 2018YFC1508801) and the Project from Development Research Center of State Administration for Market Regulation, China (entitled Research on the analysis framework on quality safety situation).
Conflicts of Interest
The authors declare no conflict of interest. The funders had no role in the design of the study; in the collection, analyses, or interpretation of data; in the writing of the manuscript; nor in the decision to publish the results.
References
- Perring, M.P.; De Frenne, P.; Baeten, L.; Maes, S.L.; Depauw, L.; Blondeel, H.; Carón, M.M.; Verheyen, K. Global environmental change effects on ecosystems: The importance of land-use legacies. Glob. Chang. Biol. 2016, 22, 1361–1371. [Google Scholar] [CrossRef] [PubMed]
- Liu, J.; Zhang, Z.; Xu, X.; Kuang, W.; Zhou, W. Spatial patterns and driving forces of land use change in China during the early 21st century. J. Geogr. Sci. 2010, 20, 484–494. [Google Scholar] [CrossRef]
- Thinh, N.X.; Arlt, G.; Heber, B.; Hennersdorf, J.; Lehmann, I. Evaluation of urban land-use structures with a view to sustainable development. Environ. Impact Assess. Rev. 2002, 22, 475–492. [Google Scholar] [CrossRef]
- Feng, X.; Fujiwara, A.; Zhang, J. Exploring Sustainable Urban Forms for Developing City Based on New Integrated Model. J. Transp. Syst. Eng. Inf. Technol. 2008, 8, 50–60. [Google Scholar] [CrossRef]
- Miller, J.S.; Hoel, L.A. The “smart growth” debate: Best practices for urban transportation planning. Socio-Econ. Plan. Sci. 2002, 36, 1–24. [Google Scholar] [CrossRef]
- Gabriel, S.; Faria, J.; Moglen, G. A multiobjective optimization approach to smart growth in land development. Socio-Econ. Plan. Sci. 2006, 16, 212–248. [Google Scholar] [CrossRef] [Green Version]
- Chen, H.; Jia, B.; Lau, S.S.Y. Sustainable urban form for Chinese compact cities: Challenges of a rapid urbanized economy. Habitat Int. 2008, 32, 28–40. [Google Scholar] [CrossRef]
- Howley, P. Attitudes towards compact city living: Towards a greater understanding of residential behaviour. Land Use Policy 2009, 26, 792–798. [Google Scholar] [CrossRef]
- Kuemmerle, T.; Erb, K.; Meyfroidt, P.; Müller, D. Challenges and opportunities in mapping land use intensity globally. Curr. Opin. Environ. Sustain. 2003, 5, 484–493. [Google Scholar] [CrossRef]
- Ellis, E.C.; Ramankutty, N. Putting people in the map: Anthropogenic biomes of the world. Front. Ecol. Environ. 2008, 6, 439–447. [Google Scholar] [CrossRef] [Green Version]
- Erb, K.H.; Haberl, H.; Jepsen, M.R.; Kuemmerle, T.; Lindner, M.; Mueller, D.; Verburg, P.H.; Reenberg, A. A conceptual framework for analysing and measuring land-use intensity. Curr. Opin. Environ. Sustain. 2013, 5, 464–470. [Google Scholar] [CrossRef] [PubMed] [Green Version]
- Asselen, S.V.; Verburg, P.H. A Land System representation for global assessments and land-use modeling. Glob. Chang. Biol. 2012, 18, 3125–3148. [Google Scholar] [CrossRef] [PubMed] [Green Version]
- Liu, F.; Yan, H.; Liu, J.; Xiao, X.; Qin, Y. Spatial pattern of land use intensity in China in 2000. Acta Geogr. Sin. 2016, 71, 1130–1143. [Google Scholar]
- Marsh, G.P. Man and Nature; University of Washington Press: Seattle, WA, USA, 2003. [Google Scholar]
- Xiaohong, C.; Honghao, Z. Research hotspots and prospects of urbanization and ecological environment relationship based on visual knowledge mapping. Prog. Geogr. 2018, 9, 37. [Google Scholar] [CrossRef]
- Ding, L.; Weituo, Z.; Yalin, H.; Shenggao, C.; Chao, L. Research on the Coupling Coordination Relationship between Urbanization and the Air Environment: A Case Study of the Area of Wuhan. Atmosphere 2015, 6, 1539–1558. [Google Scholar] [CrossRef] [Green Version]
- He, J.; Wang, S.; Liu, Y.; Ma, H.; Liu, Q. Examining the relationship between urbanization and the eco-environment using a coupling analysis: Case study of Shanghai, China. Ecol. Indic. 2017, 77, 185–193. [Google Scholar] [CrossRef]
- Zhao, Y.; Wang, S.; Zhou, C. Understanding the relation between urbanization and the eco-environment in China’s Yangtze River Delta using an improved EKC model and coupling analysis. Sci. Total Environ. 2016, 571, 862–875. [Google Scholar] [CrossRef]
- Wang, D.; Chen, W.; Wei, W.W.; Bird, B.; Zhang, L.; Sang, M.; Wang, Q. Research on the Relationship between Urban Development Intensity and Eco-Environmental Stresses in Bohai Rim Coastal Area, China. Sustainability 2016, 8, 406. [Google Scholar] [CrossRef] [Green Version]
- Bian, Z.; Lu, Q. Ecological effects analysis of land use change in coal mining area based on ecosystem service valuing: A case study in Jiawang. Environ. Earth Sci. 2013, 68, 1619–1630. [Google Scholar] [CrossRef]
- Wu, K.Y.; Ye, X.-Y.; Qi, Z.-F.; Zhang, H. Impacts of land use/land cover change and socioeconomic development on regional ecosystem services: The case of fast-growing Hangzhou metropolitan area, China. Cities 2013, 31, 276–284. [Google Scholar] [CrossRef]
- Debnath, J.; Das, N.; Ahmed, I.; Bhowmik, M. Channel migration and its impact on land use/land cover using RS and GIS: A study on Khowai River of Tripura, North-East India. Egypt. J. Remote Sens. Space Sci. 2017, 20, 197–210. [Google Scholar] [CrossRef]
- Chen, J.; Lei, G.P. Evaluation on Coordination between Land-use and Eco-environment in Daqing. Res. Soil Water Conserv. 2011, 3, 116–120. [Google Scholar]
- Yongxiang, W. Empirical Study of the Coupling Coordination Relationship of urbanization and ecological environment in Nanchang and Jiujiang urban belts. J. Interdiscip. Math. 2014, 17, 511–526. [Google Scholar] [CrossRef]
- Tan, J.T.; Zhang, P.Y.; Jing, L.I.; Liu, S.W. Spatial-temporal evolution characteristic of coordination between urbanization and eco-environment in Jilin Province, Northeast China. Chin. J. Appl. Ecol. 2015, 26, 3827–3834. [Google Scholar]
- Li, W.; Li, X.; Tan, M.; Wang, Y. Influences of population pressure change on vegetation greenness in China’s mountainous areas. Ecol. Evolut. 2017, 7, 9041–9053. [Google Scholar] [CrossRef]
- Zhuang Dafang, L.J. Study on the modle of regional differentiation of land use degree of china. J. Nat. Resour. 1997, 12, 105–111. [Google Scholar]
- Zhang, Y.K. Evaluation on the Sustainable Development of Resources City in Arid Region Based on Entropy. Resour. Ind. 2006, 8, 1–6. [Google Scholar]
- Fang, C.L.; Wang, Y. Quantitative investigation of the interactive coupling relationship between urbanization and eco-environment. Acta Ecol. Sin. 2015, 35, 2244–2254. [Google Scholar]
- Tapio, P. Towards a theory of decoupling: Degrees of decoupling in the EU and the case of road traffic in Finland between 1970 and 2001. Transp. Policy 2005, 12, 137–151. [Google Scholar] [CrossRef] [Green Version]
- Wan, L.; Wang, Z.-L.; Ng, J.C.Y. Measurement Research on the Decoupling Effect of Industries’ Carbon Emissions—Based on the Equipment Manufacturing Industry in China. Energies 2016, 9, 921. [Google Scholar] [CrossRef] [Green Version]
- Zhang, C.; Chen, W.-Q.; Liu, G.; Zhu, D.-J. Economic Growth and the Evolution of Material Cycles: An Analytical Framework Integrating Material Flow and Stock Indicators. Ecol. Econ. 2017, 140, 265–274. [Google Scholar] [CrossRef]
- Ma, X.-W.; Ye, Y.; Shi, X.-Q.; Zou, L.-L. Decoupling economic growth from CO2 emissions: A decomposition analysis of China’s household energy consumption. Adv. Clim. Chang. Res. 2016, 7, 192–200. [Google Scholar] [CrossRef]
- OECD. Decoupling: A Conceptual Overview: No. 414. OECD Pap. 2006, 5, 1–31. [Google Scholar] [CrossRef]
- Jie, G.; Wang, J.; Zhao, J. Decoupling of Transportation Energy Consumption from Transportation Industry Growth in China. Procedia Soc. Behav. Sci. 2012, 43, 33–42. [Google Scholar]
- Grand, M.C. Carbon emission targets and decoupling indicators. Ecol. Indic. 2016, 67, 649–656. [Google Scholar] [CrossRef]
- Gansu Statistics Bureau, Statistical Yearbook. Available online: http://tjj.gansu.gov.cn/HdApp/HdBas/HdClsContentMain.asp?ClassId=70 (accessed on 12 December 2019).
- Google Earth Engine. Available online: https://code.earthengine.google.com/bcdfddbedda2e7a7c4b78dc4ee3f4ffb (accessed on 28 December 2019).
- Song, W. Decoupling cultivated land loss by construction occupation from economic growth in Beijing. Habitat Int. 2014, 43, 198–205. [Google Scholar] [CrossRef]
- Bai, W.N.; Qiao, Q.; Yao, Y.; Sun, Q.H.; Song, Y.Y.; Xu, Y. An Analysis of Decoupling of Economic Development and Environmental Pressure Based on the Park Level: A Case of TEDA. Appl. Mech. Mater. 2014, 522–524, 1831–1839. [Google Scholar] [CrossRef]
- Du, H.; Chen, B. Rationality of farmland occupation by constructions based on decoupling analysis method. Trans. Chin. Soc. Agric. Eng. 2007, 23, 52–58. [Google Scholar]
- Song, Y.; Sun, J.; Zhang, M.; Su, B. Using the Tapio-Z decoupling model to evaluate the decoupling status of China’s CO2 emissions at provincial level and its dynamic trend. Struct. Chang. Econ. Dyn. 2020, 52, 20–129. [Google Scholar] [CrossRef]
- Ming, Z.; Wang, W. Decouple indicators on the CO2 emission-economic growth linkage: The Jiangsu Province case. Ecol. Indic. 2013, 32, 239–244. [Google Scholar]
Figure 1.
Geographical location of Gansu Province, China.

Figure 2.
Decoupling degree coordinate chart (modified from Tapio et al. [30]).
Figure 2.
Decoupling degree coordinate chart (modified from Tapio et al. [30]).

Figure 3.
Evolution curves of land use intensity assessment subsystems in Gansu Province from 1998 to 2017.
Figure 3.
Evolution curves of land use intensity assessment subsystems in Gansu Province from 1998 to 2017.

Figure 4.
Evolution curves of ecological environment assessment subsystems in Gansu Province from 1998 to 2017.
Figure 4.
Evolution curves of ecological environment assessment subsystems in Gansu Province from 1998 to 2017.

Figure 5.
NDVI values of Gansu Province in 1997 (A), 2004 (B), 2011 (C), and 2017 (D).

Figure 6.
Decoupling elasticity curve of land use intensity and environmental quality in Gansu Province from 1999 to 2017.
Figure 6.
Decoupling elasticity curve of land use intensity and environmental quality in Gansu Province from 1999 to 2017.


Table 1.
Assessment index system of the decoupling relationship between land use intensity and environmental quality in Gansu Province.
Table 1.
Assessment index system of the decoupling relationship between land use intensity and environmental quality in Gansu Province.
| System | Index Category | Index Name and Units | Index Code | Weight |
|---|---|---|---|---|
| Land use intensity subsystem | Land use structure | Land use intensity | C1 | 0.1439 |
| Land use input | Population density(capita/km2) | C2 | 0.1403 | |
| Land use output | Crop yield per unit of land (t/hm2) | C3 | 0.1454 | |
| Gross domestic product (GDP) per unit of land | C4 | 0.1393 | ||
| Fiscal revenue per unit of land (10 thousand yuan/hm2) | C5 | 0.1368 | ||
| Ecological environment subsystem | Ecological environment comprehensive index | Normalized differential vegetation index (NDVI) | C6 | 0.1498 |
| Greening ratio of built-up areas (%) | C7 | 0.1444 |
Table 2.
Decoupling indices and calculation results of land use intensity and environmental quality in Gansu Province from 1998 to 2017.
Table 2.
Decoupling indices and calculation results of land use intensity and environmental quality in Gansu Province from 1998 to 2017.
| Year | Land use Intensity F(x) | Growth Rate of Land Use Intensity (%) | Environmental Quality G(x) | Growth Rate of Environmental Quality (%) | Decoupling Elasticity | Decoupling States |
|---|---|---|---|---|---|---|
| 1998 | 0.22 | 6.41% | 0.1286 | 0.02% | 292.21 | Expansive negative decoupling |
| 1999 | 0.2082 | −1.18% | 0.1498 | 2.11% | −0.33 | Strong decoupling |
| 2000 | 0.154 | −5.43% | 0.1352 | −1.46% | 2.67 | Declining decoupling |
| 2001 | 0.1749 | 2.10% | 0.1697 | 3.45% | 0.53 | Weak decoupling |
| 2002 | 0.1178 | −5.71% | 0.1298 | −3.99% | 1.39 | Declining decoupling |
| 2003 | 0.1383 | 2.05% | 0.1809 | 5.11% | 0.44 | Weak decoupling |
| 2004 | 0.1665 | 2.83% | 0.132 | −4.89% | −0.76 | Strong negative decoupling |
| 2005 | 0.1872 | 2.07% | 0.1003 | −3.17% | −0.52 | Strong negative decoupling |
| 2006 | 0.2163 | 2.91% | 0.1784 | 7.81% | 0.2 | Weak decoupling |
| 2007 | 0.2231 | 0.69% | 0.152 | −2.64% | −0.21 | Strong negative decoupling |
| 2008 | 0.2575 | 3.44% | 0.1465 | −0.55% | −4.29 | Strong negative decoupling |
| 2009 | 0.2835 | 2.60% | 0.2296 | 8.31% | 0.18 | Weak decoupling |
| 2010 | 0.3223 | 3.88% | 0.2159 | −1.38% | −2.28 | Strong negative decoupling |
| 2011 | 0.4215 | 9.92% | 0.2079 | −0.80% | −8.31 | Strong negative decoupling |
| 2012 | 0.5785 | 15.70% | 0.1918 | −1.60% | −4.83 | Strong negative decoupling |
| 2013 | 0.4104 | −16.81% | 0.2346 | 4.27% | −1.31 | Strong decoupling |
| 2014 | 0.445 | 3.46% | 0.2149 | −1.96% | −1.01 | Strong negative decoupling |
| 2015 | 0.4794 | 3.44% | 0.1985 | −1.64% | −1.02 | Strong negative decoupling |
| 2016 | 0.4759 | −0.35% | 0.2118 | 1.33% | −0.11 | Strong decoupling |
| 2017 | 0.4953 | 1.94% | 0.2106 | -0.12% | -7.18 | Strong negative decoupling |
© 2020 by the authors. Licensee MDPI, Basel, Switzerland. This article is an open access article distributed under the terms and conditions of the Creative Commons Attribution (CC BY) license (http://creativecommons.org/licenses/by/4.0/).
Share and Cite
MDPI and ACS Style
Zhang, Y.; Song, W.; Fu, S.; Yang, D. Decoupling of Land Use Intensity and Ecological Environment in Gansu Province, China. Sustainability 2020, 12, 2779. https://0-doi-org.brum.beds.ac.uk/10.3390/su12072779
AMA Style
Zhang Y, Song W, Fu S, Yang D. Decoupling of Land Use Intensity and Ecological Environment in Gansu Province, China. Sustainability. 2020; 12(7):2779. https://0-doi-org.brum.beds.ac.uk/10.3390/su12072779
Chicago/Turabian StyleZhang, Yanjie, Wei Song, Shun Fu, and Dazhi Yang. 2020. "Decoupling of Land Use Intensity and Ecological Environment in Gansu Province, China" Sustainability 12, no. 7: 2779. https://0-doi-org.brum.beds.ac.uk/10.3390/su12072779
Note that from the first issue of 2016, this journal uses article numbers instead of page numbers. See further details here.