Proposing a Paradigm Shift in Rural Electrification Investments in Sub-Saharan Africa through Agriculture


Institute for Bio-Economy and Agri-Technology (iBO), Centre for Research and Technology–Hellas (CERTH), 6th km Charilaou-Thermi Rd, GR 57001 Thermi, Thessaloniki, Greece
*
Authors to whom correspondence should be addressed.
Sustainability 2020, 12(8), 3096; https://0-doi-org.brum.beds.ac.uk/10.3390/su12083096
Submission received: 20 March 2020
/
Revised: 3 April 2020
/
Accepted: 8 April 2020
/
Published: 12 April 2020
(This article belongs to the Special Issue Green, Closed Loop, Circular Bio-Economy)
Abstract
:Almost one billion people in the world still do not have access to electricity. Most of them live in rural areas of the developing world. Access to electricity in the rural areas of Sub-Saharan Africa is only 28%, roughly 600 million people. The financing of rural electrification is challenging and, in order to accomplish higher private sector investments, new innovative business models have to be developed. In this paper, a new approach in the financing of microgrid electrification activities is proposed and investigated. In this approach, agriculture related businesses take the lead in the electrification activities of the surrounding communities. It is shown that the high cost of rural electrification can be met through the increased value of locally produced products, and cross-subsidization can take place in order to decrease the cost of household electrification. The approach is implemented in a case study in Rwanda, through which the possibility of local agricultural cooperatives leading electrification activities is demonstrated.
1. Introduction
Almost one billion people in the world still do not have access to electricity [1]. Most of them live in rural areas of the developing world. Access to electricity in the rural areas of Sub-Saharan Africa is only 28%, roughly 600 million people. In recent years, poverty has been officially recognized to be at the core of development. The Sustainable Development Goal (SDG) No. 1 of the United Nations (UN) is “No poverty”, and it is acknowledged that economic growth must be inclusive to provide sustainable jobs and promote equality. Infrastructure is recognized as having a high importance on a country’s economic development. At the same time, two key factors are needed for the move to higher productivity, economies of scale, and specialization [2], which have considerable benefits in large urban centers [3]. Urbanization has been considered to be the key to economic development, but recent studies have shown that enforcing policies to simply pursue accelerated urbanization will not necessarily lead to increased economic growth [4]. At the same time, urbanization has been increasing Greenhouse Gas (GHG) emissions [5], contributing to climate change [6], and affecting water resources [7] and biodiversity [8], as well as human health [9]. Based on these drawbacks of urban economic development, recent studies have shown that, especially for the least-developed countries, rural development is an alternative way of increasing income and quality of live, with agriculture being the starting point [10].
Rural development can be defined as “the process of improving the quality of life and economic well-being of people living in rural areas, often relatively isolated and sparsely populated” [11]. The main sectors of activity that have been traditionally regarded as the core of rural development are agriculture, forestry, and natural resources extraction. In recent times, the importance of social infrastructure related to health and education [12] has been acknowledged, along with tourism, recreation, and decentralized manufacturing [13]. However, it has to be highlighted that agriculture is still considered to be the most important sector for the rural areas of the developing world [10]. Sustainable development, in turn, has been defined, according to the Brundtland Commission’s “Our Common Future” document [14], as “development that meets the needs of the present without compromising the ability of future generations to meet their own needs”.
Rural electrification and the sustainable development of rural communities has been investigated extensively, and it has been shown that there is an evident relationship between them; rural electrification can act as an enabler, a facilitator, and a driver for sustainable development [15]. Indeed, rural electrification has provided extended benefits to rural populations in health [16], education [17], and income [18,19]. Agricultural electrification has been found to produce long-lasting positive effects on communities. A review of rural electrification that took place in the US between 1930 and 1960 showed that, in the short term, electrification mostly impacted the agriculture related economy, increasing employment and rural farm population. The fact that benefits exceeded historical costs even in low density rural areas is highlighted. Another important and interesting fact is that the areas that got electrified first showed increased economic growth that was maintained for decades, even after the whole of the US was electrified [20]. Newer rural electrification programs show comparable results. In a 2018 review of the Chinese rural electrification program, one of the main outcomes was that it considerably increases the farmer’s agricultural income [21]. Another important result is that a proper matching of electrification needs can considerably increase its effectiveness [21]. It has been acknowledged that it is beneficial to utilize an approach where an investigation of each area’s needs is performed first and the electrification activities are subsequently tailored to those needs [22].
How to measure access to electricity is also an important aspect when considering electrification activities. The United Nations Global Tracking Network for Sustainable Energy for All has proposed a multi-tier framework, which is a comprehensive approach in measuring access [23]. The main attributes of this framework are that it has five tiers, it is based on six attributes of electricity supply, and that, with electricity supply improvement, there is an increase in the possible electricity services availability.
The Index of access to electricity is defined as:
where PT refers to the proportion of households at tier .
Table 1 presents the main attributes of each tier, while Table 2 presents the main services provided. As is understandable, high energy efficiency devices and appliances need to be used in order to achieve each tier access cost effectively. It should be pointed out that Tier 1 is considered as having access to electricity and therefore people with, for example, a solar lantern with the ability to also charge a mobile phone are not included in the ~1 billion people without access to electricity.
Rural electrification can be accomplished using three main approaches; grid extension, microgrids, and solar home systems [24]. The electrification costs for grid extension is estimated at between 2000 and 3000 USD, for microgrids at between 500 and 1200 USD, and for solar home systems at between 150 and 500 USD [25]. Based on technology availability and reliability nowadays, grid extension does not seem to be the optimum solution in remote locations due to the high cost and extensive infrastructure requirements; therefore, for most people in rural areas, electrification will come with systems that produce and distribute electricity locally, through solar home systems or microgrids [26]. The choice between an investment in a microgrid or solar home systems is ultimately based on a techno-economic evaluation for any given project, with population density playing an important role [27]. In Sub-Saharan Africa there are 602 million people living in the dark [1]. If all these people were to get access to electricity with microgrids, more than 480 billion USD would be needed. It is interesting to mention here that the total official financing received by African countries in 2018, according to the OECD, was ~64 billion USD [28], and this includes the financing for all activity sectors, not just energy. It is understandable that it cannot be expected that development financing alone will make the world succeed in fulfilling Sustainable Development Goal No. 7 of ensuring access to affordable, reliable, sustainable, and modern energy for all. This, in turn, means that the available financing tools should be utilized in the most effective way possible in order to stimulate sustainable economic development, which in turn will contribute to the required financing.
One of the most extended and current studies of installed microgrids in Sub-Saharan Africa was performed by the International Finance Corporation of the World Bank Group [29]. The main findings are summarized in Table 3. According to the study, households can spend very low amounts of money per month and the average payback period is more than seven years. The average access provided is Tier 2. Furthermore, most microgrids presented in this report rely heavily on grant funding and equity investment. If an increase of microgrid investments is to take place, commercial lending will also have to play an important role. Finally, it is important to note the 50-50 split between generation (which includes storage and power electronics) and distribution (poles and cables). This is due to the declining costs of photovoltaics and batteries, whereas the cost of poles and cables has remained practically unchanged.
It is evident that new business models need to be developed and utilized if an increase in electricity access is sought. Digital technologies offer various tools for cost decrease and their use by investors is increasing. The use of pay-as-you-go models, coupled with the internet of things, blockchain technologies, and mobile money is increasing [30]. There is a need, though, to target electrification activities that can also increase economic activity in the area [31]. This is the only path to enabling the electricity consumers to pay for more electricity and, as such, to increase the income for the microgrid operators, because it is acknowledged that revenue collection is one of the biggest challenges in the operation of microgrids [32]. In order to achieve this, there is a need to power appliances, devices, and equipment directly associated with economic development. These include water pumping, water desalination, refrigeration, space heating and cooling, incubators for poultry farming, milking machines, rice and maize hullers, polishers, threshers, graters, grain mills, oil presses, tailoring, workshop machinery (e.g., drills, chainsaws, rotary hammers, grinders, jigsaws, routers, etc.), and hairdresser equipment, among others [33]. Many studies have demonstrated that one of the short-term gains of rural electrification is related to increased agricultural income [20,21,34,35], showcasing that agriculture related load electrification needs to be a priority. Furthermore, experience from Asia (Bangladesh, Nepal, and Myanmar) and the USA has shown that the involvement of socially oriented cooperatives can also play an important role in rural electrification, acknowledging the fact that they can provide electricity with lower profit margins than the private sector, as long as the policy and regulatory frameworks are facilitating this involvement [20,35,36].
In Sub-Saharan Africa there are some good examples, initiated by the private sector, of linking electrification activities with agriculture. JUMEME (www.jumeme.com) is a private sector driven microgrid electrification program based on strong community engagement in the increased productive uses of electricity [37]. JUMEME aims to create value chains that can increase local income and in turn allow the local population to afford electrification, both for productive and household use. In one location, rice is grown, and JUMEME aided the local farmers to access financing in order to install water pumps to allow for irrigation [38]. An important aspect of this approach is that it is initiated by the private sector whose aim is to sell electricity [38].
In this paper, a new approach to the financing of microgrid electrification activities in Sub-Saharan Africa is proposed and investigated. In this approach, agriculture related businesses and cooperatives take the lead in the electrification activities of the surrounding communities. The aim of this work is to demonstrate that the high cost of electrification can be met through the increased value of locally produced products and, in parallel, internal cross-subsidization can take place in order to decrease the cost of household electrification. The proposed paradigm shift and the possibility of local agricultural cooperatives leading the electrification activities are investigated and presented through a case study implementing Rwanda conditions. The study is deployed according to the following steps:
- Step 1. A microgrid is designed that meets the electrification needs of the households of the typical village considered. Through this investigation, the levelized cost of electricity (LCOE) is determined. A sensitivity analysis takes place in terms of the maximum allowed annual capacity shortage, the loads not met, and the electricity lost.
- Step 2. A microgrid is designed to meet the needs of both the households and also a deferrable load. In the focal case study, the deferrable load considered is maize milling to produce flour.
- Step 3. The possibility of an agricultural cooperative investing in a mill powered by a photovoltaics (PV)/battery system in order to be able to sell maize flour instead of dry maize is considered.
- Step 4. An investigation takes place on whether the cooperative system can be extended to a microgrid to power the local households.
2. Materials and Methods
2.1. Case Study Assumptions
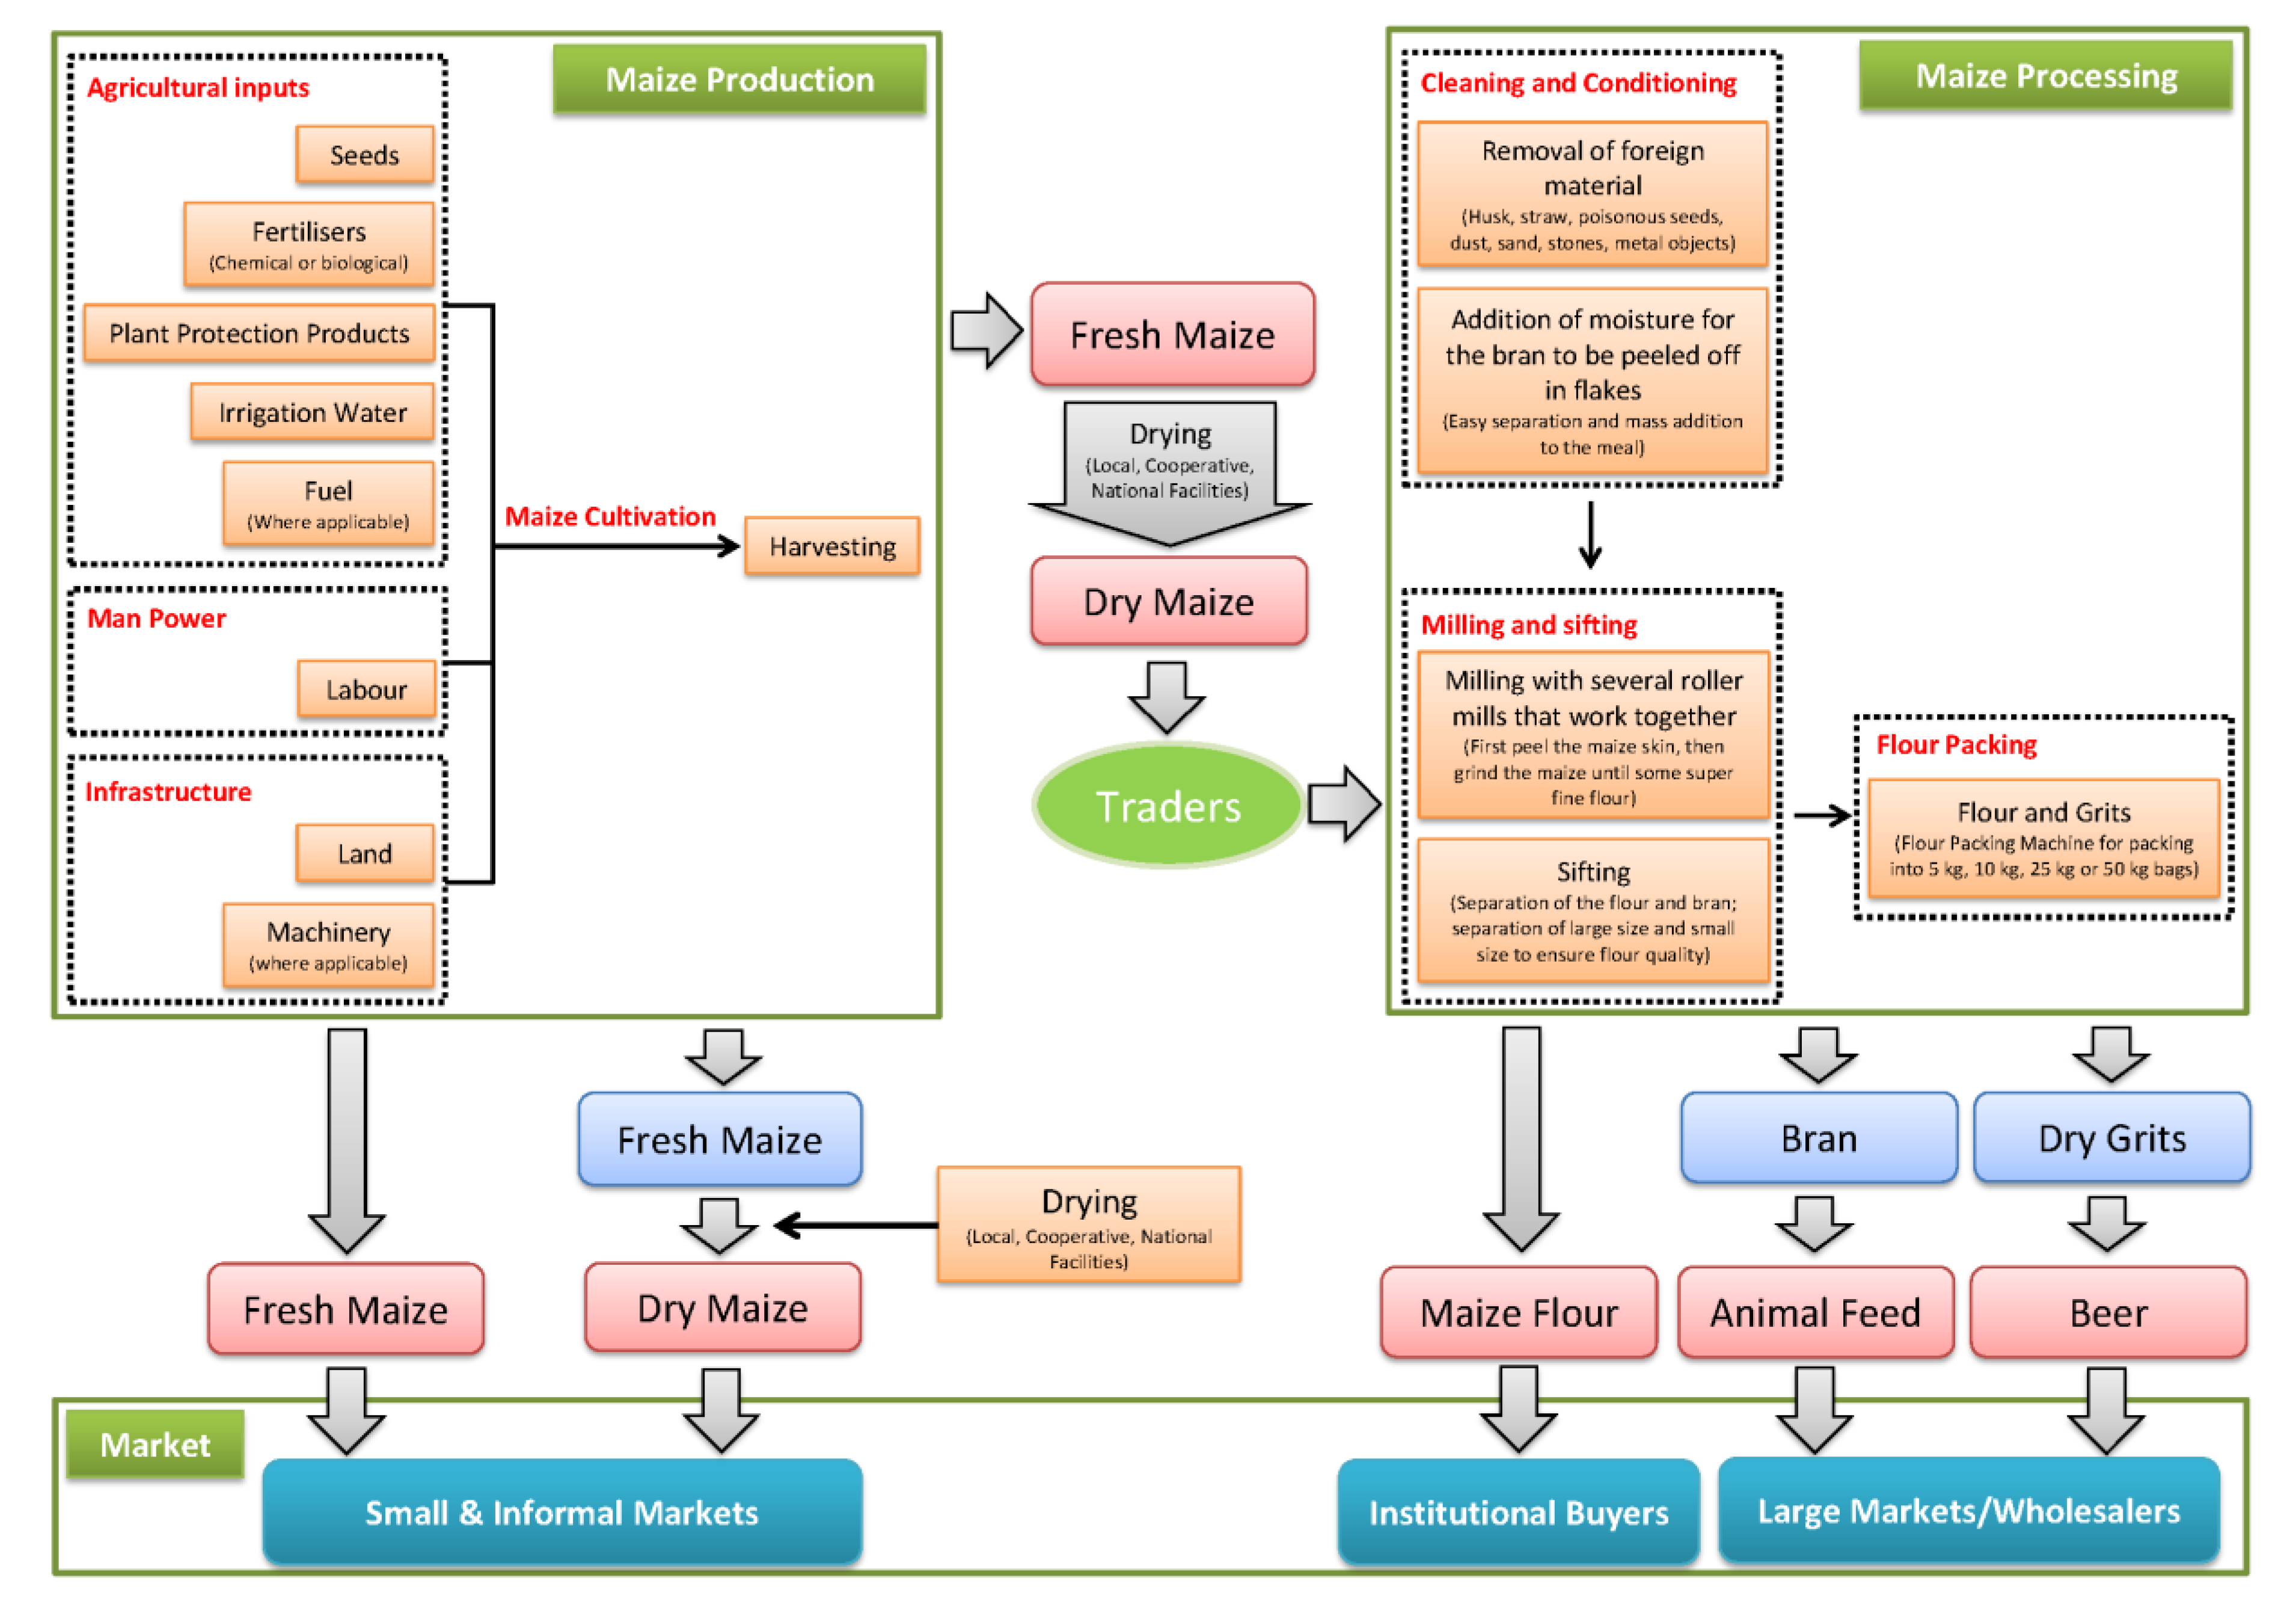
For the case study purposes, a typical village in Rwanda with 100 households was considered. This translates to roughly 550 inhabitants [39]. The meteorological data of the capital city of Kigali were used. It was assumed that the main agricultural activity in the area was maize production. In fact, over 65% of the farmers grow maize in Rwanda for both household consumption and commercial sale to traders and millers. Moreover, Rwanda is a net importer of maize grain and net exporter of maize meal [40]. Based on data derived from [39] and personal communication information, the maize value chain map in Rwanda is presented in Figure 1. As is visible, farmers usually sell fresh or dry maize. The annual cultivated area and the total and unit area yield for the past decade, according to FAO/FAOSTAT data, are listed in Table 4. The average maize farm size in Rwanda is 0.6 ha [41]. The average annual maize flour consumption in Rwanda is between 50 and 129 kg per capita [42]. Based on the above data, for the considered case study the consumption per capita of maize flour is considered as 100 kg y−1.
2.2. Simulation Software, Assumptions and Parameters
The HOMER Energy Legacy v.2.68 software (HOMER Energy, Boulder, CO, USA) was used to perform the simulation and optimization process and the economic analysis in the cases investigated. This particular software was chosen as it is a free-to-use tool.
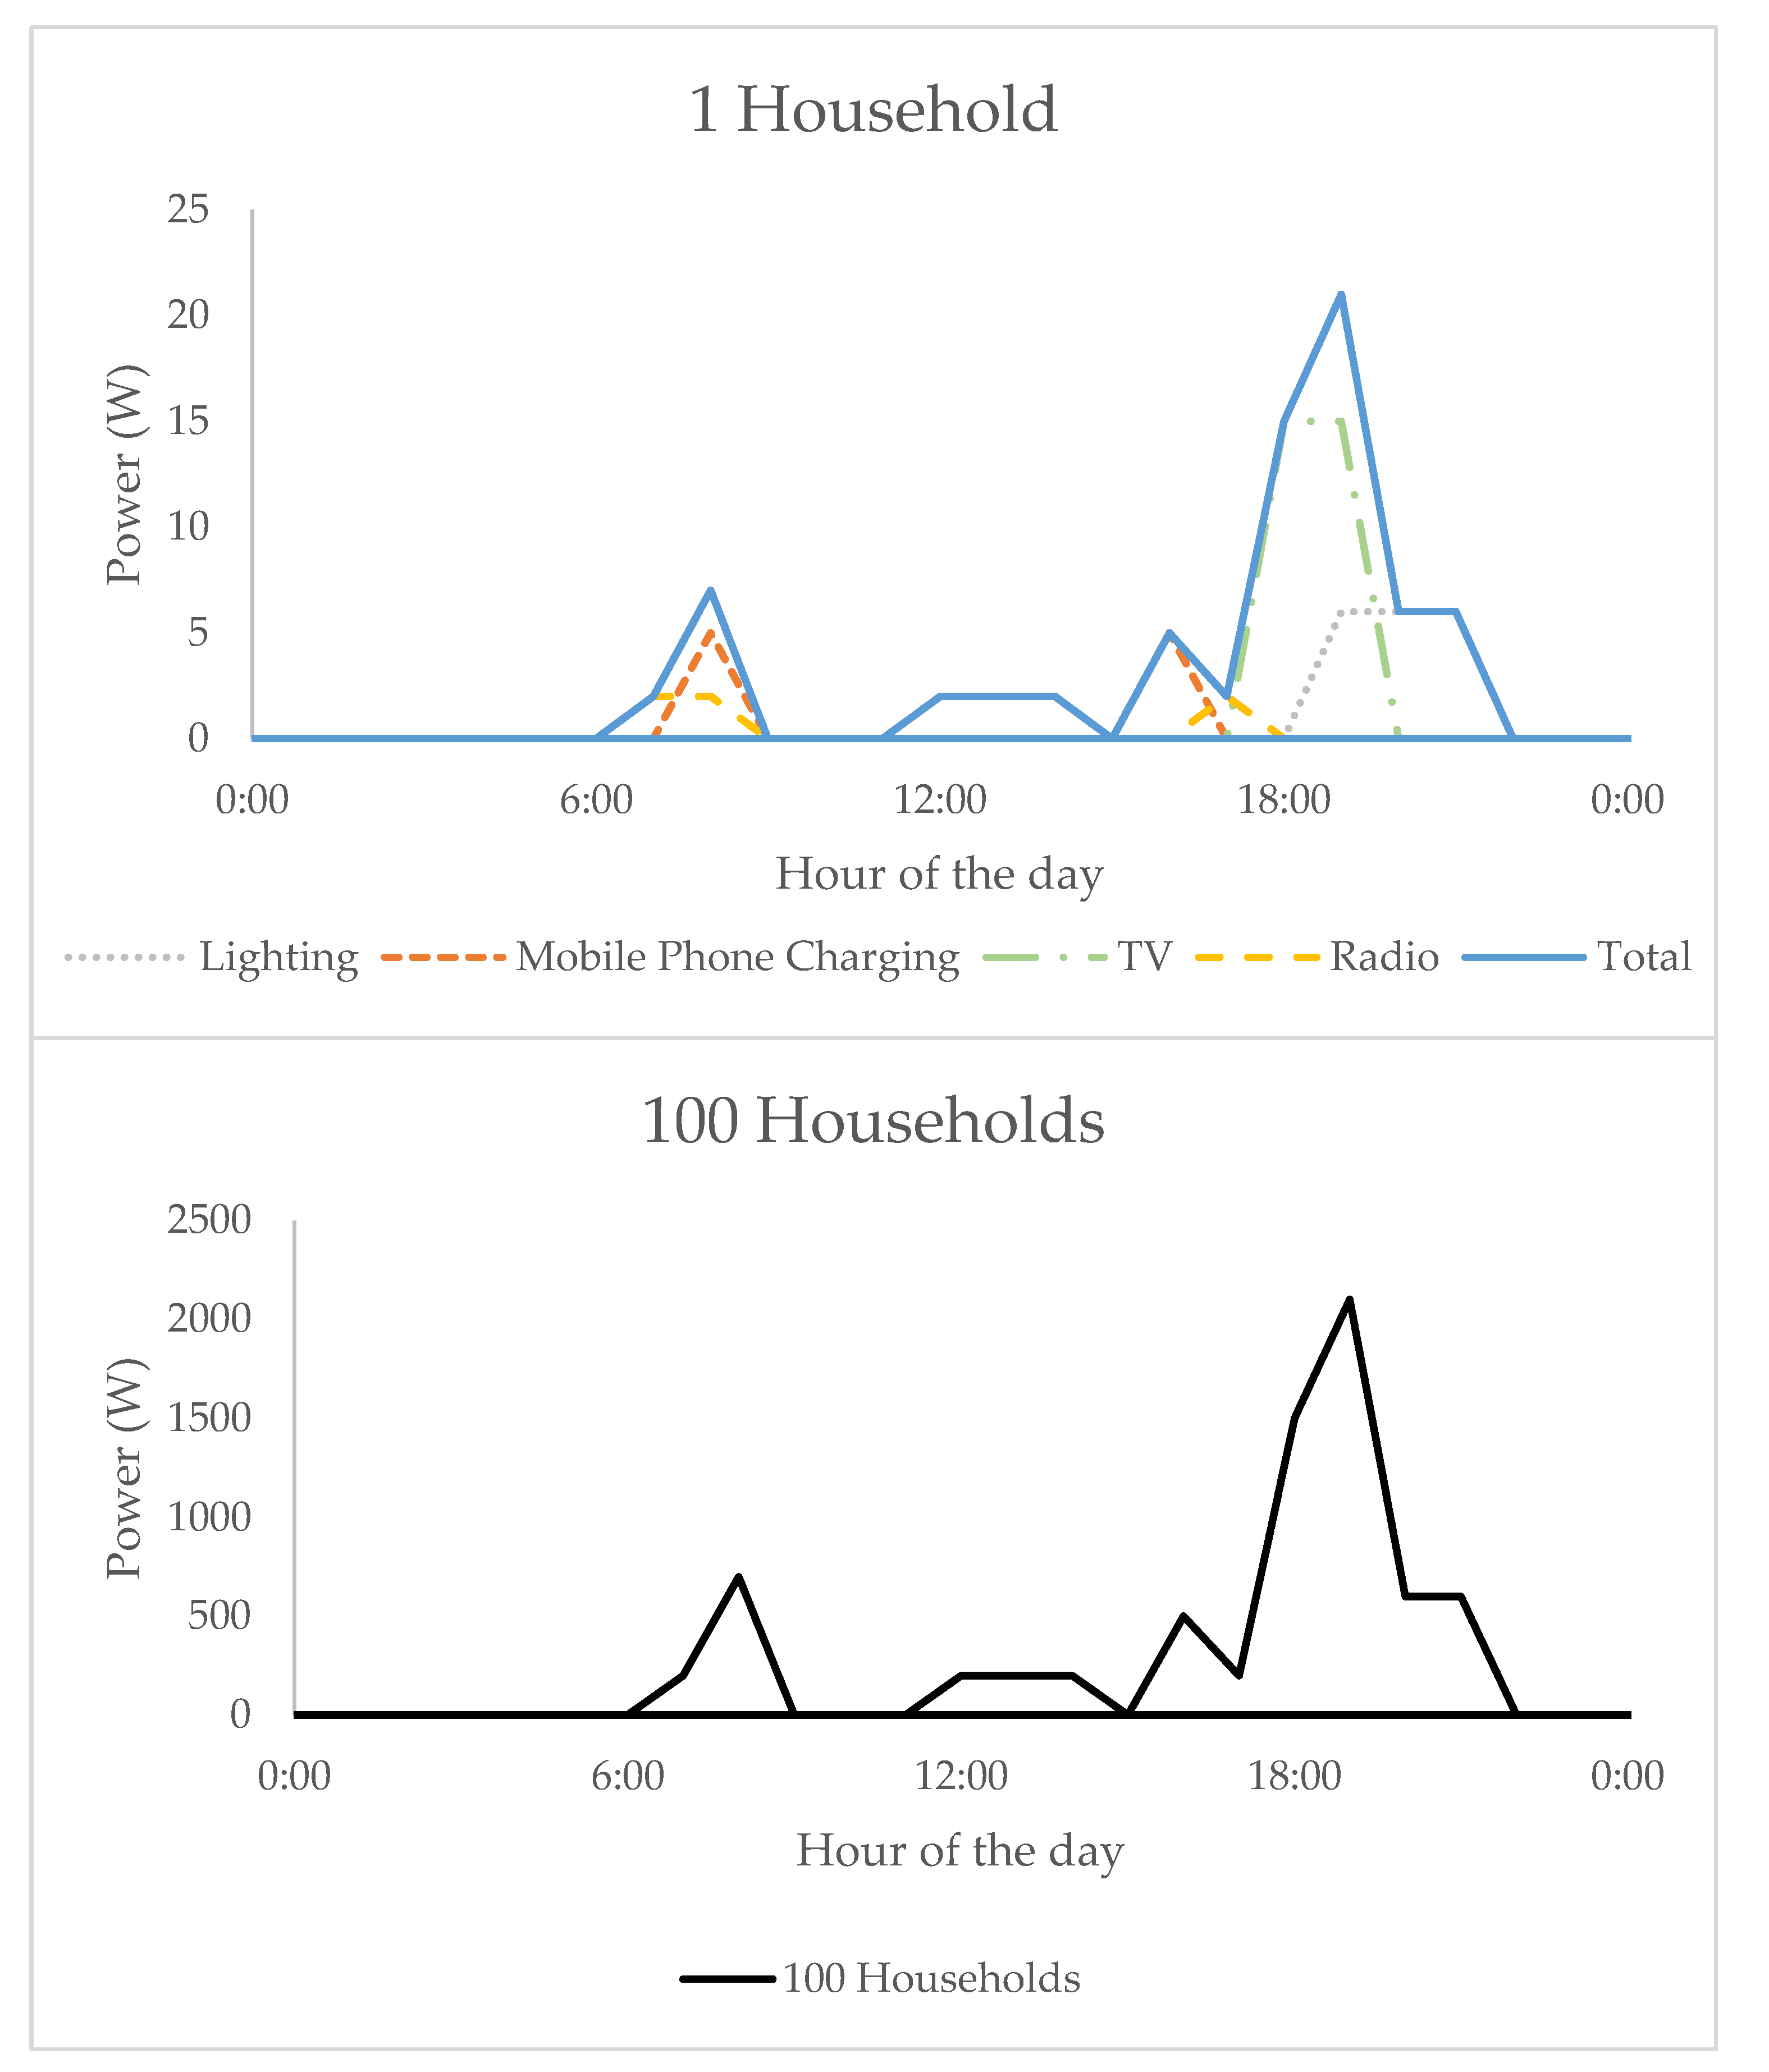
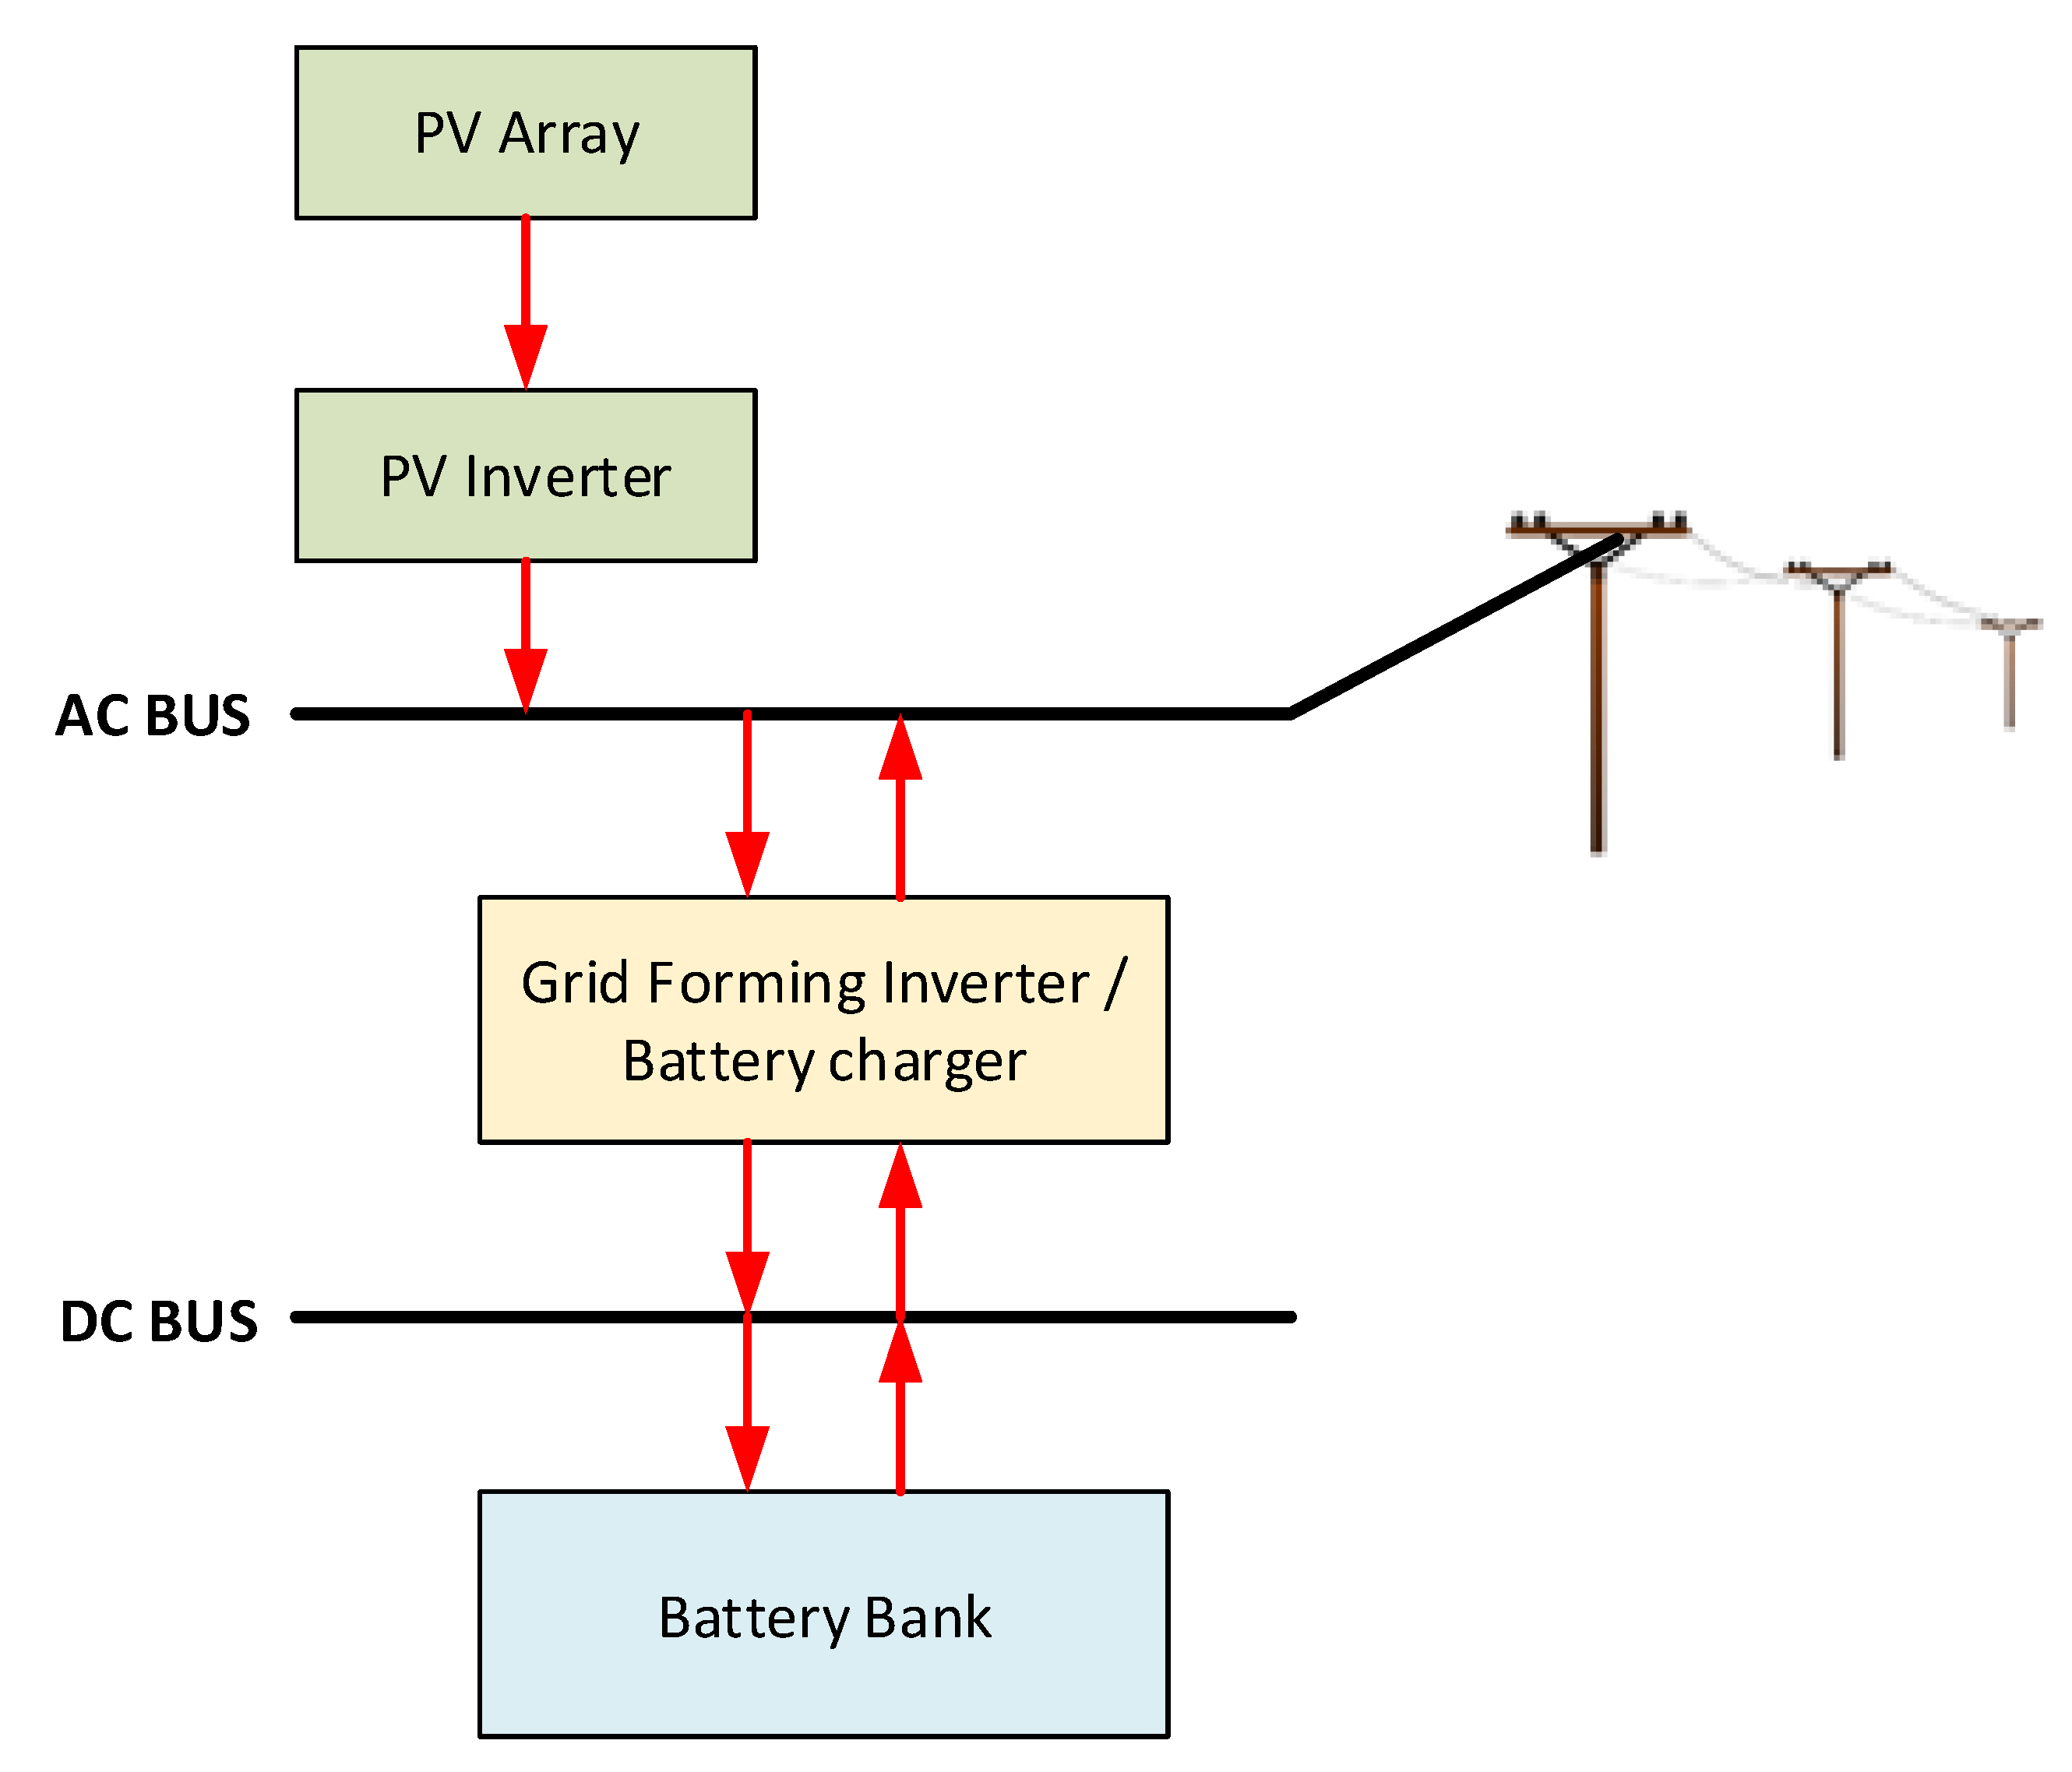
The consumption load of the 100 households is considered in line with Tier 2 access. Figure 2 presents the created hourly synthetic profile and Table 5 presents key power and energy data for the appliances used and the total needs of the 100 households. It has to be noted that super energy efficient appliances were considered. In order to add realism to the simulation, and because the predicted load profile, even based on surveys, is often not accurate [43,44], random variability was applied to this profile under a 5% random variability from day-to-day and a 5% variability from hour-to-hour. The operating reserve variables present in HOMER were set to 5% of the hourly load, 0% of the peak load, and 25% of the solar power output. This choice of variables offers a degree of balance between having a low-cost system and reliability of supply. It has to be highlighted that, for Tier 2 access, there are no restrictions in terms of reliability (see Table 1). The system topology chosen is that of an AC low voltage, single phase microgrid. This is presented in Figure 3. High quality power electronics, photovoltaic panels, and LiFePO4 batteries were used. It has to be noted that the battery was not allowed to deep discharge below a 10% state of charge in order to prevent premature aging and need for replacement. When reaching a 10% state of charge, all loads were disconnected until the battery was charged again. The related cost elements used in the simulations, as presented in Table 6, were in line with real market prices in Rwanda for 2019. Furthermore, a sensitivity analysis was carried out for different levels of annual capacity shortage to evaluate its effect on the levelized cost of electricity and load not met. The techno-economic investigation horizon was set to a 20-year period. Finally, the real interest rate for Rwanda for the year 2018 according to World Bank data was adopted, which was recorded as 17.9%.
3. Systems Sizing and Economic Investigation of Rural Electrification
3.1. Step 1: Sizing of a System to Meet the Household Needs
A microgrid is designed to meet the electrification needs of the households of the typical village considered. Through this investigation, the levelized cost of electricity is determined. A sensitivity analysis takes place in terms of the maximum allowed annual capacity shortage, the loads not met, and the electricity lost. The results of the optimizations are presented in Table 7.
Intermediate conclusions from the results are listed below:
The lowest LCOE is observed for Case 1.2. This is understandable because, subsequently, the system operator sells less kWhs. In Case 1.1, the LCOE is higher because, even if more kWhs are sold, the cost of the system is considerably higher.
An investor would most probably choose Case 1.2 because it has almost the same CAPEX as Case 1.3, but lower LCOE than all the other cases.
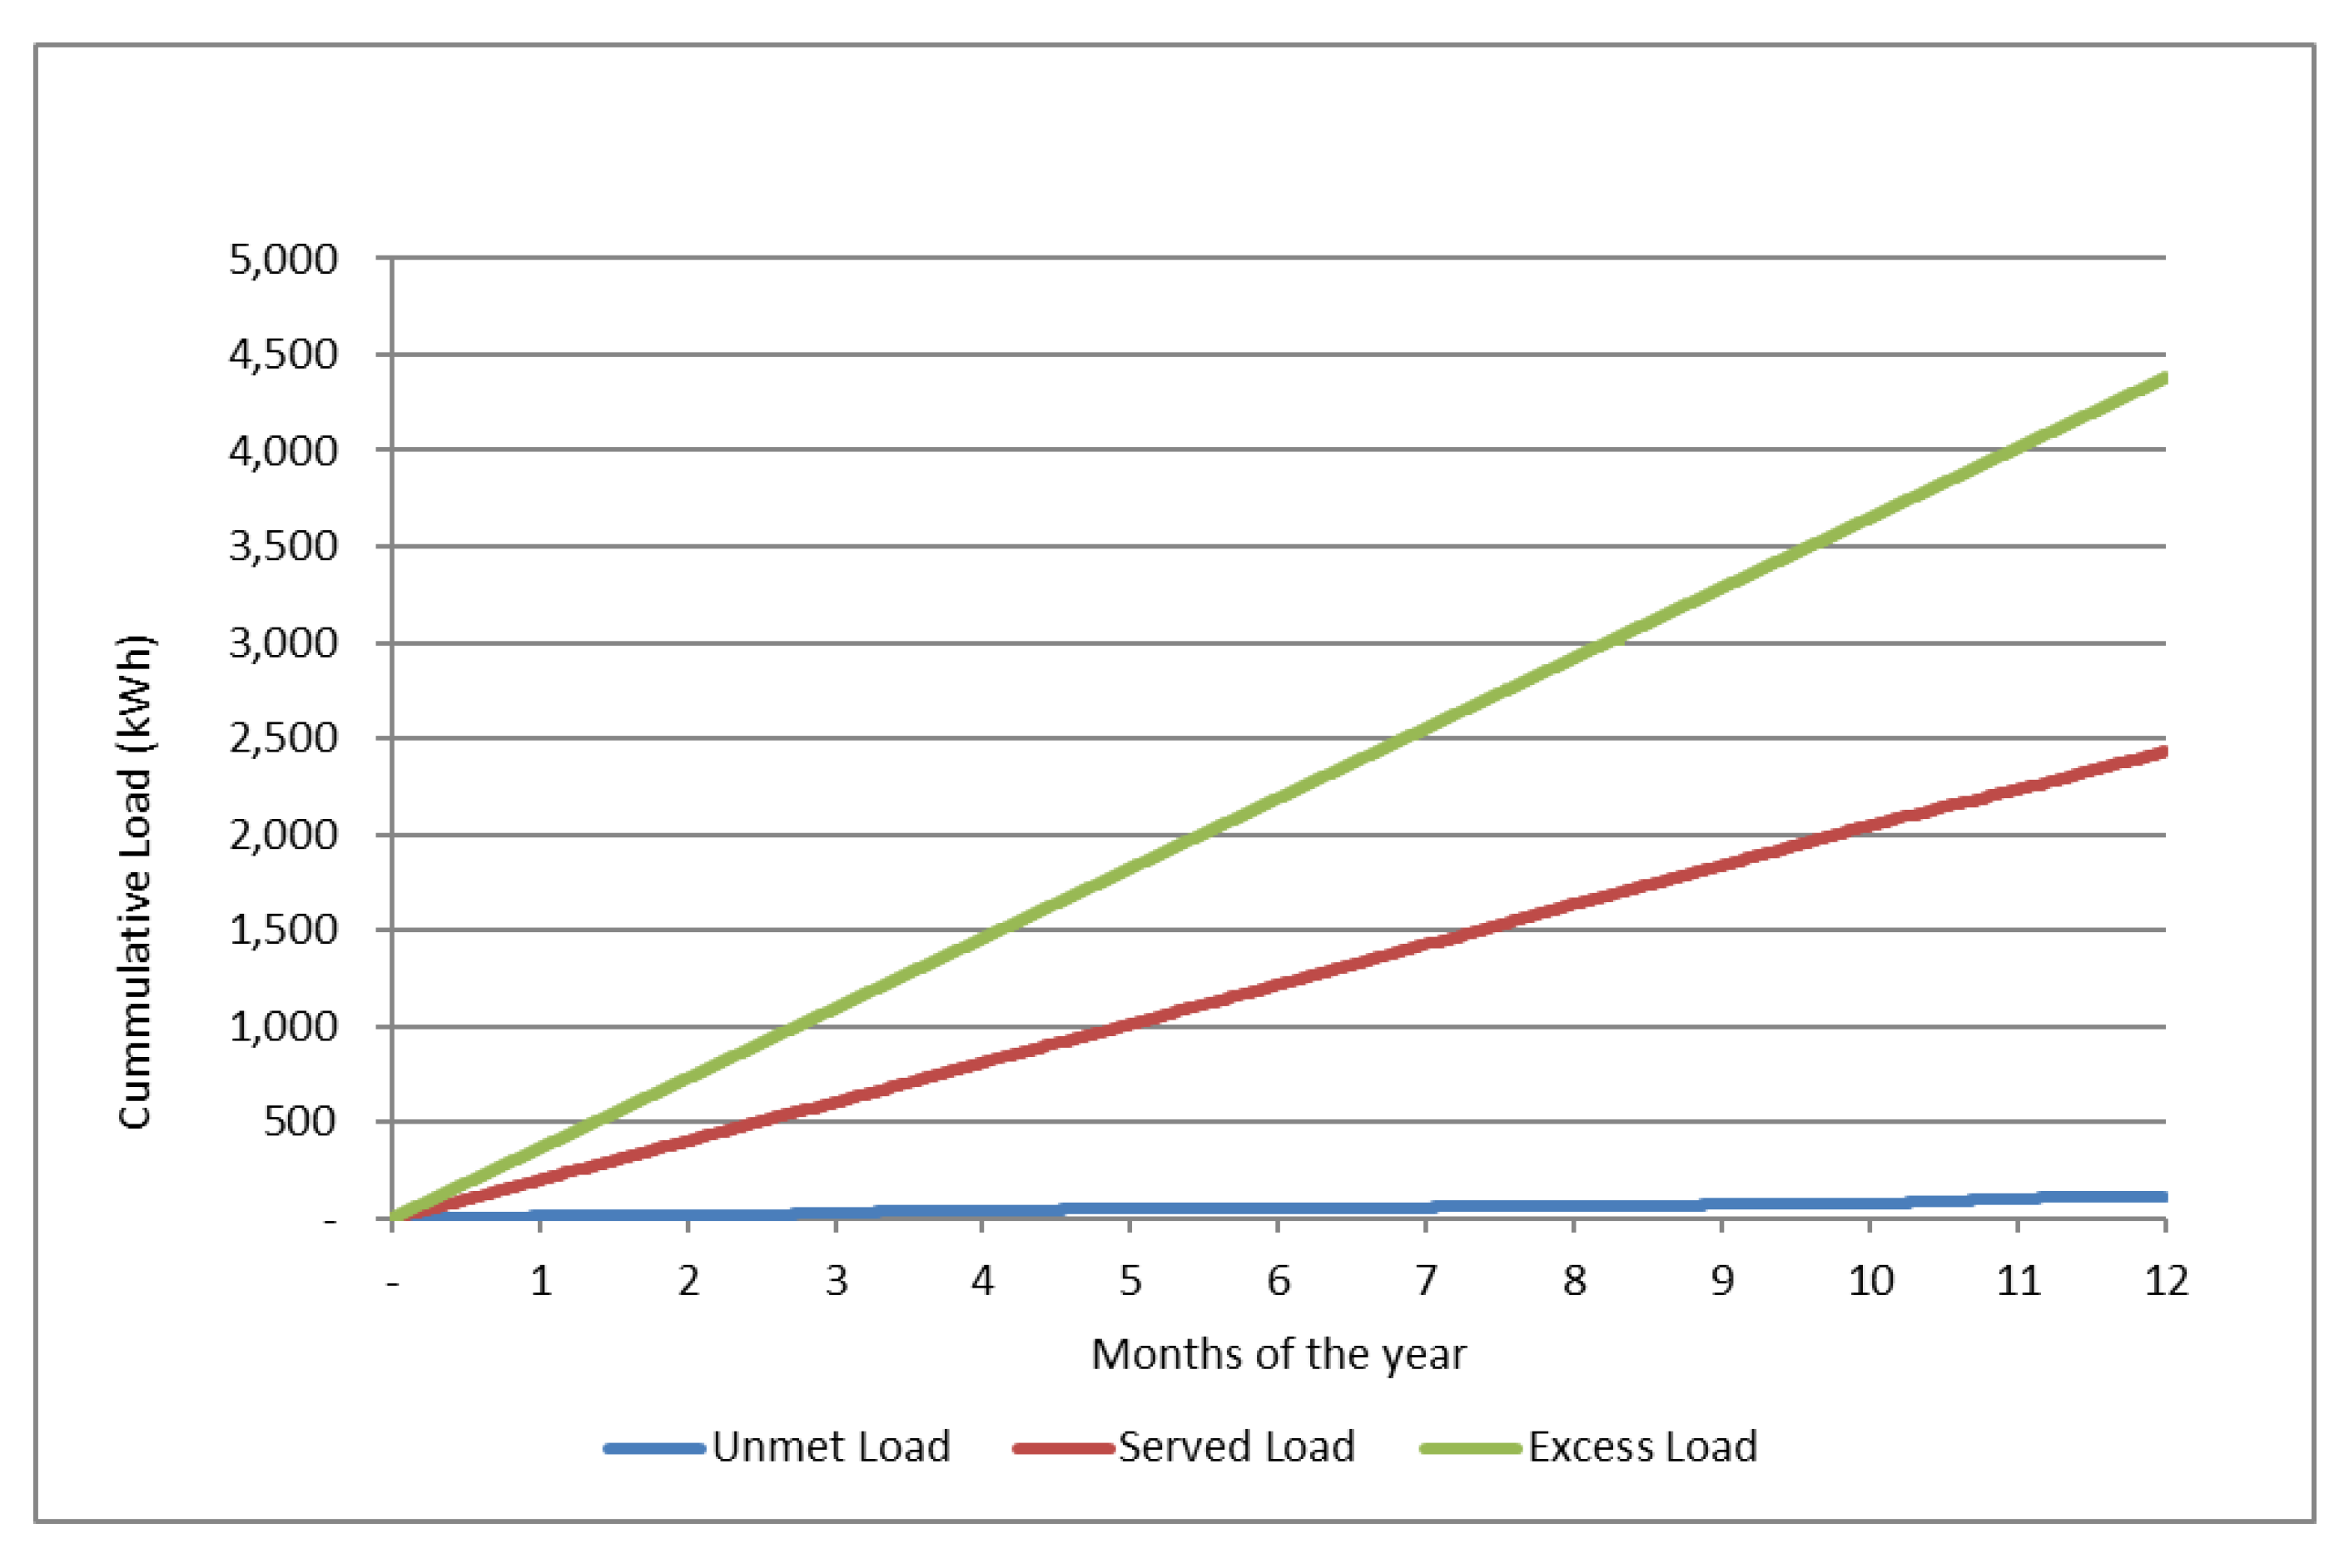
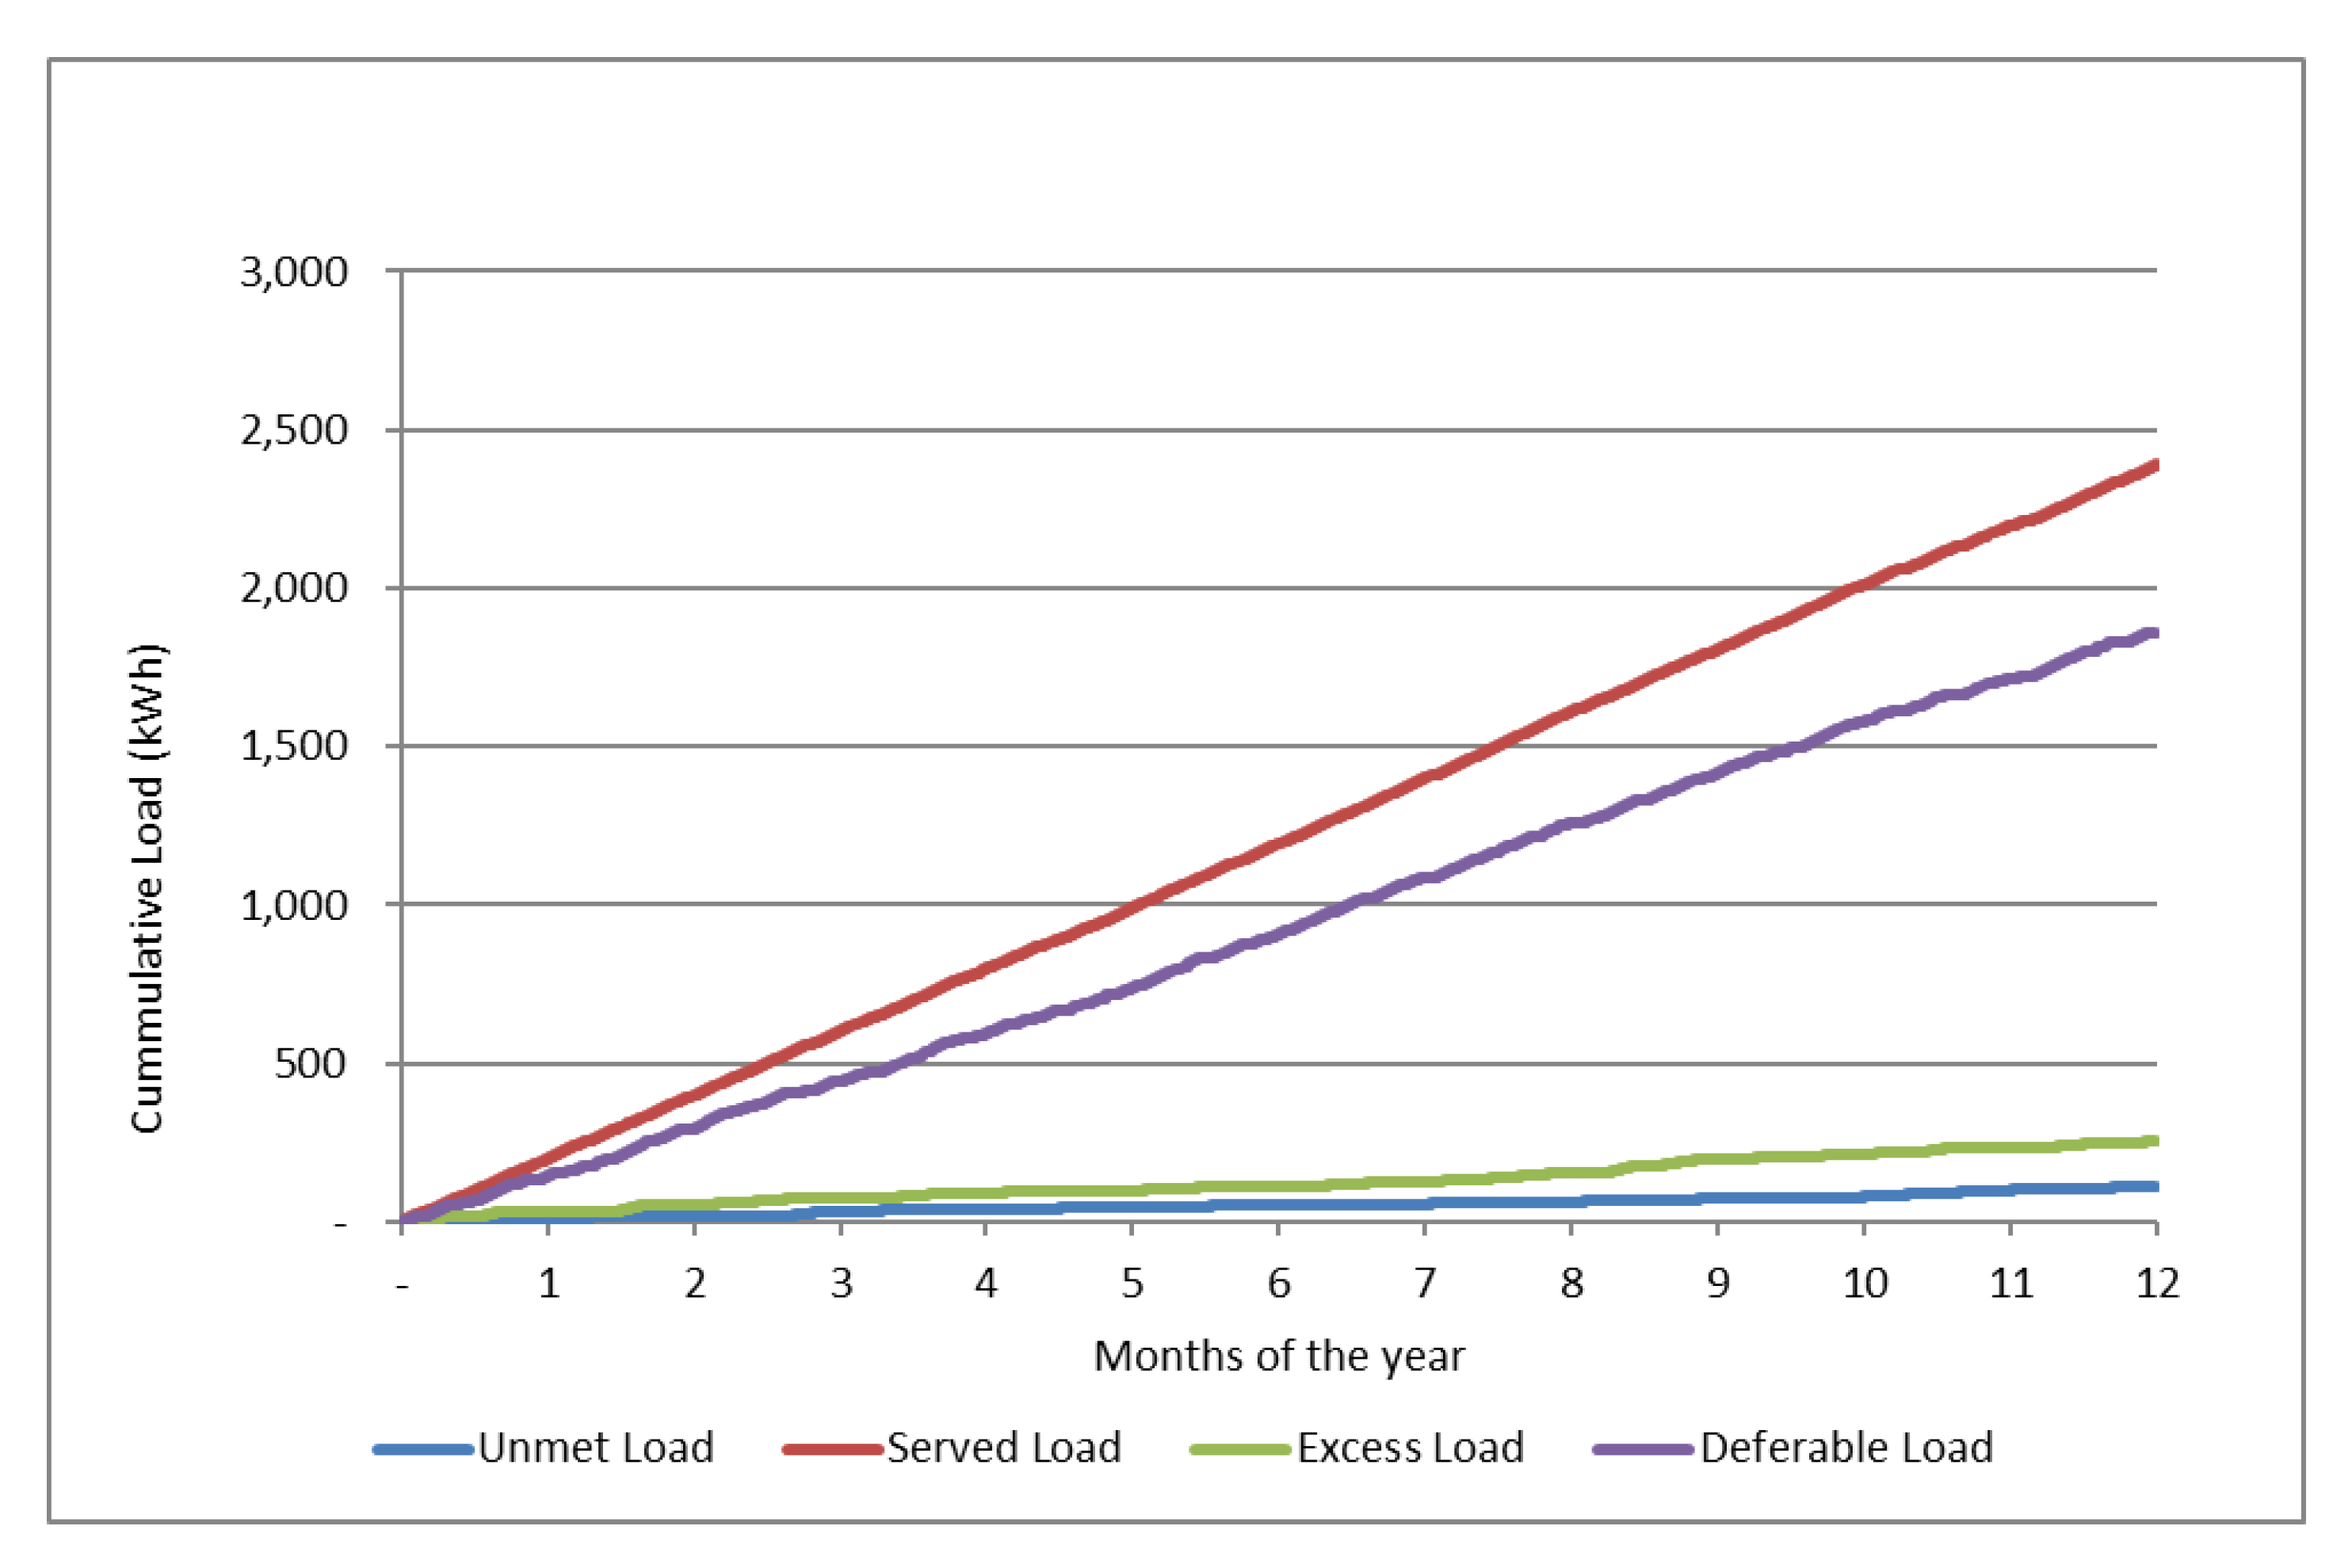
In all cases, electricity is lost because it is not cost-effective to store it. Figure 4 graphically presents the cumulative served load, the unmet load, and the excess load throughout the year. The excess load is simply discarded and, thus, wasted. The most important highlight of this is that the wasted energy from the system is much higher than the utilized electricity.
- -
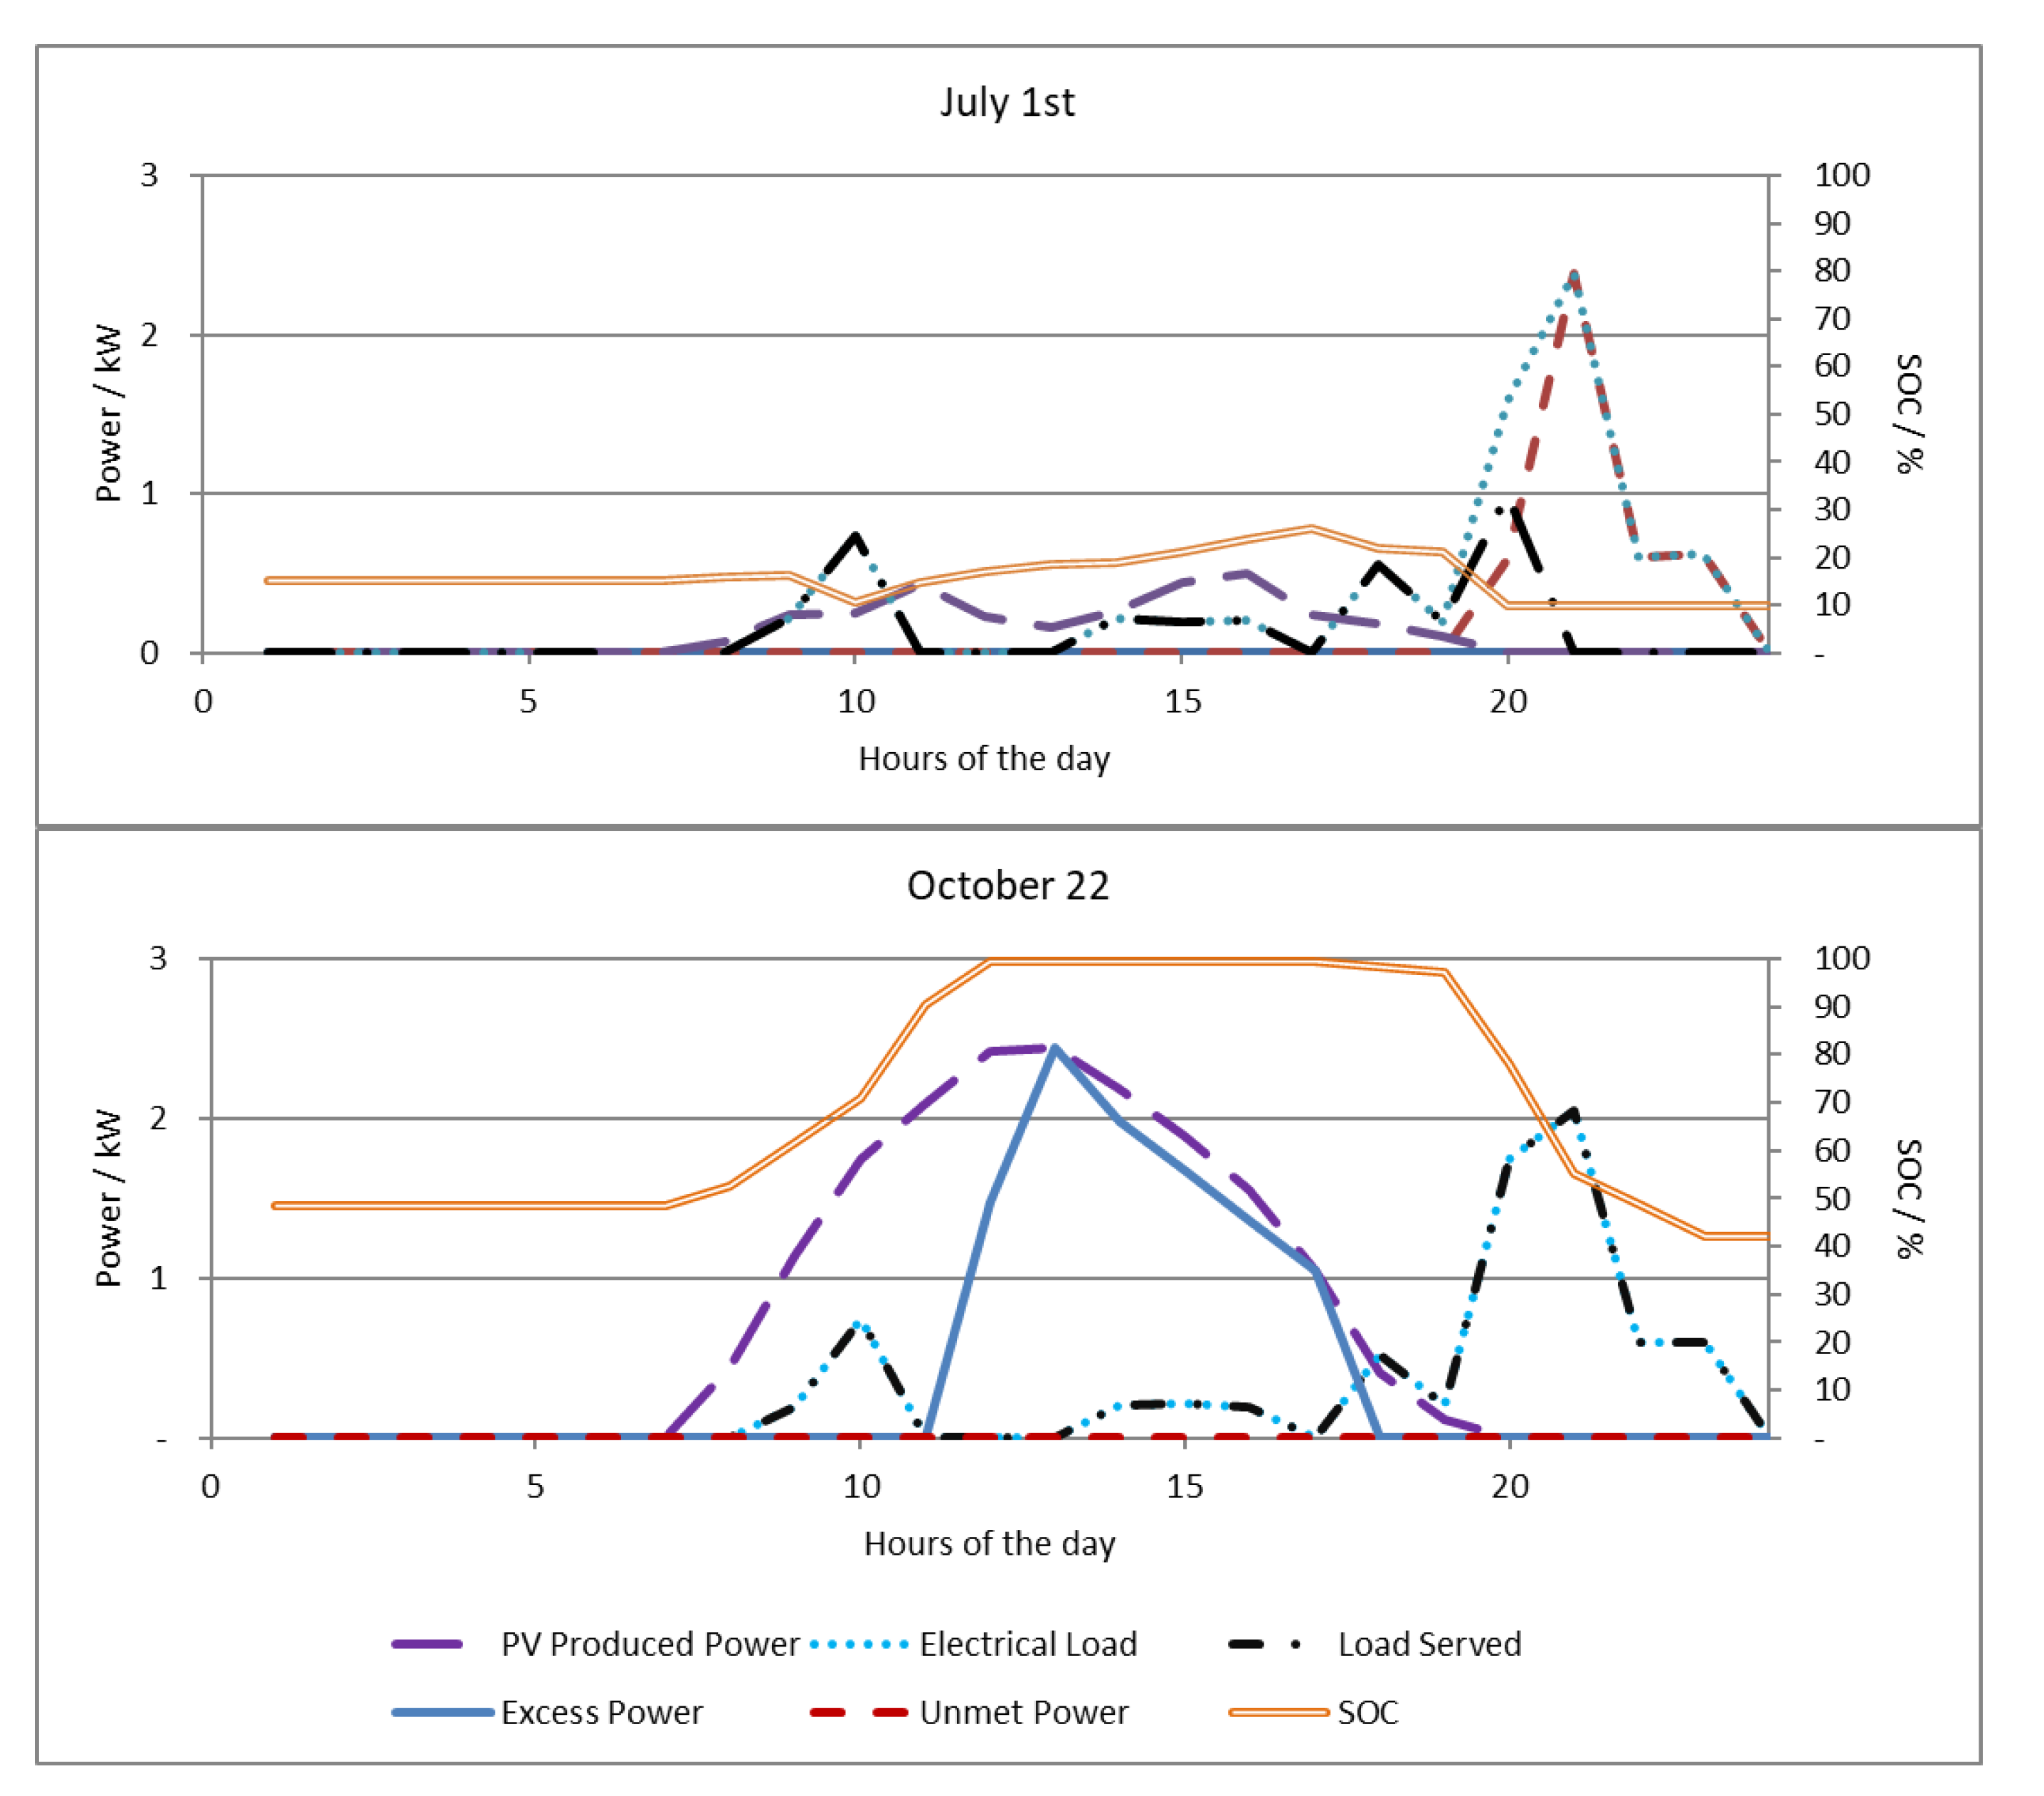
- Figure 5 presents two typical days of the year for Case 1.2, which further showcase how the system operates under excess power and unmet load. On July 1st, the solar irradiation is low and, as such, the PV produced power is low. The battery bank starts at 15% state of charge. The morning load is able to be met by the PV production and the battery, and even though the PV production is low throughout the day, the load is met until the evening. From then on, the battery reaches 10% state of charge and all loads are disconnected. The load is going to be served again when the battery gets charged by the PV array. On the 22nd of October, the PV array produces power from early in the morning until late in the evening. The battery gets full and is able to meet the load in the evening hours when the sun has set. For almost seven hours, the battery remains full, and during this time the produced power is lost because there is no extra storage capacity.
- -
- The LCOE is extremely high in all cases and it is very difficult to sell electricity at that price. For reference, grid kWh for Rwanda is sold between 0.12 € and 0.18 €.
- -
- Such an investment would need a high amount of grant money to cover the CAPEX in order to become viable.
The most important outcome of this analysis is the high cost of electricity and the high amounts of electricity wasted. The most common solution used to address this is to be able to connect a deferrable load to the system, such as a water pump, an ice making machine, etc. In the next step of this study, a deferrable load in the form of a maize mill will be considered.
3.2. Step 2: Addition of a Deferrable Load
A commercial high efficiency mill targeted for rural areas of the developing world was considered for the case study. This mill can process 30 kg of maize per hour to produce flour with a consumption equal to 1.1 kW when in operation. The cost of this mill, along with the supporting structures to allow easy supply of maize and storage of the produced flour, is considered to be 10,000 € and is in line with market costs for off-grid high efficiency mills.
Based on the data and assumptions made in Section 2.1, a 55 t consumption of maize flour takes place at the village. The mill cost is assumed to be an investment of an agricultural cooperative or a private sector business, which will buy electricity from the microgrid operator. The same analysis as in Section 3.1 takes place, and the results are presented in Table 8.
Based on the results, the following can be extracted:
- -
- The LCOE is able to drop to ~1.8 € kWh−1, which is considerably lower than the systems that supplied electricity only to households in Step 1.
- -
- For Case 2.2, the excess electricity is 5.29%, so a significant improvement is observed in relation to the systems that targeted only households.
- -
- For Cases 2.4 and 2.5, almost all of the produced electricity is consumed; however, there is a high percentage of unmet load. As such, the LCOE increases.
- -
- An investor would most probably choose Case 2.2 because it has the lowest LCOE than all the other cases.
- -
- Considerably less electricity is wasted from the system using a deferrable load. Figure 6 graphically presents the cumulative served load, the unmet load, the excess load, and the deferrable load throughout the year for Case 2.2. As can be seen, much less energy is wasted in comparison with the system from Step 1.
- -
- Figure 7 presents two typical days of the year for Case 2.2, which further showcases how the system operates under excess power and unmet load. July the 1st is a day with low PV production, and the performance observed is comparable with the system in Step 1. As is expected, the deferrable load is not activated at all during this day. On the 22nd of October, the PV array produces power from early in the morning until late in the evening. The battery gets full and is able to meet the load in the evening hours when the sun has set. The deferrable load is activated for 9 h and, as such, much less electricity is wasted in comparison with the system in Step 1.
It is understandable that, with further optimization (e.g., demand side management, variable tariffs, and different tariffs to different customers), a microgrid investor can push the LCOE down even further to approximately 1.5 € kWh−1. Given that access to grant funding is available, these results are in line with the results presented in Table 3. The business models, as in the JUMEME case presented in Section 1, aim to ensuring that enough productive use and deferrable loads are present in remote locations, along with the ability to pay for the electricity consumed, which, in the end, make the rural electrification investment viable.
3.3. Step 3: Agricultural Cooperative Business Expansion
In many areas of the developing world, cooperatives are looking to expand their activities and to produce higher value goods in rural areas in order to increase their income. For example, as presented in Figure 1, drying takes place in rural areas to prepare dry maize before selling it to traders. This section investigates the possibility of the cooperative producing flour on-site. In 2019, the price of maize, fixed by the Rwandan Ministry of Agriculture, was 200 RWF per kilo, which is ~0.20 €. At the same time, the price of maize flour was at 550 RWF per kilo, which is ~0.54 €. A cooperative could invest in a mill to produce flour.
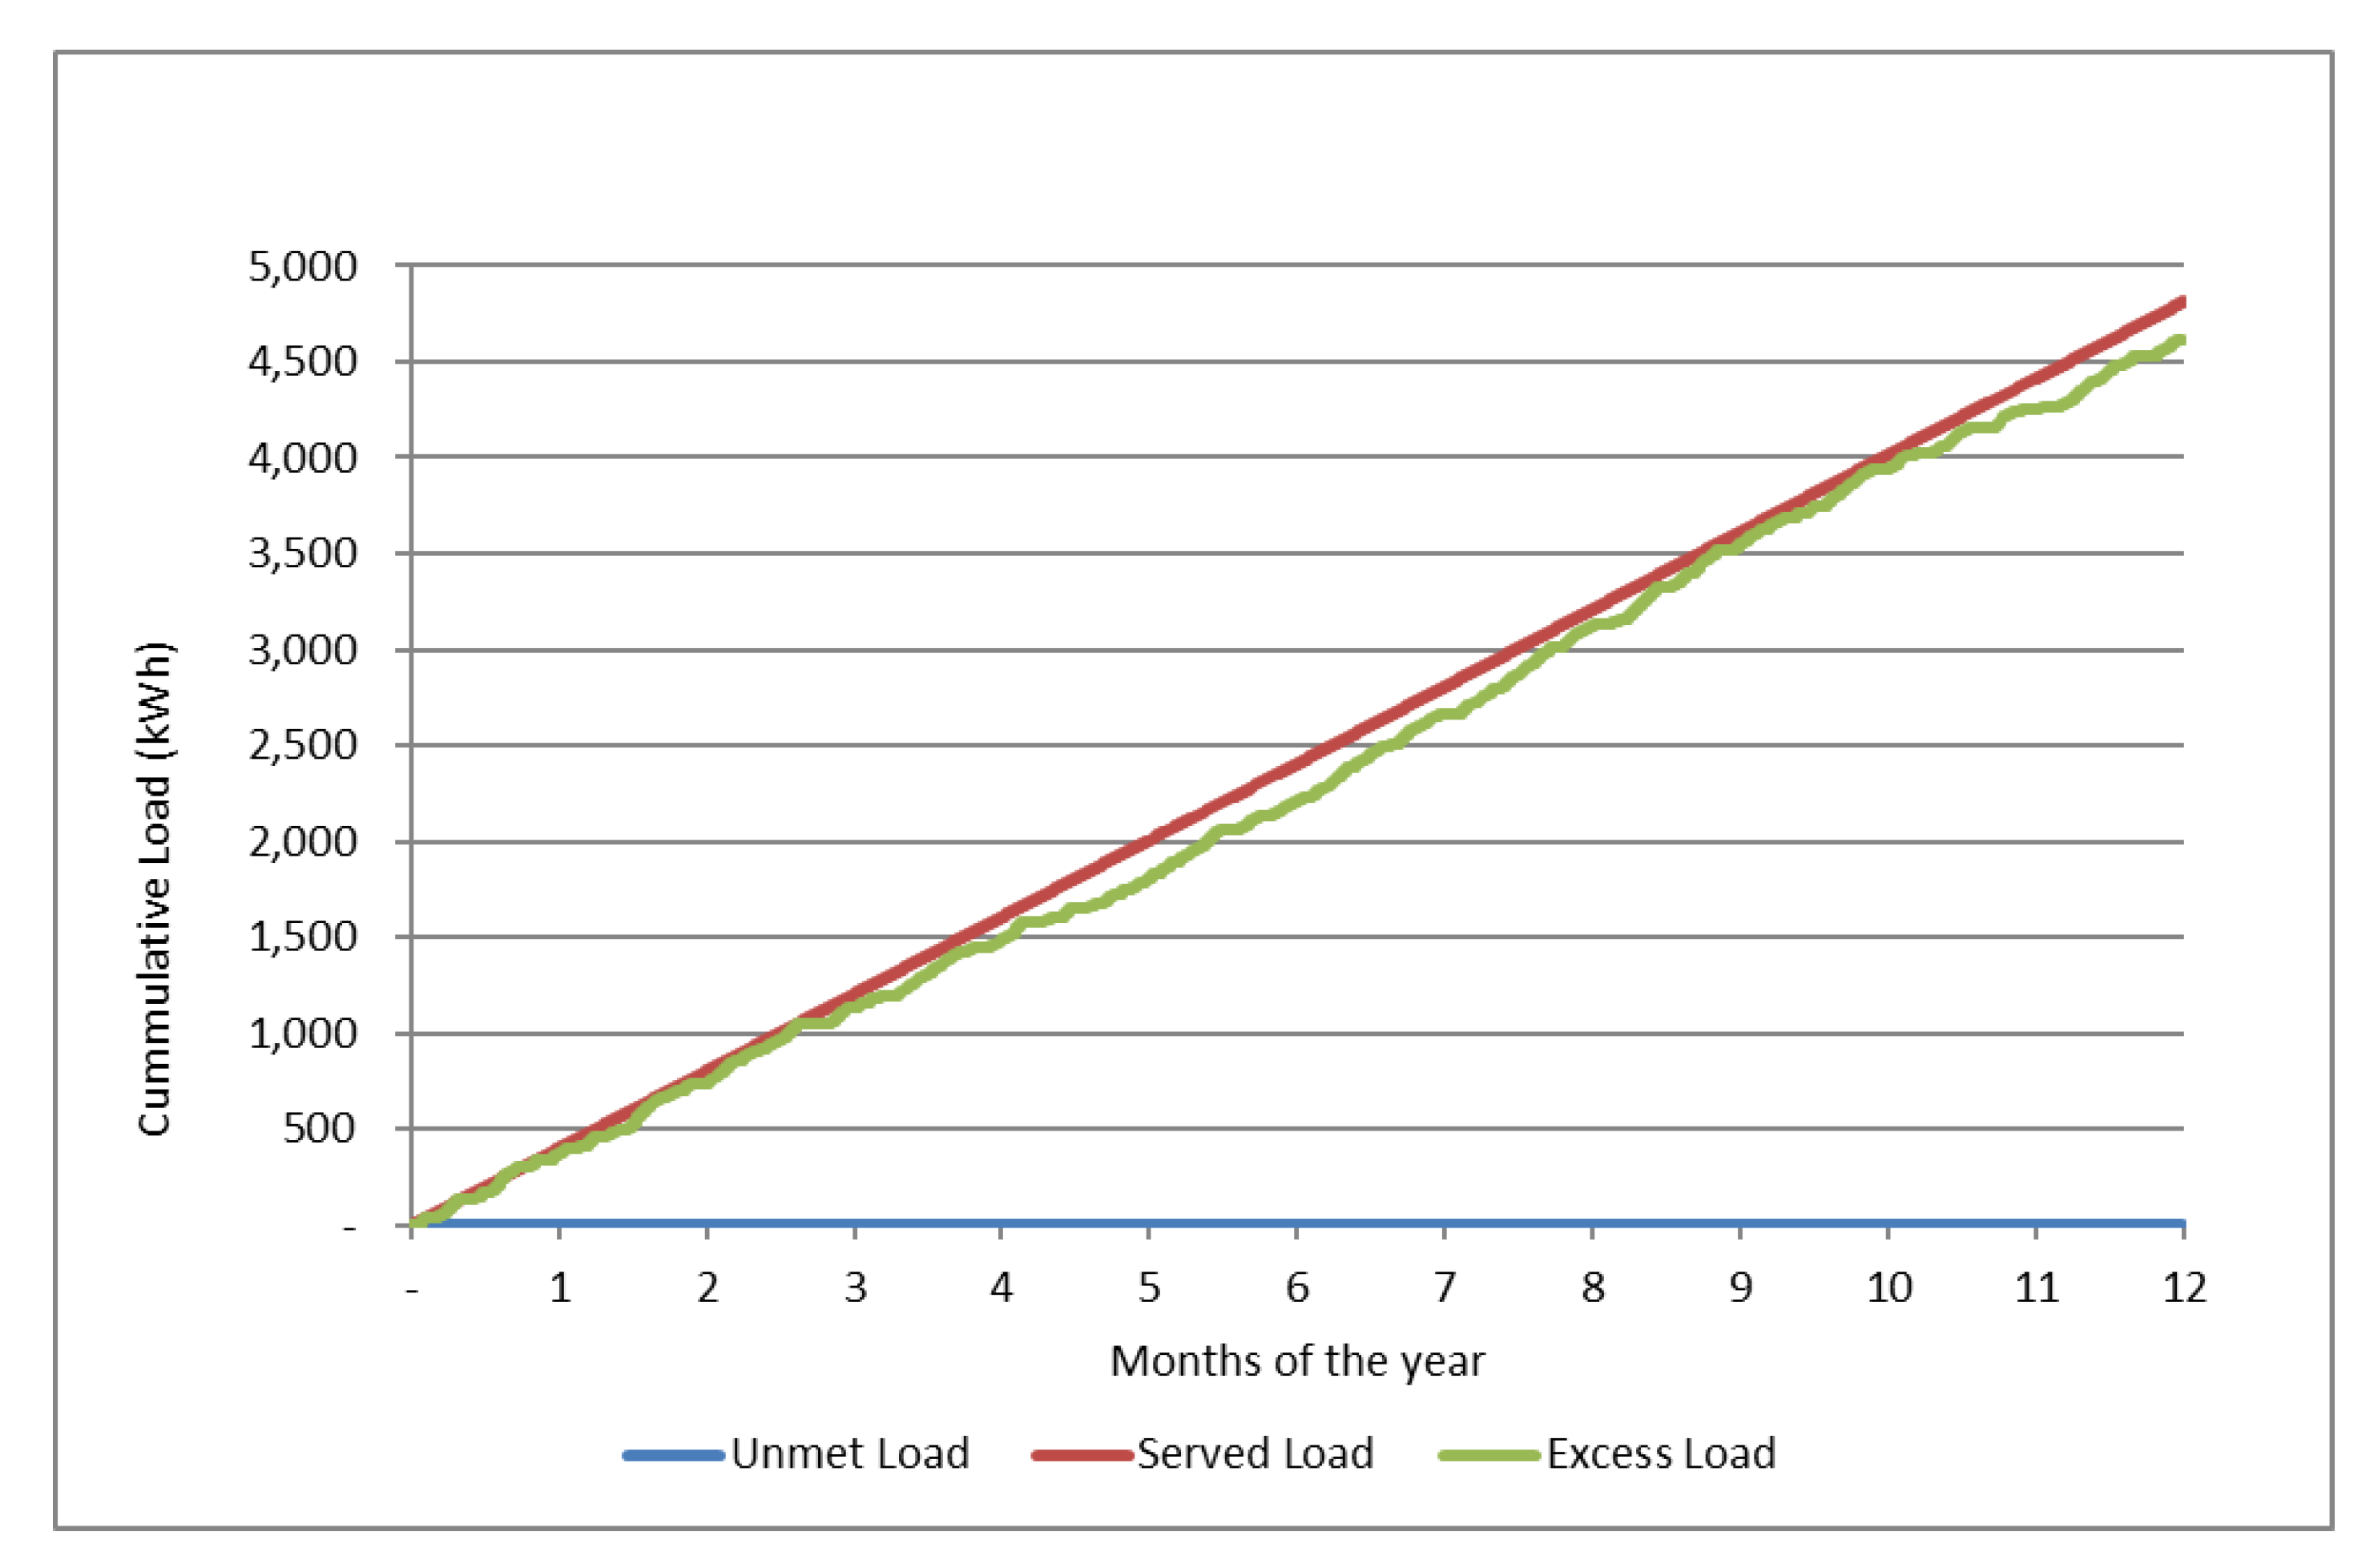
An autonomous system is designed to produce the electricity needed by the mill, and the overall investment is evaluated. The production of maize in the village is considered to be 115 t based on the assumptions in Section 2.1. An assumption is made that flour is produced throughout the year, as dry maize can be stored on the cooperative premises. Since the system is designed for commercial purposes, the load has to be continuously met. The optimal system design, which includes the cost of the mill, as calculated by HOMER, is presented in Table 9. Figure 8 presents the cumulative served, unmet, and wasted load throughout the year.
With the system above, the cooperative, instead of selling the dry maize for 23,000 €, would sell maize flour for 62,100 €, so the profit would increase by 70%. As the CAPEX of the system is 44,519 €, the simple payback period for this investment is less than two years. As is understandable, such an investment is very profitable and could boost the economic activity of rural areas considerably, improving the livelihood of the local population. Because of the considerable socio-economic benefits of such investments, in recent years, the interest in using renewable energy for decentralized solutions in the agri-food chain has been rising [47].
Still, as is clearly visible, such a system is characterized by very high excess electricity throughout the year. Figure 8 clearly showcases this, as the wasted power is roughly the same as the utilized electricity. At the same time, as was expected by the design constraints, there is practically zero unmet load throughout the year.
In reality, the cooperative does not care about the actual cost of the kWh because the system on a whole is built to process maize and produce flour. The increased value of flour in reality can allow high electricity costs because electricity, in this case, is just an intermediate good.
The next and final step investigates household electrification activity by the agricultural cooperative.
3.4. Step 4: The Local Agricultural Cooperative as the Village Household Electrification Investor
In this step, the option to include village household electrification to the system used for milling by the agricultural cooperative is investigated.
Firstly, a technical investigation takes place to see if the electricity system designed in Section 3.3 can also provide electrification to households, as it presents very high excess electricity. In this example, the only extra cost the cooperative would have to invest in is the grid infrastructure of the village, which is estimated for this case study at 10,000 € [29]. The results of this simulation are presented in Table 10.
The simulation shows that the unmet load to the households will be 462 kWh per year, which translates to ~18% of the household consumptions (it is comparable to Case 1.4 in Section 3.1).
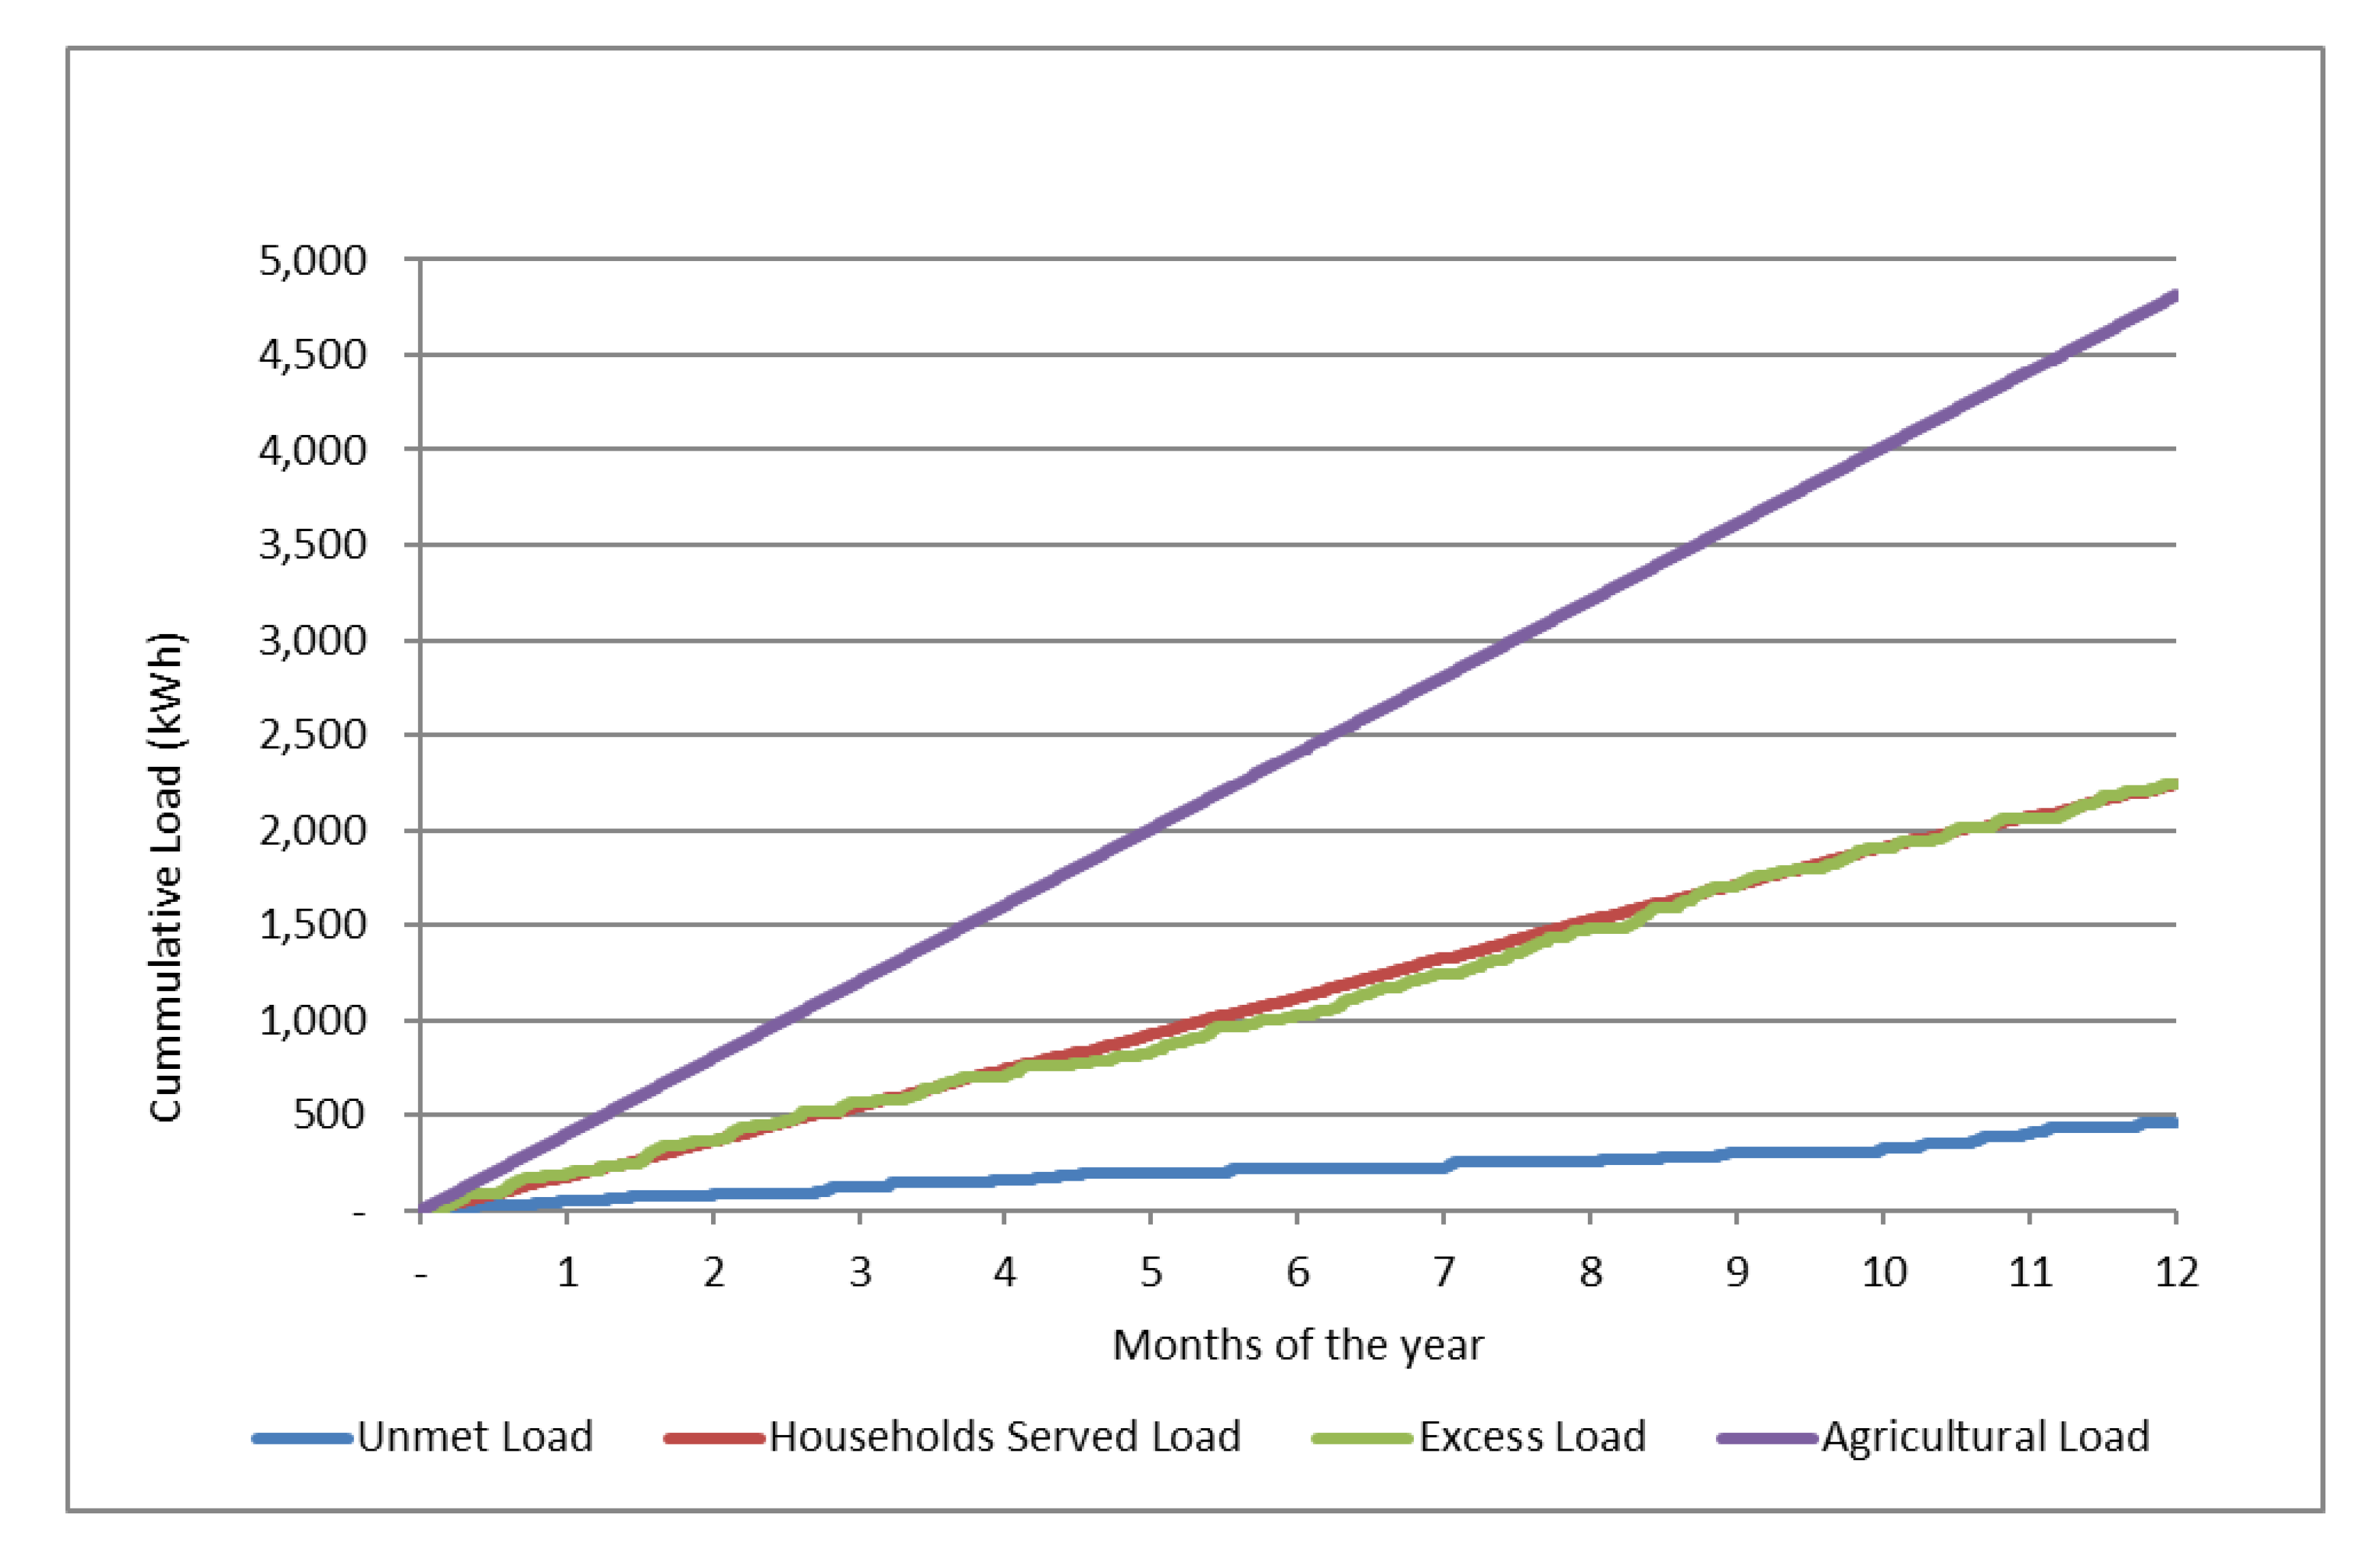
This is in line with Tier 2 access, as presented in Table 1. This is further showcased in Figure 9. However, there is a high excess of electricity observed in this example, which could be utilized further, decreasing the unmet load to the households through the implementation of an advanced energy management system.
Moreover, the LCOE is the lowest observed in all the systems analyzed in this study, at 1.555 €/kWh. Given the very high profitability of the mill investment, as presented in Section 3.3, and the fact that a cooperative is essentially a union of the local population, it is relatively easy to develop a business model for the provision of electricity to local households at very low cost. Essentially, a cross-subsidy between the agricultural activity and the household electrification can take place. Furthermore, the increased income of the farmers due to the mill can lead to further investments in the area, such as, for example, an expansion of the microgrid to increase the tier access provided.
4. Environmental Benefits of Decentralized Agricultural Activity
Maize flour production on a local basis would result in increased income for the farmers/cooperative members, as was described in Section 3.3. This, in turn, would give them the opportunity to invest in technology and advanced techniques of production resulting in higher yields for the same acreage. This would make it possible for the cooperative to either strengthen its relationship with large mills, thus gaining higher grain prices, or increase the milling capacity by adding small scale mills on a modular basis (keeping the same mill type and capacity in each upgrade and adding units). The energy producing system would also increase accordingly, providing the village with the ability to increase its tier in electricity access.
Furthermore, such an activity would also reduce the amount of maize grain that centralized large mills are currently processing and result in less environmental impact through reduced energy consumption and GHG emissions. Such facilities are based on grid electricity that, 47.2% of the time in the case of Rwanda, comes from fossil fuels [48]. According to Energy Experts International, conventional mills of European standard, based on their capacity and size, require 361–1186 MJ t−1 for flour production [49]. If the solar mill considered in Section 3.2 is used for local flour milling, then the energy required will reach 132 MJ t−1, reducing it by 63–89%, not taking into account the possible energy needs involved in grain transportation to the centralized mill. In addition, if we take into account the UN standardized baseline Rwanda grid emission factor of 0.767 kg CO2eq per kWh [50], then the centralized mill produces directly 76.7–253 kg CO2eq per ton of produced flour, while the solar decentralized system has zero direct GHG emissions. Therefore, for the 115 t that the village presented above produces, the energy use reduction would reach 26.3–121.2 GJ, and the environmental benefit would be 8.82–29.1 tCO2eq (equivalent to 1.9–6.3 regular passenger cars on an annual use basis [51]). This energy surplus could be used for several purposes, either for other industrial needs or to provide electrification to urban and peri-urban populations; the urban access to electricity figure for Rwanda in 2018 was 69%. In the hypothetical, but technically possible, scenario of replacing 10% of industrial maize processing with local solar mills, then 6.760 t y−1 of processed maize [52] would be processed locally, and about 515–1.710 tCO2eq in total would not be emitted (equivalent to 112–372 regular passenger cars on an annual use basis).
5. Discussion
It has been demonstrated that rural electrification is a key enabler, facilitator, and driver for sustainable development of rural areas of the developing world. It is also acknowledged that the most important economic sector for these areas is agriculture because, as a first step, they can provide the food needed by the local population and, as a next step, can stimulate economic activity and development. Rural electrification is challenging, and it is difficult to have viable profitable investments.
It is widely acknowledged at this point in time that private investment is needed in order to provide electricity to people living in rural areas of the developing world [53]. Development partners like the World Bank [54], the European Union (EU) [55] and the USA [56] are providing financing schemes to innovative business models related to rural electrification. Moreover, support for developing new policy models has also been heavily supported. The EU, through its Technical Assistance Facility for Sustainable Energy, has developed the “Guidelines for Institutional and Policy Model for Micro-/Mini-grids” for the benefit of the African Union Commission [57], which includes provisions that facilitate innovative business models for rural electrification, including the model proposed in this paper. Furthermore, community based models have also been investigated because they can increase community engagement, address some of the challenges faced by other business models, and be able to offer more socio-economic benefits to the local community [58]. Technological advancements can indeed decrease overall costs, contributing to the viability of rural electrification investments. This has been acknowledged, and upcoming innovative financing schemes like the Digital Energy Facility by Agence Française de Développement (AFD) and the EU have this at their core [59]. The most advanced business models in rural electrification, such as the JUMEME example that was presented in the introduction, have rural electrification companies at their center and are trying to develop the electricity needs of the local population in order to be able to sell more electricity and ultimately ensure the viability of the electrification investment.
Going beyond the state-of-the-art and building upon the lessons learned, the case study of this work shows that there is another way possible, which can address some of the challenges faced and eventually ensure that two targets are met at the same time; stimulation of economic activity through the electrification of productive loads mainly related to agriculture on one hand, and provision of household electrification utilizing agricultural cooperatives as the project owner on the other. The definition of a cooperative according to the International Cooperative alliance is “Cooperatives are people-centred enterprises owned, controlled and run by and for their members to realise their common economic, social, and cultural needs and aspirations” [60]. While cooperatives were initially introduced in Africa as part of colonial economic policies, since the 1980s, structural changes and legal battles have taken place in order to minimize government interference towards independence and further growth [61]. Significant promotion of agricultural cooperative producer structures has been observed and is considered as an important way forward [62]. Agricultural cooperatives can indeed be one of the vehicles for promoting sustainable rural development.
As was showcased in Section 3, if an autonomous electricity system based on photovoltaics is sized to meet the needs of a commercial load, such as milling, large amounts of energy are wasted. This is due to the fact that production of electricity is much cheaper than storing it and it makes economic sense to have increased installed power to meet the load during, for example, cloudy days than to store electricity produced during sunny days. As presented in Figure 8, almost half of the produced electricity is discarded because it does not make economic sense to store it. This discarded electricity can be used to provide Tier 2 household electrification to the villagers. The actual cost for supplying this electricity to households is linked to the microgrid infrastructure. It is also understandable that almost all of the households will be members of the agricultural cooperative of the village. They can decide to use part of the agricultural profits for cross-subsidization of their households’ electrification. This is fully in line with the spirit of cooperatives, citing from [60] “Putting fairness, equality and social justice at the heart of the enterprise, cooperatives around the world are allowing people to work together to create sustainable enterprises that generate long-term jobs and prosperity. Cooperatives allow people to take control of their economic future and, because they are not owned by shareholders, the economic and social benefits of their activity stay in the communities where they are established.”
It has to be noted at this point that the selected case study applies to Rwanda, but comparable results are expected to be obtained in all East African countries in terms of decentralized maize flour production because the maize markets in these countries have many similarities [41]. Agriculture related productive loads applicable to remote areas of Sub-Saharan Africa, though, are not limited to on-site flour production. Pumping water for irrigation has been proven to be one of the best interventions for increased production and consequent farmers’ income increase [63]. Small scale palm oil processing has proven to be profitable [64]. Ice makers can allow communities near the sea or a lake to store fish for longer periods of time; this in turn leads to increased fish sales and, consequently, increased income for these communities [65]. Rice threshers can also be powered by off-grid systems to provide benefits to remote farms [66]. The list of agriculture related productive loads that can be powered by rural electrification system is extensive [33]. This means that the proposed business model can be applied anywhere in Sub-Saharan Africa where an agricultural cooperative is active and profitable post-harvest processing of the agriculture produce is possible.
The proposed business model has further benefits because rural electrification provision companies can offer their services as subcontractors and not have to undertake a much more extended role, as in the JUMEME example presented above, by utilizing available resources more effectively. Moreover, since agricultural electrification investments have really low payback periods (in the above case study, it was less than two years) it can be relatively easy for the cooperatives to get access to development financing and treat the household electrification component as a side-product for the benefit of their community on the path to achieving sustainable development.
6. Conclusions
Electrification of agriculture is one of the main drivers for improving agricultural production and income of local farmers. Such investments have very low payback periods for the developing world and also present multiple site-benefits, such as reduced immigration to the big cities and abroad, creation of new jobs, increase of income, improvement of living conditions, and, ultimately, poverty alleviation.
The electrification of households is a challenging investment, as can be seen in Section 3.1. This is why the electrification of productive uses of energy has been proposed throughout the last decade in order to make both the electrification investments viable and improve the socio-economic conditions of these areas. Even with new digital technologies and business models developed in the last few years, it is very difficult to deploy viable microgrid investments through only commercial lending.
With the aid of digital technologies, it is easy to understand that the profits presented by agricultural electrification are so high, they can actually cross-subsidize household electrification. If the agricultural cooperatives and businesses becomes the main investor in a household electrification activity and this is considered a part of an agricultural electrification investment, it is possible to see higher electrification rates in the short term. This approach is fully in line with the guidelines for institutional and policy frameworks for microgrids that have been adopted by the African Union Commission and are also fully in line with the policy and regulatory frameworks of many Sub-Saharan African countries.
This paper provides justification for why such business models need to be developed further, applied, pilot tested, and evaluated in Sub-Saharan Africa.
Author Contributions
Conceptualization, G.K.; methodology, G.K. and A.T.B.; software, G.K.; validation, G.K. and D.B.; investigation, G.K.; resources, G.K. and A.T.B.; data curation, G.K. and D.B.; writing—original draft preparation, G.K.; writing—review and editing, D.B. and A.T.B.; visualization, G.K. and A.B.; supervision, D.B. All authors have read and agreed to the published version of the manuscript.
Funding
This research received no external funding.
Conflicts of Interest
The authors declare no conflict of interest.
Abbreviations
| AFD | Agence Française de Développement |
| CAPEX | Capital Expenditure |
| DESCO | Distributed energy services company |
| ESMAP | Energy Sector Management Assistance Program |
| EU | European Union |
| FAO | Food and Agriculture Organization/ |
| FAOSTAT | Food and Agriculture Organization Statistics |
| GHG | Greenhouse Gas |
| LCOE | Levelized cost of electricity |
| OECD | Organization for Economic Co-operation and Development |
| OPEX | Operational Expenditure |
| SDG | Sustainable Development Goal |
| SOC | State of Charge |
| UN | United Nations |
| WBG | World Bank Group |
References
- IEA. World Energy Outlook 2018; OECD/IEA: Paris, France, 2018. [Google Scholar]
- Silberston, A. Economies of Scale in Theory and Practice. Econ. J. 1972, 82, 369–391. [Google Scholar] [CrossRef]
- Marshall, A. The Principles of Economics; McMaster University Archive for the History of Economic Thought: London, UK, 1890. [Google Scholar]
- Chen, M.; Zhang, H.; Liu, W.; Zhang, W. The Global Pattern of Urbanization and Economic Growth: Evidence from the Last Three Decades. PLoS ONE 2014, 9, e103799. [Google Scholar] [CrossRef] [PubMed] [Green Version]
- Martínez-Zarzoso, I.; Maruotti, A. The impact of urbanization on CO2 emissions: Evidence from developing countries. Ecol. Econ. 2011, 70, 1344–1353. [Google Scholar] [CrossRef] [Green Version]
- Zhou, L.; Dickinson, R.E.; Tian, Y.; Fang, J.; Li, Q.; Kaufmann, R.K.; Tucker, C.J.; Myneni, R.B. Evidence for a significant urbanization effect on climate in China. Proc. Natl. Acad. Sci. USA 2004, 101, 9540–9544. [Google Scholar] [CrossRef] [PubMed] [Green Version]
- Bao, C.; Chen, X. The driving effects of urbanization on economic growth and water use change in China: A provincial-level analysis in 1997–2011. J. Geogr. Sci. 2015, 25, 530–544. [Google Scholar] [CrossRef] [Green Version]
- McDonald, R.I.; Kareiva, P.; Forman, R.T.T. The implications of current and future urbanization for global protected areas and biodiversity conservation. Biol. Conserv. 2008, 141, 1695–1703. [Google Scholar] [CrossRef]
- Hassell, J.M.; Begon, M.; Ward, M.J.; Fèvre, E.M. Urbanization and Disease Emergence: Dynamics at the Wildlife–Livestock–Human Interface. Trends Ecol. Evol. 2017, 32, 55–67. [Google Scholar] [CrossRef] [Green Version]
- Anríquez, G.; Stamoulis, K. Rural Development and Poverty Reduction: Is Agriculture still the Key? Electron. J. Agric. Dev. Econ. 2007, 4, 5–46. Available online: http://www.fao.org/3/a-ah885e.pdf (accessed on 3 February 2020).
- Moseley, M. Rural Development: Principles and Practice; SAGE: London, UK, 2003. [Google Scholar] [CrossRef]
- Rowley, T.D. Rural Development Research: A Foundation for Policy; Greenwood Press: Westport, CT, USA, 1996. [Google Scholar]
- Ward, N.; Brown, D.L. Placing the Rural in Regional Development. Reg. Stud. 2009, 43, 1237–1244. [Google Scholar] [CrossRef] [Green Version]
- Brundtland, G.H.; Khalid, M.; Agnelli, S.; Al-Athel, S.; Chidzero, B. Our Common Future; Oxford University Press: Oxford, UK, 1987. [Google Scholar]
- Vélez Echeverry, S.; Burnett, B.; Diniz, J.; Els, R. Rural Electrification and Sustainable Development in South America Afro Descendant’s Communities: A Comparison between the Hinterlands of Brazil and Suriname. In Proceedings of the 9th Conference on Sustainable Development of Water, Energy and Environment System, 20–27 September 2014; Available online: https://www.researchgate.net/publication/277815804_Rural_Electrification_and_Sustainable_Development_in_South_America_Afro_Descendant’s_Communities_a_Comparison_Between_the_Hinterlands_of_Brazil_and_Suriname (accessed on 10 April 2020).
- Barron, M.; Torero, M. Household electrification and indoor air pollution. J. Environ. Econ. Manag. 2017, 86, 81–92. [Google Scholar] [CrossRef] [Green Version]
- Buyinza, F.; Kapeller, J. Household Electrification and Education Outcomes: Panel Evidence from Uganda; ICAE Working Paper Series, No. 85; Institute for Comprehensive Analysis of the Economy (ICAE), Johannes Kepler University Linz: Linz, Austria, 2018; Available online: http://hdl.handle.net/10419/193624 (accessed on 3 February 2020).
- Khandker, S.; Barnes, D.H.S. Welfare Impacts of Rural Electrification: A Panel Data Analysis from Vietnam; Economic Development and Cultural Change, University of Chicago Press: Chicago, IL, USA, 2013; Volume 61, pp. 659–692. [Google Scholar]
- Bos, K.; Chaplin, D.; Mamun, A. Benefits and challenges of expanding grid electricity in Africa: A review of rigorous evidence on household impacts in developing countries. Energy Sustain. Dev. 2018, 44, 64–77. [Google Scholar] [CrossRef]
- Lewis, J.; Severnini, E. Short- and long-run impacts of rural electrification: Evidence from the historical rollout of the U.S. power grid. J. Dev. Econ. 2019, 143, 102412. [Google Scholar] [CrossRef] [Green Version]
- Ding, H.; Qin, C.; Shi, K. Development through electrification: Evidence from rural China. China Econ. Rev. 2018, 50, 313–328. [Google Scholar] [CrossRef]
- Zeyringer, M.; Pachauri, S.; Schmid, E.; Schmidt, J.; Worrell, E.; Morawetz, U.B. Analyzing grid extension and stand-alone photovoltaic systems for the cost-effective electrification of Kenya. Energy Sustain. Dev. 2015, 25, 75–86. [Google Scholar] [CrossRef]
- Bhatia, M.; Angelou, N. Beyond Connections—Energy Access Redefined; ESMAP Technical Report 008/15; World Bank: Washington, DC, USA, 2015; Available online: https://openknowledge.worldbank.org/handle/10986/24368 (accessed on 3 February 2020).
- Palit, D.; Chaurey, A. Off-grid rural electrification experiences from South Asia: Status and best practices. Energy Sustain. Dev. 2011, 15, 266–276. [Google Scholar] [CrossRef]
- Kyriakarakos, G.; Papadakis, G. Multispecies Swarm Electrification for Rural Areas of the Developing World. Appl. Sci. 2019, 9, 3992. [Google Scholar] [CrossRef] [Green Version]
- Dagnachew, A.G.; Lucas, P.L.; Hof, A.F.; Gernaat, D.E.H.J.; de Boer, H.-S.; van Vuuren, D.P. The role of decentralized systems in providing universal electricity access in Sub-Saharan Africa–A model-based approach. Energy 2017, 139, 184–195. [Google Scholar] [CrossRef] [Green Version]
- Chaurey, A.; Kandpal, T.C. A techno-economic comparison of rural electrification based on solar home systems and PV microgrids. Energy Policy 2010, 38, 3118–3129. [Google Scholar] [CrossRef]
- OECD. Detailed aid statistics: Total official development financing ODF. OECD International Development Statistics (database): 2020. Available online: https://0-doi-org.brum.beds.ac.uk/10.1787/data-00071-en (accessed on 10 April 2020).
- International Finance Corporation, World Bank Group. Benchmarking Mini-grid DESCOs 2017 Update—Summary of Findings; IFC: Washington, DC, USA, 2018. [Google Scholar]
- Kyriakarakos, G.; Papadakis, G. Microgrids for Productive Uses of Energy in the Developing World and Blockchain: A Promising Future. Appl. Sci. 2018, 8, 580. [Google Scholar] [CrossRef] [Green Version]
- Cabraal, R.A.; Barnes, D.F.; Agarwal, S.G. Productive uses of energy for rural development. Annu. Rev. Environ. Resour. 2005, 30, 117–144. [Google Scholar] [CrossRef]
- Murabula, H.M.; Kanyua, K.E. Murabula Harrison Masiga; Kanyua, K.E. Factors influencing performance of private electricity mini grid projects in Kenya: A case of Kirinyaga county. Int. J. Adv. Res. Manag. Soc. Sci. 2017, 6, 62–89. [Google Scholar]
- GIZ. Photovoltaics for Productive Use Applications; GIZ: Eschborn, Germany, 2016. [Google Scholar]
- Chakravorty, U.; Emerick, K.; Ravago, M.-L. Lighting up the Last Mile: The Benefits and Costs of Extending Electricity to the Rural Poor. Available online: http://0-dx-doi-org.brum.beds.ac.uk/10.2139/ssrn.2851907 (accessed on 10 April 2020).
- Pode, R.; Pode, G.; Diouf, B. Solution to sustainable rural electrification in Myanmar. Renew. Sustain. Energy Rev. 2016, 59, 107–118. [Google Scholar] [CrossRef]
- Yadoo, A.; Cruickshank, H. The value of cooperatives in rural electrification. Energy Policy 2010, 38, 2941–2947. [Google Scholar] [CrossRef]
- Bijaoui, I. Generators of People’s Economy. In Multinational Interest & Development in Africa: Establishing A People’s Economy; Bijaoui, I., Ed.; Springer International Publishing: Cham, Switzerland, 2017; pp. 101–177. [Google Scholar] [CrossRef]
- Contejean, A.; Verin, L. Making Mini-Grids Work—Productive Uses of Electricity in Tanzania; IIED Working Paper; IIED: London, UK, 2017; Available online: https://pubs.iied.org/pdfs/16632IIED.pdf (accessed on 2 February 2020).
- Caselli, G.; Vallin, J.; Wunsch, G. Demography: Analysis and Synthesis, Four Volume Set: A Treatise in Population; Elsevier Science; Academic Press: Cambridge, MA, USA, 2005. [Google Scholar]
- Batirbaev, P.; Kim, T.; Ma’ani, R.; Shim, R.; Singer, J.; Snyder, M.; Yawson, F. Maize in Rwanda: A Value Chain Analysis; UNIDO: 2013. Available online: https://open.unido.org/api/documents/5328232/download/Maize%20in%20Rwanda%20-%20A%20Value%20Chain%20Analysis (accessed on 2 February 2020).
- Daly, J.; Hamrick, D.; Gereffi, G.; Guinn, A. Maize Value Chains in East Africa; Center on Globalization, Governance & Competitiveness; Duke University: Durham, NC, USA, 2016. [Google Scholar]
- Kornher, L. Maize markets in Eastern and Southern Africa (ESA) in the Context of Climate Change—Background Paper for The State of Agricultural Commodity Markets (SOCO) 2018; FAO: Rome, Italy, 2018; Available online: http://www.fao.org/3/CA2155EN/ca2155en.pdf (accessed on 2 February 2020).
- Blodgett, C.; Dauenhauer, P.; Louie, H.; Kickham, L. Accuracy of energy-use surveys in predicting rural mini-grid user consumption. Energy Sustain. Dev. 2017, 41, 88–105. [Google Scholar] [CrossRef] [Green Version]
- Hartvigsson, E.; Ahlgren, E.O. Comparison of load profiles in a mini-grid: Assessment of performance metrics using measured and interview-based data. Energy Sustain. Dev. 2018, 43, 186–195. [Google Scholar] [CrossRef]
- CLASP. Global LEAP Awards. Available online: https://globalleapawards.org/tvs (accessed on 3 February 2020).
- Laender, D. Powering Health: Electrification Options for Rural Health Centers; USAID: Washington, DC, USA, 2018. Available online: http://www.poweringhealth.org/Pubs/PNADJ557.pdf (accessed on 2 February 2020).
- IRENA. Renewable Energy Benefits: Decentralised Solutions in the Agri-Food Chain; IRENA: Abu Dhabi, UAE, 2016. [Google Scholar]
- USAID. Rwanda Power Africa Factsheet; USAID: Washington, DC, USA, 2018. Available online: https://www.usaid.gov/sites/default/files/documents/1860/Rwanda_-_November_2018_Country_Fact_Sheet.pdf (accessed on 2 February 2020).
- Steerneman, M. Energy efficiency: How to save energy in a mill today? In Proceedings of the European Flour Millers’ Conference 2013, Brussels, Belgium, 16 May 2013. [Google Scholar]
- UNFCCC. Standardized Baseline: Rwanda Grid Emission Factor; UNFCCC: Bonn, Germany, 2015; Available online: https://cdm.unfccc.int/sunsetcms/storage/contents/stored-file-20161025142637883/ASB0017.pdf (accessed on 2 February 2020).
- United States Environmental Protection Agency. Greenhouse Gas Emissions from a Typical Passenger Vehicle; United States Environmental Protection Agency: Washington, DC, USA, 2018. Available online: https://nepis.epa.gov/Exe/ZyPDF.cgi?Dockey=P100U8YT.pdf (accessed on 2 February 2020).
- Trócaire. Analysis of National and Regional Agricultural Trade in Maize, Soybeans Andwheat: A Focus on Rwanda; Trócaire: Kildare, Ireland, 2014; Available online: https://www.trocaire.org/sites/default/files/resources/policy/a-focus-on-rwanda.pdf (accessed on 2 February 2020).
- Yang, F.; Yang, M. Rural electrification in sub-Saharan Africa with innovative energy policy and new financing models. Mitig. Adapt. Strateg. Glob. Chang. 2018, 23, 933–952. [Google Scholar] [CrossRef]
- IEG—World Bank Group. Reliable and Affordable Off-Grid Electricity Services for the Poor: Lessons from World Bank Group Experience; World Bank Group: Washington, DC, USA, 2016; Available online: http://documents.worldbank.org/curated/en/360381478616068138/pdf/109573-WP-PUBLIC.pdf (accessed on 2 February 2020).
- ACP-EU Energy Facility. Thematic Fiche No. 7 “Sustainability—Business Models for Rural Electrification”; ACP-EU Energy Facility: Brussels, Belgium, 2012; Available online: https://europa.eu/capacity4dev/file/10582/download?token=yK25eQn9 (accessed on 2 February 2020).
- Martinez, N.; Oliver, P.; Trowbridge, A. Cost-Benefit Analysis of Off-Grid Solar Investments in East Africa; USAID: Washington, DC, USA, 2017. Available online: https://www.usaid.gov/sites/default/files/documents/1865/Cost-Benefit-Analysis-Off-Grid-Solar-Investments-East-Africa.pdf (accessed on 2 February 2020).
- Butare, A.; Kyriakarakos, G. Guidelines for Institutional and Policy Model for Micro-/Mini-Grids; African Union Commission: Addis Ababa, Ethiopia, 2018. [Google Scholar]
- Madriz-Vargas, R.; Bruce, A.; Watt, M. A Review of Factors Influencing the Success of Community Renewable Energy Minigrids in Developing Countries. In Proceedings of the 2015 Asia-Pacific Solar Research Conference, Brisbane, Australia, 8–9 December 2015. [Google Scholar]
- AFD. Digital Energy Facility for the Promotion of Energy Transition and Energy Access; AFD: Paris, France, 2019; Available online: https://europa.eu/capacity4dev/file/89985/download?token=r0boUBTB (accessed on 2 February 2020).
- International Co-operative Allianc. What is a Cooperative? Available online: https://www.ica.coop/en/cooperatives/what-is-a-cooperative (accessed on 27 March 2020).
- Boadu, F.O. Chapter 8—Cooperatives in Sub-Saharan Africa. In Agricultural Law and Economics in Sub-Saharan Africa; Boadu, F.O., Ed.; Academic Press: San Diego, CA, USA, 2016; pp. 263–281. [Google Scholar] [CrossRef]
- Moyo, S. Family Farming in Sub-Saharan Africa: Its Contribution to Agriculture, Food Security and Rural Development; FAO, 2016; Available online: http://www.fao.org/3/a-i6056e.pdf (accessed on 2 February 2020).
- Burney, J.A.; Naylor, R.L. Smallholder Irrigation as a Poverty Alleviation Tool in Sub-Saharan Africa. World Dev. 2012, 40, 110–123. [Google Scholar] [CrossRef]
- Ohimain, E.; Izah, S.; Dorcas, A.; Cletus, I. Small-Scale Palm Oil Processing Business in Nigeria; A Feasibility Study. Greener J. Bus. Manag. Stud. 2014, 4, 070–082. [Google Scholar] [CrossRef] [Green Version]
- Briganti, M.; Vallve, X.; Alves, L.; Pujol, D.; Cabral, J.; Lopes, C. Implementation of a PV Rural Micro Grid in the Island of Santo Antão (Cape Verde) with an Individual Energy Allowance Scheme for Demand Control. In Proceedings of the 27th European Photovoltaic Solar Energy Conference and Exhibition, Frankfurt, Germany, 24–28 September 2012. [Google Scholar] [CrossRef]
- Itodo, I.N.; Aju, A.S.E. Design of a Solar Photovoltaic System to Power a Rice Threshing Machine. Niger. J. Sol. Energy 2015, 26, 109–116. Available online: http://sesn-ng.com/journal_view.php?id=156 (accessed on 27 March 2020).
Figure 1.
Maize value chain map in Rwanda.

Figure 2.
Load profiles.

Figure 3.
Microgrid topology.

Figure 4.
Step 1 cumulative served, unmet, and excess load.

Figure 5.
Hourly power figures of two typical days for Step 1.

Figure 6.
Step 2 cumulative served, unmet, excess, and deferrable load.

Figure 7.
Hourly power figures of two typical days for Step 2.

Figure 8.
Step 3 cumulative served, unmet, and excess load.

Figure 9.
Step 3 cumulative agricultural, households served, unmet, and excess load.


Table 1.
Access Tier attributes.
| Attributes | Tier 0 | Tier 1 | Tier 2 | Tier 3 | Tier 4 | Tier 5 |
|---|---|---|---|---|---|---|
| Peak available capacity (W) | - | >3 | >50 | >200 | >800 | >2000 |
| Duration (h) | - | ≥4 | ≥4 | ≥8 | ≥16 | ≥23 |
| Evening supply (h) | - | ≥1 | ≥2 | ≥3 | ≥4 | ≥4 |
| Reliability | - | - | - | - | Max 14 disruptions per week | Max 3 disruptions per week of total duration <2 h |
| Quality | - | - | - | - | Voltage problems do not affect the use of desired appliances | |
| Affordability | - | - | - | Cost of a standard consumption package of 365 kWh y−1 <5% of the household income | ||
| Legality | - | - | - | - | Bill paid to the utility, pre-paid card seller, or authorized representative | |
| Health and Safety | - | - | - | - | Absence of past accidents and perception of high risk in the future | |
Source: Bhatia M., Angelou N., “Beyond Connections—Energy Access Redefined”, 2015, ESMAP, World Bank.
Table 2.
Services provided in each Tier.
| Tier 0 | Tier 1 | Tier 2 | Tier 3 | Tier 4 | Tier 5 |
|---|---|---|---|---|---|
| - | Task lighting AND Phone charging | General Lighting AND Phone charging AND Television AND Fan (if needed) | Tier 2 AND Any medium-power appliances | Tier 3 AND Any high-power appliances | Tier 2 AND Any very high-power appliances |
Source: Bhatia M., Angelou N., “Beyond Connections—Energy Access Redefined”, 2015, ESMAP, World Bank.
Table 3.
Summary of findings of Benchmarking microgrids in Sub-Saharan Africa.
| Indicator | Value |
|---|---|
| Monthly Average Revenue per user | 7 USD |
| Average Investment per user | 920 USD |
| Tier 2 Average Residential Consumption | 11 kWh m−1 |
| Average Generation Capacity | 34 kW |
| Average Number of Connections | ~100 |
| A/C vs. D/C | 85% vs. 15% |
| Operational Expenditure (OPEX) as a % of revenue | 58% |
| Capital Expenditure (CAPEX) payback period | >7 years |
| Split of CAPEX spending on distribution vs. generation | 50% vs. 50% |
| Average Distance from National Grid | 23 km |
Source: International Finance Corporation World Bank Group (WBG). Benchmarking Mini-grid Distribution Companies (DESCOs) 2017 update–Summary of Findings. (2018).
Table 4.
Maize yield in Rwanda for the past decade.
| Year | Cultivated Area (ha) | Production (t) | Yield (t ha−1) |
|---|---|---|---|
| 2008 | 144,896 | 166,853 | 1.15 |
| 2009 | 147,129 | 286,946 | 1.95 |
| 2010 | 184,658 | 432,404 | 2.34 |
| 2011 | 223,414 | 525,679 | 2.35 |
| 2012 | 253,698 | 573,038 | 2.26 |
| 2013 | 292,326 | 667,833 | 2.28 |
| 2014 | 233,150 | 583,096 | 2.50 |
| 2015 | 241,713 | 370,140 | 1.53 |
| 2016 | 237,658 | 374,267 | 1.57 |
| 2017 | 297,447 | 358,417 | 1.20 |
| Average | 225,609 | 433,867 | 1.92 |
Source: FAO/FAOSTAT.
Table 5.
Key consumption data.
| Parameter | Value | Notes |
|---|---|---|
| Lighting | 2 W | Three LED lamps were considered for each household |
| Cell phone charging | 5 W | Typical USB charger |
| Television | 15 W | In line with the consumption of 19–22 inch TVs that won the Global LEAP awards [45] |
| Radio | 2 W | Typical energy efficient radio |
| Min Power | 0 W | For 100 households |
| Max Power | 2100 W | |
| Average Power | 291.67 W | |
| Energy per day | 7000 Wh |
Table 6.
Cost data.
| Cost Category | Cost |
|---|---|
| Photovoltaic panels, including inverter cost for AC microgrid topology. | 0.750 € Wp−1 |
| Grid forming inverter cost | 3500 € |
| Transportation and installation cost | 5000 € |
| AC and DC equipment including cabling, equipment, appliances, consumables etc. | 8000 € |
| Supplementary costs (e.g., fencing) | 2000 € |
| Smart meters/monitoring system | 5000 € |
| LiFePO4 batteries | 600 € kWh |
| Operation and Maintenance cost | 1% of Capital Expenditure (CAPEX) [46] |
| Grid infrastructure cost | 10,000 € |
Table 7.
Household electrification results.
| Case No | Annual Capacity Shortage Allowed | PV (kWp) | Batteries (kWh) | CAPEX (€) | OPEX (€) | Net Present Cost (€) | Levelized Cost of Electricity (€ kWh−1) | Unmet Load | Excess Electricity | ||
|---|---|---|---|---|---|---|---|---|---|---|---|
| kWh∙y−1 | % | kWh∙y−1 | % | ||||||||
| 1.1 | 0% | 3.75 | 7.68 | 40,921 | 449 | 43,335 | 3.164 | 1.8 | 0.1 | 2670 | 48.2 |
| 1.2 | 5% | 2.75 | 5.12 | 38,635 | 440 | 41,000 | 3.131 | 113 | 4.5 | 1321 | 32.5 |
| 1.3 | 10% | 2.25 | 5.12 | 38,260 | 433 | 40,587 | 3.196 | 187 | 7.3 | 664 | 20 |
| 1.4 | 20% | 3 | 2.56 | 37,286 | 441 | 39,659 | 3.526 | 457 | 17.9 | 2093 | 47.3 |
| 1.5 | 30% | 1.75 | 2.56 | 36,349 | 421 | 38,611 | 3.862 | 689 | 27 | 504 | 19.5 |
Table 8.
Household electrification with deferrable load results.
| Case No | Annual Capacity Shortage Allowed | PV (kWp) | Batteries (kWh) | CAPEX (€) | OPEX (€) | Net Present Cost (€) | Levelized Cost of Electricity (€ kWh−1) | Unmet Load | Excess Electricity | ||
|---|---|---|---|---|---|---|---|---|---|---|---|
| kWh∙y−1 | % | kWh∙y−1 | % | ||||||||
| 2.1 | 0% | 5 | 7.68 | 41,858 | 458 | 44,320 | 1.811 | 3.7 | 0.1 | 2518 | 34.1 |
| 2.2 | 5% | 3.25 | 5.12 | 39,010 | 439 | 41,369 | 1.809 | 156 | 3.54 | 254 | 5.29 |
| 2.3 | 10% | 4 | 2.56 | 38,036 | 450 | 40,454 | 1.824 | 416 | 9.2 | 1536 | 26 |
| 2.4 | 20% | 2.25 | 2.56 | 36,724 | 421 | 38,986 | 2.377 | 683 | 18.3 | 61.1 | 1.8 |
| 2.5 | 30% | 1.75 | 2.56 | 36,349 | 413 | 38,571 | 3.087 | 778 | 25.1 | 56.9 | 2.2 |
Table 9.
Results of the Mill system.
| PV (kWp) | Batteries (kWh) | CAPEX (€) | OPEX (€) | Net Present Cost (€) | Levelized Cost of Electricity (€ kWh−1) | Unmet Load | Excess Electricity | ||
|---|---|---|---|---|---|---|---|---|---|
| kWh y−1 | % | kWh y−1 | % | ||||||
| 6.5 | 10.24 | 44,519 | 490 | 47,153 | 1.821 | 3.15 | ~0 | 4610 | 48 |
Table 10.
Results of the Mill system also serving households.
| PV (kWp) | Batteries (kWh) | CAPEX (€) | OPEX (€) | Net Present Cost (€) | Levelized Cost of Electricity (€ kWh−1) | Unmet load | Excess Electricity | ||
|---|---|---|---|---|---|---|---|---|---|
| kWh y−1 | % | kWh y−1 | % | ||||||
| 6.5 | 10.24 | 54,519 | 600 | 54,519 | 1.555 | 462 | 6.3 | 2247 | 23.4 |
© 2020 by the authors. Licensee MDPI, Basel, Switzerland. This article is an open access article distributed under the terms and conditions of the Creative Commons Attribution (CC BY) license (http://creativecommons.org/licenses/by/4.0/).
Share and Cite
MDPI and ACS Style
Kyriakarakos, G.; Balafoutis, A.T.; Bochtis, D. Proposing a Paradigm Shift in Rural Electrification Investments in Sub-Saharan Africa through Agriculture. Sustainability 2020, 12, 3096. https://0-doi-org.brum.beds.ac.uk/10.3390/su12083096
AMA Style
Kyriakarakos G, Balafoutis AT, Bochtis D. Proposing a Paradigm Shift in Rural Electrification Investments in Sub-Saharan Africa through Agriculture. Sustainability. 2020; 12(8):3096. https://0-doi-org.brum.beds.ac.uk/10.3390/su12083096
Chicago/Turabian StyleKyriakarakos, George, Athanasios T. Balafoutis, and Dionysis Bochtis. 2020. "Proposing a Paradigm Shift in Rural Electrification Investments in Sub-Saharan Africa through Agriculture" Sustainability 12, no. 8: 3096. https://0-doi-org.brum.beds.ac.uk/10.3390/su12083096
Note that from the first issue of 2016, this journal uses article numbers instead of page numbers. See further details here.