Prediction the Contribution Rate of Long-Term Care Insurance for the Aged in China Based on the Balance of Supply and Demand


1
State Key Laboratory of Molecular Vaccinology and Molecular Diagnostics, School of Public Health, Xiamen University, Xiamen 361102, China
2
Key Laboratory of Health Technology Assessment of Fujian Province University, School of Public Health, Xiamen University, Xiamen 361102, China
3
School of Economics, Xiamen University, 422 Siming South Road, Xiamen 361005, China
*
Author to whom correspondence should be addressed.
Sustainability 2020, 12(8), 3144; https://0-doi-org.brum.beds.ac.uk/10.3390/su12083144
Submission received: 28 February 2020
/
Revised: 31 March 2020
/
Accepted: 13 April 2020
/
Published: 14 April 2020
(This article belongs to the Special Issue Sustainability of Fiscal Policy)
Abstract
:There are a large number of disabled elderly people in China, which results in huge care and financial burdens to their families and society. However, China has not yet launched a unified long-term care insurance (LTCI) system. This study aims to predict the contribution rate of LTCI in China from 2020 to 2050 based on the long-term care (LTC) cost of the disabled elderly, aged 65 and over, in order to provide strong evidence for the establishment of a unified and sustainable national LTCI system in China. The simulations are based on data from the population census data, the Chinese statistical yearbook, and the Chinese Longitudinal Healthy Longevity Survey (CLHLS) database. Based on the International Labor Organization (ILO) financing model from the perspective of fund balance, an overall simulation model and a Monte Carlo simulation are used to estimate the contribution rate of LTCI for disabled elderly from 2020 to 2050 in China. The total financial demands will increase sharply from 538.0 billion yuan in 2020 to 8530.8 billion yuan in 2050. Of that total, 80.2% will be required in urban areas. In addition, the per capita financial demands of care in urban and rural areas in 2050 will be approximately six times and 11 times higher than in 2020, respectively. The predicted results show that the overall contribution rate of LTCI in China will increase sharply from 1.46% in 2020 to 5.14% in 2050, an increase of about 3.5 times. By comparison, the contribution rate in 2020 will be close to 1.33% in Japan in 2015 and 1.40% in Germany in 2010. According to the 1:1 payment proportion between employer and employee, each side bears 0.68% of the insurance premium. From 2020 to 2050, the financial demands of long-term care for disabled elderly in China will increase, especially in urban areas, and the burden of per capita financial demands in rural areas will increase significantly. The overall contribution rate of LTCI will increase linearly and the payment burden of policyholders will increase year by year. This study provides evidence of the need for the establishment of a sustainable financing mechanism for multiple financial supplies.
1. Introduction
The aging population provides a challenge to countries in terms of meeting the needs of the aging population and by creating a policy environment [1], especially in China. China’s aging population exhibits three key features: “aging before wealthy” (aging degree exceeds the carrying capacity of the current economic development), aging fast and large rural-urban differences, and the aging population increasing the proportion of the elderly population [2]. At the end of 2018, the number of disabled elderly aged 60 and over had risen to 249 million, according to the National Bureau of Statistics of China [3]. The number of disabled elderlies exceeded 44 million, accounting for 19.1% of the total elderly population [4]. Previous research has shown that more than 60% of the elderly’s long-term care (LTC) was mainly provided by their families, while the proportion of disabled elderly will be more than 80% [5]. This illustrates that the elderly’s ability to resist financial risks in China is extremely limited, and the LTC of the disabled elderly places economic and care burden on individuals and their families.
1.1. LTCI in China
The experience and practice in various countries have proven that long-term care insurance (LTCI) is one of the most effective policy tools to deal with the care risks of disabled elderly [6,7]. Against the background of a population with a rapidly increasing percentage of those with disabilities, rising medical costs, and weakening family functions, it is critical to establish an LTCI system that suits China’s national conditions [8,9]. Therefore, the National Health and Family Planning Commission and other ministries and departments jointly issued the 13th Healthy Aging Five-Year Plan (2016–2020), which advances improving health services for the elderly, strengthens the medical security system, and increases the health level of the elderly [10]. In 2016, the Chinese government published the “Guidance on Pilot Cities to Launch Long-Term Care Insurance” [11]. The LTCI scheme has been piloted in 15 cities, covering more than 57 million people and benefiting 184,500 people at the end of June 2018 [12,13]. It aims to establish and improve the policy framework of social LTCI system until 2020 in China [14]. Although the implementation of LTCI has a good policy basis, due to the differences in the level of economic development, the degree of aging of the population, and the supply of care services, China has not yet formed a unified national LTCI system [15].
1.2. Previous Research
The development of LTCI in foreign countries is earlier than that in China, and foreign scholars focus on analyzing LTCI from a quantitative perspective. With the acceleration of the global aging process, foreign scholars have begun to pay closer attention to how to design sustainable financing policies for LTCI as the level of payment directly affects the sustainability of the system. Therefore, foreign studies on commercial LTCI contribution rates are relatively early. In 1930, James D. Craig used Manchester Unity Approach to calculate and evaluate the contribution rate of disability insurance [16]. Steven Haberman used the Decrement tables to predict the contribution rate of health insurance in his research report [17]. Jim Robinson was likely the first researcher to use Markov model to predict the contribution rate of LTCI [18].
At present, some domestic scholars focus on analyzing and summarizing the LTCI financing in OECD countries and domestic pilot cities, qualitatively discussing the ways of funding for LTCI and have proposed related policies [19]. Scholars believe that there are four types of LTCI in foreign countries: subsidy model (e.g., Britain, Sweden, and Austria), social insurance model (e.g., Germany, Japan, and Korea), commercial insurance model (e.g., the United States), and mixed model (e.g., France) [20]. At the same time, based on the analysis of the financing mechanism of domestic pilot cities, scholars basically reached an agreement that China should eventually establish a social LTCI system [19]. The quantitative research of LTCI in China is still in the primary stage. The research content mainly includes the demand analysis and contribution rate of LTCI. A number of studies used microdata combined with health status transfer and multi-state life table to predict the care needs [21,22]. The results show that the demand for LTC will increase rapidly in the future. In order to analyze the contribute rate of LTCI, some scholars introduced foreign methods to simulate the contribution rate of LTCI in China. A number of previous studies used Manchester Unity Approach, Decrement tables, and multi-state Markov model to calculate the contribution rate of LTCI [23,24]. Other studies used life insurance actuarial techniques to build a balanced rate of vertical model. The results show that in the economically developed areas, LTCI system is financially viable [25].
In general, the research abroad in similar studies has an early start in which theoretical research and empirical studies have achieved fruitful results. At the same time, scholars believe that China has a large potential demand for LTCI for disabled elderly [26,27], and it is urgent to establish an LTCI system to resolve the financial risks caused by disability. Besides, one of the biggest challenges for China’s LTCI development is raising sufficient funds [28,29]. The reason why China has not yet established a unified LTCI system is the lack of funds and the unclear financing mechanism [30], and the ability of payment by policyholders directly affects the feasibility of the system. Therefore, this study aims to predict the financial demands of disabled elderly in China from 2020 to 2050, estimate the contribution rate of LTCI based on the balance of supply and demand, and clarify the key links of the LTCI financing mechanism to provide evidence for building a unified and sustainable LTCI system.
2. Materials and Methods
2.1. Data Sources
Data for this study are taken from the World Population Prospects of the United Nations, the National Bureau of Statistics of China, Taiwan Ministry of Health and Welfare, and published research literature. (Table 1).
2.2. Key Assumptions
The key assumptions of this study are as follows: (a) The LTCI system is assumed to adopt a pay-as-you-go scheme and annual funding should meet current needs. We only measure the financial balance between the policyholder and the insured. (b) China adopts a compulsory public LTCI system, in which all urban and rural employees aged 18–64 pay premiums at the prescribed rates. Disabled elderly aged 65 and above are eligible to be insured for LTCI. (c) Funds for LTCI mainly come from premium payments, without taking into account government financial subsidies and the investment and operation income of insurance institutions. (d) Chinese total fertility rate (TFR) is between 1.6 and 1.8, calculated based on authoritative Chinese census data for 2010 and the United Nations Population Division’s plan for China’s fertility model for 2050. e) Referring to previous research literature [23], we assume that the growth rate of the income level of urban workers is synchronized with the GDP growth rate in China and that the average GDP growth rates are 6% in 2020–2030, 5% in 2031–2040, and 4% in 2041–2050. The annual growth rate of rural residents’ per capita income will be maintained at 7%.
2.3. Prediction Model
At present, scholars usually used the Manchester Unity Approach, Decrement tables, and multi-state Markov model to estimate insurance pricing [37,38]. Among them, the Decrement tables and multi-state Markov model require a large amount of basic research data and long-term follow-up survey samples, which are not easy to acquire. Compared with them, the Manchester Unity Approach uses a large sample survey to obtain the disability rate and the average care time of the elderly to estimate the care cost for the disabled and uses it as a basis for insurance pricing. This method has high feasibility and scientificity and is widely used. The parameters used to estimate the costs incurred by disability for social security benefits were assumed to be subject to some degree of uncertainty. For this reason, a Monte Carlo simulation was performed. It consists in a simultaneous variation of the parameters used in the model according to a probability distribution. This simulation generated a series of observations of the phenomenon under examination in order to evaluate the range of variation. At the same time, in the existing research [39], Monte Carlo simulation was used to predict the number of claim persons who could require insurance services according to the severity level in the future, and provided a realistic framework for the future development of LTCI in Germany. This method can simplify the study problems in essence and consider all realistic developments of the problems by simulation. Therefore, this study combines the Manchester Unity Approach with the International Labor Organization (ILO) financing model. The overall simulation model and Monte Carlo simulation are used to calculate the contribution rate of LTCI for disabled elderly from 2020 to 2050 in China.
The funds for LTCI are mainly composed of premium payments, government financial subsidies, and the investment and operation income of insurance institutions. Among them, premium payments are the main part, which is determined by the number of insurance payers, income level, and the contribution rate of insurance. The fund prediction model (Equation (1)) of this study is as follows:
In Equation (1), refers to the total funds for LTCI; refers to the number of type k insurance payers in year t; refers to the average wage level of type k population in year t;(t) refers to the contribution rate of insurance for type k population in year t; refers to the growth rate of wages of employees in year t;(t) refers to the total premium payments for the year t; refers to the government financial subsidies; and refers to the investment and operation income of insurance institutions.
In this study, an overall simulation model and a Monte Carlo simulation are used to predict the total the financial demands of LTC in the future. The specific overall simulation model of LTCL financial demands is shown in Equation (2):
In Equation (2), refers to the total the financial demands of LTCI for t years; refers to the number of elderly people in t years, refers to the proportion of elderly with care level i for the elderly in t years; refers to the utilization ratio of type j care type for the elderly with care level i in t years, refers to the costs of using type j care for the elderly with care level i in t years, and refers to the growth rate of type j care costs in t years. Also, refers to the costs of care for the disabled elderly in t years.
We assume that the government financial subsidies, fixed expenses, and other expenses are not considered in this study. Based on the balance of supply and demand, we calculated the contribution rate of LTCI in China. Combining the financial demands model (Equation (2)) and fund prediction model (Equation (1)) of the LTCI, the prediction model of the contribution rate is as follows:
2.4. Statistical Analysis
The Monte Carlo simulation, also known as statistical simulation method or random sampling technology, is based on the random number and probability statistics theory. It is also a numerical calculation type that has been widely used. Complex objects can be transformed into simulation calculations of random numbers and digital characteristics, which essentially simplifies study problems and obtains solutions with good properties [40]. In view of the prediction model of LTCI contribution rate involving complex variables, we use a Monte Carlo simulation to predict the macro and micro variables in the overall simulation model in this study. According to previous researches, the number of simulations is set to 4000 times [41]. We applied this method to obtain the confidence intervals and more robust estimates of the current result.
3. Results
3.1. Projection of Financial Demands for LTC in Urban and Rural Areas
The predicted results show that the total financial demands of LTC will increase sharply especially from 2030 to 2050 (Table 2). The total financial demands will increase from 538.0 billion yuan in 2020 to 8530.8 billion yuan in 2050, an increase of about 15.9 times. Among them, the total financial demands and growth rate of LTC in urban areas are higher than those in rural areas. They will increase from 427.7 billion yuan in 2020 to 6843.7 billion yuan in 2050, an increase of about 16 times. Besides, the per capita cost of care in urban and rural areas in 2050 will be approximately six times and 11 times higher, respectively, than in 2020. The results show that the financial demands of LTC for disabled elderly in urban and rural areas will increase, especially in urban areas, and the burden of per capita financial demands in rural areas will increase.
3.2. Projection of Employment-Population from 2020 to 2050
Table 3 shows the total labor supply and demand population in China from 2020 to 2050. According to the table, the mean of the total labor supply is lower than that of the total demand from 2020 to 2050. Therefore, this study takes the total labor supply from 2020 to 2050 as the number of employed population members in the future.
We assume that the ratio of the total employed population in the urban and rural is equal to the ratio of the population’s labor force aged 16 to 65 years old in the urban and rural areas. Based on this, the distribution of the population’s labor force in urban and rural areas from 2020 to 2050 can be calculated as shown in Table 4.
3.3. Average Wages Level of Urban and Rural Employment-Population from 2020 to 2050
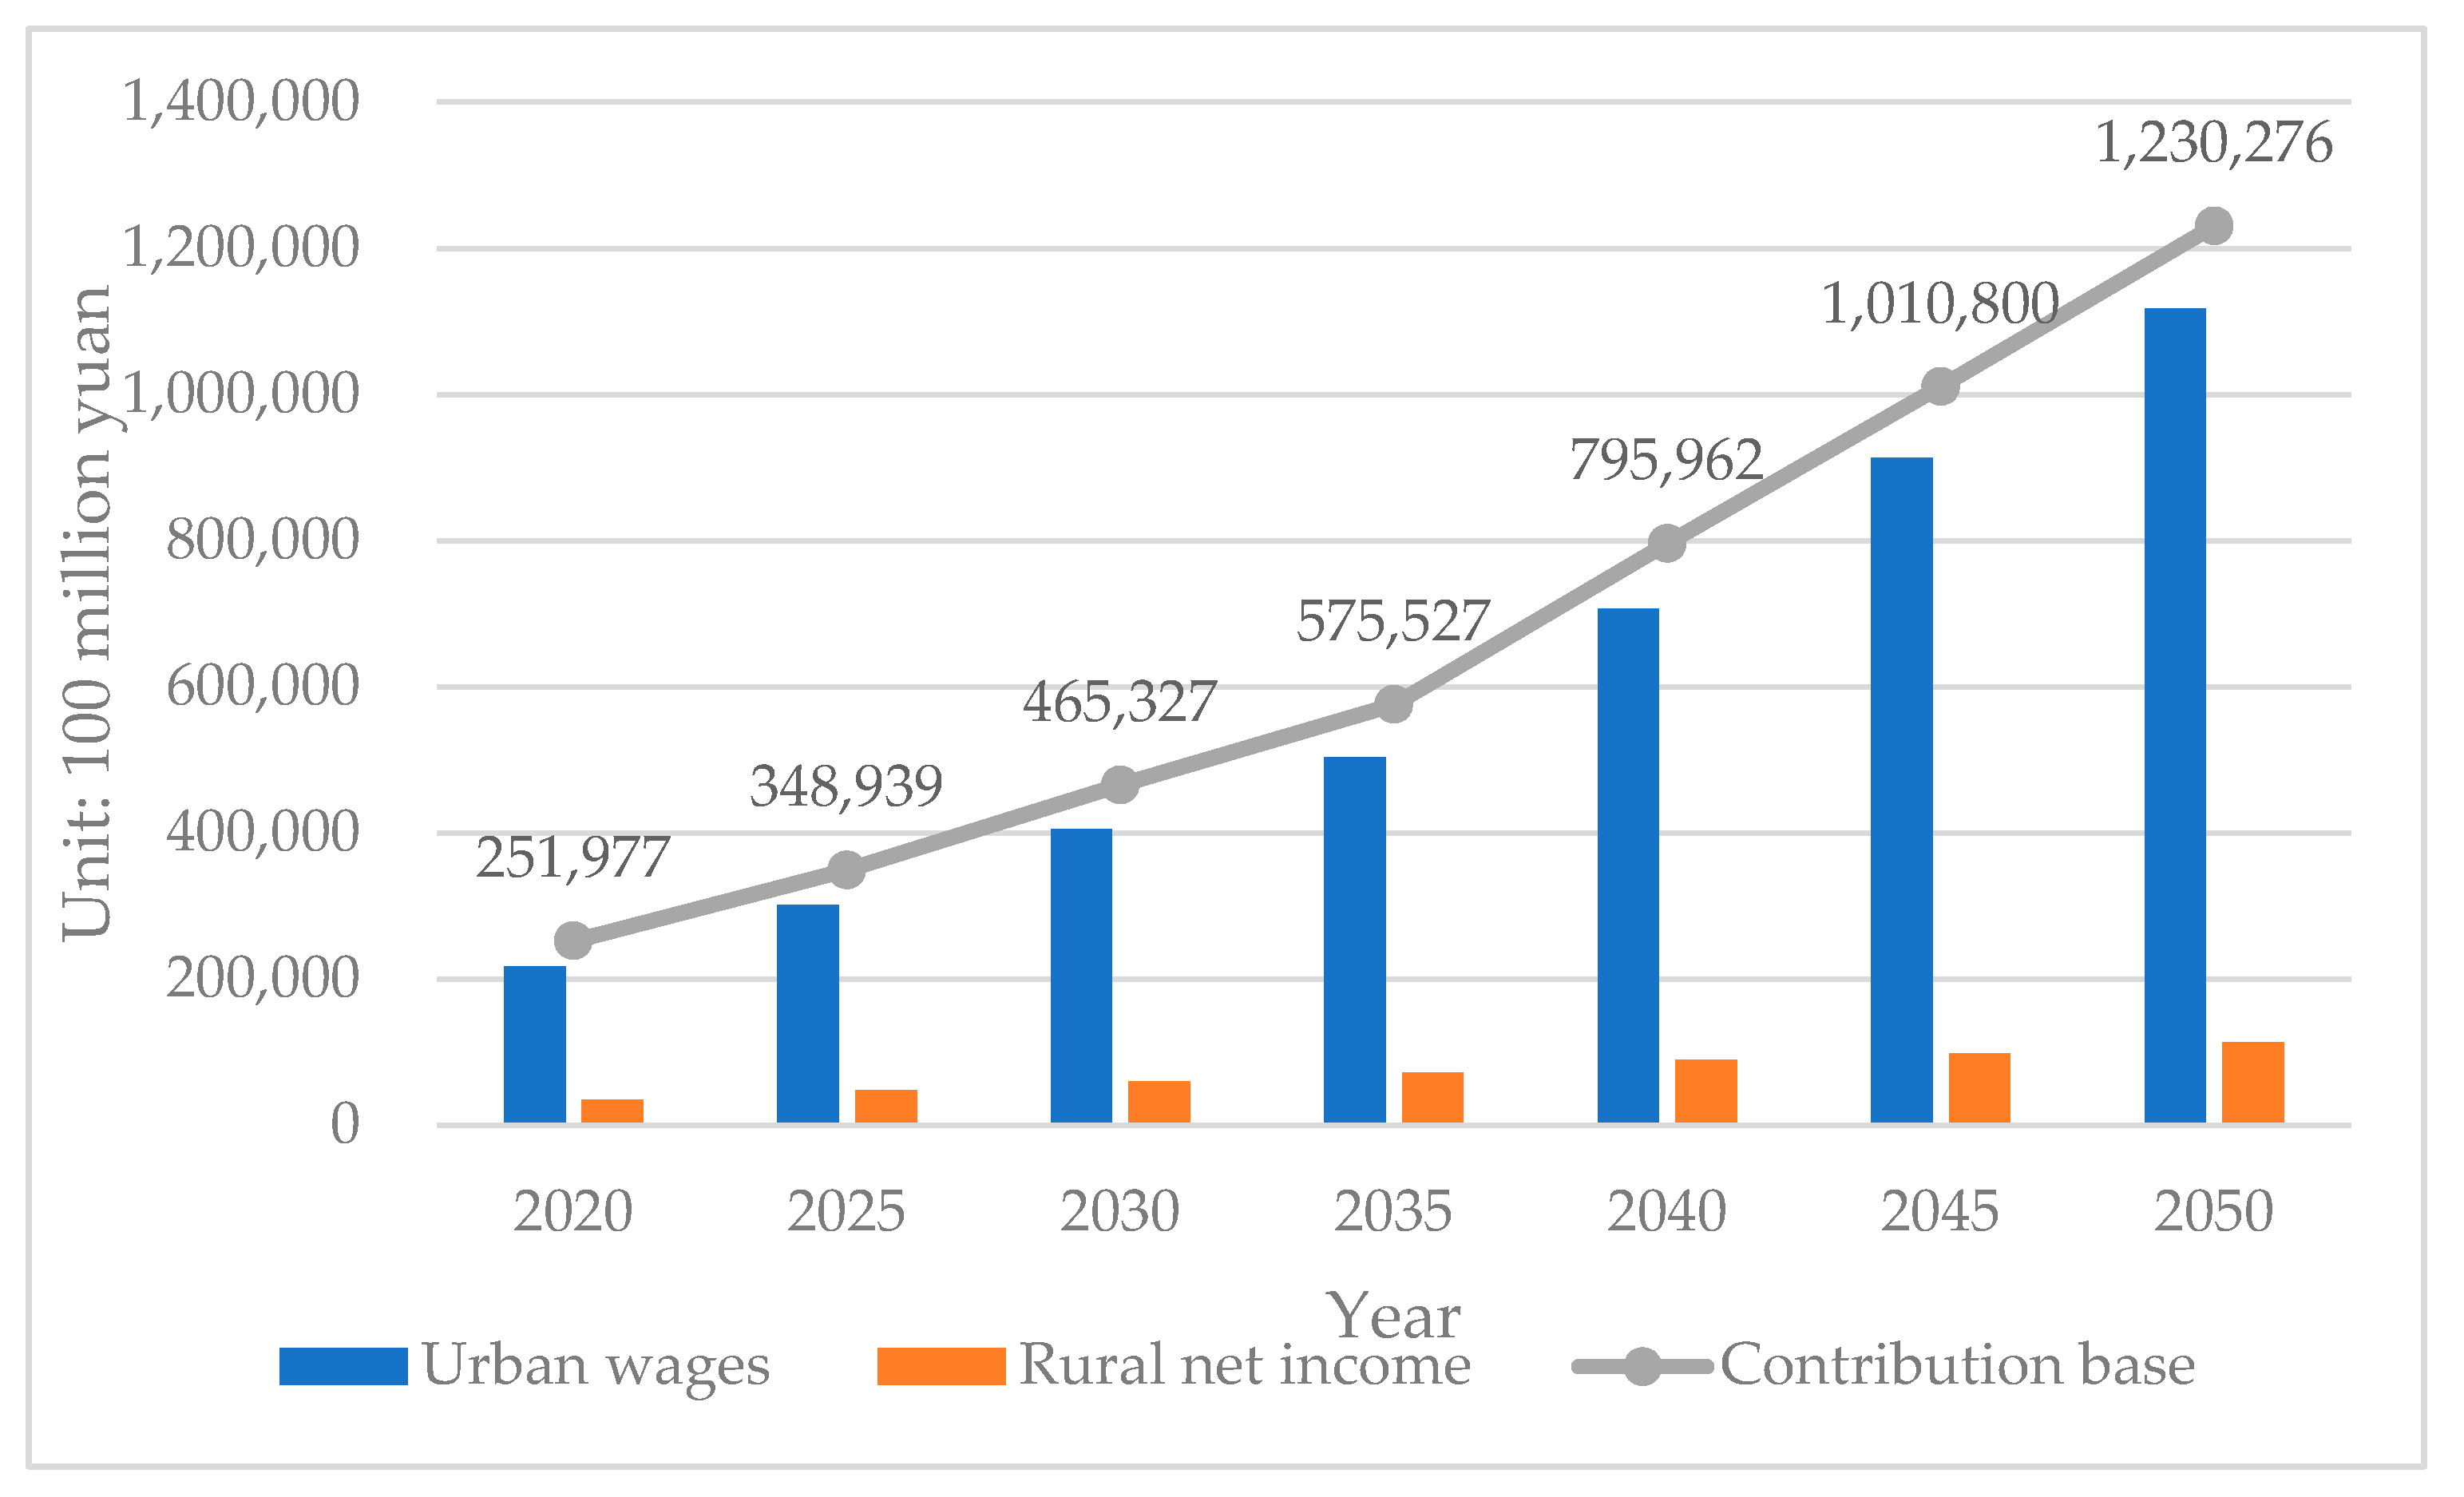
According to the National Bureau of Statistics of China in 2015, the per capita wage of urban residents in 2014 was 17936.8 yuan, and the urban population and urban employment-population were 749.16 million and 393.1 million, respectively [42]. Therefore, we estimate that the average monthly wage of the urban employment-population in 2014 was approximately 2849 yuan and the average monthly net income of rural residents in 2014 was 824 yuan [35]. Multiplying the average monthly wage by the number of employment-population, we can then get the total wages of the employment-population in the future, which is the contribution base of the LTCI (Table 5). The results show that the contribution base of LTCI will increase from 2020 to 2050 (Figure 1), and the total wages of the employment-population in 2050 will be 4.88 times higher than in 2020.
3.4. Prediction the Contribution Rate of LTCI from 2020 to 2050
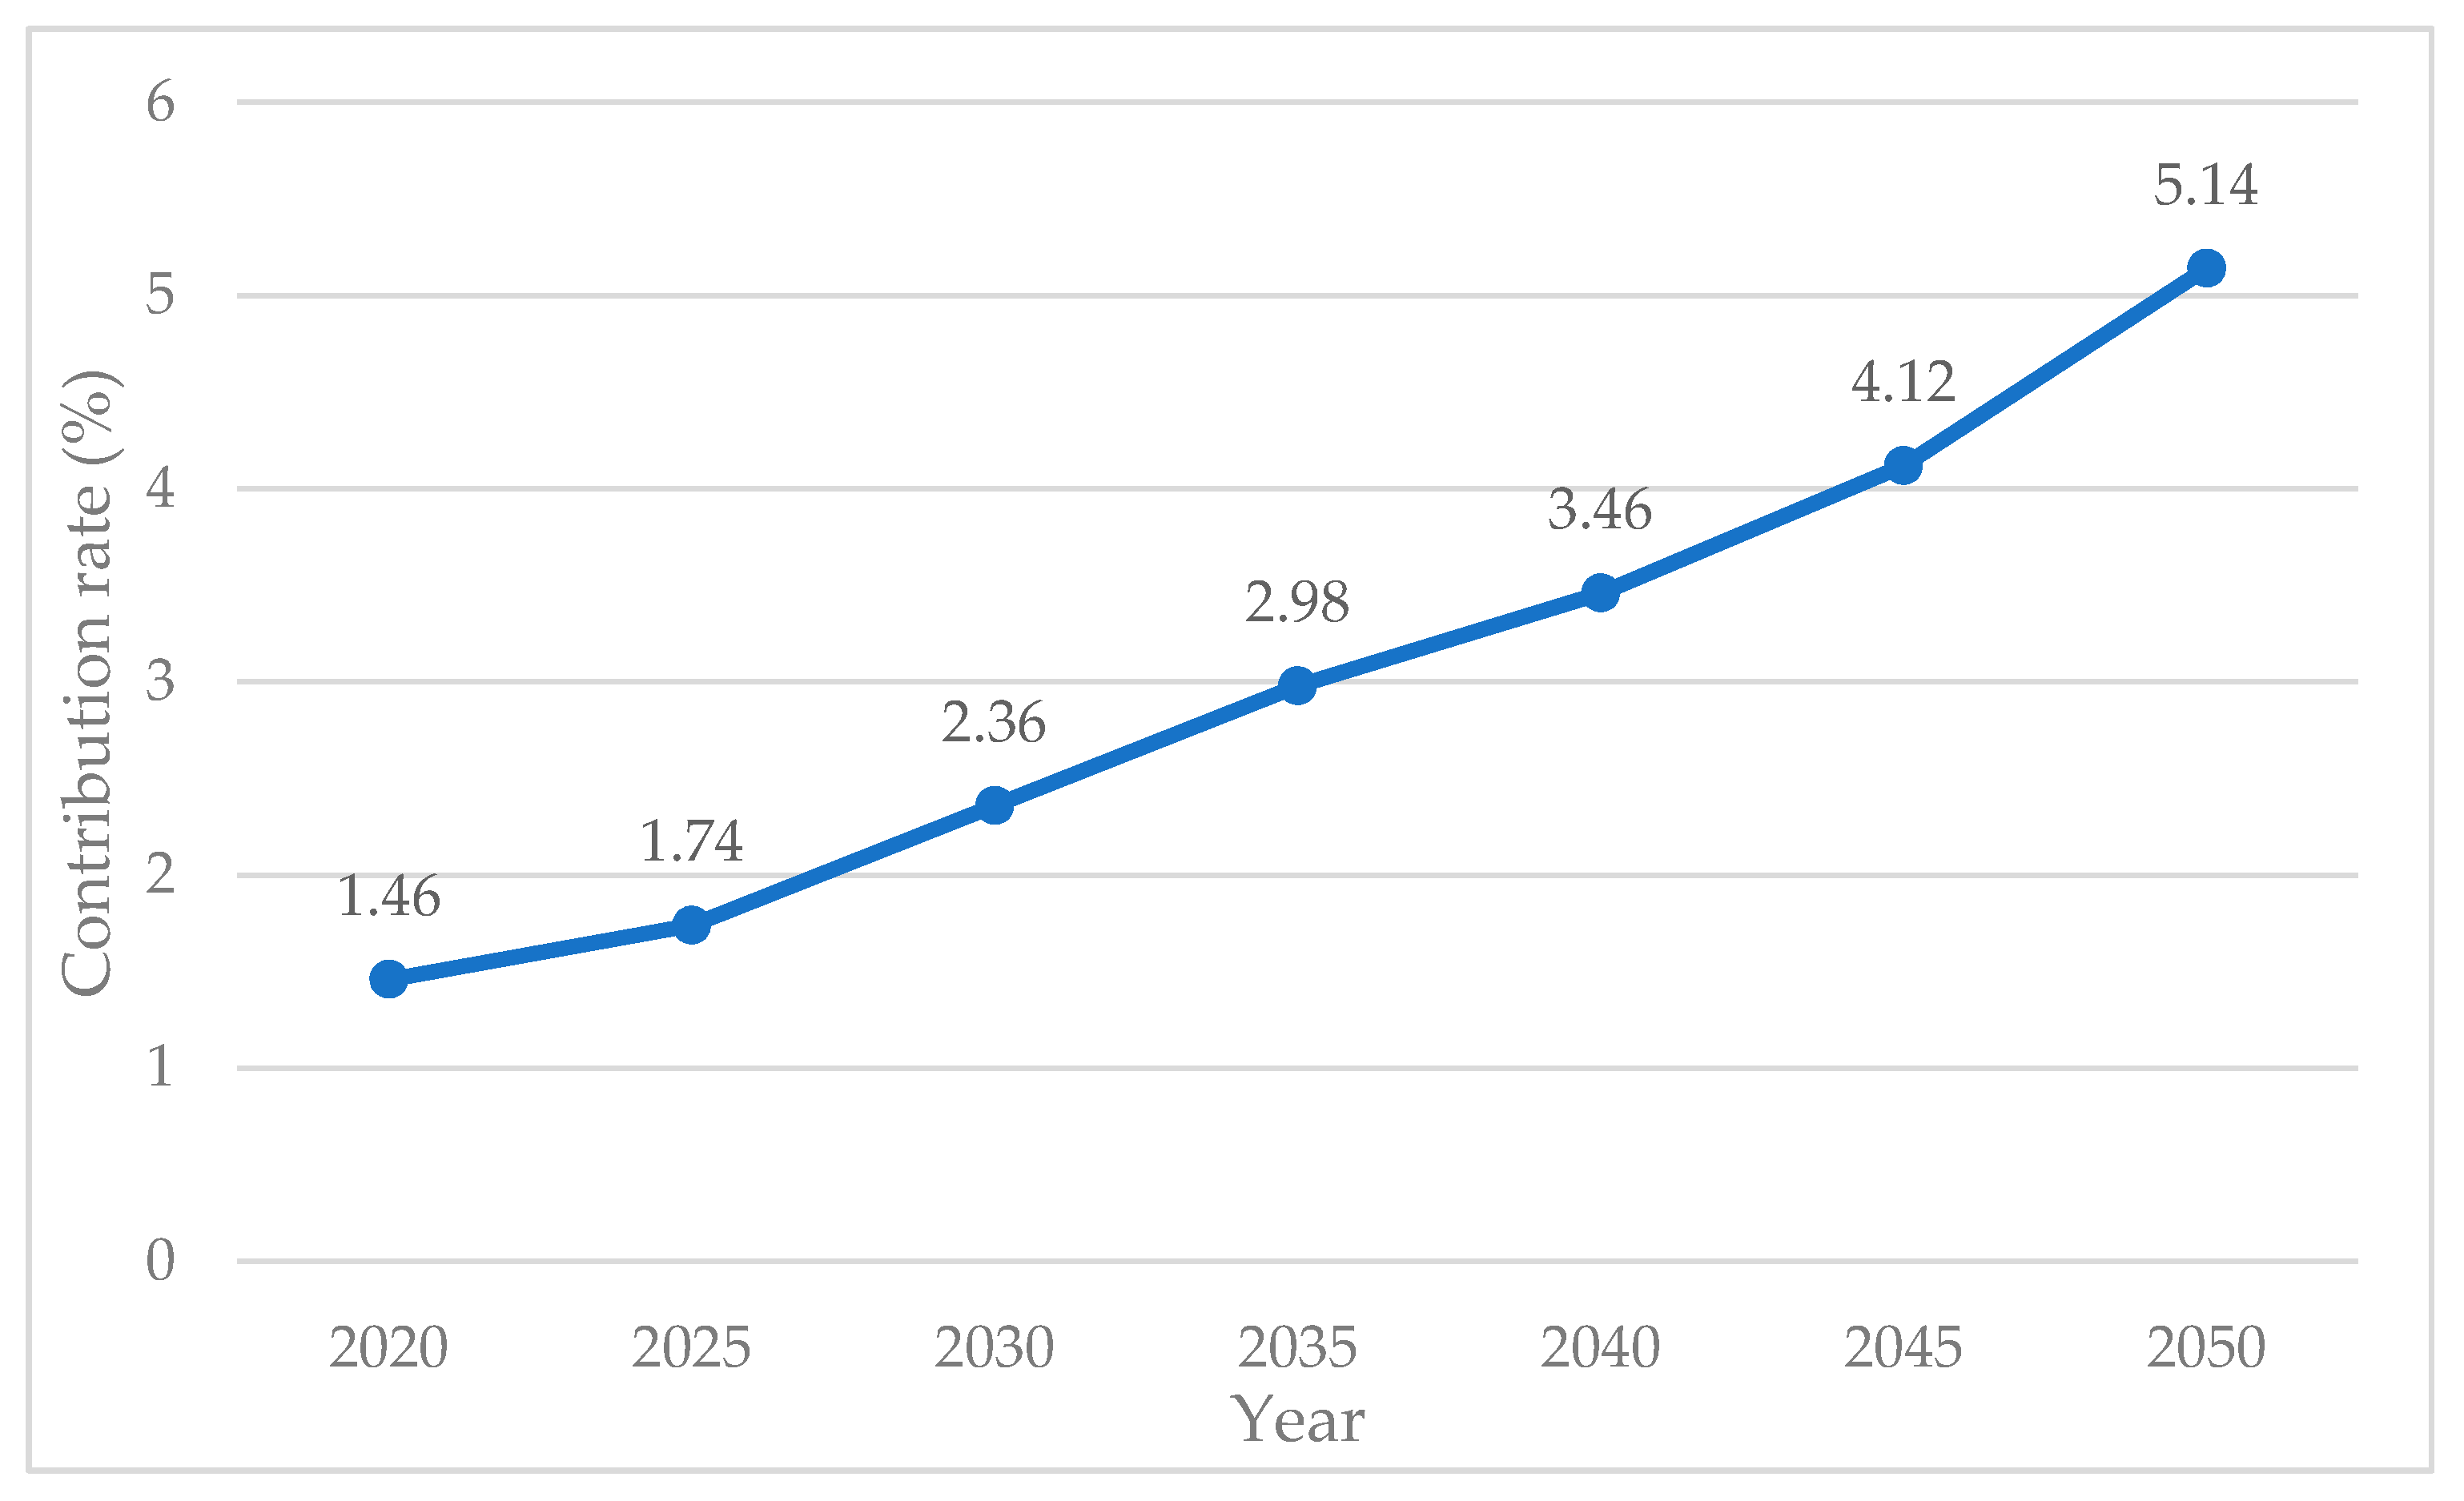
The overall contribution rate of LTCI will increase linearly from 2020 to 2050 (Figure 2). We estimate that the overall contribution rate of LTCI in China from 2020 to 2050 will increase from 1.46% in 2020 to 5.14% in 2050, an increase of about 3.5 times, and the payment burden of policyholders will increase year by year. Based on the principle of who benefits and who bears the burden, this study refers to the experience in Germany and Japan. Users pay a part of care costs (10%), which is helpful to prevent moral hazard and increase the financial burden caused by excessive consumption. Among them, the total contribution rate in 2020 is 1.46% according to the 1:1 payment proportion between employer and employee. Each side bears 0.68% of the insurance premium. In addition, the total contribution rate in 2020 will be close to 1.33% in Japan in 2015 and 1.40% in Germany in 2010 (Table 6).
4. Discussion
In this study, an overall simulation model and a Monte Carlo simulation are used to predict the contribution rates of LTCI for the disabled elderly from 2020 to 2050 in China. We estimate that the overall contribution rate of LTCI in China from 2020 to 2050 will increase from 1.46% in 2020 to 5.14% in 2050, an increase of about 3.5 times. Therefore, the payment burden of policyholders will increase year by year. As can be seen, like other social insurance (such as medical insurance), how to control the rapidly rising premium will become the focus of policymakers in the future.
From the analysis of the financial demands and supply of the LTCI system, this study summarizes the factors of the increase of the LTCI contribution rate mainly related to the following aspects: a) Rapid aging of population: the elderly population in urban and rural areas continues to rise and the number of elderly disabled people has increased significantly [43]. b) Increasing care costs: consistent with previous research results, the cost of LTC for disabled elderly is mainly composed of labor costs [44]. The labor cost is affected by the number of employment-population and their average wages. With the development of the economy and society, the cost of care will increase as average wages increase [45]. c) Diversified choices of care types: due to differences in the cost of community home and institutional care, the level of LTCI benefits varies. Compared with traditional community home care, the cost of institutional care is higher [46]. With the change of care concept, the development of professional pension institutions and the improvement of the quality of care services will also have an impact on the growth of insurance premiums. d) Decrease in the number of employment-population and an increase in the dependency ratio: in order to achieve the balance between financial supply and need for LTCI, the financial demands should be based on the financial supply. Among them, the financial supply ability of the employment-population is an important factor that affects insurance premiums. Theoretically, under the condition that the average wage income and financial demands of the employment-population are constant, the more the employment population, the lower the insurance premium [47]. We also find that the decline in urban and rural employment-population after 2020 is one of the reasons for the increase of LTCI premiums.
With the rapid aging of the population, the number of disabled elderlies has increased, the cost of formal and informal care for the disabled has continued to rise [48], and the decline in the employment-population has led to an annual increase in contribution rates. The predicted results show that the financial demands of LTC for disabled elderly in China face an increasing trend from 2020 to 2050. The total financial demands will increase from 538.0 billion yuan in 2020 to 8530.8 billion yuan in 2050, an increase of about 15.9 times. The rapidly increasing cost of LTC will become one of the great challenges to establish a sustainable LTCI system in the future. At present, the two main financing channels of social insurance (enterprises and governments) are under great pressure to raise funds, which will be detrimental to the long-term economic development. Therefore, it is urgent to establish a sustainable financing mechanism for multiple financial supplies [49,50]. Developing LTCI in China should consider China’s actual situations rather than merely implant the foreign models. By referring to the financing mechanisms of different institutional models in typical countries and regions [51], policymakers should consider our national conditions and take the following measures: a) establishing a sustainable financing policy including the government, employers, and employees; b) encouraging the private LTCI as a supplement [52]; c) making full use of medical insurance balance funds to provide favorable conditions for the initial development of LTCI; d) reallocating the profits of state-owned enterprises and investing some of the profits into the construction of LTCI; and e) issuing of the welfare lottery to raise funds [42].
From 2020 to 2050, the financial demands of LTC for disabled elderly in China will become stronger, especially in urban areas, and the burden of per capita care costs in rural areas will increase. It is worth noting that the economic development of rural areas is relatively low, but the ratio of elderly people in the rural population is higher than in urban areas. The aging population problem is more serious in rural areas [53]. With the further development of the aging population, the number of disabled, demented, and empty-nest elderly in rural areas will increase dramatically, and the need for an LTCI system is even more urgent [54]. Lacking funds is a key factor restricting the development of LTCI systems in rural areas [55]. Due to the heavy burden of current social security payment on enterprises, the income gap between urban and rural elderly and the ability to pay insurance premiums for rural elderly are limited. Policymakers should take into account many factors, including the differences between urban and rural areas, division of responsibility among three major payers (government, enterprises, and residents), coverage, and different care types in order to maintain the sustainable development of LTC in the future [30,56].
At present, China has not established a unified LTCI system. Our study predicts the contribution rate of LTCI for the elderly based on the balance of supply and demand, enriches the quantitative research of the LTCI system, and the ability to provide evidence for establishing a unified and sustainable LTCI system. However, there are still some limitations to our study. Firstly, due to the lack of relevant micro-data data, the rationality and feasibility of the calculation of the LTCI contribution rate need to be further studied. Secondly, as the employment rates in urban and rural areas are unlikely to be the same, it may not be practical to assume that the ratio of the total employed population in the urban and rural is equal to the ratio of the population’s labor force aged 16 to 65 years old in the urban and rural areas. Thirdly, due to the calculation of the LTCI contribution rate being based on the prediction of future related data and the prediction model is optimized, it may be biased to some extent. In addition, this study will focus on the overall performance and compression effect of the model in the future to increase the accuracy of the simulation.
5. Conclusions
In summary, the predicted results show that the overall contribution rate of LTCI will increase linearly, and the payment burden of policyholders will increase year by year. It is urgent to establish a unified national LTCI with a sustainable financing mechanism for multiple financial supplies. In the short term, policymakers can adjust the structure of the medical insurance fund and allocate medical insurance balance funds to promote the establishment of an LTCI system. In the long run, in order to ensure the sustainable development of the LTCI system, policymakers should formulate a reasonable funding ratio for LTCI or use a combination of fund transfers and multi-party funding. No matter which method is adopted, solving the funding problem and establishing a scientific and comprehensive financing mechanism are the first tasks of establishing an LTCI system in China. In the context of the urban-rural dual institution, policymakers need to take a multi-pronged approach and focus on the fairness, efficiency, and sustainability of LTCI funds.
Author Contributions
L.Z., S.F. and Y.F. worked together. Specifically, L.Z. designed the study design, analyzed and interpreted the data, and drafted the manuscript. S.F. participated in the statistical analysis and drafted the manuscript. Y.F. supervised and revised the manuscript. All authors have read and agreed to the published version of the manuscript.
Funding
This study was supported by the National Natural Science Foundation of China (grant number 81573257 & 81973144). The funders who supported this study had no role in study design, data collection and analysis, decision to publish, or preparation of the manuscript.
Acknowledgments
The authors would like to thank the National Bureau of statistics of the People’s Republic of China, for its support with the data. We are also grateful to the students in School of Public Health, Xiamen University who participated in the data collation and analysis.
Conflicts of Interest
The authors declare no conflict of interest.
References
- Parker, S.; Pant, B. Longevity in Nepal: Health, policy and service provision challenges. Int. J. Soc. Syst. Sci. 2011, 3, 333–345. [Google Scholar] [CrossRef]
- Li, Z.; Li, H. Analysis of the impact of population aging on the household consumption. Int. J. Bus. Soc. Sci. 2014, 5, 1. [Google Scholar]
- National Bureau of Statistics of China. 2019. Available online: http://www.stats.gov.cn/tjsj/zxfb/201902/t20190228_1651265.html (accessed on 1 December 2019).
- Yu, L. How to Solve the Problem of Insufficient Supply of More than 4 Million Registered Nurses in China? Available online: http://www.cnr.cn/sxpd/ws/20190512/t20190512_524609391.shtml (accessed on 14 March 2019).
- Zhuang, X.; Zhang, L. Aged-support Situations of the Disabled Elderly. Popul. J. 2016, 38, 47–57. [Google Scholar]
- Zhang, Y.; Yu, X. Evaluation of Long-Term Care Insurance Policy in Chinese Pilot Cities. Int. J. Environ. Res. Public Health 2019, 16, 3826. [Google Scholar] [CrossRef] [Green Version]
- Wong, Y.C.; Leung, J. Long-term care in China: Issues and prospects. J. Gerontol. Soc. Work 2012, 55, 570–586. [Google Scholar] [CrossRef]
- Xu, X.; Chen, L. Projection of Long-Term Care Costs in China, 2020–2050: Based on the Bayesian Quantile Regression Method. Sustainability 2019, 11, 3530. [Google Scholar] [CrossRef] [Green Version]
- Tao, J. Establishing a long term care insurance system model suitable for China’s actual situation. Insur. Stud. 2010, 4, 77–82. [Google Scholar]
- Interpretation of the 13th Healthy Ageing Five-Year Plan. Available online: http://www.nhc.gov.cn/jtfzs/s3582e/201703/090497fbc28a4f71b7b48f5b267b331a.shtml (accessed on 14 March 2019). (In Chinese)
- Wang, Q.; Zhou, Y.; Ding, X.; Ying, X. Demand for long-term care insurance in China. Int. J. Environ. Res. Public Health 2018, 15, 6. [Google Scholar] [CrossRef] [Green Version]
- Chang, S.; Yang, W.; Deguchi, H. Care providers, access to care, and the Long-term Care Nursing Insurance in China: An agent-based simulation. Soc. Sci. Med. 2020, 244, 112667. [Google Scholar] [CrossRef]
- Yang, J.; Wang, S.; Du, S. Regional comparison and implications of China’s long-term care insurance system. Chin. J. Health Policy 2018, 11, 1–7. [Google Scholar]
- Zhu, Y.; Osterle, A. China’s policy experimentation on long-term care insurance: Implications for access. Int. J. Health Plan. Manag. 2019, 34, e1661–e1674. [Google Scholar] [CrossRef] [PubMed] [Green Version]
- Zhou, L.; Wang, J. Long-Term Care Insurance Fund Raising and Treatment Payment Policy: Based on Implementation Scheme Comparison of 15 Pilot Cities in China. Res. Financ. Econ. Issues 2019, 11, 89–97. [Google Scholar]
- James, D.C. Actuarial Basis for Premium and Reserves in Personal Accident and Health Insurance. 1930. Available online: https://www.casact.org/pubs/proceed/proceed30/30051.pdf (accessed on 14 March 2019).
- Haberman, S. Decrement tables and the measurement of morbidity: I. J. Inst. Actuar. 1983, 110, 361–381. [Google Scholar] [CrossRef]
- Robinson, J. A Long-Term-Care Status Transition Model. 1996. Available online: https://www.soa.org/globalassets/assets/library/monographs/retirement-systems/the-old-age-crisis-actuarial-opportunities-the-1996-bowles-symposium/1999/january/m-rs99-1-08.pdf (accessed on 14 March 2019).
- Kan, Q.; Cao, X. A Review of Researches on Long-term Care Insurance Funding Theory. Chin. Econ. 2019, 3, 56–57. [Google Scholar]
- Yang, C.; Chen, Y. Comparison on Long-Term Care Insurance System and Premium Rate Structure under the Different Modes of Welfare State. Reform Econ. Syst. 2019, 4, 151–159. [Google Scholar]
- Huang, F.; Wu, C. A Study of Long-Term-Care Demand of the Elderly in China: Based on Multistatus Transition Model. Econ. Res. J. 2012, 47, 119–130. [Google Scholar]
- Hu, H.; Li, Y.; Zhang, L. Estimation and Prediction of Demand of Chinese Elderly Long-term Care Service. Chin. Popul. Sci. 2015, 13, 79–89, 127. [Google Scholar]
- He, G. Pricing Research on Long-Term Care Insurance. Master’s Thesis, Southwestern University of Finance and Economics, Sichuan, China, April 2007. [Google Scholar]
- Zhao, Y. Study on the Ratemaking of Long-Term Care Insurance in China. Master’s Thesis, Hunan University, Changsha, China, April 2016. [Google Scholar]
- Chen, K. The Premiun Rate Research of Long-Term Care Insurance. Master’s Thesis, Zhejiang University, Hangzhou, China, May 2010. [Google Scholar]
- Arnsberger, P.; Fox, P.; Zhang, X.; Gui, S. Population aging and the need for long term care: A comparison of the United States and the People’s Republic of China. J. Cross. Cult. Gerontol. 2000, 15, 207–227. [Google Scholar] [CrossRef]
- Glass, A.P.; Gao, Y.; Luo, J. China: Facing a long-term care challenge on an unprecedented scale. Glob. Public Health 2013, 8, 725–738. [Google Scholar] [CrossRef]
- Lei, X.; Feng, Y. Financing Channel of Social Long-term Care Insurance: Experience, Difficulties and Future choices. J. Northwest Univ. Philos. Soc. Sci. Ed. 2016, 46, 108–115. [Google Scholar]
- Lu, Y.; Yang, C. A Review of the Construction of Long-term Care Insurance System in China. Soc. Secur. Stud. 2016, 4, 98–105. [Google Scholar]
- Xu, K. Study on Current Issues in China Long-term Care Insurance System and Its Optimization. Fiscal Sci. 2019, 8, 140–145. [Google Scholar]
- Division, U.P. World Population Prospects 2017; UN Population Division: New York, NY, USA, 2017. [Google Scholar]
- Duke University Center for the Study of Aging and Human Development. Chinese Longitudinal Healthy Longevity Survey. Available online: https://opendata.pku.edu.cn/dataverse/CHADS (accessed on 30 January 2019).
- Taiwan Ministry of Health and Welfare. Available online: https://www.mohw.gov.tw/mp-1.html (accessed on 14 March 2019).
- Government, S.M. Notice of the Municipal Government on Printing and Distributing the “Measures for Piloting Long-Term Care Insurance in Shanghai”. Available online: http://www.shanghai.gov.cn/nw2/nw2314/nw2319/nw12344/u26aw54809.html (accessed on 14 March 2019).
- National Bureau of Statistics of China. 2014. Available online: http://www.stats.gov.cn/tjsj/ndsj/2015/indexch.htm (accessed on 14 March 2019).
- Qi, M. Labor Supply and Labor Demand Forecasting in China, 2010–2050. Popul. Res. 2010, 34, 76–87. [Google Scholar]
- Wang, B.; Shi, A. The Fuzzy-DCF Model of Insurance Pricing and Its Application. Theory Pract. Financ. Econ. 2006, 5, 31–34. [Google Scholar]
- He, C. The Research of Markov Forecasing Method and Application. Master’s Thesis, Anhui University, Hefei, China, April 2011. [Google Scholar]
- Vanella, P.; Heß, M.; Wilke, C.B. A probabilistic projection of beneficiaries of long-term care insurance in Germany by severity of disability. Qual. Quant. 2020. [Google Scholar] [CrossRef] [Green Version]
- Zhu, L. The Monte Carlo Method and Application. Master’s Thesis, Central China Normal University, Wuhan, China, December 2014. [Google Scholar]
- Duan, N.; Xue, H.; Pan, Y. The selection of simulation times when calculating reliability with Monte Carlo method. Coal Mine Mach. 2002, 3, 13–14. [Google Scholar]
- Guo, S. Research on the Financing Mechanism of the Long-Term Care Insurance Based on the ILO Financing Model. Sci. Res. Aging 2017, 5, 12–22. [Google Scholar]
- Peng, X.; Song, S.; Sullivan, S.; Qiu, J.; Wang, W. Ageing, the urban-rural gap and disability trends: 19 years of experience in China-1987 to 2006. PLoS ONE 2010, 5, e12129. [Google Scholar] [CrossRef]
- Yang, M. Multi-Properties Population Prejection Research and A Long-Term Care Policy Simulation for Disabled Elderly in China. Ph.D. Thesis, Zhejiang University, Hangzhou, China, May 2016. [Google Scholar]
- Karlsson, M.; Mayhew, L.; Plumb, R.; Rickayzen, B. Future costs for long-term care: Cost projections for long-term care for older people in the United Kingdom. Health Policy 2006, 75, 187–213. [Google Scholar] [CrossRef]
- Kuo, Y.-C.; Lan, C.-F.; Chen, L.-K.; Lan, V.M. Dementia care costs and the patient’s quality of life (QoL) in Taiwan: Home versus institutional care services. Arch. Gerontol. Geriatr. 2010, 51, 159–163. [Google Scholar] [CrossRef] [PubMed]
- Young, R.A.; DeVoe, J.E. Who will have health insurance in the future? An updated projection. Ann. Fam. Med. 2012, 10, 156–162. [Google Scholar] [CrossRef] [PubMed]
- Wittenberg, R.; Hu, B.; Hancock, R.; Morciano, M.; Comasherrera, A.; Malley, J.; King, D. Projections of Demand for and Costs of Social Care for Older People in England, 2010 to 2030, under Current and Alternative Funding Systems; University of Kent: Kent, UK, 2011. [Google Scholar]
- Li, F.; Otani, J. Financing elderly people’s long-term care needs: Evidence from China. Int. J. Health Plan. Manag. 2018, 33, 479–488. [Google Scholar] [CrossRef] [PubMed]
- Kwon, S. Future of long-term care financing for the elderly in Korea. J. Aging Soc. Policy 2008, 20, 119–136. [Google Scholar] [CrossRef]
- Jing, Y.; Meng, S.; Li, Y. Characteristics and Enlightenment of the Financing model of Long-term Care Insurance in Germany, the United States and Japan. J. Yanbian Univ. 2018, 51, 101–107, 143. [Google Scholar]
- Comas-Herrera, A.; Butterfield, R.; Fernández, J.-L.; Wiener, J.M. Barriers to Opportunities for Private Long-term Care Insurance in England: What Can We Learn from Other Countries? In The LSE Companion to Health Policy; Edward Elgar Publishing: Camberley, UK, 2012. [Google Scholar]
- Yu, J. Serving the Elderly in Rural Areas a Crucial Task. Available online: http://www.chinadaily.com.cn/a/201912/03/WS5de5a92ea310cf3e3557b784.html (accessed on 30 December 2019). (In Chinese).
- Zhang, H. Who will care for our parents? Changing boundaries of family and public roles in providing care for the aged in urban China. Care Manag. J. 2007, 8, 39. [Google Scholar] [CrossRef]
- Li, X.; Zhu, M. Analysis of Long-term Care Insurance Premium Rate for the Disabled Elderly Based on the Transition Probability Matrix Model—Taking Tianjin as the Research Object. Popul. Dev. 2019, 25, 11–19. [Google Scholar]
- Liu, Y.; Wu, H. A Brief Discussion on the Effective Connection between the Long-term Care Insurance and the Medical. J. Xi’an. Univ. Arch. Technol. 2018, 37, 48–53. [Google Scholar]
Figure 1.
Contribution base of the employment-population from 2020 to 2050 (100 million yuan).

Figure 2.
The trend of the LTCI contribution rate in China from 2020 to 2050.


Table 1.
Summary of data sources.
| Predictive Content | Index | Data Sources |
|---|---|---|
| Number of disabled | Demographic data | United Nations Population Division [31] |
| Disability rate | Chinese Longitudinal Healthy Longevity Survey (CLHLS) [32] | |
| Care cost | Proportion of different types of care | Taiwan Ministry of Health and Welfare [33] |
| Costs of LTC for disabled elderly | Shanghai Bureau of Statistics [34]; National Bureau of Statistics of China [35] | |
| Insurance rate | Urban and rural employment population | Qi Mingzhu [36] |
| Average wage of urban and rural employees | National Bureau of Statistics of China [35] |
Table 2.
Projection of financial demands for LTC in urban and rural areas from 2020 to 2050.
| Year | Financial Demands (100 million yuan) | Per Capita Financial Demands (yuan) | ||||
|---|---|---|---|---|---|---|
| Urban | Rural | Total | Urban | Rural | Total | |
| 2020 | 4277 | 1103 | 5380 | 17,931 | 5545 | 11,738 |
| 2025 | 7706 | 1812 | 9518 | 26,896 | 8317 | 17,607 |
| 2030 | 12,987 | 3493 | 16,480 | 35,827 | 13,863 | 24,845 |
| 2035 | 24,335 | 6505 | 30,840 | 53,686 | 22,180 | 37,933 |
| 2040 | 38,315 | 10,314 | 48,629 | 71,581 | 33,270 | 52,426 |
| 2045 | 52,348 | 13,119 | 65,467 | 89,476 | 44,360 | 66,918 |
| 2050 | 68,437 | 16,871 | 85,308 | 107,371 | 60,996 | 84,184 |
Table 3.
Labor supply and demand population in China from 2020 to 2050 (10,000 people).
| Year | Total Labor Supply | Total Labor Demand | ||||||
|---|---|---|---|---|---|---|---|---|
| TFR = 1.6 | TFR = 1.8 | Mean | Model 1 | Model 2 | Model 3 | Model 4 | Mean | |
| 2020 | 72,248 | 72,248 | 72,248 | 70,414 | 76,575 | 77,137 | 77,836 | 74,709 |
| 2025 | 70,568 | 70,970 | 70,769 | 69,095 | 76,310 | 76,827 | 76,894 | 74,077 |
| 2030 | 67,515 | 68,335 | 67,925 | 67,889 | 75,907 | 75,947 | 76,006 | 73,248 |
| 2035 | 63,096 | 64,766 | 63,931 | 66,528 | 75,123 | 75,022 | 75,061 | 72,224 |
| 2040 | 59,741 | 62,244 | 60,993 | 65,154 | 74,145 | 74,124 | 73,995 | 71,141 |
| 2045 | 58,112 | 61,439 | 59,776 | 63,474 | 72,691 | 73,154 | 72,608 | 69,773 |
| 2050 | 56,467 | 60,670 | 58,569 | 61,767 | 71,078 | 71,919 | 71,178 | 68,254 |
Note: Model 1 uses the employment elasticity method. Model 2 uses the GDP growth prediction method. Model 3 uses the industrial structure change prediction method. Model 4 uses the economic structure and economic aggregate prediction method [36].
Table 4.
Distribution of population’s labor force in urban and rural areas from 2020 to 2050 (10,000 people).
Table 4.
Distribution of population’s labor force in urban and rural areas from 2020 to 2050 (10,000 people).
| Year | Total Employment Population | Population Ratio of Urban and Rural Economic Activities | Urban Employment Population | Rural Employment Population |
|---|---|---|---|---|
| 2020 | 72,248 | 1.39 | 42,019 | 30,229 |
| 2025 | 70,769 | 1.53 | 42,797 | 27,972 |
| 2030 | 67,925 | 1.76 | 43,314 | 24,611 |
| 2035 | 63,931 | 2.11 | 43,374 | 20,557 |
| 2040 | 60,993 | 2.54 | 43,763 | 17,230 |
| 2045 | 59,776 | 2.96 | 44,681 | 15,095 |
| 2050 | 58,569 | 3.41 | 45,288 | 13,281 |
Table 5.
Contribution base of the employment-population from 2020 to 2050 (100 million yuan).
| Year | Urban Wages | Rural Net Income | Contribution Base | Growth Rate (%) |
|---|---|---|---|---|
| 2020 | 217,365 | 34,612 | 251,977 | —— |
| 2025 | 301,408 | 47,531 | 348,939 | 38.48 |
| 2030 | 405,049 | 60,278 | 465,327 | 33.35 |
| 2035 | 503,988 | 71,539 | 575,527 | 23.68 |
| 2040 | 706,715 | 89,247 | 795,962 | 38.3 |
| 2045 | 913,149 | 97,651 | 1,010,800 | 27 |
| 2050 | 1,117,403 | 112,873 | 1,230,276 | 21.71 |
Table 6.
Overall contribution rate of LTCI in China from 2020 to 2050 (%).
| Year | Overall Contribution Rate | User Pays 10% | Contribution Growth Rate | ||
|---|---|---|---|---|---|
| Overall Contribution Rate | Employer Contribution Rate | Personal Contribution Rate | |||
| 2020 | 1.46 | 1.36 | 0.68 | 0.68 | —— |
| 2025 | 1.74 | 1.64 | 0.82 | 0.82 | 19.18 |
| 2030 | 2.36 | 2.26 | 1.13 | 1.13 | 35.63 |
| 2035 | 2.98 | 2.88 | 1.44 | 1.44 | 26.27 |
| 2040 | 3.46 | 3.36 | 1.68 | 1.68 | 16.11 |
| 2045 | 4.12 | 4.02 | 2.01 | 2.01 | 19.08 |
| 2050 | 5.14 | 5.04 | 2.52 | 2.52 | 24.76 |
© 2020 by the authors. Licensee MDPI, Basel, Switzerland. This article is an open access article distributed under the terms and conditions of the Creative Commons Attribution (CC BY) license (http://creativecommons.org/licenses/by/4.0/).
Share and Cite
MDPI and ACS Style
Zhang, L.; Fu, S.; Fang, Y. Prediction the Contribution Rate of Long-Term Care Insurance for the Aged in China Based on the Balance of Supply and Demand. Sustainability 2020, 12, 3144. https://0-doi-org.brum.beds.ac.uk/10.3390/su12083144
AMA Style
Zhang L, Fu S, Fang Y. Prediction the Contribution Rate of Long-Term Care Insurance for the Aged in China Based on the Balance of Supply and Demand. Sustainability. 2020; 12(8):3144. https://0-doi-org.brum.beds.ac.uk/10.3390/su12083144
Chicago/Turabian StyleZhang, Liangwen, Sijia Fu, and Ya Fang. 2020. "Prediction the Contribution Rate of Long-Term Care Insurance for the Aged in China Based on the Balance of Supply and Demand" Sustainability 12, no. 8: 3144. https://0-doi-org.brum.beds.ac.uk/10.3390/su12083144
Note that from the first issue of 2016, this journal uses article numbers instead of page numbers. See further details here.