Industry 4.0—Awareness in South India


1
Department of Banking and Investment, Faculty of Economics, Technical University of Košice, Nemcovej 32, 04001 Košice, Slovakia
2
Montanuniversitaet Leoben, Erzherzog-Johann-Strasse 3/1, 8700 Leoben, Austria
*
Author to whom correspondence should be addressed.
Sustainability 2020, 12(8), 3207; https://0-doi-org.brum.beds.ac.uk/10.3390/su12083207
Submission received: 28 February 2020
/
Revised: 26 March 2020
/
Accepted: 3 April 2020
/
Published: 15 April 2020
(This article belongs to the Special Issue Industry 4.0 for SMEs - Smart Manufacturing and Logistics for SMEs)
Abstract
:Industry 4.0 (I4.0) approaches, frameworks, and technologies have gained an increasing relevance in order to gain sustainable and competitive advantages for industrial enterprises and for small and medium enterprises (SMEs), as well. Contrary to previous studies, which are mainly focused on companies, we conducted a questionnaire-based survey on inhabitants, in an attempt to examine general awareness about I4.0 concepts, in the region of South India. Our findings revealed a rather poor informational level of I4.0 concept and its components, which consequently leads to inadequate future actions and expectations. Moreover, respondents with prior information about I4.0 framework tend to have rather positive opinions and expectations of possible future trends. We emphasize that insufficient knowledge of the potential workforce regarding I4.0 concepts, especially in a region with ascending demographic development, can be considered as one of the main barriers for a successful and sustainable future development towards the 4th industrial revolution.
1. Introduction
In recent years, as a consequence of business and social evolution, a multitude of modern topics emerged, and therefore gained tremendous attention, in the areas of manufacturing, logistics, and organizational development of small and medium enterprises (SMEs), as a consequence of an ongoing business and social evolution. Megatrends, such as globalization, demographics’ dynamics, mass customization, technological progress, or climate change, lead to tremendous challenges for both society and the business sector. As a reaction to this very complex and volatile business environment, various strategic initiatives have taken place all over the world, in order to keep pace with the exponential technological development and to achieve sustainable future growth, for example, the “Made in China 2025”, Germany’s “High Tech Strategy 2020”, or the US’s “Industrial Internet Consortium” [1]. The aim of these projects is to develop and implement future concepts, frameworks, and technologies (e.g., Internet of Things or Industry 4.0) in order to make industries more effective, competitive, sustainable, and to produce higher value added [2] while minimizing negative impact on environment. Considering the costs, Industry 4.0 initiatives could also improve enterprises’ costs management [3,4,5].
In this study, the authors focus on Industry 4.0 (I4.0) as the most promising concept from both social and manufacturing–orientated point of view. Over the past years, we faced a strong advance of technology among almost all industrial sectors. New business propositions and applications within the business systems were enabled given the new technologies. As Thestrup et al. [6] stated, the systematic gathering of physical and virtual data from users, sensors, or devices, emerged. The so called “Internet of Things” (IoT) [7] was defined as a world-wide network of such objects communicating and operating through standardized communication protocols. However, IoT was recognized after the ITU1 report [8], describing IoT as ability of connecting everyday objects, meaning that people will be able to communicate with objects, the same as objects will be able to communicate among themselves. Prerequisite to such communication is advanced wireless technology (identification technologies and sensors). Logically, IoT can be diversified to Industrial IoT and Commercial IoT, while I4.0 expects all those parts to be interconnected and communicating.
To simplify, the goal of IoT infrastructure is to enable participants (people and objects) to be more flexible, to react appropriately and autonomously, thanks to an information sharing network. Harbor Research [9] suggests that two major strands of technological development emerged in the beginning of the 21st century; first is the mentioned IoT, and secondly, “Internet of People” (IoP, or social networking). These interconnected devices, processes, machines, products, etc., will have significant impact on enterprise’s life cycle, efficiency, functioning, and consequently, on the broader economy [10].
To conclude, Sundmaeker et al. [11] defines the IoT as an integrated part of ’Future Internet’, or a “dynamic global network infrastructure with self-configuring capabilities based on standard and interoperable communication protocols where physical and virtual ’things’ have identities, physical attributes, and virtual personalities and use intelligent interfaces, and are seamlessly integrated into the information network”. Internet of Things, as an essential part of I4.0 concept, is already partially adopted by households, with aim of creating a “smart house”, despite the fact that not every gadget is appropriately connectable yet [12]. The same problem can be observed among enterprises, especially in the area of SMEs. It assumed that the main barriers for becoming “smart” are insufficient education and little knowledge [10].
Moreover, interconnected objects and subjects are just one prerequisite for the so called “4th industrial revolution”, where cyber and physical levels should merge [3]. The term Industry 4.0 points to the 4th industrial revolution, and was firstly presented on Hannover-Messe (one of the biggest international trade fairs, oriented on new and smart technologies) in 2011, while it also indicates the initiative of the German government to improve the environment in the manufacturing sector using new technologies (information regarding the concept was brought up in 2014 at the World Economic Forum in Davos [13]). According to BITKOM (Germany’s digital association, founded in 1999 as a merger of individual industry associations in Berlin, representing more than 2500 companies in the digital economy, among them 1000 SMEs, all 400 start-ups), the 4th industrial revolution should allow control over the entire life cycle of the product and value stream, therefore redefine organization entirely. With respect to efficiency oriented on cost-savings and complexity reduction, Modrak and Bednar [14,15] conclude that I4.0 environment will initiate mass customization, mainly because of the ability of each entity throughout the value stream to communicate and identify itself. All these visions and concepts are meant to be environmentally, economically, but mainly socially sustainable. Thestrup et al. [6] also report to the importance of value creation and value constellations for developing the sustainable business models in industrial services. Sustainable development towards I4.0 is however a very complex issue. Leaving a now technical standpoint, we emphasize non-technical aspects of proposed changes within the industries.
As Slusarczyk [16] suggests, the 4th revolution differs from previous revolutions, because it will apply to all aspects of everyday lives, as a consequence of environment, where information will be exchanged between objects, between people, and between people and objects. In other words, real-time data exchange and horizontal and vertical integration of production systems are the main pillars of I4.0 [17], along with cyber security, autonomous systems, capability of analyzing large data sets, virtual reality, and cloud computing. Undoubtedly, such changes would require managerial decisions firstly, due to inevitable initial costs linked to such new technological equipment. Schröder et al. [18] leaves an open question, whether it is even worth implementing I4.0, especially for SMEs, despite the consensus we find among authors describing reduced costs and more efficient processes and environment as a consequence of I4.0. We argue that such dynamics within the industries should be examined deeply, and various elements of sustainable development, not only the economic point of view, should be evaluated [19,20]. The opposite to mentioned cost-saving and cost-reducing is initial need of significant financial expenditures, that are in many occasions out of reach for companies, especially SMEs.
Another very important social aspect of such smart environment is how the intelligent machines will affect the labor market [20,21,22,23,24]. This topic has basically been examined from two perspectives; firstly, by describing requirements towards workers in I4.0 [20,21,22,23,24]; secondly, by examining the standpoint of workers and their outlook or current state of mind [20,25]. Regarding the I4.0 environment, the authors can conclude that there is a growing trend in the literature highlighting the importance of sustainable development and management [26]. We argue that unless reasonable level of awareness and basic knowledge of Industry 4.0 related concepts, parts, and inevitable parts is reached, it will be hard to successfully move towards smart environment, especially in case of less developed regions. Insufficient information base of the eligible work force represents an obstacle for potential employers oriented towards I4.0. Inadequate information and knowledge could also lead potential employees towards wrong or misjudged conclusions or attitudes. Probably the most crowded thought is that bringing in the intelligent machines would steal jobs, again, especially in less developed regions with less qualified, manually involved workforce. Consequently, a lack of awareness and affinity towards any modernization steps could hold the required transformation processes. However, according to Statista [27], countries without any problems with unemployment (e.g., Germany, USA, Japan) report the highest numbers of installed industrial robots per 10,000 employees.
The aim of conducted research is to investigate and analyze general awareness and knowledge regarding Industry 4.0 within the area of South India. Based on an initial analysis, questionnaire-based surveys in the literature show a lack of covering focus on knowledge and attitudes of potential employees within the examined region and in general, as well. This paper concerns the crucial perspective of the potential workforce in the way to find a sustainable process of implementing Industry 4.0 in less developed regions. The questionnaire was created on the basis of previous industry visits and consultations with students, employers, and entrepreneurs in the investigated region. Issues addressed the most by respondents are highlighted and summarized.
2. Problems Description
The emerging economies should leverage their advantages, such as huge markets, attractive conditions for manufacturing, fast growing economies, and mainly larger labor force with more favorable demography [28]. Admitting that Industry 4.0 will primarily affect manufacturing sector, we face significant discrepancies among countries and regions. Despite the estimate that India will be the world’s fastest growing economy in following years [29] with manufacturing sector that could hit 1 trillion US$ in 2025 [30], we doubt the ability of successful transformation towards Industry 4.0, hence we find India and its regions important to examine with respect to the 4th industrial revolution [31]. For example, having Germany—a technology and manufacturing leader, however, with an aging population and lack of labor force—and on the other hand, an emerging country like India—suffering from technological gaps, which put India to a level of Industry 2.0 as Iyer [28] concludes, on the contrary, with strong demography.
There is also a political will to spur manufacturing sector, translated into initiatives such as ”Digital India” [32], “Skill India” [33], or “Make in India”, with aims to (among others) create sufficient skill sets within the urban poor and rural migrants for inclusive growth, or to increase technological depth in manufacturing in order to increase domestic value addition. In addition, there is the mentioned demographic factor—India has the best demographic dynamics, with approximately 60% of population in age between 15 and 59 [34]. The open question remains, are citizens and workers ready for such development in the foreseeable future?
We accept that within such a huge country, significant disparities among particular regions exist, hence we applied our research only in southern part of India (authors were physically present in the state of Tamil Nadu during data collection). South Indian region includes several states and union territories (Kerala, Andaman and Nicobar Islands, Tamil Nadu, Pondicherry, Andra Pradesh, Karnataka, Telangana, Lakshadweep Islands), which combined accounts for 19.31% of the geographical area of the whole of India. With over 250 million people, South India represents around 20% of the country’s population [35]. As of 2016, economic growth of South India was around 17%, compared to 8% growth of the whole of India, while GDP of South India accounted for 30% of total Indian’s GDP. Some specific industries are even more important from overall perspectives, such as cotton production (48% of India’s entire cotton production comes from South India) or agricultural production (36% of whole state’s production comes from South India).
Same as for other countries and regions, the main employers are SMEs. Unfortunately, as Iyer [28] states for India’s industrial policy in general, it is old, and lacking critical technology. Many enterprises in this area are old and have long lasting traditions. Despite the established reputation and customers created, they are equipped with insufficient and old devices or machines. Internet access and computer equipment within industries in this region is also rather poor. Since the majority of the research has been conducted in the field of needed modernization, especially with respect to the SMEs in order to successfully transform towards Industry 4.0, we would rather point at the necessity of having a potential labor force ready for such a transformation. It is therefore considered that awareness of I4.0 needs to be continuously expanded and promoted, as confirmed by several authors [10,36,37,38]. Even if obtaining new machines and gadgets would be economically viable, will there be enough sufficiently educated workers? Throughout the literature, we find papers addressing similar problems within different regions, e.g., concluding that qualified specialists are often not satisfied with the salary, which causes their outflow in favor of richer economic regions, leaving almost no people able to operate such modern machines [39]. We argue that unless some basic level of knowledge regarding the addressed issues is reached within the population, the ability of forming a sustainable path to become competitive in an Industry 4.0 environment is rather limited.
3. Methodology
Research was conducted in the area of South India, where different industries operate in several segments, with a majority representation of SMEs. The aim of this survey-based study is to examine level of awareness and general consciousness of Industry 4.0 among South Indian students, workers, entrepreneurs, in other words, a broad spectrum of citizens. We expect that proper analysis of the gathered responses could provide us with unique and valuable knowledge of the current state of mind of local citizens, along with their current level of internet/connection requiring gadgets/platforms, and further serve as guidance for finding a suitable implementing strategy for new technologies in such areas.
Results presented in this paper concern opinions and knowledge of inhabitants living, studying, working, or doing business in the previously described area. For obtaining responses, a questionnaire was used, and data collection took place from December 2019 to February 2020. As advised by several authors [40,41], we used fixed-choice questions, in order to maintain time efficiency and difficulty of evaluation. Questionnaire was distributed within several traceable ways during the stay of authors in Tamil Nadu (see Table 1). Sample contains 564 unique responses (after removing incomplete and inappropriately filled responses—respondents’ answers were checked to confirm all required questions had been answered in a prescribed manner). Respondents were notified in advance that providing answers to this questionnaire is anonymous. All answers provided will serve only for research purposes, and no personal details will be required or stored.
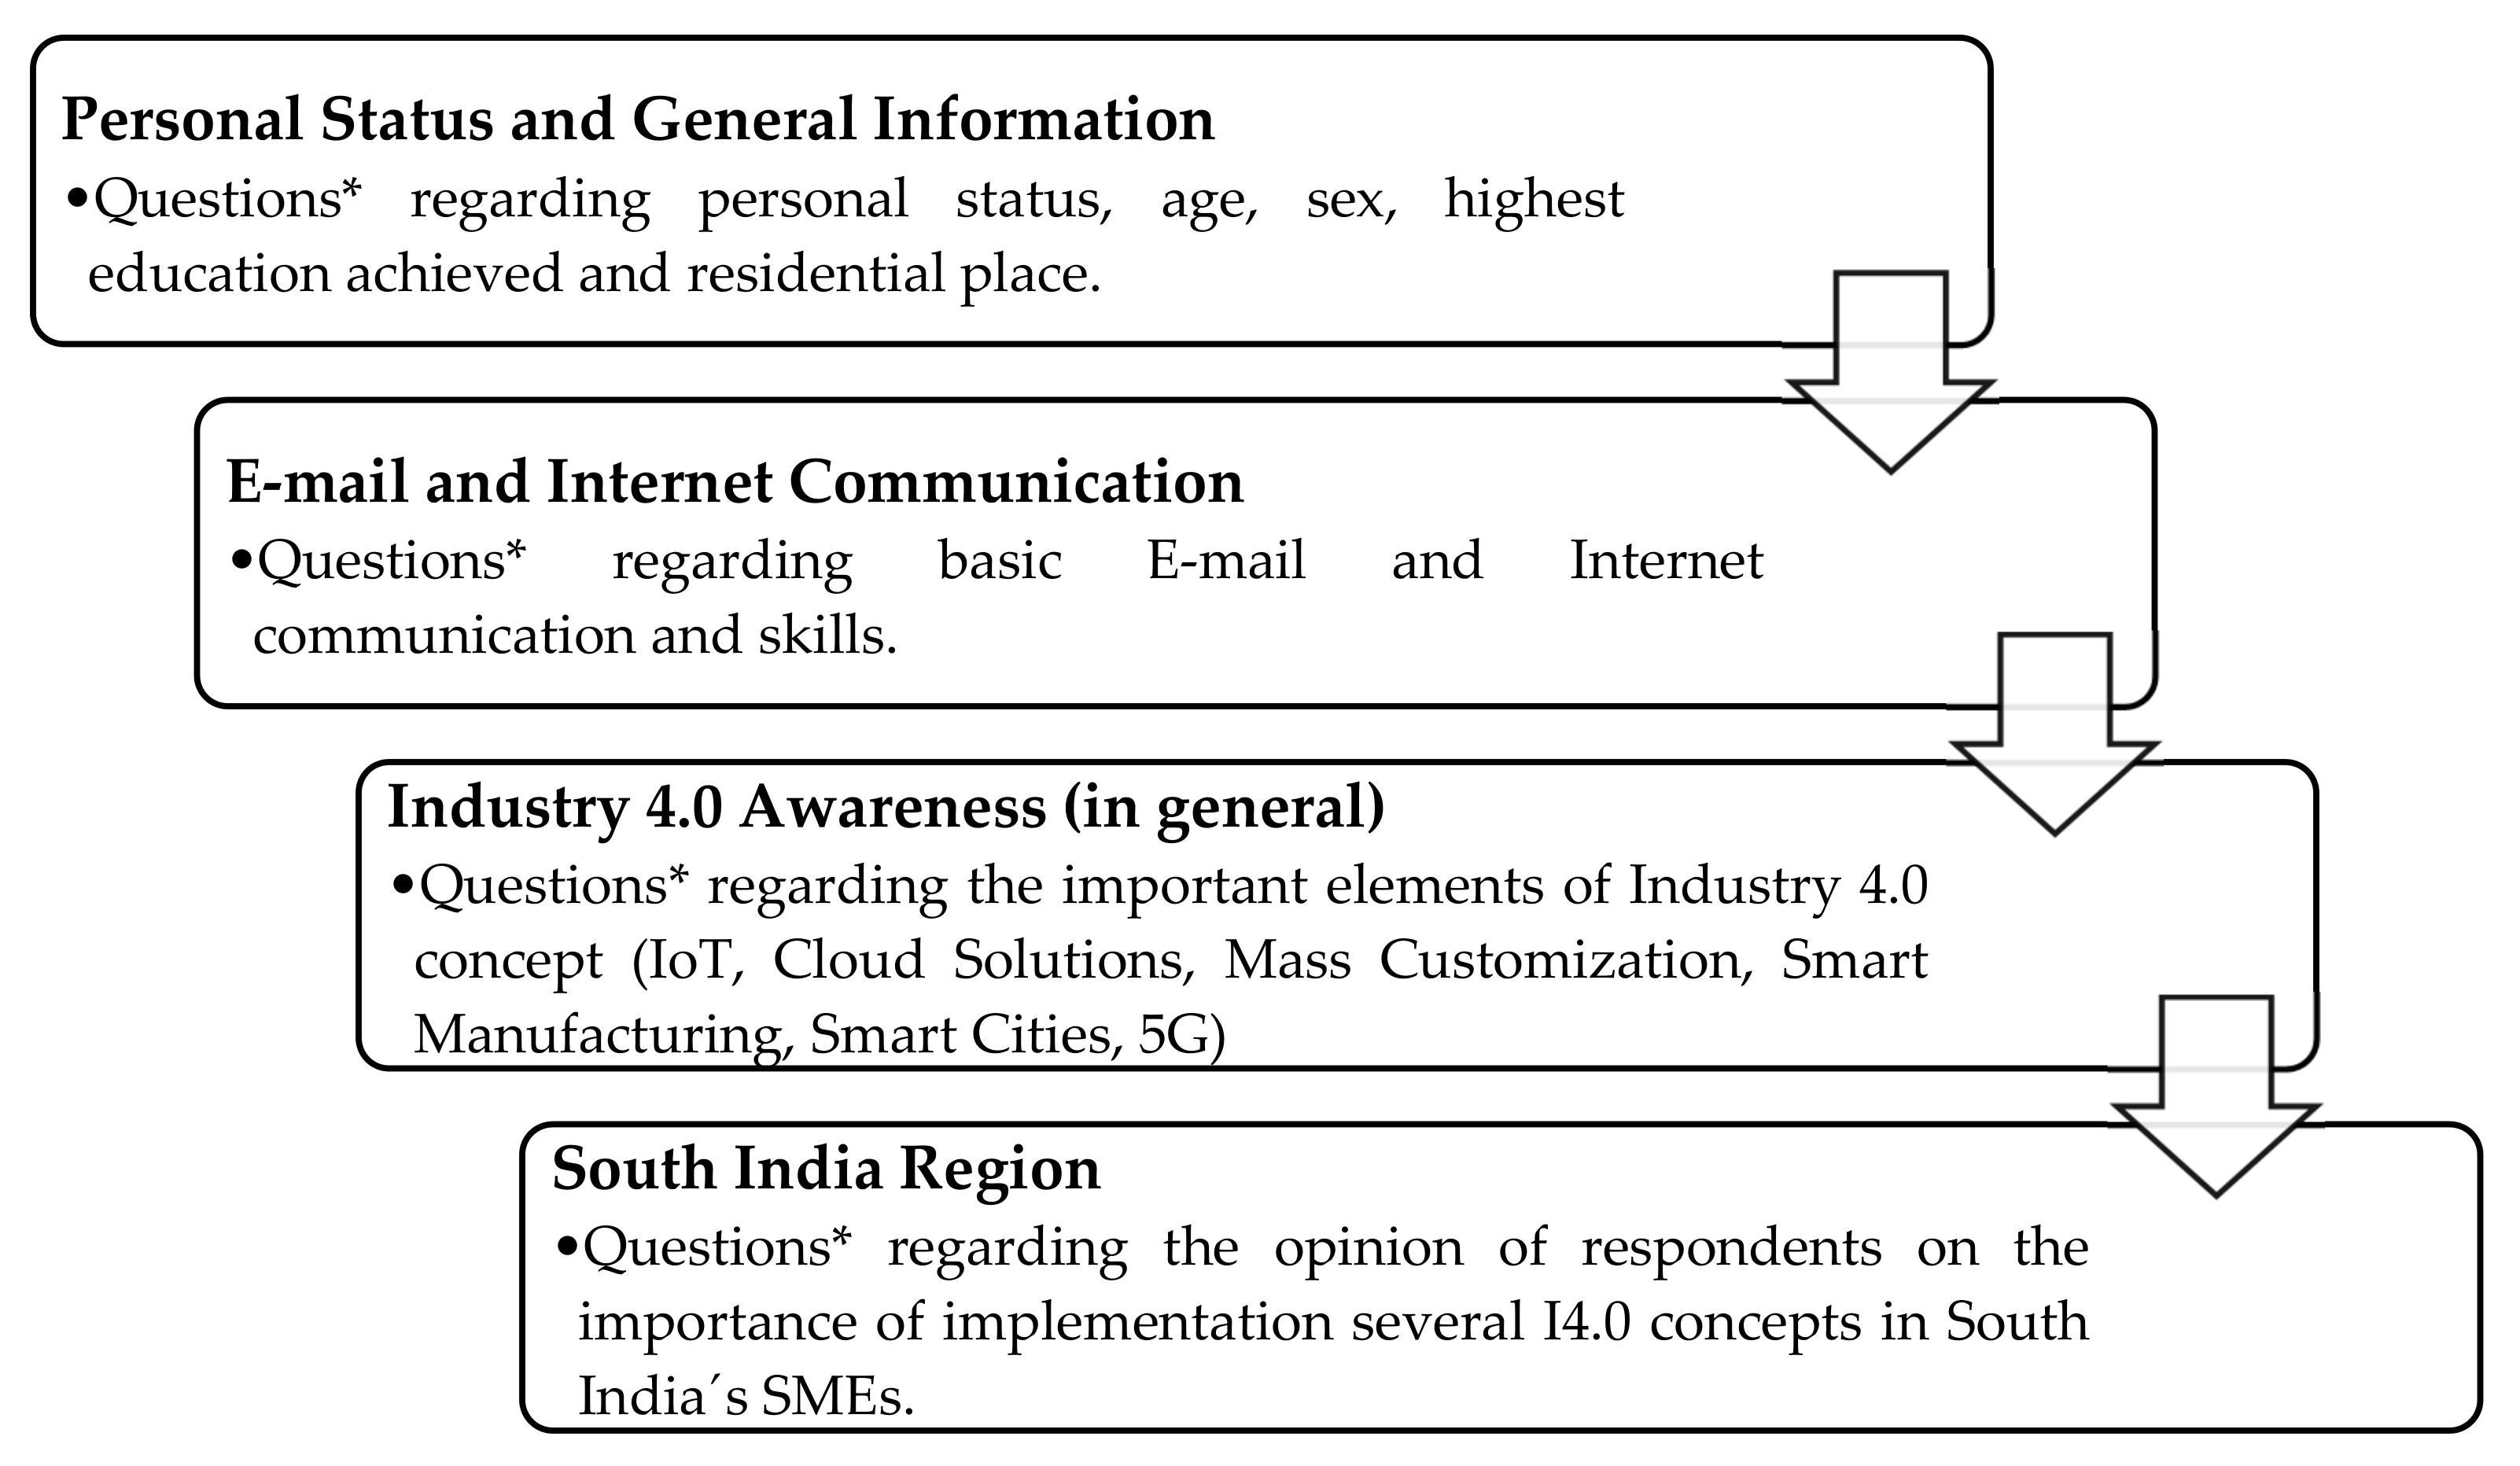
We divided the questionnaire into four main parts (Figure 1). In the first part, we focused on the social status of the respondent, education, and the place where respondent currently works, studies, or stays. In the second part, we were interested in respondents’ basic internet communication and usage of social communication applications. In the third and main part, we looked at the awareness of Industry 4.0 in general among respondents. We asked about key terms such as cloud solutions, mass customization, Internet of Things, Industry 4.0, smart manufacturing, smart cities, etc. In the fourth part, we intended to examine what the I4.0 could bring to the South Indian region from the responders’ perspective.
Several scales were used due to substance of the question (full text of the questionnaire and scales of answers is provided in Supplementary Materials). Questions addressing previous experience and general awareness about key terms were scaled binomially (yes/no). Other questions addressing South India region were scaled as 5 levels: Not at all important/no—1; slightly important/rather no—2; no opinion (due to lack of information/knowledge, referring also to “I do not know”)—3; fairly important/rather yes—4; very important/yes—5. Supplementary questions regarding usage of social media, email, or e-commerce had specific scales examining frequency of usage.
To analyze responses, we used tables of counts and percentages for the joint distribution of two (severe combinations) categorical variables. We used custom and contingency tables, statistical testing, and generated bar graphs for easier data presentation. Pearson’s chi-square test was performed to test the independence between the row and column variables. Pearson’s chi-square test requires a large sample. The main rule regarding the sample size is that not more than 20% of expected cells should be less than 5, and none of the expected cells should be less than 1 [42,43]. If the relationship was significant, consequently we used z-test to compare the proportion of column pairs to each other (adjusted by Bonferroni correction) according to the social variables and variables reported by Industry 4.0 areas. For 2 × 2 tables, we used Fisher’s Exact test. The column proportions test shows whether the ratio in one column is significantly different from the ratio in the other column. The test assigns a letter key (A, B, C) to each category reported in column variables. The definition of each comparison of column proportions is discussed in the following section. All statistical outputs were processed in the IBM SPSS Statistics v25.0.
In this study we try to identify the main drivers and barriers of Industry 4.0 readiness in South India. Among the literature, we follow several research questions to investigate their importance on Industry 4.0 readiness in this region. Accordingly, these research issues can be concluded:
- -
- The higher education achieved and higher personal status play an important role on Industry 4.0 readiness in South India’s region [28].
- -
- -
- The importance of the digital behavior of the young people, whose relationship with the digital world and services are very important for their further social and economic development, supported by the integrating social and economic dimensions of sustainable development in the context of I4.0 [38,49].
Further, we will concentrate on presenting the most attention grabbing outcomes and dependences from responses that were statistically proven as significant.
4. Results & Discussion
In order not to confuse respondents and avoid misinterpretations, we provided short descriptions of possibly unknown terms related to our scope (presented in Supplementary Materials). The questionnaire, in its actual form, is composed by twenty-seven questions divided into four main areas, mentioned above.
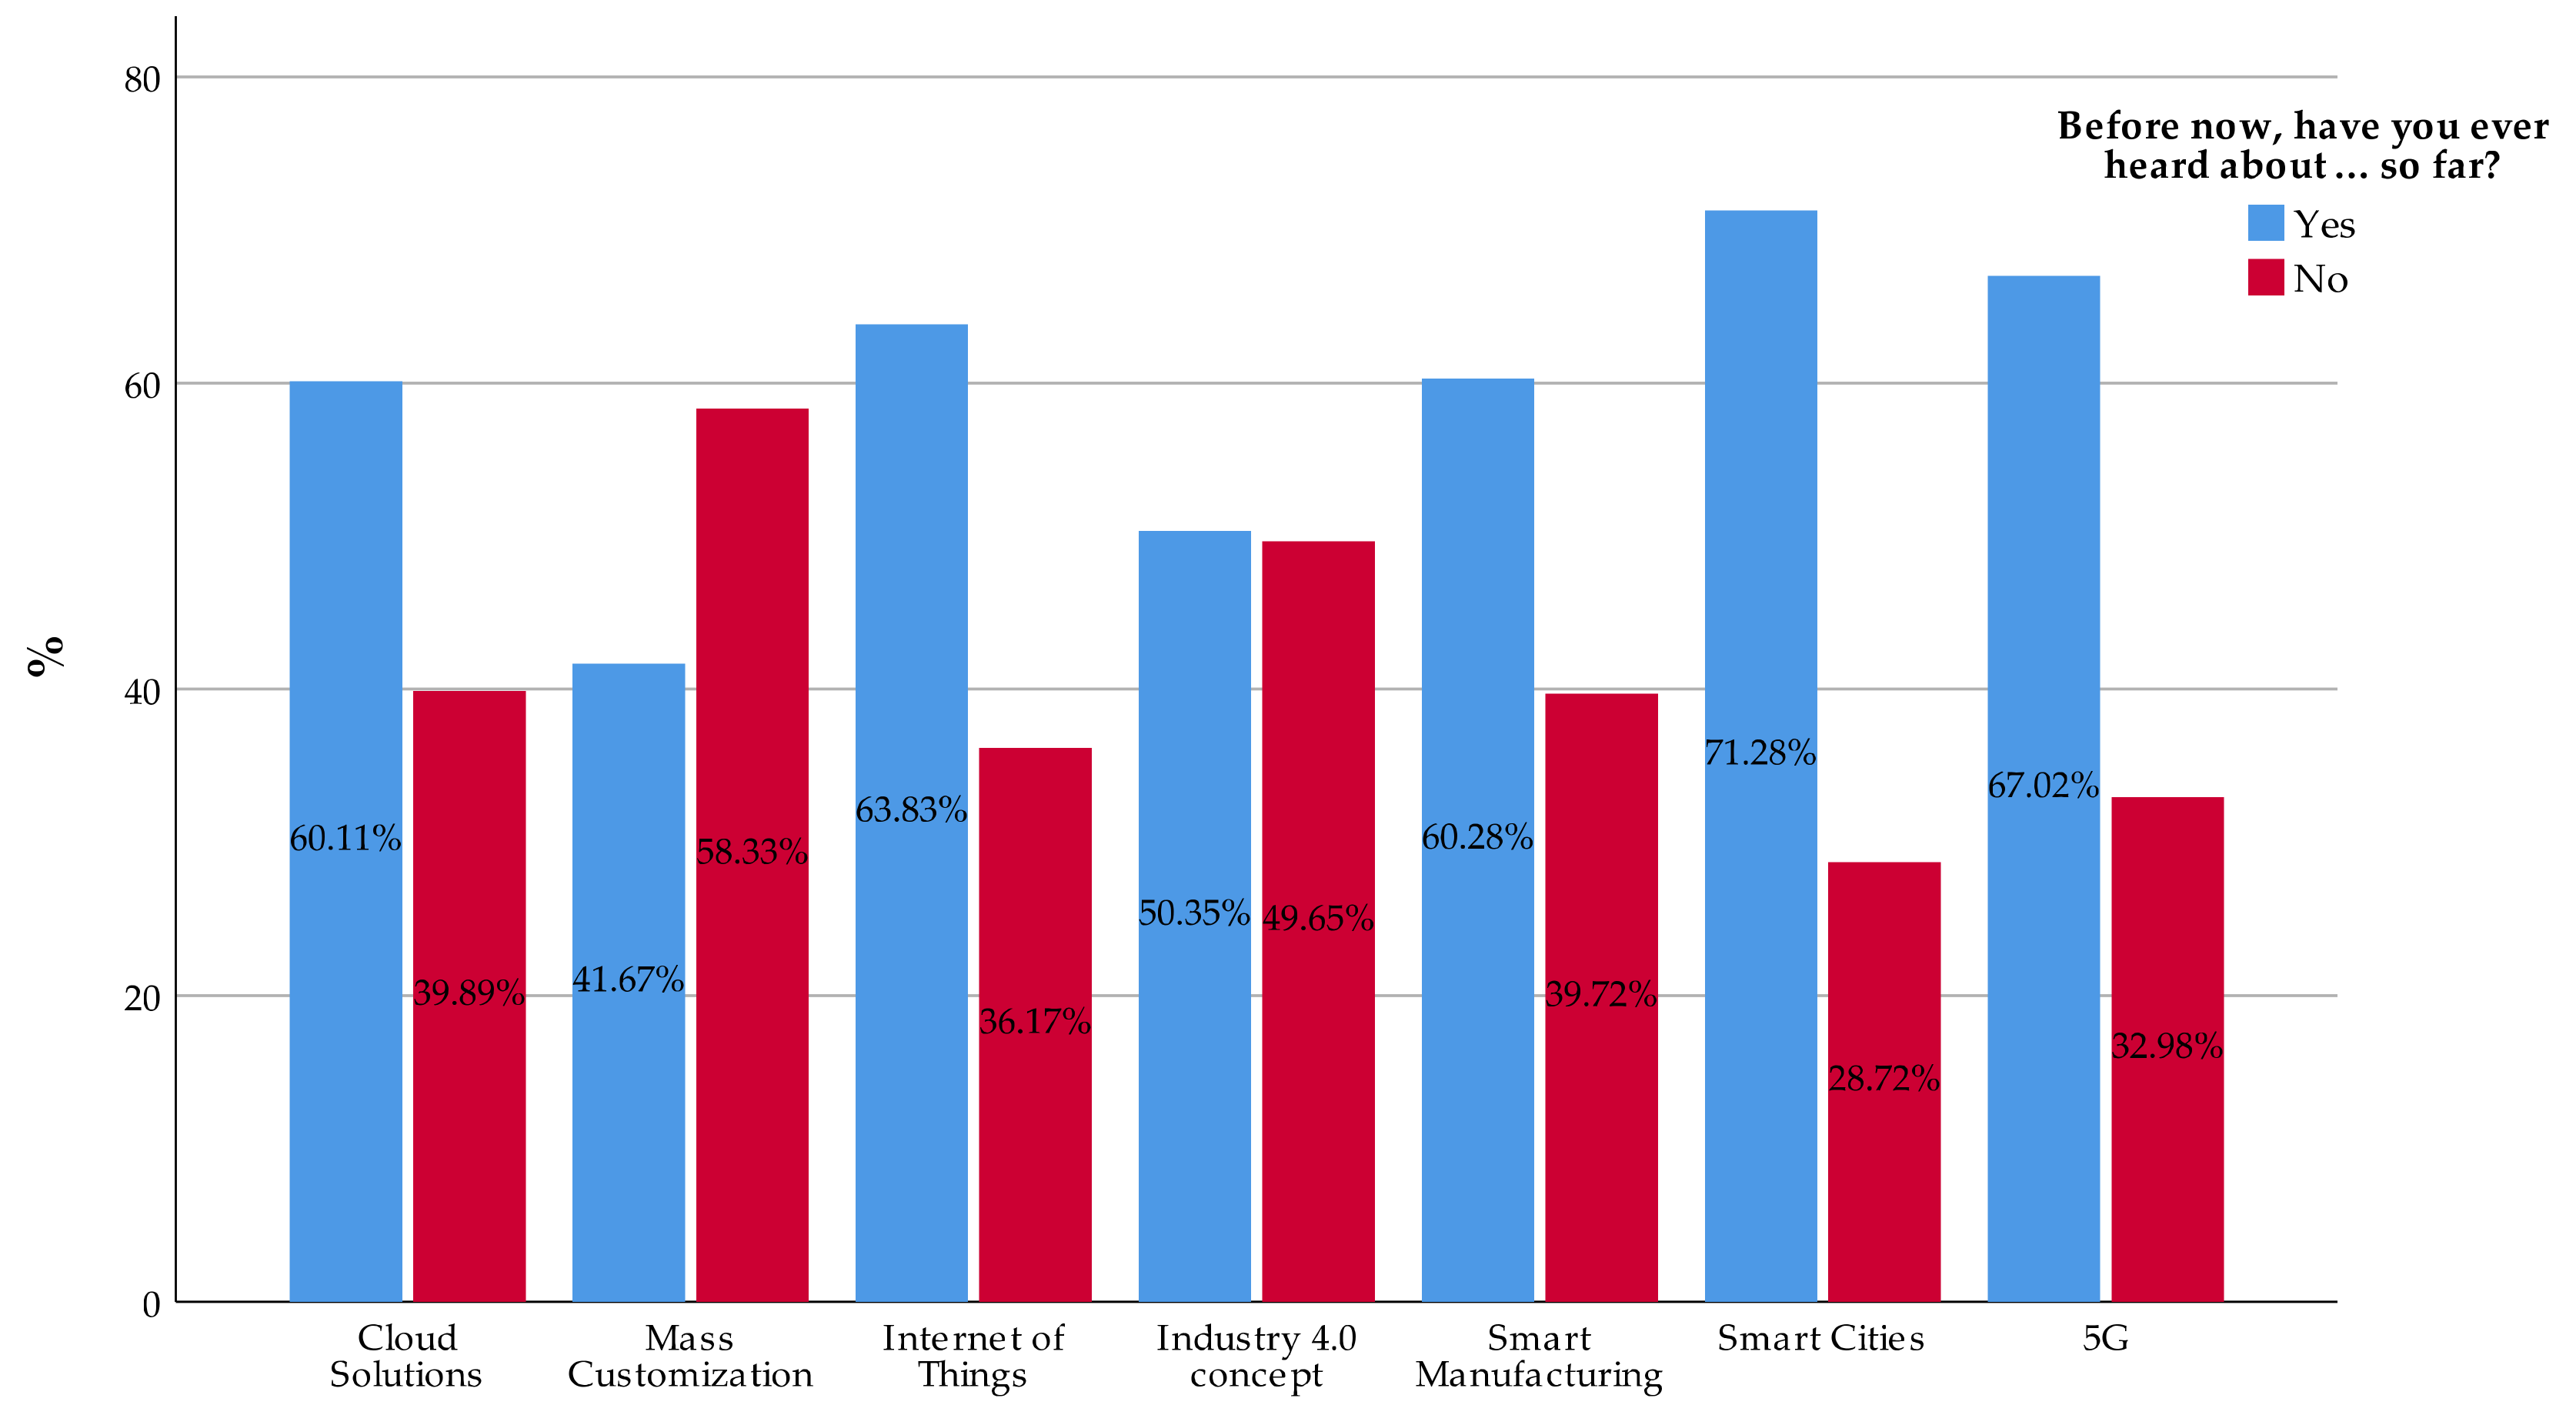
Firstly, we asked our respondents if they ever heard about key terms related to 4th industrial revolution. As presented in Figure 2, the term “mass customization” is not known by almost 60% of respondents, while, more importantly, the term “Industry 4.0” is unknown to 49.6% of respondents. Rather than focusing only on simple percentage points-presentations of answers observed, we examined and focused mainly on dependences between key answers on a statistically significant basis, as presented further in this chapter.
Before examining key aspects of this survey, we took the first step by examining dependence between age, education, and such awareness. In all tables below, Chi-square statistic (Χ2) and p-value (Sig.) are presented for each row question, as inevitable assumptions for further column proportions comparison. Χ2 refers to Pearson Chi-Square statistic value, obtained by Chi-square test in SPSS, which tests the hypothesis that two variables (row and column) are independent. Sig. refers to significance value, which has the information we are looking for. The lower the Sig., the less likely it is that two variables are unrelated. When the significance value is less than 0.05, we can conclude that there is a relationship between two variables. To understand the relationship between row and column variables, we examine the crosstabulation tables with results of the column proportions tests. As we mentioned in previous section, the column proportions test shows whether the proportion in one column is significantly different from the proportion in the other column. The test assigns a letter key (A, B, C) to each category reported in column variables. We used three significance levels: 0.05 *; 0.01 **; 0.001 ***. Column proportion tests are performed by z-test, and tests are adjusted for all pairwise comparisons within a row of each innermost sub-table using the Bonferroni correction (see Sedgwick [50]). Below we provide Table 2, where statistically significant relationship between answers ”No” to above mentioned general awareness questions and education “Higher Secondary and below” can be observed. We find this in line with basic logic that ongoing and deeper education opens possibilities and provides information about new approaches and cutting-edge trends. Similarly, we find a logical relationship within our answers, that higher education (Doctorate, Medical, or Law degree or higher) goes with higher age of the respondent. However, we consider the fact that 46.4% (45.3%) of the group “Higher Secondary and below” answered “No” when asked about “Cloud solutions” (“Internet of Things”), as a result of teaching plans that are not updated sufficiently, not the respondents’ inability to learn about possibilities linked to I4.0.
In Table 2, the column proportions test assigns a letter key, (A) or (B), to each category of question Q10–Q17. (A) refers to the answers “No” and (B) to the answers “Yes”. The row variables are “Age” and “Education”, which have four categories of answers. The two-sided asymptotic significance of chi-square statistics adjusted by Bonferroni correction is less than 0.05 * in all comparisons, except comparison between “Age” and “Mass Customization” (Sig. 0.100). The Sig. value (0.000 ***) is less than 0.001, therefore statistically significant. For the column proportions test associated with the age group “25 or below” and the answers to question Q10, the B key appears in the column “No”.
Thus, we can conclude that the proportion of respondents aged “25 or below”, who answered the question Q10 about cloud solutions negatively, is greater than the proportion of respondents that answered the question Q10 positively (aged “25 or below”). The same results are listed between the respondents aged “25 or below” and other questions, except the Q11 about mass customization. For the tests associated with “Education”, the results indicate the same in the case of “Higher Secondary and below” education for all questions Q10–Q17.
We would like to highlight the relationship between the age group “25 or below” and answers “No” to general questions. In absolute terms, 56.0%, and 41.4%, respectively, of group “25 or below” answered “No” to questions addressing Industry 4.0 and IoT as a crucial stage of 4th industrial revolution, respectively. We consider this as a very poor informational level, especially within the young and flexible group of workers entering labor market. On the contrary, 79.8% (46.6%) of this group is using WhatsApp (Facebook) almost daily, therefore we cannot explain this level of awareness as a result of insufficient conditions for obtaining information or being digitally isolated. Motyl et al. [49] conducted a survey of more than 460 students at three different universities in Italy about the Industry 4.0 concept. The authors point out the importance of the digital behavior of the young people, whose relationship with digital world and services are very important for their further social, but also economic development, ultimately for the development of the region or country. We agree with the authors that in today’s environment, it is important to empower a broader knowledge of the general I4.0 concepts and bring well-structured action plans into the educational process. These conclusions should emphasize, on the one hand, the role of education, and the SMEs on the other, which are dependent on an educated workforce in the terms of I4.0 and related IoT.
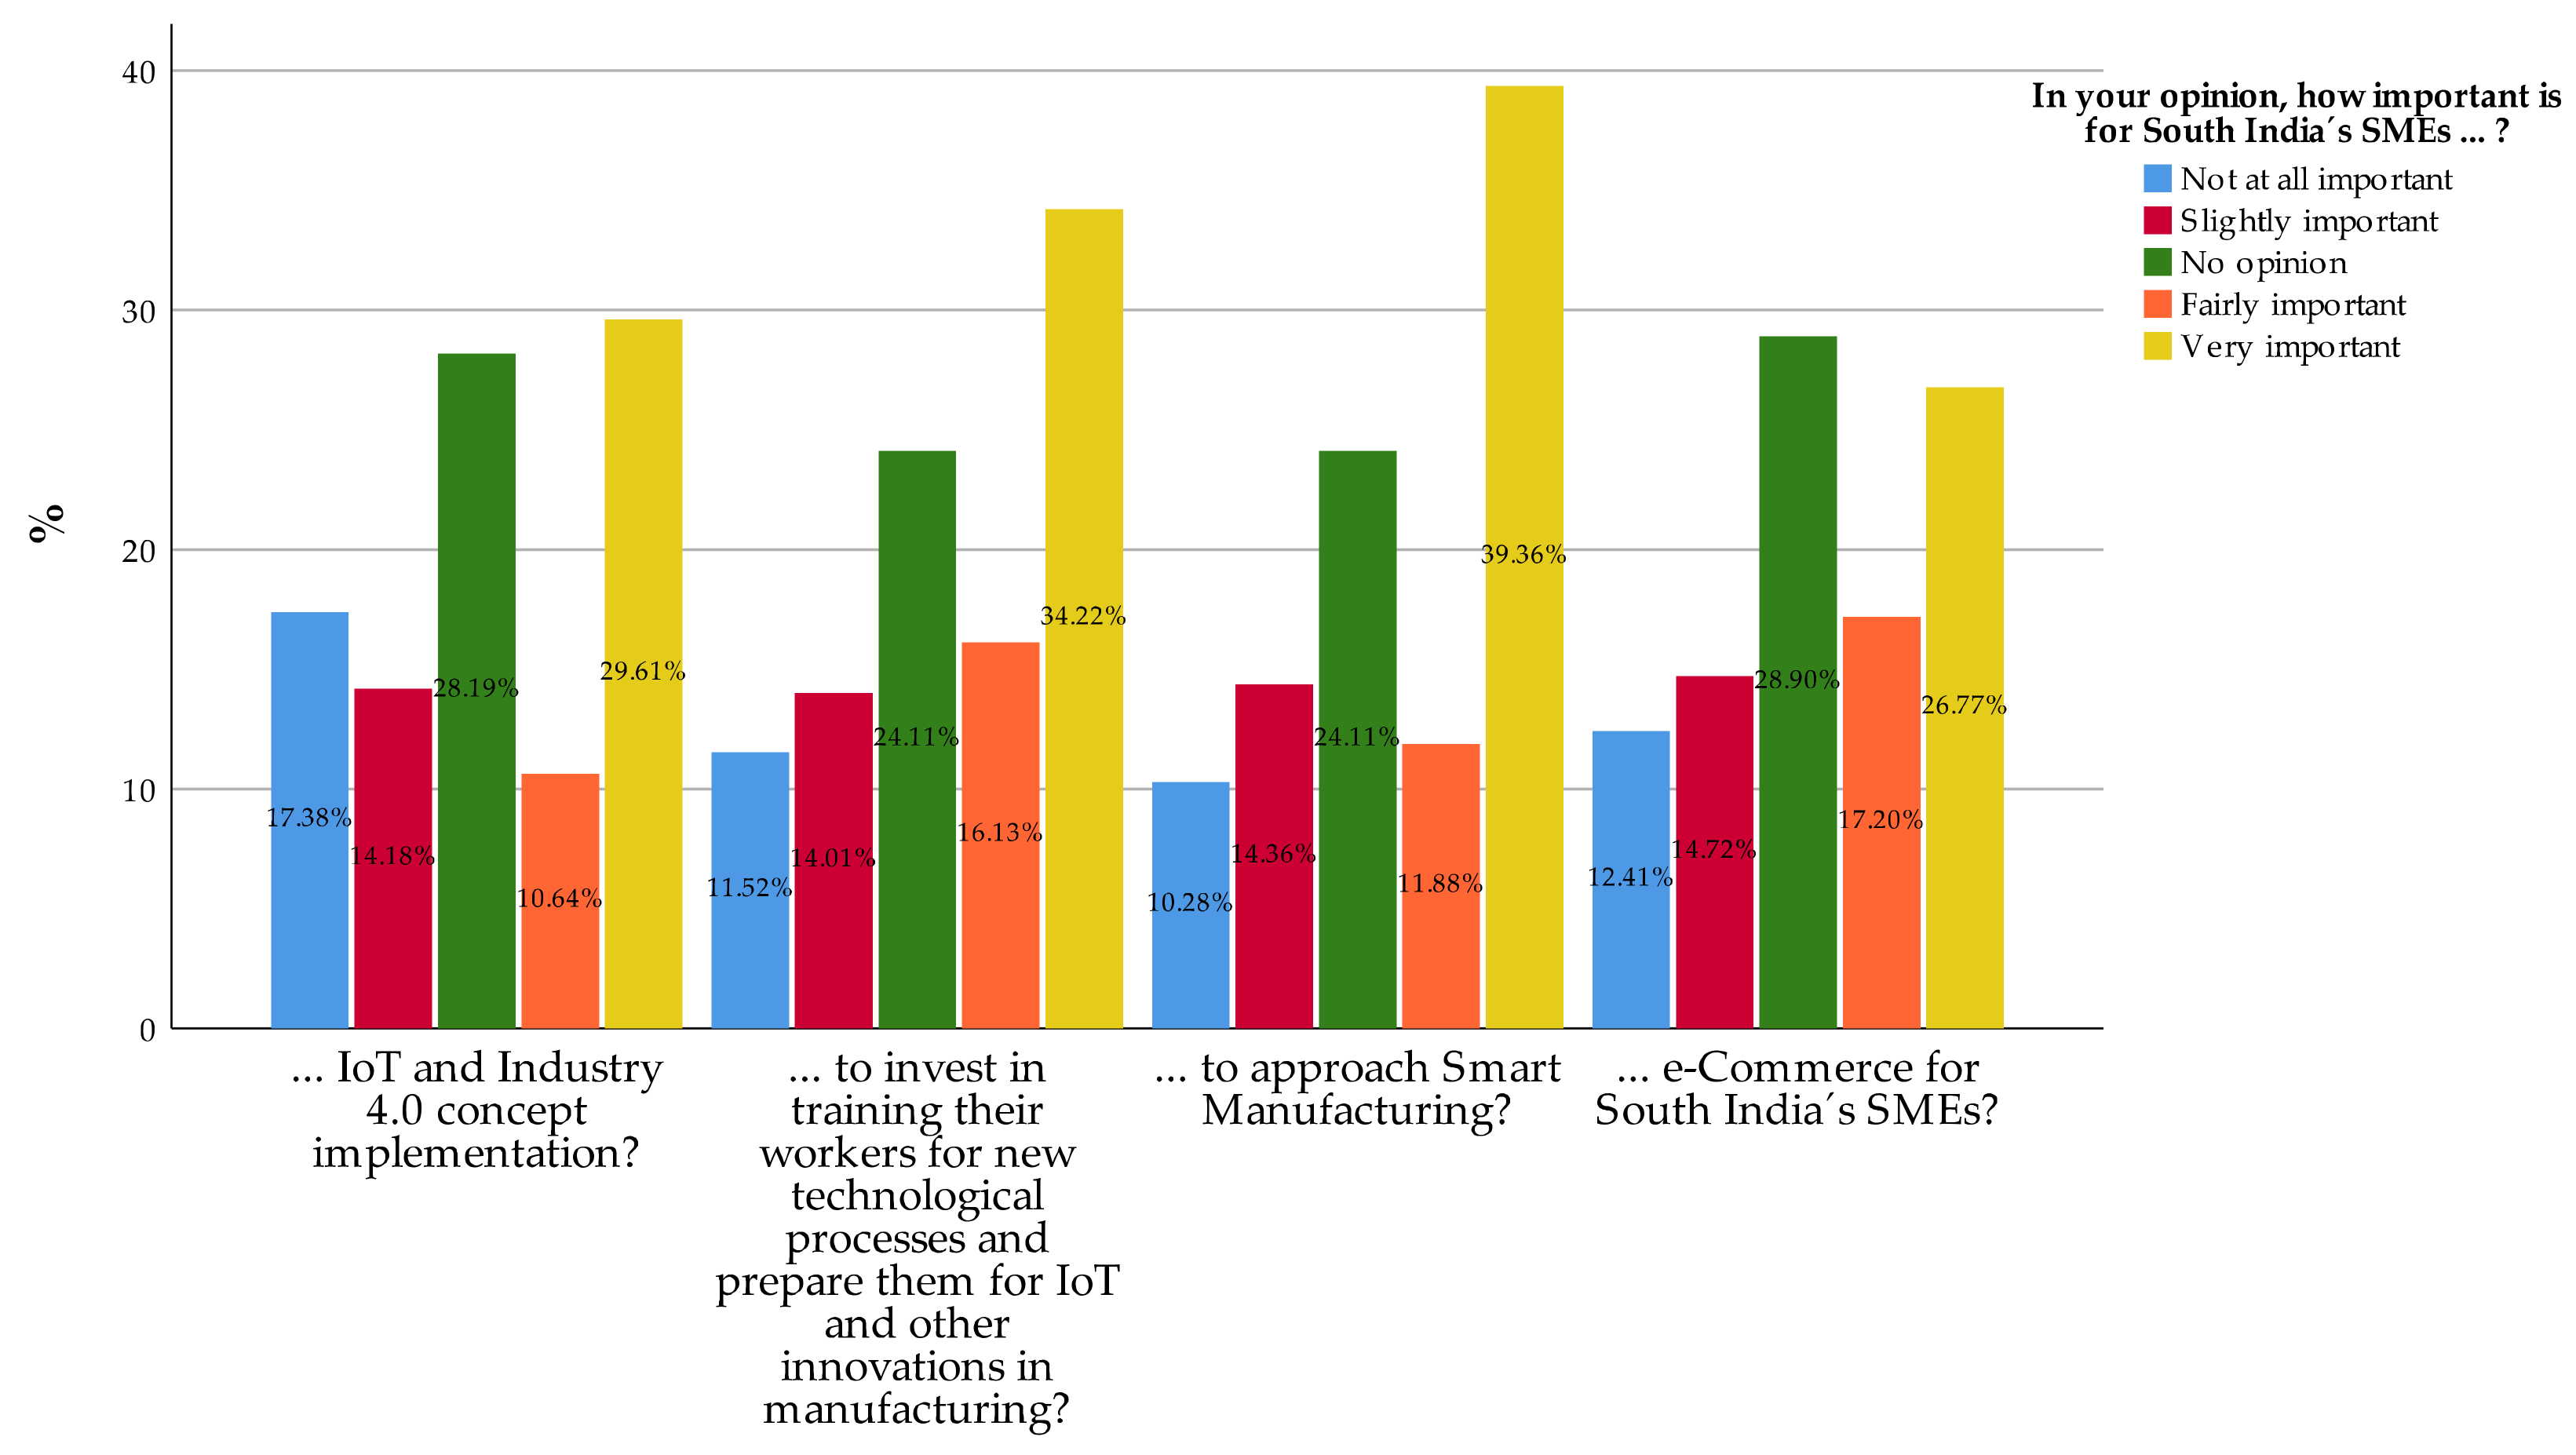
The second part contains information about the importance of several aspects of doing business from the perspective of respondents, considering SMEs. We present Figure 3 with questions Q18, Q21, Q22, and Q23. We observed a relatively high proportion of responds without any clear opinion regarding each question, while almost one quarter of respondents consider investing in training of workers as “Not at all important”. Such attitudes we consider as negative, while on the other hand, almost 40% of respondents consider approaching smart manufacturing as very important.
In Table 3 below, each column refers to awareness questions mentioned above, and each row refers to questions regarding IoT, I4.0, smart manufacturing, e-commerce, and investing in workers’ education.
We then expected the row questions (Q18, Q21–Q23) and column variables (Q10–Q17) would suggests some proportional relations. The fact is, that almost in all situations (where the questions Q18, Q21–Q23 were answered “No opinion”, respectively “I don’t know”), the proportion of respondents who answered the questions Q10–Q17 negatively is greater compared to the proportion of respondents who answered these questions positively. We argue that such statistical evidence of inability to form an opinion or express expectation stems from obvious lack of information. Stentoft et al. [45] also conclude that the lack of information and knowledge about Industry 4.0 and the lack of employee’s readiness are among the main barriers for Industry 4.0. On the contrary, proportion of respondents who answered the questions Q10–Q17 positively is greater compared to the proportion of respondents with negative answers, if we are considering answers “very important” or “fairly important” regarding questions Q18 and Q21–Q23. A possible and logical explanation could be that respondents realize importance of successful transformation of the industries due to previous, at least basic, knowledge about questioned aspects. The most attention grabbing at this stage was, however, finding relations between answers “not at all important” to questions Q18, Q21–23, and questions Q10–Q17 that were answered as “No”. The proportion of respondents answering questions Q12, Q14, and Q15 as “No” that also answered Q22 (regarding approaching smart manufacturing from SMEs perspective) as “Not at all important” was significantly higher than the proportion of respondents answering Q12, Q14, and Q15 as “Yes”. In total, 10.3% of respondents answered Q22 as “Not at all important”, 14.4% answered “Slightly important”, and 24.1% answered “No opinion” (or “I don’t know”), which makes together 48.8%. We can observe a similar relationship between answers “No” to Q12 and Q14 and answers “Not at all important” to question Q18, addressing importance of implementation of I4.0 from SMEs perspective. Additionally, the relationship between respondents answering Q13 regarding I4.0 as “No” and Q21 addressing investing in training workers answering as “Not at all important” is alarming. This could be seen as a lack of information about inevitable changes in the coming future translating into unclear thoughts about crucial education and training for current and potential employees. This is in contrast with consensus among the authors [46,47,48] that proper education and requalification is necessary, especially regarding current dynamics throughout the industries.
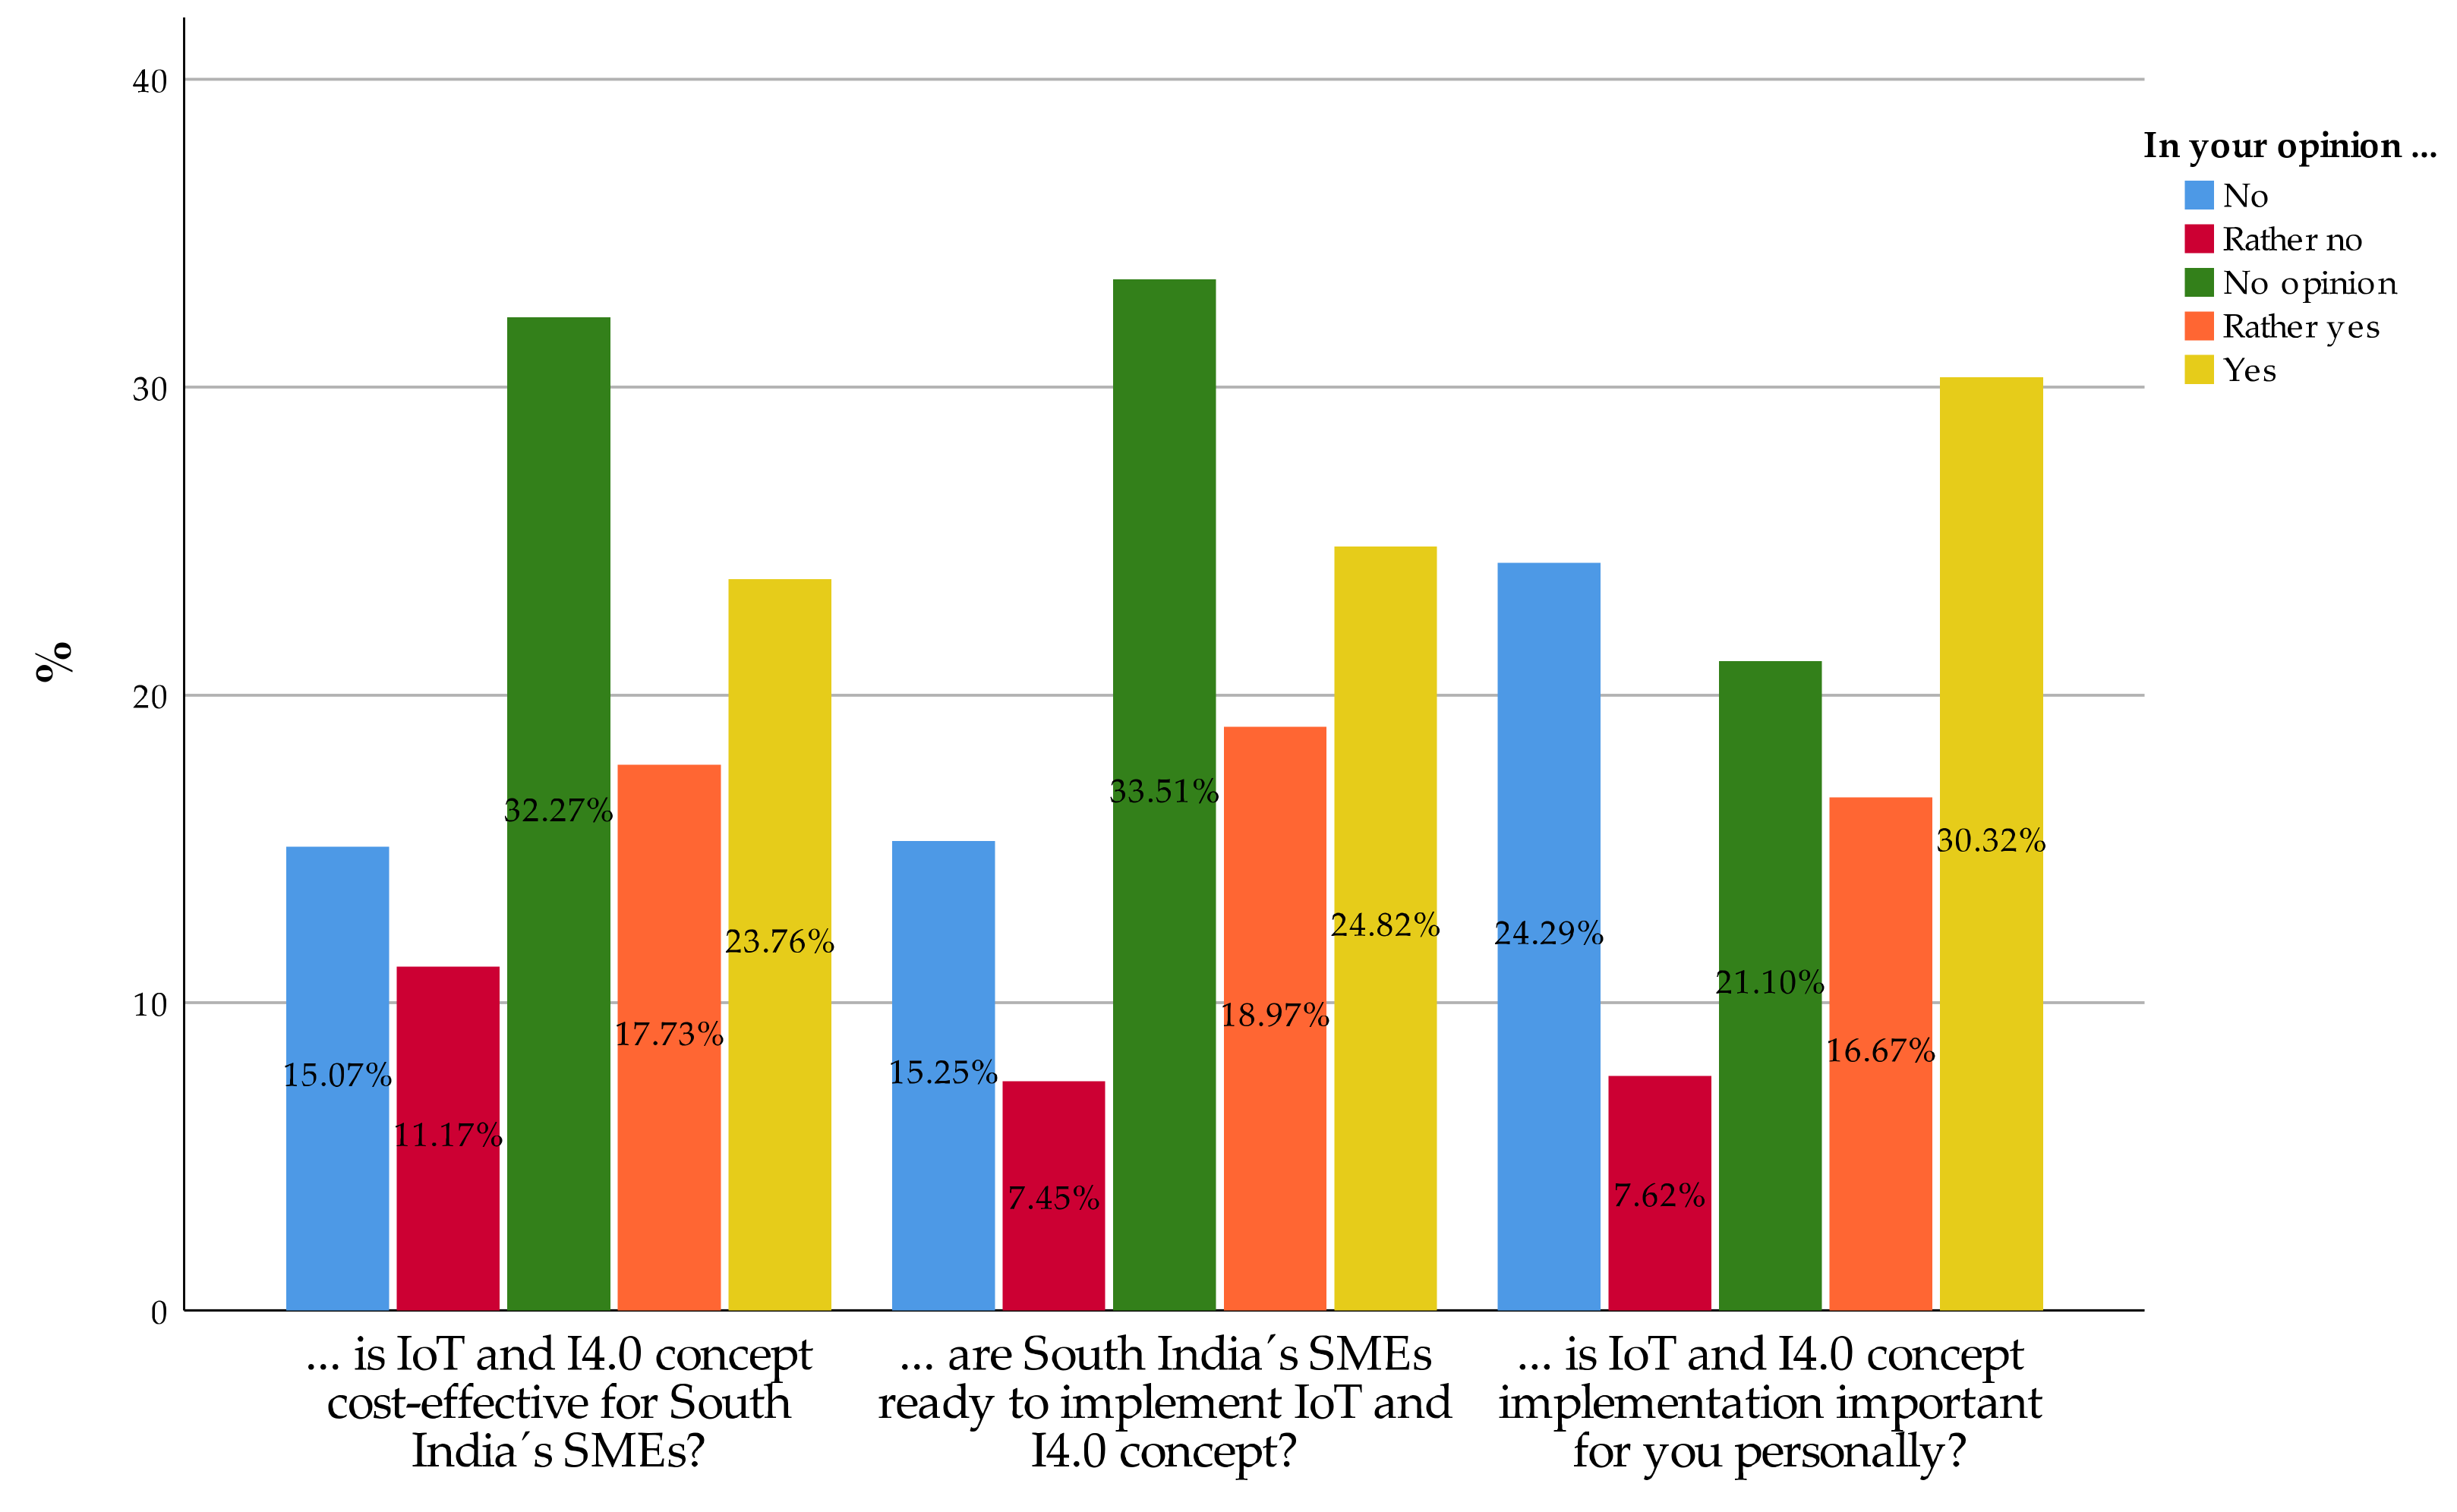
Responds to the questions Q19, Q20, and Q25 are presented further in the Figure 4. The respondents were able to choose one of five options: “No”; “Rather no”; “No opinion” (referring also to “I don’t know”); “Rather yes”; “Yes”. In each of these questions, we can see a high proportion of respondents who replied to all questions with the “No opinion” (“I don’t know”). In Q19, it was more than 32% of respondents, in Q20 more than 33%, and in Q25 more than 21%. This again points towards a lack of information resulting in an inability to form an opinion regarding the issue. On the other hand, the answers “No” and “Rather no” opened further questions that we attempted to examine. Within the age group “25 or below”, more than 16% of respondents think that IoT concept will be ineffective for South India’s SMEs. Almost 34% of the respondents within this group reported “No opinion”. Examining performance of this group also on other questions, we observed nearly 17% of the respondents claiming the SMEs in South India are not ready to implement IoT and I4.0 concept, and as many as 36% of the respondents were unable to make a judgement. For more than 27% of the respondents aged “25 or below”, the I4.0 concept is personally unimportant. More than 24% of respondents from the whole sample do not consider the IoT and I4.0 concept as important from a personal point of view.
These results are further examined against general awareness in the Table 4. Similarly, we applied column proportions test. For each combination of testing, we also point to the value of the asymptotic significance statistic (Sig.), which in all cases is less than 0.05 * level, and thus variables are related. This table includes also a comparison of the answers to question Q27, which is focused on whether respondents expect any Smart City in South India within the next 10 years. In proportional testing, we found that in three cases (Q12, Q14, and Q17), the Sig. value is higher than the confidence level 0.05 * (0.100; 0.091; 0.234). In such cases, we consider these variables as independent.
We highlight the high portion of “No opinion” (“I don’t know”) answers observed within the set of questions Q19, Q20, and Q25, related to answers “No” (questions Q10–Q17). A similar pattern was observed and described in Table 2. One concern could be potential complexity or difficulty of questions Q19 and Q20, therefore forming a substantiated opinion could be harder for respondent. On the contrary, inability to take a personal stance towards I4.0 and related IoT, we explain as lack of sufficient information, as described previously. Additionally, on a personal level, implementation of I4.0 and IoT (Q25) is not important for respondents answering Q12 and Q13. In total, 24.3% (7.6%) of respondents answered “No” (“Rather no”) to a question Q25.
Regarding question Q27, where respondents were asked if they see any Smart City within the region in the next 10 years, in total almost 74% answers were positive, which is rather overconfident, especially in contrast to other studies [28] examining current state of art in India. Putting this question in the context of questions Q10–Q17 results in similar outcomes as for previous sets of questions, where negative answer to Q10–Q17 are related to negative answer addressing Smart City. On the other hand, proportion of respondents answering Q27 positively, that answered also Q10–Q17 positively, is higher on the statistically significant basis than the proportion of those who answered Q10–Q17 negatively.
Thus, we find implementation of any I4.0 related features difficult from non-technical point of view, if respondents’ expectations are negative towards companies. On the other hand, throughout each set of questions, we observe a significantly higher proportion of respondents expecting rather positive impacts within questioned aspects, that have previous knowledge or information (which should be also considered as a part of intellectual capital [51]) about key terms addressed in the first part compared to those without such information. To add on, respondents with previous experience with IoT and I4.0 expressed positive expectations with higher frequency compared to those without such experience. On the contrary, we consider some responds to questions addressing Smart cities in South India (Q27), or readiness of SMEs for implementing IoT and I4.0 (Q20), as rather over-confident, considering the current state of art not only in South India [28]. Such observations could however stem from possible drawbacks as sampling error. Other possible limitations could be that only main results are presented. The survey was prepared only in South India’s region with high representation of people of state Tamil Nadu, which could lead to possible biasedness. Additionally, authors realize that a higher proportion of employees of SMEs in the survey could lead to more valuable outcomes. Thus, we recommend further examination of the mentioned region because of its huge demographic potential. Possible improvement of the conducted research should be expanding the sample, or expert surveys with representatives of employee associations and other social parties.
5. Conclusions
In this paper, we attempted to examine general awareness, opinions, and attitudes of South India’s inhabitants towards Industry 4.0 and its features. Contrary to the majority of studies examining I4.0 readiness and implications, we oriented our research towards citizens rather than SMEs. Conducting a survey using a questionnaire, we gathered unique answers containing crucial information about current state of art regarding addressed issues, the same as future expectations. Besides simple counts of answers, we provided also testing of interdependences between general awareness questions, and several sets of questions addressing various issues.
The main findings suggest that general awareness is quite low (almost 50% of respondents have no prior information of Industry 4.0), which consequently leads to inability to form any opinion regarding effects of such new trends on working and personal life, the same as on living and business environment. Respondents with insufficient knowledge of I4.0 and related IoT then tend to answer negatively regarding questions about possible transformation of SMEs towards I4.0, or they are unable to form any opinion regarding addressed aspects. On the contrary, respondents possessing prior information or knowledge regarding I4.0 and related IoT as its crucial part expressed positive expectations in general. We argue that this approach provides us with important information described in detail in previous section, that should serve as steppingstone in forming a sustainable strategy of implementing I4.0 features for both large enterprises and SMEs. From the perspective of sustainability of the transformation process towards competitive and functional I4.0 environment, we therefore highlight the importance of proper skills, education, working conditions, and informational level, which we consider, to some extent, in line with other studies examining sustainable management and development as a part of I4.0 linked research [6,26,39]. To conclude, improving education and providing proper information is crucial from the authors’ perspective.
Based on examined interdependences, we argue that proper education and relevant information dissemination is non-technical, however crucial, in order to achieve a sustainable transformation process of the current environment in South India towards Industry 4.0 and its features. Since we find this approach rather extraordinary, similar survey-based studies in other regions should provide comparable results, and consequently form a broader picture of inhabitants’ preparedness and awareness of I4.0.
Supplementary Materials
The following are available online at https://0-www-mdpi-com.brum.beds.ac.uk/2071-1050/12/8/3207/s1.
Author Contributions
Conceptualization, L.S. and J.S.; methodology, L.S. and J.S.; validation, Darya Dancaková; formal analysis, J.S.; investigation, L.S. and J.S.; resources, L.S., J.S.; writing—original draft preparation, L.S., J.S. and D.D.; writing—review and editing, M.W.; editing and visualization, J.S. and D.D.; supervision, M.W.; project administration, M.W., L.S., and J.S. All authors have read and agreed to the published version of the manuscript.
Funding
This research was funded by the Scientific Grant Agency of the Slovak Republic VEGA, grant number 1/0430/19. This research work is part of actual research activities in the project with acronym SME 4.0, and titled as “SME 4.0—Smart Manufacturing and Logistics for SMEs in an X-to-order and Mass Customization Environment”, from the European Union’s Horizon 2020 research and innovation program under the Marie Sklodowska-Curie grant agreement No 734713.
Acknowledgments
Authors express gratitude for tremendous support and help to Prof. Naavendra Krishnan, Prof. Sudhakara Pandian, and all SACS MAVMM staff during authors’ stay in Madurai, Tamil Nadu.
Conflicts of Interest
The authors declare no conflict of interest.
References
- Ramsauer, C. Industrie 4.0–Die Produktion der Zukunft. WINGbusiness 2013, 3, 6–12. [Google Scholar]
- Kiel, D.; Arnold, C.; Collisi, M.; Voigt, K.I. The impact of the industrial internet of things on established business models. In Proceedings of the 25th International Association for Management of Technology (IAMOT) Conference, Orlando, FL, USA, 15–19 May 2016; pp. 673–695. [Google Scholar]
- Lasi, H.; Fettke, P.; Kemper, H.G.; Feld, T.; Hoffmann, M. Industry 4.0. Bus. Inf. Syst. Eng. 2014, 6, 239–242. [Google Scholar] [CrossRef]
- Posada, J.; Toro, C.; Barandiaran, I.; Oyarzun, D.; Stricker, D.; de Amicis, R.; Vallarino, I. Visual computing as a key enabling technology for industrie 4.0 and industrial internet. IEEE Comput. Graph. Appl. 2015, 35, 26–40. [Google Scholar] [CrossRef] [PubMed]
- Valdez, A.C.; Brauner, P.; Schaar, A.K.; Holzinger, A.; Ziefle, M. Reducing complexity with simplicity-usability methods for industry 4.0. In Proceedings of the 19th triennial congress of the IEA, Melbourne, Australia, 9–14 August 2015; p. 14. [Google Scholar]
- Thestrup, J.; Sorensen, T.F.; De Bona, M. Using Conceptual Modeling and Value Analysis to Identify Sustainable m> Business Models in Industrial Services. In Proceedings of the 2006 International Conference on Mobile Business, Copenhagen, Denmark, 26–27 June 2006; p. 7. [Google Scholar]
- Brock, D. The Compact Electronic Product Code—a 64-Bit Representation of the Electronic Product Code. Auto-ID White Paper MIT-AUTOID-WH-008. 2001. [Google Scholar]
- ITU Internet Reports. The internet of things; International Telecommunication Union (ITU): Geneva, Switzerland, 2005. [Google Scholar]
- Harbor Research. Machine-To-Machine (M2M) and Smart Systems Market Opportunity 2010–2014; Harbor Research, Inc.: Denver, CO, USA, 2011; Available online: http://www.windriver.com/m2m/edk/Harbor_Research-M2M_and_Smart_Sys_Report.pdf (accessed on 12 January 2020).
- Safar, L.; Sopko, J.; Bednar, S.; Poklemba, R. Concept of SME business model for industry 4.0 environment. TEM J. 2018, 7, 626–637. [Google Scholar]
- Sundmaeker, H.; Guillemin, P.; Friess, P.; Woelfflé, S. Vision and challenges for realising the Internet of Things. Clust. Eur. Res. Proj. Internet Things Eur. Commision 2010, 3, 34–36. [Google Scholar]
- Cui, X. The internet of things. In Ethical Ripples of Creativity and Innovation; Palgrave Macmillan: London, UK, 2016; pp. 61–68. [Google Scholar]
- Strandhagen, J.W.; Alfnes, E.; Strandhagen, J.O.; Vallandingham, L.R. The fit of Industry 4.0 applications in manufacturing logistics: A multiple case study. Adv. Manuf. 2017, 5, 344–358. [Google Scholar] [CrossRef] [Green Version]
- Modrak, V.; Bednar, S. Using Axiomatic Design and Entropy to Measure Complexity in Mass Customization. Procedia CIRP 2015, 34, 87–92. [Google Scholar] [CrossRef] [Green Version]
- Modrak, V.; Bednar, S. Entropy Based versus Combinatorial Product Configuration Complexity in Mass Customized Manufacturing. Procedia CIRP 2016, 41, 183–188. [Google Scholar] [CrossRef] [Green Version]
- Ślusarczyk, B. INDUSTRY 4.0 – ARE WE READY? Pol. J. Manag. Stud. 2018, 17, 232–248. [Google Scholar] [CrossRef]
- Thoben, K.-D.; Wiesner, S.; Wuest, T. BIBA – Bremer Institut für Produktion und Logistik GmbH, the University of Bremen; Faculty of Production Engineering, University of Bremen, Bremen, Germany; Industrial and Management Systems Engineering, “Industrie 4.0” and Smart Manufacturing – A Review of Research Issues and Application Examples. Int. J. Autom. Technol. 2017, 11, 4–16. [Google Scholar]
- Schröder, C.; Schlepphorst, S.; Kay, R. Bedeutung der Digitalisierung im Mittelstand (No. 244) IfM-Materialien; Institut für Mittelstandsforschung (IfM): Bonn, Germany, 2015. [Google Scholar]
- Kovacs, O. The dark corners of industry 4.0–Grounding economic governance 2.0. Technol. Soc. 2018, 55, 140–145. [Google Scholar] [CrossRef]
- Eberhard, B.; Podio, M.; Alonso, A.P.; Radovica, E.; Avotina, L.; Peiseniece, L.; Caamaño Sendon, M.; Gonzales Lozano, A.; Solé-Pla, J. Smart work: The transformation of the labour market due to the fourth industrial revolution (I4. 0). Int. J. Bus. Econ. Sci. Appl. Res. 2017, 10, 47–66. [Google Scholar]
- Dallasega, P.; Woschank, M.; Zsifkovits, H.; Tippayawong, K.; Brown, C.A. Requirement Analysis for the Design of Smart Logistics in SMEs. In Industry 4.0 for SMEs; Springer: Berlin/Heidelberg, Germany, 2020; pp. 147–162. [Google Scholar]
- Zsifkovits, H.E.; Woschank, M. Smart Logistics–Technologiekonzepte und Potentiale. BHM Berg- Hüttenmännische Monatshefte 2019, 164, 42–45. [Google Scholar] [CrossRef] [Green Version]
- Dallasega, P.; Woschank, M.; Ramingwong, S.; Tippayawong, K.; Chonsawat, N. Field study to identify requirements for smart logistics of European, US and Asian SMEs. In Proceedings of the International Conference on Industrial Engineering and Operations Management Bangkok, Bangkok, Thailand, 5–7 March 2019; pp. 844–855. [Google Scholar]
- Chaopaisarn, P.; Woschank, M. Requirement Analysis for SMART Supply Chain Management for SMEs. In Proceedings of the International Conference on Industrial Engineering and Operations Management Bangkok, Bangkok, Thailand, 5–7 March 2019; pp. 3715–3725. [Google Scholar]
- Wolter, M.I.; Mönnig, A.; Hummel, M.; Schneemann, C.; Weber, E.; Zika, G.; Neuber-Pohl, C. Industry 4.0 and the Consequences for Labour Market and Economy: Scenario Calculations in Line with the BIBB-IAB Qualifications and Occupational Field Projections (Industrie 4.0 und die Folgen für Arbeitsmarkt und Wirtschaft: Szenario-Rechnungen im Rahmen der BIBB-IAB-Qualifikations-und Berufsfeldprojektionen) (No. 201508_en). Institut für Arbeitsmarkt-und Berufsforschung (IAB); Institute for Employment Research: Nuremberg, Germany, 2015. [Google Scholar]
- Bonilla, S.H.; Silva, H.R.O.; da Silva, M.T.; Goncalves, R.F.; Sacomano, J.B. Industry 4.0 and Sustainability Implications: A Scenario-Based Analysis of the Impacts and Challenges. Sustainability 2018, 10, 3740. [Google Scholar] [CrossRef] [Green Version]
- The Countries with the Highest Density of Robot Workers. Available online: https://0-www-statista-com.brum.beds.ac.uk/chart/13645/the-countries-with-the-highest-density-of-robot-workers/ (accessed on 10 January 2019).
- Iyer, A. Moving from Industry 2.0 to Industry 4.0: A case study from India on leapfrogging in smart manufacturing. Procedia Manuf. 2018, 21, 663–670. [Google Scholar] [CrossRef]
- World Bank. Global Economic Prospects, June 2018: The Turning of the Tide. In Global Economic Prospects; World Bank: Washington, DC, USA, 2018. [Google Scholar]
- India Manufacturing Report by Indian Brand Equity Forum. Available online: www.ibef.org (accessed on 12 January 2020).
- Chandran, S.; Poklemba, R.; Sopko, J.; Šafár, L. Organizational Innovation and Cost Reduction Analysis of Manufacturing Process–Case Study. Manag. Syst. Prod. Eng. 2019, 27, 183–188. [Google Scholar] [CrossRef]
- Goswami, H. Opportunities and challenges of digital India programme. Int. Educ. Res. J. 2016, 2, 78–79. [Google Scholar]
- Skill India Portal. Available online: https://www.skillindia.gov.in (accessed on 12 January 2020).
- Directorate of Intelligence. “CIA–World Factbook”. Available online: https://www.cia.gov/library/publications/the-world-factbook/index.html (accessed on 12 January 2019).
- Census 2011 (Final Data)-Demographic Details, Literate Population (Total, Rural Urban). Planning Commission, Government of India. Available online: http://www.planningcommission.gov.in (accessed on 12 January 2020).
- Matt, D.T.; Rauch, E. SME 4.0: The Role of Small-and Medium-Sized Enterprises in the Digital Transformation. In Industry 4.0 for SMEs; Springer: Berlin/Heidelberg, Germany, 2020; pp. 3–36. [Google Scholar]
- Burgess, S. (Ed.) Managing Information Technology in Small Business: Challenges and Solutions: Challenges and Solutions; IGI Global: Hershey, PA, USA, 2001. [Google Scholar]
- Kagermann, H. Change through digitization—Value creation in the age of Industry 4.0. In Management of Permanent Change; Springer: Berlin/Heidelberg, Germany, 2015; pp. 23–45. [Google Scholar]
- Ingaldi, M.; Ulewicz, R. Problems with the Implementation of Industry 4.0 in Enterprises from the SME Sector. Sustainability 2020, 12, 217. [Google Scholar] [CrossRef] [Green Version]
- Schwarz, N.; Hippler, H.J. What response scales may tell your respondents: Informative functions of response alternatives. In Social Information Processing and Survey Methodology; Springer: Berlin/Heidelberg, Germany, 1987; pp. 163–178. [Google Scholar]
- Schuman, H.; Presser, S.; Ludwig, J. Context effects on survey responses to questions about abortion. Public Opin. Q. 1981, 45, 216–223. [Google Scholar] [CrossRef]
- Agresti, A.; Kateri, M. Categorical Data Analysis; Springer: Berlin/Heidelberg, Germany, 2011. [Google Scholar]
- Armitage, P.; Berry, G.; Matthews, J.N.S. Statistical Methods in Medical Research; John Wiley Sons: Hoboken, NJ, USA, 2008. [Google Scholar]
- Lin, D.; Lee, C.K.M.; Lau, H.; Yang, Y. Strategic response to Industry 4.0: An empirical investigation on the Chinese automotive industry. Ind. Manag. Data Syst. 2018, 118, 589–605. [Google Scholar] [CrossRef]
- Stentoft, J.; Jensen, K.W.; Philipsen, K.; Haug, A. Drivers and Barriers for Industry 4.0 Readiness and Practice: A SME Perspective with Empirical Evidence. In Proceedings of the 52nd Hawaii International Conference on System Sciences, Maui, HI, USA, 8–11 January 2019. [Google Scholar]
- Coskun, S.; Kayikci, Y.; Gencay, E. Adapting Engineering Education to Industry 4.0 Vision. Technologies 2019, 7, 10. [Google Scholar] [CrossRef] [Green Version]
- Benešová, A.; Tupa, J. Requirements for Education and Qualification of People in Industry 4.0. Procedia Manuf. 2017, 11, 2195–2202. [Google Scholar] [CrossRef]
- Schuster, K.; Groß, K.; Vossen, R.; Richert, A.; Jeschke, S. Preparing for Industry 4.0 – Collaborative Virtual Learning Environments in Engineering Education. Engineering Education 4.0 2016, 4, 477–487. [Google Scholar]
- Moty, B.; Baronio, G.; Uberti, S.; Speranza, D.; Filippi, S. How will Change the Future Engineers’ Skills in the Industry 4.0 Framework? A Questionnaire Survey. Procedia Manuf. 2017, 11, 1501–1509. [Google Scholar] [CrossRef]
- Sedgwick, P. Multiple significance tests: The Bonferroni correction. BMJ 2012, 344, e509. [Google Scholar] [CrossRef]
- Pastor, D.; Glova, J.; Lipták, F.; Kovac, V. Intangibles and methods for their valuation in financial terms: Literature review. Intang. Cap. 2017, 13, 387. [Google Scholar] [CrossRef] [Green Version]
Figure 1.
Stages of survey. Note: * For all types of questions, please see Supplementary Materials.
Figure 1.
Stages of survey. Note: * For all types of questions, please see Supplementary Materials.

Figure 2.
Awareness in general on Industry 4.0.

Figure 3.
The answers to the questions Q18, Q21–Q23.

Figure 4.
The answers to the questions Q19, Q20, and Q25.


Table 1.
Profile of respondents.
| Demographics | N | % | Demographics | N | % |
|---|---|---|---|---|---|
| Gender | Age | ||||
| Female | 147 | 26.1 | 25 or below | 466 | 82.6 |
| Male | 417 | 73.9 | 26–35 | 57 | 10.1 |
| 36–45 | 24 | 4.3 | |||
| Status | 46 and more | 17 | 3.0 | ||
| Student | 438 | 77.7 | |||
| Employed & Entrepreneur | 105 | 18.6 | Residential place | ||
| Houseperson & Retired | 7 | 1.2 | Andaman and Nicobar Islands * | 12 | 2.1 |
| Unemployed | 14 | 2.5 | Andra Pradesh | 6 | 1.1 |
| Karnataka | 10 | 1.8 | |||
| Education | Kerala | 14 | 2.5 | ||
| Higher Secondary and below | 181 | 32.1 | Lakshadweep Islands * | 4 | 0.7 |
| Bachelor | 256 | 45.4 | Pondicherry * | 9 | 1.6 |
| Master | 67 | 11.9 | Tamil Nadu | 507 | 89.9 |
| Doctorate, Medical, Law degree, or higher | 60 | 10.6 | Telangana | 2 | 0.4 |
Note: *Union territory; Source: Prepared by authors.
Table 2.
Awareness vs. Age and Education.
| Q10 | Q11 | Q12 | Q13 | Q14 | Q15 | Q16 | Q17 | ||||||||||
|---|---|---|---|---|---|---|---|---|---|---|---|---|---|---|---|---|---|
| Before Now, Have You Ever Heard about the... | Do You Have Any Previous Experience with IoT or I4.0 Concept? | ||||||||||||||||
| Cloud Solutions So Far? | Mass Customization so Far? | Internet of Things So Far? | Industry 4.0 Concept So Far? (so Called 4th Industrial Revolution) | Smart Manufacturing So Far? | Smart Cities So Far? | 5G So Far? | |||||||||||
| No | Yes | No | Yes | No | Yes | No | Yes | No | Yes | No | Yes | No | Yes | No | Yes | ||
| (A) | (B) | (A) | (B) | (A) | (B) | (A) | (B) | (A) | (B) | (A) | (B) | (A) | (B) | (A) | (B) | ||
| Χ2 | Sig. | 31.512 | 0.000 *** | 6.251 | 0.100 | 33.499 | 0.000 *** | 44.270 | 0.000 *** | 24.811 | 0.000 *** | 27.827 | 0.000 *** | 18.893 | 0.000 *** | 15.197 | 0.002 ** |
| Age | 25 or below | B | B | B | B | B | B | B | |||||||||
| 26-35 | A | A | A | A | A | A | |||||||||||
| 36-45 | A | A | A | A | A | A | |||||||||||
| 46 and more | A | A | A | ||||||||||||||
| Χ2 | Sig. | 11.945 | 0.008 ** | 8.559 | 0.036 * | 28.072 | 0.000 *** | 35.004 | 0.000 *** | 19.037 | 0.000 *** | 53.918 | 0.000 *** | 20.402 | 0.000 *** | 8.560 | 0.036 * |
| Education | Higher Secondary and below | B | B | B | B | B | B | B | B | ||||||||
| Bachelor | A | A | |||||||||||||||
| Master | A | A | A | A | A | A | |||||||||||
| Doctorate, Medical or Law degree, or higher | B | B | A | B | |||||||||||||
Results are based on two-sided tests. For each significant pair, the key of the category with the smaller column proportion appears in the category with the larger column proportion. Χ2 refers to Chi-square statistic. Sig. refers to the two-sided asymptotic significance of the chi-square statistic. Significance level for upper case letters (A, B, C): 0.05 *; 0.01 **; 0.001 ***. Tests are adjusted for all pairwise comparisons within a row of each innermost sub-table using the Bonferroni correction; Source: Prepared by authors.
Table 3.
Awareness vs. importance of the modern environment of doing business regarding SMEs.
| Q10 | Q11 | Q12 | Q13 | Q14 | Q15 | Q16 | Q17 | ||||||||||
| Before now, Have You Ever Heard about the... | Do You Have Any Previous Experience with IoT or I4.0 Concept? | ||||||||||||||||
| Cloud Solutions So Far? | Mass Customization So Far? | Internet of Things So Far? | Industry 4.0 concept So Far? (So Called 4th Industrial Revolution) | Smart Manufacturing So Far? | Smart Cities So Far? | 5G So Far? | |||||||||||
| No | Yes | No | Yes | No | Yes | No | Yes | No | Yes | No | Yes | No | Yes | No | Yes | ||
| Χ2 | Sig. | 125.083 | 0.000 *** | 61.415 | 0.000 *** | 42.886 | 0.000 *** | 71.854 | 0.000 *** | 59.146 | 0.000 *** | 53.016 | 0.000 *** | 50.778 | 0.000 *** | 47.945 | 0.000 *** |
| Q18. In your opinion, is IoT and Industry 4.0 concept implementation important for South India’s SMEs? | Not at all important | B | B | ||||||||||||||
| Slightly important | |||||||||||||||||
| No opinion | B | B | B | B | B | B | B | B | |||||||||
| Fairly important | A | A | A | A | |||||||||||||
| Very important | A | A | A | A | A | A | A | A | |||||||||
| Χ2 | Sig. | 71.830 | 0.000 *** | 16.292 | 0.003 ** | 13.077 | 0.011 * | 28.767 | 0.000 *** | 31.763 | 0.000 *** | 70.570 | 0.000 *** | 46.957 | 0.000 *** | 24.682 | 0.000 *** |
| Q21. In your opinion, how important is it for South India’s SMEs to invest in training their workers for new...? | Not at all important | B | |||||||||||||||
| Slightly important | A | A | |||||||||||||||
| No opinion | B | B | B | B | B | B | B | B | |||||||||
| Fairly important | A | A | A | ||||||||||||||
| Very important | A | A | A | A | A | A | |||||||||||
| Χ2 | Sig. | 36.366 | 0.000 *** | 15.174 | 0.004 ** | 17.773 | 0.001 *** | 18.905 | 0.001 *** | 26.573 | 0.000 *** | 55.685 | 0.000 *** | 21.711 | 0.000 *** | 17.629 | 0.001 *** |
| Q22. In your opinion, how important is it for SMEs in South India to approach Smart Manufacturing? | Not at all important | B | B | B | |||||||||||||
| Slightly important | A | A | A | ||||||||||||||
| No opinion | B | B | B | B | B | B | B | ||||||||||
| Fairly important | A | A | A | ||||||||||||||
| Very important | A | A | A | A | A | ||||||||||||
| Χ2 | Sig. | 104.602 | 0.000 *** | 40.564 | 0.000 *** | 45.056 | 0.000 *** | 61.571 | 0.000 *** | 78.993 | 0.000 *** | 52.549 | 0.000 *** | 63.905 | 0.000 *** | 46.675 | 0.000 *** |
| Q23. In your opinion, how important is e-Commerce for South India’s SMEs? | Not at all important | B | |||||||||||||||
| Slightly important | A | A | |||||||||||||||
| No opinion | B | B | B | B | B | B | B | B | |||||||||
| Fairly important | A | A | A | A | |||||||||||||
| Very important | A | A | A | A | A | A | A | A | |||||||||
Note: “No opinion” refers to “I don’t know”. Results are based on two-sided tests. For each significant pair, the key of the category with the smaller column proportion appears in the category with the larger column proportion. Χ2 refers to Chi-square statistic. Sig. refers to the two-sided asymptotic significance of the chi-square statistic. Significance level for upper case letters (A, B, C): 0.05 *; 0.01 **; 0.001 ***. Tests are adjusted for all pairwise comparisons within a row of each innermost sub-table using the Bonferroni correction.l Source: Prepared by authors.
Table 4.
Awareness vs. questions Q19, Q20, Q25, and Q27.
| Q10 | Q11 | Q12 | Q13 | Q14 | Q15 | Q16 | Q17 | ||||||||||
|---|---|---|---|---|---|---|---|---|---|---|---|---|---|---|---|---|---|
| Before Now, Have You Ever Heard about the... | Do You Have Any Previous Experience with IoT or I4.0 Concept? | ||||||||||||||||
| Cloud Solutions So Far? | Mass Customization So Far? | Internet of Things So Far? | Industry 4.0 Concept So Far? (So Called 4th Industrial Revolution) | Smart Manufacturing So Far? | Smart Cities So Far? | 5G So Far? | |||||||||||
| No | Yes | No | Yes | No | Yes | No | Yes | No | Yes | No | Yes | No | Yes | No | Yes | ||
| (A) | (B) | (A) | (B) | (A) | (B) | (A) | (B) | (A) | (B) | (A) | (B) | (A) | (B) | (A) | (B) | ||
| Χ2 | Sig. | 52.087 | 0.000 *** | 55.046 | 0.000 *** | 28.232 | 0.000 *** | 41.303 | 0.000 *** | 45.401 | 0.000 *** | 17.383 | 0.002 ** | 55.819 | 0.000 *** | 72.579 | 0.000 *** |
| Q19. In your opinion, is IoT and I4.0 concept cost-effective for South India’s SMEs? | No | ||||||||||||||||
| Rather no | A | ||||||||||||||||
| No opinion | B | B | B | B | B | B | B | B | |||||||||
| Rather yes | A | A | |||||||||||||||
| Yes | A | A | A | A | A | A | A | A | |||||||||
| Χ2 | Sig. | 52.379 | 0.000 *** | 16.323 | 0.003 ** | 48.810 | 0.000 *** | 37.977 | 0.000 *** | 46.488 | 0.000 *** | 35.185 | 0.000 *** | 59.091 | 0.000 *** | 31.707 | 0.000 *** |
| Q20. In your opinion, are South India’s SMEs ready to implement IoT and I4.0 concept? | No | B | |||||||||||||||
| Rather no | |||||||||||||||||
| No opinion | B | B | B | B | B | B | B | B | |||||||||
| Rather yes | A | A | A | ||||||||||||||
| Yes | A | A | A | A | A | A | A | A | |||||||||
| Χ2 | Sig. | 52.355 | 0.000 *** | 26.645 | 0.000 *** | 44.466 | 0.000 *** | 45.476 | 0.000 *** | 44.201 | 0.000 *** | 73.733 | 0.000 *** | 15.657 | 0.004 ** | 26.082 | 0.000 *** |
| Q25. In your opinion, is IoT and I4.0 concept implementation important for you personally? | No | B | B | B | |||||||||||||
| Rather no | A | ||||||||||||||||
| No opinion | B | B | B | B | B | B | B | B | |||||||||
| Rather yes | A | A | A | A | A | ||||||||||||
| Yes | A | A | A | A | A | A | |||||||||||
| Χ2 | Sig. | 17.696 | 0.000 *** | 8.219 | 0.016 * | 4.596 | 0.100 | 8.943 | 0.011 * | 4.793 | 0.091 | 40.112 | 0.000 *** | 15.174 | 0.001 *** | 2.905 | 0.234 |
| Q27. In your opinion, do you see any Smart City in South India in next 10 years? | No | B | B | B | B | ||||||||||||
| No opinion | A | B | |||||||||||||||
| Yes | A | A | A | A | |||||||||||||
Note: “No opinion” refers to “I don’t know”. Results are based on two-sided tests. For each significant pair, the key of the category with the smaller column proportion appears in the category with the larger column proportion. Χ2 refers to Chi-square statistic. Sig. refers to the two-sided asymptotic significance of the chi-square statistic. Significance level for upper case letters (A, B, C): 0.05 *; 0.01 **; 0.001 *** a. Tests are adjusted for all pairwise comparisons within a row of each innermost sub-table using the Bonferroni correction; Source: Prepared by authors.
© 2020 by the authors. Licensee MDPI, Basel, Switzerland. This article is an open access article distributed under the terms and conditions of the Creative Commons Attribution (CC BY) license (http://creativecommons.org/licenses/by/4.0/).
Share and Cite
MDPI and ACS Style
Safar, L.; Sopko, J.; Dancakova, D.; Woschank, M. Industry 4.0—Awareness in South India. Sustainability 2020, 12, 3207. https://0-doi-org.brum.beds.ac.uk/10.3390/su12083207
AMA Style
Safar L, Sopko J, Dancakova D, Woschank M. Industry 4.0—Awareness in South India. Sustainability. 2020; 12(8):3207. https://0-doi-org.brum.beds.ac.uk/10.3390/su12083207
Chicago/Turabian StyleSafar, Leos, Jakub Sopko, Darya Dancakova, and Manuel Woschank. 2020. "Industry 4.0—Awareness in South India" Sustainability 12, no. 8: 3207. https://0-doi-org.brum.beds.ac.uk/10.3390/su12083207
Note that from the first issue of 2016, this journal uses article numbers instead of page numbers. See further details here.