Spatiotemporal Pattern of Wind Erosion on Unprotected Topsoil Replacement Sites in Mainland China

1
School of Land Science and Technology, China University of Geosciences (Beijing), 29 Xueyuan Road, Haidian District, Beijing 100083, China
2
School of Water Resources and Environment, China University of Geosciences (Beijing), 29 Xueyuan Road, Haidian District, Beijing 100083, China
3
Key Laboratory of Land Consolidation and Land Rehabilitation, Ministry of Natural Resources, Beijing 100035, China
*
Author to whom correspondence should be addressed.
Sustainability 2020, 12(8), 3237; https://0-doi-org.brum.beds.ac.uk/10.3390/su12083237
Submission received: 22 March 2020
/
Revised: 7 April 2020
/
Accepted: 14 April 2020
/
Published: 17 April 2020
(This article belongs to the Section Environmental Sustainability and Applications)
Abstract
:Topsoil is required to be stripped and reused to maintain land productivity in mining and construction activities. However, as a great threat to unprotected soil, wind erosion on topsoil replacement sites has not received enough research attention, which hinders the efficient implementation of wind erosion control measures in the right time and place on a national scale. This study aims to evaluate wind erosion on unprotected topsoil replacement sites (WEUTRS) in mainland China, examining its spatiotemporal pattern and demonstrating its significance for the relevant research and industry. The WEUTRS was calculated by the Revised Wind Erosion Equation with meteorological data (1988–2017) and raster data of soil properties. The results showed a strong spatiotemporal heterogeneity of WEUTRS. The highest (>300 kg m−2) and the lowest (<0.5 kg m−2) WEUTRS appeared in Northwest and Central Southern China, respectively. The most drastic temporal change through the year was in Northwest China (as high as 335.4 kg m−2 on the example site), followed by Qinghai–Tibet Plateau and Shandong Province. By contrast, almost no temporal changes happened in Central Southern China. The ratio of monthly WEUTRS to respread the topsoil mass (Rw) in Northwest China and Mongolia Plateau reached 10% or more in specific months, and less than 0.1% in most of Southern China. The WEUTRS quantification could be applied to the wind erosion control on topsoil replacement sites on both a national scale and a regional scale. The spatiotemporal pattern of WEUTRS may be a scientific basis for a nationwide or regionwide differentiated policy on the wind erosion control on topsoil replacement sites for policy makers, as well as the reference to the proper working schedule and the control measures for local mining and construction projects for management authorities and practitioners.
1. Introduction
Topsoil is a precious natural resource and plays an important role in maintaining land productivity and biodiversity. It takes centuries for topsoil to develop several centimeters of thickness; hence, it is considered a non-renewable resource [1,2]. Nutrients, such as carbon and nitrogen, are in the topsoil, and it may function as a long-term N pool [3,4], and it has the role of a ‘reservoir’ of seeds and vegetative propagules [5].
In practice, topsoil is required to be stripped from the original site and then reused after construction activities and the mining of coal, uranium, and phosphates, etc. [6,7,8]. It is firstly removed from the construction site, then transported directly to the topsoil replacement site or to storage until the forming of the replacement site is ready [7,9], and, lastly, respread to the replacement site for the ecological restoration of the site. During the topsoil handling process, wind erosion leads to large soil loss and topsoil deterioration in most mining and quarry activities [10,11], railroad and highway projects [12,13,14], and other infrastructure construction [15].
There are many negative impacts of erosion by wind on newly respread topsoil. The duration of wind erosion lasts from the topsoil replacement to the establishment of post-construction cover [15], which is normally vegetation. It could take months, or even years, for the vegetation to recover and provide effective protection for soil from wind erosion [16]. For a bare soil surface, wind erosion is 50 times higher than that with 60% of soil surface protection (e.g., vegetation, vegetation residual, clods, etc.) [17]. It will also significantly reduce soil thickness if the site is exposed with unprotected topsoil [18,19]. The thickness of respread topsoil is crucial to vegetation recovery. Topsoil that is too shallow could decrease the land productivity and biodiversity [20,21,22], and also cause poor-to-no vegetative cover [18]. As a result, heavier wind erosion could occur with topsoil and even lead to the failure of the whole topsoil handling.
Given the harmfulness of wind erosion on unprotected soil, many countries emphasize the necessity of wind erosion control during topsoil handling in the relevant laws and regulations [23,24,25,26,27,28]. However, research that evaluates wind erosion on topsoil replacement sites is scarce in both field study and modelling. Current studies pertaining to wind erosion and its influence on mining and construction projects mainly focus on the impacts of dust emission to the surrounding environment [11,13,14,29], rather than quantifying the soil loss by wind at the post-construction stage. This data gap hinders the effective implementation of wind erosion control measures on topsoil replacement sites in different locations at different times.
In this paper, we: (1) evaluated wind erosion on unprotected topsoil replacement sites (WEUTRS) in mainland China; (2) examined its spatiotemporal pattern; and (3) demonstrated the significance of WEUTRS for the relevant research and industry. Our findings can be used as a basis for future studies on the sustainable use of topsoil in mining and construction projects. It will also provide a scientific basis for making a relevant spatiotemporal differentiated policy, and the supervision and management to protect topsoil from wind erosion on post-construction sites for local management authorities and practitioners.
2. Materials and Methods
2.1. Study Area
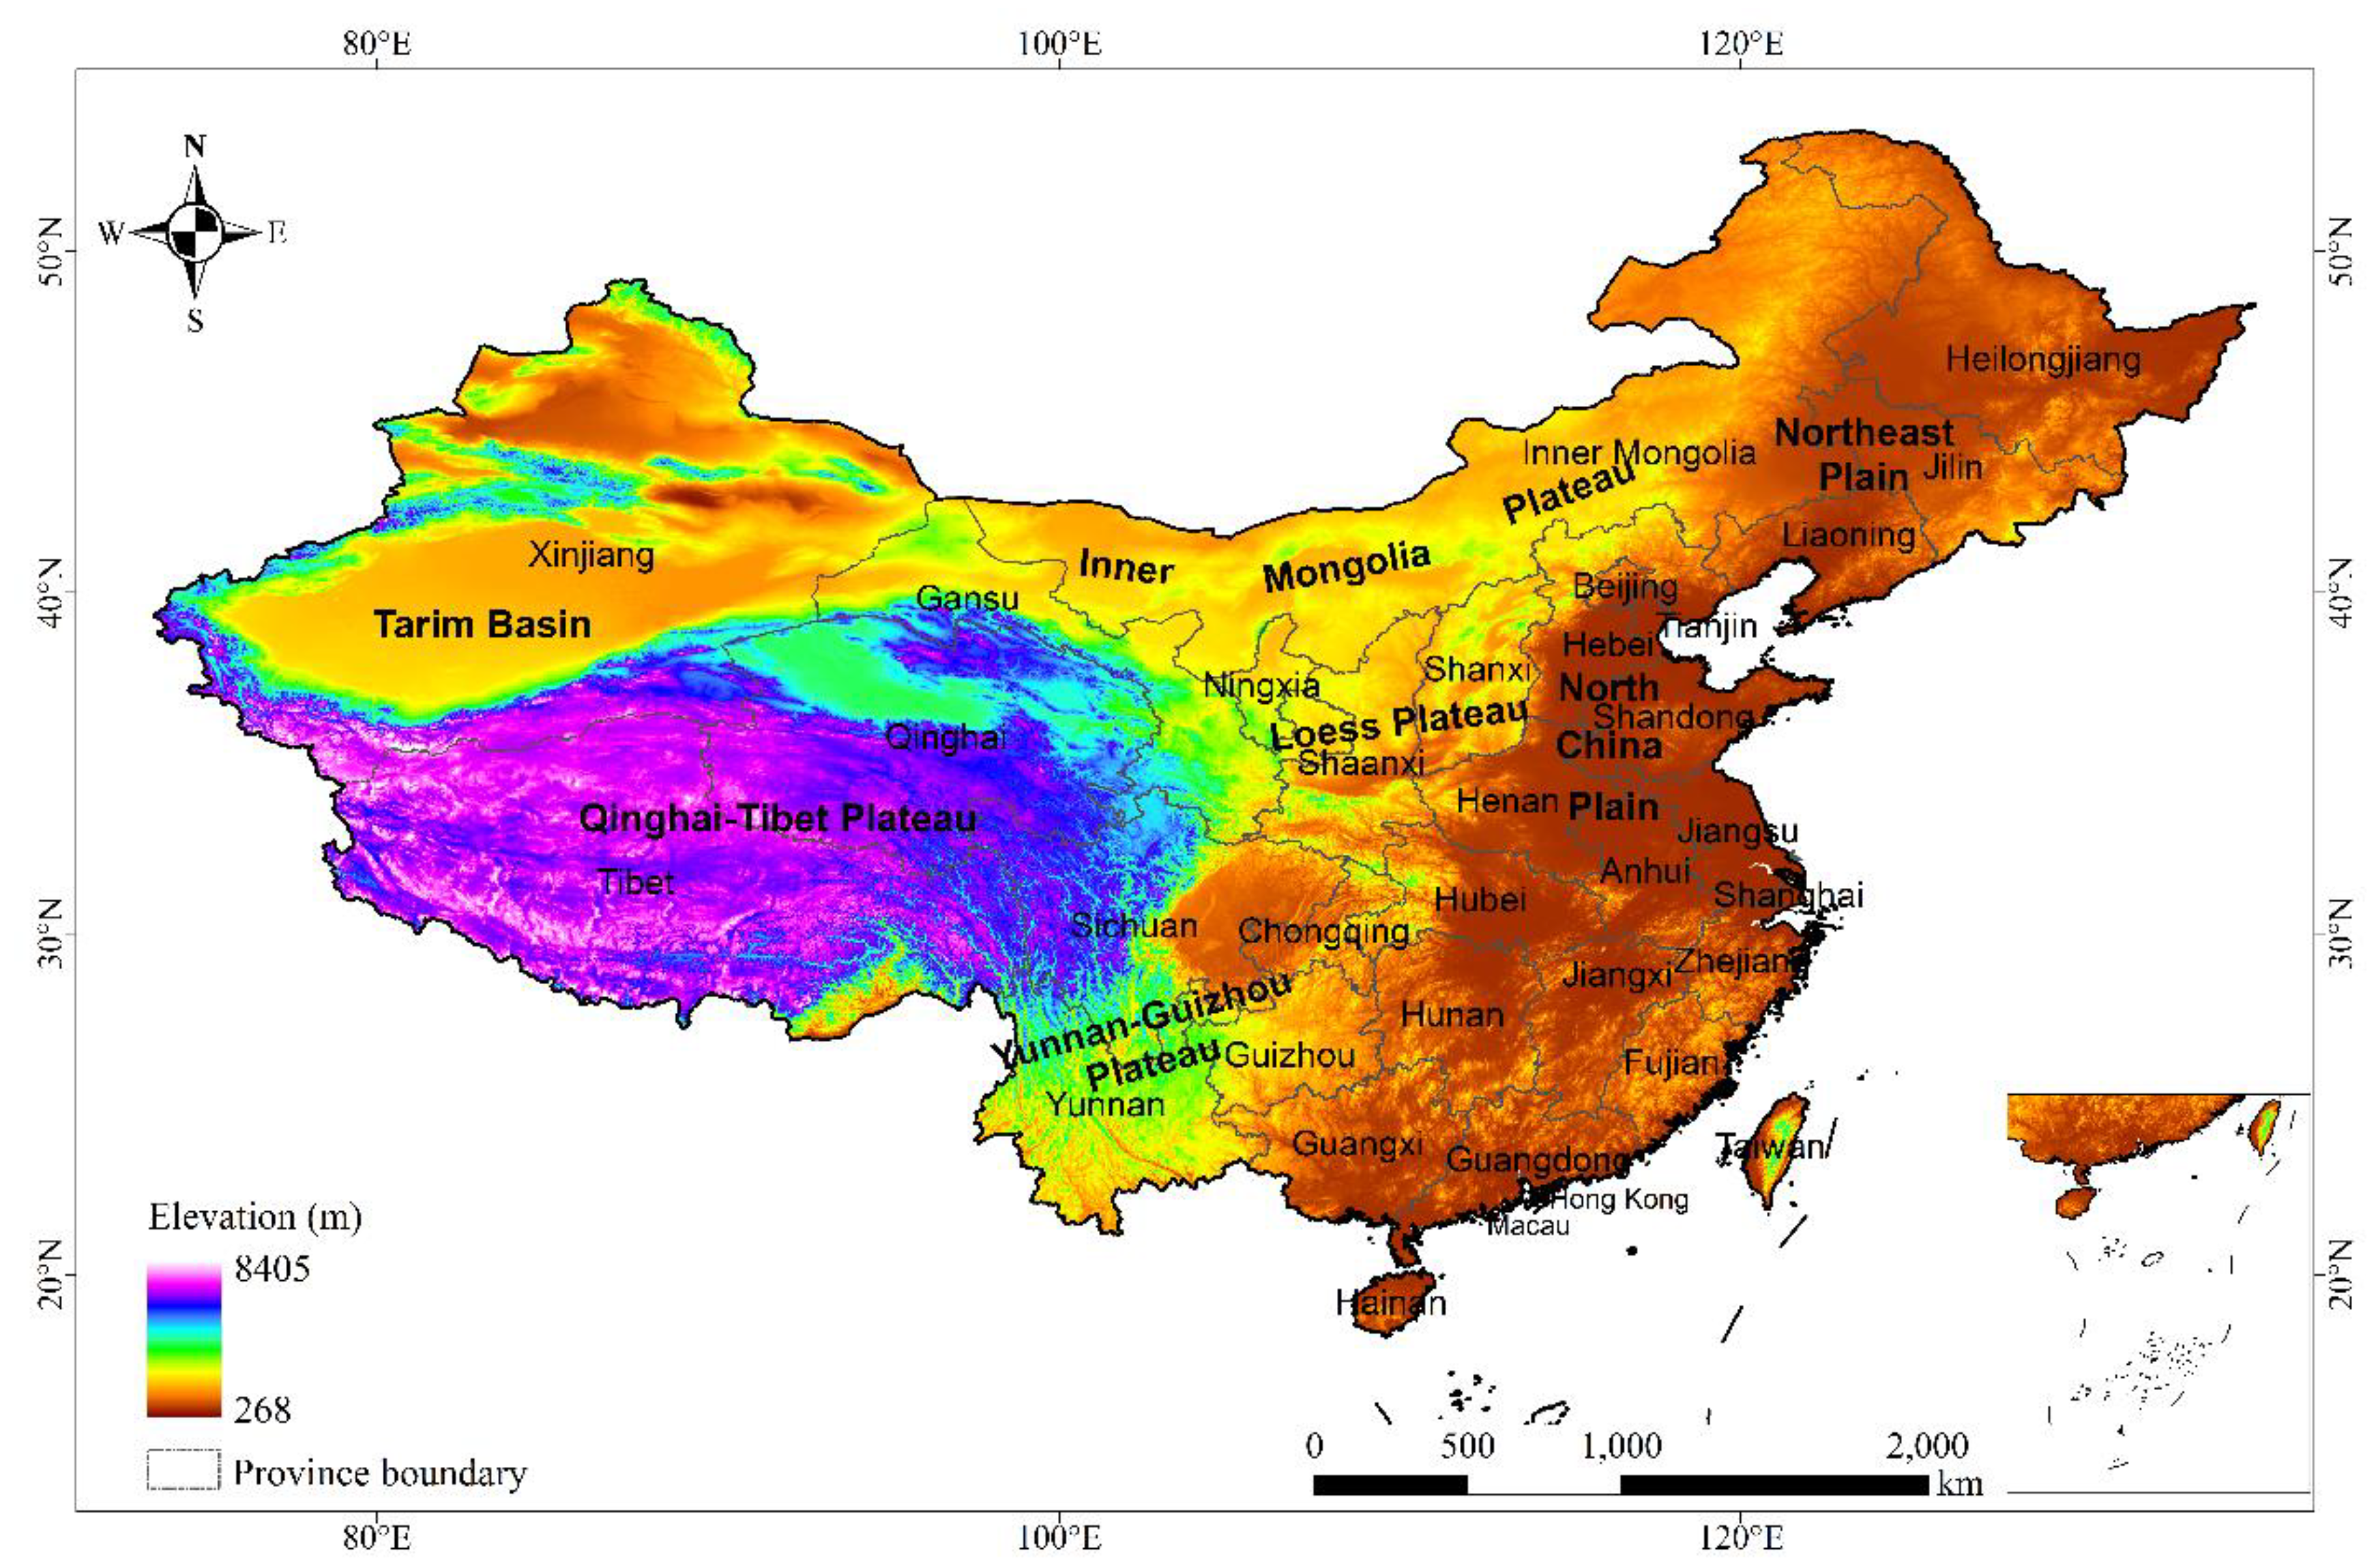
China (Figure 1) is one of the countries that suffers the most erosion by wind in the world [30]. There are approximately 3070 km2 of disturbed soil due to natural disasters and construction projects every year in China [31]. Given the diverse physical geography, many large construction projects have taken place in regions across several climate zones and soil types [14]. Therefore, the situation of topsoil replacement sites could vary according to the locations of the projects, which leads to the complexity of soil loss by wind on the sites. It can be a good representation of the countries that need spatiotemporal differentiated management on the relevant issues.
2.2. Study Assumption
In a raster map of mainland China (spatial resolution of 1 km × 1 km), a 200 m × 200 m unprotected topsoil replacement site was simulated inside every pixel. Each simulated site was used to estimate wind erosion per unit area of any topsoil replacement site in its corresponding pixel. The sites were simulated according to the relevant technical standards and specifications in China [23,32,33] the topsoil was mixed during topsoil handling; the site was levelled before soil replacement and ploughed after replacement; and one of the site’s sides was vertical to the dominant wind direction.
2.3. Dataset
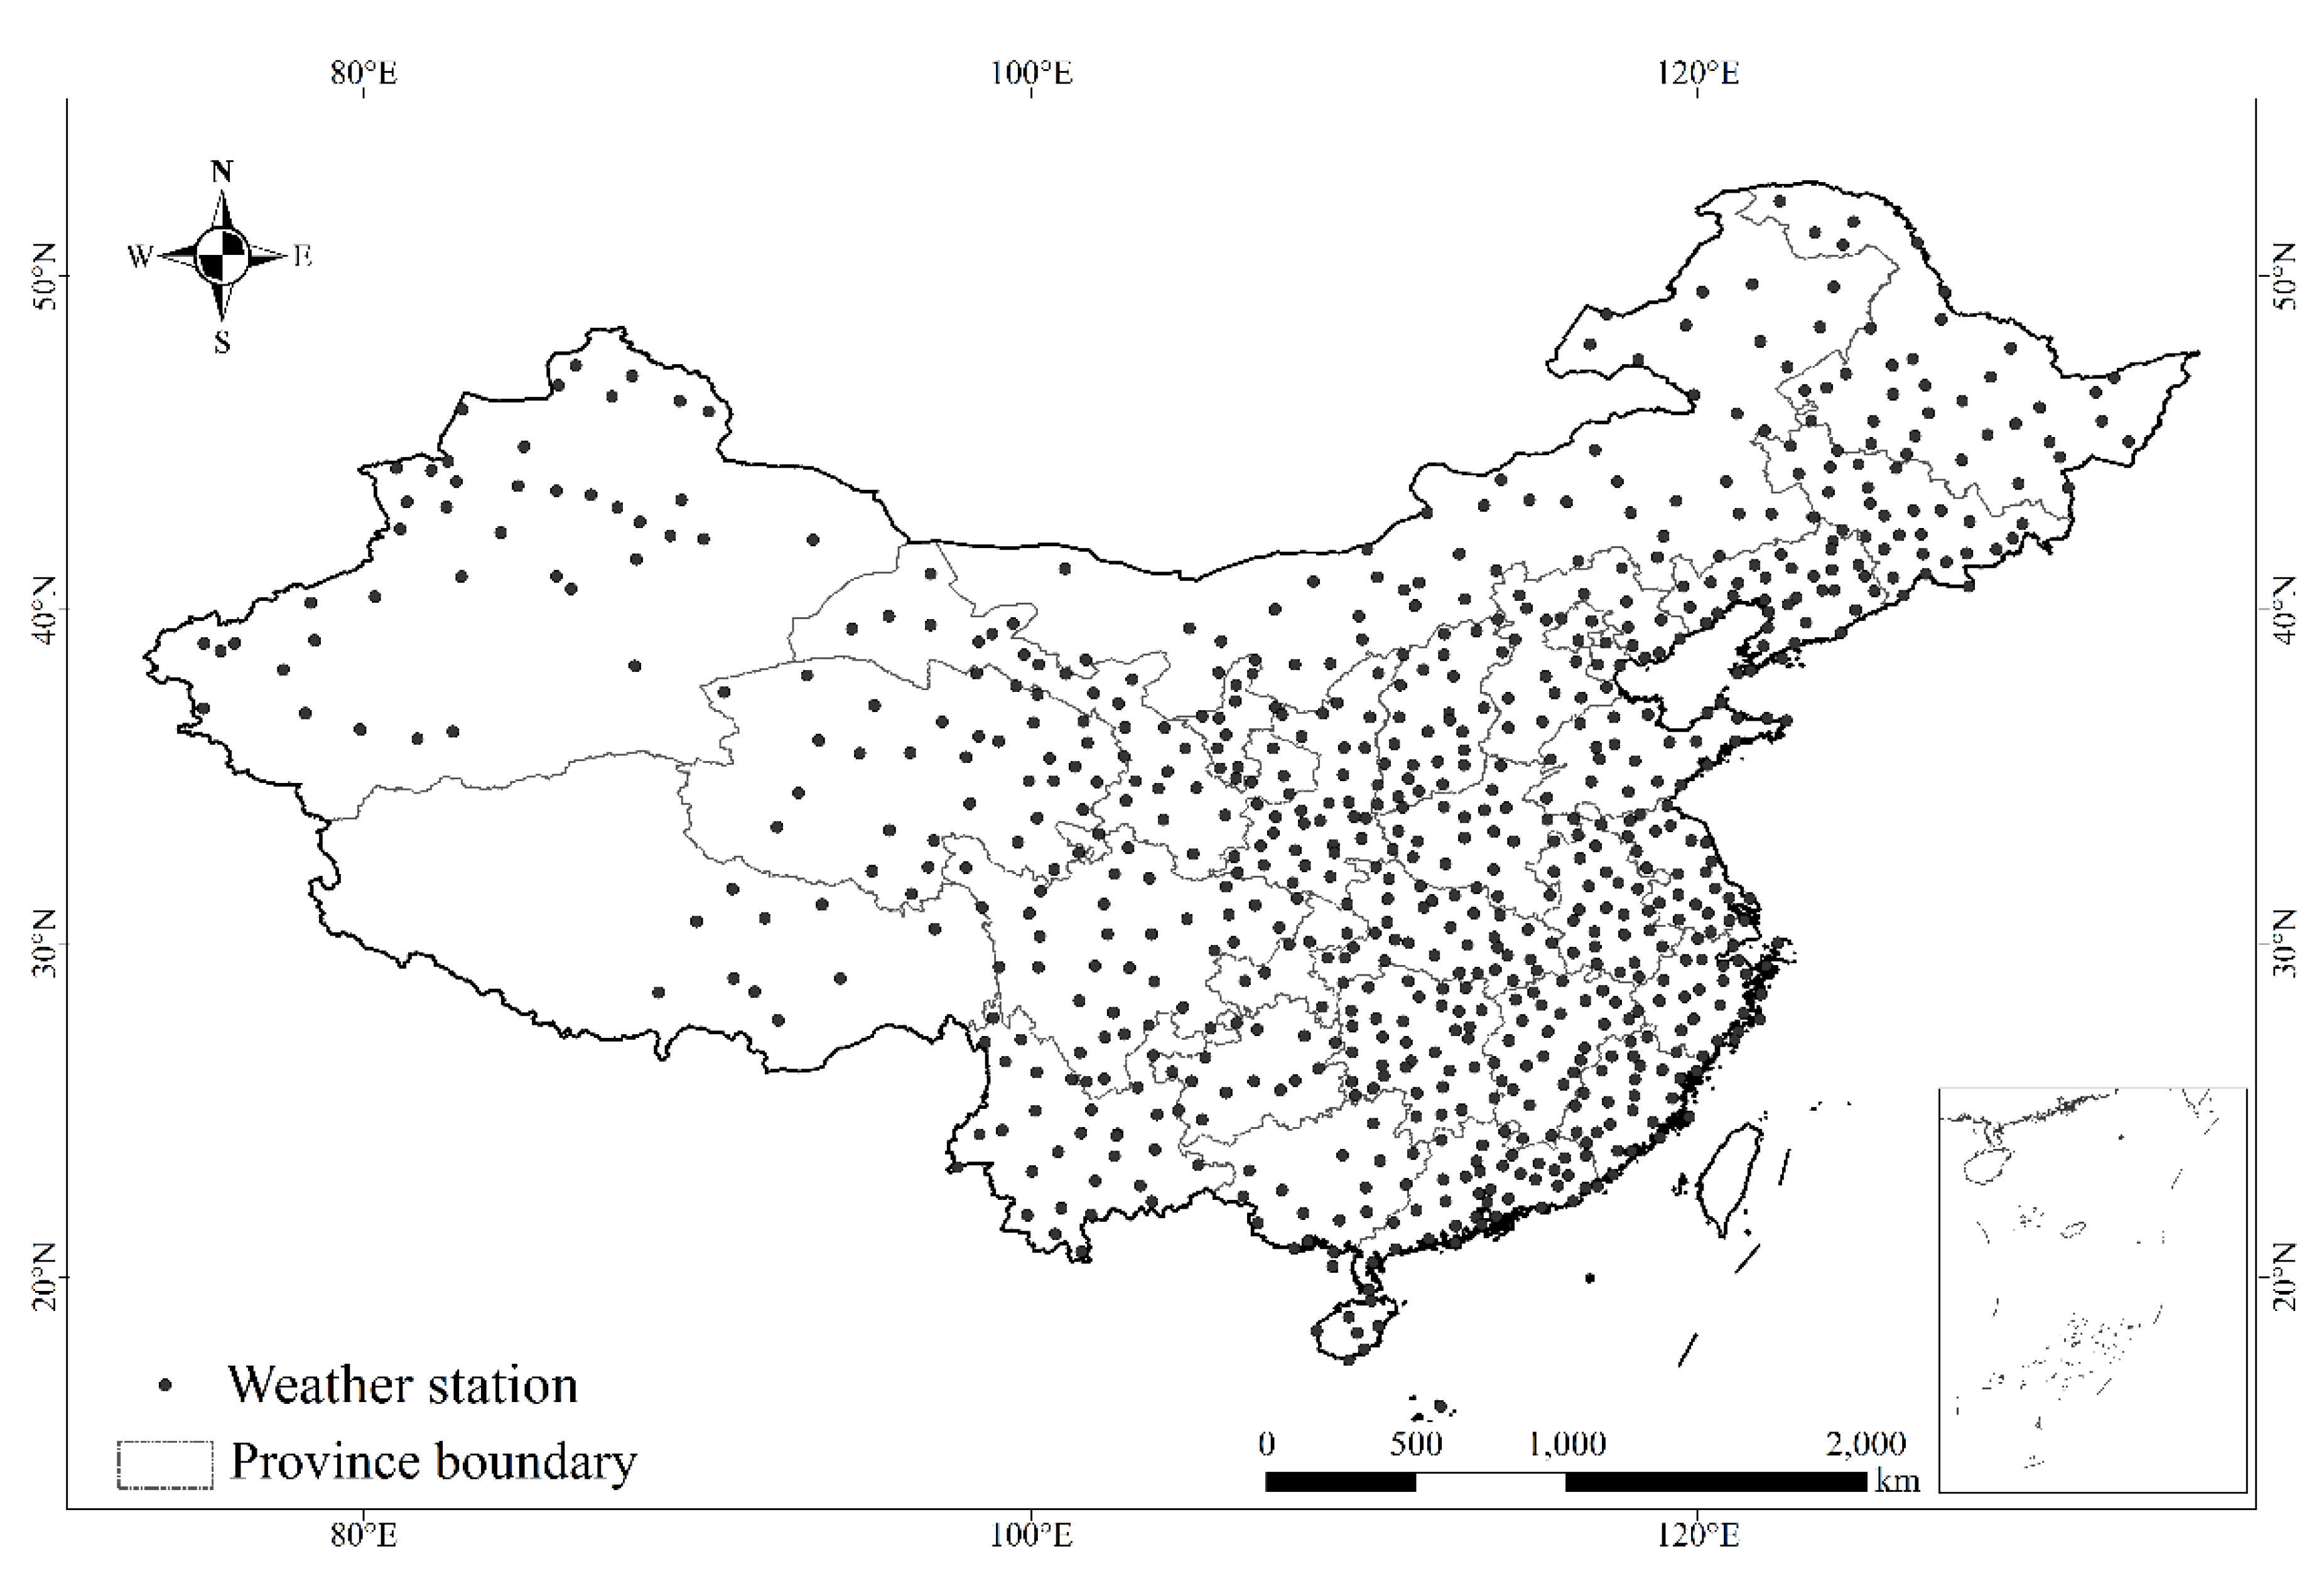
Meteorological data was obtained from the National Meteorological Information Centre [34] from 1 January 1988 to 31 December 2017. It includes the daily wind speed (four observations per day at 2:00, 8:00, 14:00, and 20:00), daily mean temperature, daily relative humidity, and daily rainfall from 740 weather stations (Appendix A, Figure A1) across mainland China.
Soil data was obtained from the Resource and Environment Data Cloud Platform [35] and the Cold and Arid Regions Science Data Center of China [36]. The raster dataset of soil properties was generated by the Institute of Soil Science, Chinese Academy of Sciences, with 1 km2 spatial resolution (the water body was removed from the raster data) [37]. The dataset of soil properties included soil texture (clay, silt, and sand content), CaCO3 content, soil organic matter content, and soil bulk density. Soil particle-size distribution was converted from Chinese standard to the U.S. Department of Agriculture (USDA) scheme by a log-normal distribution method [38,39].
2.4. Method
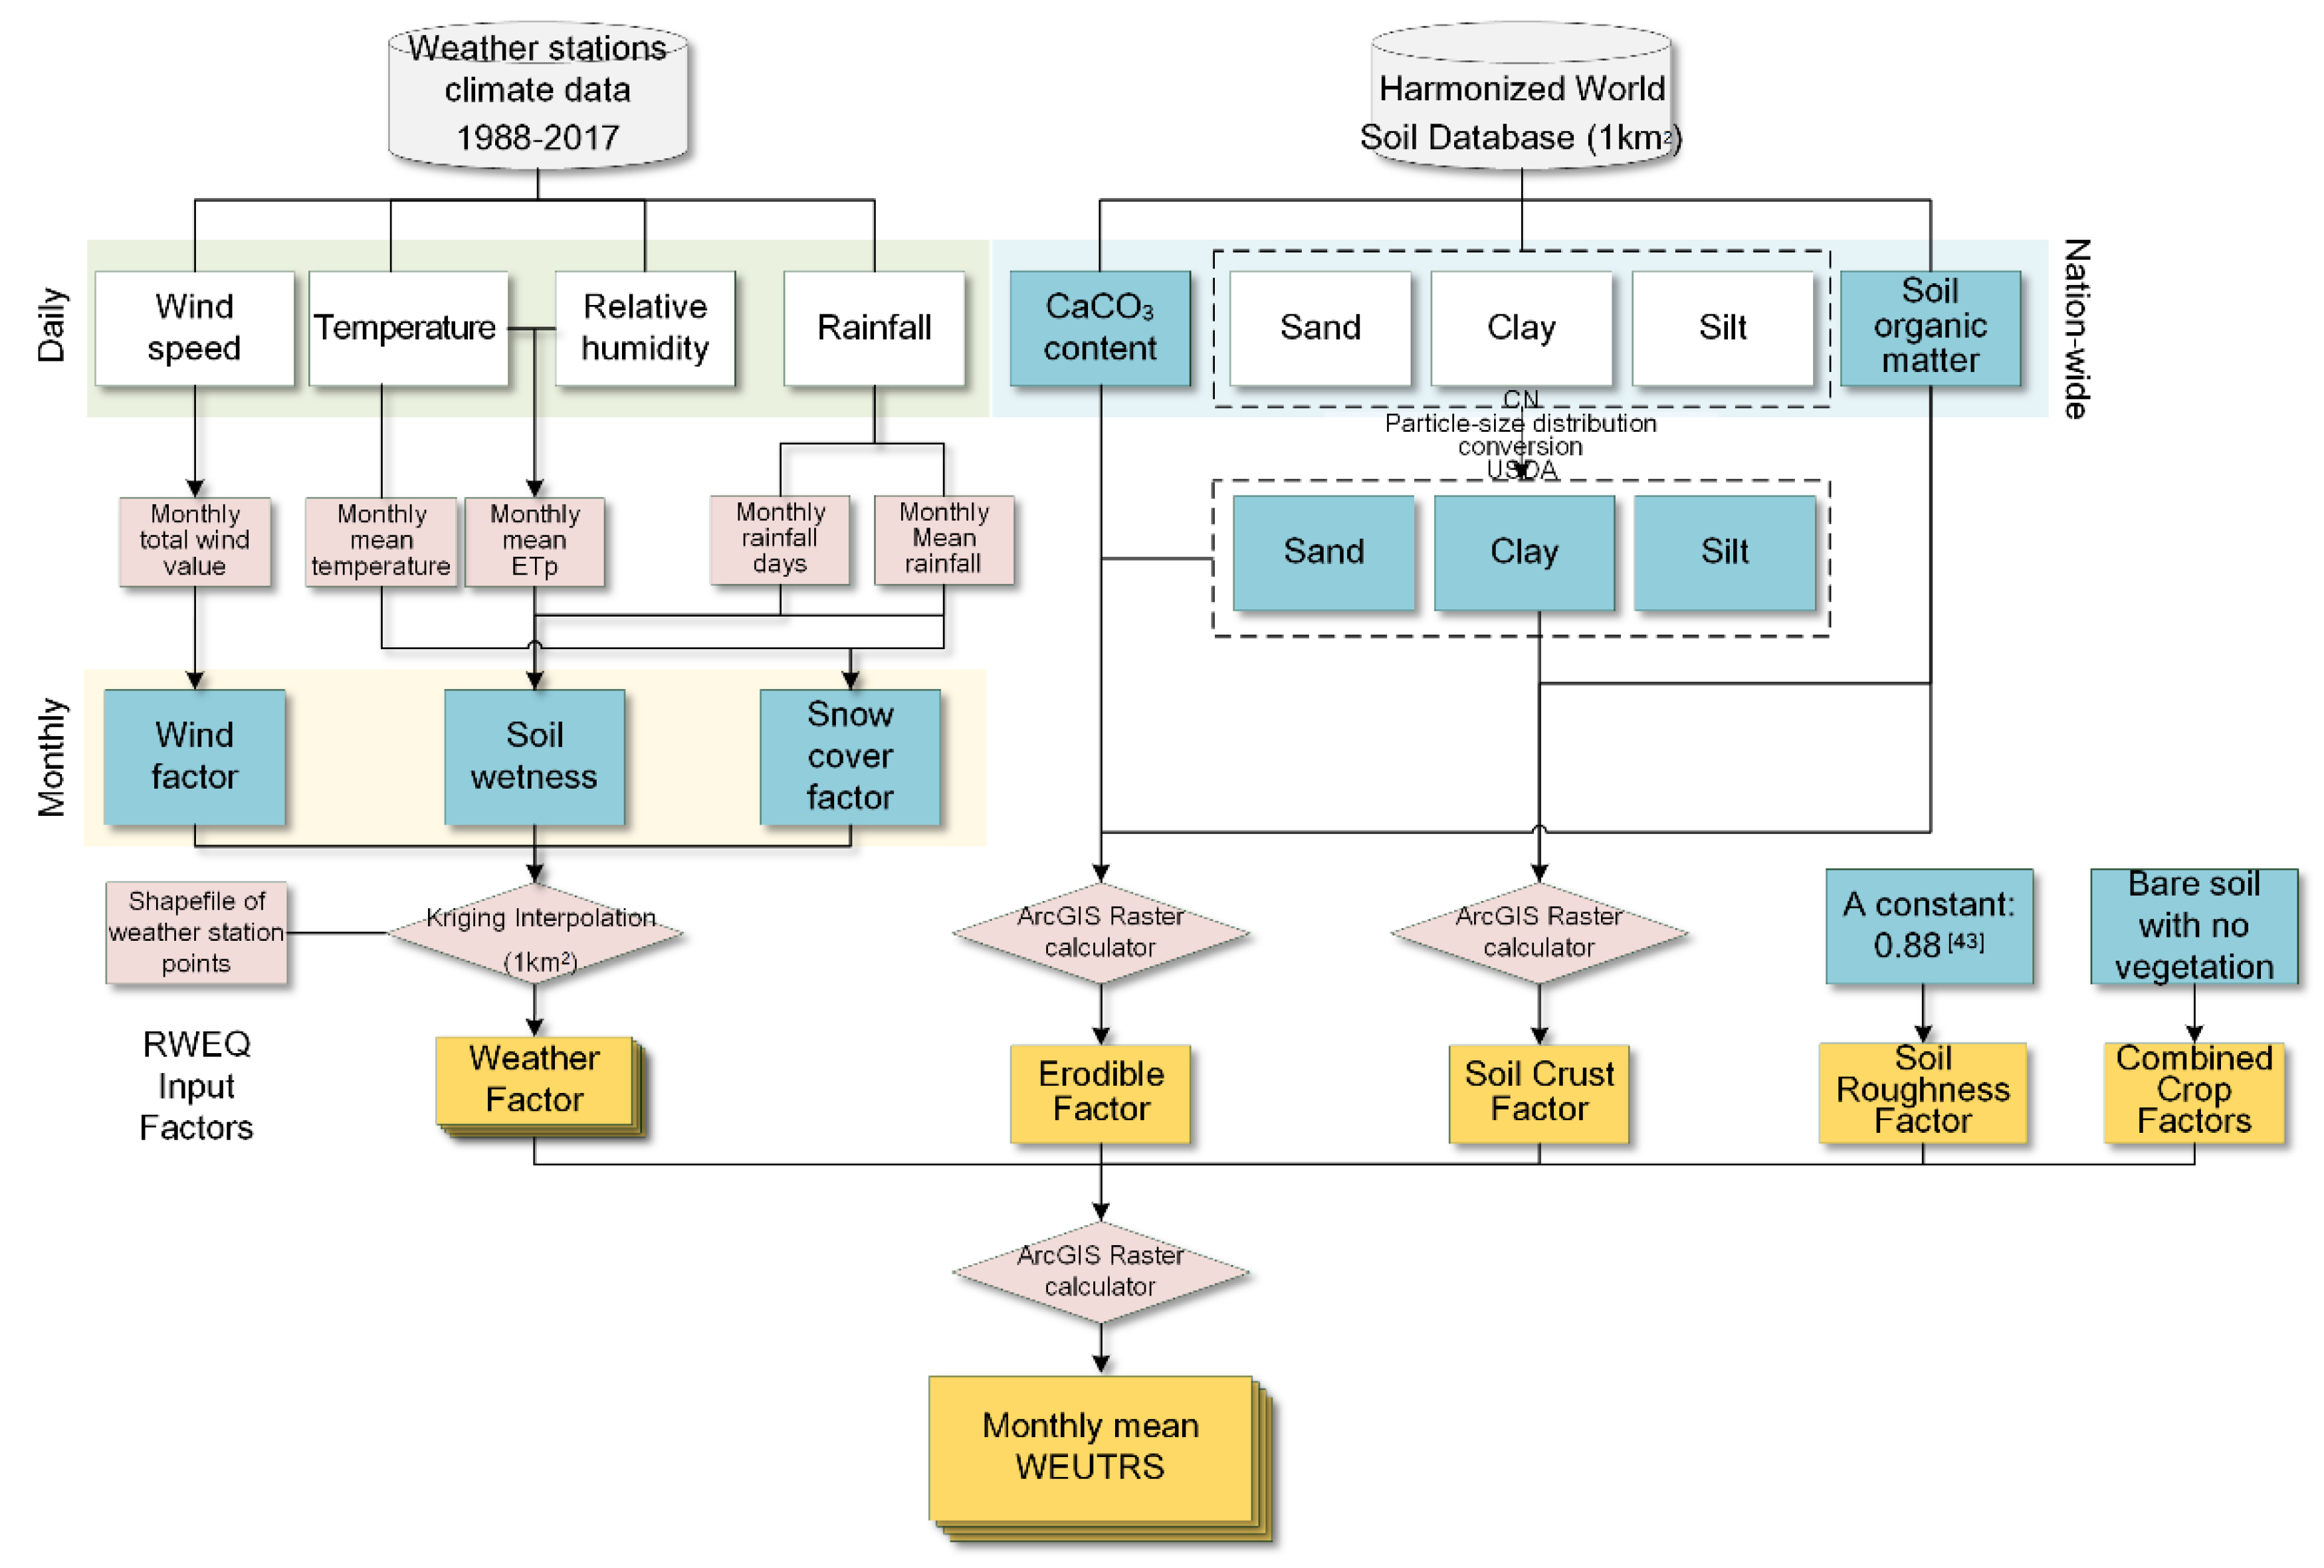
2.4.1. Evaluation of WEUTRS
The Revised Wind Erosion Equation (RWEQ) was applied to evaluate the wind erosion on each simulated site. It was originally used to estimate the soil loss by wind in arable land developed by scientists of the USDA [41,42]. After decades of application and adjustment, it contains a comprehensive modelling scheme, which is proven to be suitable for the wind erosion estimation in different climate zones and soil types on different scales [43,44,45,46,47]. Moreover, the adjustable parameters of the model make it suitable for different purposes.
According to Fryrear [41], the RWEQ calculated the soil loss at a specific point (x (m)) in the field, as follows (where Qmax and s are constant):
where Qmax (kg m−1―width) is the maximum transport capacity and s is the critical field length (m), at which the 63.2% maximum transport capacity Qmax is reached. In this study, the field length x was the width of the platform, which is 200 m. The average soil loss that was used in this study is defined as mass transport at field length x divided by distance x [41].
Qmax and s are estimated as:
where EF is erodible factor; SCF—soil crust factor; K′ is soil roughness factor; COG is combined crop factors; and WF is weather factor (kg m−1).
The WEUTRS of each site in each month was evaluated with this model. According to the conditions of our simulated topsoil replacement sites, the model parameters were set and localized as follows:
A) Weather Factor (WF)
The weather factor (WF) was calculated by multiplying the monthly mean value of the wind factor (Wf), soil wetness (SW), snow cover factor (SD) and the quotient of air density (, kg m−3), and acceleration due to gravity (g, m s−2) (Equation 4) in every weather station in Microsoft Excel. Based on the weather station point, the Kriging method [48,49] was used to interpolate the raster of WF for each month with the spatial resolution of 1 km × 1 km in ArcGIS® v10.5.
Wind factor (Wf): the wind factor was calculated by Equation (5). U2 is the wind speed at 2 meters high, which was the wind speed observation from the weather stations. Ut is the wind speed threshold that causes soil transportation. Ut = 5 m s−1 at a height of 2 m as a threshold of the general wind speed of transporting soil was used in this study [41,47]. N is the total wind speed observations and Nd is the total days of one period, and a month was used as a period in this study.
Soil wetness (SW): in the RWEQ, soil wetness was the difference of evapotranspiration and rainfall (and irrigation) in a period of time (Equation (6)). If there was no rain or irrigation over a time period, the SW coefficient was one; if the evapotranspiration was less than the water receiving (rainfall and irrigation) in that period, the SW coefficient was zero. According to our assumption, no irrigation was applied on the simulated sites; thereby, irrigation was not considered in this study.
The monthly mean temperature and monthly mean relative humidity were used to compute the monthly mean potential relative evapotranspiration (Equation (7)). The equation was tested reliable for the climatic erosivity of wind erosion in arid and semiarid China [50].
where ETp is potential relative evapotranspiration (mm); Ti is monthly mean temperature (°C); ri is monthly mean relative humidity (%); R is rainfall (mm); I is irrigation (mm); Rd is number of rainfall and/or irrigation days in a period (one month); Nd is number of days of a period (one month).
Snow cover factor (SD): this factor equals to 1, minus the probability of a snow depth greater than 25.4 mm. The probability is the ratio of days with a snow depth greater than 25.4 mm in a time period (one month) and the total days in that period. Snowfall was conversed from rainfall data. According to Chinese meteorological administration, the intensity of newly formed snow cover is one-tenth of that of rainfall water. Therefore, the condition of daily snow cover greater than 25.4 mm could have been considered when the daily mean rainfall was greater than 2.5 mm; meanwhile, the temperature was below 0 °C [51].
B) Erodible Factor (EF) and Soil Crust Factor (SCF)
In the RWEQ model, both the erodible factor (EF) and soil crust factor (SCF) (Appendix A, Figure A2) were calculated as follows:
where Sa = sand content (%); Si = silt content (%); Cl = clay content (%); Sa/Cl = sand to clay ratio; OM = organic matter (%); CaCO3= calcium carbonate (%). The soil texture data (Sa, Si, and Cl) used in Equations (8) and (9) was converted from Chinese standard to USDA scheme by the log-normal distribution method [38,39].
C) Soil Roughness Factor (K’)
The soil roughness factor (K’) in the RWEQ was calculated from soil surface roughness and soil ridge roughness [41]. In this study, the site was levelled and assumed to be flat. According to Saleh [52], considering the soil surface roughness and soil ridge roughness, the soil roughness of the almost flat site was 0.88. Thereby, we used 0.88 as the K’ value of the simulated topsoil replacement sites.
D) Combined Crop Factors (COG)
Under the circumstances of the topsoil handling process, the plant was removed in the first place. Therefore, bare soil without vegetation or vegetation residual was on the simulated sites after topsoil replacement in this study. Although some stripped topsoil contained plant seeds [5], they still needed months to sprout and grow, which meant that there were months that the topsoil was unprotected by vegetation or any other cover. On the basis of the RWEQ model, the COG was 1 if all the flat residual coverage, standing residual coverage, and crop canopy coverage were 0.
The mean WEUTRS of each month from 1987 to 2017 was calculated by the RWEQ (Figure 2). Then, the monthly means of WEUTRS from January to December were conducted in the ArcGIS model builder using a raster calculator (e.g., the monthly mean of WEUTRS in January was obtained by averaging all values of the WEUTRS of January from 1987 to 2017).
2.4.2. Range of Monthly Mean WEUTRS
The range is the difference between the maximum and minimum value, and it can be used as a measure of temporal heterogeneity. In this study, the range of the monthly mean of WEUTRS was used to demonstrate the inter-monthly variation of WEUTRS. The maximum and minimum of the monthly means of WEUTRS in each pixel of the raster map were obtained respectively; then, the range of WEUTRS was calculated by subtracting the raster with the minimum value from the one with the maximum value.
2.4.3. Ratio of WEUTRS to Respread Topsoil Mass
The ratio of WEUTRS to respread the topsoil mass in one unit area (Rw) (Equation (10)) was calculated. It was used as the assessment of wind erosion severity on the unprotected replacement sites.
where w is the monthly mean of WEUTRS, i is the vertical soil layer number from top layer to layer n, ρi is bulk density of layer i, and di is soil thickness of layer i.
We assumed that the area of respread topsoil was equal to the area of stripped topsoil. Thus, the soil mass of respread topsoil equaled the soil mass of stripped topsoil (i.e., soil mass before stripping). The soil mass of one unit area was calculated as the sum of the soil mass of each layer.
3. Results
3.1. Spatiotemporal Heterogeneity of WEUTRS
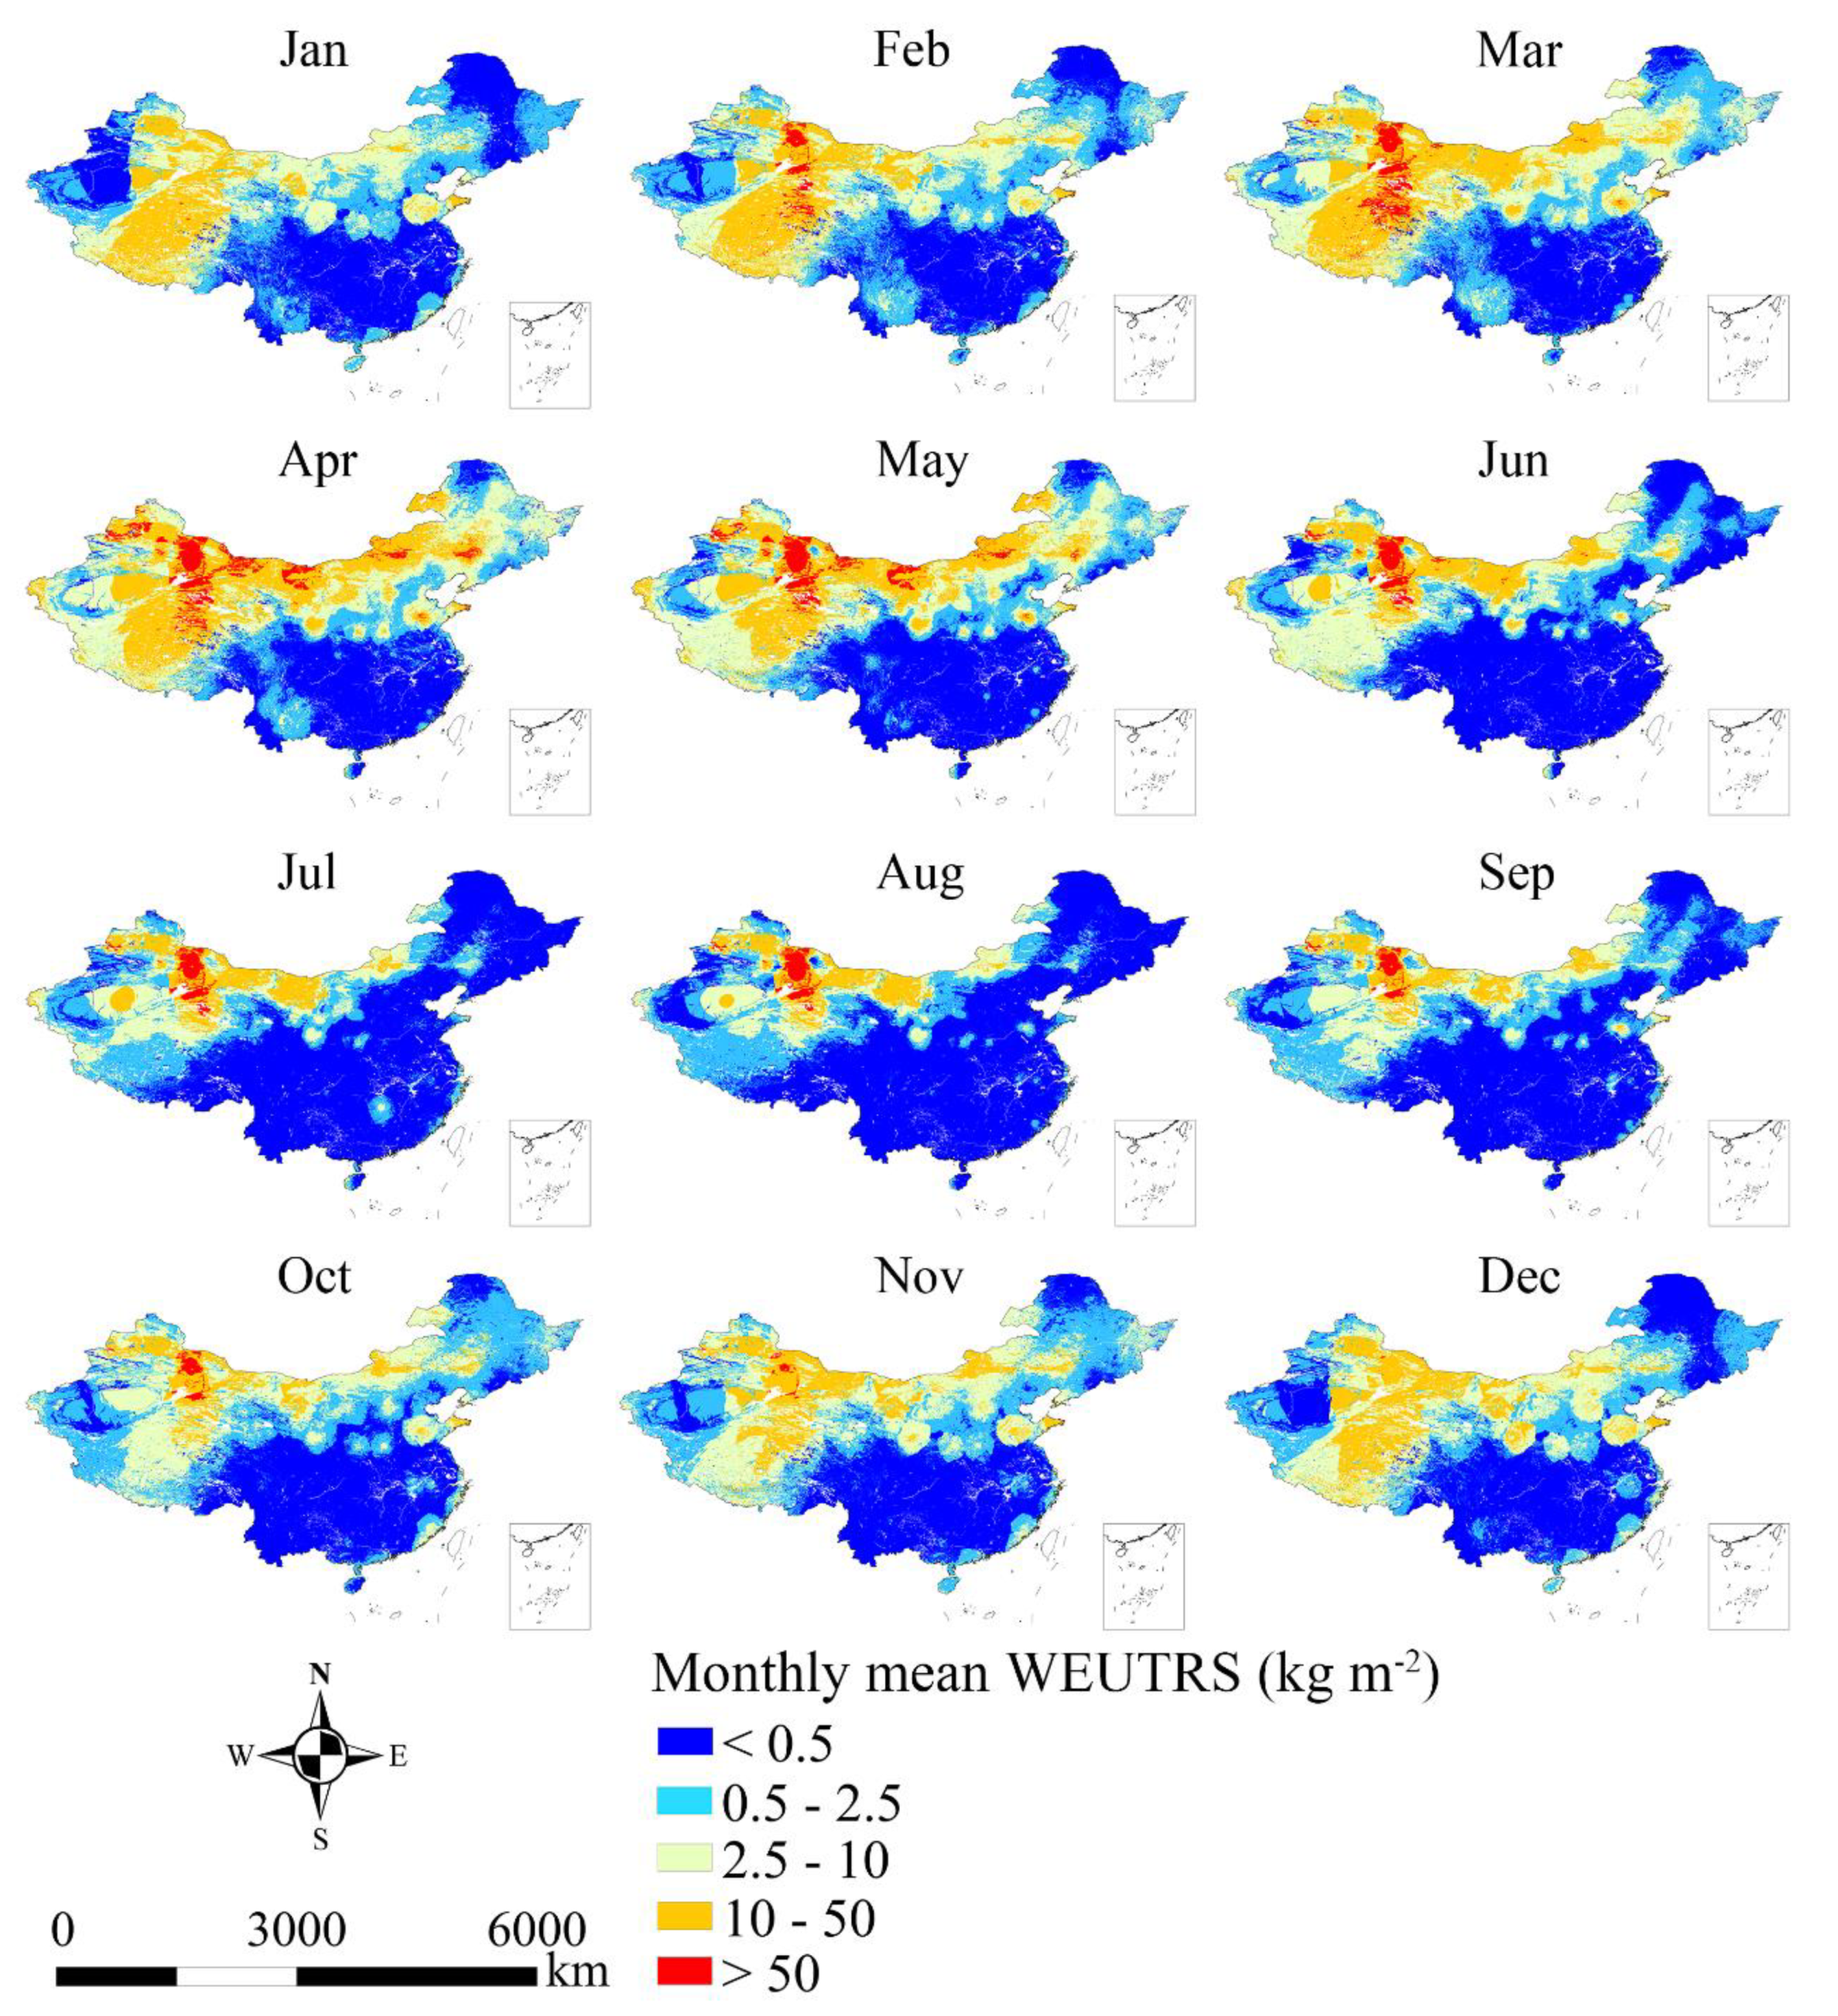
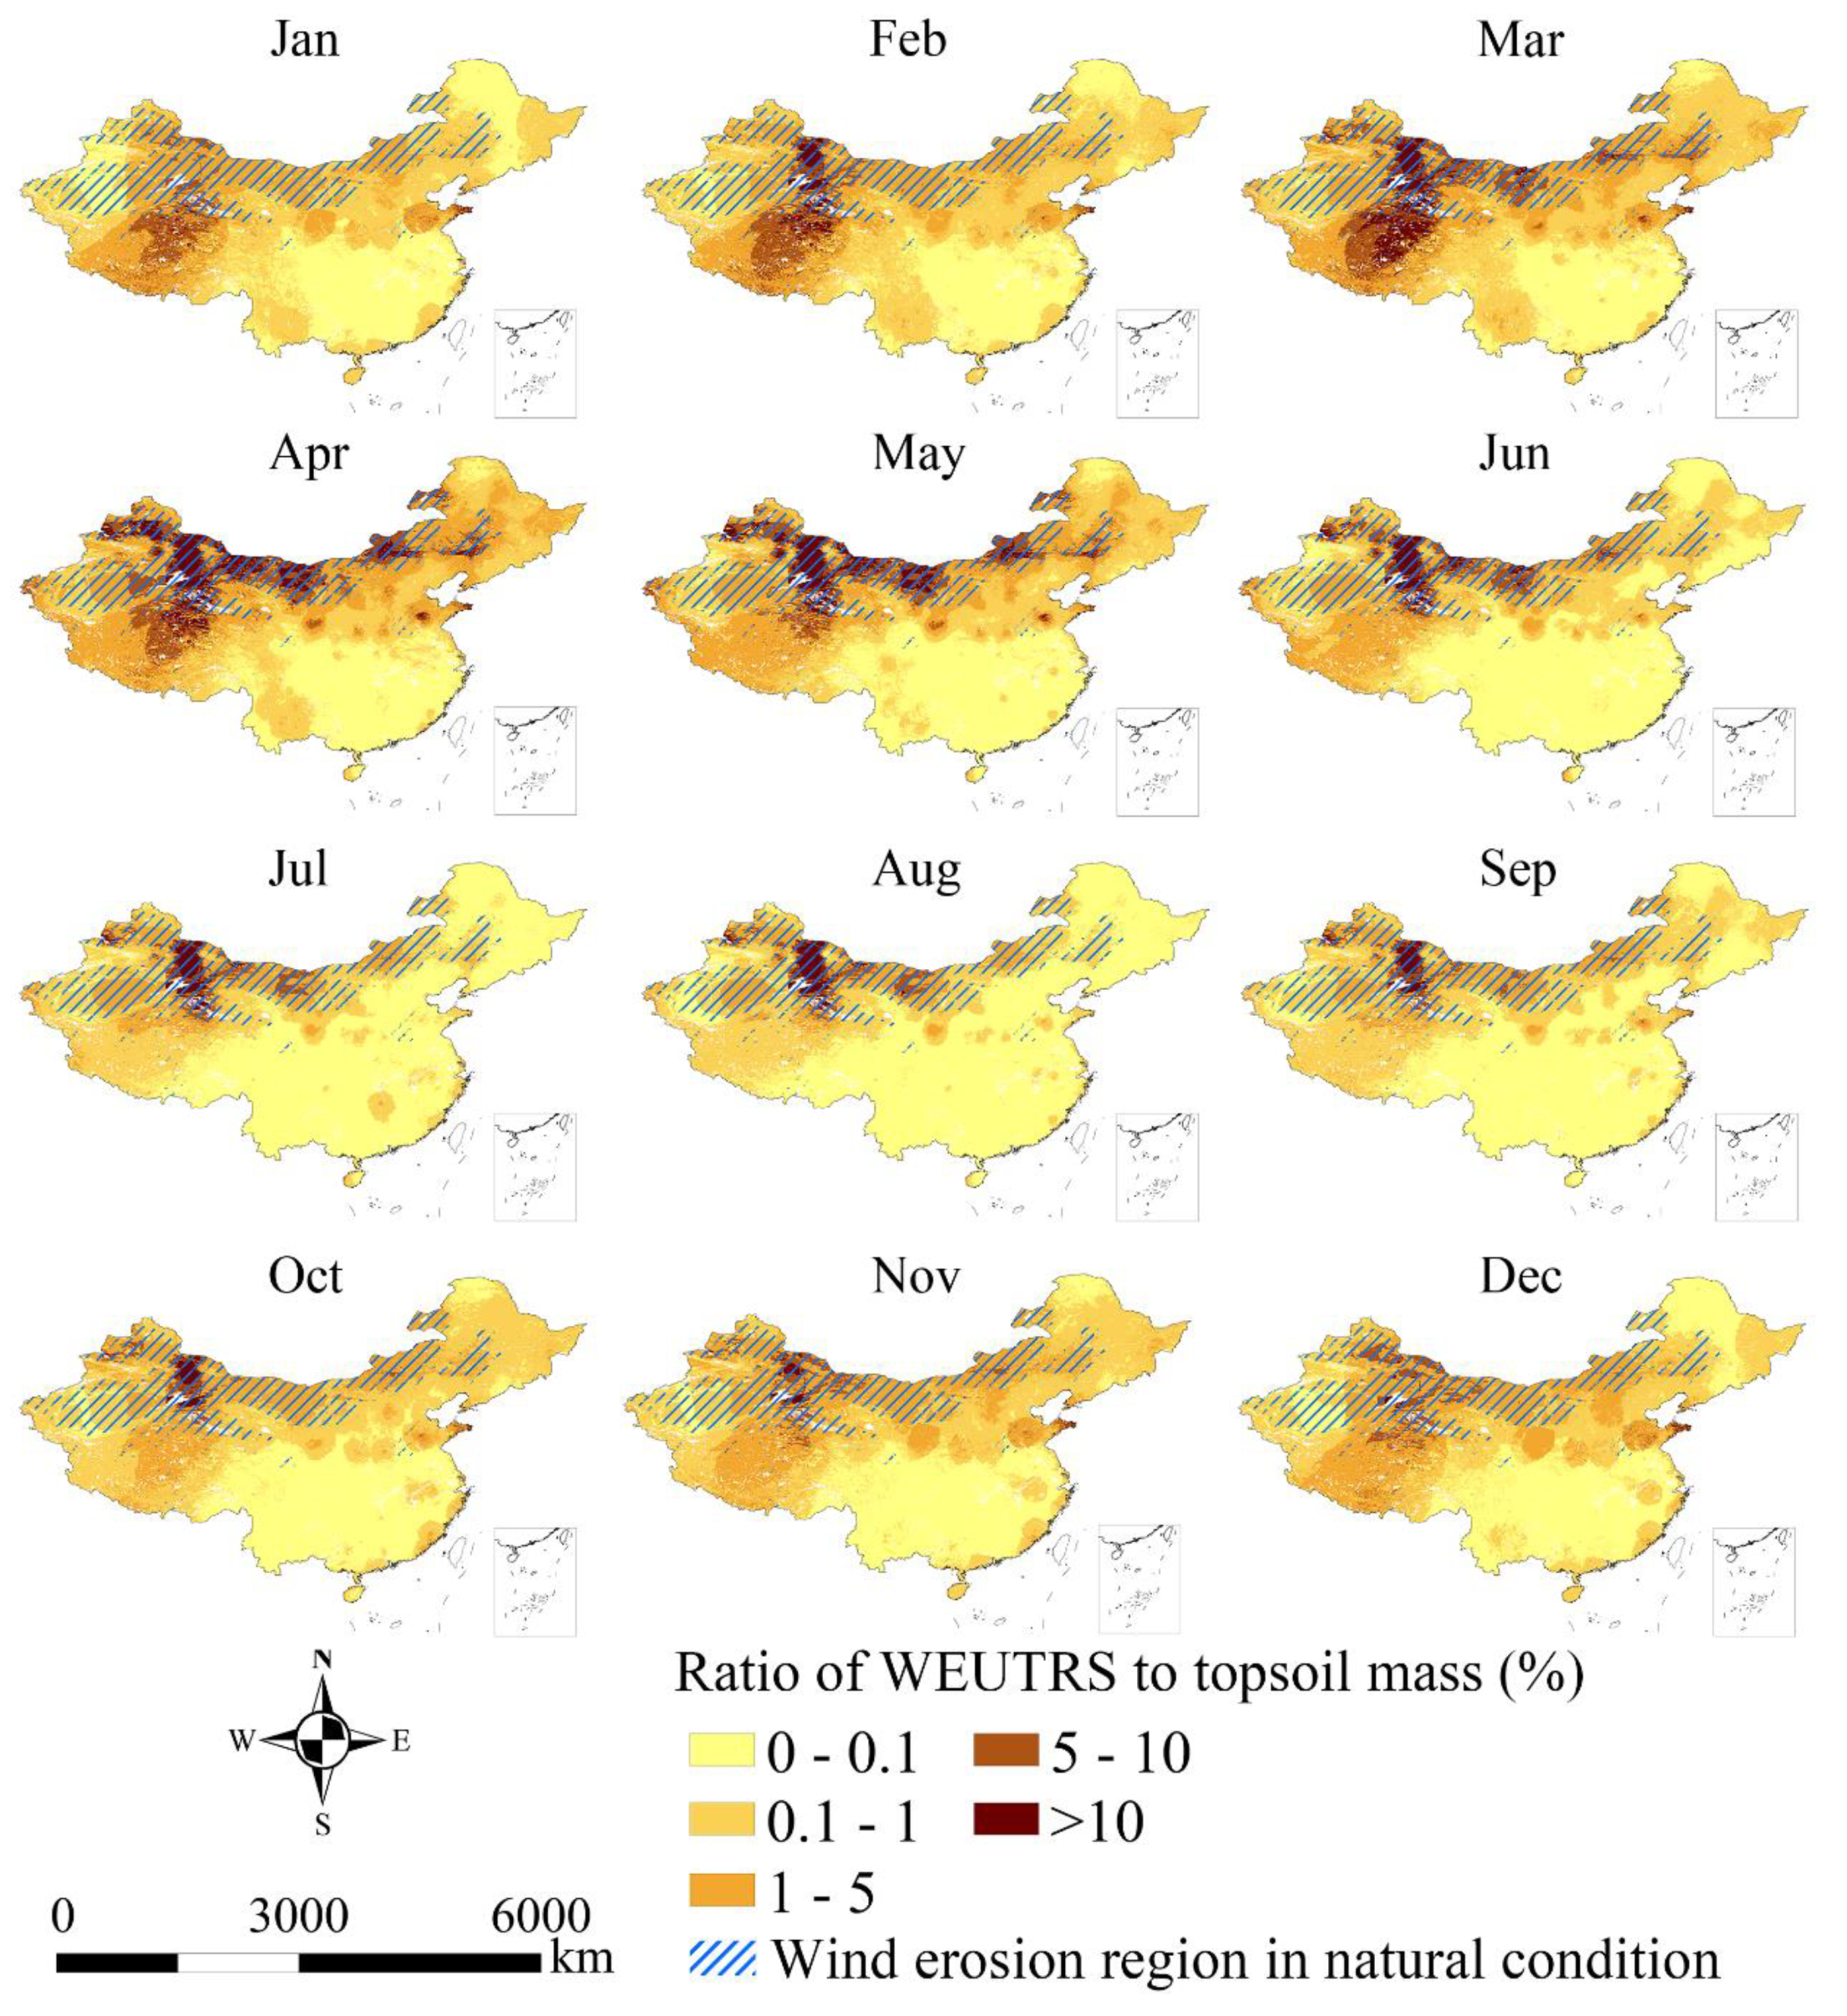
Figure 3 shows the monthly mean of WEUTRS from January to December on the simulated topsoil replacement sites. The monthly mean of WEUTRS showed strong spatiotemporal heterogeneity.
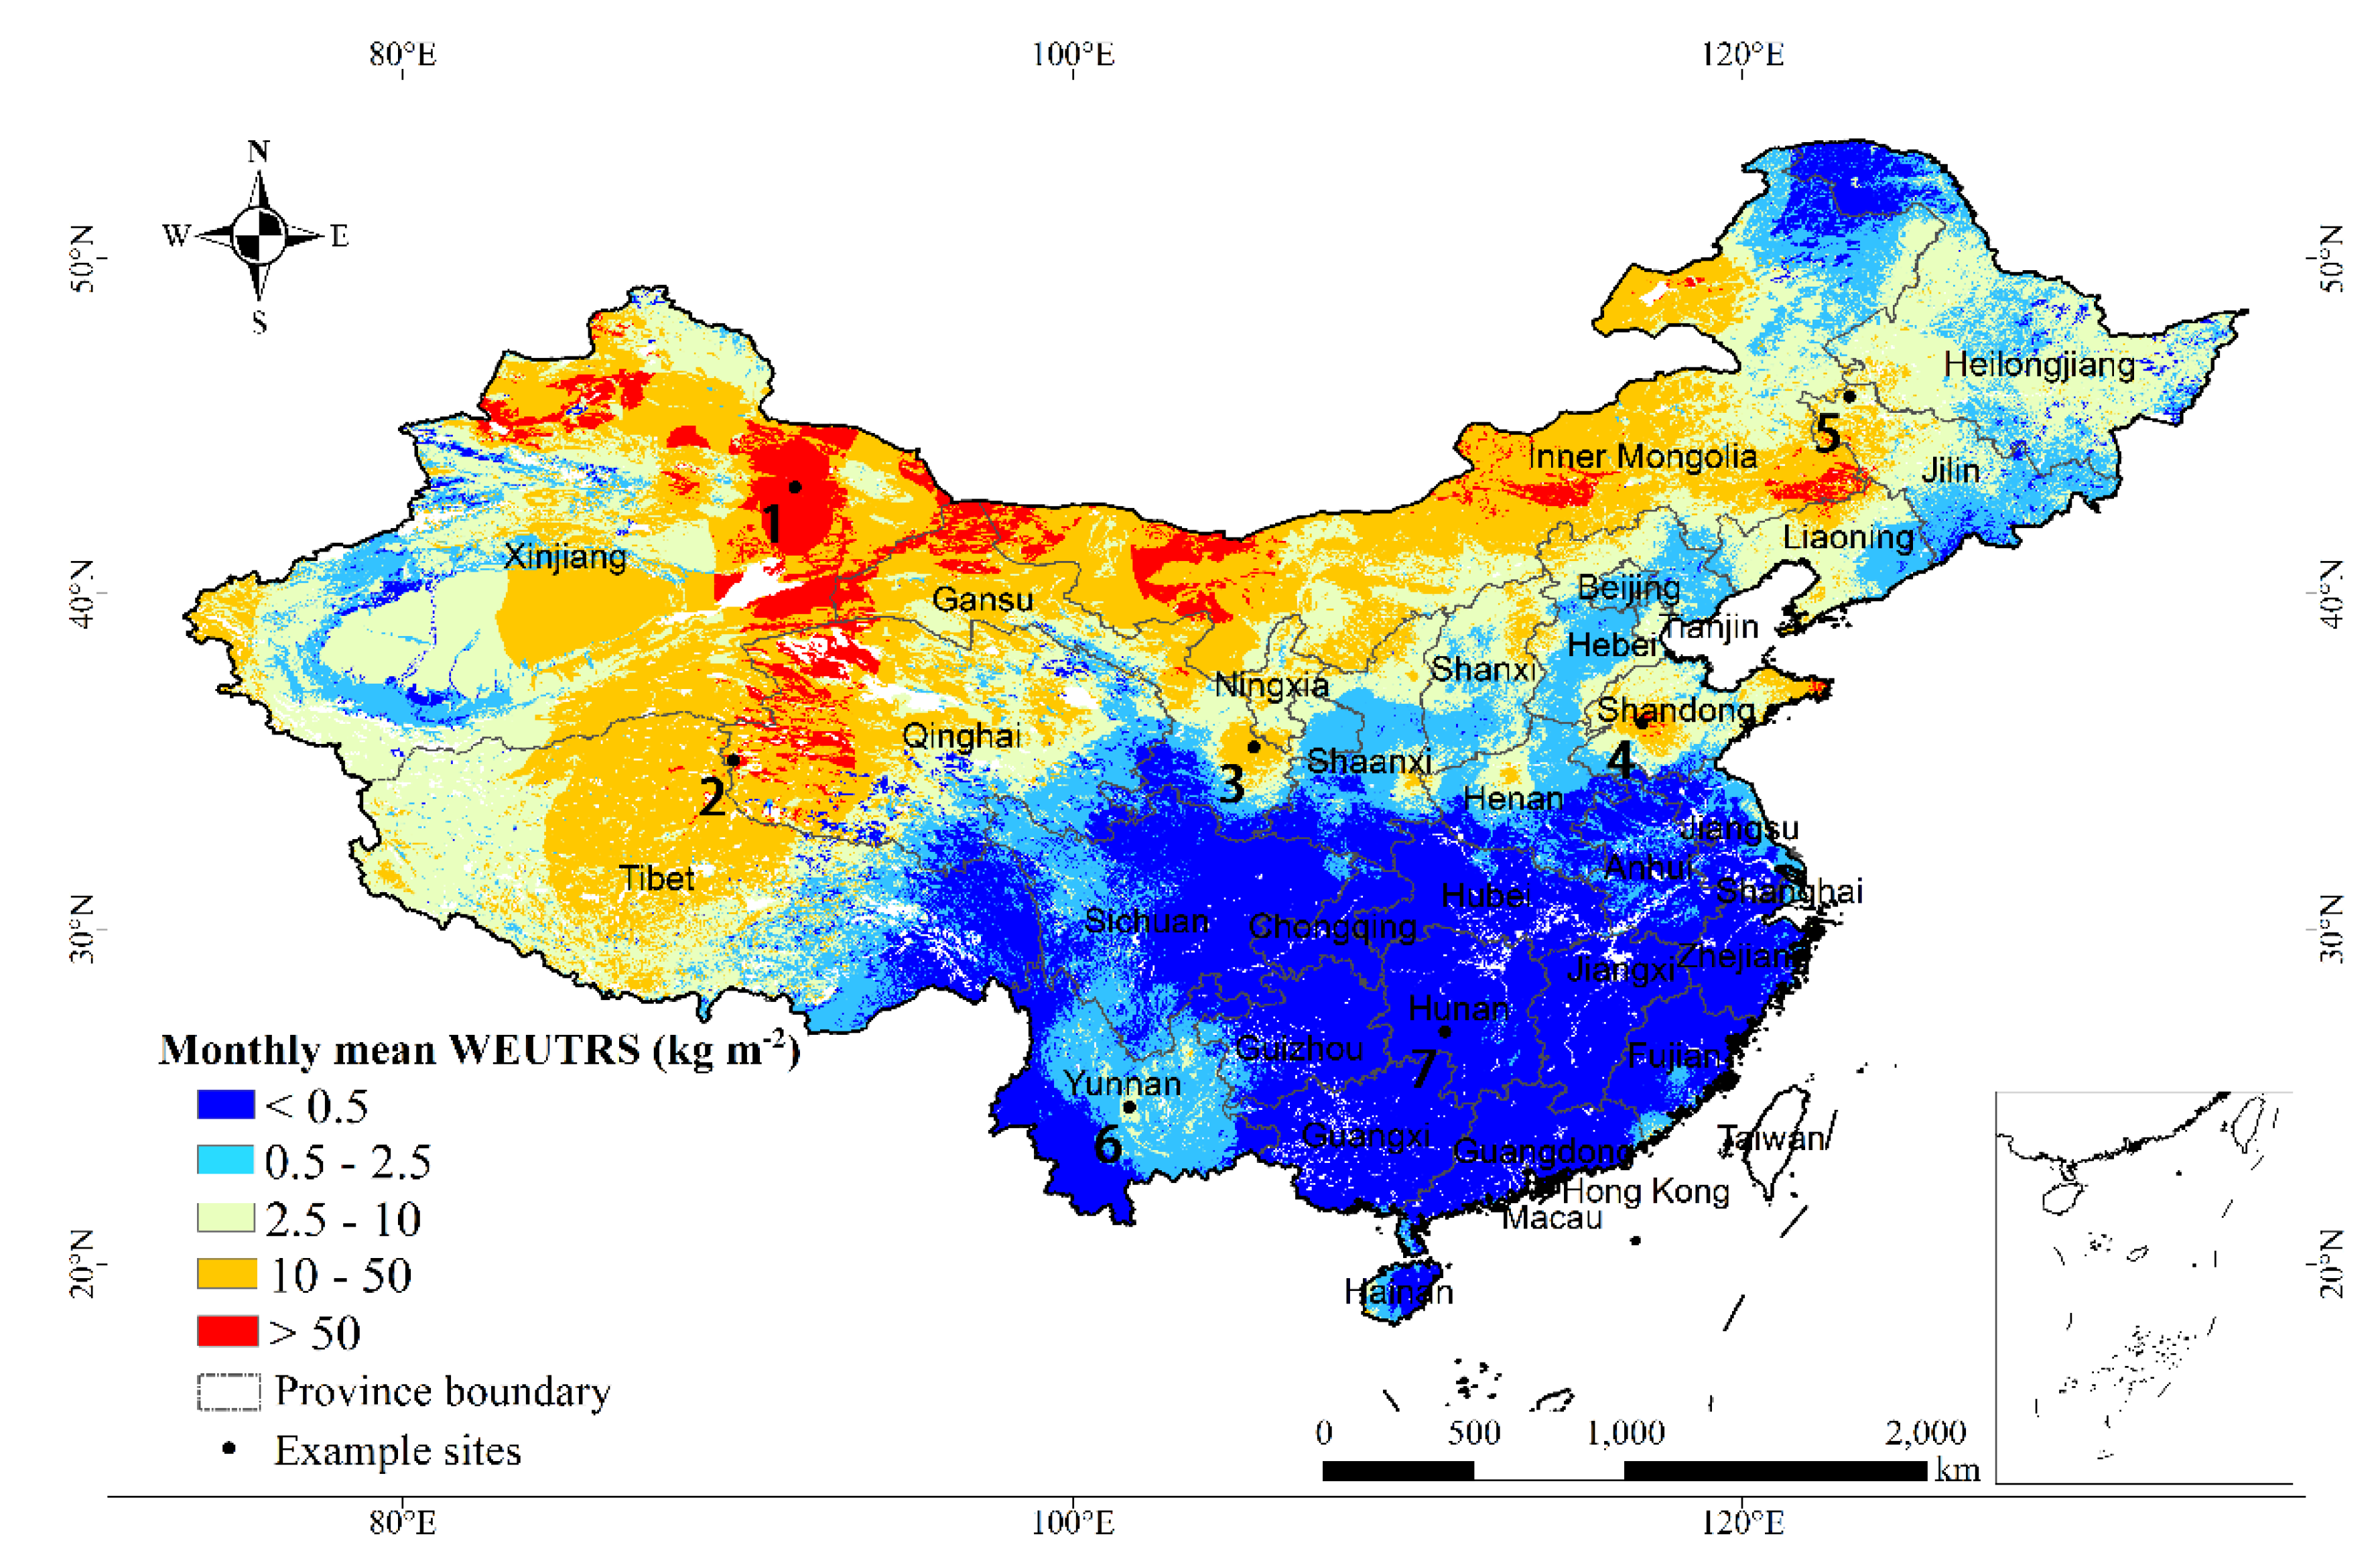
Taking April as an example (Figure 4), Xinjiang, Inner Mongolia, and Qinghai exhibited the highest WEUTRS (>50 kg m−2) on the national scale. The provinces with the second highest WEUTRS were Qinghai–Tibet Plateau, Inner Mongolia Plateau (Gansu, Ningxia, and Inner Mongolia), Northeast Plateau (Liaoning and Jilin), and Shandong Province (10–50 kg m−2). Yunnan–Guizhou Plateau in the Southwest had a relatively high WEUTRS (2.5–10 kg m−2) compared to other Southern provinces. Central Southern China is had the lowest WEUTRS (<0.5 kg m−2).
We selected seven simulated sites (i.e., seven pixels) in different regions as examples to further demonstrate the spatiotemporal heterogeneity (Figure 4, Table 1).
For the sites in Northern China (site 1 to 5), the WEUTRS in April were all relatively high but had great differences, from 321.98 kg m−2 to 15.92 kg m−2. For site 6 and 7 in Southern China, site 6 still had wind erosion of 3.28 kg m−2 on the unprotected topsoil surface, while wind erosion hardly affected the replaced topsoil on site 7.
Temporal-wise, the range of the monthly mean WEUTRS (Figure 5) was calculated by subtracting the minimum monthly mean of WEUTRS from the maximum in each pixel. This was used as a measure of temporal variation of WEUTRS in mainland China. The most drastic variation of the monthly mean of WEUTRS took place in Northwest China (Xinjiang, Qinghai) and part of Inner Mongolia Plateau, which was greater than 50 kg m−2. This was followed by the relatively drastic temporal change of the monthly mean of WEUTRS in Qinghai–Tibet Plateau and Shandong Province, which was greater than 10 kg m−2. Almost no temporal changes of the monthly mean of WEUTRS (<0.5 kg m−2) occurred in the provinces in Central Southern China, such as Sichuan, Hubei, Anhui, and Jiangxi.
Among the seven example sites (Table 1), site 1 had the largest temporal variation of 335.4 kg m−2. This difference between the maximum and the minimum monthly WEUTRS on site 1 was nearly four times larger than that of site 4 in Shandong, and five times larger than that of site 2 on the Qinghai–Tibet Plateau. For site 6 and 7 in Southern China, the temporal variation was small. The range of site 7 was especially close to 0 due to little WEUTRS in each month.
Regional-wise, in Northwest China, the extent of the monthly means of WEUTRS greater than 50 kg m−2 reached the largest in March, April, and May. In November, December, and January, the monthly mean WEUTRS decreased to less than 50 kg m−2. In the Qinghai–Tibet Plateau, the monthly mean WEUTRS stayed between 10 to 50 kg m−2 from November to May, and it reduced to less than 2.5 kg m−2 in June, July, August, and September. In the Inner Mongolia Plateau, the highest monthly mean of WEUTRS (>50 kg m−2) was in April and May, mainly appearing in the East and the North of the Inner Mongolia Plateau. In July to September, the extent of the monthly mean of WEUTRS was greater than 2.5 kg m−2, shrinking to the smallest. In Southern China, the monthly mean of WEUTRS was mainly less than 0.5 kg m−2 in every month through the year. The monthly mean of WEUTRS could increase to a maximum of 10 kg m−2, except in January to April in Yunnan–Guizhou Plateau in Southwest China.
3.2. Ratio of WEUTRS to Respread Topsoil Mass (Rw)
The evaluation results of WEUTRS showed a strong spatiotemporal heterogeneity. With the quantification of the WEUTRS, the soil loss ratio of WEUTRS to topsoil mass per m2 after the replacement (Rw) (Figure 6) was estimated. This was different from the wind erosion distribution under natural conditions (Appendix A, Figure A3). The distribution of Rw was consistent with the spatiotemporal pattern of the WEUTRS in Figure 3. When a region had a relatively high WEUTRS (≥2.5 kg m−2), the soil loss ratio was relatively high; hence, the topsoil replacement sites in this region suffered more severe wind erosion.
In Northwest China, Rw was greater than 10% from February to October. In Northern Xinjiang, especially, the accumulated percentage of soil loss accounting for the soil mass could be greater than 90% if a topsoil replacement site was unprotected from wind erosion from February to October.
In the Qinghai–Tibet Plateau, a Rw greater than 5% appeared from January to April. The accumulated soil loss percentage could be greater than 20% on the unprotected topsoil replacement sites in some parts during these four months.
In the Inner Mongolia Plateau, Rw was greater than 5% from March to June, and was greater than 10% in some areas in April and May.
In most of Southern China, the Rw was less than 0.1% through the year.
4. Discussion
4.1. Necessity of WEUTRS Quantification
In many regions, there is a considerable amount of soil loss by wind from topsoil replacement to the commencement of the vegetation growing season according to the accumulated Rw. This could subsequently affect the vegetation growth on the sites [54]. The spatiotemporal pattern of the quantified WEUTRS may be a scientific reference for wind erosion control on these sites to minimize soil loss.
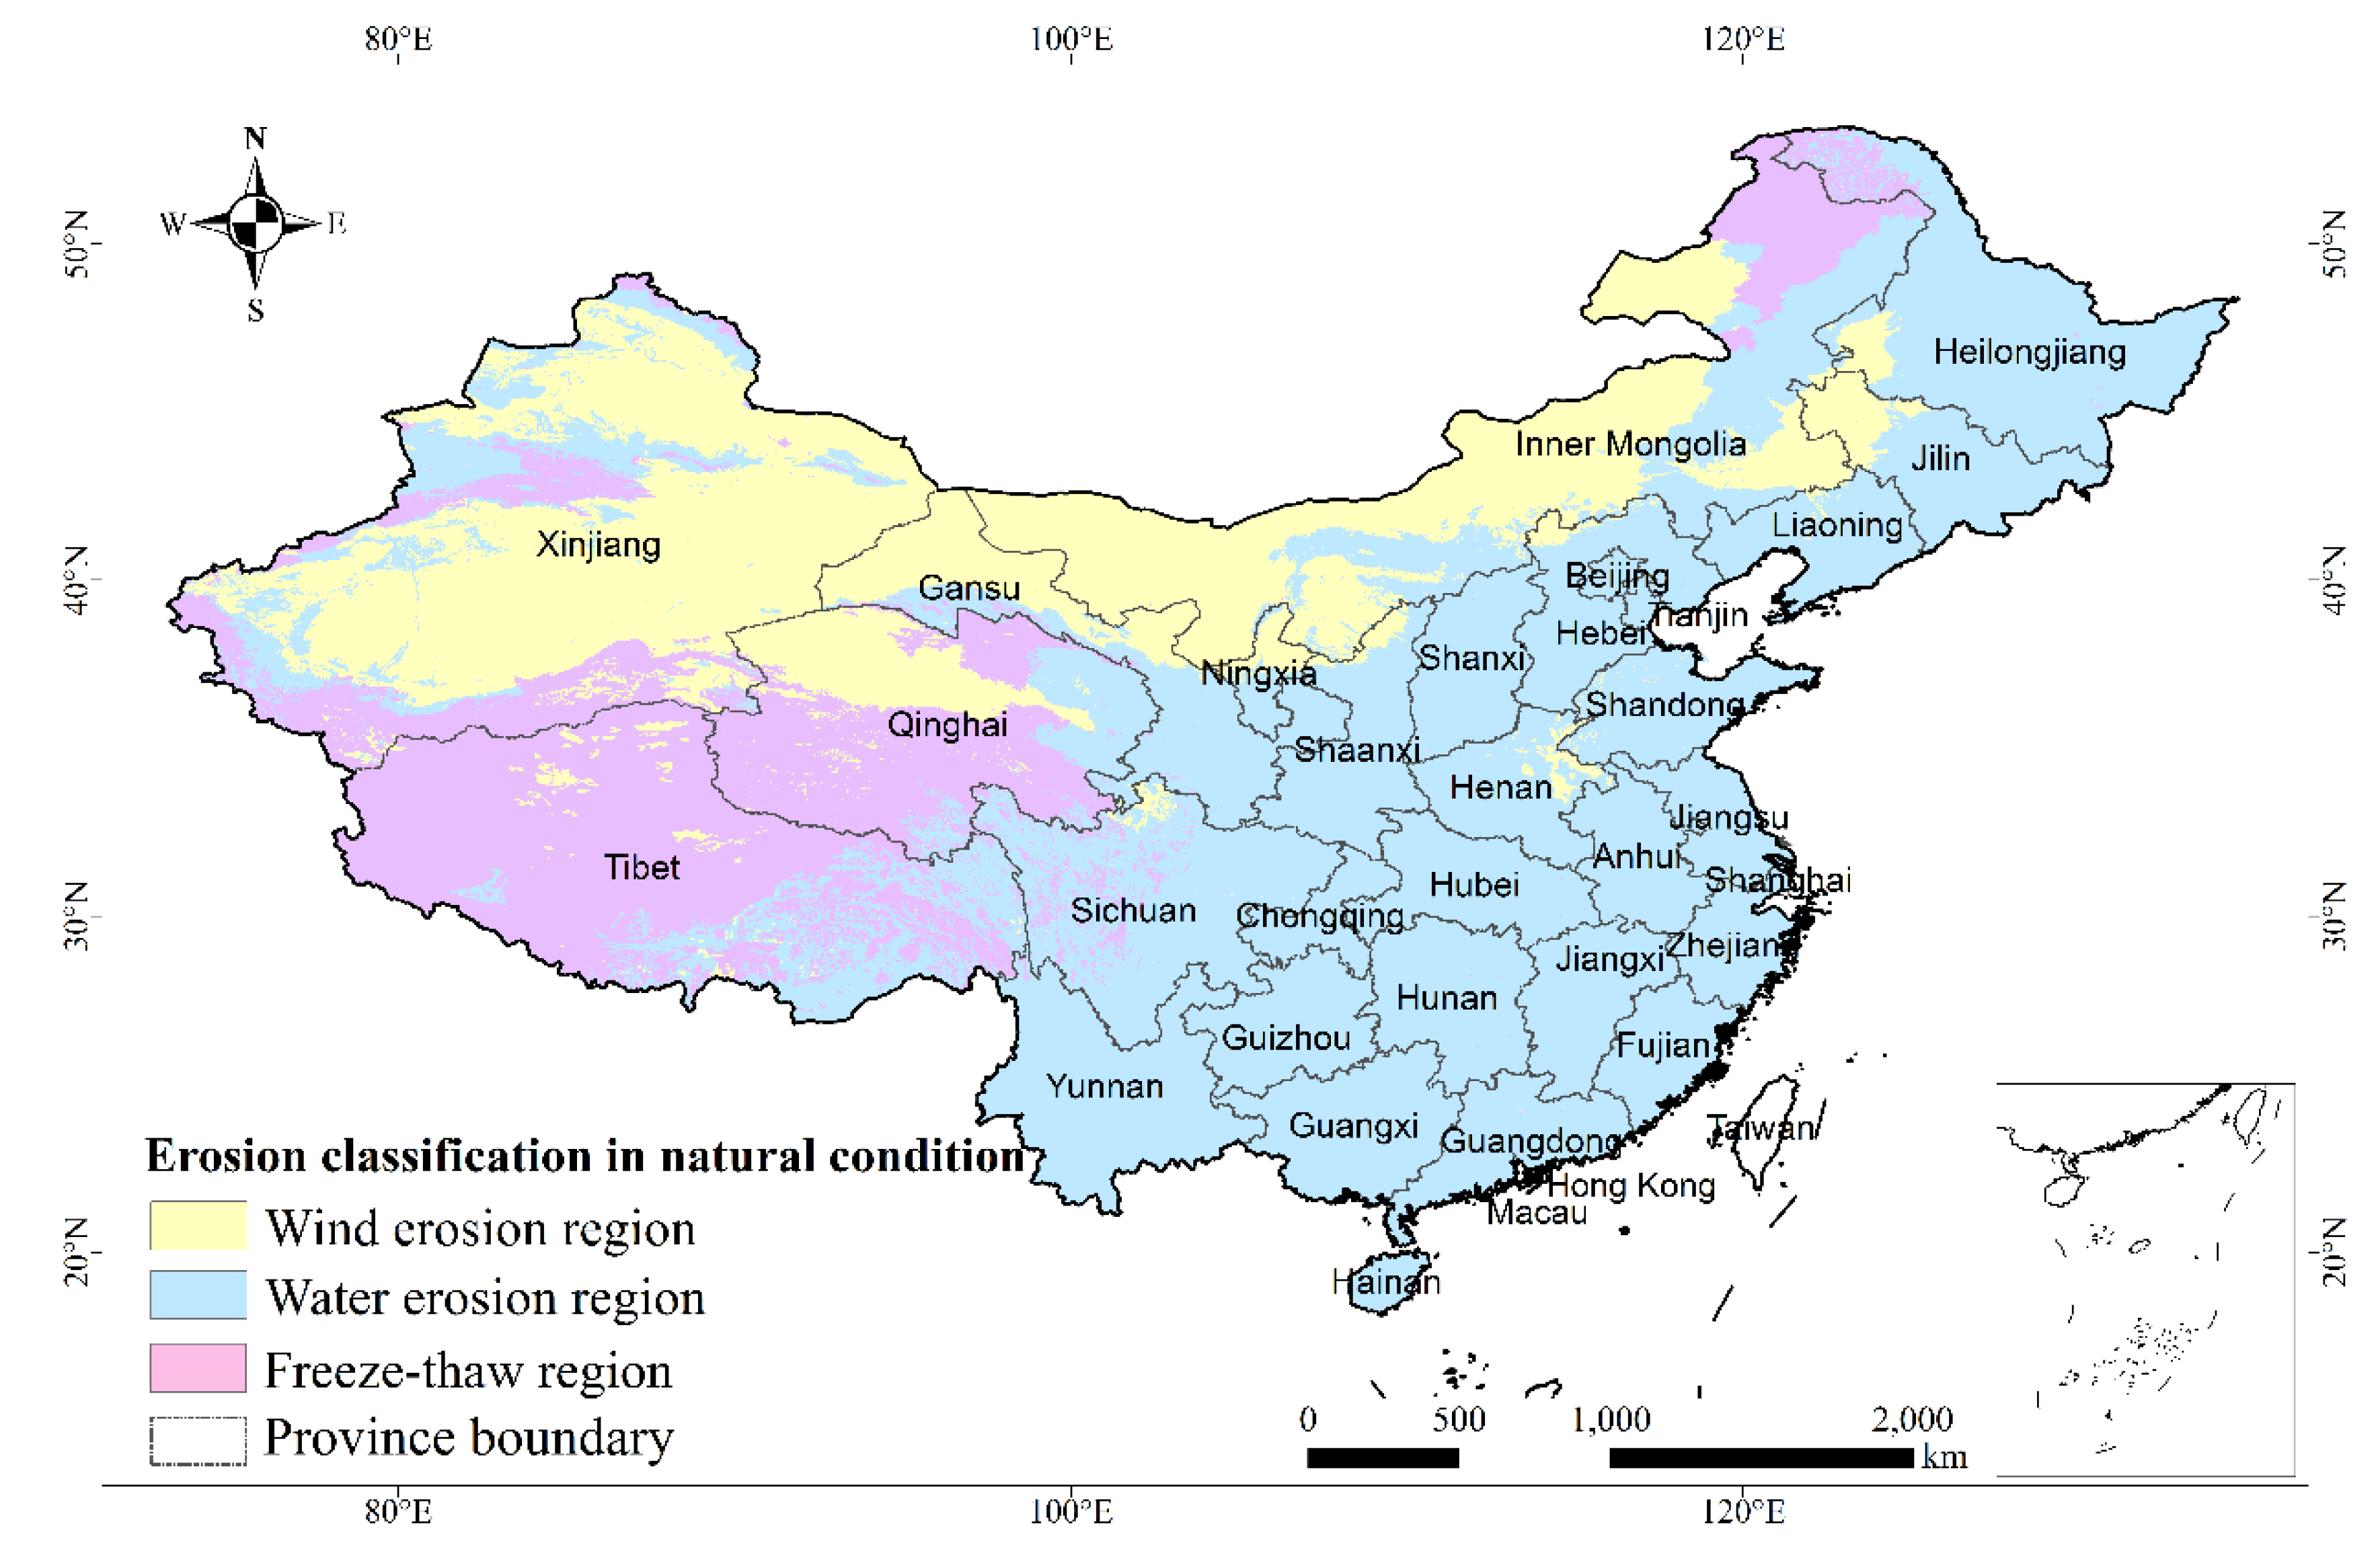
Sites in Northwest China are located inside the wind erosion region in natural conditions (Figure 6). This region is located in an arid area with intensive wind and erodible ground surface material, and can easily be eroded by wind when disturbed [55]. There are intensive human activities in this region—such as large opencast coal mining projects—especially in Xinjiang and Inner Mongolia [56]. The topsoil replacement sites on the mining dump could face severe wind erosion: the Rw could be greater than 10% per month from February to April (Figure 6)—hence, the accumulated soil loss ratio accounts for at least 20% of the replaced topsoil mass before April. The growing season begins in April in this area [57], and the vegetation growth on a topsoil replacement site may be affected by the soil loss by wind before the vegetation growing season. If there are any unprotected topsoil replacement sites in this region, the wind erosion control measures should be implemented in February to April to prevent at least 20% of the topsoil loss on the sites.
Soil loss by wind could also occur on the sites of the regions that are not included in wind erosion distribution in natural conditions (Figure 6). Wind erosion control in these regions could be overlooked on the unprotected topsoil replacement sites. For example, Qinghai–Tibet Plateau is classified to the freeze-thaw erosion region under natural conditions (Appendix A Figure A3), but the freeze–thaw cycles could induce wind erosion due to the fragile permafrost [58,59]. With the intensified human activities on the grass land in this region [13], if there is not any wind erosion control measures being implemented on the site before May, which is the commencement of the growing season in this region [59], the accumulated Rw could theoretically be 20% to 40% from January to April according to our study. In addition to its high elevation and low average temperature [59], the vegetation growth can be greatly affected.
Loess Plateau in Northern China is not included in the wind erosion region under natural conditions, as it is a water–wind erosion crisscross region and wind erosion mainly happens in winter and spring (December to May) [60]. For an unprotected topsoil replacement site, the accumulated ratio of soil loss by wind to topsoil mass can reach 3% to 15% from December to February, and greater than 15% from March to May.
In Yunnan–Guizhou Plateau, the vegetation growing season is divided into the dry season (from December to May) and the wet season (from June to November) [61]. The relatively severe wind erosion on topsoil replacement sites takes place in the dry season in this region. According to Figure 6, there is 0.4–4% of the accumulated soil loss ratio by wind from January to April. The Rw could reach 1% to 5% in March in some parts. As a typical water erosion region [62], the additional wind erosion in the dry season could aggravate a soil loss situation and affect its soil mass and land productivity [63].
4.2. Implications for Policy Makers, Local Management Authorities, and Practitioners
This study has implications for policy making, local management and supervision, and practice on wind erosion control on topsoil replacement sites for policy makers, local management authorities, and practitioners.
For policy makers, in the past, policy makers determined whether it was necessary to carry out wind erosion control measures based on the technical standard of soil and water conservation for production and construction projects in China [23].The wind erosion control areas are mainly classified by typical erosion regions under natural conditions with different soil types (e.g., black soil zone of Northeast China, red soil zone of Southern China, etc.), which is vaguely described and not precisely quantified. This could cause the neglect of wind erosion control in some areas and a waste of time and resources. The idea of spatiotemporal differentiated management is widely applied in environmental policy making [29,64,65,66]. The spatiotemporal pattern of WEUTRS in this study offers a comprehensive knowledge of the monthly WEUTRS in different locations. With the proper threshold of WEUTRS in different regions, policy makers are able to determine whether an unprotected topsoil replacement site needs wind erosion control or not according to the project location and local vegetation growing season. The sites could be classified into three types: (1) must implement wind erosion control measures in each month through the year; (2) needs wind erosion control measures in specific months of the year; or (3) no need for wind erosion control at all. The relevant policy can optimize money, labor, and raw material allocation during the wind erosion control in topsoil handling in order to both conserve topsoil and reduce the cost.
For local management authorities, the local authorities are responsible for the management and supervision of conducting wind erosion control [23] and could give the instructions and supervision of the proper schedule of the topsoil handling process to control wind erosion during a mining and construction project [14]. With the help of the WEUTRS quantification results, the working schedule of a mining and construction project can be determined according to the severity of the monthly mean of WEUTRS. For example, the working schedule of topsoil replacement should take place after the months with a severe WEUTRS monthly mean and before the local vegetation growing season, which needs to be under the supervision of the local authorities so that the soil loss by wind can be minimized on these sites.
For practitioners, the construction contractors are obliged to control wind and water erosion during the projects [23]. Combined with the relevant policy, the quantification of WEUTRS in each month provides the explicit data support to minimize misunderstandings from construction personnel as to what is required [29]. The practitioners of the mining and construction projects could select a proper topsoil handling working schedule and wind erosion control measures according to the severity of the monthly mean of WEUTRS.
4.3. Research Implications
This study has important implications for future research regarding wind erosion control on topsoil replacement sites.
Northwest China, the North part of Inner Mongolia Plateau, and Qinghai–Tibet Plateau are the study areas of many wind erosion researchers in China [13,45,67,68,69]. However, this research mainly focuses on wind erosion in natural conditions and the measures of combating desertification [13,69,70]. The results in our study show that the most severe WEUTRS takes place in these regions. From the perspective of wind erosion control, more research attention should be paid to: (1) field measurements of wind erosion on unprotected topsoil replacement sites, and (2) the evaluation of the impacts of vegetation recovery and the subsequent influences on land productivity and biodiversity on the topsoil replacement sites.
Regions such as Loess Plateau, Shandong Province, Yunnan–Guizhou Plateau, and the Southeast coast of mainland China have relatively high WEUTRS in specific months. They are mostly classified as water erosion areas [62] and are not included in wind erosion distribution areas under natural conditions. A large amount of soil is disturbed and replaced by human activities [30,63,71,72], and wind erosion is an issue that is just as important as other types of soil erosion during or following the project period. Research into wind erosion quantification and wind erosion control on topsoil replacement sites is deficient in these regions. The impacts of wind erosion on vegetation recovery, biodiversity, and land productivity is worth studying further.
The approach of evaluating the WEUTRS is suitable for simulating soil loss by wind on unprotected topsoil replacement sites nationwide, regionwide, or on other large scales. The input data are easy to obtain and normally have a low cost, such as soil raster data and weather station data. In addition, a field measurement is not necessary for the simulation of WEUTRS [45]. The quantification result can be a reliable scientific basis for the management and supervision in wind erosion control on unprotected topsoil replacement sites on a large scale.
4.4. Limitations
Enhancements in the input data could further improve the accuracy of the RWEQ model results in future studies [45]. The samples of the weather station are not geographically evenly distributed. There is a lack of weather stations, especially in Tibet (Appendix A Figure A1). The increased variance and data range of the weather data together could cause an unavoidably inaccurate interpolation of the wind factor [73]. Moreover, in the practice of topsoil replacement, the actual establishment of the sites may have problems of non-standard operations, such as topsoil and subsoil mixing, machinery compaction, and the non-perpendicular angle of the ridge to the dominant wind direction, etc. [7].
When evaluating the WEUTRS in specific topsoil handling projects, the field sampling data of local wind velocity and direction observations, soil roughness, and vegetation factors could be considered in the wind erosion prediction, thereby decreasing the inaccuracy caused by incomprehensive input data.
In addition, due to the different soil types and land use types in different locations, the respread topsoil thickness on topsoil replacement sites varies [52,74]. The determination of the thickness of respread topsoil for the estimation of soil mass is not discussed in detail in this study and can be studied in the follow-up research.
5. Conclusions
This study evaluates how much wind erosion would occur on site if topsoil was respread without prevention measures in each month across mainland China. This potential wind erosion shows a great spatiotemporally heterogeneous pattern over the whole country and could cause severe soil losses on sites in many regions. The pattern distinctly differs from that of wind erosion on natural landscapes and highlights the necessity of spatiotemporally differentiated management for wind erosion control on topsoil replacement sites on the national scale of China. The results can serve as a scientific basis for the relevant policy making and help to optimize the working schedule to minimize wind erosion for practitioners in the topsoil handling process. Moreover, this study provides directions for future research, such as the impacts of wind erosion on vegetation recovery, land productivity, and the biodiversity of the unprotected topsoil replacement sites, and the development of effective measures for wind erosion prevention on these sites.
Author Contributions
Conceptualization, X.F.; Data curation, C.Z.; Formal analysis, C.Z.; Funding acquisition, Z.B.; Investigation, C.Z.; Supervision, Z.B.; Writing—original draft, C.Z.; Writing—review & editing, C.Z., X.F. and Z.B. All authors have read and agreed to the published version of the manuscript.
Funding
This research was funded by National Key Research and Development Program of China, grant number 2017YFF0206800. The APC was funded by Zhongke Bai.
Conflicts of Interest
The authors declare no conflicts of interest.
Appendix A
Figure A1.
Distribution of weather stations.

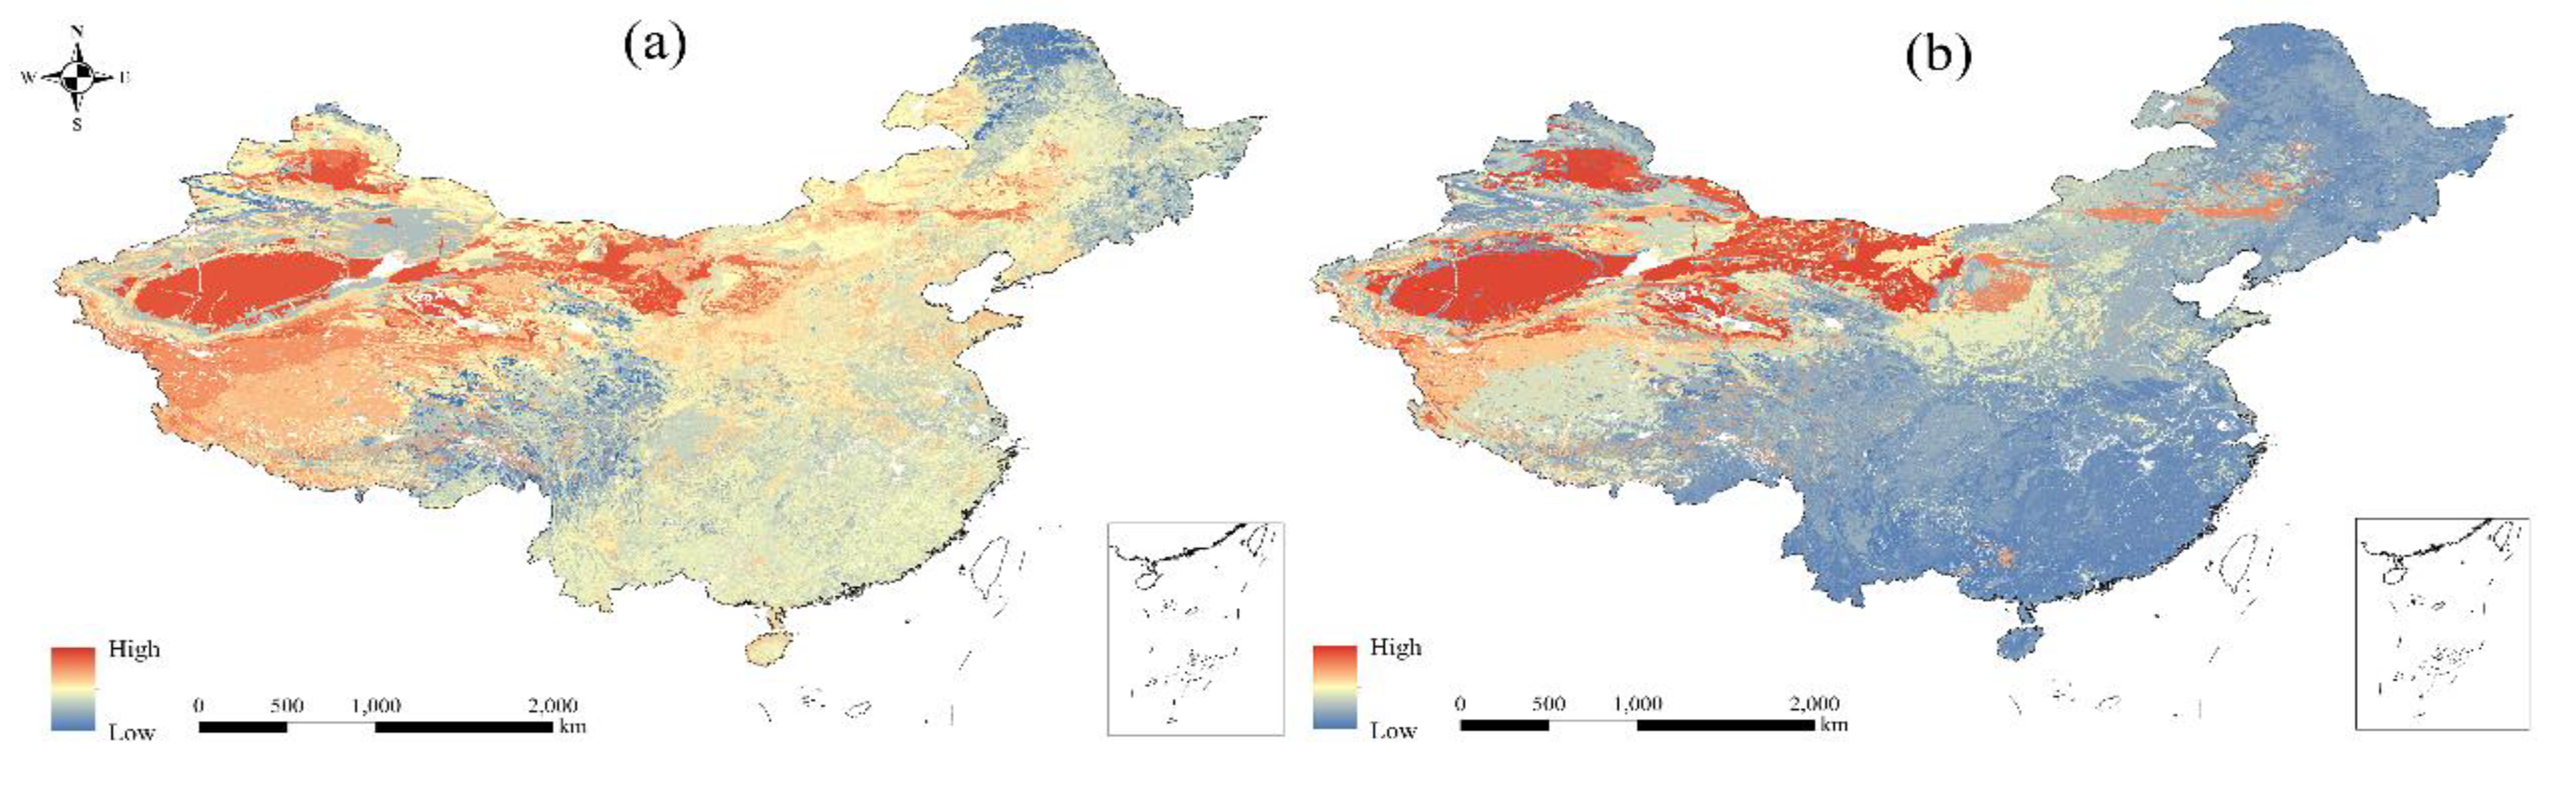
Figure A2.
(a) Erodible factor (EF); (b) Soil crust factor (SCF).

Figure A3.
Soil erosion distribution of China.

The soil erosion distribution was obtained from the Resource and Environment Data Cloud Platform of the Institute of Geographic Sciences and Natural Resources Research, Chinese Academy of Sciences, according to the standards for classification and gradation of soil erosion [35,40]. It shows a general distribution of soil erosion for naturally formed topsoil with natural soil layers and cover (e.g., vegetation, clods, etc.) on the surface in decades, or even hundreds of years. Soil loss tolerance is used as the threshold for soil loss by wind, which is mainly determined by a soil formation rate [75].
References
- European Commission. Soil. Available online: http://ec.europa.eu/environment/soil/index_en.htm (accessed on 5 July 2019).
- Strohmayer, P. Soil Stockpiling for Reclamation and Restoration activities after Mining and Construction. Restor. Reclam. Rev. 1999, 4, 1–6. [Google Scholar]
- Davies, R.; Hodgkinson, R.; Younger, A.; Chapman, R. Nitrogen Loss from a Soil Restored after Surface Mining. J. Environ. Qual. 1995, 24, 1215–1222. [Google Scholar] [CrossRef]
- Liu, X.; Zhang, W.; Wu, M.; Ye, Y.; Wang, K.L.; Li, D. Changes in soil nitrogen stocks following vegetation restoration in a typical karst catchment. Land Degrad. Dev. 2019, 30, 60–72. [Google Scholar] [CrossRef] [Green Version]
- DePuit, E.J. Potential topsoiling strategies for enhancement of vegetation diversity on mined lands. Miner. Environ. 1984, 6, 115–120. [Google Scholar] [CrossRef]
- Borůvka, L.; Kozák, J.; Mühlhanselová, M.; Donátová, H.; Nikodem, A.; Němeček, K.; Drábek, O. Effect of covering with natural topsoil as a reclamation measure on brown-coal mining dumpsites. J. Geochem. Explor. 2012, 113, 118–123. [Google Scholar] [CrossRef]
- Moffat, A.J.; McNeill, J.D. During mineral extraction. In Reclaiming Disturbed Land for Forestry; HMSO: London, UK, 1994; pp. 28–29. [Google Scholar]
- Maiti, S.K. Topsoil Management. In Ecorestoration of the Coalmine Degraded Lands; Springer: New Delhi, India, 2013; pp. 83–96. [Google Scholar]
- Ramsay, W.J.H. Bulk soil handling for quarry restoration. Soil Use Manag. 1986, 2, 30–39. [Google Scholar] [CrossRef]
- Coffey, P.S.; Scott, W.D.; Summers, K.J. The Effects of Tailing Dam Profiles on Relative Wind Erosion Rates. J. Environ. Qual. 1986, 15, 168–172. [Google Scholar] [CrossRef]
- Brotons, J.M.; Diaz, A.R.; Sarria, F.A.; Serrato, F.B. Wind Erosion on Mining Waste in Southeast Spain. Land Degrad. Dev. 2010, 21, 196–209. [Google Scholar] [CrossRef]
- Israelsen, C.E.; Clyde, C.G.; Fletcher, J.E.; Israelsen, E.K.; Haws, F.W.; Packer, P.E.; Farmer, E.E. Erosion Control during Highway Construction Research Report—National Cooperative Highway Research Program 220; Transportation Research Board: Washington, DC, USA, 1980. [Google Scholar]
- Jiang, Y.; Gao, Y.; Dong, Z.; Liu, B.; Zhao, L. Simulations of wind erosion along the Qinghai-Tibet Railway in north-central Tibet. Aeolian Res. 2018, 32, 192–201. [Google Scholar] [CrossRef]
- Liu, B.; Wagner, L.E.; Ning, D.; Qu, J. Estimation of wind erosion from construction of a railway in arid Northwest China. Int. Soil Water Conserv. Res. 2017, 5, 102–108. [Google Scholar] [CrossRef]
- Harbor, J. Engineering geomorphology at the cutting edge of land disturbance: Erosion and sediment control on construction sites. Geomorphology 1999, 31, 247–263. [Google Scholar] [CrossRef]
- Ghose, M. Effect of opencast mining on soil fertility. J. Sci. Ind. Res. 2004, 63, 1006–1009. [Google Scholar]
- Fryrear, D.W. Soil cover and wind erosion. Trans. ASAE 1985, 28, 781–784. [Google Scholar] [CrossRef]
- Ferris, F.; Kleinman, L.; Steward, D.; Stowe, R.; Vicklund, L.; Berry, J.; Cowan, R.; Dunne, C.; Dunne, R.; Fritz, D.; et al. Handbook of Western Reclamation Techniques; Western Regional Coordinating Center Office of Surface Mining Reclamation and Enforcement: Denver, CO, USA, 1996.
- Tanner, S.; Katra, I.; Argaman, E.; Ben-Hur, M. Erodibility of waste (Loess) soils from construction sites under water and wind erosional forces. Sci. Total Environ. 2018, 616, 1524–1532. [Google Scholar] [CrossRef] [PubMed]
- Power, J.F.; Sandoval, F.M.; Ries, R.E.; Merrill, S.D. Effects of Topsoil and Subsoil Thickness on Soil Water Content and Crop Production on a Disturbed Soil1. Soil Sci. Soc. Am. J. 1981, 45, 124. [Google Scholar] [CrossRef]
- Bowen, C.; Olson, R.; Schuman, G.; Ingram, L. Long-term plant community responses to topsoil replacement depth on reclaimed mined land. Reclam. Purp. Am. Soc. Min. Reclam. Lexingt. Ky. 2002, 19, 130–140. [Google Scholar]
- Yan, H.; Wang, S.; Wang, C.; Zhang, G.; Patel, N. Losses of soil organic carbon under wind erosion in China. Glob. Chang. Biol. 2010, 11, 828–840. [Google Scholar] [CrossRef]
- Ministry of Water Resource of the People’s Republic of China. Technical Standard of Soil and Water Conservation for Production and Construction Projects; GB 50433-2018; Ministry of Water Resource of the People’s Republic of China: Beijing, China, 2018. (In Chinese)
- Agriculture and Agri-Food Canada (AAFC). Topsoil Preservation Act c230. In RSNB 2011; Agriculture and Agri-Food Canada: Ottawa, ON, Canada, 2011. [Google Scholar]
- Department for Environment, Food and Rural Affairs (DEFRA). DEFRA Guidance for Successful Reclamation of Mineral and Waste Sites; Defra: London, UK, 2004.
- The Pipelines Act, c.P-12.1; The Queens Printer: Saskatchewan, Canada, 1998.
- Ronchi, S.; Salata, S.; Arcidiacono, A.; Piroli, E.; Montanarella, L. Policy instruments for soil protection among the EU member states: A comparative analysis. Land Use Policy 2019, 82, 763–780. [Google Scholar] [CrossRef]
- Electronic Code of Federal Regulations, Mineral Resources. 2019. Available online: https://www.ecfr.gov/cgi-bin/text-idx?SID=dda42636430ba136b7874b9784b2dff1&mc=true&node=se30.3.816_122&rgn=div8 (accessed on 20 July 2019).
- Israelsen, C.E.; Clyde, C.G.; Fletcher, J.E.; Israelsen, E.K.; Haws, F.W.; Packer, P.E.; Farmer, E.E. Erosion Control during Highway Construction Manual on Principles and Practices—National Cooperative Highway Research Program 221; Transportation Research Board: Washington, DC, USA, 1980. [Google Scholar]
- Zheng, F.; Wang, B. Soil Erosion in the Loess Plateau Region of China. In Restoration and Development of the Degraded Loess Plateau, China. Ecological Research Monographs; Tsunekawa, A., Liu, G., Yamanaka, N., Du, S., Eds.; Springer: Tokyo, Japan, 2014; pp. 77–92. [Google Scholar]
- Gao, B. The Area of Annual Destruction of Cultivated Land in the Country Exceeds the Area of Taihu Lake. Available online: http://w.huanqiu.com/r/MV8wXzk1NzQ4NTdfMjM1XzE0NzY5MDU0ODU= (accessed on 2 May 2019).
- Ministry of Natural Resources of the People’s Republic of China. Specification for Planning and Design for Land Consolidation and Rehabilitation Project; TD/T 1012-2016; Ministry of Natural Resources of the People’s Republic of China: Beijing, China, 2016. (In Chinese) [Google Scholar]
- Ministry of Natural Resources of the People’s Republic of China. Technical Specifications for Stripping and Using of Plough Layer Soil; TD/T 1048-2016; Ministry of Natural Resources of the People’s Republic of China: Beijing, China, 2016. (In Chinese) [Google Scholar]
- National Meteorological Information Center. Available online: http://data.cma.cn (accessed on 10 March 2019).
- Resource and Environment Data Cloud Platform. Available online: http://www.resdc.cn (accessed on 10 March 2019).
- Cold and Arid Regions Science Data Center (Lanzhou). Available online: http://westdc.westgis.ac.cn (accessed on 10 March 2019).
- Shangguan, W.; Dai, Y.; Liu, B.; Zhu, A.; Duan, Q.; Wu, L.; Ji, D.; Ye, A.; Hua, Y.; Qian, Z. A China Dataset of Soil Properties for Land Surface Modeling. J. Adv. Model. Earth Syst. 2013, 5, 212–224. [Google Scholar] [CrossRef]
- Nemes, A.; Wösten, J.H.M.; Lilly, A.; Voshaar, J.H.O. Evaluation of different procedures to interpolate particle-size distributions to achieve compatibility within soil databases. Geoderma 1999, 90, 187–202. [Google Scholar] [CrossRef]
- Buchan, G.D.; Grewal, K.S.; Robson, A.B. Improved Models of Particle-Size Distribution: An Illustration of Model Comparison Techniques. Soil Sci. Soc. Am. J. 1993, 57, 901–908. [Google Scholar] [CrossRef] [Green Version]
- Ministry of Water Resources of the People’s Republic of China. Standards for Classification and Gradation of Soil Erosion; Ministry of Water Resources of the People’s Republic of China: Beijing, China, 2008. (In Chinese)
- Fryrear, D.W.; Saleh, A.; Bilbro, J.D.; Schromberg, H.M.; Stout, J.E.; Zobeck, T.M. Revised Wind Erosion Equation (RWEQ); Technical Bulletin NO.1; Southern Plains Area Cropping Systems Research Laboratory, Wind Erosion and Water Conservation Research Unit, USDA: TX, USA, 1998.
- Fryrear, D.W.; Bilbro, J.D.; Saleh, A.; Schomberg, H.; Stout, J.E.; Zobeck, T.M. RWEQ: Improved wind erosion technology. J. Soil Water Conserv. 2000, 55, 183–189. [Google Scholar]
- Youssef, F.; Visser, S.; Karssenberg, D.; Bruggeman, A.; Erpul, G. Calibration of RWEQ in a patchy landscape; a first step towards a regional scale wind erosion model. Aeolian Res. 2012, 3, 467–476. [Google Scholar] [CrossRef] [Green Version]
- Guo, Z.; Zobeck, T.M.; Stout, J.E.; Zhang, K. The effect of wind averaging time on wind erosivity estimation. Earth Surf. Process. Landf. 2012, 37, 797–802. [Google Scholar] [CrossRef]
- Borrelli, P.; Lugato, E.; Montanarella, L.; Panagos, P. A New Assessment of Soil Loss Due to Wind Erosion in European Agricultural Soils Using a Quantitative Spatially Distributed Modelling Approach. Land Degrad. Dev. 2017, 28, 335–344. [Google Scholar] [CrossRef] [Green Version]
- Du, H.Q.; Xue, X.; Wang, T.; Deng, X.H. Assessment of wind-erosion risk in the watershed of the Ningxia-Inner Mongolia Reach of the Yellow River, northern China. Aeolian Res. 2015, 17, 193–204. [Google Scholar] [CrossRef]
- Gong, G.L.; Liu, J.Y.; Shao, Q.Q.; Zhai, J. Sand-fixing Function under the Change of Vegetation Coverage in a Wind Erosion Area in Northern China. J. Resour. Ecol. 2014, 5, 105–114. [Google Scholar]
- Hudson, G.; Wackernagel, H. Mapping temperature using kriging with external drift: Theory and an example from Scotland. Int. J. Climatol. 1994, 14, 77–91. [Google Scholar] [CrossRef]
- Oliver, M.A.; Webster, R. Kriging: A method of interpolation for geographical information systems. Int. J. Geogr. Inf. Syst. 1990, 4, 313–332. [Google Scholar] [CrossRef]
- Dong, Y.X.; Kang, G.D. Study on the wind erosion climatic erosivity in arid and semi-arid areas in China. J. Soil Water Conserv. 1994, 8, 1–7. [Google Scholar]
- Guo, Z. Improvement and Application of RWEQ model in North China. Ph. D Thesis, Beijing Normal University, Beijing, China, 2012. (In Chinese). [Google Scholar]
- Saleh, A. Soil Roughness Measurement—Chain Method. J. Soil Water Conserv. 1993, 48, 527–529. [Google Scholar]
- Ministry of Natural Resources of the People’s Republic of China. Completion Standards on Land Reclamation Quality; Ministry of Natural Resources of the People’s Republic of China: Beijing, China, 2013. (In Chinese) [Google Scholar]
- Li, F.; Zhao, W.; Liu, J.; Huang, Z. Degraded vegetation and wind erosion influence soil carbon, nitrogen and phosphorus accumulation in sandy grasslands. Plant Soil 2009, 317, 79. [Google Scholar] [CrossRef]
- Dong, Z.; Wang, X.; Liu, L. Wind Erosion in Arid and Semiarid China: An Overview. J. Soil Water Conserv. 2000, 55, 439–444. [Google Scholar]
- Yang, J.Z. Remote Sensing Monitoring of Mine Geological Environment in China; Geological Publishing House: Beijing, China, 2016. (In Chinese) [Google Scholar]
- He, B.; Ding, J.; Li, H.; Liu, B.; Chen, W. Spatiotemporal variation of vegetation phenology in Xinjiang from 2001 to 2016. Acta Ecol. Sin. 2018, 38, 2139–2155. (In Chinese) [Google Scholar]
- Liu, T.; Xu, X.; Yang, J. Experimental study on the effect of freezing-thawing cycles on wind erosion of black soil in Northeast China. Cold Reg. Sci. Technol. 2017, 136, 1–8. [Google Scholar] [CrossRef]
- Huang, W.; Zeng, T.; Huang, X. Spatiotemporal dynamics of alpine grassland phenology on the Tibetan Plateau. Pratacultural. Sci. 2019, 36, 1032–1043. (In Chinese) [Google Scholar]
- Tuo, D.; Xu, M.; Gao, G. Relative contributions of wind and water erosion to total soil loss and its effect on soil properties in sloping croplands of the Chinese Loess Plateau. Sci. Total Environ. 2018, 633, 1032–1040. [Google Scholar] [CrossRef]
- Zhang, G.S.; Hu, X.B.; Zhang, X.X.; Li, J. Effects of plastic mulch and crop rotation on soil physical properties in rain-fed vegetable production in the mid-Yunnan plateau, China. Soil Tillage Res. 2015, 145, 111–117. [Google Scholar] [CrossRef]
- Tian, G.; Zhang, Z.; Zhao, X.; Zhou, Q.; Tan, W. The soil erosion distribution characteristics and ecological background of Chinese cultivated land. Acta Ecol. Sin. 2002, 22, 10–16. [Google Scholar]
- Whitmore, T.J.; Brenner, M.; Engstrom, D.R.; Song, X. Accelerated soil erosion in watersheds of Yunnan Province, China. J. Soil Water Conserv. 1994, 49, 67–72. [Google Scholar]
- Jim, C.Y.; Zhang, H. Urbanization effects on spatial-temporal differentiation of tree communities in high-density residential areas. Urban Ecosyst. 2015, 18, 1081–1101. [Google Scholar] [CrossRef]
- Feitelson, E.; Salomon, I.; Cohen, G. From policy measures to policy packages: A spatially, temporally and institutionally differentiated approach. In Transport and Environment: In Search of Sustainable Solutions; Feitelson, E., Verhoef, E.T., Eds.; Edward Elgar Pub: Cheltenham, UK, 2001; pp. 34–35. [Google Scholar]
- Cui, S.; Fu, Q.; Guo, L.; Li, Y.F.; Li, T.X.; Ma, W.L.; Wang, M.; Li, W.L. Spatial–temporal variation, possible source and ecological risk of PCBs in sediments from Songhua River, China: Effects of PCB elimination policy and reverse management framework. Mar. Pollut. Bull. 2016, 106, 109–118. [Google Scholar] [CrossRef] [PubMed]
- Zou, X.; Li, J.; Cheng, H.; Wang, J.; Zhang, C.; Kang, L.; Liu, W.; Zhang, F. Spatial variation of topsoil features in soil wind erosion areas of northern China. CATENA 2018, 167, 429–439. [Google Scholar] [CrossRef]
- Bryan, B.A.; Gao, L.; Ye, Y.; Sun, X.; Connor, J.D.; Crossman, N.D.; Stafford-Smith, M.; Wu, J.; He, C.; Yu, D. China’s response to a national land-system sustainability emergency. Nature 2018, 559, 193–204. [Google Scholar] [CrossRef] [PubMed]
- Guo, Z.; Huang, N.; Dong, Z.; Van Pelt, R.S.; Zobeck, T.M. Wind Erosion Induced Soil Degradation in Northern China: Status, Measures and Perspective. Sustainability 2014, 6, 8951–8966. [Google Scholar] [CrossRef] [Green Version]
- Chi, W.; Zhao, Y.; Kuang, W.; He, H. Impacts of anthropogenic land use/cover changes on soil wind erosion in China. Sci. Total Environ. 2019, 668, 204–215. [Google Scholar] [CrossRef]
- Fu, B. Soil erosion and its control in the Loess Plateau of China. Soil Use Manag. 1989, 5, 76–82. [Google Scholar] [CrossRef]
- Wang, G.; Innes, J.; Yusheng, Y.; Shanmu, C.; Krzyzanowski, J.; Jingsheng, X.; Wenlian, L. Extent of soil erosion and surface runoff associated with large-scale infrastructure development in Fujian Province, China. CATENA 2012, 89, 22–30. [Google Scholar] [CrossRef]
- Collins, F.C. A Comparison of Spatial Interpolation Techniques in Temperature Estimation. Available online: http://www.ncgia.ucsb.edu/SANTA_FE_CD-ROM/sf_papers/collins_fred/collins.html (accessed on 21 August 2019).
- Larney, F.; Akinremi, O.; Lemke, R.; Klaassen, V.; Janzen, H. Crop response to topsoil replacement depth and organic amendment on abandoned natural gas wellsites. Can. J. Soil Sci. 2003, 83, 415–423. [Google Scholar] [CrossRef] [Green Version]
- Li, L.; Du, S.; Wu, L.; Liu, G. An overview of soil loss tolerance. CATENA 2009, 78, 93–99. [Google Scholar] [CrossRef]
Figure 1.
The provinces and elevation of China.

Figure 2.
Flowchart of Revised Wind Erosion Equation (RWEQ) for monthly mean of wind erosion on unprotected topsoil replacement sites (WEUTRS).
Figure 2.
Flowchart of Revised Wind Erosion Equation (RWEQ) for monthly mean of wind erosion on unprotected topsoil replacement sites (WEUTRS).

Figure 3.
The monthly mean WEUTRS (1988–2017). Spatial-wise, overall, the provinces in Northwest China (Xinjiang, Qinghai, and Inner Mongolia) had the most severe WEUTRS, followed by Gansu, Tibet, and Shandong Province. The provinces in the humid area of Central Southern China had the least severe WEUTRS.

Figure 4.
Monthly mean WEUTRS of April.

Figure 5.
Range of monthly mean WEUTRS.

Figure 6.
Soil loss ratio of WEUTRS to topsoil mass.


Table 1.
WEUTRS and its range in seven example sites.
| Site ID | Natural Region | Provincial Administrative Region | WEUTRS in April (kg m−2) | Range of Monthly Mean WEUTRS (kg m−2) |
|---|---|---|---|---|
| 1 | Northwest China | Xinjiang Uygur Autonomous Region | 312.98 | 335.40 |
| 2 | Qinghai–Tibet Plateau | Qinghai | 49.79 | 68.59 |
| 3 | Loess Plateau | Gansu | 25.21 | 20.19 |
| 4 | North China Plain | Shandong | 89.30 | 87.74 |
| 5 | Northeast Plain | Jilin | 15.92 | 15.21 |
| 6 | Yunnan–Guizhou Plateau | Yunnan | 3.28 | 4.12 |
| 7 | Central Southern China | Hunan | 0.004 | 0.02 |
© 2020 by the authors. Licensee MDPI, Basel, Switzerland. This article is an open access article distributed under the terms and conditions of the Creative Commons Attribution (CC BY) license (http://creativecommons.org/licenses/by/4.0/).
Share and Cite
MDPI and ACS Style
Zhu, C.; Fan, X.; Bai, Z. Spatiotemporal Pattern of Wind Erosion on Unprotected Topsoil Replacement Sites in Mainland China. Sustainability 2020, 12, 3237. https://0-doi-org.brum.beds.ac.uk/10.3390/su12083237
AMA Style
Zhu C, Fan X, Bai Z. Spatiotemporal Pattern of Wind Erosion on Unprotected Topsoil Replacement Sites in Mainland China. Sustainability. 2020; 12(8):3237. https://0-doi-org.brum.beds.ac.uk/10.3390/su12083237
Chicago/Turabian StyleZhu, Chuxin, Xiang Fan, and Zhongke Bai. 2020. "Spatiotemporal Pattern of Wind Erosion on Unprotected Topsoil Replacement Sites in Mainland China" Sustainability 12, no. 8: 3237. https://0-doi-org.brum.beds.ac.uk/10.3390/su12083237
Note that from the first issue of 2016, this journal uses article numbers instead of page numbers. See further details here.