Tourist-Perceived Quality and Loyalty Intentions towards Rural Tourism in China


1
Department of Hospitality and Tourism Management, Sejong University, Seoul 05006, Korea
2
Tourism Industry Data Analytics Lab (TIDAL), Department of Hospitality and Tourism Management, Sejong University, Seoul 05006, Korea
*
Author to whom correspondence should be addressed.
Sustainability 2020, 12(9), 3614; https://0-doi-org.brum.beds.ac.uk/10.3390/su12093614
Submission received: 9 April 2020
/
Revised: 25 April 2020
/
Accepted: 28 April 2020
/
Published: 30 April 2020
(This article belongs to the Special Issue City Branding and Sustainable Destination Management)
Abstract
:The growing interest in ruralism among Chinese people has been observed as China’s population in urban areas has exceeded its rural population. Rural tourism has become one of the leading tourism sectors in China, in large part because many of China’s popular tourist attractions are surrounded by rural communities. This study identified 12 dimensions of tourist-perceived quality. In addition, perceived value and satisfaction were used as mediators to explain the relationships between perceived quality and three dimensions of behavioral intentions (i.e., revisitation intention, positive word-of-mouth, and willingness to pay for special rural products). Furthermore, the moderating impact of urban versus rural residence was tested. A total sample of 495 was used for data analysis. Four tourist-perceived quality dimensions (i.e., tourism infrastructure and transportation, hospitality and learning, handicrafts and culture, and rural environment) were found. The results of this study demonstrated the empirical evidence of the relationship between perceived quality, perceived value, satisfaction, and behavioral intentions. Finally, the results showed a moderating effect. The findings of this study can contribute to increasing various behavioral intentions and sustainable rural tourism in China.
1. Introduction
China has experienced rapid economic growth and urbanization in recent decades [1,2]. Consequently, urbanization brought both positive impacts (e.g., economic growth, infrastructure, social development) and negative impacts (e.g., environmental pollution, traffic congestion, stressful life pressure, and food safety) [3,4,5]. A study reported that the Chinese people’s life satisfaction score decreased from 7.29 in 2004 to 6.96 in 2014 [6]. The results imply that material and economic improvements do not always correlate to increased subjective well-being. In recent times, people who live in the ever-changing urban centers started to idealize and seek slow-paced environments as an escape [7]. Unsurprisingly, the demand for rural tourism started gradually increasing [2,7]. This phenomenon is indicated not only in rural tourism, but in entertainment media as well. China’s top influencer, Li Ziqi, a 29-year old who creates content around her daily life in a Chinese rural village [8], has 23 million followers on Weibo, 34 million on Douyin, and 8.3 million on YouTube, making her one of the top influencers not just in China, but in the world [9]. Li Ziqi’s content describing her rural lifestyle and daily activities illustrates the interest in ruralism among urban residents and the growth in rural tourism demand.
Undoubtedly the urban metropolises are generally more appealing to Chinese families, given their superior healthcare options, education systems, business and employment opportunities [1]. The rural villages and communities have recently taken a new role in modern China. They have become popular weekend getaways and tourist destinations for urban families [2,10]. Economically, rural tourism has since been regarded as an effective strategy for sustainable social and economic development [11]. Through tourism, rural villages have a chance to revitalize their communities by utilizing and commoditizing existing local resources [12]. Since 1988, the Chinese government has also made efforts to promote rural tourism by launching several marketing campaigns around rural tourism, such as 1988’s China Urban and Rural Year and 2006’s China Rural Tourism Year [13]. In 2018, the number of domestic travelers reached 5.54 billion, of whom approximately 3 billion engaged in some form of rural tourism. Thus, rural tourism accounted for more than half of domestic tourism and generated tourism income exceeding RMB 800 billion [14].
China has tremendous tourism resources for rural tourism development. China’s diverse natural landscape offers scenery that Chinese people cannot experience in cities. Agricultural resources and traditional folk customs provide an attractive basis for tourism activities and product development [5]. Moreover, approximately half of China’s 55 UNESCO World Heritage Sites are in rural areas. World Heritage Sites are well-known sites that can attract both domestic and international visitors to rural communities. Previous research on rural tourism in China developed destination marketing strategies and tourism development policies [12,15,16,17].
However, there is little research that has been done on the subject, and previous research rarely attempted to examine Chinese rural tourists and their loyalty intentions [18,19]. Among them, a qualitative approach was used to explore the tourists’ perceived quality [20]. In rural tourism contexts outside of China, studies also employed a qualitative research approach or focused on the residents’ perspectives [21,22]. While many of the key variables measuring the rural tourist experience were studied and validated in other countries, the rural tourist experience in China still lacks empirical evidence [10,11,21,22,23]. Thus, studies of the rural tourism experience in other countries provided a basis to develop the conceptual background for this present research. Hence, this present study focuses on domestic Chinese rural tourists and their behavioral intentions in rural areas in China.
As travel destinations compete to attract tourists, researchers strive to investigate tourists’ experiences and their evaluation of those experiences [18,23,24]. Empirically, tourists’ perceived quality was seen as an essential prerequisite leading to tourist loyalty [20,25,26]. In destination competitiveness research, destination quality is multi-dimensional in nature. Therefore, measuring perceived quality using a multiple dimensional scale is recommended [24,27,28,29]. Moreover, tourist-perceived value was found to be a crucial determinant of satisfaction [23,30,31,32]. Satisfaction predicts tourist loyalty intentions. Tourist loyalty can include constructs such as revisit intention, positive word-of-mouth intention, and willingness to pay a premium [4,29,33,34]. More importantly, the motivation to visit rural areas for urban residents may be different than for rural residents [21,35]. Thus, examining the difference in quality perception and tourists’ subsequent intentions can contribute to small and medium business sectors and travel operators in rural areas [4,36].
Therefore, the present study aims to examine Chinese rural tourists’ perceived quality and their loyalty intentions. Three research objectives were designed to achieve the research purposes. The first objective is to identify relevant dimensions of rural tourism quality, then validate the scale with Chinese rural tourists. Secondly, using the same research sample, the proposed conceptual model is tested. The conceptual model includes tourist-perceived quality, tourist-perceived value, tourist satisfaction, revisitation intention, positive word-of-mouth intention, and willingness to pay for special rural products. Lastly, the multi-group invariance is conducted to test the moderating impact between urban and rural residents using the study model.
2. Literature Review
2.1. Rural Tourism in China
Researchers have described the current tourism industry of China as having a spatial heterogeneity situation [37]. It is a situation where the tourist density is higher in urban areas than in rural villages. The situation causes issues such as overdeveloped urban resources and over-tourism in urban spots. Rural tourism was seen as an alternative to help alleviate problems caused by mass tourism in urban spaces [38]. Rural tourism has its roots in tourism literature since 1994, when the researchers described rural tourism as not only tourism activities taking place in rural areas, but as a complex and multi-faceted sector of tourism. Its scope and definition can differ depending on the country and region [39,40]. Hence, there is no uniform definition of rural tourism [41]. In general, rural tourism involves elements of rural folklore, local customs, beliefs, and original heritage [42]. Many definitions simply emphasize the location and rural characteristics [41].
Chinese academics have yet to agree upon a universal scope and definition of rural tourism [41,43,44]. Nevertheless, the scope incorporates the agronomic characteristics of rural China [15]. As such, the term rural tourism is sometimes interchangeably used with agricultural tourism. Historical and heritage elements, such as ancient villages, are also incorporated within the scope of rural tourism [19]. Given the context of China in this research, rural tourism is defined as a comprehensive tourism product with diverse patterns based on rural pastoral scenery, farming activities, farmer experience, and folk cultures. Specifically, it integrates agriculture, sightseeing, leisure, entertainment, and vacation into a coherent experience. Rural tourism products utilize a mixture of local pastoral resources. Needless to say, these tourism products are designed to be appealing to urban residents [43,44,45].
2.2. Tourist Perceived Quality
Tourist-perceived quality has often been discussed as a fundamental concept in research on tourist behaviors [4]. Researchers defined tourists’ perceived quality as an overall judgment based on the feelings of tourists activated by their travel experience [26,30,38]. The concept of customer experience is relatively broad and less bounded. Operationally, it is regarded as a multidimensional assessment, where various experiential cues help to form a final holistic vision [46]. In other words, tourists may evaluate and remember their experience in a simple dichotomous favorable/unfavorable format, in which they still perceive the various attributes individually. The overall perceived quality reflects the various attributes that a destination contains [36]. The same approach was successfully utilized in many tourism research contexts [25,29,46,47]. Surprisingly, existing research focuses only on a particular quality aspect of rural tourism. Specifically, there was a study on the accommodation aspect of rural tourism in Spain [38]. Other studies only focus on the service quality at rural tourism destinations [23,36].
This present study aims to comprehensively measure the rural tourism experience among Chinese domestic travelers, similar to the general destination competitiveness studies, in which destination attributes are categorized into broader groups. A previous study categorized the rural tourism experience into four broader groups. They are interaction, physical environment, accessibility, and accommodation [4]. This categorization implies that the essential elements of any tourism destinations are also relevant in the context of rural tourism. Accommodation is one of the prominent requirements for any destination development. In the rural tourism context, factors such as room size, room type, location, and catering are still relevant for tourists [38]. Additionally, other attributes such as sanitation, safety, tourism infrastructure, transportation, accessibility, cuisine, environment, attractions, and activities are still considered as important elements in the overall perception of quality [4,18,43,44,45]. Moreover, previous studies suggest that the location and its environment, such as the rural atmosphere, can add value to travel commodities [25,46,48].
Important elements for enhancing the uniqueness of the rural environment should be considered. These elements act as the primary attractions for visitors. Researchers found that activities while visiting are essential to the overall enjoyment, especially activities that tourists are physically involved in, which are found to leave longer and vivid memories [21,47]. Previous studies found that tasting the local cuisine, participating in local cultural events, imitating local lifestyle, and adventure activities are among the most highly-rated activities among rural tourists [10,29,48,49]. Learning and self-improvement are also found to be highlights of rural tours [50]. The opportunity for urban residents to learn something new, such as farming methods, modern agricultural science, and technologies, can also contribute to the perceived quality [46]. Communication and social bonding with locals help to engage and integrate visitors with the local communities during a trip [4,10]. Thus, it can help form a deeper sense of belonging that is important for positive post-visit intentions [29,47]. Lastly, rural handicrafts and agricultural products are perceived to be of better value and higher quality at rural locations. Therefore, a pleasant shopping experience for handicrafts and agricultural products can contribute to tourism quality [51].
2.3. Perceived Value
Perceived value is defined as an outcome of overall product or service evaluation against what was sacrificed to obtain the product or service [52]. Although the concept of perceived value can be traced back to pricing literature, the sacrifice a customer makes does not only include monetary transactions but also time and effort [53]. In the tourism-specific context, perceived value is defined as the result of an individual cognitive-affective evaluation of the tourism products or services from the process of tourism consumption based on the benefits against the costs of travel [25,54]. Perceived value is always a vital antecedent in tourist behavioral research, especially in its ability to predict tourist satisfaction and loyalty intentions [25,55]. However, assessing tourist-perceived value and its subsequent influence on tourists’ decision-making process has rarely been applied to rural tourists [23,55].
Compared to the mass tourism sector, rural tourism is often associated with the added value of special rural identity [48]. In other words, rural tourism may cost less than the cost of traveling to urban cities, but it does not necessarily mean tourists also perceive less value from rural tourism. A study emphasized that tourists perceive a tremendous amount of value when the host communities or tour enterprises foster educational benefits such as new discovery and learning [55]. In this present study, perceived value is measured by using the following components: rural tour quality given travel costs, acceptability of travel costs given the benefits from the rural tourism experience, and overall perceived value of the rural trip [25,26,54].
Previous research found multi-dimensional scales of quality or attributes to be strongly predictive of perceived value [34]. Specifically, in the halal-friendly destination context, six quality dimensions significantly predicted tourist-perceived value [25]. Similarly, water park visitor-perceived value was strongly explained by the four dimensions of experience quality [26]. Moreover, in the UK attraction context, all six attraction attributes were found to impact perceived value [32]. Given the empirical evidence, this present study proposes that tourist-perceived quality of rural tourism in China significantly influences tourist-perceived value. Hence, Hypothesis 1 is proposed.
Hypothesis 1 (H1).
Tourist-perceived quality has a significant and positive effect on perceived value.
2.4. Tourist Satisfaction and Behavioral Intentions
Satisfaction is defined as the positive psychological state resulting from a customer’s feelings about the consumption process [56,57]. A high level of satisfaction is a sense of exhilaration and a deep feeling of enjoyment [25]. Satisfaction is viewed as a holistic/overall positive response to an experience or consumption of a product/service [29]. It is found that evaluation of various cues or attributes of an experience/consumption is an effective antecedent of satisfaction and allows for an in-depth analysis of what causes the holistic satisfaction to form [29,57]. Furthermore, satisfaction is widely accepted as a mediator between quality evaluations and customers’ post-consumption behaviors [57]. The relationship between satisfaction and loyalty intention has also been extensively validated in a plethora of tourism studies [4,25,29,44,54,55]. For example, satisfaction was a mediator between experiential quality and loyalty in the Indonesian creative tourism context [34]. Likewise, the relationship between perceived quality and tourist loyalty was mediated by satisfaction among Taiwanese heritage tourists [30]. Lastly, perceived value was also found to be an antecedent of satisfaction in a variety of research settings, such as water park visitors in Korea and rural tourism in Spain [23,26].
Among consumer behavior studies, customer loyalty is one of the most studied areas [34,38]. Customer loyalty behaviors can be divided into several aspects. The most common categorization includes three dimensions: revisitation, recommendation or positive word-of-mouth, and willingness to pay a premium [23,25,33,34]. All three aspects of customer loyalty are desirable behaviors for companies. As a result, industry practitioners often find explanations and antecedents of customer loyalty to be useful in aiding their marketing strategies [31,58]. Measuring customers’ actual behaviors is challenging for many researchers. However, the behavioral intention was found to be a powerful construct in predicting actual behaviors [29,59]. The behavioral intention refers to a stated likelihood or willingness to engage in a specific behavior [4,57]. Previous research on agri-tourism and rural tourism found that agricultural products and rural handicrafts are especially prevalent [51,60,61,62]. Therefore, this present study shaped willingness to pay a premium to measure willingness to pay for special rural products, alongside revisitation intention and positive word-of-mouth intention. Moreover, satisfaction was commonly found as the prominent predictor of tourist loyalty intention [4,29,60,63]. Based on the extant literature, the following hypotheses were developed.
Hypothesis 2 (H2).
Tourist-perceived quality has a positive effect on tourist satisfaction.
Hypothesis 3 (H3).
Perceived value has a positive effect on tourist satisfaction.
Hypothesis 4 (H4).
Tourist satisfaction has a positive effect on revisitation intention.
Hypothesis 5 (H5).
Tourist satisfaction has a positive effect on willingness to pay for special rural products.
Hypothesis 6 (H6).
Tourist satisfaction has a positive effect on positive word-of-mouth (WOM) intention.
2.5. The Moderating Role of Urban and Rural Residency
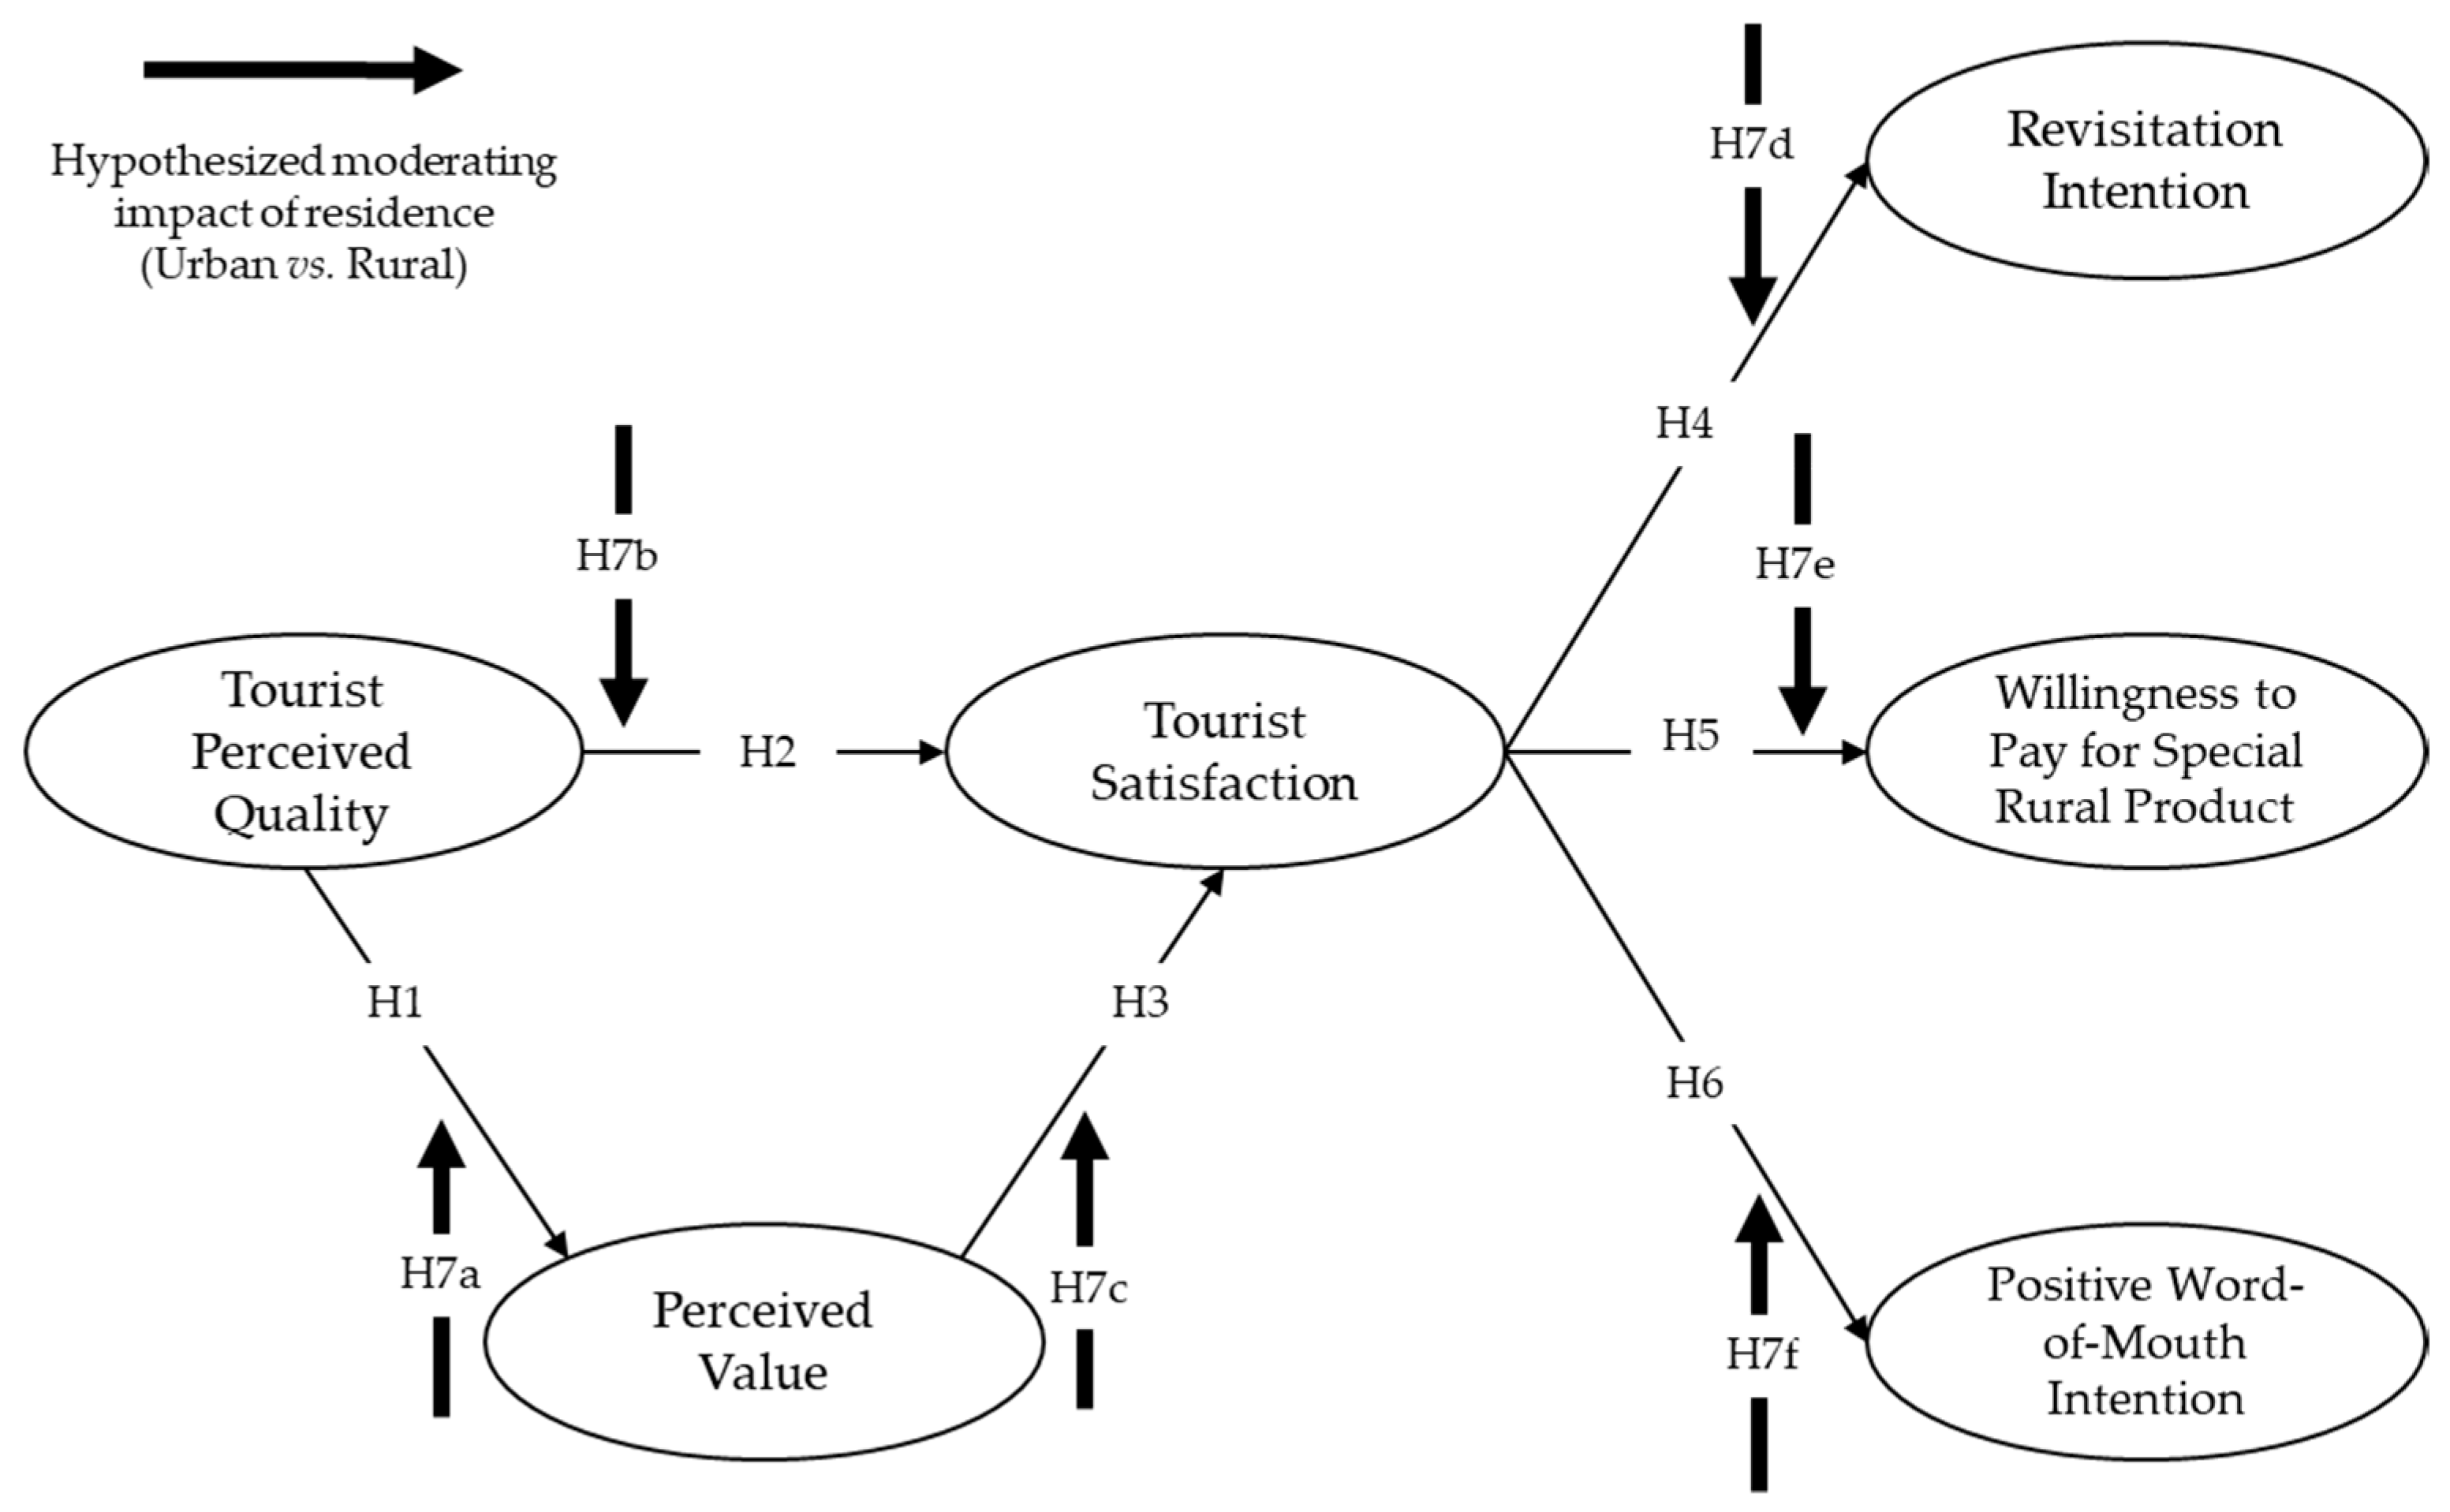
Previous studies found that many domestic rural tourists are motivated by escaping from their daily lives, relaxation, and avoiding the hectic life in the urban environment, among others [20,21,35,55]. At the same time, they often visit rural areas seeking a special rural socio-physical atmosphere [35], thus implying that tourists from urban areas may perceive and evaluate the rural tourism experience differently than tourists who are also rural residents but from another area. In a study of rural tourists in the UK, differences between urban and rural residents were found in such areas as a sense of place, emotional experience, and spirituality response [21]. Likewise, in the US domestic rural tourism research, the results showed that rural destinations have a more substantial effect on urban residents’ self-presentational concerns compared to rural residents [35]. Along with other studies that found significant differences between urban and rural residents in their behavioral response [64,65], this study assumes a multi-group moderation effect between urban and rural residents. Therefore, Hypotheses 7a-f are proposed. Additionally, a graphical illustration of the proposed study model that includes all the constructs and the proposed hypotheses is presented in Figure 1.
Hypothesis 7a–f (H7a–f).
Place of residence (urban and rural) has a moderating effect on the relationships among tourist-perceived quality, perceived value, satisfaction, revisitation intention, willingness to pay for special rural products, and positive word-of-mouth intention.
3. Methodology
3.1. Measurement Items and Survey Design
The measurement items were identified from the literature review process, and the measurement was adopted from previous studies. Specifically, 12 quality dimensions were identified to be relevant to the Chinese rural tourism context [24,27,28]. The items included travel environment, local cuisine, culture and heritage, arts and crafts, local transportation, tourism infrastructure, service, accommodation, hospitality, activities, shopping, and learning. A total of 40 items were adopted to measure all 12 dimensions of tourist-perceived quality from previous studies [25,29,34,46,47,66]. Three items measuring perceived value were adopted and adjusted to fit the present study context [26,54,60]. Tourist satisfaction was also measured using three items from previously validated studies [26,67]. The three dimensions of loyalty, revisitation intention, willingness to pay for special rural products, and positive word-of-mouth intention were all measured using three items each [26,29,38,60]. Similarly, all items were validated in previous studies and reshaped to fit the context of rural tourism. A list of measurement items can be seen in Appendix A, Table A1. All measurement items were measured using 7-point Likert scales.
Finally, demographic and travel characteristic questions were added to the questionnaire. A brief cover letter was added to introduce the research to potential participants. The questionnaire was then subjected to a pretest. Two tour agencies in Anji County specializing in rural tourism helped screen the identified quality dimension as well as the overall comprehensiveness of the questionnaire. A pilot test was conducted, and 10 experts in hospitality and tourism checked words and flows of the questionnaire items for face validity. The experts included senior academics in hospitality and tourism management, tour guides, and rural tour providers. All suggestions and comments were considered before finalizing the original English version. Lastly, the questionnaire was translated into Chinese. Then, a second translation from Chinese to English was finalized.
3.2. Sampling and Data Collection
The research sample included only Chinese who had recently been to a rural destination for tourism purposes. There are many rural tourism sites in China, and to maximize the generalizability of the study, the survey was distributed to all provinces and regions of China. The online self-administered method was deployed. The distribution of the questionnaire was done on popular Chinese social media and instant messaging platforms, specifically WeChat, Weibo, and QQ. All participants were to fill in qualifying questions before proceeding to the full questionnaire. The first qualifying question asked whether the participants had previously traveled to a rural destination. Then, two subsequent questions were asked about their residence. Hence, a non-probability convenience sampling method was utilized for this research project.
A total of 636 surveys were collected. However, some surveys had a large amount of missing data. Consequently, any questionnaires with more than 10% of the data missing were removed. Then, the recommended method to detect cases with unengaged responses was conducted [59]. For each research sample, the standard deviation was calculated from all measurement items. Cases with standard deviation scores lower than 0.5 were then carefully examined for any evidence of unengaged respondents. As a result, 93 cases were discarded for unengagement, 48 cases of which had zero deviation. Finally, 495 responses were retained for further data analysis using IBM SPSS and IBM SPSS AMOS version 22 software.
3.3. Sample Profiles
From a total of 495 valid responses, the gender distribution was slightly higher for females at 52.5% compared to 47.5% males. The three largest age groups were 18–25 years old (51.7%), 26–30 years old (24.2%), and 31–40 years old (17.8%). The sample was generally well-educated with bachelor’s degree holders accounting for more than half (50.9%), followed by master’s degree holders (23.6%). Students accounted for the largest group of reported occupations with 34.1%, followed by company employees (25.7%). Single, followed by married with children were the two largest groups in the marital status category, with 66.5% and 26.9%, respectively.
In terms of travel characteristics, 41.6% of respondents reported that they had visited a rural tourism destination 2–4 times before, and 28.9% reported having visited more than 10 times in the past. The research participants indicated they had traveled to a rural destination with family/relatives and friends the most, with 40% and 32.7%, respectively. The majority of the participants traveled to a rural area for fewer than three nights. Day trips were the most reported (38.6%), 2–3 nights was the second most reported trip duration (26.7%), and one-night trips was the third most reported trip length (24.4%). Lastly, the majority (74.9%) of the research sample lived in urban areas, whereas the rest of the sample reported living in rural areas (25.1%). The research participants reported having residency in 32 provinces, municipalities, and autonomous regions of China. Full details of the research samples’ demographic information and travel characteristics can be found in Table 1.
4. Results
4.1. Principle Component Analysis
The 40 measurement items of tourist-perceived quality were first subjected to principle component analysis (PCA). This process helps refine both the dimensions and items by allowing all items to load freely into the corresponding factors and allows for removal of inconsistent items. The rotation method was Varimax. The Kaiser–Meyer–Olkin (KMO) measurement of the sampling adequacy score was 0.948, and Bartlett’s test of sphericity level at p = <0.001. Items with factor loadings less than 0.4, and those with high cross-loadings were removed [68]. Factors with an eigenvalue greater than 1 were formed. The PCA produced four factors and retained 27 items. The four factors were explained by 68.85% of the total variance.
The first factor was named tourism infrastructure and transportation, and it was comprised of eight items. The eight items combined five items of local transportation and three items from tourism infrastructure. The first factor was explained by 45.012% of the variance. Factor two, named as hospitality and learning, consisted of six items, three items from hospitality and three items from learning. The factor was explained by 11.086% of the variance. The third factor consisted of five items, and was referred to as handicrafts and culture. Three items from the proposed arts and crafts dimension and two items from the culture and heritage dimension were included in the third factor, and 6.814% of the variance was explained by the factor. The final factor was named rural environment and consisted of four items from the tourism environment dimension, and it was explained by 5.938% of the total variance. Lastly, Cronbach’s Alpha scores ranged from 0.807 to 0.930, exceeding the minimum threshold of 0.70 [69]. The level of internal consistency was excellent. A summary of the PCA results is shown in Table 2.
4.2. Confirmatory Factor Analysis
A two-step approach suggested by Anderson and Gerbing (1988) was deployed in this study [70]. In the first step, confirmatory factor analysis (CFA) measured the adequacy of the data to the study model. The extraction method was maximum likelihood. In addition to the four dimensions of tourist-perceived quality, perceived value, satisfaction, and all three loyalty dimensions were tested. First, the goodness-of-fit statistics were all within the accepted thresholds (χ2 = 1414.145, df = 619, χ2/df = 2.285, RMSEA = 0.051, CFI = 0.952, TLI = 0.945, IFI = 0.952, PGFI = 0.838) [71]. Hence, the proposed study model and the data collected showed a satisfactory fit. The composite reliability (CR) scores were also calculated to examine the constructs’ internal reliability. The CR scores ranged from 0.832 to 0.945, and all were greater than the minimum threshold of 0.7 [72]. Next, the average variance extracted (AVE) scores were calculated for each construct. The AVE scores ranged between 0.539 and 0.852. All exceeded the minimum requirement of 0.5 [71,72]. Hence, both reliability and convergence validity existed at the measurement model level. Lastly, the discriminant validity was examined by comparing the squared correlations against the AVE values. If the AVE score was higher than the squared correlations, discriminant validity was established [73]. In general, discriminant validity existed, with the exceptions between perceived value and tourist satisfaction, and between hospitality and learning and revisitation intention. Thus, a further assessment was conducted by combining the measurement items of both constructs, then comparing the chi-square of the base measurement model against the models with combined items [69]. The χ2 difference between combining perceived validity and tourist satisfaction was 78.11 (△df = 8), and the combination of hospitality and learning and revisitation intention was 271.954 (△df = 8). Both comparisons were different at the 0.001 level. Thus, discriminant validity was supported. A summary of the CFA results are exhibited in Table 3.
4.3. Structural Equation Modeling
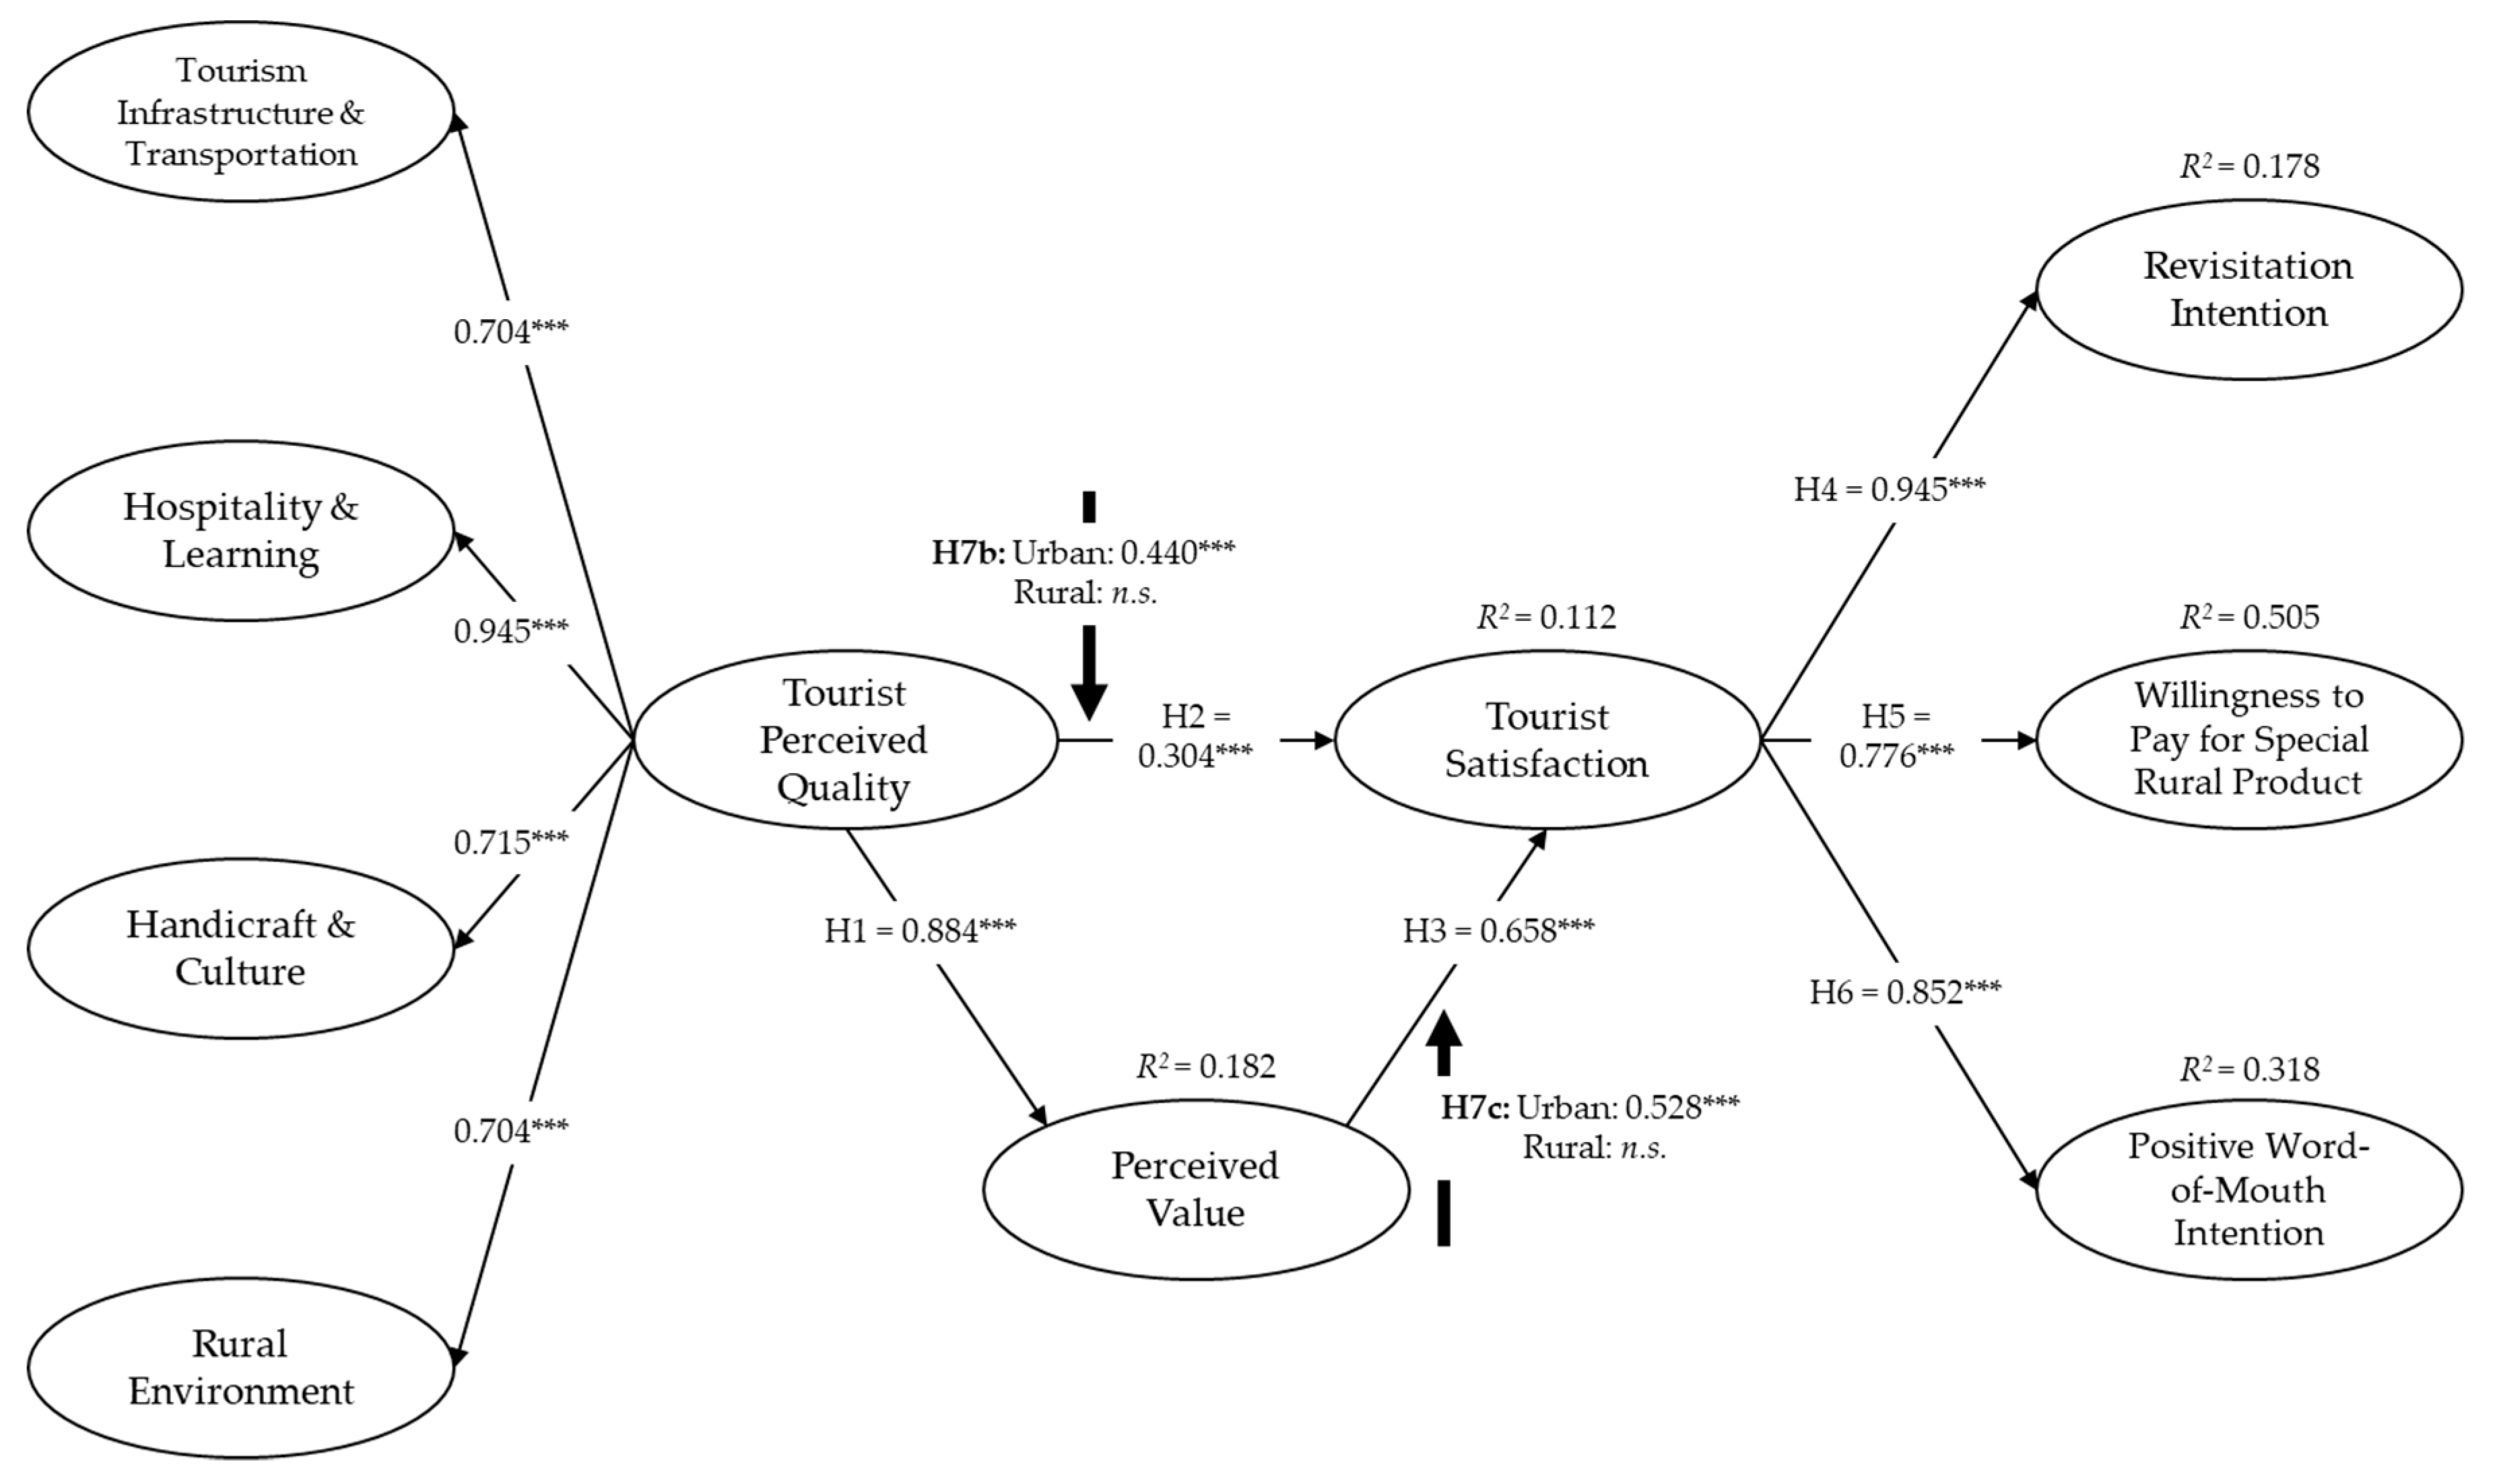
At the second step, structural equation modeling (SEM) was performed to test the hypothesized relationships among all constructs. First, the goodness-of-fit statistics of the structural model also showed satisfactory fit (χ2 = 1585.794, df = 645, χ2/df = 2.459, RMSEA = 0.054, CFI = 0.943, TLI = 0.938, IFI = 0.943, PGFI = 0.865). The four dimensions of tourist-perceived quality also loaded strongly. Tourism infrastructure and transportation produced a loading value of 0.704, hospitality and learning was 0.945, handicrafts and culture was 0.715, and rural environment produced 0.704, all of which were significant at 0.001 level. The total variance explained scores were perceived value (R2 = 0.182), satisfaction (R2 = 0.112), revisitation intention (R2 = 0.178), willingness to pay for special rural products (R2 = 0.505), and positive word-of-mouth intention (R2 = 0.318).
The hypothesis testing found tourist-perceived quality was significantly and positively impacting perceived value (β = 0.884, p = < 0.001). The relationship between tourist-perceived quality and tourist satisfaction was also positive and significant (β = 0.299, p = < 0.001). Hence, both Hypotheses 1 and 2 are supposed. Perceived value was significantly and positively affecting tourist satisfaction (β = 0.664, p = < 0.001), which confirms the establishment of Hypothesis 3. Satisfaction was then significantly and positively predicted by all three loyalty dimensions: revisitation intention (β = 0.925, p = < 0.001), willingness to pay for special rural products (β = 0.780, p = < 0.001), and positive word-of-mouth intention (β = 0.853, p = < 0.001). Therefore, Hypotheses 4, 5, and 6 are all supported by the data.
Moreover, the indirect impact assessment was conducted to test the type of mediation within the constructs in the study model. The results from the bootstrapping method showed tourist-perceived quality indirectly impacted satisfaction (β = 0.578, p = < 0.01). This result suggests that perceived value partially mediates the relationship between quality and satisfaction. Furthermore, perceived quality also indirectly impacted revisitation intention (β = 0.820, p = < 0.01), willingness to pay for special rural products (β = 0.690, p = < 0.01), and positive word-of-mouth intention (β = 0.756, p = < 0.01). Then, perceived value all indirectly impacted revisitation intention (β = 0.614, p = < 0.01), willingness to pay for special rural products (β = 0.518, p = < 0.01), and positive word-of-mouth intention (β = 0.566, p = < 0.01). As a result, both perceived value and satisfaction are partial mediators to all indirect relationships. The summary of SEM results are shown in Table 4.
4.4. Multi-Group Invariance Test
The multi-group invariance test was conducted to examine the moderating impact between urban and rural residency of the research participants. From a total sample of 495, 371 were urban residents and 124 were rural residents. At the measurement model, there was no statistical difference between the non-restricted and full-metric model (△χ2 (32) = 38.991, p = > 0.05). Therefore, the difference of each path was individually examined. The baseline model at the structural level produced a chi-square of 2607.307, and the degrees of freedom were 1292. Then, the paths among all constructs were freely estimated. The chi-square difference tests showed only that the paths from tourist-perceived quality to satisfaction (△χ2 (1) = 7.598, p < 0.05), and from perceived value to satisfaction (△χ2 (1) = 8.151, p < 0.05) were statistically different. In other words, urban residents showed a higher satisfaction level if they also perceived quality to be high, when compared to rural residents. Also, the perceived value would have a stronger impact on satisfaction among urban relative to rural residents. Thus, only Hypotheses H7b and H7c are supported by the data. A summary of the multi-group invariance test is shown in Table 5. Furthermore, Figure 2 illustrates the study model and the results of the SEM analysis and multi-group invariance test.
5. Discussions
5.1. General Discussions
In a brief look at the participant profiles, the statistics show that rural tourism in China attracts many families with children and solo travelers who may have more free time, similar to the general tourism industry where a relatively high annual income is reported. Thus, most respondents are well-educated. These are typical personal characteristics of urban residents, who are rural tourism’s main clientele.
The results of the PCA found four distinct factors, all of which are consistent with the previous studies. The first factor, tourism infrastructure and transportation, represents the basic prerequisites for any successful tourism destinations. Given the relatively short visit duration, transportation to the destination must require minimal efforts [27,28,74]. Then, at the destination, essential quality such as toilets, rest areas, and tourist information should be available and easily accessible [59,66]. The second factor, hospitality and learning, shows that guests consistently appreciate the hospitality of the local people, and the local communities play an integral role in the tourist perception of quality. A study of international visitors in Thailand also found locals’ friendliness towards visitors was among the most crucial factors in creating a positive evaluation of the destination [29].
Moreover, learning and obtaining new knowledge is consistent with previous studies in that the aspiration to self-improvement when traveling often plays a significant role in tourist experiential quality [34,46]. Then, the handicrafts and culture factor reemphasizes the findings from previous studies in that rural crafts and local cultures are some of the main appeals for visitors to rural sites [10,51]. Lastly, the rural environment factor shows that characteristics of rurality are also closely associated with safety, hygiene, eco-friendliness, and tranquility. It is also not surprising that rural environment was found to be important in other Chinese rural tourism studies, as well [15,42,44,45].
Equally important, some proposed dimensions of tourist-perceived quality towards rural tourism did not form into factors. Items that were removed from the PCA stage do not indicate that the responses were negative. Instead, this illustrates the inconsistency of the respondents. Notably, shopping did not converge into any factor, but the respondents showed a willingness to pay for rural products. The results may imply the shopping experience is not always satisfactory. Recent development and introduction of shopping facilities in rural villages may cause inconsistent experience. Activities were also omitted from the final results. Activities at rural sites are often nature-based, such as trekking, mountaineering, and sports. Therefore, when the travel group consists of different members, the available activities may not be suitable for the majority. China’s diverse cultures also mean that local cuisine can be vastly different. Thus, the dietary preference may have produced inconsistent results among the research samples. Lastly, service quality dimensions were also removed after the PCA. This may highlight the need to train rural service staff general standards of service while still maintaining the rustic charms of the local people.
Although the hypotheses are all supported, there are still other results worth interpreting. Among the four dimensions of tourist-perceived quality, hospitality and learning shows the strongest loading. Thus, it implies that the hospitality and learning dimension is both consistent and positively perceived. The relatively high estimates from quality to value and value to satisfaction indicate that perceived value is critical in explaining the relationship between quality and satisfaction. Although all three loyalty dimensions show relatively strong correlations, revisitation intention shows the strongest positive correlation. This might imply that the destination is likely to be near the resident’s area if revisitation intention is more favorably expressed. Alternatively, it is also possible that the respondents are already visiting the rural areas regularly. The willingness to pay for special rural products is explained by the variance that is even higher than revisitation and word-of-mouth intention.
The multi-group invariance test found the place of residence has a moderating effect on two relationships, between tourist-perceived quality and tourist satisfaction, in addition to the relationship of perceived value and satisfaction. In both paths, the relationships remain positive and significant for the urban population, while neither is significant among the rural residents. This implies that tourists who live in other rural areas may not respond enthusiastically to rurality atmospheres. On the other hand, tourists from urban areas might respond more sensitively and enthusiastically towards rural surroundings and activities. Similar to previous studies that examined the moderating effect of place of residence, this present study also found a significant impact among rural tourists [64,65].
5.2. Implications
The practical implications obtained from this research project could help inspire future measures and strategies to maximize rural tourism experiences and products. Furthermore, the findings could help identify where area site managers and businesses can make better use of a site’s resources to strengthen service delivery and appeals. Specifically, the importance of learning at a rural destination highlights the critical requirement for the rural tourism experience to offer new and beneficial educational value to visitors. Next, it highlights the need to protect and foster local culture and heritage, both tangible and intangible assets such as natural environment, local traditions, festivals, and handicrafts, and also to maintain the necessary tourism infrastructure and transportation systems. These areas are still fundamentally important to serve visitors and are always being continuously evaluated by visitors. Lastly, rural destination developers and markets could try to distinguish themselves from other villages. This can benefit both urban residents and rural residents of other villages. Differentiation provides a wider variety for all tourists, including other rural residents who may find learning and experiencing different cultures intriguing.
Moreover, site managers and businesses should be aware of the dimensions removed from the PCA. These are areas that illustrated inconsistency in response. Therefore, they most likely require immediate attention to improve the overall experience. For example, large developers and businesses have moved into smaller villages. While that may help provide recognizable options for most people, it could also diminish the uniqueness and the pastoral charm of rural communities. Businesses may want to localize their businesses to suit the local environment rather than just simply use the same branding as can be seen in urban areas. Family-friendly activities may also help increase satisfaction when traveling to rural areas. Alternatively, for some adventure activities, the general safety and security improvements may encourage more members to participate. Lastly, local dialects may be sources of inconsistent perception of service quality. Often, foreign dialects, especially those in rural tribes, can be perceived as harsh and unwelcoming by Mandarin Chinese speakers. Thus, it causes the perception of unprepared service. Language or communication training of staff, as well as a better understanding by tourists, may help improve the general evaluation of service.
Theoretically, this research successfully validated the usefulness of all proposed study variables in explaining Chinese rural tourists’ loyalty intentions. Additionally, the proposed relationships among all study variables were also validated by the research sample. This research project also found useful suggestions about the perception of rural tourism quality among domestic travelers. The quality dimensions, while generally consistent with previous research, also produced differences in terms of how the dimensions are grouped together, implying that among Chinese travelers, some of the dimensions previously thought to be distinct are closely related to the research sample.
5.3. Limitations and Rcommendations for Future Research
Although the research sample represented domestic travelers from 32 provinces and autonomous regions of China, the distribution ratio was uneven in relation to the population and number of tourists in each region. Hence, the generalizability of this present study may not be conclusive for the entire country. Additionally, due to the data collection method, rural tourists over the age of 40 were not well represented. Therefore, an alternative data collection method could help improve the research generalizability of future projects. Furthermore, China has vastly diverse geographical and natural environments. Therefore, each specific region and site may offer different tourism products and experiences. Future studies are encouraged to duplicate the conceptual framework proposed in this study and apply it in more contexts, both within China and internationally, to validate the framework further. Also, the research design only focused on Chinese domestic tourists, yet rural destinations in China also welcome a large number of international tourists. Thus, future studies can design research to focus on foreign tourists’ perceptions of Chinese rural tourism. There are also some other moderating variables worth investigating in future attempts, such as the differences between genders and differences between residents in the northern and southern parts of the country. Lastly, the role of past experiences was also identified as a potential variable to help further explore the understanding of rural tourists [26].
Author Contributions
Conceptualization, X.C. and S.K.L.; methodology, X.C.; formal analysis, X.C., Y.-j.A.; data curation, X.C.; writing—original draft preparation, X.C.; writing—review and editing, K.K.; supervision, Y.-j.A., S.K.L. and K.K. All authors have read and agreed to the published version of the manuscript.
Funding
This research received no external funding.
Conflicts of Interest
The authors declare no conflict of interest.
Appendix A

Table A1.
Measurement items and standardized factor loading.
| Perceived value Rating of rural tour quality given invested travel costs. (0.837) Acceptability of travel costs given benefits and experience quality provided by the rural trip. (0.764) Overall, rural trips deliver me good value. (0.886) |
| Tourist satisfaction I am satisfied with my rural trip. (0.891) I feel enjoyable about the experiences in the rural trip. (0.909) I feel pleasant about my decision on the rural trip, it was a wise one. (0.886) |
| Revisitation intention If I had to decide again, I would choose a rural trip again. (0.899) I would like to revisit in the near future. (0.890) I would more frequently visit in the future. (0.893) |
| Willingness to pay for special rural products The probability that I would consider purchasing special rural products (handicrafts/ specialties) is high. (0.888) The likelihood of my purchasing special rural products (handicrafts/specialties) is high. (0.898) My willingness to repurchase special rural products (subsidiary agricultural products) after my rural trip is strong. (0.796) |
| Word-of-mouth intention I will say the positive things about my rural trip to my friends/family. (0.889) I will recommend the rural tour to my friends/family. (0.946) I will encourage my friends and/or family to try rural trips. (0.933) |
References
- Ran, M.; Chen, L.; Li, W. Financial Deepening, Spatial Spillover, and Urban–Rural Income Disparity: Evidence from China. Sustainability 2020, 12, 1450. [Google Scholar] [CrossRef] [Green Version]
- Kim, J.H.; Kang, K.H. The interaction effect of tourism and foreign direct investment on urban–rural income disparity in China: A comparison between autonomous regions and other provinces. Curr. Issues Tour. 2020, 23, 68–81. [Google Scholar] [CrossRef]
- Wang, Y. Pseudo-Public Spaces in Chinese Shopping Malls: Rise, Publicness and Consequences; Routledge: Abingdon-on-Thames, UK, 2019. [Google Scholar]
- Wu, H.-C.; Cheng, C.-C.; Ai, C.-H. A study of experiential quality, equity, happiness, rural image, experiential satisfaction, and behavioral intentions for the rural tourism industry in China. Int. J. Hosp. Tour. Adm. 2017, 18, 393–428. [Google Scholar] [CrossRef]
- Xie, T. Overview of Rural Tourism Development in China. Asian Agric. Res. 2015, 7, 13–17. [Google Scholar]
- Cheng, H.; Chen, C.; Li, D.; Yu, H. The Mystery of Chinese People’s Happiness. J. Happiness Stud. 2018, 19, 2095–2114. [Google Scholar] [CrossRef]
- Li, Y.; Zhang, H.; Zhang, D.; Abrahams, R. Mediating urban transition through rural tourism. Ann. Tour. Res. 2019, 75, 152–164. [Google Scholar] [CrossRef]
- Dai, W. How Li Ziqi Repackages Rural China for Urban Fantasies. Available online: https%3A%2F%2Fwww.sixthtone.com%2Fnews%2F1005007%2Fhow-li-ziqi-repackages-rural-china-for-urban-fantasies (accessed on 21 March 2020).
- Matei, A. Country Life: The Young Female Farmer Who is Now a Top Influencer in China. Available online: https://www.theguardian.com/lifeandstyle/2020/jan/28/li-ziqi-china-influencer-rural-life (accessed on 21 March 2020).
- Demirović, D.; Berjan, S.; Milentijević, N.; Bilali, H.E.; Syromiatnikova, Y.A. Exploration of tourist motivation and preferred activities in rural areas. J. Geogr. Inst. Jovan Cvijic SASA 2019, 69, 29–37. [Google Scholar] [CrossRef] [Green Version]
- Wang, M.; Chen, L.-H.; Su, P.; Morrison, A.M. The right brew? An analysis of the tourism experiences in rural Taiwan’s coffee estates. Tour. Manag. Perspect. 2019, 30, 147–158. [Google Scholar] [CrossRef]
- Su, M.M.; Wall, G.; Wang, Y.; Jin, M. Livelihood sustainability in a rural tourism destination-Hetu Town, Anhui Province, China. Tour. Manag. 2019, 71, 272–281. [Google Scholar] [CrossRef]
- Wang, L.; Yotsumoto, Y. Conflict in tourism development in rural China. Tour. Manag. 2019, 70, 188–200. [Google Scholar] [CrossRef]
- Han, C. State Council Report on Rural Industry Development. Available online: http://ccrs.ccnu.edu.cn/List/Details.aspx?tid=9123 (accessed on 23 March 2020).
- Shen, S.; Wang, H.; Quan, Q.; Xu, J. Rurality and rural tourism development in China. Tour. Manag. Perspect. 2019, 30, 98–106. [Google Scholar] [CrossRef]
- Li, P.; Ryan, C.; Cave, J. Chinese rural tourism development: Transition in the case of Qiyunshan, Anhui.–2008–2015. Tour. Manag. 2016, 55, 240–260. [Google Scholar] [CrossRef] [Green Version]
- Yan, S.; Chen, C. The Spatial Transformation of Traditional Rural Villages Driven by Private Investment in China’s Developed Areas: The Case of Daxi Village, Anji County. J. Reg. City Plan. 2018, 29, 156–168. [Google Scholar] [CrossRef] [Green Version]
- Lin, D. Empirical study about the influencing factors of rural tourist satisfaction based on factor analysis and single factor analysis of variance. J. Cent. South Univ. For. Technol. 2015, 9, 56–60. [Google Scholar] [CrossRef]
- An, C.; Li, T.; Zhai, Z.; Fu, Q. Characteristics and prospects of Chinese rural tourism research, 1992–2016: An analysis based on CiteSpace maps. Prog. Geogr. 2018, 37, 1186–1200. [Google Scholar] [CrossRef]
- Zhang, W. IPA analysis of rural tourism service quality based on tourist perception—A case of Shansheng, Chengdu. J. Leshan Teach. Coll. 2010, 25, 70–79. [Google Scholar]
- Jepson, D.; Sharpley, R. More than sense of place? Exploring the emotional dimension of rural tourism experiences. J. Sustain. Tour. 2015, 23, 1157–1178. [Google Scholar] [CrossRef]
- Marzo-Navarro, M.; Pedraja-Iglesias, M.; Vinzón, L. Sustainability indicators of rural tourism from the perspective of the residents. Tour. Geogr. 2015, 17, 586–602. [Google Scholar] [CrossRef]
- Campón-Cerro, A.M.; Hernández-Mogollón, J.M.; Alves, H. Sustainable improvement of competitiveness in rural tourism destinations: The quest for tourist loyalty in Spain. J. Destin. Mark. Manag. 2017, 6, 252–266. [Google Scholar] [CrossRef]
- Enright, M.J.; Newton, J. Determinants of tourism destination competitiveness in Asia Pacific: Comprehensiveness and universality. J. Travel Res. 2005, 43, 339–350. [Google Scholar] [CrossRef]
- Al-Ansi, A.; Han, H. Role of halal-friendly destination performances, value, satisfaction, and trust in generating destination image and loyalty. J. Destin. Mark. Manag. 2019, 13, 51–60. [Google Scholar] [CrossRef]
- Jin, N.; Lee, S.; Lee, H. The effect of experience quality on perceived value, satisfaction, image and behavioral intention of water park patrons: New versus repeat visitors. Int. J. Tour. Res. 2015, 17, 82–95. [Google Scholar] [CrossRef]
- Crouch, G.I. Destination competitiveness: An analysis of determinant attributes. J. Travel Res. 2011, 50, 27–45. [Google Scholar] [CrossRef]
- Crouch, G.I.; Ritchie, J.B. Tourism, competitiveness, and societal prosperity. J. Bus. Res. 1999, 44, 137–152. [Google Scholar] [CrossRef]
- Kiatkawsin, K.; Han, H. An alternative interpretation of attitude and extension of the value–attitude–behavior hierarchy: The destination attributes of Chiang Mai, Thailand. Asia Pac. J. Tour. Res. 2017, 22, 481–500. [Google Scholar] [CrossRef]
- Chen, C.-F.; Chen, F.-S. Experience quality, perceived value, satisfaction and behavioral intentions for heritage tourists. Tour. Manag. 2010, 31, 29–35. [Google Scholar] [CrossRef]
- Hallak, R.; Assaker, G.; El-Haddad, R. Re-examining the relationships among perceived quality, value, satisfaction, and destination loyalty: A higher-order structural model. J. Vacat. Mark. 2018, 24, 118–135. [Google Scholar] [CrossRef]
- Oriade, A.; Schofield, P. An examination of the role of service quality and perceived value in visitor attraction experience. J. Destin. Mark. Manag. 2019, 11, 1–9. [Google Scholar] [CrossRef]
- Kiatkawsin, K.; Han, H. What drives customers’ willingness to pay price premiums for luxury gastronomic experiences at michelin-starred restaurants? Int. J. Hosp. Manag. 2019, 82, 209–219. [Google Scholar] [CrossRef]
- Suhartanto, D.; Brien, A.; Primiana, I.; Wibisono, N.; Triyuni, N.N. Tourist loyalty in creative tourism: The role of experience quality, value, satisfaction, and motivation. Curr. Issues Tour. 2019, 23, 867–879. [Google Scholar] [CrossRef]
- Qiu, S.C.; Cai, L.; Lehto, X.; Huang, Z.J.; Gordon, S.; Gartner, W. Reliving self-presentational concerns in rural tourism. Ann. Tour. Res. 2019, 74, 56–67. [Google Scholar] [CrossRef]
- Nair, V.; Hussain, K.; Chiun, L.M.; Ragavan, M.N.A.; Rajaratnam, S.D.; Sharif, S.P.; Munikrishnan, U.T. Destination quality and tourists’ behavioural intentions: Rural tourist destinations in Malaysia. Worldw. Hosp. Tour. Themes 2015, 7, 463–472. [Google Scholar]
- Zhao, L.; Fang, C.; Wu, X. Tourism development, space spillover, and economic growth: Empirical evidence from China. Tour. Trib. 2014, 29, 16–30. [Google Scholar]
- Loureiro, S.M.C.; González, F.J.M. The importance of quality, satisfaction, trust, and image in relation to rural tourist loyalty. J. Travel Tour. Mark. 2008, 25, 117–136. [Google Scholar] [CrossRef]
- Bramwell, B. Rural tourism and sustainable rural tourism. J. Sustain. Tour. 1994, 2, 1–6. [Google Scholar] [CrossRef]
- Lane, B. What is rural tourism? J. Sustain. Tour. 1994, 2, 7–21. [Google Scholar] [CrossRef]
- Zhang, C.; Deng, F.; Yang, Y.; Yin, L. A summary of rural tourism research. Rural Econ. 2019, 2, 202–206. [Google Scholar]
- Su, B. Rural tourism in China. Tour. Manag. 2011, 32, 1438–1441. [Google Scholar] [CrossRef]
- Zhou, Y.; He, J.; Rong, H. Satisfaction evaluation of tourist and influence factors analysis in rural tourism. Econ. Manag. J. 2016, 38, 156–166. [Google Scholar]
- Zhang, H. The relationship between the tourist satisfaction and behavioral intention for rural tourism in Henan province. J. Xinyang Norm. Univ. Nat. Sci. Ed. 2017, 30, 402–406. [Google Scholar]
- Zhou, Y. Study on the Promotion of Rural Tourism in China’s Ethnic Minority Areas—Taking Inner Mongolia Autonomous Region as an Example. In Proceedings of the 3rd International Seminar on Education Innovation and Economic Management (SEIEM 2018), Penang, Malaysia, 29–31 December 2018; Atlantis Press: Paris, France, 2019. [Google Scholar]
- Fernandes, T.; Cruz, M. Dimensions and outcomes of experience quality in tourism: The case of Port wine cellars. J. Retail. Consum. Serv. 2016, 31, 371–379. [Google Scholar] [CrossRef] [Green Version]
- Kim, J.-H. The antecedents of memorable tourism experiences: The development of a scale to measure the destination attributes associated with memorable experiences. Tour. Manag. 2014, 44, 34–45. [Google Scholar] [CrossRef]
- Fons, M.V.S.; Fierro, J.A.M.; Patiño, M.G.Y. Rural tourism: A sustainable alternative. Appl. Energy 2011, 88, 551–557. [Google Scholar] [CrossRef]
- Funk, D.C.; Bruun, T.J. The role of socio-psychological and culture-education motives in marketing international sport tourism: A cross-cultural perspective. Tour. Manag. 2007, 28, 806–819. [Google Scholar] [CrossRef]
- Kulczyk-Dynowska, A.; Bal-Domańska, B. The National Parks in the Context of Tourist Function Development in Territorially Linked Municipalities in Poland. Sustainability 2019, 11, 1996. [Google Scholar] [CrossRef] [Green Version]
- Haldar, P. Rural Tourism: Challenges and Opportunities. Int. Mark. Conf. Mark. Society 2007, 111–129. [Google Scholar]
- Zeithaml, V.A. Consumer perceptions of price, quality, and value: A means-end model and synthesis of evidence. J. Mark. 1988, 52, 2–22. [Google Scholar] [CrossRef]
- Dodds, W.B.; Monroe, K.B. The effect of brand and price information on subjective product evaluations. ACR N. Am. Adv. 1985, 12, 85–90. [Google Scholar]
- Pandža Bajs, I. Tourist perceived value, relationship to satisfaction, and behavioral intentions: The example of the Croatian tourist destination Dubrovnik. J. Travel Res. 2015, 54, 122–134. [Google Scholar] [CrossRef]
- Peña, A.I.P.; Jamilena, D.M.F.; Molina, M.Á.R. The perceived value of the rural tourism stay and its effect on rural tourist behaviour. J. Sustain. Tour. 2012, 20, 1045–1065. [Google Scholar] [CrossRef]
- Oliver, R.L. A cognitive model of the antecedents and consequences of satisfaction decisions. J. Mark. Res. 1980, 17, 460–469. [Google Scholar] [CrossRef]
- Oliver, R.L. Satisfaction: A Behavioral Perspective on the Consumer: A Behavioral Perspective on the Consumer; Routledge: Abingdon-on-Thames, UK, 2014. [Google Scholar]
- Barsky, J.; Nash, L. Evoking emotion: Affective keys to hotel loyalty. Cornell Hotel Restaur. Adm. Q. 2002, 43, 39–46. [Google Scholar] [CrossRef]
- Kiatkawsin, K.; Han, H. Young travelers’ intention to behave pro-environmentally: Merging the value-belief-norm theory and the expectancy theory. Tour. Manag. 2017, 59, 76–88. [Google Scholar] [CrossRef]
- Ponte, E.B.; Carvajal-Trujillo, E.; Escobar-Rodríguez, T. Influence of trust and perceived value on the intention to purchase travel online: Integrating the effects of assurance on trust antecedents. Tour. Manag. 2015, 47, 286–302. [Google Scholar] [CrossRef]
- Catalino, A.H.; Lizardo, M. Agriculture, environmental services and agro-tourism in the Dominican Republic. EJADE Electron. J. Agric. Dev. Econ. 2004, 1, 87–116. [Google Scholar]
- Rogerson, C.M.; Sithole, P.M. Rural handicraft production in Mpumalanga, South Africa: Organization, problems and support needs. S. Afr. Geogr. J. 2001, 83, 149–158. [Google Scholar] [CrossRef]
- Olya, H.G.; Lee, C.-K.; Lee, Y.-K.; Reisinger, Y. What are the triggers of Asian visitor satisfaction and loyalty in the Korean heritage site? J. Retail. Consum. Serv. 2019, 47, 195–205. [Google Scholar] [CrossRef]
- Munyoka, W.; Maharaj, M. The effect of UTAUT2 moderator factors on citizens’ intention to adopt e-government: The case of two SADC countries. Probl. Perspect. Manag. 2017, 15, 115–123. [Google Scholar] [CrossRef] [Green Version]
- Shin, Y.; Baik, S.; Chung, E.; Heo, S.; Ha, J. Impact of Hearing Loss on Social Contact among Korean Older Adults: Place of Residence as Moderator. Innov. Aging 2017, 1, 1174. [Google Scholar] [CrossRef] [Green Version]
- Zehrer, A.; Smeral, E.; Hallmann, K. Destination competitiveness—A comparison of subjective and objective indicators for winter sports areas. J. Travel Res. 2017, 56, 55–66. [Google Scholar] [CrossRef]
- Lee, J.-S.; Lee, C.-K.; Choi, Y. Examining the role of emotional and functional values in festival evaluation. J. Travel Res. 2011, 50, 685–696. [Google Scholar] [CrossRef]
- Li, M.; Cai, L.A. The effects of personal values on travel motivation and behavioral intention. J. Travel Res. 2012, 51, 473–487. [Google Scholar] [CrossRef]
- Nunally, J.C.; Bernstein, I. Psychometric Theory, 3rd ed.; McGraw-Hill: New York, NY, USA, 1994. [Google Scholar]
- Anderson, J.C.; Gerbing, D.W. Structural equation modeling in practice: A review and recommended two-step approach. Psychol. Bull. 1988, 103, 411. [Google Scholar] [CrossRef]
- Hair, J.; Black, W.; Babin, B.; Anderson, R. Multivariate Data Analysis, 7th ed.; Pearson New International Edition; Pearson Education limited: Essex, UK, 2014. [Google Scholar]
- Bagozzi, R.P.; Yi, Y. Specification, evaluation, and interpretation of structural equation models. J. Acad. Mark. Sci. 2012, 40, 8–34. [Google Scholar] [CrossRef]
- Fornell, C.; Larcker, D.F. Structural Equation Models with Unobservable Variables and Measurement Error: Algebra and Statistics; SAGE Publications: Los Angeles, CA, USA, 1981. [Google Scholar]
- Dwyer, L.; Kim, C. Destination competitiveness: Determinants and indicators. Curr. Issues Tour. 2003, 6, 369–414. [Google Scholar] [CrossRef]
Figure 1.
The proposed study model.

Figure 2.
The proposed study and results of the SEM. Note = *** p < 0.001.

Table 1.
Demographic information and travel characteristics.
| Variable | Category | Distribution | Valid Percentage |
|---|---|---|---|
| Gender | Male | 235 | 47.5 |
| Female | 260 | 52.5 | |
| Age | 18–25 years old | 256 | 51.7 |
| 26–30 years old | 120 | 24.2 | |
| 31–40 years old | 88 | 17.8 | |
| 41–50 years old | 18 | 3.6 | |
| 51–60 years old | 11 | 2.2 | |
| Over 60 years old | 2 | 0.4 | |
| Educational background | Middle school or below | 9 | 1.8 |
| Secondary vocational school | 9 | 1.8 | |
| High school | 24 | 4.8 | |
| Three-year college | 69 | 13.9 | |
| Bachelor’s degree | 252 | 50.9 | |
| Master’s degree | 117 | 23.6 | |
| Doctorate or above | 15 | 3.0 | |
| Occupation type | Institutional organization/ Civil servant | 93 | 18.8 |
| Company staff | 127 | 25.7 | |
| Full-time self-employed | 40 | 8.1 | |
| Part-time employment | 28 | 5.7 | |
| Unemployed | 9 | 1.8 | |
| Student | 169 | 34.1 | |
| Retired | 5 | 1.0 | |
| Others | 24 | 4.8 | |
| Marital status | Single | 329 | 66.5 |
| Married, no children | 31 | 6.3 | |
| Married, with children | 133 | 26.9 | |
| Separated/Divorced | 2 | 0.4 | |
| Prior visit(s) frequency | 1 time | 66 | 13.3 |
| 2–4 times | 206 | 41.6 | |
| 5–10 times | 80 | 16.2 | |
| More than 10 times | 143 | 28.9 | |
| Travel companionship | Alone | 60 | 12.1 |
| Family/relatives | 198 | 40.0 | |
| Friends | 162 | 32.7 | |
| Organized group | 40 | 8.1 | |
| Business partners/ colleagues | 35 | 7.1 | |
| Length of stay | Day trip | 191 | 38.6 |
| 1 night | 121 | 24.4 | |
| 2–3 nights | 132 | 26.7 | |
| 4–5 nights | 17 | 3.4 | |
| More than 5 nights | 34 | 6.9 | |
| Residence | Urban | 371 | 74.9 |
| Rural | 124 | 25.1 | |
| Distribution of respondents’ hometown | Shandong (14.9%); Sichuan (7.1%); Anhui (6.9%); Chongqing (4.8%); Hebei (4.4%); Beijing (4.2%); Zhejiang (4.0%); Jiangsu (3.8%); Yunnan (3.6%); Guangdong (3.4%); Jilin (3.4%); Henan (3.0%); Hunan (3.0%); Shanghai (3.0%); Liaoning (2.8%); Fujian (2.4%); Gansu (2.4%); Guangxi (2.2%); Hainan (2.2%); Henan (2.2.%); Shanxi (2.2%); Xinjiang (2.2%); Heilongjiang (2.0%); Qinghai (1.8%); Guizhou (1.6%); Hubei (1.6%); Shaanxi (1.4%); Inner Mongolia (1.2%); Ningxia (1.2%); Jiangxi (1.0%); Tianjin (1.0%); Tibet (0.6%). | ||
Table 2.
Summary of the principle component analysis (PCA) results.
| Factors | Factor Loading | Eigen- Values | Variance Explained | Cronbach’s Alpha |
|---|---|---|---|---|
| Factor 1: Tourism infrastructure and transportation | 10.353 | 45.012% | 0.930 | |
| LT1- Efficiency of local transport services | 0.761 | |||
| LT2- Visitor accessibility of local transport services | 0.797 | |||
| LT3- Comfort of local transport services | 0.856 | |||
| LT4- Attitude of local drivers towards tourists | 0.664 | |||
| LT5- Quality of roads in the rural tourism destination | 0.812 | |||
| TI1- Full array of sanitary facilities and rest facilities | 0.779 | |||
| TI2- Availability of rural tourism guidance and information | 0.742 | |||
| TI3- Signage/directions clear and easy to understand in rural trip | 0.681 | |||
| Factor 2: Hospitality and Learning | 2.550 | 11.086% | 0.892 | |
| HO1- Friendliness of residents toward tourists | 0.751 | |||
| HO2- Willingness of locals to aid tourists | 0.734 | |||
| HO3- Residents support for the local rural tourism | 0.708 | |||
| LER1- Rural trip helps me to learn and understand the agricultural science | 0.691 | |||
| LER2- I have obtained more knowledge about rural tourism | 0.728 | |||
| LER3- I learned something new from rural tourism | 0.710 | |||
| Factor 3: Handicraft and Heritage | 1.567 | 6.814% | 0.911 | |
| ART1- Variety of local arts and crafts workshops | 0.842 | |||
| ART2- Uniqueness of arts and handicrafts | 0.818 | |||
| ART3- Quality of local crafts and handworks | 0.774 | |||
| CH3- Varied opportunities to experience local traditional lifestyle | 0.649 | |||
| CH4- Varied historical and cultural heritage (attractions) | 0.769 | |||
| Factor 4: Rural environment | 1.366 | 5.938% | 0.807 | |
| TE1- Safety and security of local environment | 0.755 | |||
| TE2- Hygiene and sanitation of local environment | 0.655 | |||
| TE3- Tranquility and peace of rural atmosphere | 0.688 | |||
| TE4- Eco-friendly and pleasant environment | 0.703 | |||
| Total | 68.850% |
Table 3.
Summary of the confirmatory factor analysis (CFA) results.
| TI | HL | CH | RE | PV | TS | RI | WP | PWI | |
|---|---|---|---|---|---|---|---|---|---|
| TI | 0.923 a | 0.419 c | 0.285 | 0.301 | 0.370 | 0.360 | 0.340 | 0.278 | 0.268 |
| HL | 0.647 b | 0.875 | 0.421 | 0.417 | 0.734 | 0.717 | 0.593 | 0.480 | 0.557 |
| CH | 0.534 | 0.649 | 0.914 | 0.353 | 0.359 | 0.392 | 0.307 | 0.307 | 0.480 |
| RE | 0.549 | 0.646 | 0.594 | 0.832 | 0.377 | 0.348 | 0.285 | 0.180 | 0.234 |
| PV | 0.608 | 0.857 | 0.599 | 0.614 | 0.869 | 0.884 | 0.545 | 0.584 | 0.234 |
| TS | 0.600 | 0.847 | 0.626 | 0.590 | 0.940 | 0.924 | 0.826 | 0.539 | 0.584 |
| RI | 0.583 | 0.770 | 0.554 | 0.534 | 0.818 | 0.909 | 0.923 | 0.564 | 0.745 |
| WTP | 0.527 | 0.693 | 0.554 | 0.424 | 0.738 | 0.734 | 0.751 | 0.896 | 0.570 |
| PWI | 0.518 | 0.746 | 0.545 | 0.484 | 0.764 | 0.816 | 0.863 | 0.755 | 0.945 |
| AVE | 0.601 | 0.539 | 0.681 | 0.554 | 0.690 | 0.802 | 0.799 | 0.743 | 0.852 |
| Mean | 4.463 | 5.257 | 5.134 | 5.231 | 5.239 | 5.287 | 5.102 | 5.032 | 5.032 |
| SD | 1.075 | 0.952 | 1.099 | 0.986 | 1.018 | 1.038 | 1.159 | 1.185 | 1.185 |
Note 1: Goodness-of-fit statistics: x2 = 1414.145, df = 619, χ2/df = 2.285, RMSEA = 0.051, CFI = 0.952, TLI = 0.945, IFI = 0.952, PCFI = 0.838. Note 2: TI = Tourism infrastructure and transportation, HL = Hospitality and learning, CH = Handicraft and heritage, RE = Rural environment, PV = Perceived value, TS = Tourist satisfaction, RI = Revisitation intention, WP = Willingness to pay for special rural products, PWI = Positive word-of-mouth intention. a Composite reliability values are along the diagonal. b Correlations. c Squared correlations.
Table 4.
Summary of the structural equation modeling (SEM) results.
| Hypothesis | Standardized Coefficient | t-Value | |
|---|---|---|---|
| H1: Tourist-perceived quality | Perceived value | 0.884 | 12.311 *** |
| H2: Tourist-perceived quality | Tourist satisfaction | 0.299 | 3.761 *** |
| H3: Perceived value | Tourist satisfaction | 0.664 | 8.297 *** |
| H4: Tourist satisfaction | Revisitation intention | 0.925 | 25.452 *** |
| H5: Tourist satisfaction | Willingness to pay for special rural products | 0.780 | 18.973 *** |
| H6: Tourist satisfaction | Positive word-of-mouth intention | 0.853 | 22.108 *** |
| Tourist-perceived quality | Tourism infrastructure | 0.704 *** | |
| Tourist-perceived quality | Hospitality and Learning | 0.945 *** | |
| Tourist-perceived quality | Handicraft and Heritage | 0.715 *** | |
| Tourist-perceived quality | Rural environment | 0.704 *** | |
| Total variance explained: R2 of RI = 0.178; R2 of WTP = 0.505; R2 of PWI = 0.318; R2 of TS = 0.112; R2 of PV = 0.182. | |||
| Indirect impact assessment: | |||
| Tourist-perceived quality | Tourist satisfaction | 0.587 ** | |
| Tourist-perceived quality | Revisitation intention | 0.820 ** | |
| Tourist-perceived quality | Willingness to pay for special rural products | 0.690 ** | |
| Tourist-perceived quality | Positive word-of-mouth intention | 0.756 ** | |
| Perceived value | Revisitation intention | 0.614 ** | |
| Perceived value | Willingness to pay for special rural products | 0.518 ** | |
| Perceived value | Positive word-of-mouth intention | 0.566 ** | |
| Goodness-of-fit statistics: χ2 = 1585.794, df = 645, χ2/df = 2.459, RMSEA = 0.054, CFI = 0.943, IFI = 0.938, TLI = 0.943, PGFI = 0.865. | |||
Note: PV = Perceived value, TS = Tourist satisfaction, RI = Revisitation intention, WTP = Willingness to pay for special rural products, PWI = Positive word-of-mouth intention. * p = < 0.05, ** p = < 0.01, *** p = < 0.001.
Table 5.
Results of the multi-group invariance test.
| Measurement-invariance model for urban (n = 371) and rural (n = 124) | ||||||
|---|---|---|---|---|---|---|
| Models | χ2 | df | △χ2 | Full-metric invariance | ||
| Non-restricted model | 24,462.651 | 1272 | △χ2 (32) = 38.991, p = > 0.05 | Supported | ||
| Full-metric invariance | 2501.642 | 1304 | ||||
| Goodness-of-fit statistics of the non-restricted model: RMSEA = 0.044. CFI = 0.929, TLI = 0.922; IFI = 0.930. | ||||||
| Goodness-of-fit statistics of the full-metric model: RMSEA = 0.043. CFI = 0.929, TLI = 0.924; IFI = 0.929. | ||||||
| Structural-invariance models for urban (n= 371) and rural (n= 124) | ||||||
| Paths | Urban | Rural | Baseline model | Nested model | ||
| β | t-values | β | t-values | (freely estimated) | (equally restricted) | |
| H7a: TPQ → PV | 0.866 | 10.254 *** | 0.966 | 6.492 *** | χ2 (1292) = 2607.307 | χ2 (1293) = 2607.317 |
| H7b: TPQ → TS | 0.440 | 5.071 *** | −1.086 | −0.757 | χ2 (1292) = 2607.307 | χ2 (1293) = 2616.905 |
| H7c: PV → TS | 0.528 | 6.637 *** | 2.034 | 1.398 | χ2 (1292) = 2607.307 | χ2 (1293) = 2615.457 |
| H7d: TS → RI | 0.926 | 23.050 *** | 0.934 | 10.911 *** | χ2 (1292) = 2607.307 | χ2 (1293) = 2608.307 |
| H7e: TS → WTP | 0.800 | 17.242 *** | 0.730 | 8.257 *** | χ2 (1292) = 2607.307 | χ2 (1293) = 2608.557 |
| H7f: TS → PWI | 0.878 | 19.538 *** | 0.779 | 10.195 *** | χ2 (1292) = 2607.307 | χ2 (1293) = 2607.376 |
| Baseline model Goodness-of-fit statistics: χ2 = 2607.307, df = 1292, χ2/df = 2.018, RMSEA = 0.045, CFI = 0.922, TLI =0.915, IFI = 0.923. | ||||||
| Chi-square difference test: | ||||||
| △χ2 (1) = 0.011, p = > 0.10 H7a: not supported | ||||||
| △χ2 (1) = 9.598, p = < 0.05 H7b: supported | ||||||
| △χ2 (1) = 8.151, p = < 0.05 H7c: supported | ||||||
| △χ2 (1) = 1.031, p = > 0.10 H7d: not supported | ||||||
| △χ2 (1) = 1.251, p = > 0.10 H7e: not supported | ||||||
| △χ2 (1) = 0.069, p = > 0.10 H7f: not supported | ||||||
Note: TPQ = Tourist-perceived quality, PV = Perceived value, TS = Tourist satisfaction, RI = Revisitation intention, WTP = Willingness to pay for special rural products, PWI = Positive word-of-mouth (WOM) intention. * p = < 0.05, ** p = < 0.01, *** p = < 0.001.
© 2020 by the authors. Licensee MDPI, Basel, Switzerland. This article is an open access article distributed under the terms and conditions of the Creative Commons Attribution (CC BY) license (http://creativecommons.org/licenses/by/4.0/).
Share and Cite
MDPI and ACS Style
Chi, X.; Lee, S.K.; Ahn, Y.-j.; Kiatkawsin, K. Tourist-Perceived Quality and Loyalty Intentions towards Rural Tourism in China. Sustainability 2020, 12, 3614. https://0-doi-org.brum.beds.ac.uk/10.3390/su12093614
AMA Style
Chi X, Lee SK, Ahn Y-j, Kiatkawsin K. Tourist-Perceived Quality and Loyalty Intentions towards Rural Tourism in China. Sustainability. 2020; 12(9):3614. https://0-doi-org.brum.beds.ac.uk/10.3390/su12093614
Chicago/Turabian StyleChi, Xiaoting, Seul Ki Lee, Young-joo Ahn, and Kiattipoom Kiatkawsin. 2020. "Tourist-Perceived Quality and Loyalty Intentions towards Rural Tourism in China" Sustainability 12, no. 9: 3614. https://0-doi-org.brum.beds.ac.uk/10.3390/su12093614
Note that from the first issue of 2016, this journal uses article numbers instead of page numbers. See further details here.