Analysis of Oil Import Risk and Strategic Petroleum Reserve: The Case of China


1
School of Management, Lanzhou University, Lanzhou 730000, China
2
College of Earth and Environmental Sciences, Lanzhou University, Lanzhou 730000, China
*
Author to whom correspondence should be addressed.
Sustainability 2020, 12(9), 3723; https://0-doi-org.brum.beds.ac.uk/10.3390/su12093723
Submission received: 4 April 2020
/
Revised: 29 April 2020
/
Accepted: 1 May 2020
/
Published: 4 May 2020
(This article belongs to the Special Issue Sustainable Energy Economics and Policy)
Abstract
:Based on the data of 17 countries along the “One Belt and One Road” from 2000 to 2016, this paper quantified China’s oil import risks, and proposed a quantitative model to cope with the oil disruption. According to the model, the optimized scales of strategic petroleum reserve (SPR) and alternative fuels were calculated. An analysis of China’s examples shows that Saudi Arabia and Russia were the countries with the least supply risks in 2000−2016, and 10 countries with the highest risk of marine transportation were mainly located in the Middle East. China’s oil imports from Iraq and Qatar were more vulnerable to supply risks, and oil imports from other oil-producing countries in the Middle East were less affected. In addition, China’s oil imports from Asian countries were more susceptible to transportation risks, and those from the Middle East countries were less or not affected. If only SPR is considered, the optimal scale of SPR is 77 “days of oil consumption” to cope with the once-in-a-decade disruption to oil supplies. Once both alternative fuels and SPR were considered, China’s optimal alternative fuels’ size is 10 “days oil consumption” and SPR size is 75 “days oil consumption” to cope with the once-in-a-decade oil disruption. When changing disruption size, the proportion of alternative fuel and SPR will also change. If disruption scale continues to increase, the alternative fuels’ size increases from 10 “days of oil consumption” to 25 “days of oil consumption”, then decreases to 0, and the SPR size increases from 75 “days of oil consumption” to 270 “days of oil consumption”. This indicates that the SPR is more important than alternative fuels when the disruption scale is large.
1. Introduction
With the rapid economic development, China’s demand for oil is growing, and its oil consumption has increased from 176 million tons in 1996 to 610 million tons in 2018. China has become the second largest oil consumer and the largest oil importer in the world [1]. In 2018, China’s net oil imports reached 440 million tons, and the dependence on foreign oil rose to 69.8%. It is expected that China’s dependence on foreign oil will continue to increase in 2019 [2]. The increase of dependence on oil imports poses a huge challenge to the stable and secure supply of China’s oil resources. Oil import faced complex and variable risk factors. How to quantify the risk of oil import is the focus of oil supply security research. Current studies on how to measure the risk of oil import can be divided into three categories: one is based on Hirschman-Herfindahl Index (HHI), which studies how to diversify suppliers to reduce the risk of over-reliance on a country or region; the second is to identify risk factors and establish an evaluation index system with different multi-attribute decision-making methods; the third is to assess oil import risks from the perspective of the supply chain. HHI was originally developed by Hirschman and Herfindahl to measure market concentration. Then, HHI has been widely used in the energy field to assess energy diversity and supplier diversity. Some scholars have used HHI to assess the risk of oil imports in China [3], European Union [4], etc. Other researchers have added country risks and potential export capacity to the diversification index to evaluate external oil supply risks [5]. Vivoda [6] analyzed the importance of diversification policies and theoretically explained the reasons for implementing oil diversification policies. When constructing the indicator system, the identification and selection of risk indicators are the core part. Gupta [7] calculated the oil vulnerability index of 26 oil-import countries in 2004 based on four market risk indicators and three supply risk indicators to evaluated countries’ oil import risks. Geng and Ji [8] constructed a multi-dimensional indicator system to evaluate China’s energy supply security from four aspects: the risk indicators of energy external availability, the affordability indicators of energy imports, the index of energy technologies and efficiency, and the index of energy resource reserves. The evaluation system includes seven indicators. Under the background of energy security and import risks, some scholars have proposed a new perspective on the oil supply chain. The petroleum industry has a complete supply chain, including: petroleum exploration, crude oil collection, warehousing logistics, crude oil transportation, oil refinery processing, product distribution and transportation. Improving the oil supply chain will affect not only the performance of oil companies, but also the government decision-making and strategic planning aimed at achieving energy supply security. Zhang et al. [9] constructed a petroleum import safety assessment framework from the perspective of the supply chain, and established a two-stage DEA model to evaluate oil import security. Based on the 4A factor framework model, Sun et al. [10] analyzed the risk of oil imports from the perspective of the global oil supply chain (OSC).
Nordhaus [11] pointed out that the best way to guarantee the security of oil supply is petroleum reserves and tariff policies. He constructed a simple static linear demand model to investigate the role of tariffs and petroleum reserves, and found that tariff policies and petroleum reserves can significantly reduce the losses caused by oil embargo. Tolley et al. [12] also briefly discussed the petroleum reserve policy during the oil embargo. In their model, oil-import countries minimize the losses of the oil embargo by controlling consumption, domestic production, and release rate of oil reserves, while oil exporters maximize their benefits by choosing the embargo duration and the price of oil. The results showed that petroleum reserves should be released at a fixed rate when the embargo duration is determined. The petroleum reserves should be released at a decreasing rate if embargo duration is uncertain. Different from the above static model research, Teisberg [13] studied the optimal size and optimal purchase (release) policy of the U.S. strategic petroleum reserve based on stochastic dynamic programming method and numerical simulation technology. The basic idea is that the oil supply interruption leads to the decrease of consumer surplus, which is the cost of the petroleum disruption. The strategic petroleum reserves can reduce this cost. However, strategic petroleum reserves also bring costs of facility construction, daily maintenance, cash occupancy, etc. Therefore, the government’s goal is to balance these two aspects by choosing the optimal strategic petroleum reserve size and purchase (release) strategy for minimizing total cost. The study showed that the optimal strategy is to purchase (release) in stages when the purchase (release) of strategic oil reserves has an impact on world oil prices. Otherwise, it should be purchased (released) at one time, and the benefits of the strategic petroleum reserve with the corresponding tariff policy will be greater. Oren et al. [14] argued that the stochastic dynamic programming model is too complex. Thus, they simplified the Teisberg’s [13] model and simplified the SPR (strategic petroleum reserve) purchase (release) rate to a fixed ratio policy, which greatly simplified the model. However, the accuracy of the simplified model has not been greatly weakened from the results of numerical simulation.
Based on the above researches, this paper aimed to quantify the risk of China’s oil imports from the perspective of the supply chain. In addition, we proposed a static model along the line of Teisberg [13], and conducted empirical research based on China’s specific data. The main contributions are as follows: (1) earlier studies on oil supply risks only considered country risks and oil reserve-production ratio, and this paper further introduced the diplomatic relations between supplier country and China to quantify supply risks, so as to obtain a more reliable assessment result. (2) Previous studies have mainly analyzed the transportation risk of sea transportation channels, and this paper specifically calculated the oil transportation risk between countries to more accurately identify the oil import risk. (3) SPR is an important countermeasure to deal with interruption of oil imports. Quantitative research in this field focuses only on the optimal scale of SPR, and does not consider a comprehensive model for quantifying alternative fuels. This paper established the model of alternative fuel and SPR to analyze the optimal amount of alternative fuel development and SPR under different situations.
2. Methodology and Data
2.1. Research Method
2.1.1. The Measurement of China’s Oil Import Risks
1. Supply risk
Supply risk is the uncertainty of oil supply. In previous studies of oil supply risks, researchers have discussed oil export capacity and country risks [5,9,10,15]. However, in addition to these two factors, the relationship between the two countries also affects oil supply risks. Obviously, if political relations between the two countries are tense, oil suppliers may be reluctant to export oil to the country, causing an oil supply crisis. Therefore, China’s oil supply risk includes the following three aspects: the supplier’s oil export capacity, that is, supply capacity; the stability of the supply process, that is, uninterrupted supply; and the supplier’s friendly relationship with China, that is, the supplier’s willingness to export oil to China. Due to the lack of quantitative indicators to measure bilateral relations, this paper used the quantitative evaluation index of China’s Overseas Investment National Risk Rating to quantify the relationship: whether the two countries have signed the bilateral investment treaty (BIT), the visa-free status situations of oil exporter to China regarding trade dependence. The friendly relationship index between suppliers and China can be obtained by calculating three indicators on average. In addition, we used the annual export volume of crude oil and related products of the oil exporting countries as the index to measure the export capacity of the supplier country, and selected national vulnerability index to measure the national risk of oil suppliers.
In order to ensure the comparability of the three indicators, they were standardized and turned into dimensionless values. The square mean method was used to calculate supply risk.
where SRi,t is the supply risk index of the exporting country i in year t. S1i,t, S2i,t, S3i,t represent the oil export capacity, stability and relationship with China, respectively; all of them are standardized. S’qi,t is the qth index of exporting country i in year t, which is not standardized. Before the geometric mean is synthesized, to make indexes of different dimensions comparable, equations (2) and (3) were used to make positive and negative normalization processing on indexes, respectively.
2. Transportation risk
In this paper, transport risk is defined by the probability of disruptions caused by failure in shipping routes. The risks of transport routes come from three aspects: the transportation distance between two countries, the longer transportation distance is, the greater uncertainty is; the share of oil imports, the greater the share of oil imports, the greater the loss in case of danger; and the probability of route or pipeline interruption, the probability of pirate attack on dangerous nodes or the probability of oil pipeline damage being crucial to transportation safety [15]. Since the oil trade routes between different countries and China are quite different, this paper divided the transportation risk nodes of each country in detail, according to the attack locations in the pirate attack report and previous literatures (Table 1). Referring to Sun et al. [10], the specific expression of transportation risk is:
where TRi,t is the transportation risk index of oil exporting country i to China in year t. Si,t is the proportion of China’s total import of petroleum from country i in year t; Di is the distance between major cities in exporting country i and that in China; Pi,t is the probability of disruption of the transportation route from exporting country i to China in year t.
According to the current situation of China’s oil import, this paper only analyzes ocean shipping and pipeline transportation. In maritime transportation, the oil transportation routes are divided into various nodes. As for the possibility of node interruption, we referred to the calculation method of the probability of disruption of the four main routes calculated by Sun et al. [10,15]. We adjusted the formula for calculating the probability of the route interruption between two countries,
where pik,t represents the probability of kth node disrupting in the transportation route from exporting country i to China in year t. 1-pim,t represents the probability of safety of node m in the transportation route.
This paper combined data of pipeline failure frequency from PHMSA (Pipeline and Hazardous Materials Safety Administration), CEPA (Canadian Energy Pipeline Association) and Concawe. The oil pipelines that China put into use before 2016 included the China-Kazakhstan oil pipeline, officially used in July 2006, and the China-Russia oil pipeline, officially used in January 2011. Therefore, the average value of pipeline failures in the three regions from 2006 to 2016 was taken as the failure probability of the China-Kazakhstan oil pipeline; and the average value of pipeline failures in three regions from 2011 to 2016 is taken as the failure probability of the China-Russia oil pipeline.
2.1.2. Construction of China’s Petroleum Strategic Reserve Model 1
1. Model assumption
Assumption 1: There are two states of oil supply: “normal” and “crisis”. Under normal condition, oil supplies are normal, and China can import oil at constant international prices. Under the crisis condition, the oil supply is disrupted and there is a gap in oil consumption. The government needs to release the oil emergency reserve to fill the gap.
Assumption 2: The purchase of oil emergency reserves does not affect the oil market price, so government can purchase the oil emergency reserves at one time, without considering the staged purchase status. For simplicity, this paper assumes that the decision period is one year.
Assumption 3: The scale of oil supply disruption is g "days of oil consumption" () and the scale of SPR is h "days of oil consumption" (). Interruption days g is a random variable that obeys the lambda exponential distribution of mean λ:
where g, a random variable, is the scale of oil supply disruption. f(g) is the density function of the random variable g. λ is the mean of the disruption scale g, λ > 0.
Assumption 4: When the oil crisis with a disruption scale of g occurs, the government rations the strategic petroleum reserve through effective means. Therefore, the most effective consumers could get consumption first, until the scale of strategic petroleum reserve h is completely released. When the scale of strategic petroleum reserve h is larger than that of interruption g, only part of the petroleum reserve should be released. Otherwise, the entire strategic petroleum reserve should be released.
Assumption 5: Due to the suddenness of supply interruption and the timeliness of reserve delivery, even if the scale of reserve is smaller than that of emergency demand, the oil market price remains stable during the interruption. Thus, the government can release reserves according to the market equilibrium price. When supply disruptions occur, the government can release reserves at the normal equilibrium price, and consumers can buy oil at the normal equilibrium price.
Assumption 6: As a planner of social and economic activities, the government aims to maximize social welfare.
2. SPR model
The larger the scale of the oil reserve, the smaller the social welfare loss when the oil reserve is disrupted. In addition, the cost of the reserve rises. The optimal reserve size should satisfy that the marginal cost of increasing unit oil reserve is equal to the marginal revenue of releasing unit oil reserve. SPR costs mainly include: infrastructure investment costs, maintenance and operation costs and petroleum procurement costs.
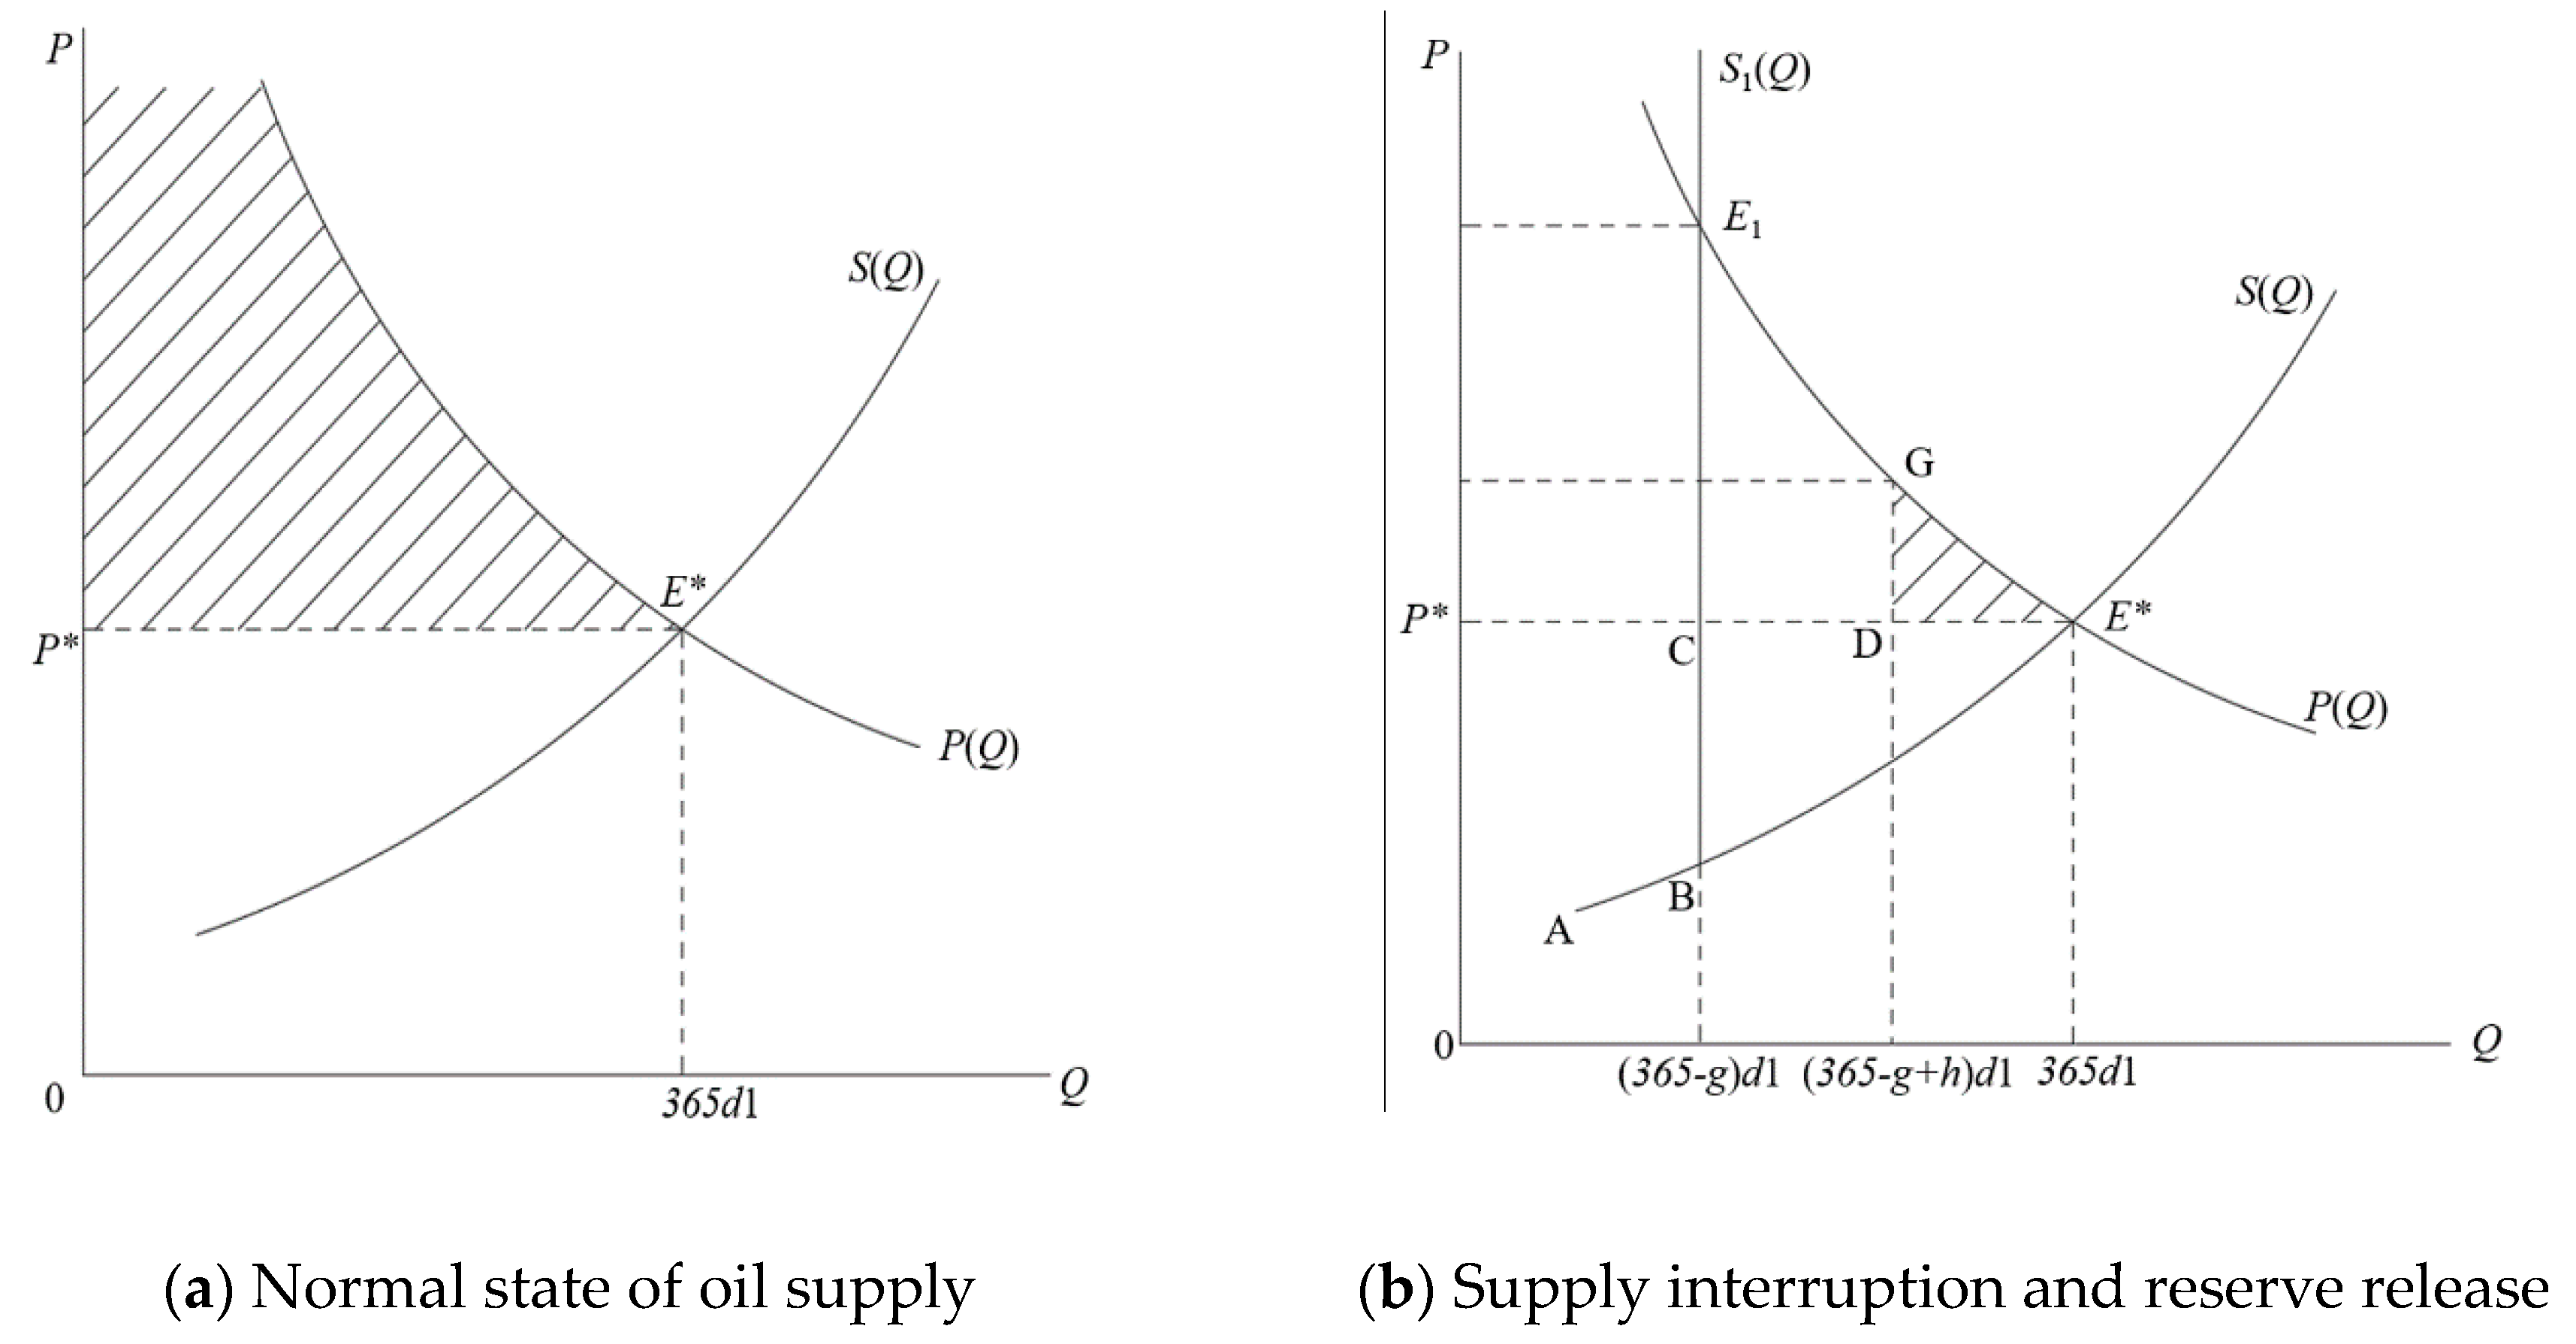
Figure 1a shows the normal state of oil supply, and the shaded part represents consumer surplus; Figure 1b shows the status of supply interruption and reserve release, and the shaded part shows the recovered consumer surplus loss after reserve release. P on the vertical axis represents oil price, and Q on the horizontal axis represents oil consumption. P(Q) is a function of oil demand, and S(Q) is a function of oil supply under normal conditions.
Under normal conditions, the intersection point E* of oil supply curve S(Q) and demand curve P(Q) is equilibrium point of supply and demand, P* is the oil price, and Q0 is the oil demand, namely 365 "days of oil consumption". In addition, consumer surplus can be expressed as:
When a petroleum supply interruption crisis of scale g occurs, the oil supply curve S1(Q) is composed of the curves A to B on the original supply curve S(Q) and the vertical line formed by points B and E1. This means that the supply curve remains unchanged before the supply is interrupted, and the supply quantity suddenly turns into an inelastic longitudinal straight line when the supply is interrupted. The consumer surplus becomes the left area enclosed by the demand curve P(Q), point E1, C and P*.
In view of the consumer surplus loss under petroleum strategic reserve policy, this paper divided it into two cases for discussion. The first case is that the scale of strategic oil reserve h is smaller than the scale of supply disruption g. The consumer surplus obtained is
The lost consumer surplus is
In the second case, the scale of strategic oil reserve h is larger than or equal to that of supply interruption g. After the oil reserve is used, consumption will return to the normal level of 365 days. The consumer surplus is the same as equation (7), and the lost consumer surplus is 0.
Combining the above two cases, the consumer surplus loss after releasing the strategic petroleum reserve is
The cost of stockpiling consists of construction cost, operation cost and cost of fund occupation. We assume that the unit construction cost is c1, the unit operation cost is v1, and the bank rate is r. Then the total cost of strategic petroleum reserve for h day’s oil consumption is
The government aims to minimize the sum of consumer surplus loss and cost by choosing the optimal size of the strategic petroleum reserves. The total loss of social welfare is
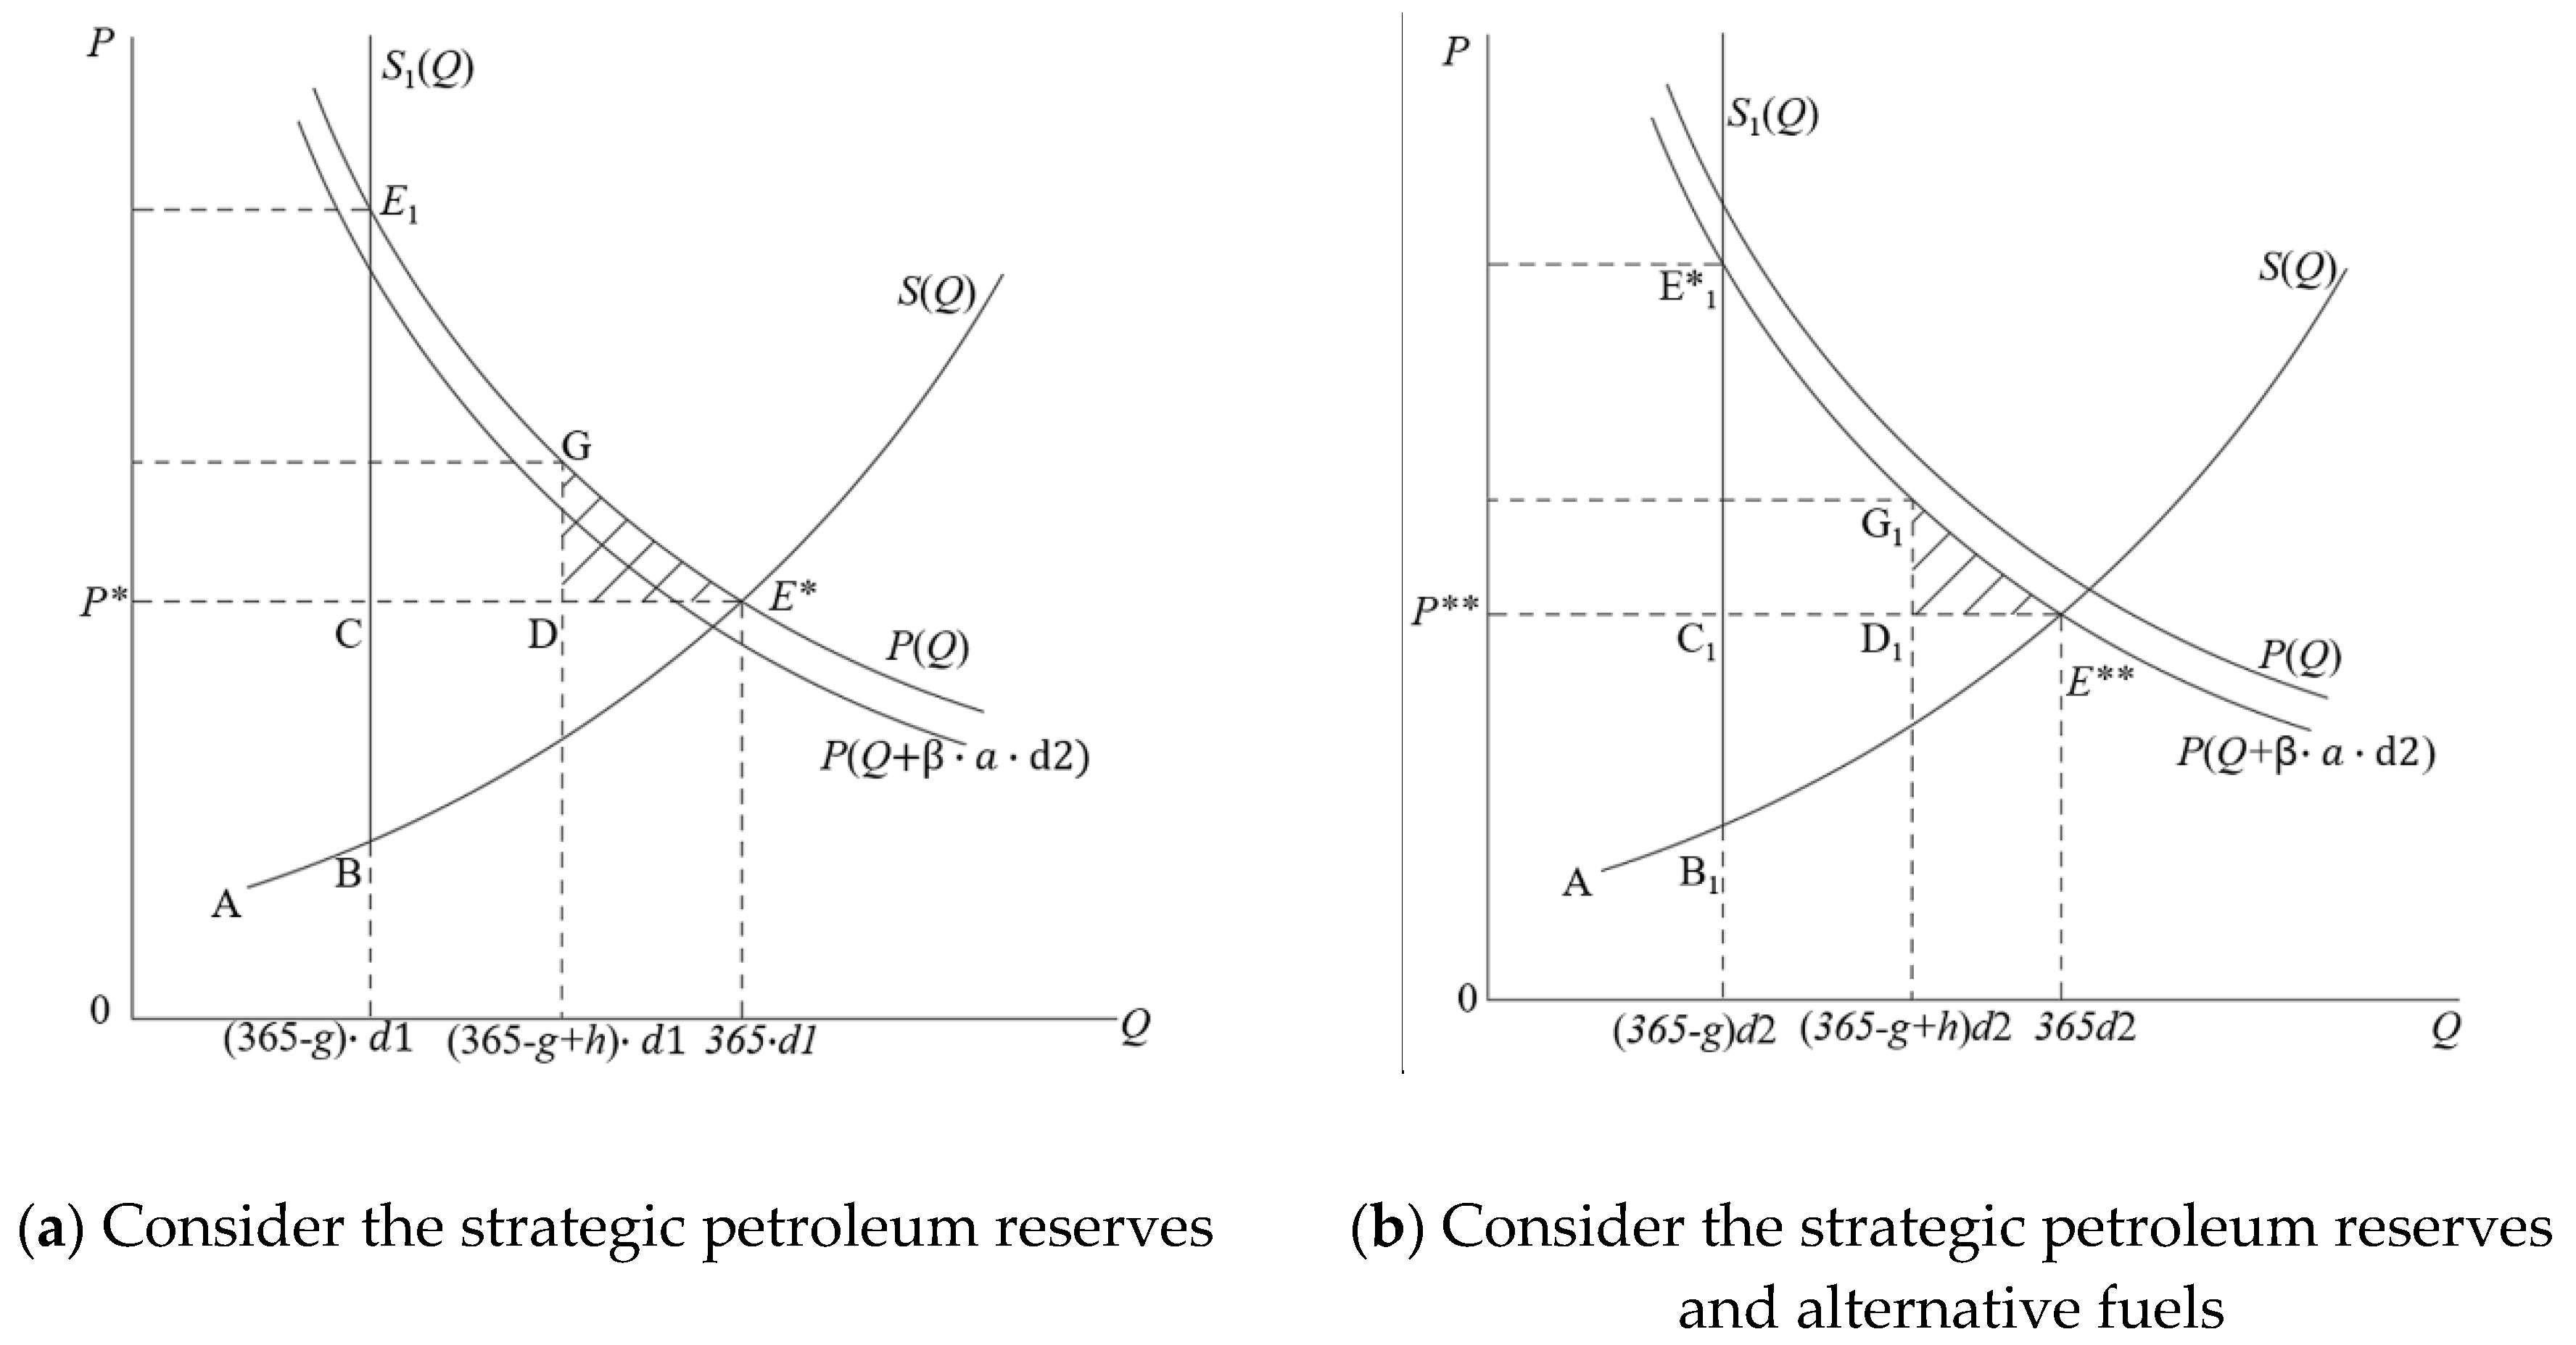
3. Alternative fuel - SPR model
Alternative fuel can directly replace oil, which is converted from coal or natural gas through technology. The development of alternative fuels reduces both the domestic demand for oil and the economic losses caused by oil interruption.
Assuming that the alternative fuel is , and the convert ratio from alternative fuel to oil is βthe oil demand function changes from P(Q) to P(Q+β·a·d2) (Figure 2a). Then, the intersection E** of the oil supply curve S(Q) and the demand curve P(Q+β·a·d2) is equilibrium point. P** is the equilibrium oil price, and the oil demand is 365 "days of oil consumption". Then, the total amount of 1 "day of oil consumption" is no longer d1. In this paper, d2 is used to represent the total amount of 1 "day of oil consumption" under the alternative fuel-petroleum strategic reserve model. Then, the consumer surplus is
When an oil supply interruption of scale g occurs, the oil supply curve becomes S1(Q), and the consumer surplus is the area of the left side enclosed by the demand curve P(Q+β·a·d2), point E1*, C1 and P** (Figure 2b).Then, the consumer surplus is
Similarly, we discussed two cases. The first case is that the scale of strategic oil reserve h is smaller than that of supply interruption g. Then, the consumer surplus is
The lost consumer surplus is
In the second case, the scale of strategic oil reserve h is greater than or equal to that of supply interruption g. After the oil reserve is used, consumption will return to the normal level of 365 days. The consumer surplus is the same as equation (13), and the lost consumer surplus is 0.
Combining the above two cases, the consumer surplus loss after releasing the strategic petroleum reserve is
Similarly, the cost of developing alternative fuels consists of construction cost, operation cost and cost of fund occupation. We assume that the unit construction cost is c2, the unit operation cost is v2, and the bank rate is r. Then, the total cost of alternative fuels for “days of oil consumption” is
In addition, due to changes of "days of oil consumption" and oil equilibrium price, the SPR cost of h "days of oil consumption" becomes
Then, the total loss of social welfare should be minimized.
2.2. Data Source
The data of oil import was from the 33rd chapter of the United Nations Comtrade Database SITC Rev.3 “Petroleum, petroleum products and related raw materials [16]. The data of country risk was from the U.S. Peace Center database [17]. BIT sign situation, the situation of the visa, and the trade dependence data were derived from the website of the Ministry of Commerce of China [18], the Chinese Consular Service Network [19] and the United Nations Trade Database [16]. Transport distances were distances of the major cities between two countries from the CEPII database [20]. The number of pirate attacks were from the global pirate attack report [21]. Pipeline failure probability data were obtained from PHMSA [22], CEPA [23] and Concawe [24].
3. Results
3.1. China’s Oil Import Risk
3.1.1. Statistical Analysis: China’s Oil Import Risk
"One Belt and One Road" runs through Asia, Europe and Africa, with an active east Asian economic circle at one end and a developed European economic circle at the other one. The vast hinterland countries in the middle have huge economic development potential. The “One Belt and One Road” region is rich in petroleum resources, accounting for 56.8% of the world’s oil reserves and 51.7% of the world’s oil production [25]. It is a global oil supplier and a major source of China’s oil import. With the promotion of the “One Belt and One Road”, China is expected to further deepen energy cooperation with countries along the route. Therefore, this paper takes 17 countries along the route as an example to quantify supply risk and transportation risk. Then, we briefly analyzed the impact of oil supply risk and transportation risk on oil import trade.
• Supply risk
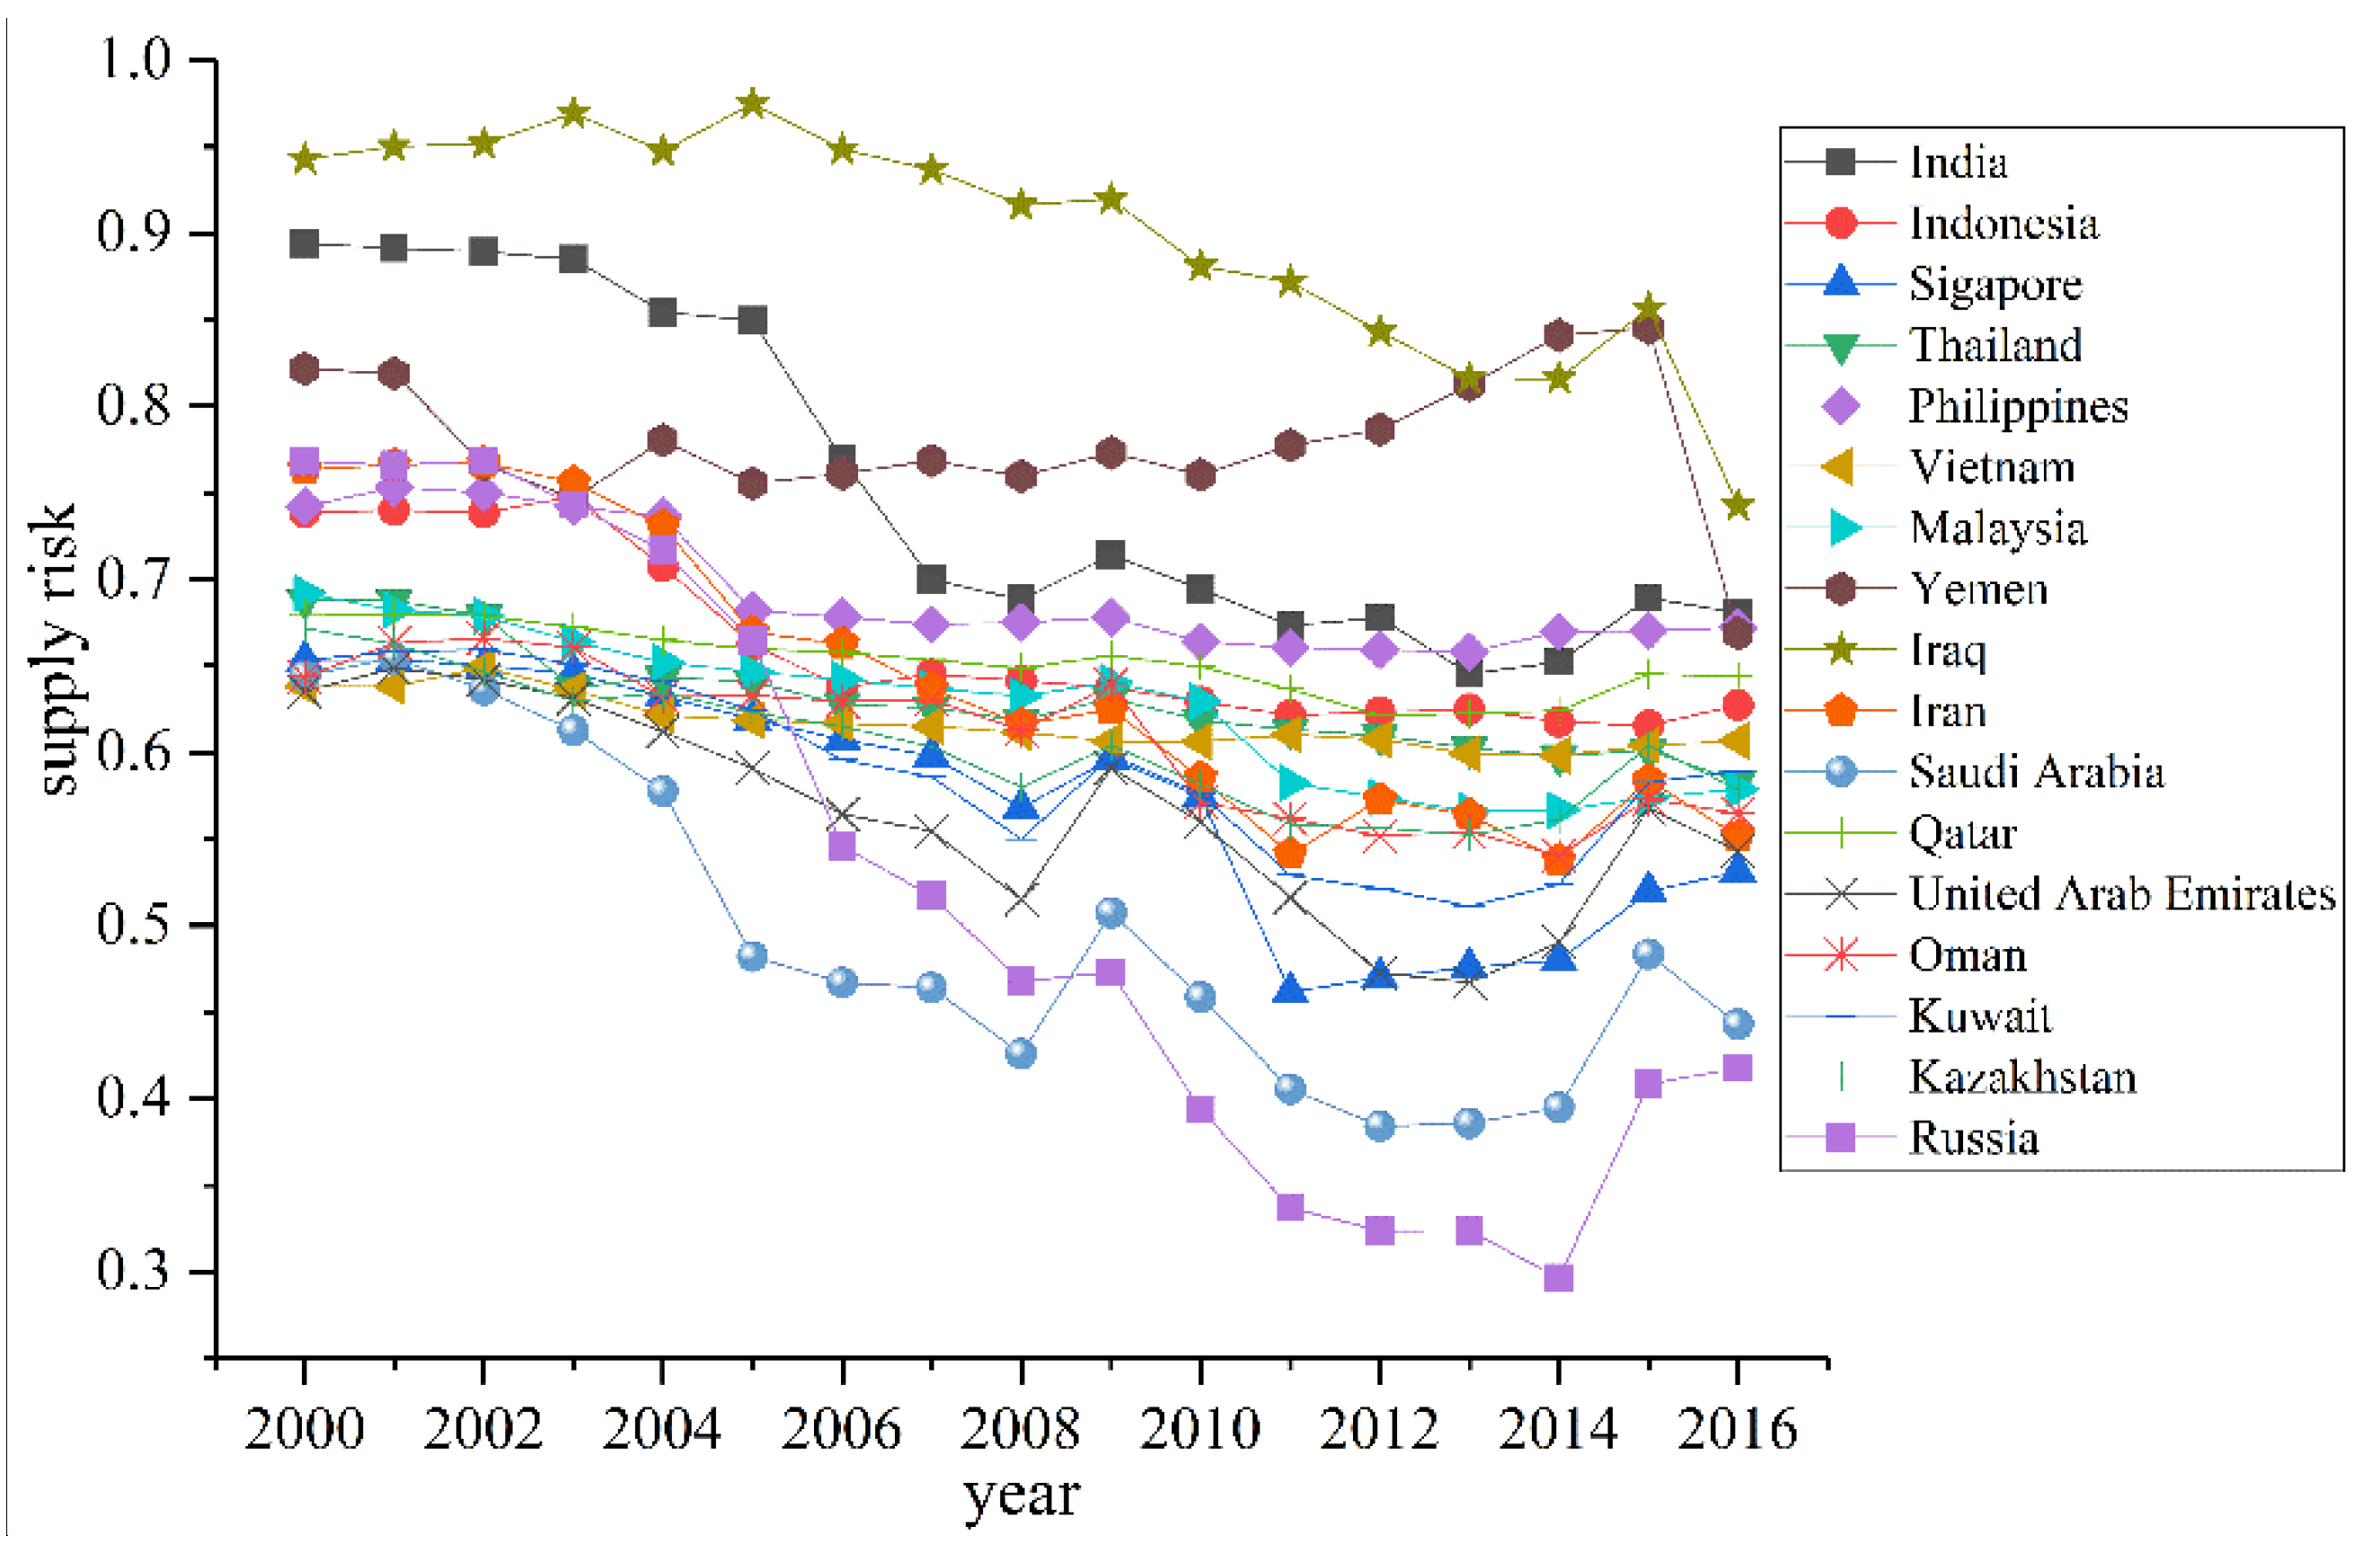
In general, the oil supply risks of 17 countries along the route from 2000 to 2016 shows a state of fluctuation and decline, but the oil supply risks in most countries rebounded in 2009 and 2015 (Figure 3). At the end of 2008, the global financial crisis broke out comprehensively and international oil prices quickly fell below $35/barrel. In 2009, OPEC’s oil production fell sharply by 8.4%, and oil production in the Asia-Pacific region fell slightly by 0.8%, so that the oil supply capacity was decreased in 2009. In 2015, the United States imposed energy sanctions on Russia, and the major oil-producing countries such as Saudi Arabia cracked down on unconventional oil exploitation in the United States, which had a strong impact on the international energy trade market.
For different countries, the oil supply risks are varied (Table 2). According to the average oil supply risk index of each country from 2000 to 2016, 17 countries can be divided into five categories. The lowest-risk country (<0.5): Saudi Arabia. Saudi Arabia is the world’s largest oil country and the focus of China’s foreign cooperation. It occupies a high status in China’s oil market. From 2000 to 2008, its oil supply risk dropped, reaching a minimum of 0.384 in 2012. The lower-risk countries (0.5~0.6): Russia, United Arab Emirates, Singapore, Kuwait. Among all countries, Russia’s oil supply risk showed the greatest variation, from 0.768 in 2000 to 0.525 in 2016, and the lowest was 0.296 in 2014. Furthermore, Russia replaced Saudi Arabia as the country with the lowest supply risk in 2009 and beyond. The United Arab Emirates and Kuwait are both major oil-producing countries, and their oil supply risks were generally decreasing. The minimum supply risks were 0.467 and 0.541, respectively. With its unique geographical advantages, Singapore has become one of the world’s three major oil refining centers and exports refined oil to the world. Its oil supply risk has dropped from 0.653 in 2000 to 0.462 in 2011, and then increased slightly after 2011. Moderate-risk countries (0.6~0.7): Kazakhstan, Oman, Vietnam, Malaysia, Thailand, Iran, Qatar, Indonesia, Philippines. The supply risks of these countries have had a downward trend, but the fluctuations were not large. The higher-risk countries (0.7~0.8): India, Yemen. India’s oil supply risk was high at first, but it declined rapidly, and its lowest supply risk was 0.654, second only to Russia and Saudi Arabia. The oil supply risk in Yemen was at a relatively stable level from 2000 to 2010. After 2011, due to the turmoil in the domestic situation, the risk of oil supply remained high and it did not decline until 2016. The highest-risk country (>0.8): Iraq. Iraq is a major oil-producing country in the Middle East, and its turbulent political and economic environment were the main reason for high oil supply risks.
• Transportation risk
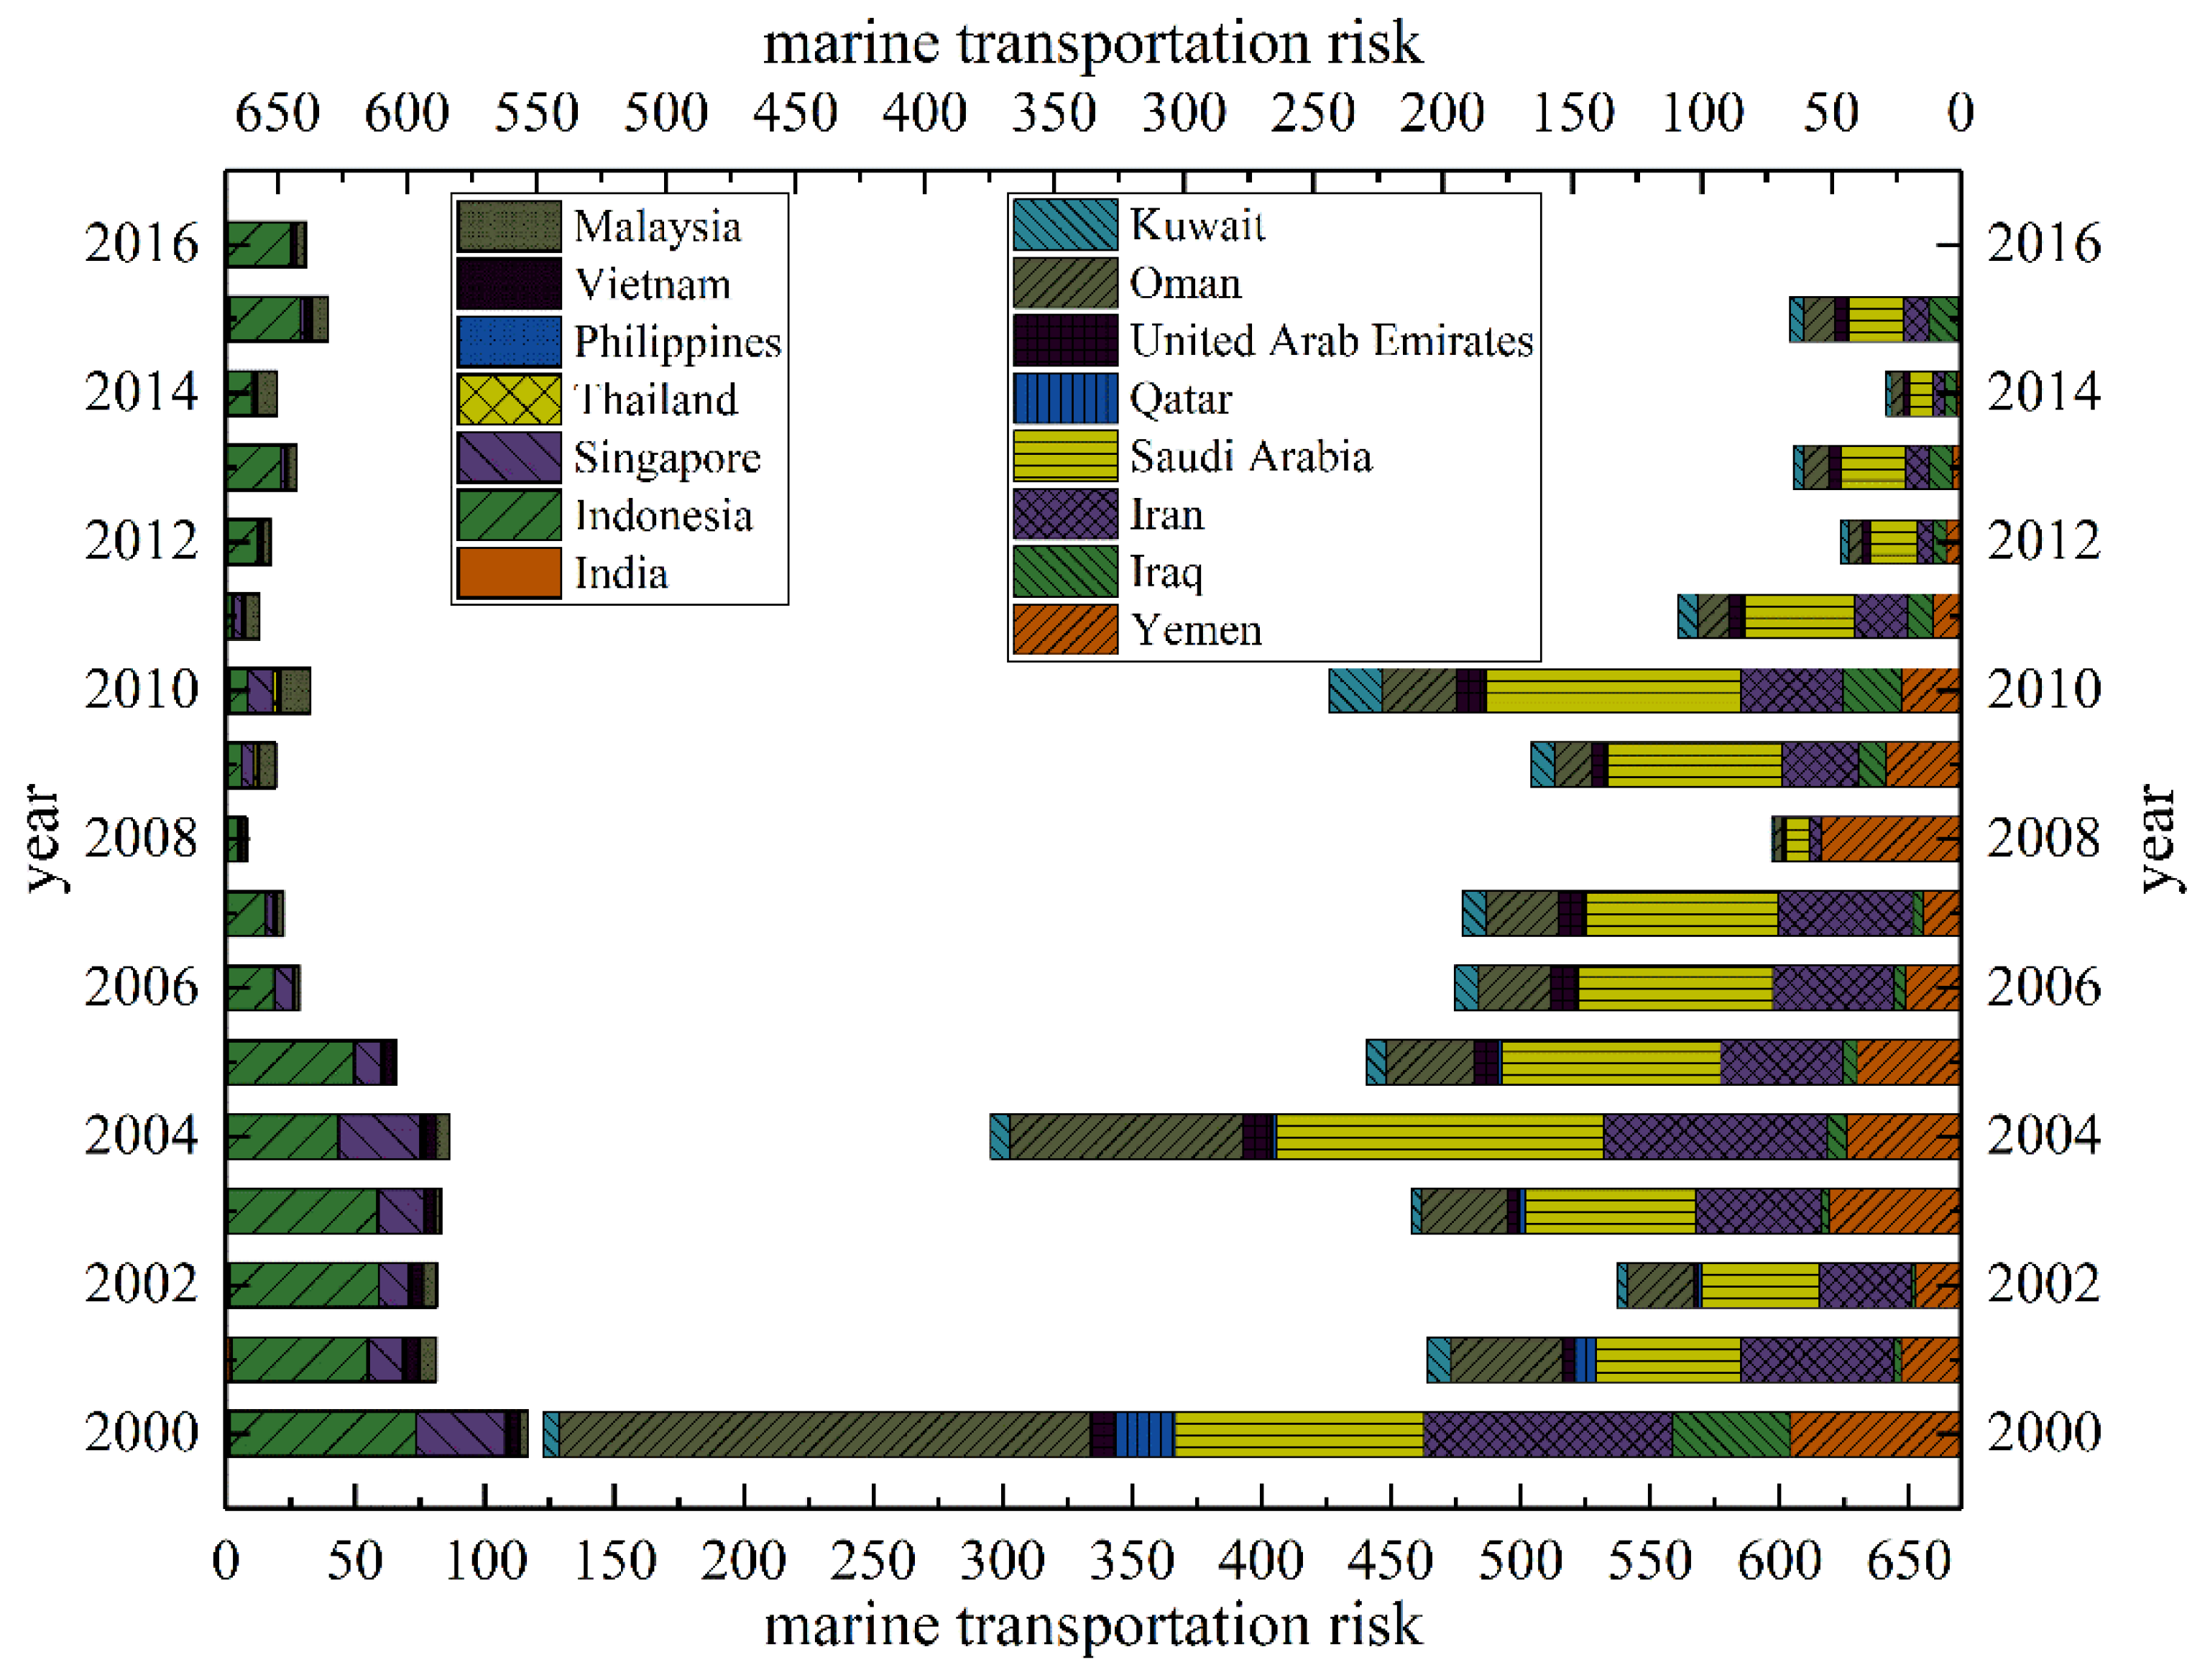
From 2000 to 2016, the marine transportation risk showed a trend of fluctuation and decline. However, from 2002 to 2004 and from 2008 to 2010, the transportation risk rebounded to a higher level (Figure 4). From 2002 to 2004, pirate attacks in the Straits of Malacca occurred frequently and increased year by year, posing a serious threat to the Middle East-China offshore oil transportation route. From 2008 to 2010, piracy in the South China Sea has happened, and the South China Sea has become one of the most ravaged regions in the world. For different regions, the transportation risks of China’s oil import from the Middle East countries were much higher than that from East and South Asian countries. The reason is that the Middle East contributes most of China’s oil imports, and the route passes through more dangerous nodes with frequent piracy. For different countries, China’s transportation risks from Saudi Arabia, Iran, Oman and Indonesia are higher than that of other countries. This is because China imports a large proportion of oil from Saudi Arabia, Iran and Oman. When the transportation process goes wrong, the route is exposed to greater risks. However, Indonesia is exposed to shipping risks because of high piracy in the surrounding waters.
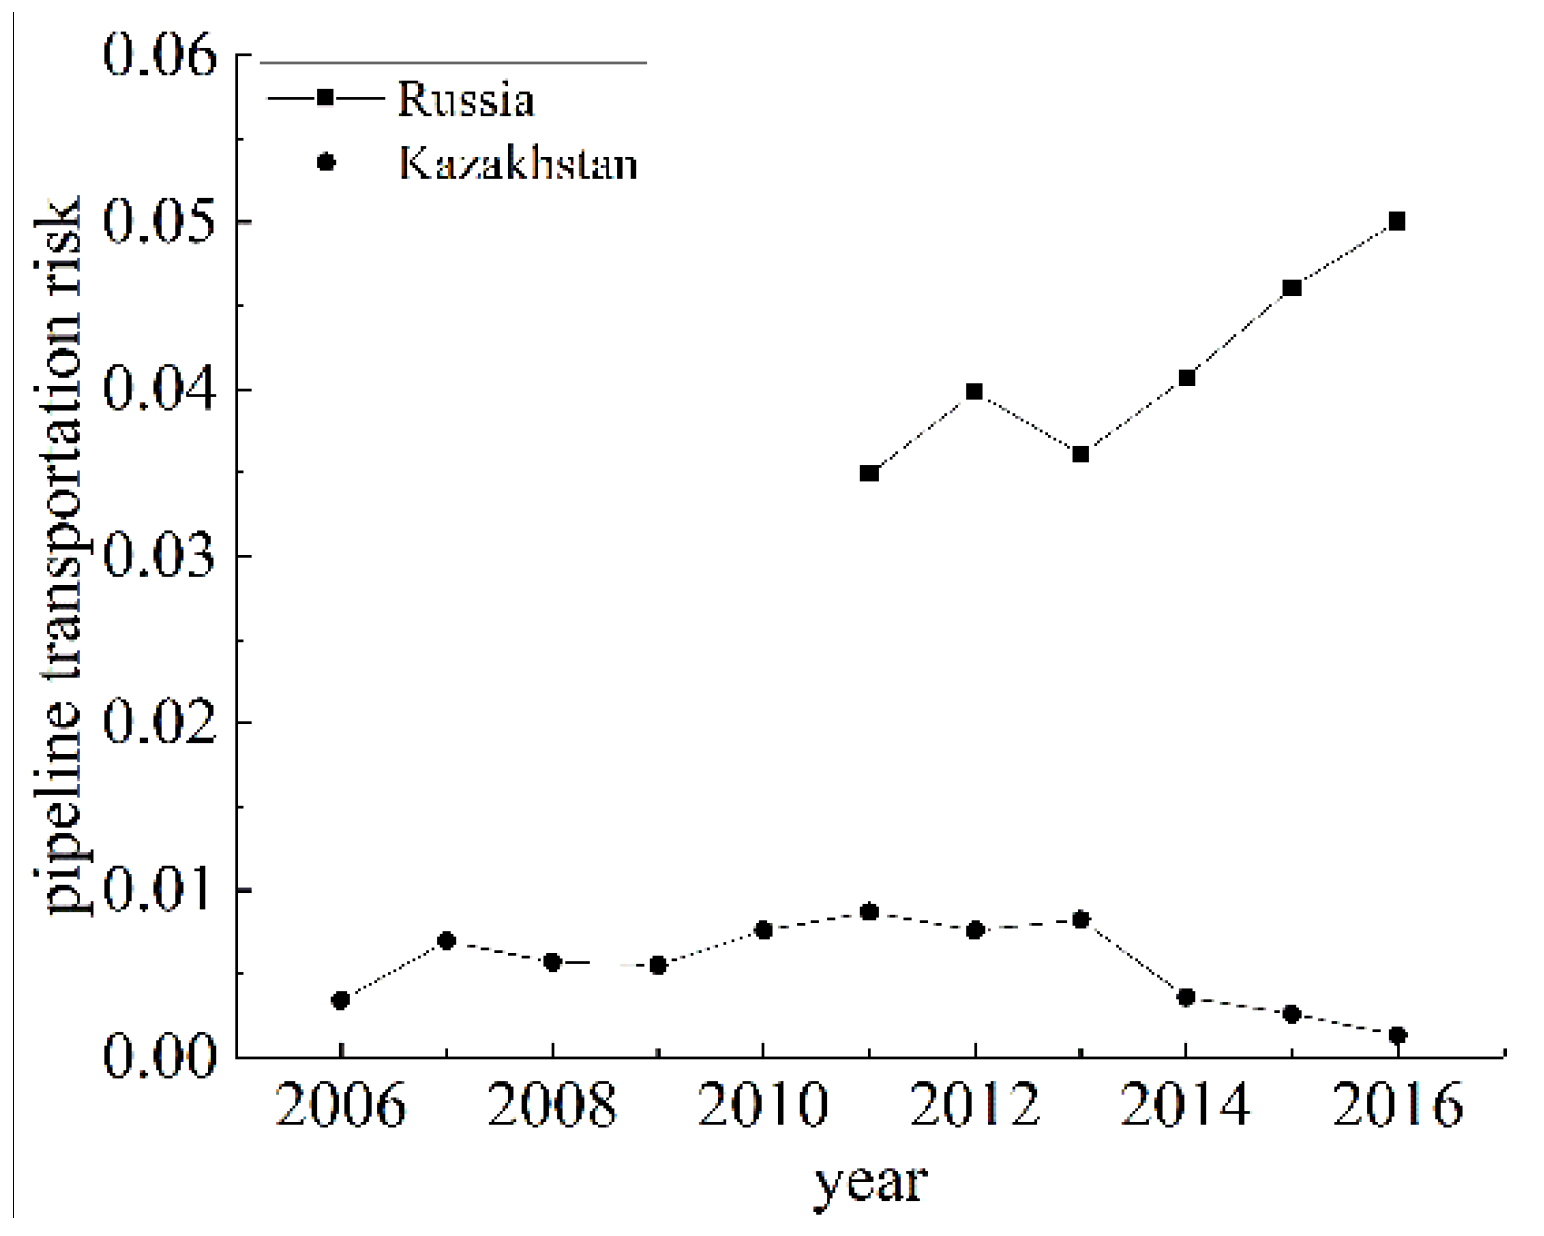
Figure 5 shows pipeline transportation risks of China’s imports of oil from Kazakhstan and Russia. The China-Kazakhstan oil pipeline and the China-Russian oil pipeline were put into use in 2006 and 2011, respectively. Since the share of China’s oil import from Russia is much higher than that from Kazakhstan, the risk of China-Russian oil pipeline transportation is obviously higher than that from China-Kazakhstan oil pipeline transportation. The transportation risk of China-Kazakhstan oil pipeline shows a upward trend from 2006 to 2013. After 2013, the transportation risk began to decline. However, the risks of oil pipeline transportation between China and Russia began to increase after 2013.
3.1.2. Empirical Analysis: The Impact of Import Risk on Oil Import Trade
In order to analyze the impact of oil import risks on trade volume, this paper adopted the panel data varying-coefficient model to estimate the relevant parameters of supply risk and trade volume, transportation risk and trade volume. The regression equation can be modified as
where (i=1,2,3,…,15; t=1,2, ,…,17) Adj_R2=0.9070
where (i=1,2,3,…,15; t=1,2, ,…,17) Adj_R2=0.9070
where lnoiliit represents the natural logarithm of China’s oil import trade volume from country i in year t. SRit, TRit represent the supply risk and transportation risk of China’s oil import from exporter i in year t, respectively. ui is the individual fixed effect, which is used to control the unobservable factors of each country that do not change with time. λt is the annual dummy variable. εit is the random error term.
Figure 6 shows the time-fixed effect in model (20) and (21), where the trends of λ1t, λ2t are basically the same. The trend reflects the changing of China’s oil import trade volume over years. From 2000 to 2015, the volume of oil import increased in fluctuation. However, due to the turbulence of the international oil market and the decline of oil price in 2009, the volume of oil import decreased obviously. After 2015, the volume of oil import began to decline for the same reason.
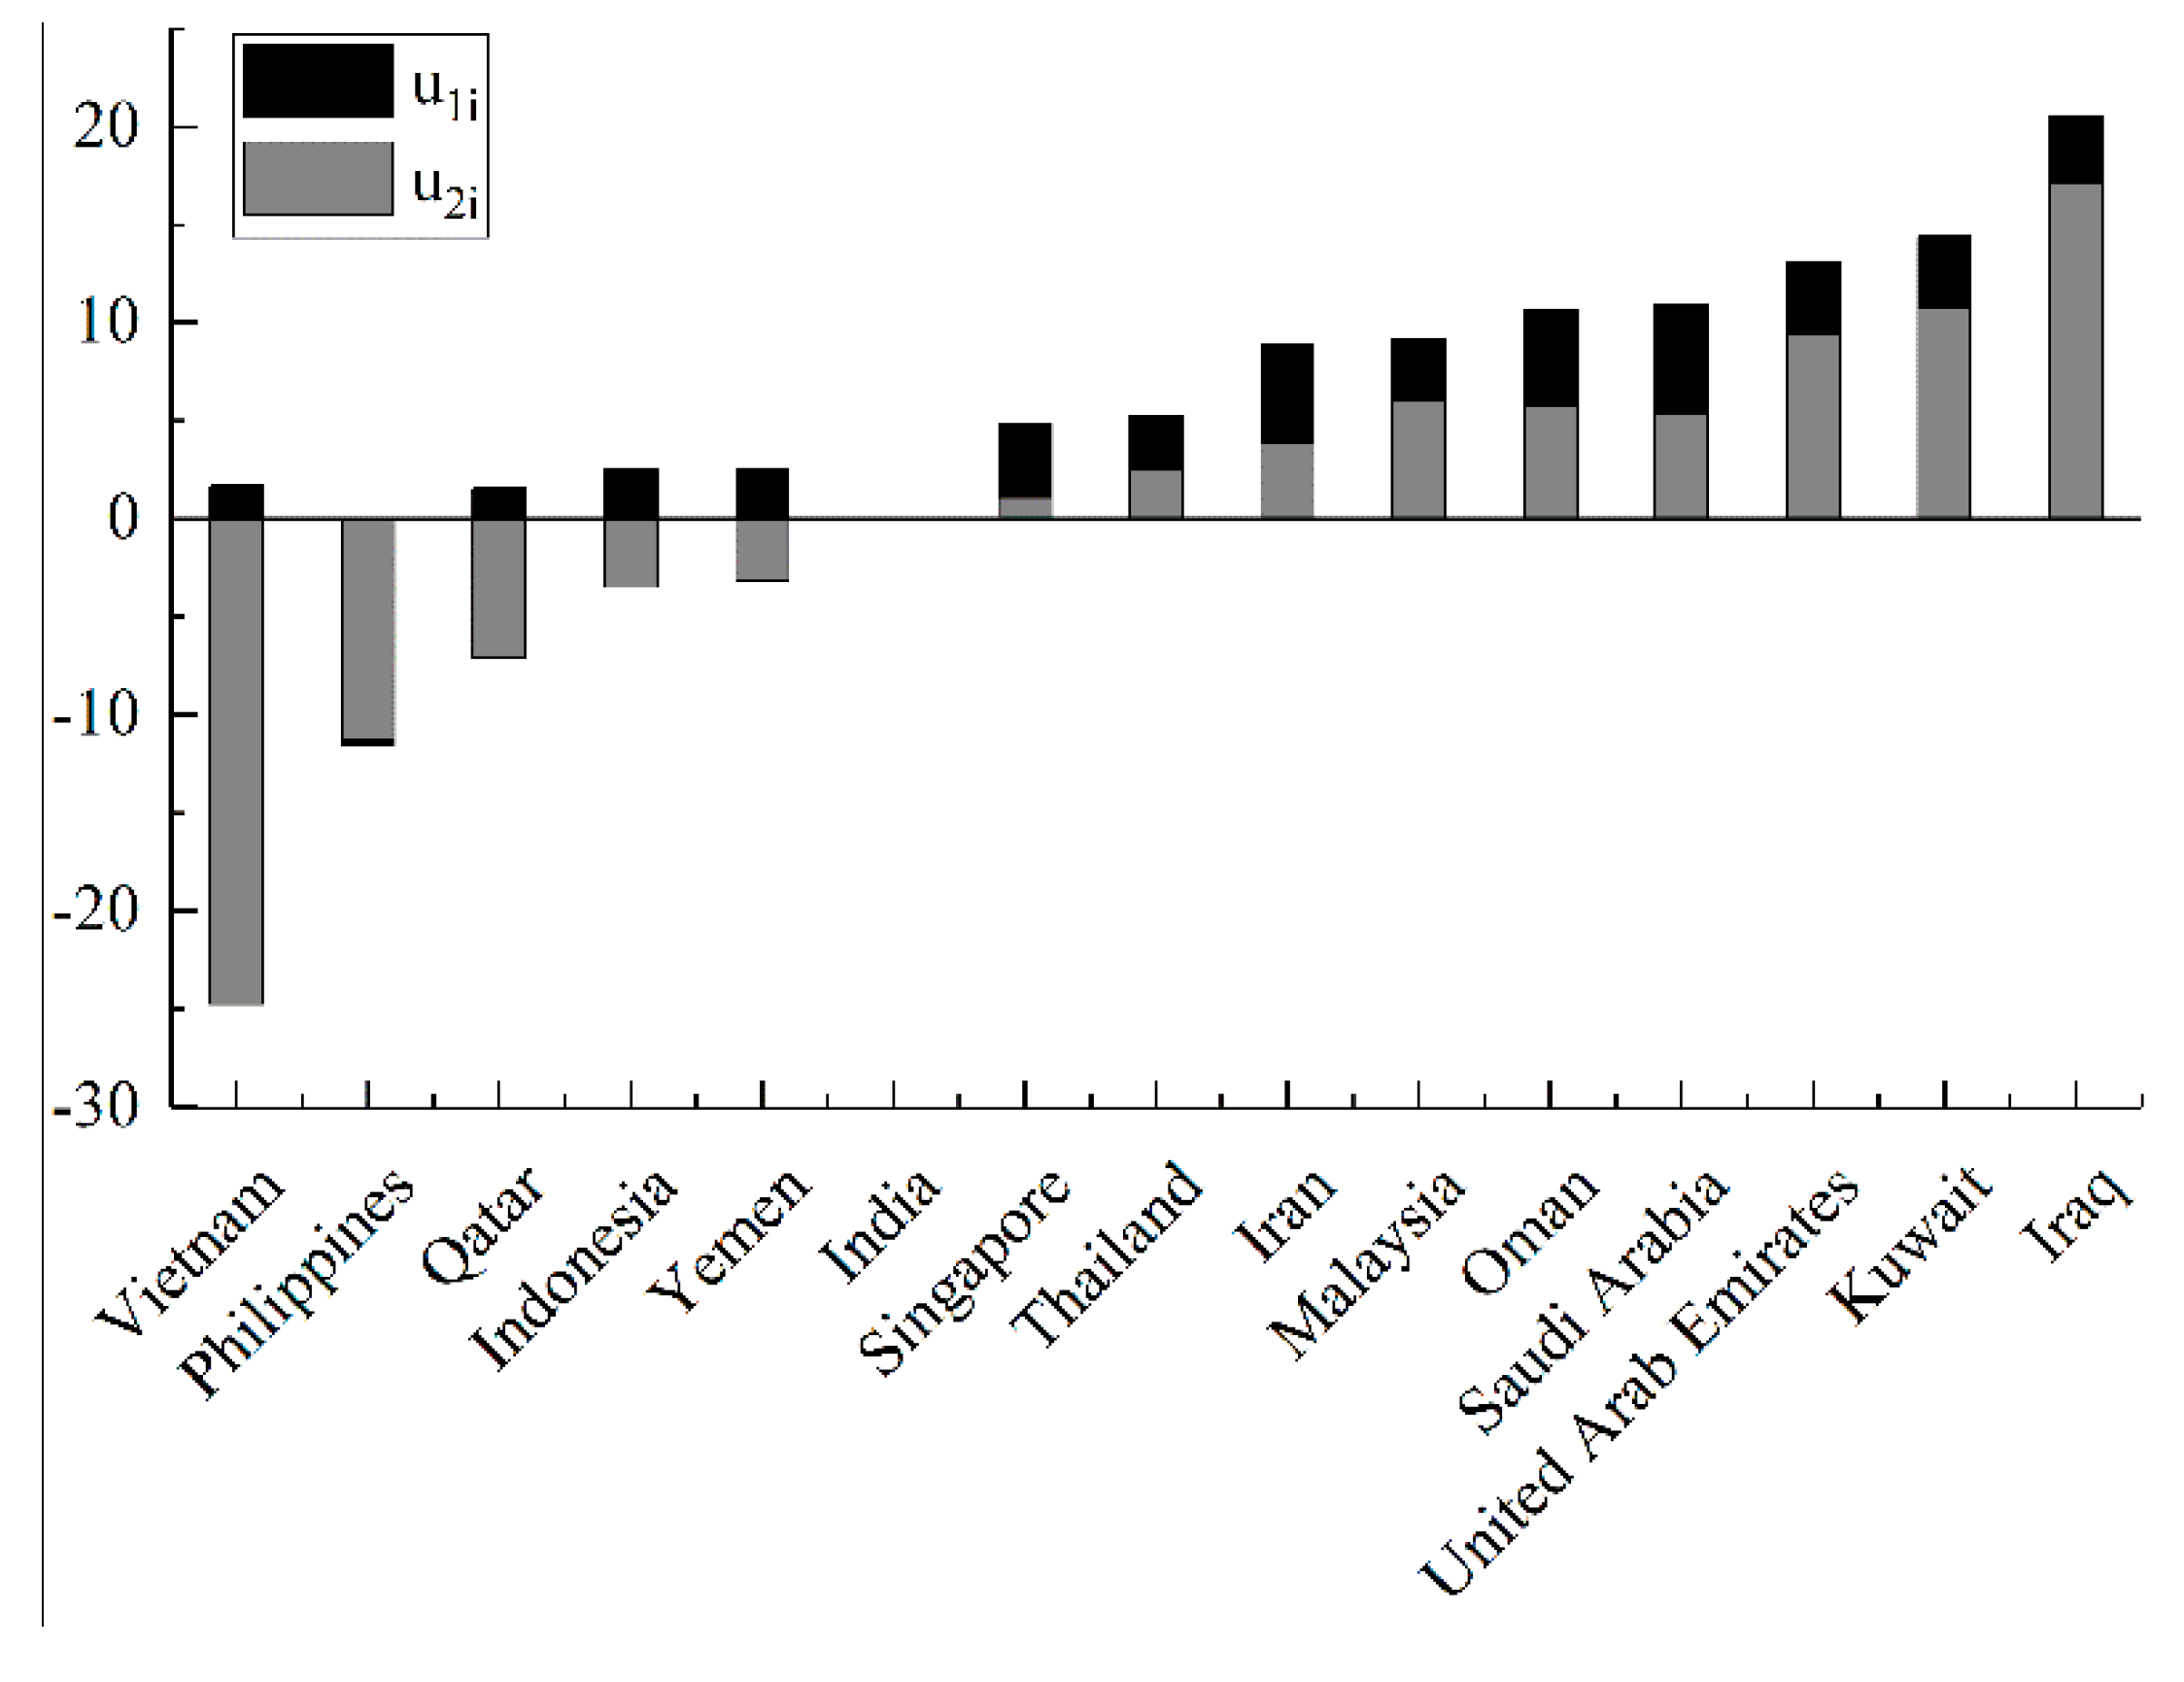
Figure 7 shows the individual fixed effects in model (20) and (21). The individual effect of most Middle Eastern countries is stronger than that of non-Middle Eastern countries. This indicates that the fixed base of China’s oil import trade from Middle Eastern countries is higher than that of China’s oil import trade from other countries. Compared with East Asia and South Asia, the Middle East has more abundant oil resources to meet China’s consumer demand. Therefore, China is more inclined to import oil from the Middle East. It should be noted that Qatar and Yemen are Middle Eastern countries, but their intercepts are smaller than those of some East Asian countries. This is because China imports less oil from Qatar and Yemen than other Middle Eastern countries.
In Table 3, β1i, β2i are the coefficients of oil supply risk and transportation risk, respectively. They reflect the sensitivity of China’s oil import volume from different countries to supply risk and transportation risk, respectively.
At the regional level, the supply risk coefficients of four countries in the Middle East are significantly negative. The coefficient of one country is significantly positive, and the others are not significant. Among the six countries in East and South Asia, one country’s coefficient is significantly positive, and one is significantly negative at 10% level; the other five countries’ coefficients are not significant. Compared with East Asia and South Asia, oil trade between China and the Middle East is more susceptible to the negative impact of supply risks. At the national level, the countries with significantly negative supply risk coefficients are Iraq, Kuwait, United Arab Emirates, Malaysia and Saudi Arabia. For each unit increase in the supply risk, China’s oil import trade volume from these countries decreases by 18.54%, 17.62%, 16.21%, 9.122% and 6.166%, respectively.
In general, the coefficients for each country are negative. This indicates that increased transport risks could deter China from importing oil. At the regional level, the transportation risk coefficients of countries in the Middle East are generally greater than that of South Asian and East Asian countries, which indicates that compared with countries in the Middle East, China’s oil trade with countries in South and East Asia is more sensitive to transport risk. At the national level, China’s oil imports from the Philippines, Malaysia and Vietnam are most affected by transport risks. When the transportation risk increases by one unit, China’s oil trade volume from these three countries will decrease by 5.78%, 1.04% and 0.70%. However, the transportation risk coefficients of Saudi Arabia, United Arab Emirates, Iran and Kuwait are not significant, indicating that the transportation risks have no impact on China’s oil imports from the major oil-producing countries in the Middle East. This is because China currently should import most oil from these countries and has no other choice. Therefore, there is no way to reduce oil imports, even with high transportation risks.
3.2. China’s Strategic Petroleum Reserve
3.2.1. Parameter Estimation
In order to calculate the optimal scale of SPR and alternative fuels, we must estimate the specific oil import demand function, and other relevant parameters. This includes the average scale of oil interruption, price elasticity of oil demand, price elasticity of oil supply, unit construction cost and unit operating cost of strategic petroleum reserve, unit construction cost and unit operating cost of alternative fuel reserve, the benchmark price of oil, the benchmark price of alternative fuels, and the bank rate.
1. Estimation of oil demand and supply function parameters
This paper assumed that the oil demand function and the oil supply function have the property of constant elasticity, and the inverse demand functions P(Q) and S(Q) are:
where Q is the oil demand. P(Q) is the oil price when the oil demand is Q. ψ is the price elasticity of oil demand; it is negative because of the reverse relationship between price and demand. S(Q) is the oil price when the oil supply quantity is Q. τ is the price elasticity of oil supply; it is positive because of the positive correlation between price and supply. P0 is a constant, representing the lowest price of oil. Both γ and φ are constants.
We took the international cost of oil extraction as the lowest price of oil, which means P0 is equal to $12.5/bbl. In addition, we took the average oil price of $70/bbl in 2017 as the equilibrium price and calculated the coefficient γ, φ (assuming no alternative fuel was developed in 2017). Then, γ and φ were substituted into the demand and supply functions, respectively, and we obtained
The demand function under the alternative-fuel strategic petroleum reserve model is
Further, we substituted the equilibrium points (365d2, P**) into equations (25) and (26). Then the formula for d2 and d1 is
2. Estimation of other parameters
China has limited oil reserves and abundant coal resources. Thus, it is urgent to extract alternative fuels (such as methanol, gasoline, glycol, etc.) from coal to replace oil. For convenience, we directly used coal as an alternative fuel, and the ratio of per unit coal to per unit oil utility is β. Table 4 shows the specific values of each parameter.
3.2.2. Model Solution and Analysis
• SPR model
We substitute the set parameter values into the formula and use MATLAB to solve them. The results showed that the optimal scale of China’s SPR is 77 “days of oil consumption”, when ψ=−0.1 and λ=21. The consumption of crude oil in 2017 of 590 million tons was taken as an example. If 1 ton of crude oil equals 7.3 barrels of crude oil, the average consumption of crude oil is about 11.8 million barrels per day. When it comes to the oil crisis in a decade, the oil reserves should be 90.86 million barrels.
In addition, we considered the case that the price elasticity of oil demand and the number of days of oil disruption adopt other values.
The oil demand function directly determines consumer surplus. Thus, the optimal scale will be changed when the demand function changes. According to Lin and Du [28], the strategic petroleum reserves are not sensitive to oil prices. Thus, we only considered the price elasticity of oil demand. Figure 8 shows the optimal scales of the SPR when the price elasticity of oil demand changes from −0.10 to −0.30 (with a change interval of 0.01). The price elasticity of oil demand has a great influence on the optimal scale of SPR, as shown in Figure 8. When the price elasticity of demand changes from −0.1 to −0.2 and −0.3, the optimal scale decreases from 77 "days of oil consumption" to 23 and 9, respectively, by 70% and 88%. As the price elasticity of oil demand increases, the optimal scale will decrease slowly. This is because oil demand becomes more sensitive to price changes when the price elasticity of oil demand increases. The demand curve becomes flatter, and the lost consumer surplus becomes smaller.
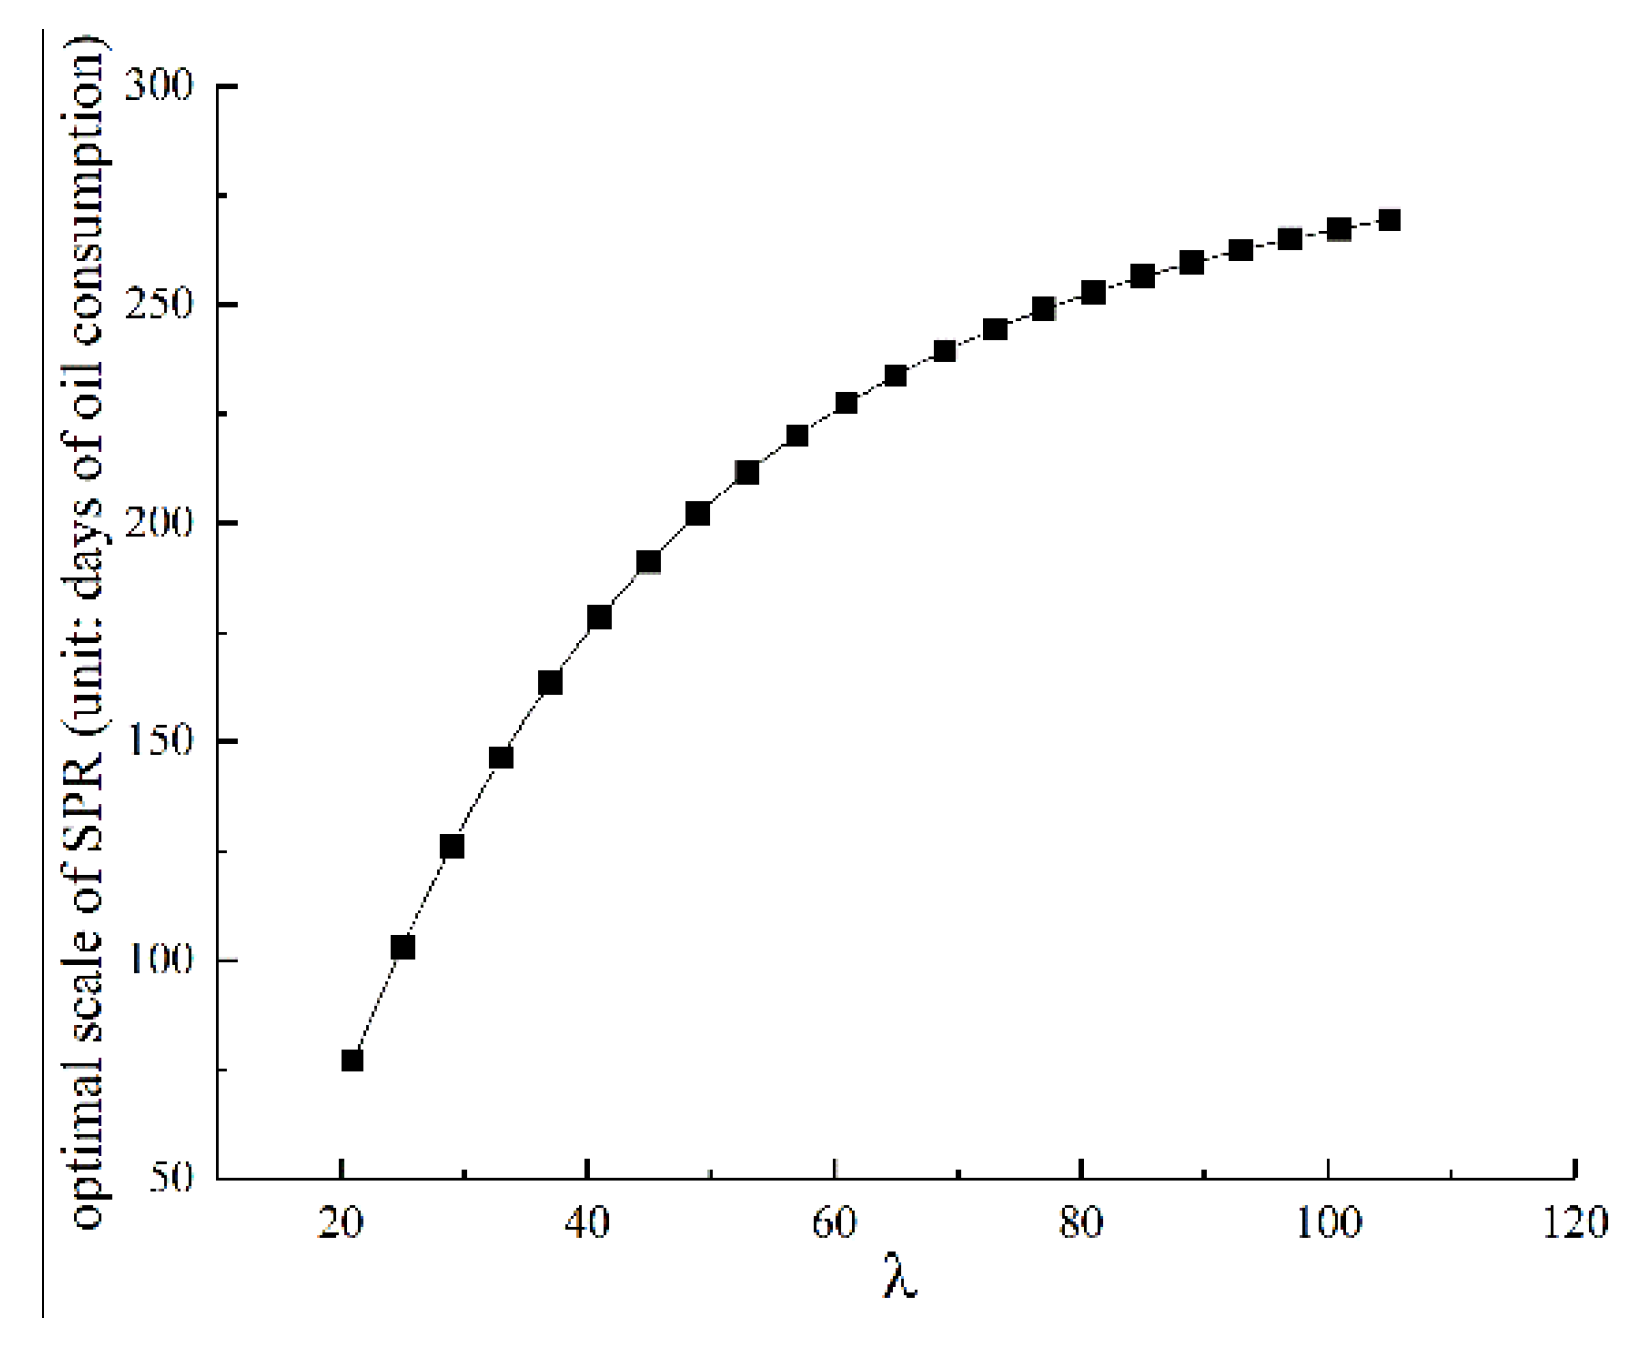
We assume that the days of oil interruption follows an exponential distribution with the average of λ. Thus the value of λ directly affects the scale of SPR. Sun [30] estimated the probability distribution of different oil interruption scales, based on historical data of oil interruptions since 1951. This study found that, under the assumption of exponential distribution, the average disruption scale is 21 days for a 10-year oil outage, 42 days for a 20-year oil crisis, and 105 days for a 50-year oil crisis. Therefore, we changed the scale of oil disruption from 21 "days of oil consumption" to 105 "days of oil consumption" (with an interval of 2 "days of oil consumption") to investigate the impact on the scale of SPR (Figure 9). As the scale of the disruption increases, the optimal size will increase, but the rate of increase will become slower. In the case of a=1, if the average scale of interruption changes from 21 to 105, the optimal scale changes from 77 to 270. The economic result is significant. When the scale of oil disruption increases, the marginal consumer surplus loss also increases. Therefore, it is necessary to expand the strategic oil reserves to reduce the marginal consumer surplus losses.
The price elasticity of oil demand and the average oil disruption have an important impact on the scale of SPR from the above analysis. Then, we calculated the optimal scale under different price elasticities to cope with different oil disruption scale (Table 5). This paper divided the price elasticity of demand into three conditions: high, normal and low (ψ=−0.1, ψ=−0.2, ψ=−0.3).
• Alternative fuels-SPR model
Similarly, we substituted the set parameter values into the formula and solved them using MATLAB. The results shows that the optimal scale is 10 "days of oil consumption" of coal and 75 "days of oil consumption" of SPR when ψ=−0.1, τ=0.1, β=0.25 and λ=21.
In addition, we considered the situation that the convert ratio of alternative fuels and the number of days of oil disruption adopt other values.
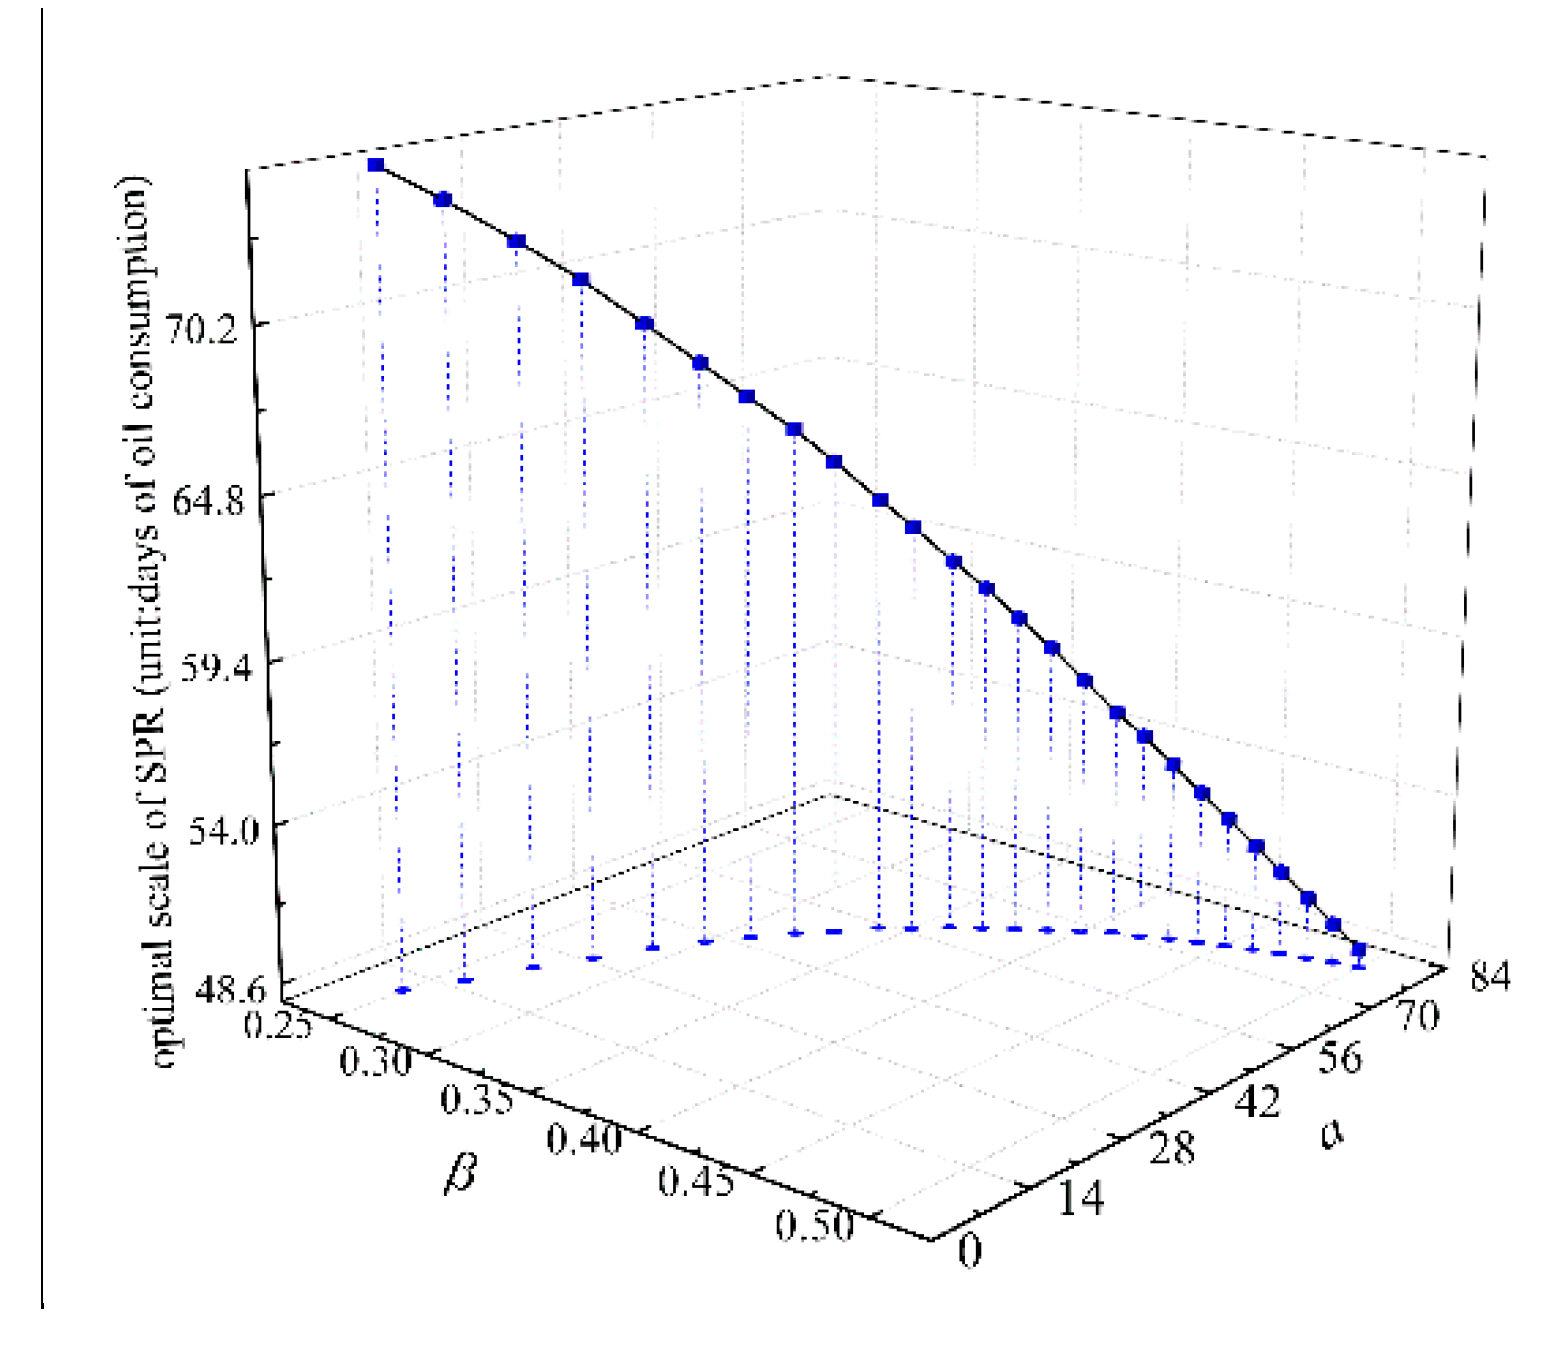
Figure 10 shows the optimal scale when the convert ratio of alternative fuels changes from β=0.25 to 0.50 in the base case. With the increase of the convert ratio, the alternative fuels become larger, and the SPR becomes smaller. When the convert ratio changes to 0.35, the optimal scale is: 57 "days of oil consumption" of coal with 62 " days of oil consumption" of SPR. When the convert ratio is further changed to 0.50, the optimal scale is: 78 "days of oil consumption" of coal with 49 "days of oil consumption" of SPR.
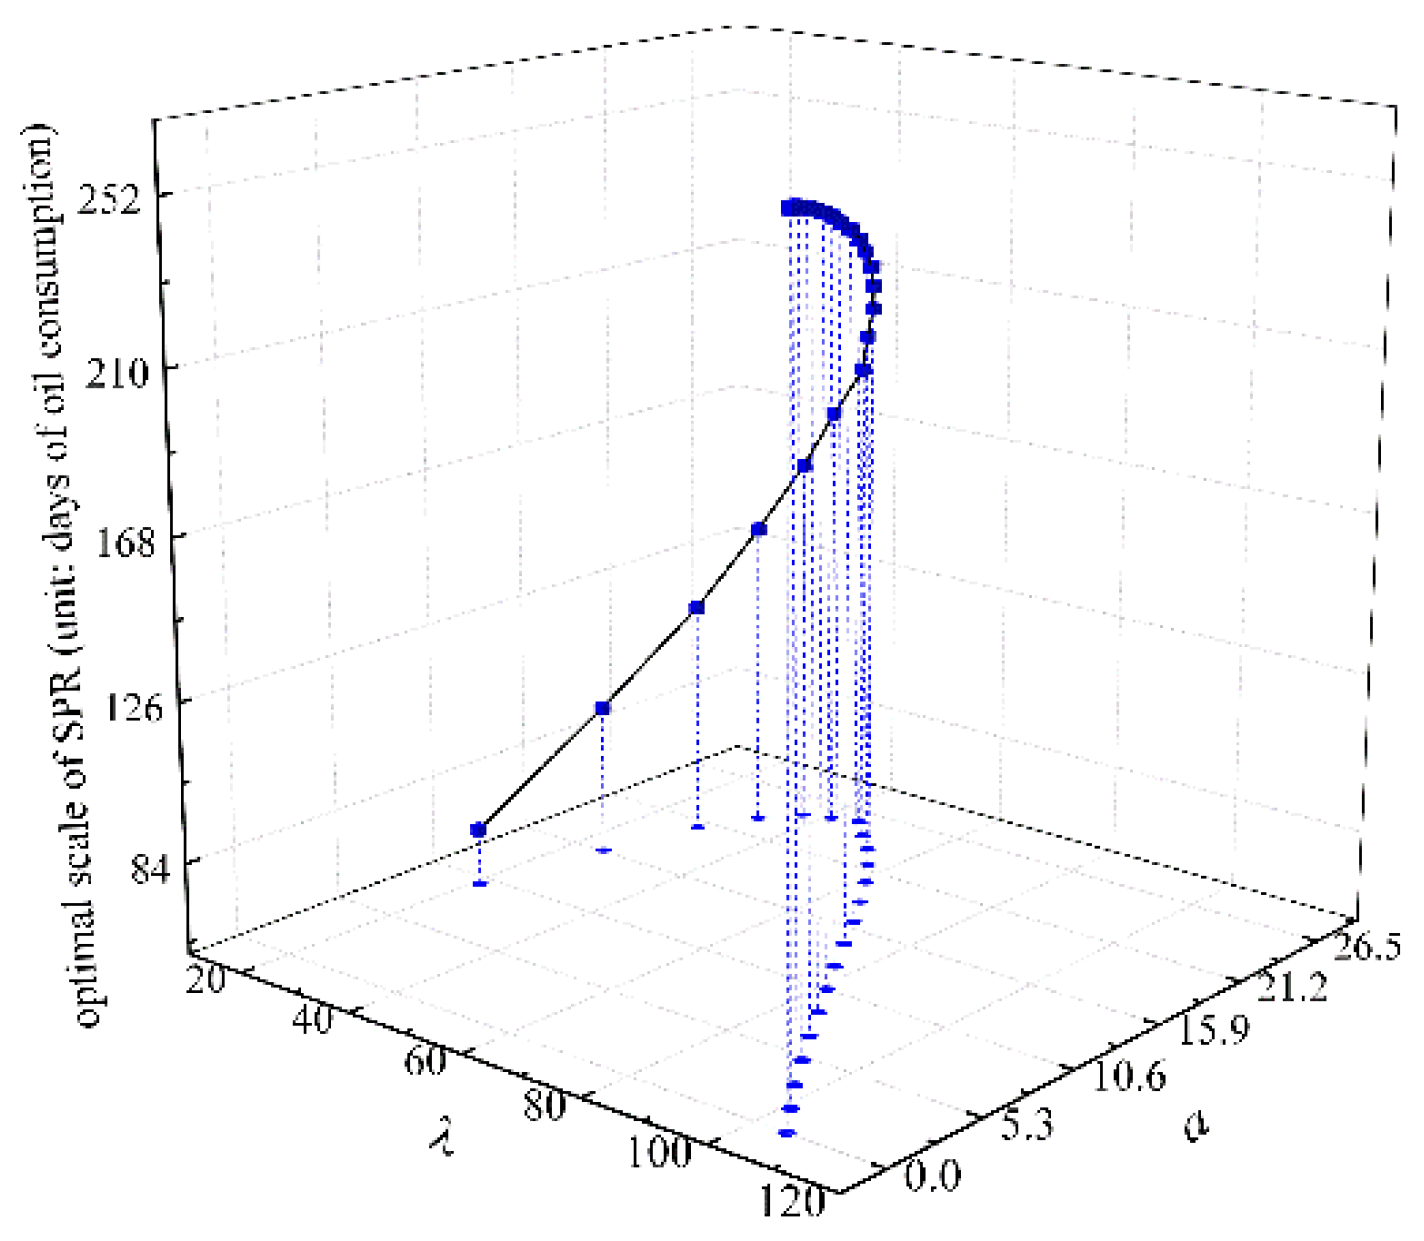
In addition, the scale of oil disruption was changed from 21 "days of oil consumption" to 105 "days of oil consumption" (with an interval of 2 "days of oil consumption") to investigate its impact on the scale of coal and SPR (Figure 11). As the scale of the disruption increases, both the size of alternative fuels and SPR increase. However, when convert ratio increases to a certain value, the scale of coal starts to decrease, and SPR still gradually increases. This indicates that alternative fuel can reduce the strategic petroleum reserve when the disruption scale is small. However, the strategic petroleum reserve plays an increasingly important role when the disruption scale is large.
In order to further investigate the comprehensive effect of convert ratio and scale of interruption, we calculated the optimal scale under convert ratio to cope with different oil disruption scales. This paper classified the convert ratio into three categories: high, normal and low (β=0.5, β=0.35, β=0.25). The simulation results are shown in Table 6. When the convert ratio is different, the turning point of alternative fuel will be different. The higher the convert ratio is, the greater the turning point of alternative fuel is.
4. Discussion
China, as the largest oil importing country, is faced with a huge import risk. Therefore, in this paper, the risk of China’s oil imports was first systematically analyzed. Furthermore, the models of SPR and alternative fuels were established, and influences of several paramount parameters on the model were discussed. The optimal SPR, 77 “days of consumption” in the proposed model, is analogous to those relating reference, 80 in [28] and 90 in [31], and the national actual situation. Therefore, the presented quantitative strategy petroleum reserve model is rational, and effective to be applied into the policy making process of the national energy strategy.
The framework in this work for national energy strategy has many advantages, the most significant of which is the consideration of both SPR and alternative fuels. Thus, it is more practical in an energy supply crisis. In addition, the oil import risk and demonstrating examples were analyzed, providing the theoretical basis for SPR and alternative fuels.
However, our strategic petroleum reserve model is still preliminary and has some limitations. This paper assumed that the purchase of China’s strategic petroleum does not affect the oil price, and there is no difference between a one-off purchase and an installment purchase. However, as China’s demand for oil soars, its imports are likely to have a big impact on world oil prices. In addition, China is actively developing new energy sources, including encouraging the development of electric vehicles and vigorously promoting solar energy and wind energy. It is beyond the scope of this paper to discuss the characteristics of all the possible alternative fuels on the development of SPR, although the present model can be applied to the above cases without difficulties.
5. Conclusions and Policy Implications
This paper quantified the risk of China’s oil import and simulated the optimal size of China’s strategic petroleum reserves under different supply interruption scenarios. This provides the scientific basis for grasping the current situation of China’s oil import and formulating China’s oil resource security policies. In addition, this paper calculated the supply and transportation risks of China’s oil imports and innovatively introduced the relationship with China into the calculation of supply risks. The development amount of alternative energy has been included into the model of strategic petroleum reserve as a factor affecting the strategic petroleum reserves. The research conclusions and policy recommendations of this paper are as follows:
- As for the case study of China, we find that the main risk factors affecting China’s oil import security varies in different periods. Furthermore, in terms of countries and regions, Saudi Arabia and Russia are the countries with the lowest annual supply risk, and the marine transportation risk of China’s oil imports from Middle Eastern countries is much higher than that from East Asian and South Asian countries. In addition, China’s oil imports from the Middle East are more susceptible to supply risks, and China’s oil imports from South and East Asian countries are more susceptible to transport risks. This reflects the fact that the impact of oil import risks on the volume of oil imports varies from region to region. This is due to the different feature of the Middle Eastern countries and Asian countries: Middle East countries have strong oil export capacity, but the political situation is unstable; Asian countries have weak oil export capacity, but the political situation is relatively stable.
- The numerical simulation of SPR model shows that under the condition of low price elasticity of China’s oil import demand (ψ= −0.10), the optimal strategic petroleum reserve is 77 "days of oil imports" to cope with the once-in-a-decade oil interruption crisis. However, larger oil reserves should cope with the larger oil interruption crisis. The price elasticity of oil import demand and the size of oil interruption crisis are the main factors affecting the optimal size of strategic petroleum reserves. The increase of price elasticity of oil import demand tends to reduce the optimal size of strategic petroleum reserves, and the increase of oil interruption crisis tends to expand the optimal size of strategic petroleum reserves. The key to the government’s decision on the optimal size of strategic petroleum reserves is to determine the price elasticity of oil import demand and how much the oil disruption crisis should be planned.
- The numerical simulation of alternative fuels-SPR model shows that the optimal scale is 75 “days of oil consumption” of oil with 10 "days of oil transportation" of coal, when ψ = − 0.10, τ = 0.10, β = 0.25, λ = 21. When the interruption scale keeps increasing, the amount of alternative fuel development in the optimal scale first increases and then decreases, and the amount of strategic petroleum reserve gradually increases. When the conversion rate of alternative fuels increases, the inflection point of the change of alternative fuel openness increases. Obviously, if the government is committed to improving the conversion rate of alternative energy, or actively demands new energy, the importance of petroleum energy in China’s energy consumption structure will continue to decrease. This will inevitably reduce the size of China’s strategic petroleum reserves, and be of great significance for coping with the long-term oil disruption crisis.
Energy, especially conventional fossil energy, is a basic guarantee and an important security prerequisite for the economic development of all countries and regions. SDG (sustainable development goals) 7, ensuring access to affordable, reliable and sustainable modern energy for all, is a re-emphasis on this important resource. At present, the competition for energy among countries in the world is becoming more and more fierce, which has become an important source of competition and conflict among countries. In order to ensure the oil supply security, China should take the construction of the “One Belt and One Road" as an opportunity to build a community of shared interests and destiny for Asia-Europe-Africa energy cooperation, strengthen the practical cooperation of the "the belt and road initiative" energy club, establish an information communication mechanism, financial support and supervision mechanism. This can eliminate barriers to energy trade and promote deep integration of energy markets. In addition, the government should actively develop alternative energy sources, promote new energy vehicles, and replace oil with electricity and biomass energy.
Author Contributions
The conceptualization, aspects and validation were performed by X.G. and S.N.; the methodology, software, formal analysis, and original draft was performed by C.H.; the paper was revised and checked by X.G. and S.N.; the funding acquisition were performed by X.G. and C.H. All authors have read and agreed to the published version of the manuscript.
Funding
This research was supported by the "One Belt and One Road" Special Project of Lanzhou University of China (Grant No. 2018ldbryb014). This research was supported by the Fundamental Research Funds for the Central Universities of China (Grant No. 18LZUJBWYJ005).
Acknowledgments
The authors are grateful to two anonymous reviewers for their valuable comments and suggestions.
Conflicts of Interest
The authors declare no conflict of interest.
References
- National Bureau of Statistics of China. Available online: http://data.stats.gov.cn/easyquery.htm?cn=C01 (accessed on 6 May 2019). (In Chinese)
- Development Report of Domestic and Foreign Oil and Gas Industry in 2018. Available online: http://news.cnpc.com.cn/system/2019/01/18/001717430.shtml (accessed on 6 May 2019). (In Chinese).
- Wu, G.; Liu, L.C.; Wei, Y.M. Comparison of China’s oil import risk: Results based on portfolio theory and a diversification index approach. Energy Policy 2009, 37, 3557–3565. [Google Scholar] [CrossRef]
- Coq, C.L.; Paltseva, E. Measuring the security of external energy supply in the European Union. Energy Policy 2009, 37, 4474–4481. [Google Scholar] [CrossRef]
- Yang, Y.Y.; Li, J.P.; Sun, X.L.; Chen, J.M. Measuring external oil supply risk: A modified diversification index with country risk and potential oil exports. Energy 2014, 68, 930–938. [Google Scholar] [CrossRef]
- Vivoda, V. Diversification of oil import sources and energy security: A key strategy or an elusive objective? Energy Policy 2009, 37, 4615–4623. [Google Scholar] [CrossRef]
- Gupta, E. Oil vulnerability index of oil-importing countries. Energy Policy 2007, 36, 1195–1211. [Google Scholar] [CrossRef]
- Geng, J.B.; Ji, Q. Multi-perspective analysis of China’s energy supply security. Energy 2014, 64, 541–550. [Google Scholar] [CrossRef]
- Zhang, H.Y.; Ji, Q.; Fan, Y. An evaluation framework for oil import security based on the supply chain with a case study focused on China. Energy Econ. 2013, 38, 87–95. [Google Scholar] [CrossRef]
- Sun, X.L.; Liu, C.; Chen, X.W.; Li, J.P. Modeling systemic risk of crude oil imports: Case of China’s global oil supply chain. Energy 2017, 121, 449–465. [Google Scholar] [CrossRef]
- Nordhaus, W.D. The 1974 report of the president’s council of economic advisers: Energy in the economic report. Am. Econ. Rev. 1974, 64, 558–565. [Google Scholar]
- Tolley, G.S.; Wilman, J.D. The foreign dependence question. J. Polit. Econ. 1977, 85, 323–347. [Google Scholar] [CrossRef]
- Teisberg, T.J. A dynamic programming model of the U.S. strategic petroleum reserve. Bell J. Econ. 1981, 12, 526–546. [Google Scholar] [CrossRef]
- Oren, S.S.; Wan, S.H. Optimal strategic petroleum reserve policies: A steady state analysis. Manag. Sci. 1986, 32, 14–29. [Google Scholar] [CrossRef] [Green Version]
- Sun, M.; Gao, C.X.; Shen, B. Quantifying China’s oil import risks and the impact on the national economy. Energy Policy 2014, 67, 605–611. [Google Scholar] [CrossRef]
- United Nations Comtrade Database. Available online: https://comtrade.un.org/ (accessed on 6 May 2019).
- US Peace Center Database. Available online: http://www.systemicpeace.org/ (accessed on 6 May 2019).
- Ministry of Commerce of China. Available online: http://tfs.mofcom.gov.cn/article/Nocategory/201111/20111107819474.shtml (accessed on 6 May 2019). (In Chinese)
- Chinese Consular Affairs. Available online: http://cs.mfa.gov.cn/zlbg/tyxy_660627/t833978.shtml (accessed on 6 May 2019). (In Chinese)
- CEPII Database. Available online: Cepii.fr/cepii/en/bdd_modele/bdd.asp (accessed on 6 May 2019).
- Pirate Attacks—Statistics & Facts. Available online: https://0-www-statista-com.brum.beds.ac.uk/topics/1290/pirate-attacks/ (accessed on 6 May 2019).
- PHMSA. Available online: https://www.phmsa.dot.gov/ (accessed on 6 May 2019).
- CEPA. Available online: https://cepa.com/en/ (accessed on 6 May 2019).
- Concawe. Available online: https://www.concawe.eu/ (accessed on 6 May 2019).
- Xie, J.; Xiao, Y.; Zhang, X.L.; Yang, Y. National energy supply potential and energy geopolitical pattern along “The Belt and Road”. World Reg. Stud. 2017, 26, 13–23. (In Chinese) [Google Scholar]
- Gao, D.; Li, Z.; Liu, P.; Zhao, J.Z.; Zhang, Y.N.; Li, C.B. A coordinated energy security model taking strategic petroleum reserve and alternative fuels into consideration. Energy 2018, 145, 171–181. [Google Scholar] [CrossRef]
- Wang, L. Study on Emergency Reserves of Coal Resources in Central China Responding to Natural Disaster; China University of Mining and Technology: Beijing, China, 2016. (In Chinese) [Google Scholar]
- Lin, B.Q.; Du, L.M. The optimal size of China’s strategic petroleum reserves. J. World Econ. 2010, 33, 72–92. (In Chinese) [Google Scholar]
- Zhou, D.Q.; Sun, L.C.; Wan, H. Study on the strategic petroleum reserve model with the factor of petroleum substitution and tariff quota policy. Chin. J. Manag. Sci. 2010, 18, 149–155. (In Chinese) [Google Scholar]
- Sun, T.Q. Probability model and its application of strategic oil storage based on complex poisson process. J. Appl. Stat. Manag. 2007, 26, 852–857. (In Chinese) [Google Scholar]
- Wu, Y.; Fan, Y.; Liu, L.C.; Wei, Y.M. An empirical analysis of the dynamic programming model of stockpile acquisition strategies for China’s strategic petroleum reserve. Energy Policy 2008, 36, 1470–1478. [Google Scholar] [CrossRef]
Figure 1.
Consumer surplus loss.

Figure 2.
Consumer surplus loss based on the alternative fuel-SPR (strategic petroleum reserve) model.
Figure 2.
Consumer surplus loss based on the alternative fuel-SPR (strategic petroleum reserve) model.

Figure 3.
Trends in supply risk for 17 countries.

Figure 4.
Maritime transportation risks for 15 countries.

Figure 5.
Pipeline transportation risk.

Figure 6.
Time fixed effect.

Figure 7.
Individual fixed effects.

Figure 8.
Optimal scale when the price elasticity of oil demand changes.

Figure 9.
Optimal scale when the price elasticity of oil demand changes.

Figure 10.
Optimal scale when convert ratio changes.

Figure 11.
Optimal scale when average oil disruption scale changes.


Table 1.
Transportation route and risk node.
| Country | Risk Node |
|---|---|
| India | Indian waters, South China Sea |
| Indonesia | Indonesian waters, South China Sea |
| Thailand | Thailand waters, South China Sea |
| Vietnam | Vietnamese waters, South China Sea |
| Philippines | Philippine waters, South China Sea |
| Malaysia | Malaysian waters, South China Sea |
| Singapore | Strait of Malacca, South China Sea |
| Iraq, Iran, Kuwait, Saudi Arabia, Qatar, United Arab Emirates | Persian Gulf, Arabian Sea, Indian Ocean, Malacca Strait, South China Sea |
| Yemen | Yemeni waters, Gulf of Aden, Arabian Sea, Indian Ocean, Malacca Strait, South China Sea |
| Oman | Oman waters, Arabian Sea, Indian Ocean, Malacca Strait, South China Sea |
| Kazakhstan, Russia | Pipeline transportation |
Table 2.
Descriptive statistics of supply risk in 17 countries.
| Country | Mean | Standard Deviation | Minimum | Maximum | Range |
|---|---|---|---|---|---|
| India | 0.756 | 0.097 | 0.645 | 0.894 | 0.249 |
| Indonesia | 0.662 | 0.050 | 0.616 | 0.748 | 0.132 |
| Singapore | 0.573 | 0.070 | 0.462 | 0.653 | 0.192 |
| Thailand | 0.630 | 0.031 | 0.583 | 0.688 | 0.105 |
| Philippines | 0.692 | 0.036 | 0.658 | 0.753 | 0.095 |
| Vietnam | 0.617 | 0.015 | 0.598 | 0.649 | 0.051 |
| Malaysia | 0.626 | 0.043 | 0.566 | 0.692 | 0.126 |
| Yemen | 0.779 | 0.042 | 0.669 | 0.845 | 0.177 |
| Iraq | 0.899 | 0.066 | 0.743 | 0.975 | 0.232 |
| Iran | 0.643 | 0.085 | 0.538 | 0.767 | 0.230 |
| Saudi Arabia | 0.496 | 0.094 | 0.384 | 0.654 | 0.270 |
| Qatar | 0.653 | 0.019 | 0.622 | 0.680 | 0.059 |
| United Arab Emirates | 0.565 | 0.059 | 0.467 | 0.649 | 0.182 |
| Oman | 0.608 | 0.044 | 0.541 | 0.666 | 0.125 |
| Kuwait | 0.591 | 0.051 | 0.511 | 0.659 | 0.148 |
| Kazakhstan | 0.604 | 0.037 | 0.552 | 0.672 | 0.119 |
| Russia | 0.525 | 0.176 | 0.296 | 0.769 | 0.472 |
| total | 0.642 | 0.117 | 0.296 | 0.975 | 0.678 |
Table 3.
Coefficient estimation results of the regression of supply risk and transportation risk to oil import volume.
Table 3.
Coefficient estimation results of the regression of supply risk and transportation risk to oil import volume.
| India | Indonesia | Singapore | Thailand | Philippines | Vietnam | Malaysia | ||
| β1i | −3.46 | 5.54 | −0.52 | −4.58 | 12.66 | 39.42** | −9.12* | |
| β2i | −1.04*** | −0.14*** | −0.05** | −0.44* | −5.79*** | −0.70*** | −0.11*** | |
| Yemen | Iraq | Iran | Saudi Arabia | Qatar | United Arab Emirates | Oman | Kuwait | |
| β1i | 4.30*** | −18.54*** | −3.06 | −6.17** | 8.65 | −16.21*** | −6.63 | −17.62*** |
| β2i | −0.04*** | −0.04*** | −0.01 | −0.01 | −0.03*** | −0.01 | −0.01** | −0.02 |
Note: *, ** and *** respectively represent significant at the level of 10%, 5% and 1%.
Table 4.
Parameter estimation.
| Parameter | Value | Units | Description | |
|---|---|---|---|---|
| P0 | 12.5 [26] | dollar per barrel | Benchmark oil price | |
| P* | 70 | dollar per barrel | Oil price in normal state | |
| Pa | 550 | yuan per ton | Coal price in normal state | |
| c1 | 5 [26] | dollar per barrel | Construction cost per unit of SPR | |
| v1 | 0.4 [27] | dollar per barrel | Operation cost per unit of SPR | |
| c2 | 22 [28] | yuan per ton | Construction cost per unit of coal reserve | |
| v2 | 40 [28] | yuan per ton | Operation cost per unit of coal reserve | |
| β | 0.25 [29] | — | Convert ratio of coal to oil | |
| τ | 0.10 | — | Price elasticity of oil supply | |
| ψ | ψ1 | −0.10 | — | Low price elasticity of oil demand |
| ψ2 | −0.20 | — | Normal price elasticity of oil demand | |
| ψ3 | −0.30 | — | High price elasticity of oil demand | |
| λ | λ1 | 21 | days of oil consumption | Average disruption scale of the oil crisis that occurred once in 10 years |
| λ2 | 31 | days of oil consumption | Average disruption scale of the oil crisis that occurred once in 15 years | |
| λ3 | 42 | days of oil consumption | Average disruption scale of the oil crisis that occurred once in 20 years | |
| λ4 | 63 | days of oil consumption | Average disruption scale of the oil crisis that occurred once in 30 years | |
| λ5 | 84 | days of oil consumption | Average disruption scale of the oil crisis that occurred once in 40 years | |
| λ6 | 105 | days of oil consumption | Average disruption scale of the oil crisis that occurred once in 50 years | |
Table 5.
The optimal scale of SPR under different conditions.
| Average Scale of Oil Disruption (Unit: Days of Oil Consumption) | ||||||
|---|---|---|---|---|---|---|
| λ = 21 Occurred Once in 50 Years | λ = 31 Occurred Once in 50 Years | λ = 42 Occurred Once in 50 Years | λ = 63 Occurred Once in 50 Years | λ = 84 Occurred Once in 50 Years | λ = 105 Occurred Once in 50 Years | |
| ψ = −0.1 | 77 | 137 | 182 | 231 | 256 | 270 |
| ψ = −0.2 | 23 | 64 | 110 | 170 | 204 | 224 |
| ψ = −0.3 | 9 | 35 | 73 | 132 | 169 | 192 |
Table 6.
The optimal scale of coal and SPR under different conditions.
| Average Scale of Oil Disruption (Unit: Days of Oil Consumption) | ||||||
|---|---|---|---|---|---|---|
| λ = 21 Occurred Once in 50 Years | λ = 31 Occurred Once in 50 Years | λ = 42 Occurred Once in 50 Years | λ = 63 Occurred Once in 50 Years | λ = 84 Occurred Once in 50 Years | λ = 105 Occurred Once in 50 Years | |
| β = | a = 10 s = 75 | a = 22 s = 133 | a = 25 s = 178 | a = 19 s = 228 | a = 9 s = 255 | a = 0 s = 270 |
| β = | a = 57 s = 62 | a = 84 s = 117 | a = 95 s = 162 | a = 102 s = 212 | a = 100 s = 239 | a = 97 s = 254 |
| β = | a = 78 s = 49 | a = 118 s = 97 | a = 141 s = 137 | a = 166 s = 183 | a = 180 s = 207 | a = 189 s = 221 |
© 2020 by the authors. Licensee MDPI, Basel, Switzerland. This article is an open access article distributed under the terms and conditions of the Creative Commons Attribution (CC BY) license (http://creativecommons.org/licenses/by/4.0/).
Share and Cite
MDPI and ACS Style
Guo, X.; Hao, C.; Niu, S. Analysis of Oil Import Risk and Strategic Petroleum Reserve: The Case of China. Sustainability 2020, 12, 3723. https://0-doi-org.brum.beds.ac.uk/10.3390/su12093723
AMA Style
Guo X, Hao C, Niu S. Analysis of Oil Import Risk and Strategic Petroleum Reserve: The Case of China. Sustainability. 2020; 12(9):3723. https://0-doi-org.brum.beds.ac.uk/10.3390/su12093723
Chicago/Turabian StyleGuo, Xiaodong, Chen Hao, and Shuwen Niu. 2020. "Analysis of Oil Import Risk and Strategic Petroleum Reserve: The Case of China" Sustainability 12, no. 9: 3723. https://0-doi-org.brum.beds.ac.uk/10.3390/su12093723
Note that from the first issue of 2016, this journal uses article numbers instead of page numbers. See further details here.