Article

Sustainability of Mussel (Mytilus Galloprovincialis) Farming in the Po River Delta, Northern Italy, Based on a Life Cycle Assessment Approach

1
Department of Life Sciences and Biotechnology, University of Ferrara, 44121 Ferrara, Italy
2
Istituto Delta Ecologia Applicata, 44124 Ferrara, Italy
*
Author to whom correspondence should be addressed.
Sustainability 2020, 12(9), 3814; https://0-doi-org.brum.beds.ac.uk/10.3390/su12093814
Submission received: 2 April 2020 / Revised: 29 April 2020 / Accepted: 1 May 2020 / Published: 7 May 2020
(This article belongs to the Collection Environmental Assessment, Life Cycle Analysis and Sustainability)

Abstract

:
Molluscan shellfish aquaculture is considered a “green” industry because of the limited presence of chemicals and risk of pathogens during farming in licensed areas, which provide a safe, nutritive and healthy food source. Moreover, the environmental impact of their production is lower than all other fish animal per unit of protein. In particular, mussels’ production was the first organized mollusk aquaculture in Europe and is now one of the most extended. Italy is the second main European producer of mussels. Taking into account the relevance of the sector, Italian Mediterranean mussel (Mytilus galloprovincialis) aquaculture has been considered for a life cycle assessment (LCA), from a cradle-to-gate perspective. The mussel farms were located in the northern Adriatic Sea, close to the Po River Delta, a region traditionally vocated to bivalve aquaculture. Results have shown that the growing and harvesting phases are the most critical life cycle stages (“hotspots”) due to the production and use of boats, and the great quantity of non-recyclable high-density polyethylene (HDPE) socks used during the yearly productive cycle. Several improvement potentials have been identified and estimated by means of a sensitivity analysis. Furthermore, regarding the principal exporting countries to Italy (Spain and Chile), the transport factors in an overall sustainability assessment have been considered, in order to compare the local and global mussels supply chain.

1. Introduction

In recent years, the global demand of fisheries has been constantly increased. While capture fisheries’ production has been slowing down as far as fish stocks have been over-exploited due to the difficulty of making management models prevail over the overwhelming law of the market, aquaculture is a world commodity in constant growth and enables to meet the ever increasing food demand driven by population growth [1]. In fact, with about a 6% increase in the yearly raising rate during the last decades, aquaculture keeps on growing more rapidly than other food protein production sector, and its economic importance is increasing concomitantly [2]. The amount of species such as salmon, catfish and shrimp has exploded, raising about 85% over the past ten years [3]. Since the feed for these species are almost entirely prepared with fish meal, this means, as for some meat productions, that aquaculture is developing out of sustainability criteria [4]. Moreover, such a rapid expansion worldwide has led coastal ecosystems to serious environmental damage, especially caused by uncontrolled expansion and monoculturing systems [5]. Pressure on natural resources such as water, energy, eutrophication, biodiversity loss, land use change, introduction of allochthons, genetic alteration of and disease transmission to wild stocks, as well as food insecurity, could be included in the long list of environmental burdens [6]. Moreover, external inputs as fertilizers, feed, antibiotics and additives, largely used in modern aquaculture, arrive to water also as organic loads from the surrounding agriculture, leading to a potential depletion of water quality that can affect native species. Today, more than 40% of aquaculture production depends on industrial feeds with a major part derived from marine and coastal ecosystems, with the consequent further suffering of wild fish stock [7]. On the other hand, to switch from farming top predators to species which have a lower position in the food web, and thus require no fish meal as feed, or better, don’t require any feed at all, such as bivalve molluscs population, is nowadays of main interest to ensure adequate nutritional requirement for constantly increasing world population. As a matter of fact, shellfish provide one of the most feasible options for producing sustainable food [8]. In fact, compared with other aquacultured species of fish and seaweeds, filters-feeding bivalves have lower growing requirements and, as a consequence, lower impacts on coastal ecosystems [9].
Bivalves shellfish can be considered as a “green” aquaculture. They are grown or farmed in licensed areas, certified for the absence or very limited presence of chemicals and risk of pathogens, provide a safe, nutritious and healthy food source [10], with an average higher protein content than beef (140 vs. 85 mg protein/kcal) and a high content of essential omega-3 fatty acids [11]. The environmental impact of mollusk aquaculture is usually lower than all other forms of meat or fish production and several agricultural crops considering greenhouse gas emissions, land use, freshwater use and eutrophication potential per unit of protein [12]. As an example, if just 25% of actual intensive fish farming was substituted with an exact amount of protein from mollusk aquaculture, 16.3 million tonnes of CO2 emissions could be yearly recovered, corresponding to about 50% of the overall emissions of New Zealand [13]. As reported by Danovaro et al. [14], mussel aquaculture in the Adriatic Sea is environmental friendly and does not significantly cause alterations in the marine ecosystem, both as functioning and trophic state. Furthermore, mussels represent a fundamental connection between the bottom-dwelling fish and phytoplankton along the water column. In fact, they efficiently act as filters of particulate matters from water, removing turbidity, nitrogen and other nutrients [10], which, in their turn, contribute to phytoplankton growing. Moreover, the deposition of mussel faeces under the farming plants contribute to the mineralization of organic matter settled on the seabeds [15].
Recently, the market has been recognizing this value added, with growing requests for the major mollusk species (oysters, clams, mussels and scallops) [16]. Mussel production, in particular, reported as done in wooden stakes in France since 1235, has been the first example of regulated bivalves’ aquaculture in Europe [17]. Since then, mussel farming has seen a great development in the overall European coastal area. In particular, on the Atlantic coast with the blue mussel (Mytilus edulis), whereas on the Spanish Atlantic coast and the Mediterranean area with the Mediterranean mussel (Mytilus galloprovincialis), which is farmed as far as the Black Sea [18]. Mussel aquaculture, now accounting for not more than 15% of the global shell mollusks production, is now largely present wordwide in coastal areas and it is still an industry with great room to grow [19]. In 2015, the largest production took place in Asia (1.05 million tonnes), followed by Europe (0.50 million tonnes), the Americas (0.25 million tonnes), Oceania and Africa (0.08 million tonnes) [15].
In Europe, Italy is the second main producer of farmed mussels after Spain, with about 64,000 tonnes per year of fresh mussels and also is one of the largest markets for mussels in Europe with an average consumption of 120,000 tonnes per year [20]. In Italy, the Emilia-Romagna region is the largest in terms of production, with 34% of the overall volume, due to the favorable natural conditions for the production and maturation of mussels [21]. Nevertheless, domestic mussels’ production does not be sufficient to cover the internal market request. Spain is the main supplying country for the Italian market with a 20% share of total imports in 2017, followed by Greece, Chile and Tunisia [22]. A great potential for future development could be recognized to mussel market in view of sustainable production perspective.
Considering the importance of the sector, and the great interest on its sustainability, mussel aquaculture has been considered for the evaluation of its environmental impacts by means of a life cycle assessment (LCA) [23]. The method, standardized by the International Standards Organization (ISO), makes it possible to quantify the total environmental impact of a product and considers all the steps in the production chain [24]. LCA can be used to make a quantitative evaluation that produces clear indicators of sustainability and permits a comparison among different studies [25]. A life cycle assessment can highlight the specific processes responsible for major environmental impacts along the entire supply chain, including transportations, shipping and market connections [26]. In fact, seafood can be now advisedly considered one of the mostly traded global commodities, even though impacts of transportation of products from the fishery or farm to the market are rarely accounted for in the sustainability evaluations. The often large distance between the place where a product is produced and where it is consumed could be included as a key variable to judge if a global food supply chain is sustainable or not [27]. Information can be used to evidence the environmental hotspots that give significant contribution to the impacts of aquaculture, in order to facilitate regulations and policy making [28].
Although LCA has been already largely used in industry and agriculture sectors, studies for aquaculture have been developed only recently, and are mainly focused on intensive farming systems, including salmon [29,30], rainbow trout [31], shrimp [32,33], sea bass, sea bream [34,35] and tilapia [36]. In particular, mussel farming has already been examined in an LCA perspective in Spain [37,38], in France [39], in Algeria [40], and in Scotland [41]. This article carried out the LCA of the Italian mussel farming sector based on current husbandry practices, with the purpose of giving information on its environmental performance. In fact, to the best of the authors’ knowledge, this is the first study on mussel farming in Italy. Besides the regional and national significance of this case study to investigate the state-of-the-art sustainability of mussel farming, LCA gives the opportunity to identify new environmental, technical and economical solutions where improvement actions might be focused.

2. Methods

2.1. General Background
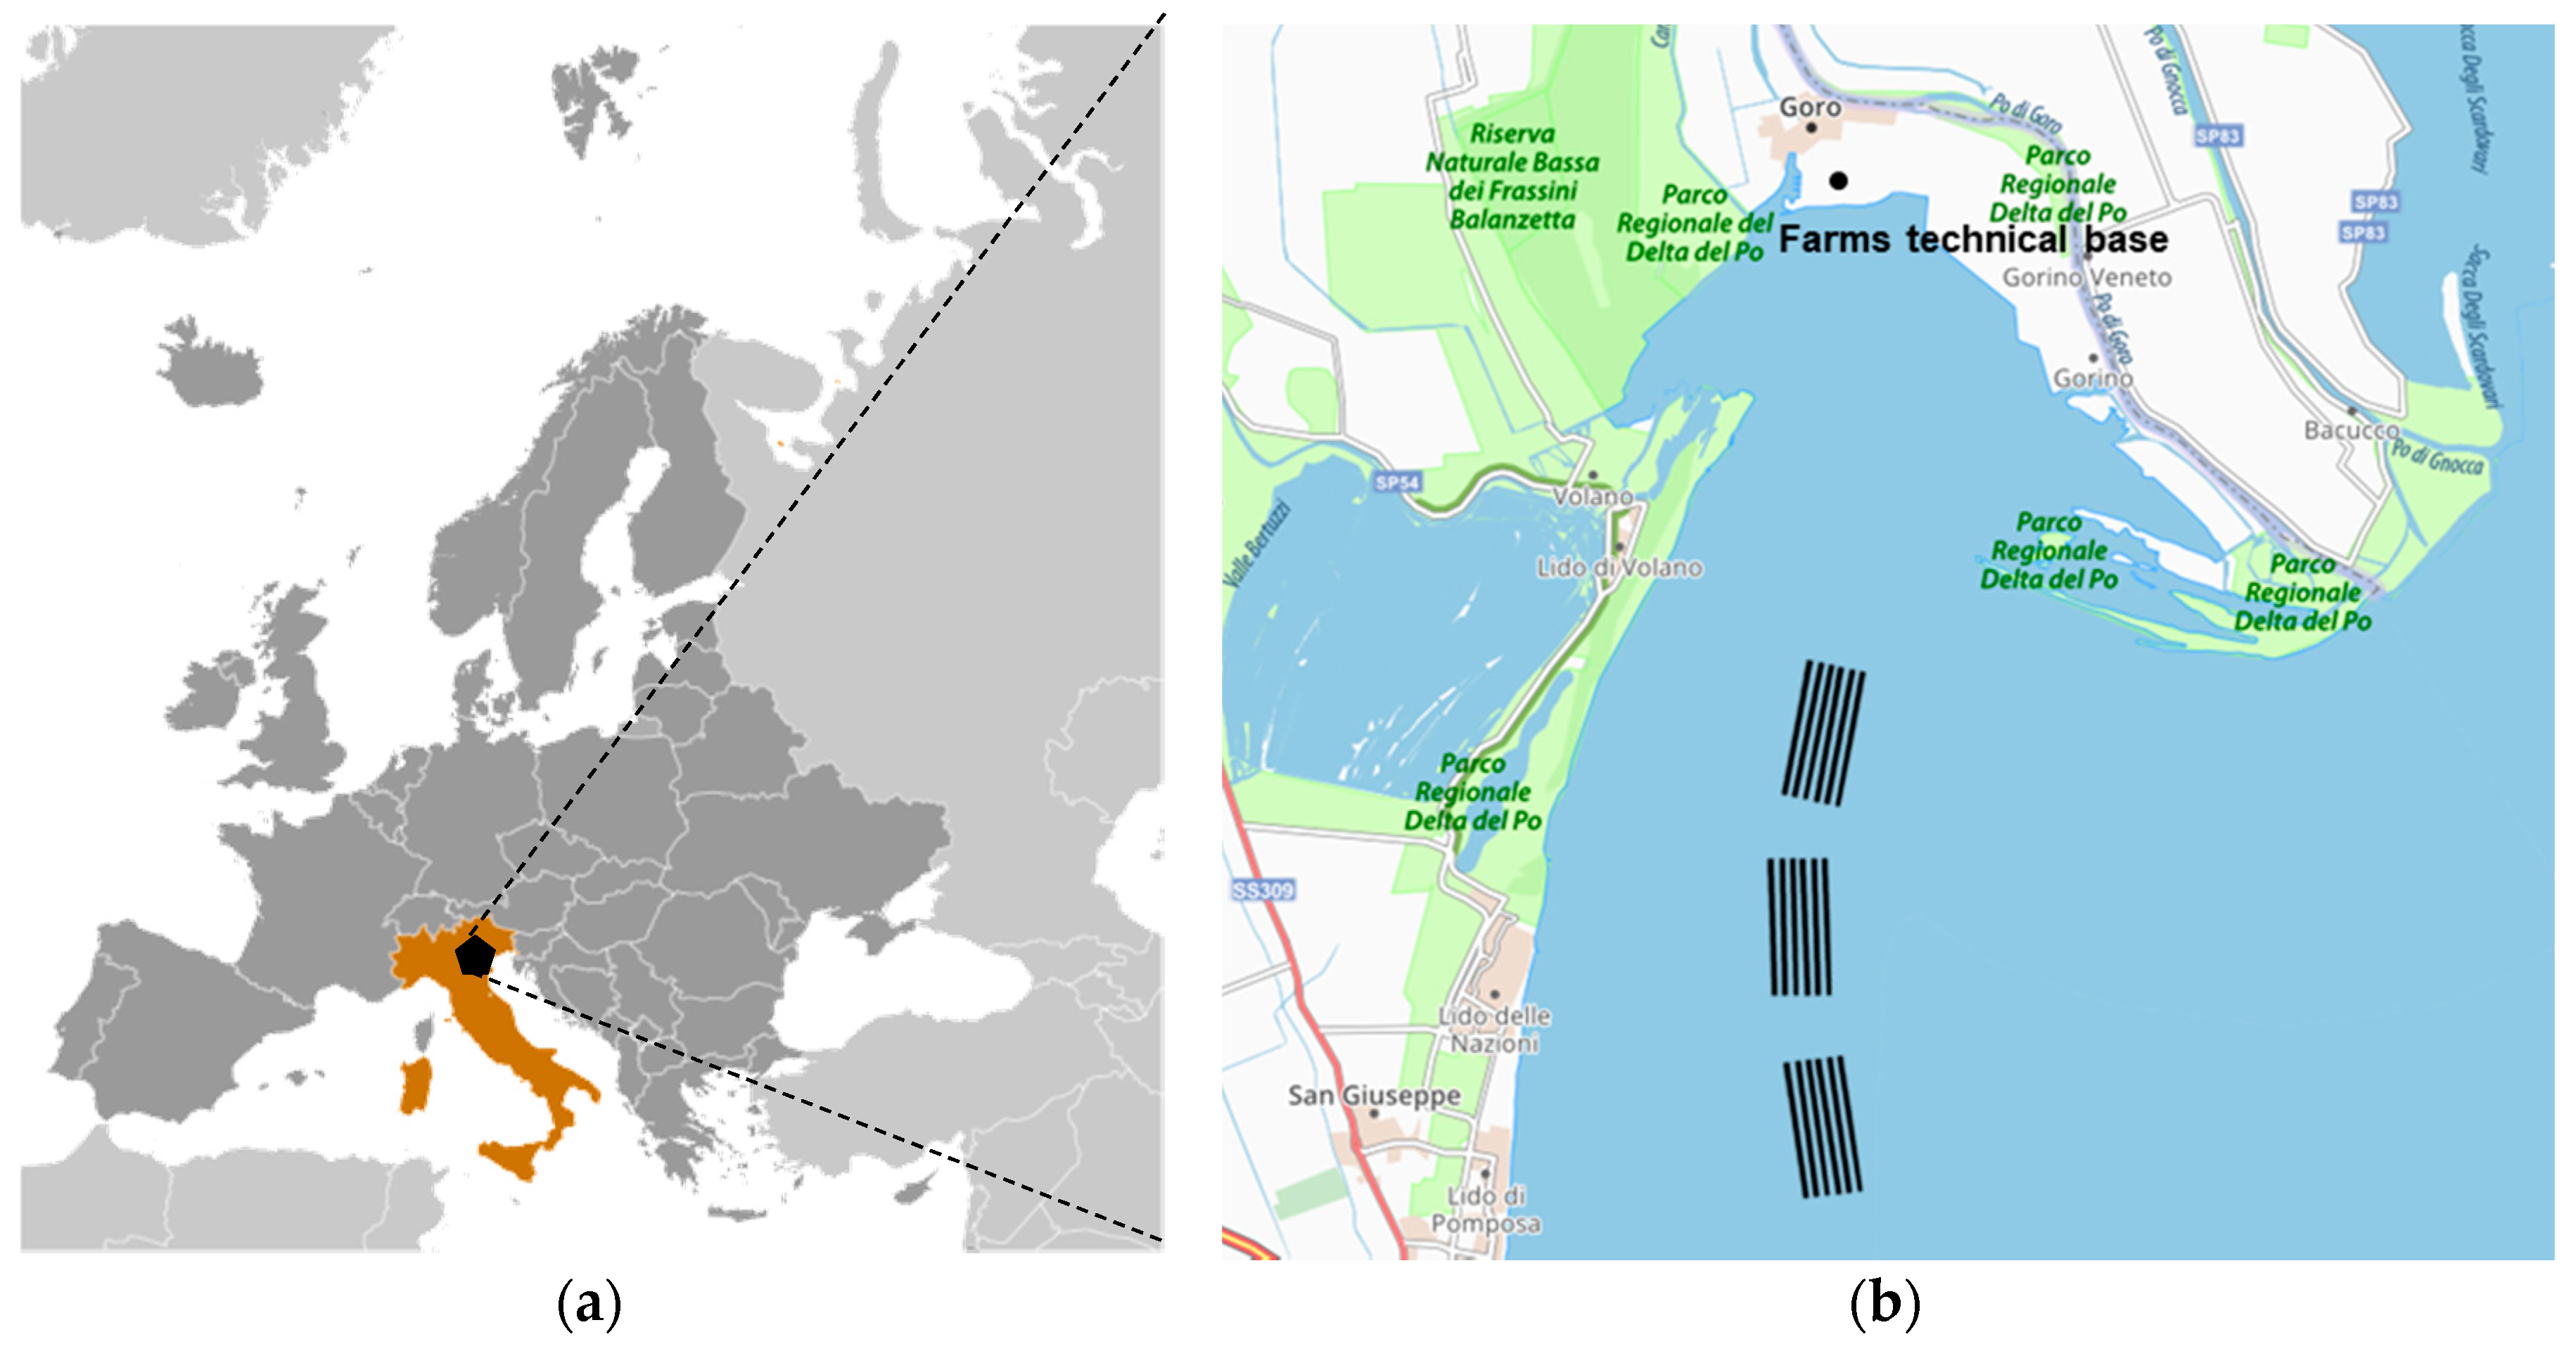
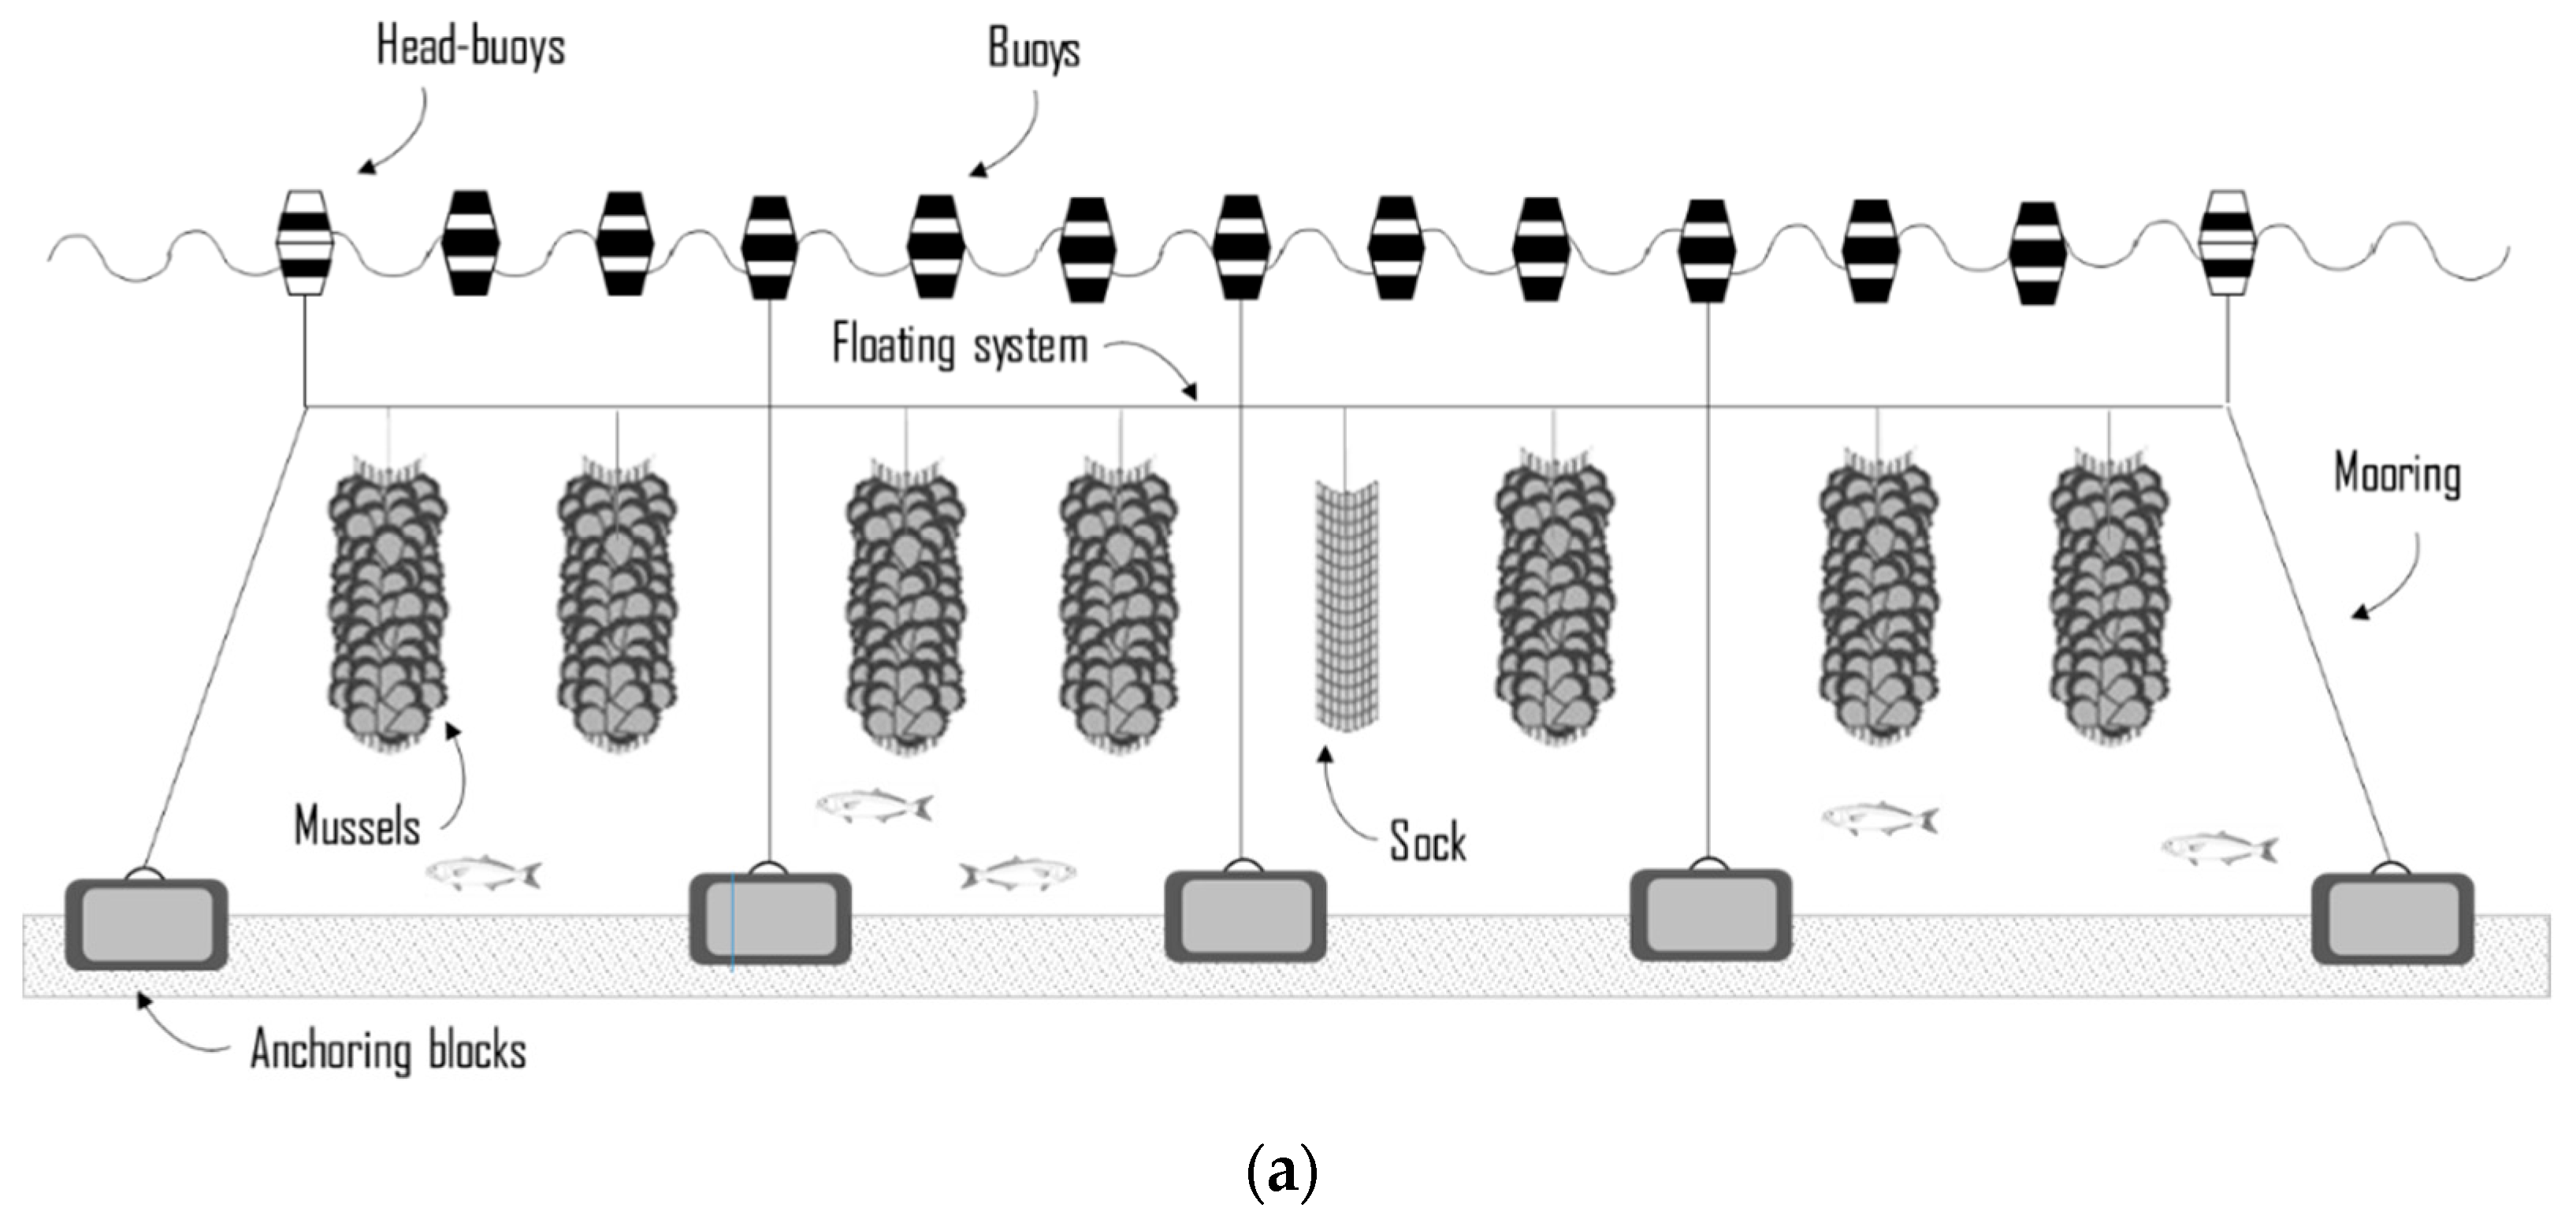
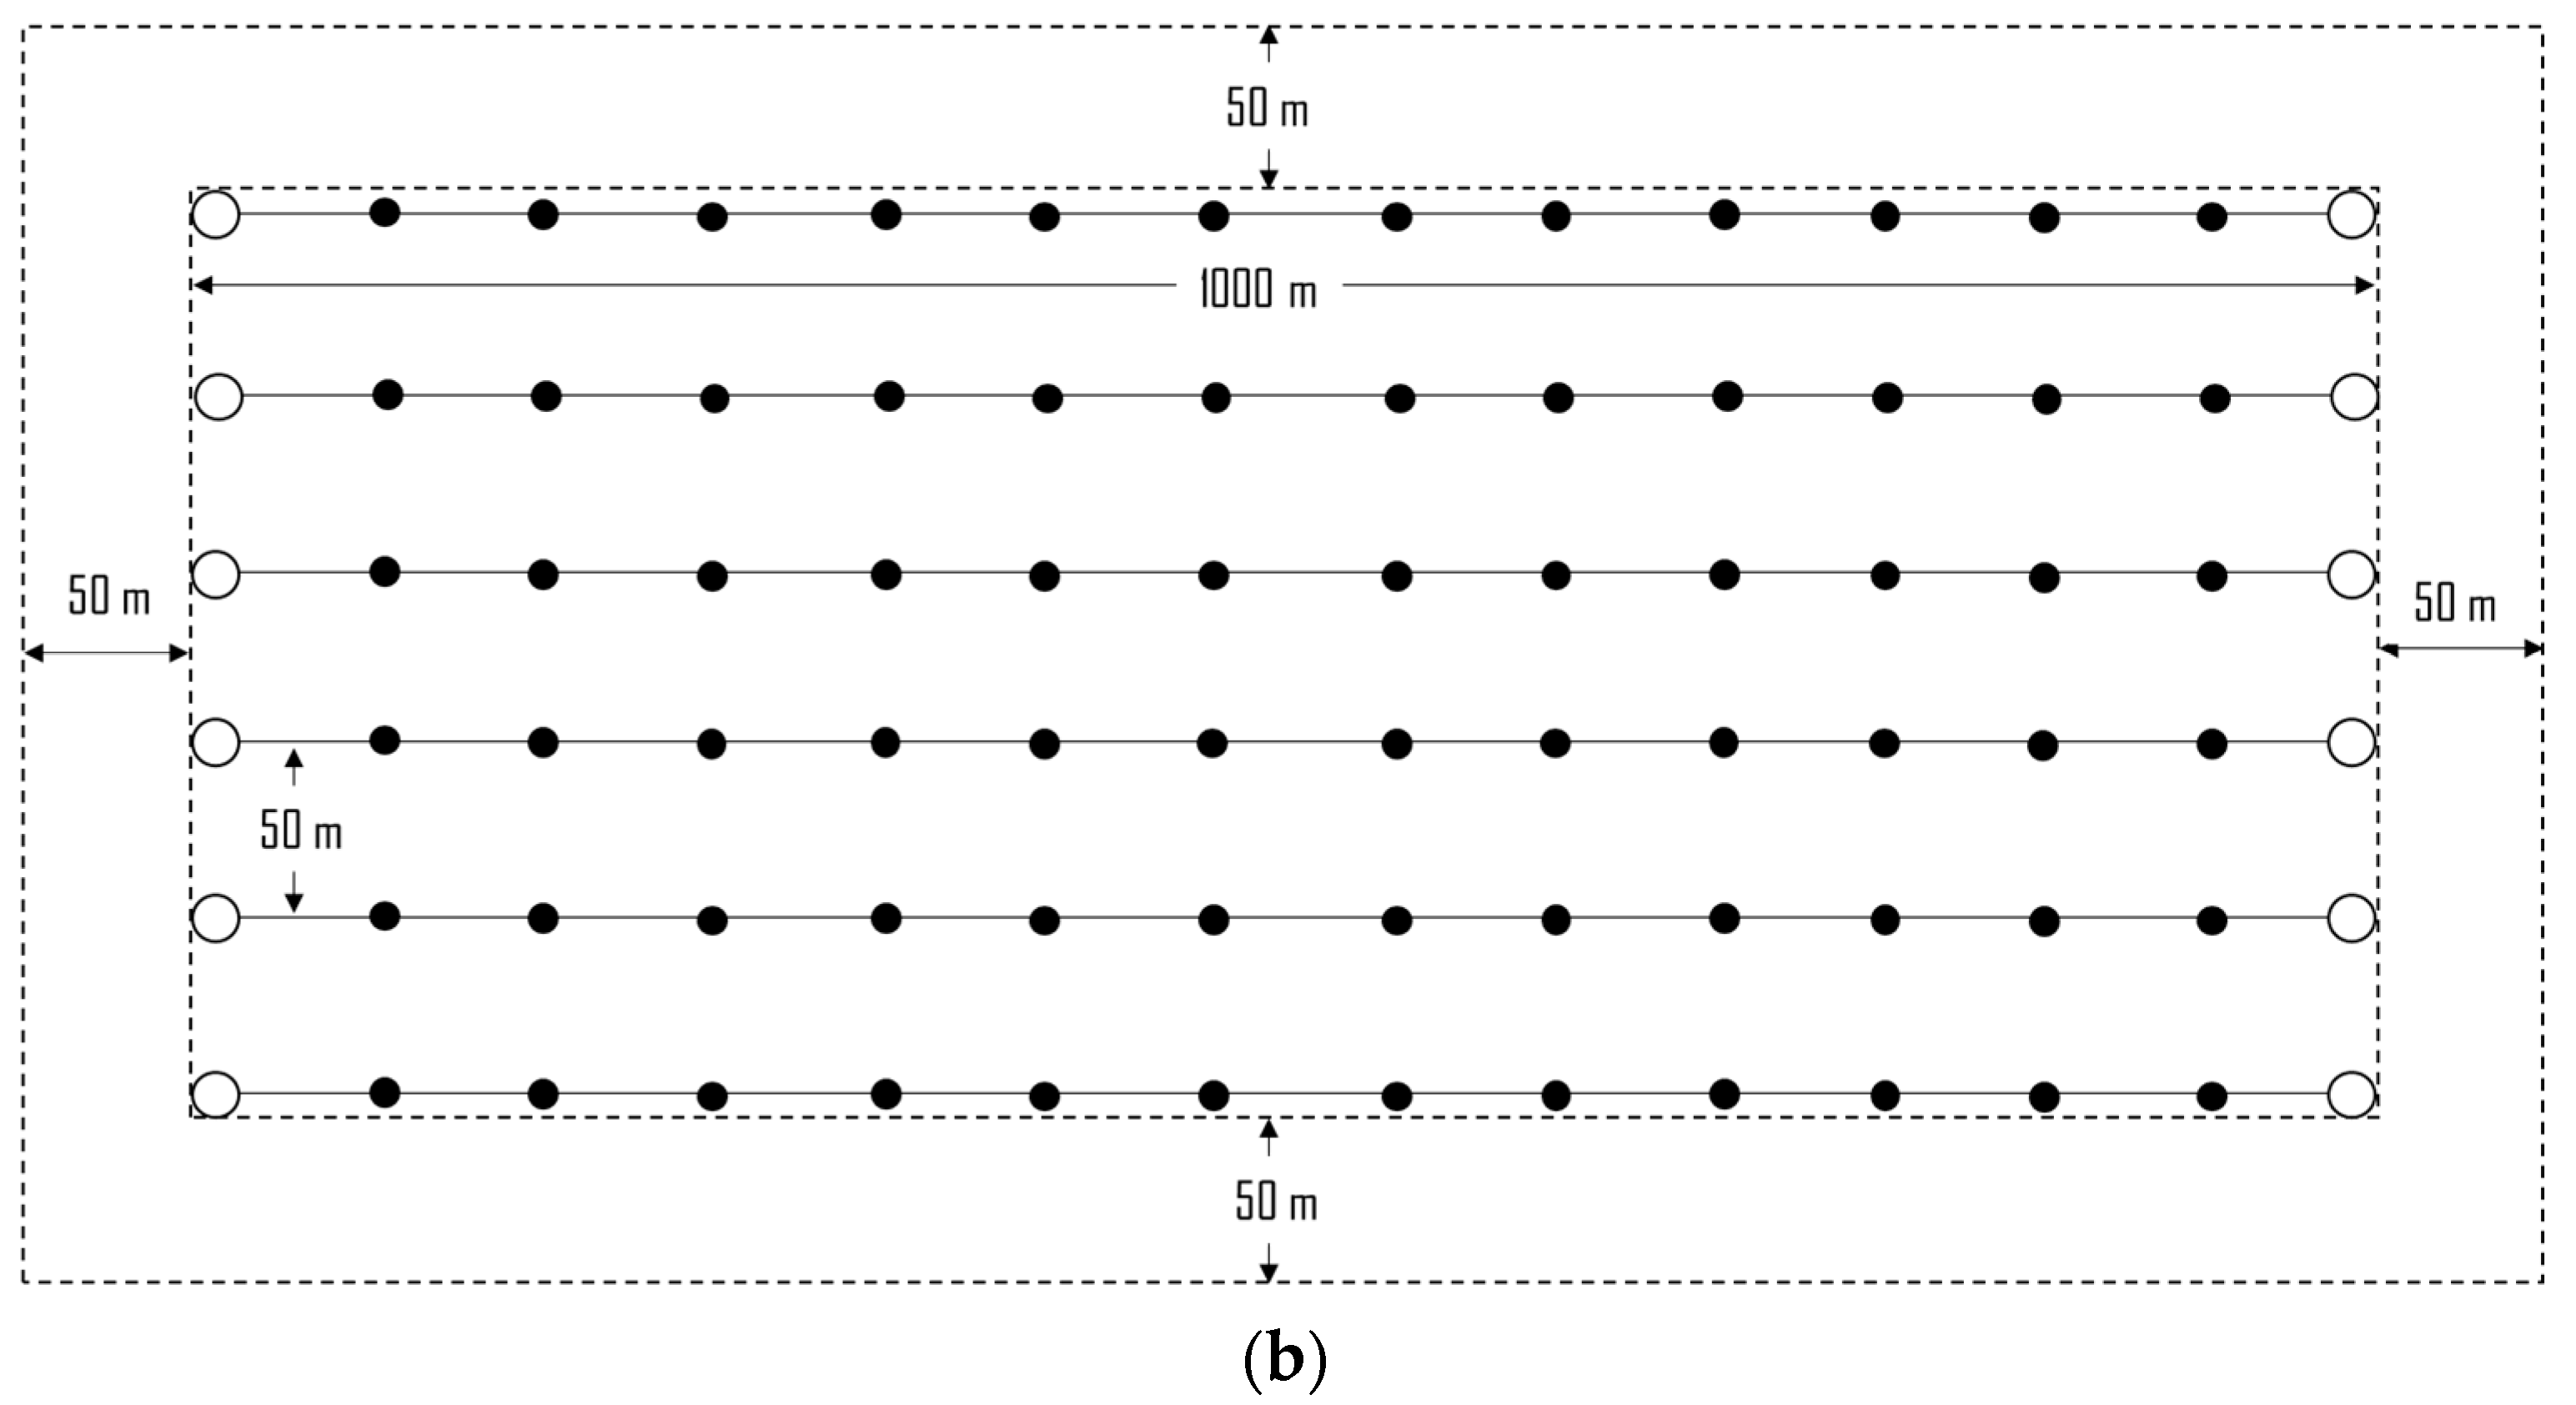
This study followed the standardized method for LCA, set up to evaluate the potential impacts associated with a product or a process by analysing and estimating the abiotic and biotic resources consumed and outputs emitted into the environment during all steps of its life cycle, from the raw material extraction up to the end-of-life [24]. Each compound emitted or consumed contributed to one or more impact categories based on its potential effect on the environment and information from the scientific literature. The LCA carried out in this study followed the main framework in the ILCD handbook [42], consisting of four phases: goal and scope definition, inventory, impact assessment and interpretation.

2.2. The Case Study

Mussel farms were located in the northern Adriatic Sea, along the coastline of the Emilia-Romagna region nearby the River Po Delta. The study area is located in the coastal area of the Sacca di Goro, within 3 miles from the coast (latitude = 44°47’02.6″N; longitude = 12°19’00.3″E) (Figure 1). Shellfish culture, mainly mussel, clam and, recently, oyster farming, is a well-established activity in this area that is one of the most important sites in Europe, involving about 1700 operators and 83 companies. The total annual production of mussels (Mytilus galloprovincialis) in Goro is about 10,000 tonnes, which covers about 50% of the regional production [43]. In comparison with other Adriatic coastal areas, nutrients delivered by the Po River act as a boost for primary production, making this area particularly suitable for shellfish farming to the market size reached in approximately 9–12 months.
Mussel farming is locally characterized by a complex system, where ancient traditions have survived for a long time together with modern and efficient farming techniques. The transformation process towards farming practices that has made it possible to overcome the artisanal character of this activity took place with the introduction, in the second half of the 1980s, of the suspended long-lines, the most diffused mussel farming system in Italy and all around the world [44].
In general, the rearing cycle starts in fall with the collection of wild seeds on the hard infrastructure of farms, such as cables and buoys, where early seeds can attach by means of their strong byssal threads [45]. In the grow-out phase of the rearing cycle, the seeds are removed, placed in tubular plastic mesh socks with a socking machine on the working boat attached to them to suspended long-lines and kept at a depth of about 2–3 m by buoys.
Long-line plants are made up of a series of vertically oriented ropes attached to parallel cables suspended by buoys located at the sea surface (Figure 2a). The system is maintained anchored to the seabed by concrete blocks (1200 kg anchoring blocks). Besides the anchoring system, the main components of this system are the ropes and the flotation buoys. Each line measures about 1000 m for a total of an average of 6 (the exact number of lines depends on the characteristics of a single plant) parallel units 50 m from each other. The overall sea occupation is about 385,000 m2 (Figure 2b).
As the mussels grow in the socks, the density and the weight become too high. To avoid the socks overcrowding that can lead to a slower growth and smaller mussel size, during the rearing cycle, 2–3 re-socking operations are needed. In this process the mussels are harvested and re-seeded in new double-mesh socks, made of an external plastic net and an inner cotton net. This operation permits to ensure that the mussels are being attached at the optimum density that gives the best growing condition, resulting in more evenly sized mussel and a higher yield. Based on data collected, an average total amount of 10,500 and 3000 high-density polyethylene (HDPE) and cotton socks, respectively, could be estimated for the entire growing cycle in a plant producing 250 tonnes/year.
In late May–June of the following year, mussels are harvested from the socks and submitted to the de-clumping (separating mussels from each other and cleaning the shell surfaces) and grading operations directly on the barge. The commercial size is 6–7 cm. The smaller mussels are usually re-seeded to avoid waste. According to Italian legislation to ensure food safety, mussels farmed along the Emilia-Romagna coast are farmed in the so-called “Zone A”, where the risk of pathogens’ contamination is null, and therefore can be directly sold and consumed, without any treatment of depuration. Once harvested, mussels can be sold directly in socks or, after a final de-clumping and grading on the boat, delivered to the farms’ technical bases for the final packaging in 1-kg low-density polyethylene (LDPE) bags for the sale of them. In the bags, a HDPE label is included and considered in the impact calculation.

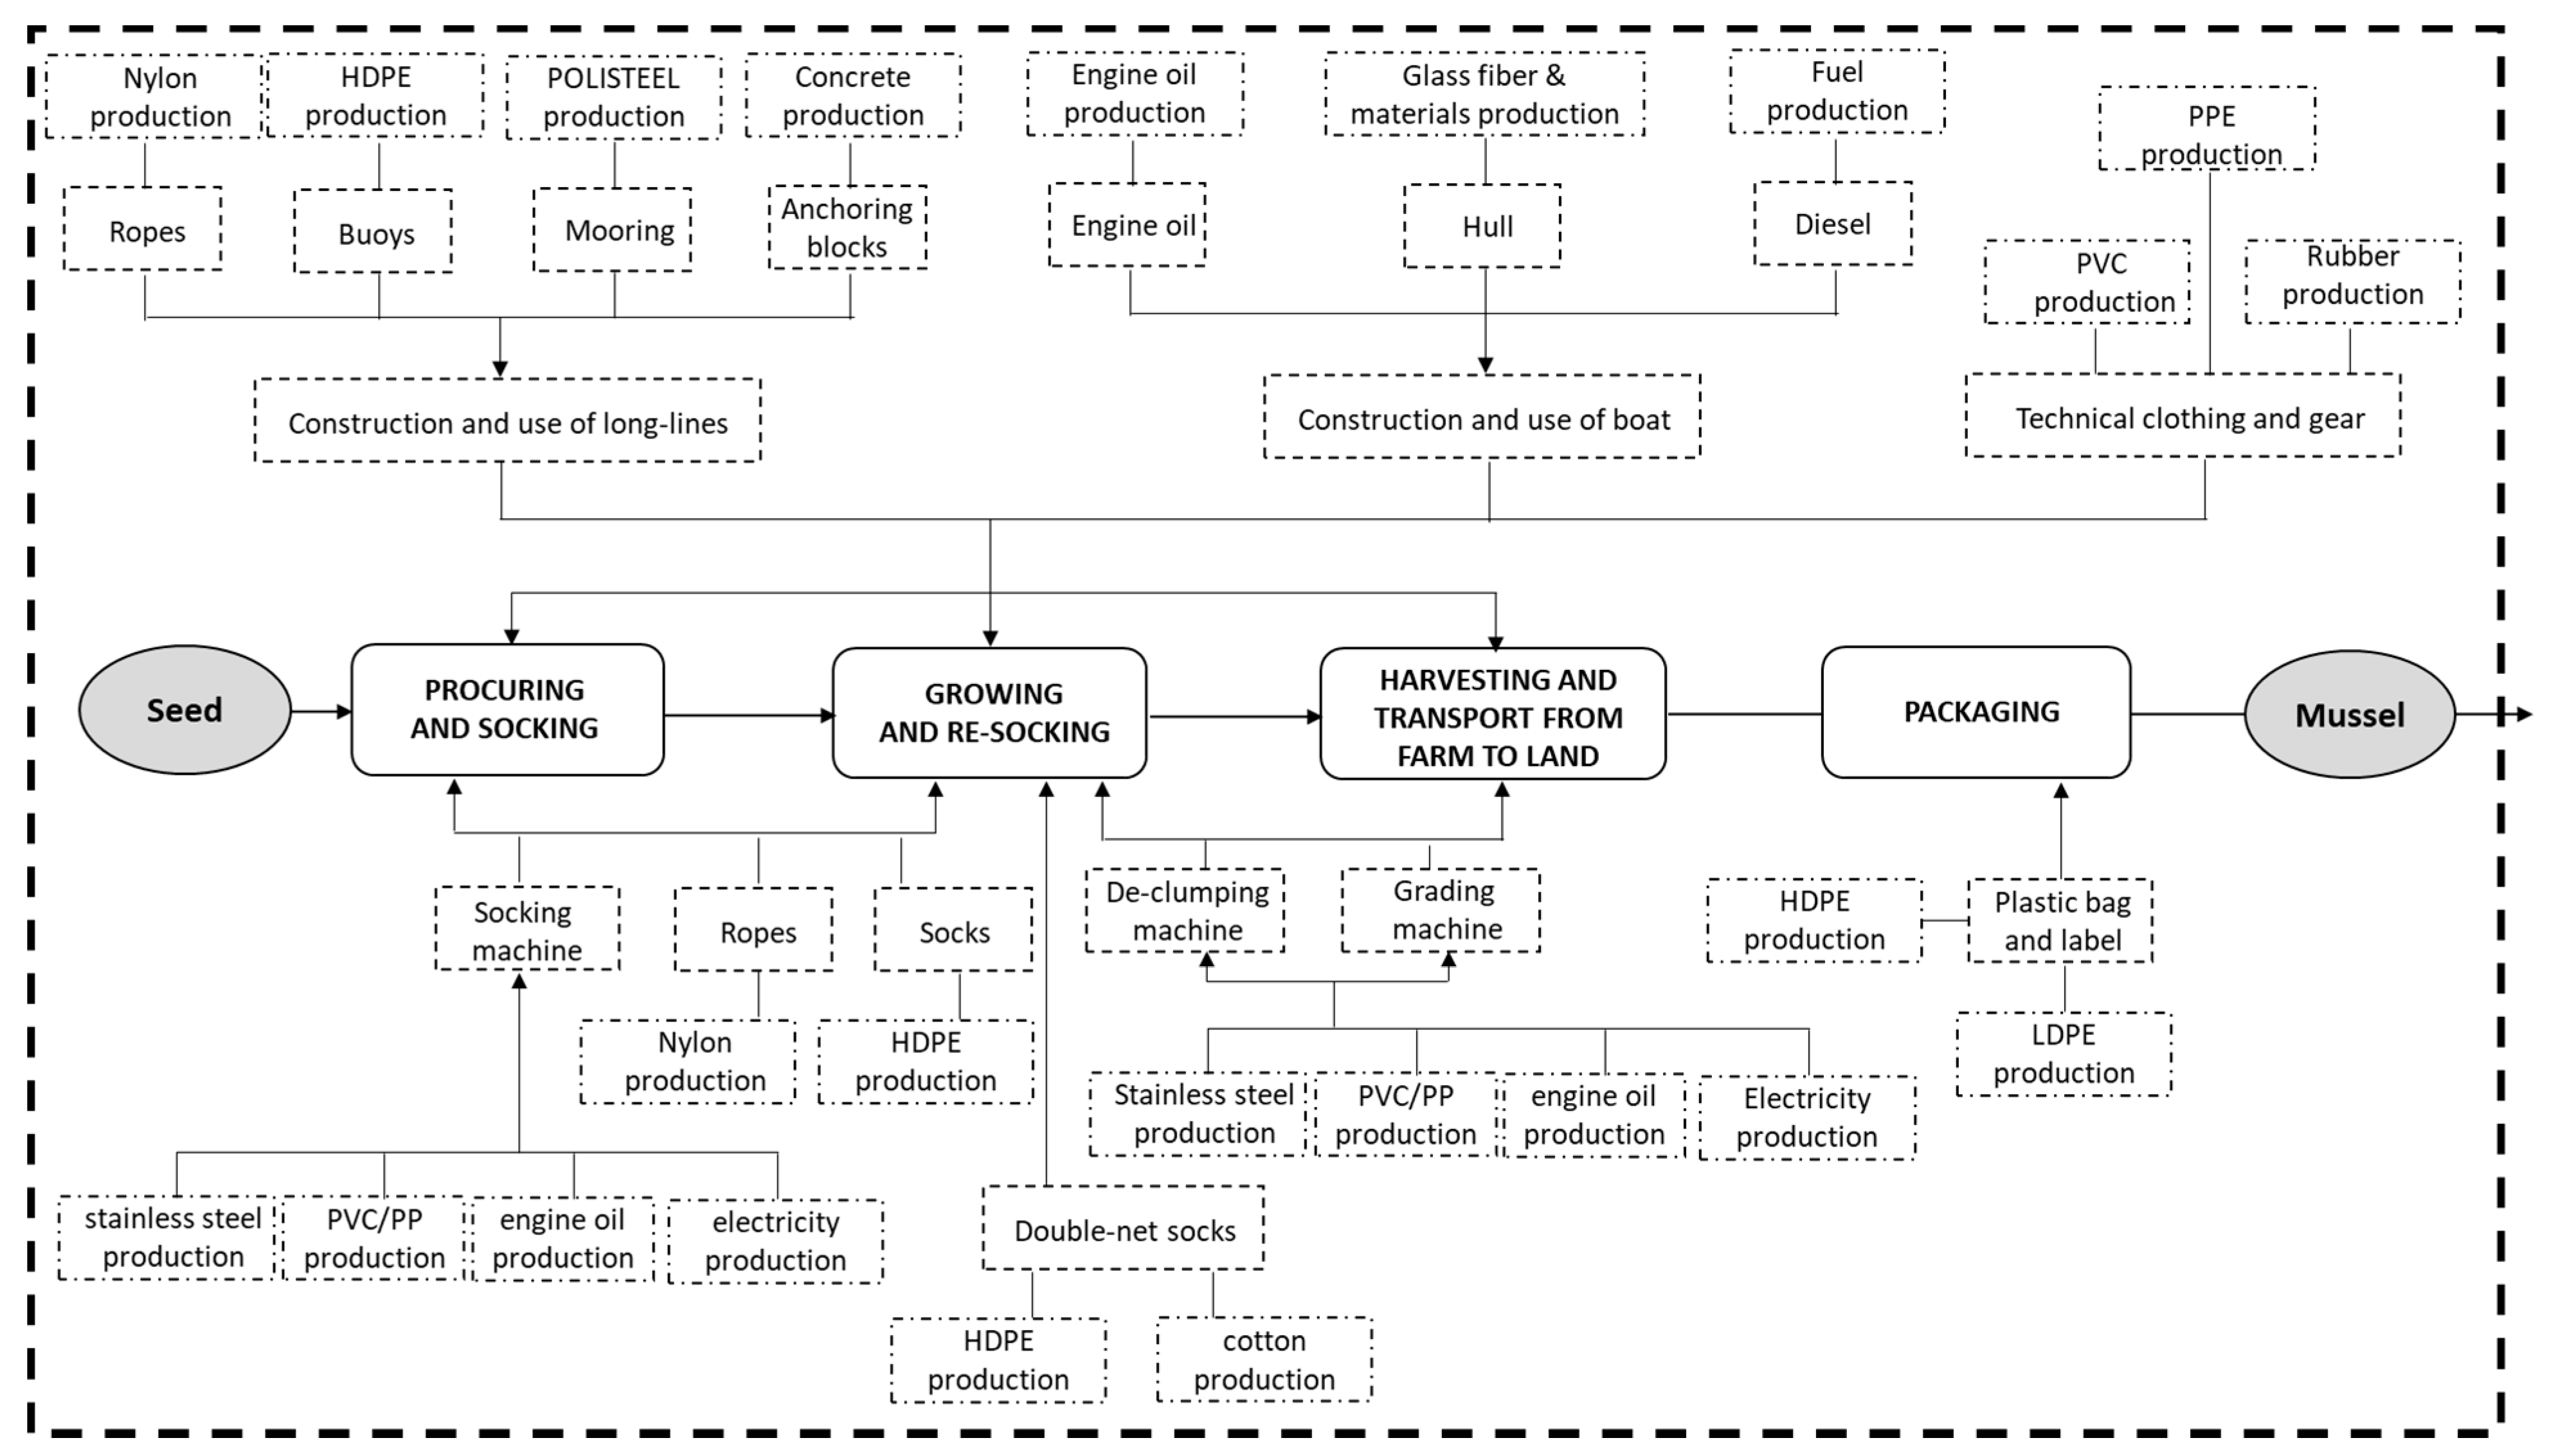
2.3. Goal, Scope Definition, Functional Unit and System Boundaries

LCA was here undertaken to evaluate the environmental impacts of mussels produced in Sacca di Goro, with the final aim to individuate and highlight the potential impact “hotspots”. A functional unit (FU) is defined by the ISO standards as a quantified performance of a product system and is used as a reference unit from which all environmental impacts are quantified. The FU chosen for the assessment of mussel farming was 1 kg fresh wet weight (including shell) of Mediterranean mussels (M. galloprovincialis), reared using suspended long-lines in seawater, at a distance of 3 miles from the coastal line.
A cradle-to-gate analysis has been carried out, considering the main processes of (1) the seed procuring and socking, (2) growing and re-socking, (3) harvesting and transport from farm to land and (4) depuration and packaging.
The system boundaries for the LCA of mussel cultivation included all the above-mentioned activities, all inputs of energy, water and electricity, and all outputs, as emissions to the sea and to the atmosphere, and waste. As shown in Figure 3, the consumption of inputs for the construction of the capital goods, such as long-lines, barges and machineries, were included. However, the treatment of the end-of-life materials from the capital goods’ waste treatment of non-recyclable plastic materials were excluded because of the lack of reliable information.
After the harvest, fresh mussels are disposed for the 1 kg packaging in the technical base building and sold. It is worthwhile to note that the building of farms’ technical base was left out from the system boundaries because they already existed and are shared with other mollusks aquaculture. Likewise, mussels with broken shells and the empty shells were not included in the analysis because they are simply thrown back to the sea.

2.4. Life Cycle Inventory

The primary data regarding the production were collected based on the long-term professional experience of some of the authors in this field and from individualized questionnaires and interviews that were answered by 30 local mussel farmers, in the fall–winter of 2019. Data collected for this study covered about 75% of the overall local mussel production, corresponding to about 7500 tonnes per year, in one of the most representative geographical area for mussel culture in Italy, with an average production of 250 tonnes per year for each farm.
On-site operations were performed using fiberglass boats, with a length of 15.7 m and width of 4.5 m on average, specifically designed for mussel farming, equipped with a socking machine, a de-clumping machine and a grading machine (Table 1).
Machines are made of stainless steel AISI 316, plastic fittings and powered by electric energy produced by the boat. The long-lines are made of POLISTEEL (a mixture of polyethylene and polypropylene) mooring and nylon ropes, whereas high-density polyethylene (HDPE) is the main component of buoys. Concrete and steel were used in the anchoring blocks. Plastic components in the socking, de-clumping and grading machines (tanks, tubs and fittings) are completely recyclable, whereas the HDPE buoys and socks are waste after use because of the accumulation of organic fouling. When possible, the end-of-life scenario of a complete recycling has been considered. The cotton of double-net socks is completely biodegraded in 4–6 weeks during farming. Technical clothing consists of PVC (Polyvinyl chloride) diving vests and gloves, rubber boots and PPE (Polyphenylene ether) waterproof suits (trousers and jacket). The life spans of materials are 15 years for the HPDE items; 8 years for the buoys, ropes, trays, and baskets; and 1 month to 2 years for the clothing and gear. The boat and long-line plant life were estimated at 35 and 50 years, respectively. Electricity consumption in the technical base is due to fresh water and seawater pumping for the mussels’ depuration. All the inventory data are listed in Table 2.
All background data such as the electricity, raw materials, infrastructure and transportation were extracted from the EcoinventTM v.3.6 database [46]. Mussel seeds are considered as an intermediate species without impact, since they spontaneously grow on long-lines ropes. The only impact which accounted for the seed was related to the seed procuring. For the Life Cycle Impact Assessment (LCIA), the midpoint-based CML-IA method baseline 2000 v.3.01 (PRé Consultants, Amersfoort, The Netherlands) method was used [47]. The Open-LCA® 1.8.0 software, an open source software package developed by GreenDelta (Berlin, Germany), was used for the overall LCA modeling. Emissions to air and to water were calculated by the software, based on the input data and are originated principally by diesel combustion, boat and equipment production, and plastic, concrete and stainless steel manufacture. The following impact categories were considered: acidification potential (AP), ozone layer depletion potential (ODP), depletion of abiotic resources potential (ADP), global warning potential (GWP100), eutrophication potential (EP), photochemical oxidant formation potential (POFP), marine water aquatic ecotoxicity potential (METP) and human toxicity potential (HTP). This set of categories is common in LCAs for seafood [48]. Allocation was not necessary because we considered mussels to be a unique process output.

2.5. Uncertainty Analysis and Sensitivity Analysis

In aquaculture, practices can widely differ among farms as a function of farmers’ traditions and experiences, so uncertainty is usually high and can jeopardize the reliability and robustness of LCA results. Taking into account these uncertainties permits to improve the accuracy of Life Cycle Inventory (LCI) and the LCA calculations.
The LCI data was evaluated according to the semi-quantitative “pedigree matrix” by which it was scored (1 to 5, where 5 is worse) based on the data quality characteristics of reliability (sampling methods and verification procedures), completeness (statistical representativeness of the datum and time periods for data collection), temporal, geographic and a further technological correlation (for data used outside its proper context). The matrix is a tool for “coding” the qualitative assessment descriptions, where rating scales and criteria are selected according to the need of the study. In Ecoinvent™, an uncertainty factor is assigned to each of the five data quality indicators, based on expert judgement [49]. These uncertainty factors are combined to compute the total uncertainty, expressed as a 95% confidence interval as the square of the geometric standard deviation. The pedigree matrix and the values suggested for determining the uncertainty scaling factors based on the data quality ratings are reported in Table 3 and used in this study for the Monte Carlo simulation.
The quality of a further technological correlation has been judged as score 2 because for related processes of concrete, plastic, boat and stainless steel productions, we have used data present in EcoinventTM from other enterprises.
We performed 1000 Monte Carlo simulations, the method most commonly applied in an LCA uncertainty analysis [50]. In a Monte Carlo analysis, the values of the inputs and outputs are dependently sampled from the unit process distributions for a fixed number of iterations and then aggregated into LCA results to produce a range of possible results. The uncertainty ranges calculated estimated the uncertainty in impacts generated by producing 1 kg of fresh mussels and could be useful when comparing the results with those of similar farms.

3. Results and Discussion

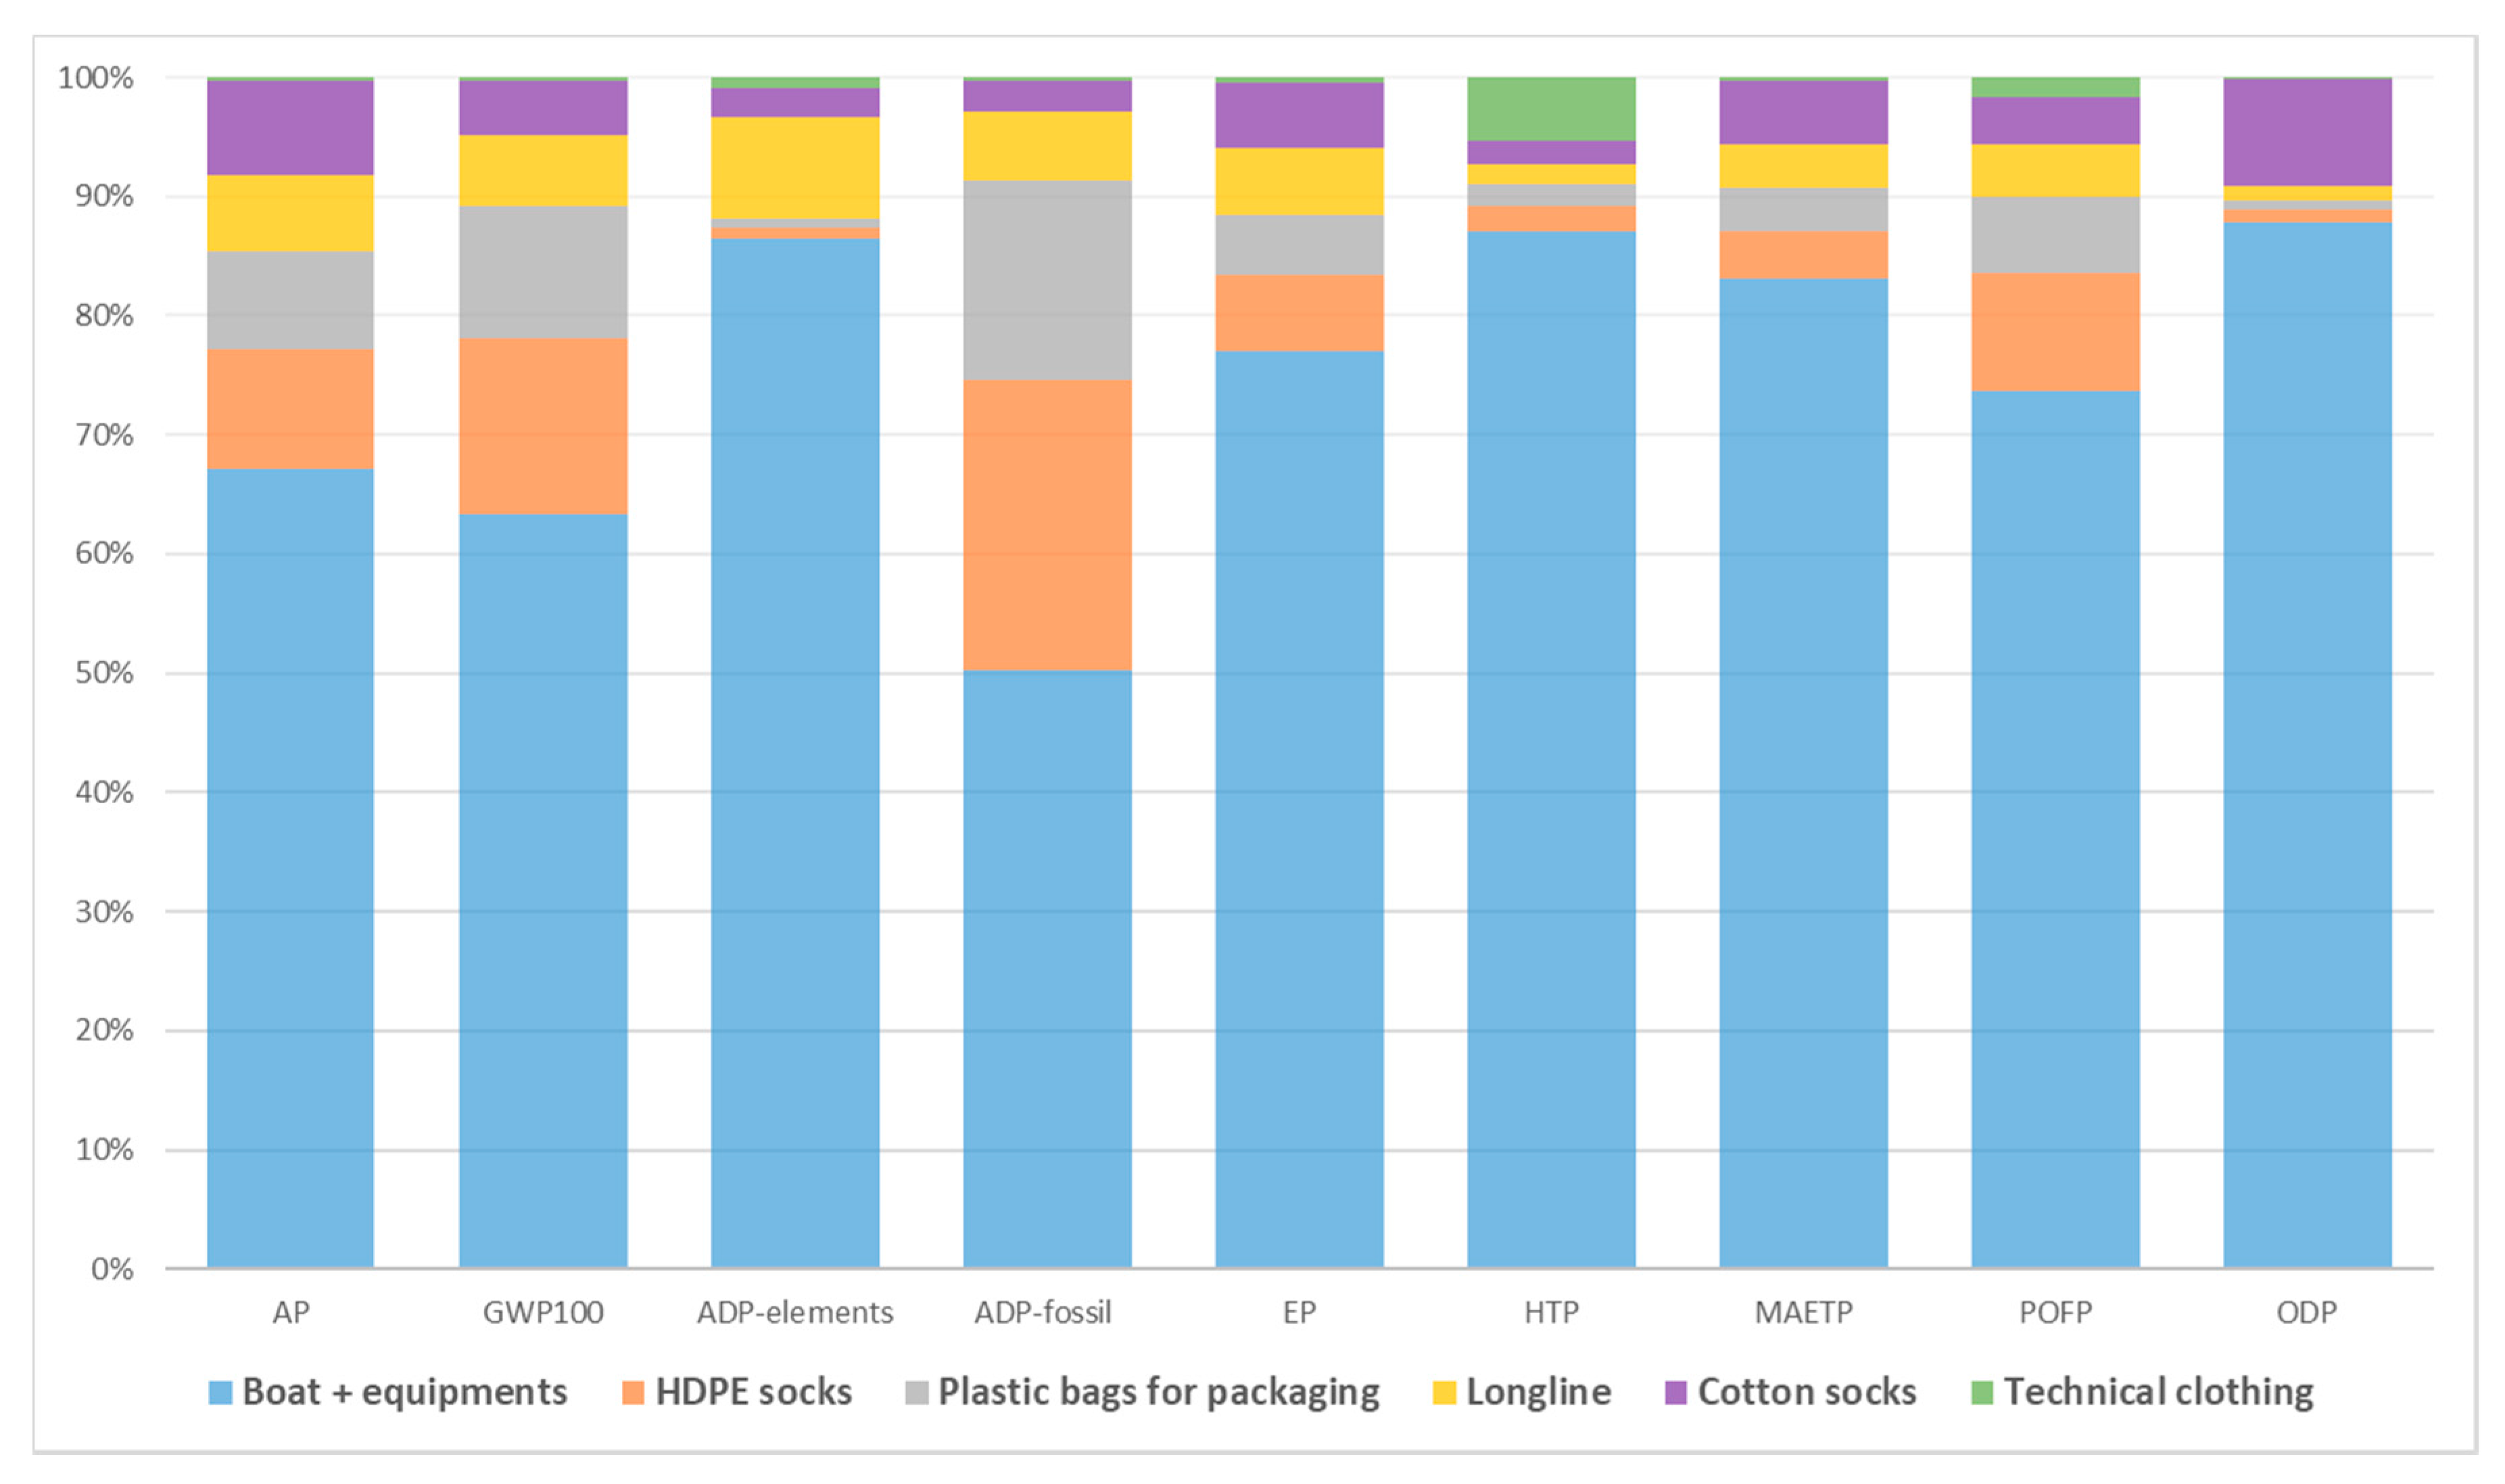
3.1. Environmental Performance of Mussel Farming

The results of the LCIA are presented in Table 4 and are referred to as 1 kg of packed fresh mussels with shells, ready to be sold.
The impact categories reported in Table 4 have been selected and calculated to obtain comprehensive information regarding the environmental burdens of mussel farming on human heath, ecosystem and abiotic resources depletion. Moreover, those effects can be grouped in local and regional (as photochemical oxidant formation potential (POFP), human toxicity potential (HTP), marine aquatic ecotoxicity potential (MAETP), acidification potential (AP) and eutrophication potential (EP)) and global (ozone layer depletion potential (ODP), climate change (GWP100) and depletion of abiotic resources (ADP)) impacts. Emissions to air of nitrous oxide and sulfur oxide (Table 4) due to diesel combustion principally contribute to the AC, whereas emissions of nitrate to the EP category. The Non-Methane Volatile Organic Compounds (NMVOC) are the main contributors to the POFP because they are oxidized to the ozone by sunlight in the troposphere. As it is well known, particulates create severe damage to human health and contribute to HTP, together with potentially dangerous emissions due to diesel combustion and plastic production. The climate change associated with mussel farming in the Po River Delta found in our study (0.137 kgCO2eq./kg of fresh mussel) is comparable to the value obtained in other similar studies. For example, taking into account the different FU used, that is 1 tonne of fresh mussel meat without the shells (corresponding to about 35% of the overall weight of fresh mussels), our value becomes 392 kgCO2/tonne of mussel meat, similar to those found by Iribarren et al. [38], Aubin et al. [39] and Lourguioui et al. [40] of 325, 472 and 404 kgCO2/tonne of mussel meat. Even the EP value in this study is lower than those calculated in other studies. The conversion of our value leads to an impact of 391 kgCO2eq./tonne of mussel meat. When studying mussel farming, EP becomes a controversial impact category because mussels (filter feeders) may be seen as a buffer against eutrophication processes since they exert a control on the phytoplankton biomass and sequester nutrients [51]. In this study, impacts are referred uniquely to mussel farming, excluding the contribution of the growing mussels to the N and C overall balance and the potential bioaccumulation of heavy metals or marine biotoxins in mussels’ flesh. Including the chemical composition of mussels’ flesh and shells and calculating the mussels’ contribution to the overall elemental balance could more accurately describe the influence of mussel farming to the marine environment and how it influences the environmental impact.
The main contributor to the environmental impacts values for all categories are the capital goods such as boats and long-lines (Figure 4). In particular, boats burden on mussel farming for their construction more than for their operations (diesel and engine oil consumptions) and maintenance, whereas non-recyclable nylon ropes contribute to the impact of long-lines in all categories. Diesel and engine oil use included diesel production as well as its combustion in boat operations. The high impact of boats and equipment (machines for mussel processing on board) is principally due to the steel and glass fiber production, followed by the copper, aluminum and iron production, at the plant.
Non-recyclable HDPE socks have a great impact on overall mussel farming because they have to be considered as disposable materials due to the organic fouling due to mussels growing residues and being managed as special waste. Otherwise, cotton socks biodegrade in a few weeks after re-socking, but they have a significant environmental contribution due to the cotton cultivation, featured by high water consumption and the use of great quantities of fertilizers and pesticides [52]. It is possible that this impact could be lower depending on where and how it is produced. Emission data taken from EcoinventTM are based on global mean values for the production (textile, woven cotton, at plant-GLO) and can vary a lot among different factories and producers.
Plastic bags for packaging have a relevant impact in all categories because even if they can be theoretically recycled by the final consumer after use, their end-of-life management is out of the system boundaries of the present study, so here they have been considered simply as waste.
The technical clothing has an almost negligible impact in all categories, except for the HTP and POFP categories, due to the PPE manufacture for waterproof trousers and jackets.
It is worthwhile noting that in this assessment, the ADP category is split into two different contributions, one related to the depletion of elements reserves and one to the depletion of fossil fuel reserves. On the other hand, boats and equipment, which are the main contributors, HDPE socks and LDPE bags have the greatest impact on the ADP fossils due to the polyethylene production, whereas ADP elements burden the long-line materials (principally, concrete for the anchoring blocks and nylon for the ropes) used for their construction.
At the LCIA level, a Monte Carlo simulation was carried out to evaluate the uncertainties in the analysis due to the statistical, temporal, geographical or technological fluctuation in the Life Cycle Inventory (LCI) data. Based on the uncertainty of the LCI data expressed as a probability distribution, the Monte Carlo method was run in the OpenLCATM software with 1000 iterations at a significance level of 95%, to develop a statistical dispersion of the calculated impact categories. Table 5 shows the results of the Monte Carlo simulation. The 95% confidence interval given in Table 5 shows that the LCIA results for the life cycle would enter within the interval. The coefficient of variation (CV) is the normalized indicator of data dispersion around the average values and suggests that a significant level of uncertainty is found for the HTP and MAETP, probably due to the large uncertainties related to the major toxic drivers, i.e., heavy metal or steel production emissions.

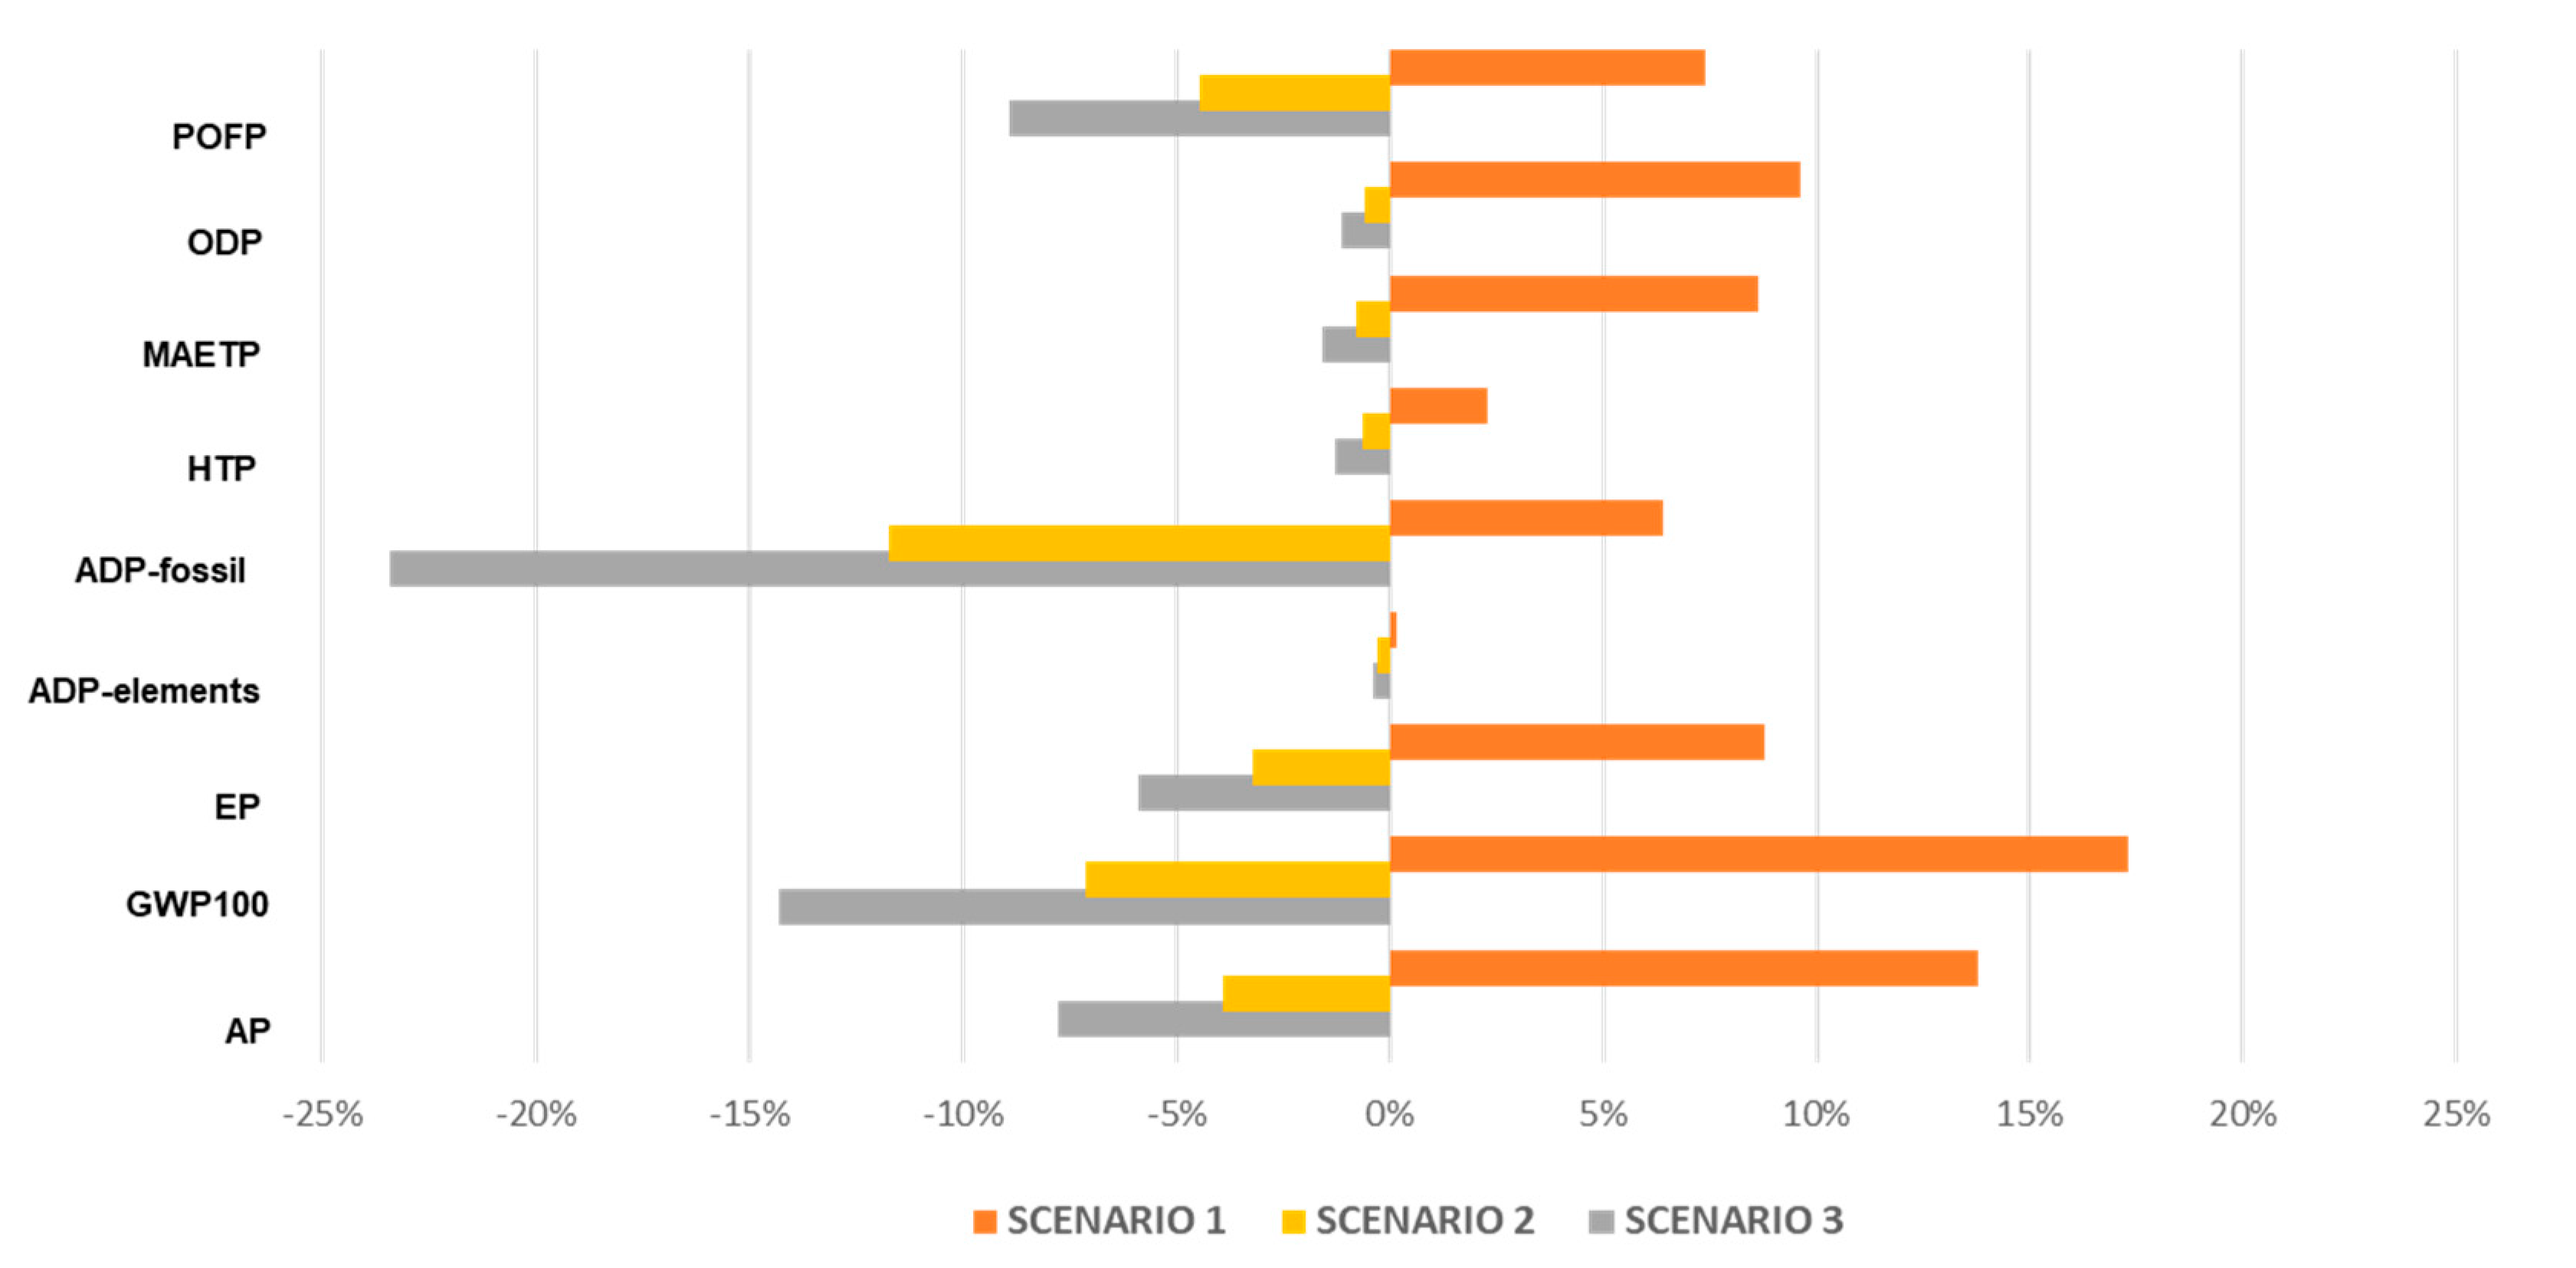
3.2. Sensitivity Analysis

From seed procuring to fresh mussel packaging, all production stages contribute at a different level to the environmental impact of mussel farming. In some cases, such as for long-lines or for working boats and equipment, it is very difficult to hypothesize potential improvements in order to reduce the impacts because both have been developed to optimize operations’ efficiency and are made of materials robust enough to resist marine corrosion and bad weather events. Moreover, as above-mentioned, the impact of cotton socks was principally derived from the cotton production at global level, making it difficult to put in practice effective actions by producers at the local level.
The environmental characterization has led to the conclusion that the principal “hotspots” where improvement actions should be undertaken are the boat fuel supply and HDPE socks. Figure 5 shows the results of a sensitivity analysis where the amounts of these factors have been lowered. In the first scenario, a boat’s diesel engine has been replaced with a 180 hp electric engine designed for a working boat, that consumes 0.2 kwh/km and is recharged in a charging station [53]. The current Italian electric energy mix, at the grid, contains about 38% of renewable energy [54]. In the second scenario, HDPE has been replaced with 50% of hemp textile yarn as the material for the socks. In the third scenario, the HDPE has been completely replaced with hemp for the socks. Despite hemp fibers’ biodegradability, they are actually 5 times stiffer and 2.5 times stronger than traditional plastics [55].
Moreover, textile hemp was usually cultivated on wide areas in the north of Italy, principally for the textile industry and for ropes’ manufactures, and its use could contribute to the relaunch of an old supply chain, with potential economic advantages also for surrounding farmers [56].
It is interesting that the use of an electric engine determined a general increase in the environmental impacts, except for the ADP elements category. The increase was in the range 7–17%, depending on the impact category, and is due to the actual electric energy production and not to the use of an electric engine. In particular, GWP100 is the category more affected by the use of an electricity engine. Better results could be obtained with 100% renewable electricity, such as photovoltaic or wind energy, but these scenarios have not been considered in the present study, due to the lack of regional data.
Otherwise, a 100% replacement of HDPE with textile hemp as sock materials can strongly contribute to reduce the environmental impact, with reductions of about 14% in GWP100, 8% in AP, 9% in EP and 24% in ADP fossil impact savings, respectively.
Currently, adverse effects of HDPE in aquaculture are not limited to plastic production and use, but are also derived from plastic and microplastic losses such as debris in marine environments [57]. Even though plastic socks are usually recovered from the environment together with mussels and disposed in the correct waste stream, during mussel growing, they can be exposed to direct UV light, waves, scraping and temperature fluctuations, all of which are factors that contribute to embrittlement and fragmentation. As it is well known, alarming level of contamination due to microplastics in aquatic environments has been reported in several aquatic matrices (beaches, sediments, surface waters and water column) [58]. There are no global estimates of the amount of plastic waste generated by the fisheries and aquaculture sectors, but HDPE, LDPE and PP are the three most frequently identified materials in marine environments [59]. The only attempt of estimation at the European level is reported in the 2019 “Action plan for marine litter” of OSPAR (Oslo/Paris convention for the Protection of the Marine Environment of the North-East Atlantic), where plastic nets lost in fisheries and aquaculture have been estimated in 1053 km of the overall length of nets lost per year [60]. Assuming that all sectors produce the same amount of nets lost and considering the ratio between mussel and overall fisheries and aquaculture production in Europe [61], a value of 0.1 meters per kg of mussel could be roughly estimated. To the best of the authors’ knowledge, no LCA study on mussel farming included plastic losses from socks, bags and/or ropes, being difficult to obtain inventory data on how much plastic is abandoned or degraded during the yearly production cycle. The error of neglecting the potential environmental impact of plastic debris from mussel farming could have a dramatic effect on the overall LCA results, taking into account that the proportion of the overall bivalve molluscs farming plastic litter (bags and ropes) found in the Adriatic and Ionic Sea (Mediterranean area) was in the range of 4%–11% of the total amount of collected plastic litter [62]. Anyway, since plastic litter and microplastics in the marine environment greatly impact the entire ecosystem and threaten the oceans, seas and coastal areas, the effort should be focused in the near future to monitor and measure even those small contributions.
The great advantage of HDPE socks, which makes it harder to put in practice the third scenario hypothesis in the short–medium period, is its low cost in comparison with natural fibers. For example, as raw materials, HDPE granulate has a cost of 0.7–1.1€/kg, cotton yarn of 0.75–2.20€/kg and hemp yarn of 1.8–2.5 €/kg. For this reason, in the sensitivity analysis, the possible scenario of only 50% of socks substitution has been attempted. In this case, the average environmental benefit has reduced by half, as expected.

3.3. Identification of Further Improvement Potential

The main limitation of mussel farming developments in the Po River Delta in order to augment the portion of internal consumption is the temporal limitation of harvesting, from early summer to the end of August. This is due to biological and practical reasons, such as the species’ life cycle and the timing of maturation, and the coinciding with the touristic season. This implies that to satisfy the internal demand in the other eight months of the year, fresh or frozen mussels have to be imported from other countries, especially Spain (Galicia) for fresh mussels (about 31,600 tonnes per year) and Chile for frozen or canned products (about 22,711 tonnes per year) [22].
According to Italian legislation, imported shellfish should be treated in a depuration center, in order to remove potential microbial contamination and ensure food safety. The enclosure may be also used for the decontamination of local mussels from more coastal areas or lagoons, classified as Zone B, where the higher risk of microbial contamination is eliminated with the purification treatment before the sale for human consumption [63].
The environmental impact that burdens on mussels consumed on Italian tables from September to May, every year, derives not only from mussels’ production in the exporting regions but also from the transportation from there to Italian dispatch centers and from depuration. Food miles alone are only a partial indicator of the overall climate impact of the mussel import/export global system. In fact, other important factors should have to be considered, that is the transport mode, the size of the vessel or vehicle, speed, load capacity (and proportion of it that is used), transportation time and, especially, the need for refrigeration, which is the major energy user in the seafood supply chain and the refrigerants used in the freezing process. An analysis of the contribution of these factors on the environmental impact of mussel global trade would deserve a further specific investigation. Even taking into consideration the sole transportation from the principal exporting country to Italy, the amount of CO2 eq. that has to be added to the production is significant under all the scenarios (Table 6). According to the average CO2 eq. emissions for the transport modes [64], extra CO2 eq. emissions have been estimated for a kilogram of mussel products shipped from Spain and Chile.
As expected, air freight shipping is completely unsustainable, but even the other transport modes generate a relevant amount of extra emissions that arrives at a value similar to the impact of the overall local mussels’ production. Shipping in containers on a freight ship is the most efficient transport mode for long distances, and rail/road intermodal freights for the short–medium distances.
We have already mentioned that mussel and in general bivalve shellfish aquaculture can be highly attractive for human nutrition in the future because of their high protein content and essential omega-3 fatty acids, together with an overall lower environmental impact than all other forms of fish and meat production and many arable crops [3]. Nevertheless, almost all environmental benefits risk being cancelled by the global trade. Fortunately, worldwide, less than 5% of bivalves’ production is traded, especially at long distances, and for millions of people they represent an inexpensive domestically provided food. However, in developed countries, the perspective is different and a year-round demand undoubtedly favors the development of international trade and its environmental consequences [65].
In order to encourage the local production, some strategies could be proposed. In particular, in the studied case of the Emilia-Romagna region and the Po River Delta, the most practical sustainable opportunity is given by the recovery of the traditional mussel farming technique which has been the most practiced technique in the 1970s and 1980s before the advent of the use of the offshore long-line. This technique is based on the use of canopy structures, supported by poles inserted in the sediment, usually positioned in the most sheltered and productive portions of the Po Delta lagoons. In this way, both the advance of a couple of months in the spring heat and the delay, roughly of the same order, of the autumn cooling period can be exploited. The lengthening of the useful time for mussels’ growth thus allows to have the mature product available throughout a much longer period of time than that provided by the current long-line. However, the exacerbation of eutrophication and of the related anoxic crises inside these very productive lagoons, as well as the increase in the summer temperatures to values intolerable by the mussels, led to the gradual abandonment of the technique.
In light of the considerations above and of the increased common sensitivity for the environmental sustainability of the productions, a winning strategy is thus represented by the recovery of this technique, and by its integration with the long-line cycle, in order to extend as much as feasibly possible the availability of mussels at the commercial size. This would likely correspond to a number of months per year but deserves a dedicated experimental investigation in order to be defined.
The most realistic strategy to achieve this goal lies in the integration between the two techniques, i.e. the transfer of the mussels from the sea to the lagoon at the most favourable moments in the lagoon and, vice versa, from the lagoon to the sea, when temperatures in the lagoon are not sustainable, in July and August. This would allow to exploit the higher growth rates, typical of the lagoon, in spring and autumn and therefore have a mature and saleable product, in the period in which it is not possible to obtain it on the long-line at sea. On the contrary, the displacement of mussels from the lagoon to the sea during the summer guarantees for survival in face of increasingly critical events due to climate change. The timing of these phases and the most appropriate modalities to transfer the mussels must be the subject of a dedicated experimental investigation, in order to be properly defined.

4. Conclusions

This is the first attempt to apply LCA for the assessment of the environmental impacts of mussel aquaculture in Italy. In order to identify the main “hotspots” of mussel farming, different impact categories have been studied and a sensitivity analysis has been performed to evaluate the possible improvements, reducing the use of HDPE socks and promoting natural and biodegradable materials such as hemp. This study has demonstrated once again the great potentiality of LCAs as a tool for aquaculture management. At a regional scale, it can help in understanding the priorities towards a more sustainable production system and to identify and remove the process inefficiencies, while from a general perspective, it can be used to find the most appropriate productive strategies for sustainable food supply and global food security. The results of the present study support chain transparency and accountability in the aquaculture industry of mussels, for the safeguarding of customers and consumers.

Author Contributions

Conceptualization, G.C. and E.T. (Edoardo Turolla); data and inventory, E.T. (Edoardo Turolla); methodology and formal analysis, E.T. (Elena Tamburini); writing—original draft preparation, E.T. (Elena Tamburini); writing—review and editing, all authors.; supervision, E.A.F. All authors have read and agreed to the published version of the manuscript.

Funding

This research received no external funding.

Conflicts of Interest

The authors declare no conflict of interest.

References

  1. Anderson, J.L.; Asche, F.; Garlock, T.; Chu, J. Aquaculture: Its Role in the Future of Food. In Frontiers of Economics and Globalization; Emerald Publishing Limited: Bingley, UK, 2017; Volume 17, pp. 159–173. [Google Scholar]
  2. FAO. The State of World Fisheries and Aquaculture 2018 - Meeting the sustainable development goals. Rome. Licence: CC BY-NC-SA 3.0 IGO. 2018. Available online: http://www.fao.org/3/i9540en/i9540en.pdf (accessed on 13 March 2020).
  3. Willer, D.; Aldridge, D.C. Microencapsulated diets to improve bivalve shellfish aquaculture for global food security. Glob. Food Secur. 2019, 23, 64–73. [Google Scholar] [CrossRef]
  4. Jacquet, J.; Sebo, J.; Elder, M. Seafood in the future: bivalves are better. Solutions 2017, 8, 27. Available online: https://jenniferjacquet.files.wordpress.com/2018/06/jacquetseboelder_2017_solutions.pdf (accessed on 14 April 2020).
  5. Folke, C.; Kautsky, N. Aquaculture with its environment: Prospects for sustainability. Ocean Coast. Manag. 1992, 17, 5–24. [Google Scholar] [CrossRef]
  6. Diana, J.S. Aquaculture Production and Biodiversity Conservation. Biosci. 2009, 59, 27–38. [Google Scholar] [CrossRef]
  7. Deutsch, L.; Gräslund, S.; Folke, C.; Troell, M.; Huitric, M.; Kautsky, N.; Lebel, L. Feeding aquaculture growth through globalization: Exploitation of marine ecosystems for fishmeal. Glob. Environ. Chang. 2007, 17, 238–249. [Google Scholar] [CrossRef]
  8. Godfray, H.C.J.; Beddington, J.R.; Crute, I.R.; Haddad, L.; Lawrence, D.; Muir, J.F.; Pretty, J.; Robinson, S.; Thomas, S.M.; Toulmin, C. Food Security: The Challenge of Feeding 9 Billion People. Science 2010, 327, 812–818. [Google Scholar] [CrossRef] [Green Version]
  9. Dumbauld, B.R.; Ruesink, J.L.; Rumrill, S.S. The ecological role of bivalve shellfish aquaculture in the estuarine environment: A review with application to oyster and clam culture in West Coast (USA) estuaries. Aquac. 2009, 290, 196–223. [Google Scholar] [CrossRef]
  10. Shumway, S.E.; Davis, C.; Downey, R.; Karney, R.; Kraeuter, J.; Parsons, J.; Wikfors, G. Shellfish aquaculture–in praise of sustainable economies and environments. J. World Aquacult. Soc. 2003, 34, 8–10. [Google Scholar]
  11. Richter, C.; Skulas-Ray, A.C.; Champagne, C.M.; Kris-Etherton, P.M. Plant protein and animal proteins: do they differentially affect cardiovascular disease risk? Adv. Nutr. 2015, 6, 712–728. [Google Scholar] [CrossRef]
  12. Willer, D.; Aldridge, D.C. Microencapsulated diets to improve bivalve shellfish aquaculture. R. Soc. Open Sci. 2017, 4, 171142. [Google Scholar] [CrossRef] [Green Version]
  13. World Bank Data. CO2 Emissions. 2017. Available online: https://data.worldbank.org/indicator/EN.ATM.CO2E.PC (accessed on 3 March 2020).
  14. Danovaro, R.; Gambi, C.; Luna, G.; Mirto, S. Sustainable impact of mussel farming in the Adriatic Sea (Mediterranean Sea): evidence from biochemical, microbial and meiofaunal indicators. Mar. Pollut. Bull. 2004, 49, 325–333. [Google Scholar] [CrossRef] [PubMed]
  15. Suplicy, F.M. A review of the multiple benefits of mussel farming. Rev. Aquac. 2018, 12, 204–223. [Google Scholar] [CrossRef]
  16. Venugopal, V.; Gopakumar, K. Shellfish: Nutritive Value, Health Benefits, and Consumer Safety. Compr. Rev. Food Sci. Food Saf. 2017, 16, 1219–1242. [Google Scholar] [CrossRef] [Green Version]
  17. Prou, J.; Goulletquer, P. The French mussel industry: present status and perspectives. Bull Aquacul. Assoc. Can. 2002, 3, 17–23. [Google Scholar]
  18. Gangnery, A.; Bacher, C.; Buestel, D. Application of a population dynamics model to the Mediterranean mussel, Mytilus galloprovincialis, reared in Thau Lagoon (France). Aquac. 2004, 229, 289–313. [Google Scholar] [CrossRef]
  19. FAO. Fishery and aquaculture statistics. Global aquaculture production 1950-2015 (Fishstat). In: FAO Fisheries and Aquaculture Department [online]. Rome, Updated 2018. 2018. Available online: www.fao.org/fishery/statistics/software/fishstatj/enaccessed1.1.18 (accessed on 11 March 2020).
  20. European Market Observatory for Fisheries and Aquaculture Products (EUMOFA), 2019. Fresh mussel in the UE: price structure in the supply chain. Available online: https://www.eumofa.eu/documents/20178/151118/PTAT+Fresh+Mussel_EN.pdf (accessed on 11 March 2020).
  21. Rodríguez-Rodríguez, G.; Ramudo, R.B. Market driven management of climate change impacts in the Spanish mussel sector. Mar. Policy 2017, 83, 230–235. [Google Scholar] [CrossRef]
  22. Samuel-Fitwi, B.; Wuertz, S.; Schroeder, J.P.; Schulz, C. Sustainability assessment tools to support aquaculture development. J. Clean. Prod. 2012, 32, 183–192. [Google Scholar] [CrossRef]
  23. Finkbeiner, M.; Inaba, A.; Tan, R.; Christiansen, K.; Klüppel, H.-J. The New International Standards for Life Cycle Assessment: ISO 14040 and ISO 14044. Int. J. Life Cycle Assess. 2006, 11, 80–85. [Google Scholar] [CrossRef]
  24. Traverso, M.; Asdrubali, F.; Francia, A.; Finkbeiner, M. Towards life cycle sustainability assessment: an implementation to photovoltaic modules. Int. J. Life Cycle Assess. 2012, 17, 1068–1079. [Google Scholar] [CrossRef]
  25. Ziegler, F.; Winther, U.; Hognes, E.S.; Emanuelsson, A.; Sund, V.; Ellingsen, H. The Carbon Footprint of Norwegian Seafood Products on the Global Seafood Market. J. Ind. Ecol. 2012, 17, 103–116. [Google Scholar] [CrossRef]
  26. Farmery, A.K.; Gardner, C.; Green, B.S.; Jennings, S.; Watson, R.A. Domestic or imported? An assessment of carbon footprints and sustainability of seafood consumed in Australia. Environ. Sci. Policy 2015, 54, 35–43. [Google Scholar] [CrossRef]
  27. Cao, L.; Diana, J.S.; Keoleian, G.A. Role of life cycle assessment in sustainable aquaculture. Rev. Aquac. 2013, 5, 61–71. [Google Scholar] [CrossRef] [Green Version]
  28. Ford, J.S.; Ziegler, F.; Scholz, A.J.; Tyedmers, P.; Sonesson, U.; Kruse, S.A.; Silverman, H.; Pelletier, N.L. Proposed Local Ecological Impact Categories and Indicators for Life Cycle Assessment of Aquaculture. J. Ind. Ecol. 2012, 16, 254–265. [Google Scholar] [CrossRef]
  29. McGrath, K.P.; Pelletier, N.L.; Tyedmers, P. Life Cycle Assessment of a Novel Closed-Containment Salmon Aquaculture Technology. Environ. Sci. Technol. 2015, 49, 5628–5636. [Google Scholar] [CrossRef] [PubMed]
  30. Song, X.; Liu, Y.; Pettersen, J.B.; Brandão, M.; Ma, X.; Røberg, S.; Frostell, B. Life cycle assessment of recirculating aquaculture systems: A case of Atlantic salmon farming in China. J. Ind. Ecol. 2019, 23, 1077–1086. [Google Scholar] [CrossRef] [Green Version]
  31. Silvenius, F.; Grönroos, J.; Kankainen, M.; Kurppa, S.; Mäkinen, T.; Vielma, J. Impact of feed raw material to climate and eutrophication impacts of Finnish rainbow trout farming and comparisons on climate impact and eutrophication between farmed and wild fish. J. Clean. Prod. 2017, 164, 1467–1473. [Google Scholar] [CrossRef]
  32. Järviö, N.; Henriksson, P.J.G.; Guinée, J. Including GHG emissions from mangrove forests LULUC in LCA: a case study on shrimp farming in the Mekong Delta, Vietnam. Int. J. Life Cycle Assess. 2017, 23, 1078–1090. [Google Scholar] [CrossRef] [Green Version]
  33. Medeiros, M.V.; Aubin, J.; Camargo, A.F. Life cycle assessment of fish and prawn production: Comparison of monoculture and polyculture freshwater systems in Brazil. J. Clean. Prod. 2017, 156, 528–537. [Google Scholar] [CrossRef] [Green Version]
  34. Abdou, K.; Aubin, J.; Romdhane, M.S.; Le Loc’H, F.; Lasram, F.B.R. Environmental assessment of seabass (Dicentrarchus labrax) and seabream (Sparus aurata) farming from a life cycle perspective: A case study of a Tunisian aquaculture farm. Aquaculture 2017, 471, 204–212. [Google Scholar] [CrossRef]
  35. Lopez, P.A.; Toledo-Guedes, K.; Izquierdo-Gomez, D.; Šegvić-Bubić, T.; Sanchez-Jerez, P. Implications of Sea Bream and Sea Bass Escapes for Sustainable Aquaculture Management: A Review of Interactions, Risks and Consequences. Rev. Fish. Sci. Aquac. 2017, 26, 214–234. [Google Scholar] [CrossRef]
  36. Yacout, D.M.M.; Soliman, N.F.; Yacout, M.M. Comparative life cycle assessment (LCA) of Tilapia in two production systems: semi-intensive and intensive. Int. J. Life Cycle Assess. 2016, 21, 806–819. [Google Scholar] [CrossRef]
  37. Iribarren, D.; Moreira, M.T.; Feijoo, G. Life Cycle Assessment of fresh and canned mussel processing and consumption in Galicia (NW Spain). Resour. Conserv. Recycl. 2010, 55, 106–117. [Google Scholar] [CrossRef]
  38. Iribarren, D.; Hospido, A.; Moreira, M.T.; Feijoo, G. Carbon footprint of canned mussels from a business-to-consumer approach. A starting point for mussel processors and policy makers. Environ. Sci. Policy 2010, 13, 509–521. [Google Scholar] [CrossRef]
  39. Aubin, J.; Fontaine, C.; Callier, M.D.; D’Orbcastel, E.R. Blue mussel (Mytilus edulis) bouchot culture in Mont-St Michel Bay: potential mitigation effects on climate change and eutrophication. Int. J. Life Cycle Assess. 2017, 23, 1030–1041. [Google Scholar] [CrossRef]
  40. Lourguioui, H.; Brigolin, D.; Boulahdid, M.; Pastres, R. A perspective for reducing environmental impacts of mussel culture in Algeria. Int. J. Life Cycle Assess. 2017, 22, 1266–1277. [Google Scholar] [CrossRef]
  41. Fry, J.M. Carbon Footprint of Scottish Suspended Mussels and Intertidal Carbon Footprint of Scottish Suspended Mussels and Intertidal Oysters. SARF078, 2018, Pitlochry, UK. Available online: http://www.sarf.org.uk/cms-assets/documents/43896-326804.sarf078 (accessed on 14 April 2020).
  42. European Commission—Joint Research Centre—Institute for Environment and Sustainability. International Reference Life Cycle Data System (ILCD) Handbook—General Guide for Life Cycle Assessment—Detailed Guidance, 1st ed.; EUR 24708 EN; Publications Office of the European Union: Luxembourg, 2010. [Google Scholar]
  43. Viaroli, P.; Giordani, G.; Bartoli, M.; Naldi, M.; Azzoni, R.; Nizzoli, D.; Ferrari, I.; Comenges, J.M.Z.; Bencivelli, S.; Castaldelli, G.; et al. The Sacca di Goro Lagoon and an Arm of the Po River. In The Handbook of Environmental Chemistry; Springer Science and Business Media LLC: Berlin, Germany, 2005; Volume 5, pp. 197–232. [Google Scholar]
  44. Maffei, M.; Matarazzo, D.; Mietti, N.; Pasini, M.; Tontini, N.; Turolla, E.; Massaccesi, G.; Camanzi, L. Consorzio mitilicoltori dell’Emilia Romagna, Studi ed indagini rivolti al miglioramento della mitilicoltura in Emilia-Romagna. Greentime. 2011. Available online: https://agricoltura.regione.emilia-romagna.it/pesca/temi/pubblicazioni/acquacoltura/mitilicoltura-in-emilia-romagna (accessed on 16 March 2020).
  45. Buck, B.H.; Ebeling, M.W.; Michler-Cieluch, T. MUSSEL CULTIVATION AS A CO-USE IN OFFSHORE WIND FARMS: POTENTIAL AND ECONOMIC FEASIBILITY. Aquac. Econ. Manag. 2010, 14, 255–281. [Google Scholar] [CrossRef]
  46. Ecoinvent Database®. Available online: https://www.ecoinvent.org/database/database.html (accessed on 15th January 2020).
  47. De Bruijn, H.; Van Duin, R.; Huijbregts, M.A.J. Handbook on Life Cycle Assessment. In Ahead of the Curve; Springer Science and Business Media LLC: Berlin, Germany, 2002. [Google Scholar]
  48. Pelletier, N.L.; Ayer, N.W.; Tyedmers, P.H.; Kruse, S.A.; Flysjo, A.; Robillard, G.; Sonesson, U. Impact categories for life cycle assessment research of seafood production systems: review and prospectus. Int. J. Life Cycle Ass. 2007, 12, 414–421. [Google Scholar] [CrossRef]
  49. Muller, S.; Lesage, P.; Ciroth, A.; Mutel, C.L.; Weidema, B.P.; Samson, R. The application of the pedigree approach to the distributions foreseen in ecoinvent v3. Int. J. Life Cycle Assess. 2014, 21, 1327–1337. [Google Scholar] [CrossRef]
  50. Lo, S.-C.; Ma, H.-W. Quantifying and reducing uncertainty in life cycle assessment using the Bayesian Monte Carlo method. Sci. Total. Environ. 2005, 340, 23–33. [Google Scholar] [CrossRef]
  51. Gallardi, D.; Dörner, J.; Carbonell, P.; Pino, S.; Farías, A. Effects of Bivalve Aquaculture on the Environment and Their Possible Mitigation: A Review. Fish. Aquac. J. 2014, 5, 1–3. [Google Scholar] [CrossRef] [Green Version]
  52. Van Der Werf, H.M.G.; Turunen, L. The environmental impacts of the production of hemp and flax textile yarn. Ind. Crop. Prod. 2008, 27, 1–10. [Google Scholar] [CrossRef]
  53. Minami, S.; Toki, T.; Yoshikawa, N.; Hanada, T.; Ashida, M.; Kitada, S.-I.; Tsukuda, K. A Newly Developed Plug-in Hybrid Electric Boat (PHEB). J. Asian Electr. Veh. 2010, 8, 1385–1392. [Google Scholar] [CrossRef] [Green Version]
  54. Gestore dei Servizi Energetici S.p.A Rapporto Statistico 2018. Available online: http://enerweb.casaccia.enea.it/enearegioni/UserFiles/GSE_Rapporto_Statistico_FER_2018.pdf (accessed on 15 March 2020).
  55. Wibowo, A.C.; Mohanty, A.K.; Misra, M.; Drzal, L.T. Chopped Industrial Hemp Fiber Reinforced Cellulosic Plastic Biocomposites: Thermomechanical and Morphological Properties. Ind. Eng. Chem. Res. 2004, 43, 4883–4888. [Google Scholar] [CrossRef]
  56. Amaducci, S.; Amaducci, M.; Benati, R.; Venturi, G. Crop yield and quality parameters of four annual fibre crops (hemp, kenaf, maize and sorghum) in the North of Italy. Ind. Crop. Prod. 2000, 11, 179–186. [Google Scholar] [CrossRef]
  57. Avio, C.G.; Gorbi, S.; Regoli, F. Plastics and microplastics in the oceans: From emerging pollutants to emerged threat. Mar. Environ. Res. 2017, 128, 2–11. [Google Scholar] [CrossRef]
  58. Lusher, A.; Hollman, P.; Mendoza-Hill, J. Microplastics in fisheries and aquaculture. FAO Fisheries and Aquaculture Technical Paper (FAO) eng no. 615. 2017. Available online: http://www.fao.org/3/a-i7677e.pdf (accessed on 14 April 2020).
  59. Smith, M.; Love, D.C.; Rochman, C.M.; Neff, R.A. Microplastics in Seafood and the Implications for Human Health. Curr. Environ. Heal. Rep. 2018, 5, 375–386. [Google Scholar] [CrossRef] [Green Version]
  60. OSPAR convention, Scoping study to identify key waste items from the fishing industry and aquaculture Marine Litter Regional Action Plan Action 35. 2019. Available online: https://www.ospar.org/documents?v=41242 (accessed on 27 April 2020).
  61. Stamatopoulos, C. Current Status of Fisheries and Aquaculture Statistics: A Brief Review. Oceanogr. Fish. Open Access J. 2018, 7. [Google Scholar] [CrossRef]
  62. Sandra, M.; Devriese, L.; De Raedemaecker, F.; Lonneville, B.; Lukic, I.; Altvater, S.; Compa Ferrer, M.; Deudero, S.; Torres Hansjosten, B.; Alomar Mascaró, C.; et al. Knowledge wave on marine litter from aquaculture sources. D2.2 Aqua-Lit project. Oostende, Belgium. 2019. Available online: https://aqua-it.eu/assets/content/D2.2.%20Knowledge%20wave%20on%20marine%20litter%20from%20aquaculture%20sources_upd.pdf (accessed on 3 May 2020).
  63. Barile, N.B.; Scopa, M.; Nerone, E.; Mascilongo, G.; Recchi, S.; Cappabianca, S.; Antonetti, L. Study of the efficacy of a closed cycle depuration system on bivalve molluscs. Veter- Ital. 2010, 45, 555–566. [Google Scholar]
  64. Kinnon, A.M. Guidelines for Measuring and Managing CO2 Emission from Freight Transport Operations. The European Chemical Industry Council. 2011. Available online: https://www.ecta.com/resources/Documents/Best%20Practices%20Guidelines/guideline_for_measuring_and_managing_co2.pdf (accessed on 16 April 2020).
  65. Friel, S.; Schram, A.; Townsend, B. The nexus between international trade, food systems, malnutrition and climate change. Nat. Food 2020, 1, 51–58. [Google Scholar] [CrossRef] [Green Version]
Figure 1. Mussel farming leases on the Po River Delta valley, northeastern coast of Italy (a), in the Sacca di Goro lagoon (b). The positions of the long-line plants and of the farms’ technical base are indicated by the black bars.
Sustainability 12 03814 g001
Figure 2. Schematic diagram showing a typical mussel farm long-line as (a) side view and (b) plan view of the long-lines used in typical plants.
Sustainability 12 03814 g002aSustainability 12 03814 g002b
Figure 3. System boundaries used in the life cycle assessment (LCA) of mussel farming in Sacca di Goro. The boxes represent the processes (solid box = foreground process; dashed box = background process; dash–dot box = raw material production process/electricity/water production), the gray circles represent the products and the solid arrows depict mass flows.
Sustainability 12 03814 g003
Figure 4. Contribution of materials and capital goods to the potential environmental impact associated with mussel farming.
Sustainability 12 03814 g004
Figure 5. Results of the sensitivity analysis of the three scenarios (SCENARIO 1, a boat’s diesel engine has been replaced with an electric engine; SCENARIO 2, 50% of HDPE socks replaced by textile hemp socks; SCENARIO 3, 100% of HDPE socks replaced by textile hemp socks). Percentages of impact worsening (positive values) and of impact improvement (negative values) were calculated from the actual scenario (0%).
Sustainability 12 03814 g005
Table 1. Average values for boats used in local mussel farming.
ParameterValueStandard DeviationUnit
Hull materialFiberglass--
Length15.72.3m
Main engine power21020hp
Boat equipmentSocking machine
De-clumping machine
Grading machine
--
Crew4.51.0people
Distance to cultivation site3.30.4miles
Annual consumption of diesel62502235l/years
Annual consumption of oil455l/years
Annual days of work2055days
Table 2. Life cycle inventory of mussel culture in long-lines. The value of 0 tonnes km means that the contribution of transportation is negligible, since the supplier is located in Goro. The transport of raw materials to suppliers was not included in the analysis. All input is referred in terms of 1 kg of fresh mussels harvested.
INPUTS
From the TechnosphereFrom the Environment
Materials and FuelsResources
Stainless steel AISI 316 (g)800.0Sea use (m2 year−1)1.54
High-density polyethylene (HDPE) (g)27.7Seawater (m3)0.001
Low-density polyethylene (LDPE) (g)5.0Freshwater (m3)-
Fiberglass50.0
Polypropylene (PP) (g)5.8
Polisteel (g)19.7
Polyvinyl chloride (PVC) (g)0.8
Rubber (g)< 0.1
Polyphenil ether (PPE) (g)< 0.1
Cotton (g)0.2
Nylon (g)9.3
Concrete (g)1730.0
Diesel for boat (g)20
Engine oil (l)0.2
Vehicles
Boat (no. of items)1
Emissions to air
Carbon dioxide (kg)0.037
Nitrous oxide (kg)1.1 × 10⁻⁴
Sulfur oxide (kg)4.2 × 10⁻⁵
Methane (kg)6.8 × 10⁻⁴
Non-methane volatile organic carbon (NMVOC)1.5 × 10⁻⁴
Particulates < 2.5 μ (kg)1.6 × 10⁻⁵
Particulates < 10 μ (kg)4.1 × 10⁻⁶
Particulates > 2.5 μ and < 10 μ (kg)5.2 × 10⁻⁶
Emissions to Water
Absorbable organic halogen as Cl (AOX) (kg)1.3 × 10⁻⁹
Biochemical oxygen demand (BOD) (kg)5.4 × 10⁻⁶
Heat, waste (MJ)1.3 × 10⁻⁴
Nitrate (kg)3.7 × 10⁻⁷
Table 3. Pedigree matrix for our data quality and correlated empirical uncertainty factors.
Indicator ScoreModesUncertainty Factor
Reliability 1Verified data based on measurement1.00
Completeness1Representative data from all sited relevant for the process considered1.00
Temporal correlation1Less than three years of difference to the time period of the dataset1.00
Geographical correlation1Data from the area under study1.00
Further technological correlation2Data from processes and materials under study (i.e. identical technology) but from different enterprises1.18
Table 4. Mean impacts from Life Cycle Impact Assessment (LCIA) of 1 kg of fresh mussels packed to be sold.
Impact CategoryValueUnit
Climate change—GWP100 *0.137kg CO2 eq.
Acidification potential (AP)7.1 × 10⁻⁴kg SO2 eq.
Eutrophication potential (EP)1.7 × 10⁻⁴kg PO4 eq.
Depletion of abiotic resources (ADP)—elements, ultimate reserves4.4 × 10−7kg Sb eq.
Depletion of abiotic resources (ADP)—fossil fuel2.55MJ
Ozone layer depletion potential (ODP)8.67 × 10⁻⁹kg CFC-11 eq.
Photochemical oxidant formation potential (POFP) 5.12 × 10⁻⁵kg ethylene eq.
Human toxicity potential (HTP)0.13kg 1,4-DCB eq. **
Marine water aquatic ecotoxicity potential (MAETP)130.34kg 1,4-DCB eq.
** GWP100, global warming potential for 100 years time horizon; * 1,4-DCB, 1,4 dinitrobenzene eq.
Table 5. Results of the Monte Carlo simulation. SD, standard deviation; CV, coefficient of variation; Min, minimum value of the distribution; Max, maximum value of the distribution; 5% and 95%, percentiles values.
Impact CategoryMeanSDCV%MinMaxMedian5%95%
Climate change – GWP1001.00 × 10−34.70 × 10−447%4.63 × 10−45.68 × 10−38.71 × 10−45.97 × 10−41.00 × 10⁻³
Acidification potential (AP)1.58 × 10−13.09 × 10−220%9.95 × 10−23.78 × 10−11.53 × 10−11.20 × 10−11.58 × 10⁻¹
Eutrophication potential (EP)4.86 × 10−75.59 × 10−812%3.22 × 10−77.57 × 10−74,83 × 10−74.04 × 10−74.86 × 10⁻⁷
Depletion of abiotic resources (ADP) - elements, ultimate reserves2.977.1224%1.909.332.852.192.97
Depletion of abiotic resources (ADP) – fossil fuel3.36 × 10−41.33 × 10−440%1.56 × 10−41.6610−33.14 × 10−41.95 × 10−43.36 × 10⁻⁴
Human toxicity potential (HTP)2.20 × 10−11.33 × 10−160%1.20 × 10−12.051.95 × 10−11.43 × 10−12.20 × 10−1
Marine water aquatic ecotoxicity potential (MAETP)249.82184.2374%111.312688.85214.13147.86416.31
Ozone layer depletion potential (ODP)1.10 × 10−83.65 × 10−833%5.16 × 10−93.04 × 10−81.03 × 10−86.64 × 10−91.10 × 10 −8
Photochemical oxidant formation potential (POFP)7.15 × 10−52.82 × 10−539%3.04 × 10−53.08 × 10−46.45 × 10−54.2810−57.15 × 10⁻⁵
Table 6. Average extra CO2 eq. emissions estimation due to different possible transport modes from the two main mussel-exporting countries to Italy.
Transport ModegCO2eq./kg·km *Average kmExtra Emissions as kgCO2eq./kg of Mussel Product
From Spain ~2000
Intermodal road/barge0.034 0.068
Intermodal road/rail0.026 0.052
Road 0.062 0.124
From Chile ~12,000
Deep sea/container0.008 0.096
Air freight0.602 7.224
* as reported by [65].

