Article

Pullout Behaviour of Geogrids Embedded in a Recycled Construction and Demolition Material. Effects of Specimen Size and Displacement Rate

by
Castorina Silva Vieira
*,
Paulo Pereira
,
Fernanda Ferreira
and
Maria de Lurdes Lopes
CONSTRUCT, Faculty of Engineering, University of Porto, R. Dr. Roberto Frias, 4200-465 Porto, Portugal
*
Author to whom correspondence should be addressed.
Sustainability 2020, 12(9), 3825; https://0-doi-org.brum.beds.ac.uk/10.3390/su12093825
Submission received: 13 March 2020 / Revised: 4 May 2020 / Accepted: 4 May 2020 / Published: 8 May 2020

Abstract

:
In recent years, environmental concerns related to the overexploitation of natural resources and the need to manage large amounts of wastes arising from construction activities have intensified the pressure on the civil engineering industry to adopt sustainable waste recycling and valorisation measures. The use of recycled construction and demolition (C&D) wastes as alternative backfill for geosynthetic-reinforced structures may significantly contribute towards sustainable civil infrastructure development. This paper presents a laboratory study carried out to characterise the interaction between a fine-grained C&D material and two different geogrids (a polyester (PET) geogrid and an extruded uniaxial high-density polyethylene (HDPE) geogrid) through a series of large-scale pullout tests. The effects of the geogrid specimen size, displacement rate and vertical confining pressure on the pullout resistance of the geogrids are evaluated and discussed, aiming to assess whether they are in line with the current knowledge about the pullout resistance of geogrids embedded in soils. Test results have shown that the measured peak pullout resistance of the geogrid increases with the specimen size, imposed displacement rate and confining pressure. However, the pullout interaction coefficient has exhibited the opposite trend with the specimen size and confining pressure. The pullout interaction coefficients ranged from 0.79 and 1.57 and were generally greater than or equal to the values reported in the literature for soil-geogrid and recycled material-geogrid interfaces.

1. Introduction

Recent years have witnessed an increasing environmental awareness and the recognition of the importance of reducing the production of wastes and the exploitation of non-renewable natural resources in order to foster sustainable development. The civil engineering industry is among the major contributors to the worldwide consumption of natural resources (such as sand, gravel and stone reserves), being responsible for about 50% of all the materials extracted from the earth’s crust [1]. On the other hand, construction and demolition (C&D) waste is one of the heaviest and most voluminous waste streams generated in the European Union (EU), representing approximately 25–30% of all waste generated in the EU [2].Billions of tons of construction and demolition (C&D) wastes are produced every year from different activities, including the construction, maintenance and demolition of buildings and civil infrastructure, which raises severe environmental concerns and intensifies the need for more efficient waste management in the construction sector. In particular, the large volumes of C&D waste generated across the EU and their high valorisation potential have led the European Commission to classify these materials as a priority waste stream [3].
Geotechnical design and construction, which is often placed early in a civil engineering project, can significantly contribute to enhance the overall sustainable development by incorporating sustainable practices, among which is the use of alternative, environment friendly materials and the reuse of waste materials, such as the C&D wastes [4,5,6]. In Europe about 40% of the natural aggregates are consumed in unbound layers of transportation infrastructures [7]. This suggests that the reliance on natural aggregates in geotechnical applications is high and the inclusion of recycled aggregates can contribute significantly to preserve the environment. In view of the above, several studies have recently been conducted to evaluate the feasibility of using recycled C&D wastes in diverse geotechnical applications, such as ground improvement works [8,9], pipe bedding and backfilling [10,11], construction of paved and unpaved roads [12,13,14,15,16,17,18] and backfilling of geosynthetic-reinforced structures [19,20,21,22].
Most of the studies carried out on recycled aggregates from C&D waste are related to recycled concrete aggregates [9,10,14,23] or reclaimed asphalt pavement materials [16,17]. However, particularly in Southern European Countries, C&D wastes sent out at the recycling plants are mainly mixed wastes (comprising concrete, mortars, stones, ceramics,). The recycled aggregates coming from mixed C&D waste have limited market acceptance, particularly to concrete production and base layers of roadways. Coarse recycled aggregates are sometimes applied as aggregates in sub-base layers of transportation infrastructures [13] or unpaved roads [15,24].
During the recycling process of C&D waste, particularly in Portuguese recycling plants, a fine-grain recycled material (0–10 mm) is produced. This fine grain fraction has reduced market acceptance and the recycling operators have difficulties in commercialize it. Rodrigues et al. [25] evaluated physical and chemical properties relevant for the incorporation in concrete of 10 samples of fine aggregates from C&D waste obtained from seven Portuguese recycling plants and concluded that none of the samples has all characteristics within the limits imposed in the European Standards to allow its incorporation in concrete. Based on these evidences, a research study has been carried out to evaluate the feasibility of using these recycled materials in the construction of structural embankments, in particular geosynthetic reinforced embankments [11,20,21].
The interaction between the geosynthetic reinforcement and the backfill material is of critical importance for the safe design and adequate performance of geosynthetic-reinforced structures, such as walls, slopes and bridge abutments [26,27]. Various test methods have been used by numerous researchers over the last decades to characterise soil-geosynthetic interaction, such as the direct shear test [28,29,30,31], inclined plane test [32,33,34,35], pullout test [36,37,38,39,40] and in-soil tensile test [41], each of which allows simulating a different type of deformation at the backfill-reinforcement interface. For instance, the direct shear test is commonly used to analyse soil-reinforcement interaction when sliding of the backfill on the geosynthetic surface is anticipated, whereas the pullout test simulates the interaction between the backfill and the reinforcement in the anchorage zone of geosynthetic-reinforced soil walls and slopes (i.e., beyond the hypothetical failure surface). In fact, a condition for verification of internal stability of these structures is that the pullout capacity of the geosynthetic in the anchorage zone should not be lower than the tensile force acting on the reinforcement. The pullout resistance of the geosynthetic is therefore an important parameter required by design codes for geosynthetic-reinforced structures [42,43,44,45].
The pullout resistance of the geogrids is developed primarily by the combination of the passive resistance mobilised against their transverse members and the skin friction at both sides of the reinforcement [27]. While the latter mechanism depends mainly on the type of backfill material and geogrid surface roughness, the contribution of the passive resistance mechanism to the overall pullout resistance is dependent upon several factors, including the confining pressure, geogrid geometry and ratio of the mean grain size of the backfill material to the geogrid opening size.
The feasibility of using C&D recycled materials in the construction of geogrid-reinforced structures has been studied in recent years by some research groups [19,20,21,46,47]. These researches have been focused mainly on full-scale testing [19] or on the study of interfaces behaviour through direct shear [20,47,48,49] or pullout tests [20,22,49]. Nevertheless, the studies on the pullout resistance of geogrids embedded in C&D recycled materials are limited and based on valid assumptions for soils.
Vieira et al. [20] carried out pullout tests on three geosynthetics for soil reinforcement (a uniaxial HDPE geogrid, a uniaxial PET geogrid and a high-strength composite geotextile) embedded in a fine grain recycled C&DW obtained from a Portuguese recycling plant. The tests procedures were defined in accordance with the European standard for determination of pullout resistance in soil [50], being the tests were carried out with a constant displacement rate of 2 mm/min and under normal stress of approximately 31 kPa at interface level. Vieira et al. [22] report an experimental study carried out to assess the pullout behaviour of two geosynthetics (a uniaxial geocomposite reinforcement and an extruded HDPE geogrid) embedded in a recycled C&D material under cyclic and post-cyclic loading conditions. Soleimanbeigi et al. [49] performed pullout tests on a recycled concrete aggregate reinforced with a woven geotextile or a uniaxial geogrid following the procedures outlined in the ASTM standard for measuring geosynthetic pullout resistance in soil [51]. walls. A pullout displacement rate of 1.0 mm/min was used and the tests were performed under 20, 30, 50, 100 and 200 kPa normal stress.
The aim of the present study is assessing whether the effects of the different parameters with influence on the pullout resistance of geogrids (namely, the geogrid specimen size, the displacement rate and the normal stress) when they are embedded in a C&D recycled material are in line with the current knowledge about the pullout resistance of geogrids in soils. Previous studies on the pullout behaviour of interfaces between geosynthetics and C&D recycled materials have been performed following the guidance for common backfill materials (cohesionless soil soils) [20,22,49]. Thus, it is of great importance to evaluate whether some assumptions are still valid for alternative backfill materials. To this end, a series of large-scale laboratory pullout tests were carried out using a compacted C&D recycled material and two distinct uniaxial geogrids: a laid and welded geogrid consisting of extruded polyester (PET) bars and an extruded uniaxial high-density polyethylene (HDPE) geogrid. The effects of the geogrid specimen size, displacement rate and vertical confining pressure on the measured pullout response of the reinforcements are assessed. The pullout interaction coefficients for the studied interfaces are then derived, discussed and compared with the values typically reported in the literature for soil-geogrid interfaces. The main conclusions and the implications to the design of geogrid-reinforced structures are also depicted.

2. Materials and Methods

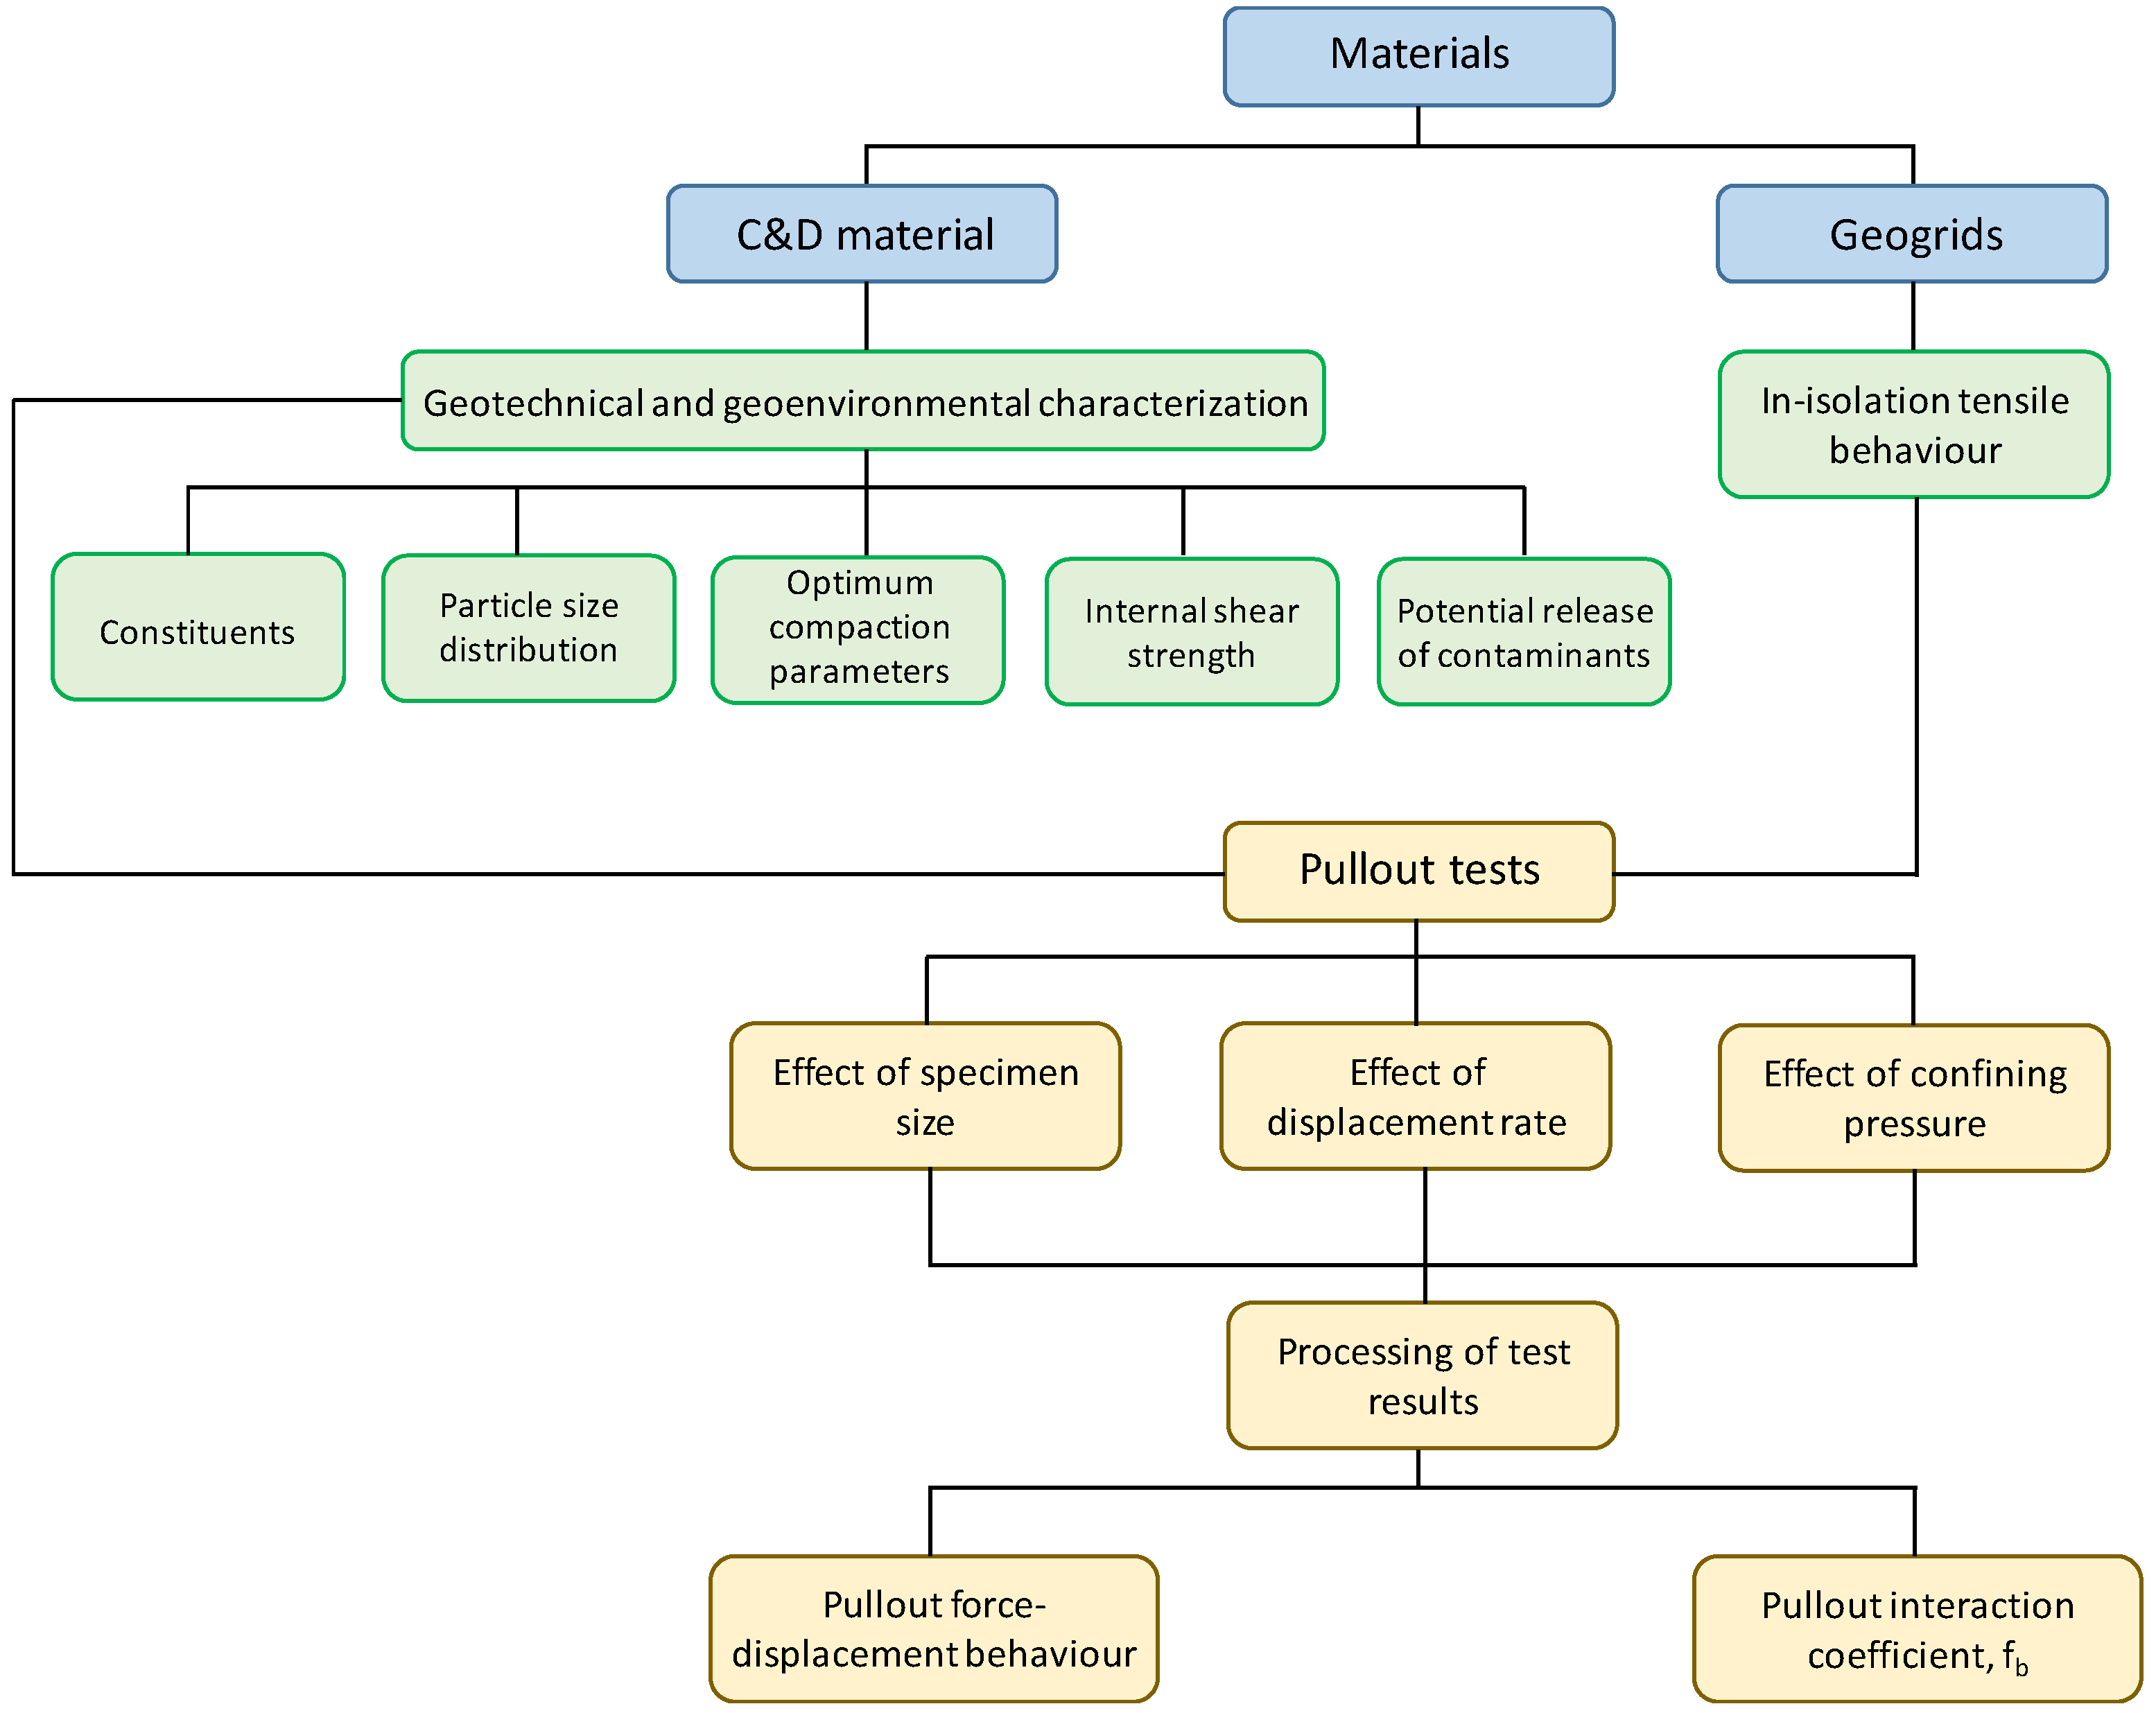
2.1. General Overview

Figure 1 presents a flowchart of the experimental study for a better understanding of this research. In this section the materials are characterized, pullout test apparatus and procedures are described, the test programme is summarised and the processing of the pullout test results is introduced.

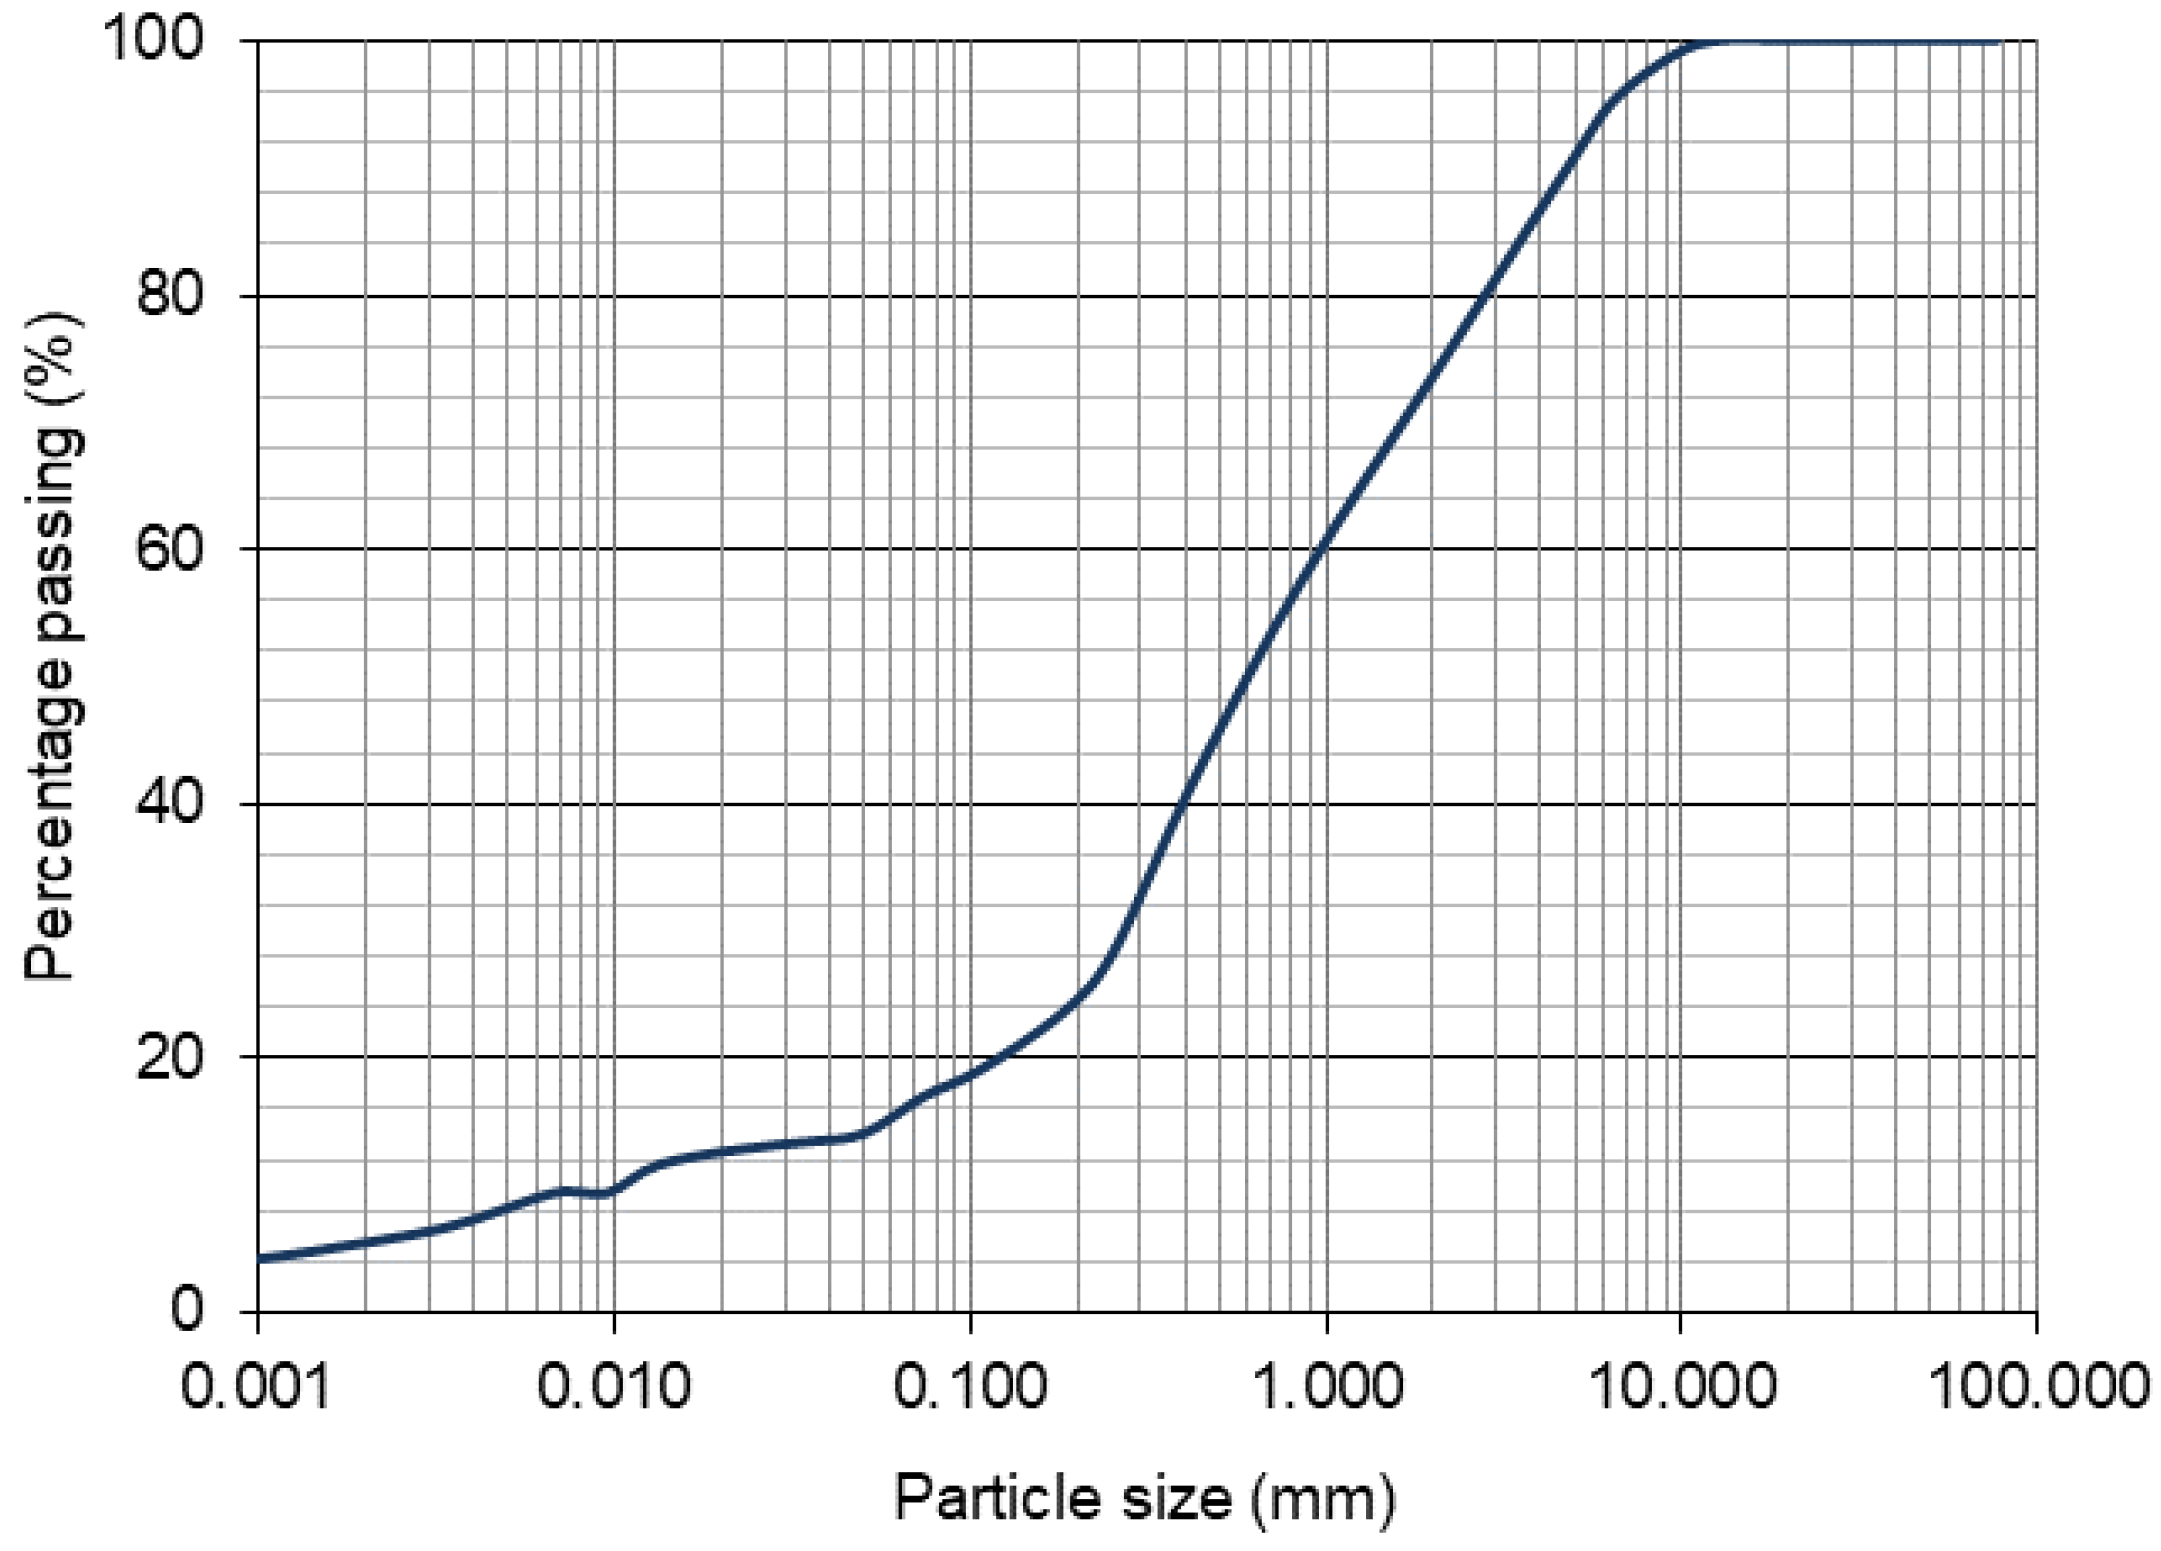
2.2. Construction and Demolition (C&D) Material
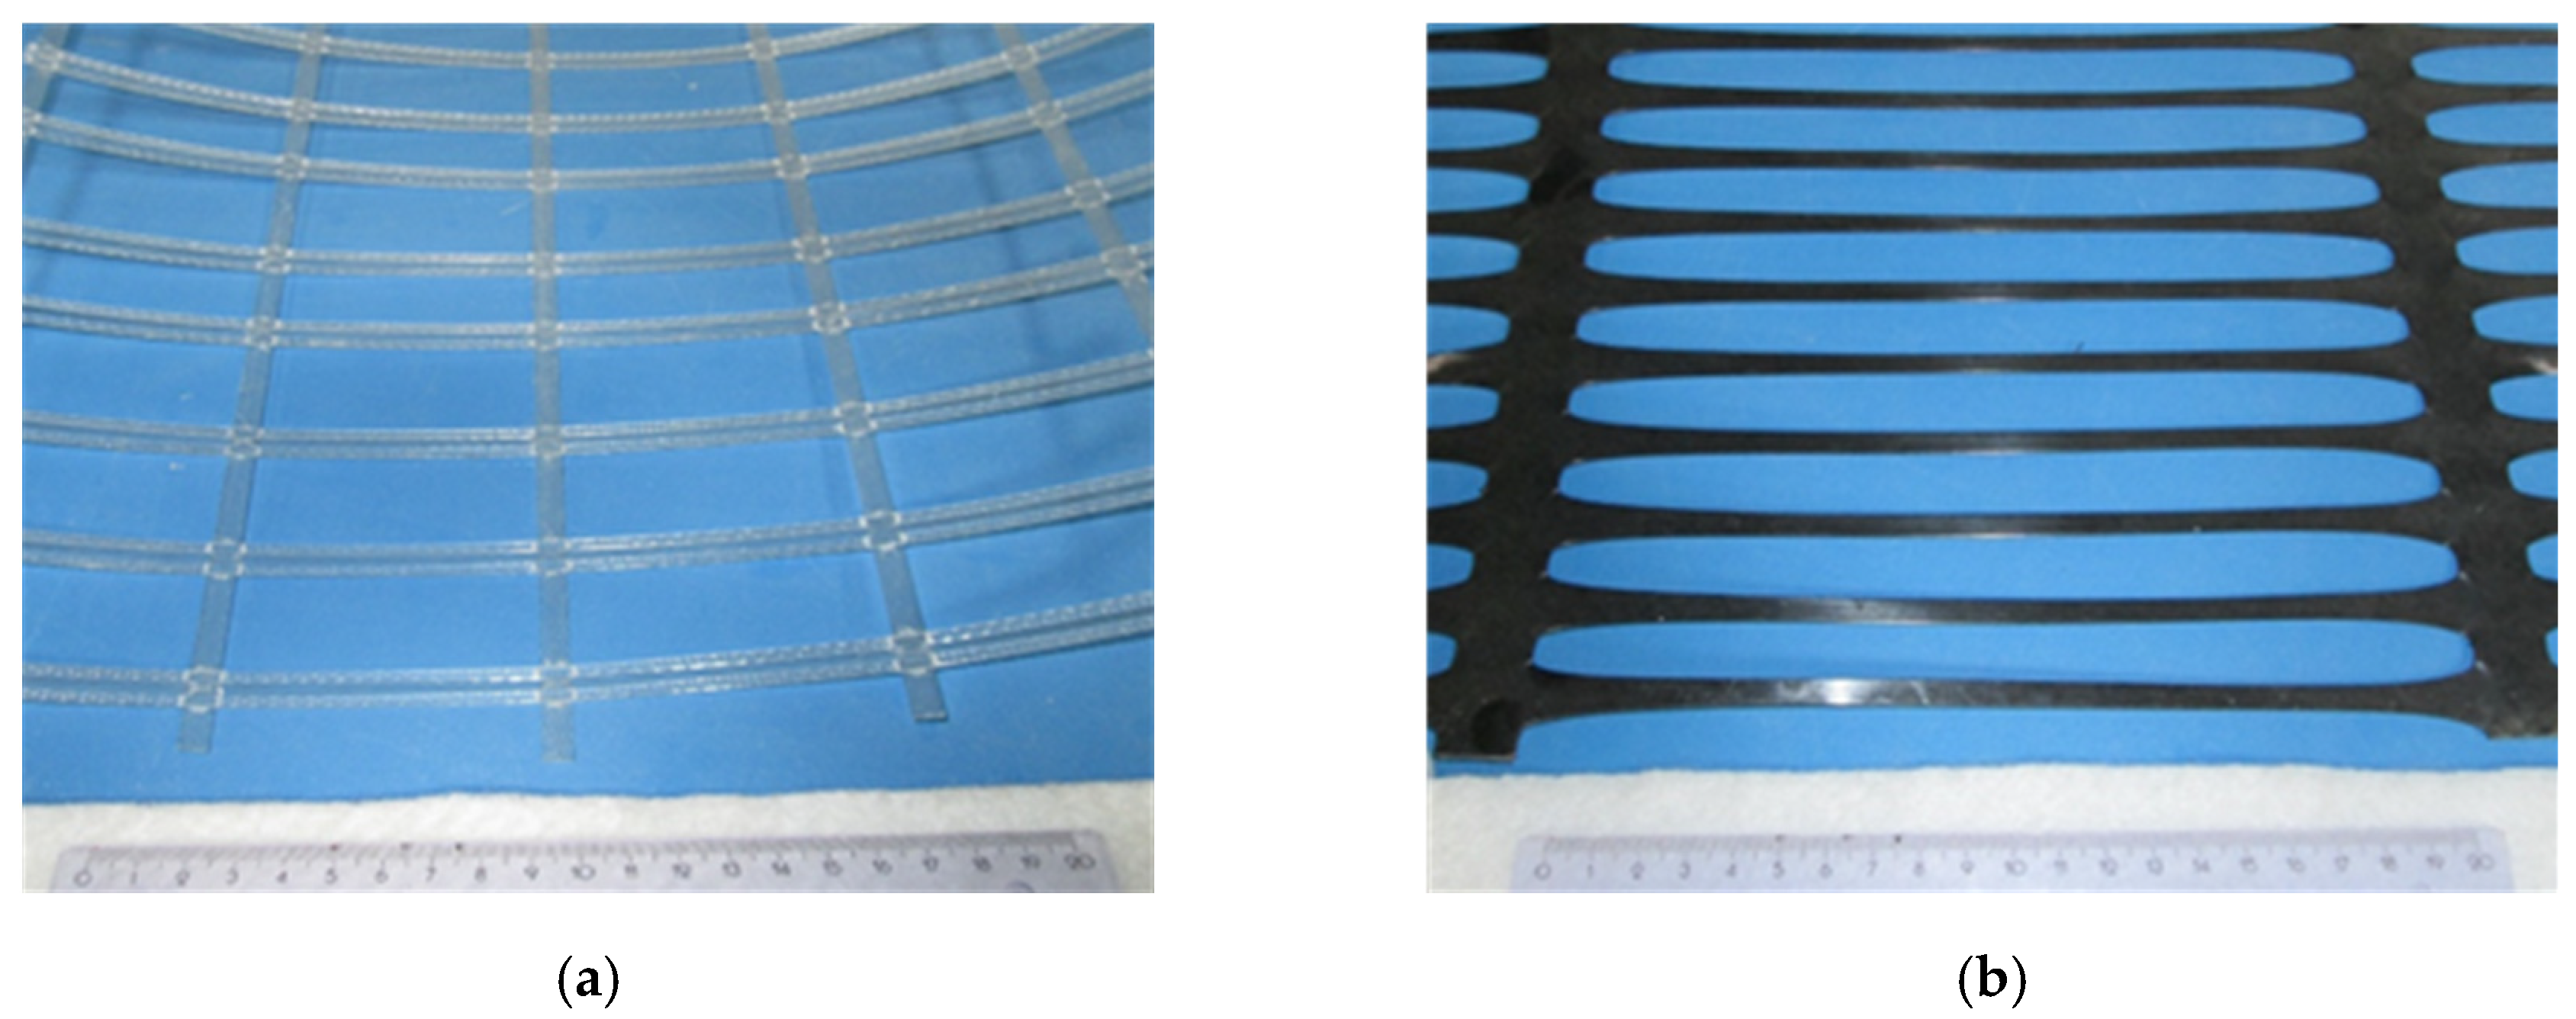
A fine-grained C&D recycled material was collected at a Portuguese recycling plant and used throughout the current study. This fine grain fraction is produced during the recycling process of C&D wastes and has little market acceptance due, mainly, to the likely high soil content and heterogeneity. Table 1 lists the respective constituents determined on the basis of the European Standard [52]. This standard refers to the constituents of coarse recycled aggregates, so some adjustments have been implemented, namely to estimate the “soil” constituent. The presented results clearly show that this particular C&D material was essentially composed of concrete and mortar products, unbound aggregates, masonries and soil.
The gradation was evaluated by sieving and sedimentation, in accordance with the Standards [53,54], respectively (Figure 2). It is worth noting that this material complies with the gradation requirements of the Federal Highway Administration (FHWA) [43] for reinforced soil slopes and of the National Concrete Masonry Association (NCMA) [44] for segmental retaining walls, but does not fulfil the criteria established by the FHWA for mechanically stabilised earth walls. Following the FHWA criteria, this C&D material can be used as backfill material for geosyntetic-reinforced steep slopes (face inclinations of less than 70 degrees).
The relevant geotechnical properties of this C&D material are summarised in Table 2. The optimum compaction parameters (i.e., maximum dry unit weight, γd,max = 20.1 kN/m3 and optimum moisture content, wopt = 9%) were estimated using the modified Proctor test, according to [55]. The quality of fines was assessed using the methylene blue test, following the standard [56]. The methylene blue value, MB (expressed in grams of dye per kilogram of the 0–2 mm size fraction) was determined as 3.2 g/kg.
The internal shear strength of the material was estimated by large-scale direct shear tests, using a prototype facility described in previous publications [28,29]. The C&D material was compacted inside the direct shear box (600 mm × 300 mm in plan) at the dry unit weight, γd = 16.1 kN/m3 (corresponding to 80% of its maximum dry density) and at the optimum moisture content (wopt = 9%) and then subjected to shearing under the normal stresses of 25, 50, 100 and 150 kPa. Based on the Mohr-Coulomb failure criterion, a peak friction angle (φ) of 37.6° and cohesion (c) of 16.3 kPa were obtained (Table 2).
The use of C&D materials in geotechnical applications may lead to environmental issues as far as groundwater contamination is concerned. When the rainfall percolates a solid material (in the case, solid waste or recycled aggregates) produces a leachate which, in case it contains hazardous substances, can contaminate groundwater. This issue is even more relevant when C&D recycled materials are placed in direct contact with the ground, as it is generally the case of geotechnical applications.
To evaluate the potential short-term release of contaminants, laboratory leaching tests were carried out on the recycled C&D material, as per the standard [57]. The obtained results are given in Table 3, which also shows the acceptance criteria of maximum leached concentration for inert landfill according to the European Council Decision 2003/33/EC [58]. As can be seen from the analysis of Table 3 only the value of sulphate, SO4, is above the threshold value.
The source of sulphates in C&D recycled materials is commonly attribute to the gypsum drywall [59], as well as, to concrete and mortar, natural aggregates and ceramic components [60]. Table 2 does not provide evidence of high gypsum content, but concrete and mortar, natural aggregates and ceramic components are the predominant components of the recycled material.
It should be noted however that, according to the above-mentioned Decision [58], if the waste material does not comply with the value for sulphate, it can still be considered as meeting the acceptance criteria if the leaching (estimated either by a batch leaching test or by a percolation test under conditions approaching local equilibrium) does not exceed 6000 mg/kg at a liquid to solid ratio of 10 L/kg (L/S = 10). Based on that it can be concluded that this recycled material meet the acceptance criteria set out by the European legislation for inert materials.
The Federal Highway Administration [43] recommends the use of fill materials with pH values above 3 and in the range of 3–9 for mechanically stabilized earth structures involving geosynthetic reinforcements manufactured from polyolefin (PP and HDPE) and polyester, respectively. The pH value of this C&D material (pH = 8.2) fulfils the FHWA specified requirements.
The content of water soluble sulphates was determined by spectrophotometry on the basis of Section 10 of the standard [61]. Firstly, the specimens of C&D material were sieved through the 4 mm sieve. The retained particles were crushed so as to pass the same sieve. Then, the specimens were mixed with hot water to extract water-soluble sulphate ions and barium chloride was added so that sulphate ions precipitate as barium sulphate. The content of water soluble sulphates obtained by weighting and expressed as a percentage of sulphate ions by mass of C&D material was about 0.14%.

2.3. Geogrids

Two commercially available geogrids were tested (Figure 3): a laid uniaxial geogrid consisting of extruded polyester (PET) bars with welded rigid junctions (GGR1) and an extruded uniaxial geogrid manufactured from high-density polyethylene, HDPE (GGR2). These geogrids in particular were selected as they are widely used in Portugal, they are produced with different polymers and manufacturing processes, they have nominal strength as close as possible and they are suitable for medium-high reinforced structures (i.e., neither with very low nor very high strength).
The tensile load-strain behaviour of the geogrids was assessed by in-isolation tensile tests carried out on a Universal Testing Machine (LR50K) following the standard [62]. The main physical and mechanical properties of the geogrids can be found in Table 4.

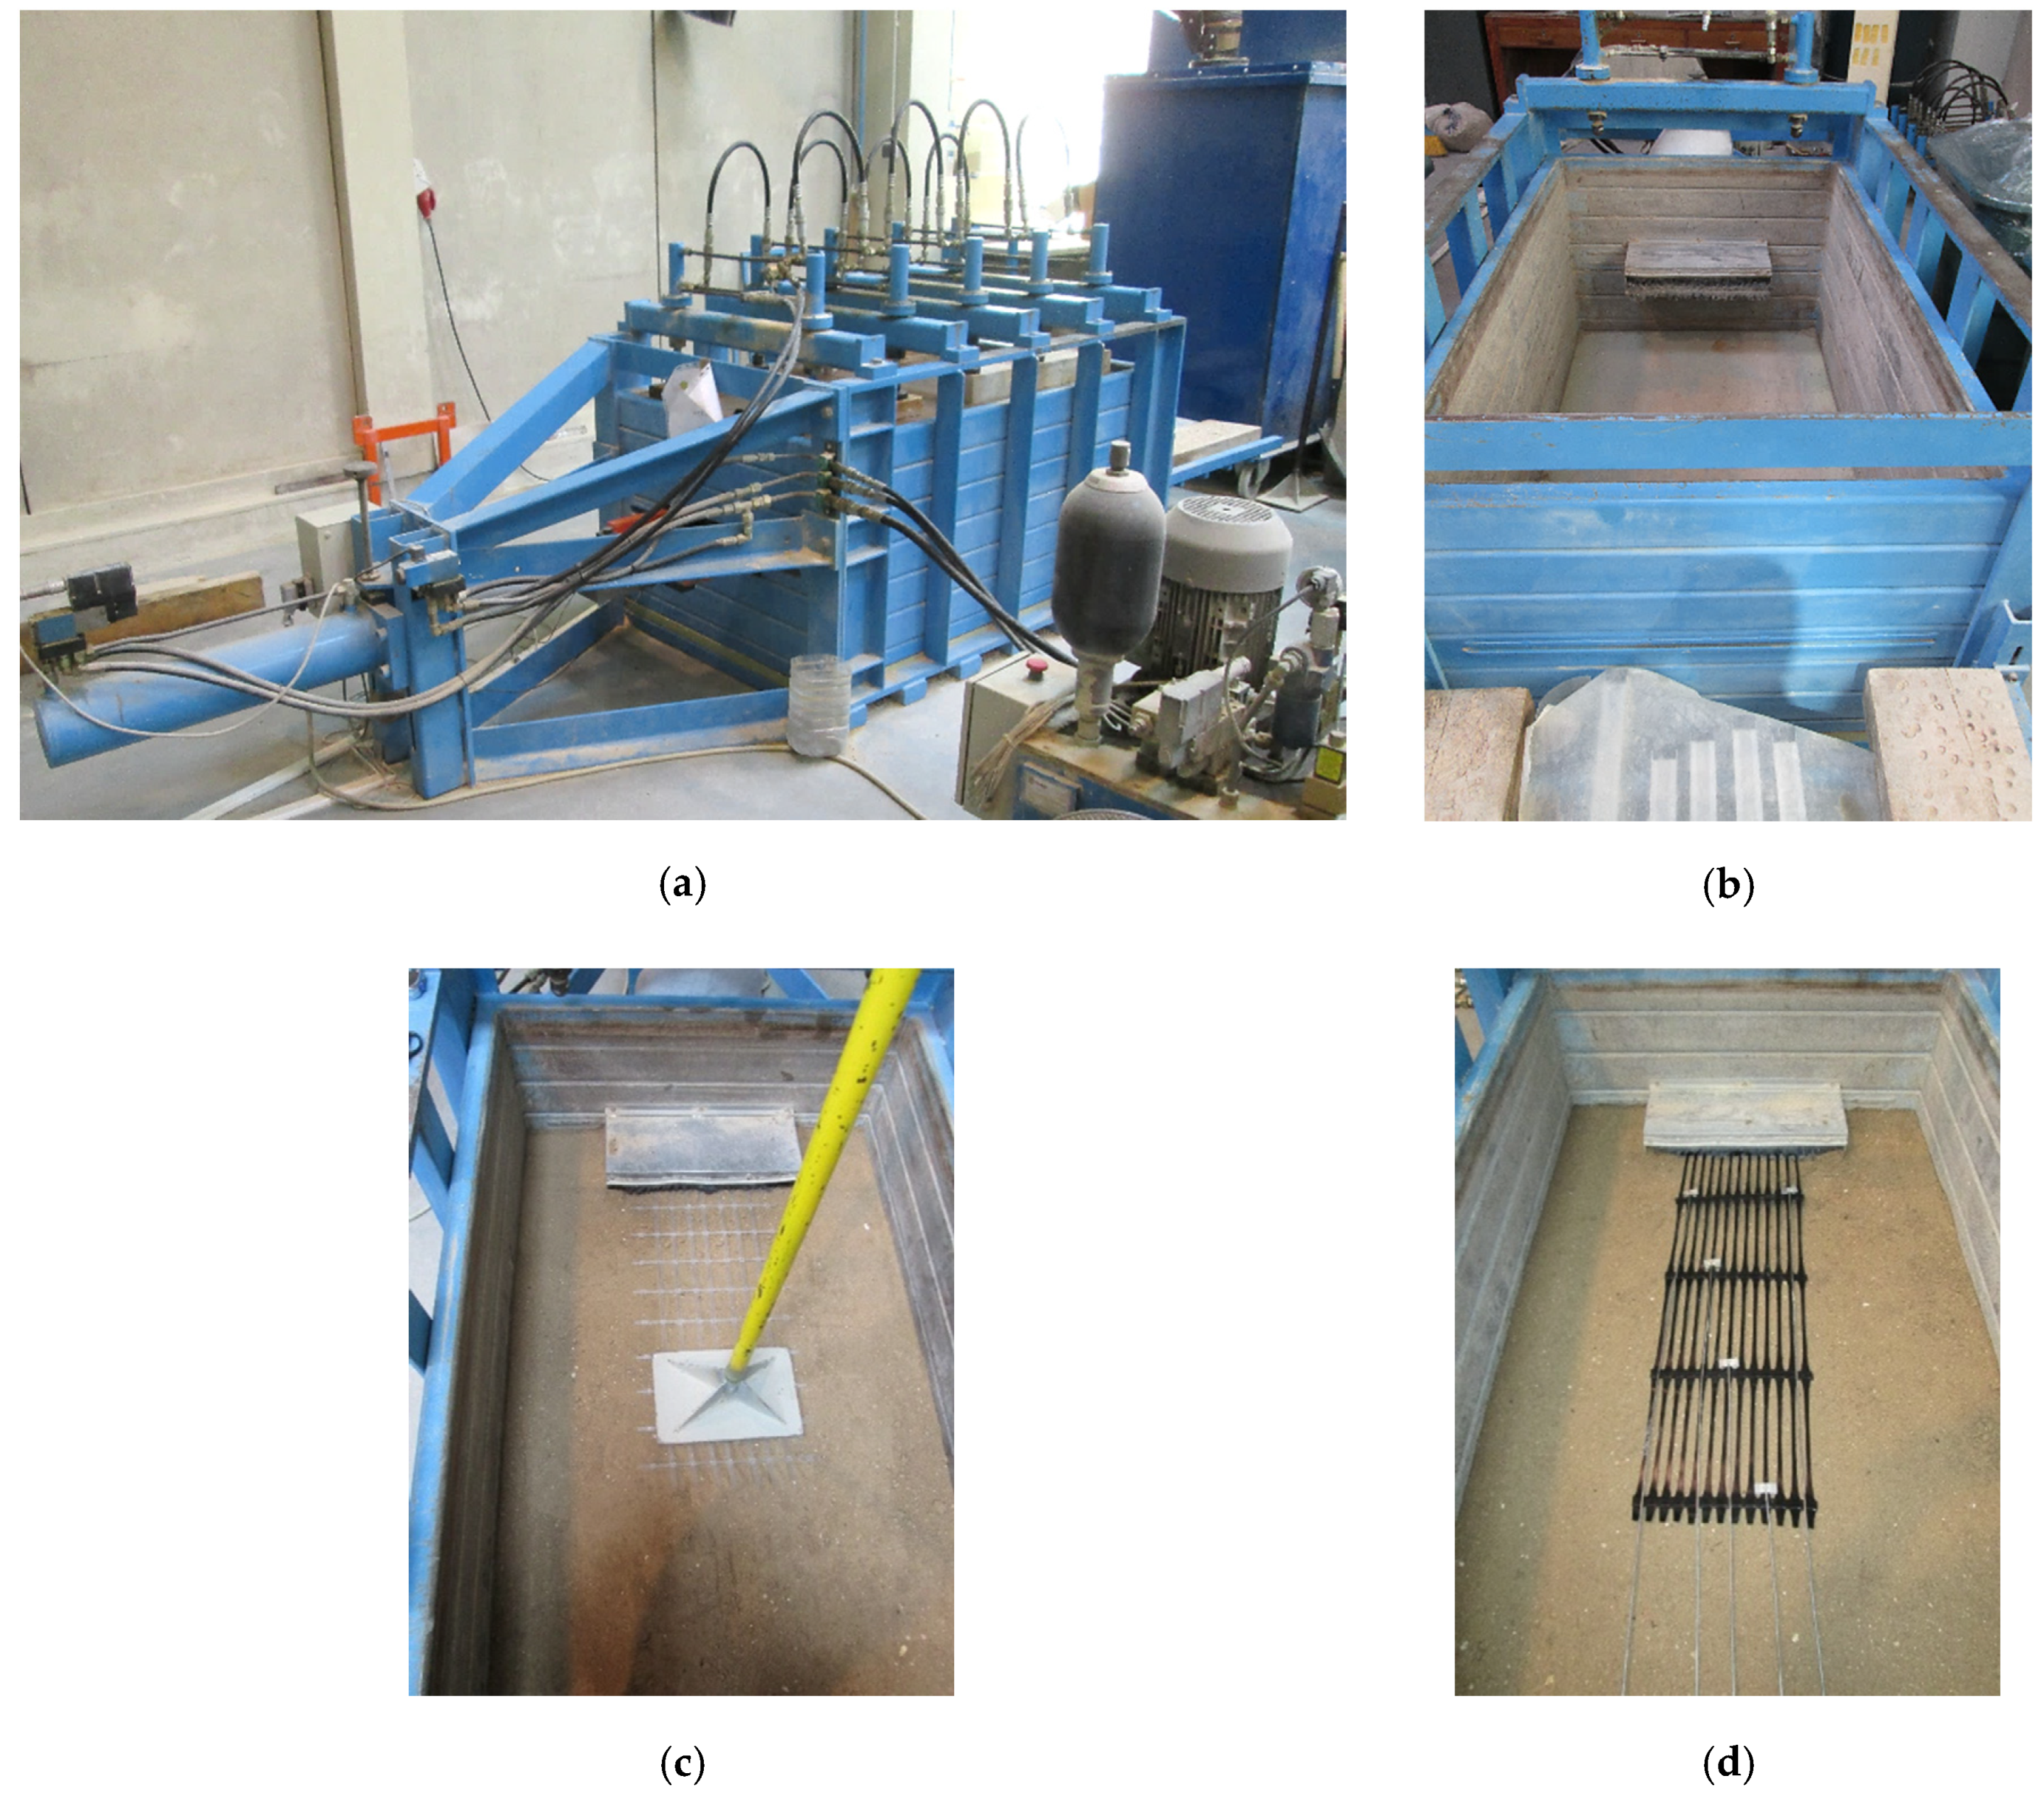
2.4. Pullout Test Apparatus and Test Procedures

Figure 4a presents an overall view of the large-scale pullout test apparatus used in this study. The pullout box consists of a modular structure with internal dimensions of 1.00 m wide, 1.53 m long and 0.80 m deep. A 0.20 m long sleeve is fixed to the front wall to minimise the frictional effects of this rigid boundary during testing (Figure 4b).
The C&D material was compacted inside the pullout box in several 0.15 m thick layers at the optimum moisture content (wopt = 9%) and at the dry density of 16.1 kN/m3 (i.e., 80% of its maximum dry density, based on the modified Proctor test), using an electric vibratory hammer. Once the first two layers were compacted, the geosynthetic specimen was clamped and laid over the C&D material, with the machine direction members oriented parallel to the pullout direction. For the geogrid GGR1 (Figure 4c), preliminary testing showed that the inextensible wires used to monitor the displacements throughout the length of the reinforcement had the potential to damage the geogrid ribs and lead to rupture of the junctions during testing. Hence, to avoid any reduction of the measured pullout resistance due to the presence of the inextensible wires, they were not used in these tests. In the tests involving the geogrid GGR2, a set of inextensible wires were attached to the specimen (Figure 4d) and connected to linear potentiometers placed at the back of the pullout box. Two additional layers of C&D material were then placed and compacted over the geosynthetic specimen, resulting in a total height of filling material of 0.60 m. To reduce the influence of the top boundary rigidity on the test results and attain more uniform distribution of the vertical load, a neoprene slab was placed on the top of the C&D material and beneath a wooden loading plate. The vertical load was applied by ten hydraulic jacks and monitored by a load cell.
The pullout force was applied to the geogrid specimen through a hydraulic system under displacement-controlled conditions (i.e., by adopting a constant displacement rate throughout the test) and the associated front displacement was measured by a linear potentiometer. During the tests, relevant parameters, such as the imposed vertical pressure, pullout load, front displacement of the geogrid specimen (i.e., displacement of the clamped end) and displacements along the length of the reinforcement (for GGR2) were continuously monitored, using an automatic data acquisition system. A more comprehensive description of the pullout test apparatus can be found elsewhere [36,39].

2.5. Test Programme

A summary of the test conditions adopted in the current study is presented in Table 5. As mentioned before, two different geogrids were tested (GGR1 and GGR2). To investigate the possible effect of specimen size on the measured data, different specimen dimensions were considered for both reinforcements (200 mm × 600 mm versus 250 mm × 750 mm for GGR1, and 200 mm × 600 mm versus 300 mm × 900 mm for GGR2), while keeping the ratio of the specimen confined length to width equal to three, as recommended by the European Standard [50]. The role of the vertical confining pressure (σv) on the GGR1 pullout behaviour was evaluated by imposing vertical stresses at the interface level of 10, 25 and 50 kPa. According to the European Standard [50], geosynthetic pullout tests involving free draining soils, where excess pore water pressures are not anticipated should be conducted at a constant displacement rate of 2 mm/min (±10%). However, the American Standard [51] suggests that the pullout force be applied at a slower rate of 1 mm/min (±10%). In order to determine whether the displacement rate affects the pullout test results, different displacement rates (dr) ranging from 1 to 4 mm/min were adopted in the tests involving the geogrid GGR2. To analyse the repeatability of results, the initial six tests (T1–T6) were carried out three times under identical conditions. Therefore, 22 pullout tests were performed in this study.

2.6. Processing of the Test Results

Based on the pullout load continuously monitored by the data acquisition system, the pullout force per unit width of the geogrid is evaluated and plotted against the front displacement of the geogrid specimen. The displacements over the geogrid length (only for GGR2 as mentioned in Section 2.4) recorded through linear potentiometers can be plotted for any value of the pullout force or front displacement. Graphs of all the relevant parameters (imposed vertical pressure, pullout load, front displacement of the geogrid specimen and displacements along the geogrid length) as a function of time can also be prepared.
In the design of geosynthetic-reinforced structures, such as retaining walls and slopes, one of the essential parameters is the geosynthetic-backfill material pullout interaction coefficient. The pullout interaction coefficient (fb) can be estimated as the ratio of the maximum shear stress mobilised at the backfill-geosynthetic interface during the pullout test (τp) to the direct shear strength of the backfill material (τs), under the same confining pressure:
f b = τ p τ s
The maximum shear stress developed at the interface during the pullout test can be determined as:
τ p = P R 2   L R
where PR is the pullout resistance (i.e., maximum pullout force per unit width of reinforcement) and LR is the confined length of the reinforcement at maximum pullout force.
The shear strength of the backfill material (τs) was evaluated through direct shear tests carried out on a large scale prototype. Details on these tests can be found in a previous publication [48].

3. Results and Discussion

In this section the results are presented and discussed, firstly, in terms of pullout force-displacement behaviour (Section 3.1, Section 3.2 and Section 3.3) and subsequently, regarding the values of the pullout interaction coefficient—Section 3.4 (see Figure 1).

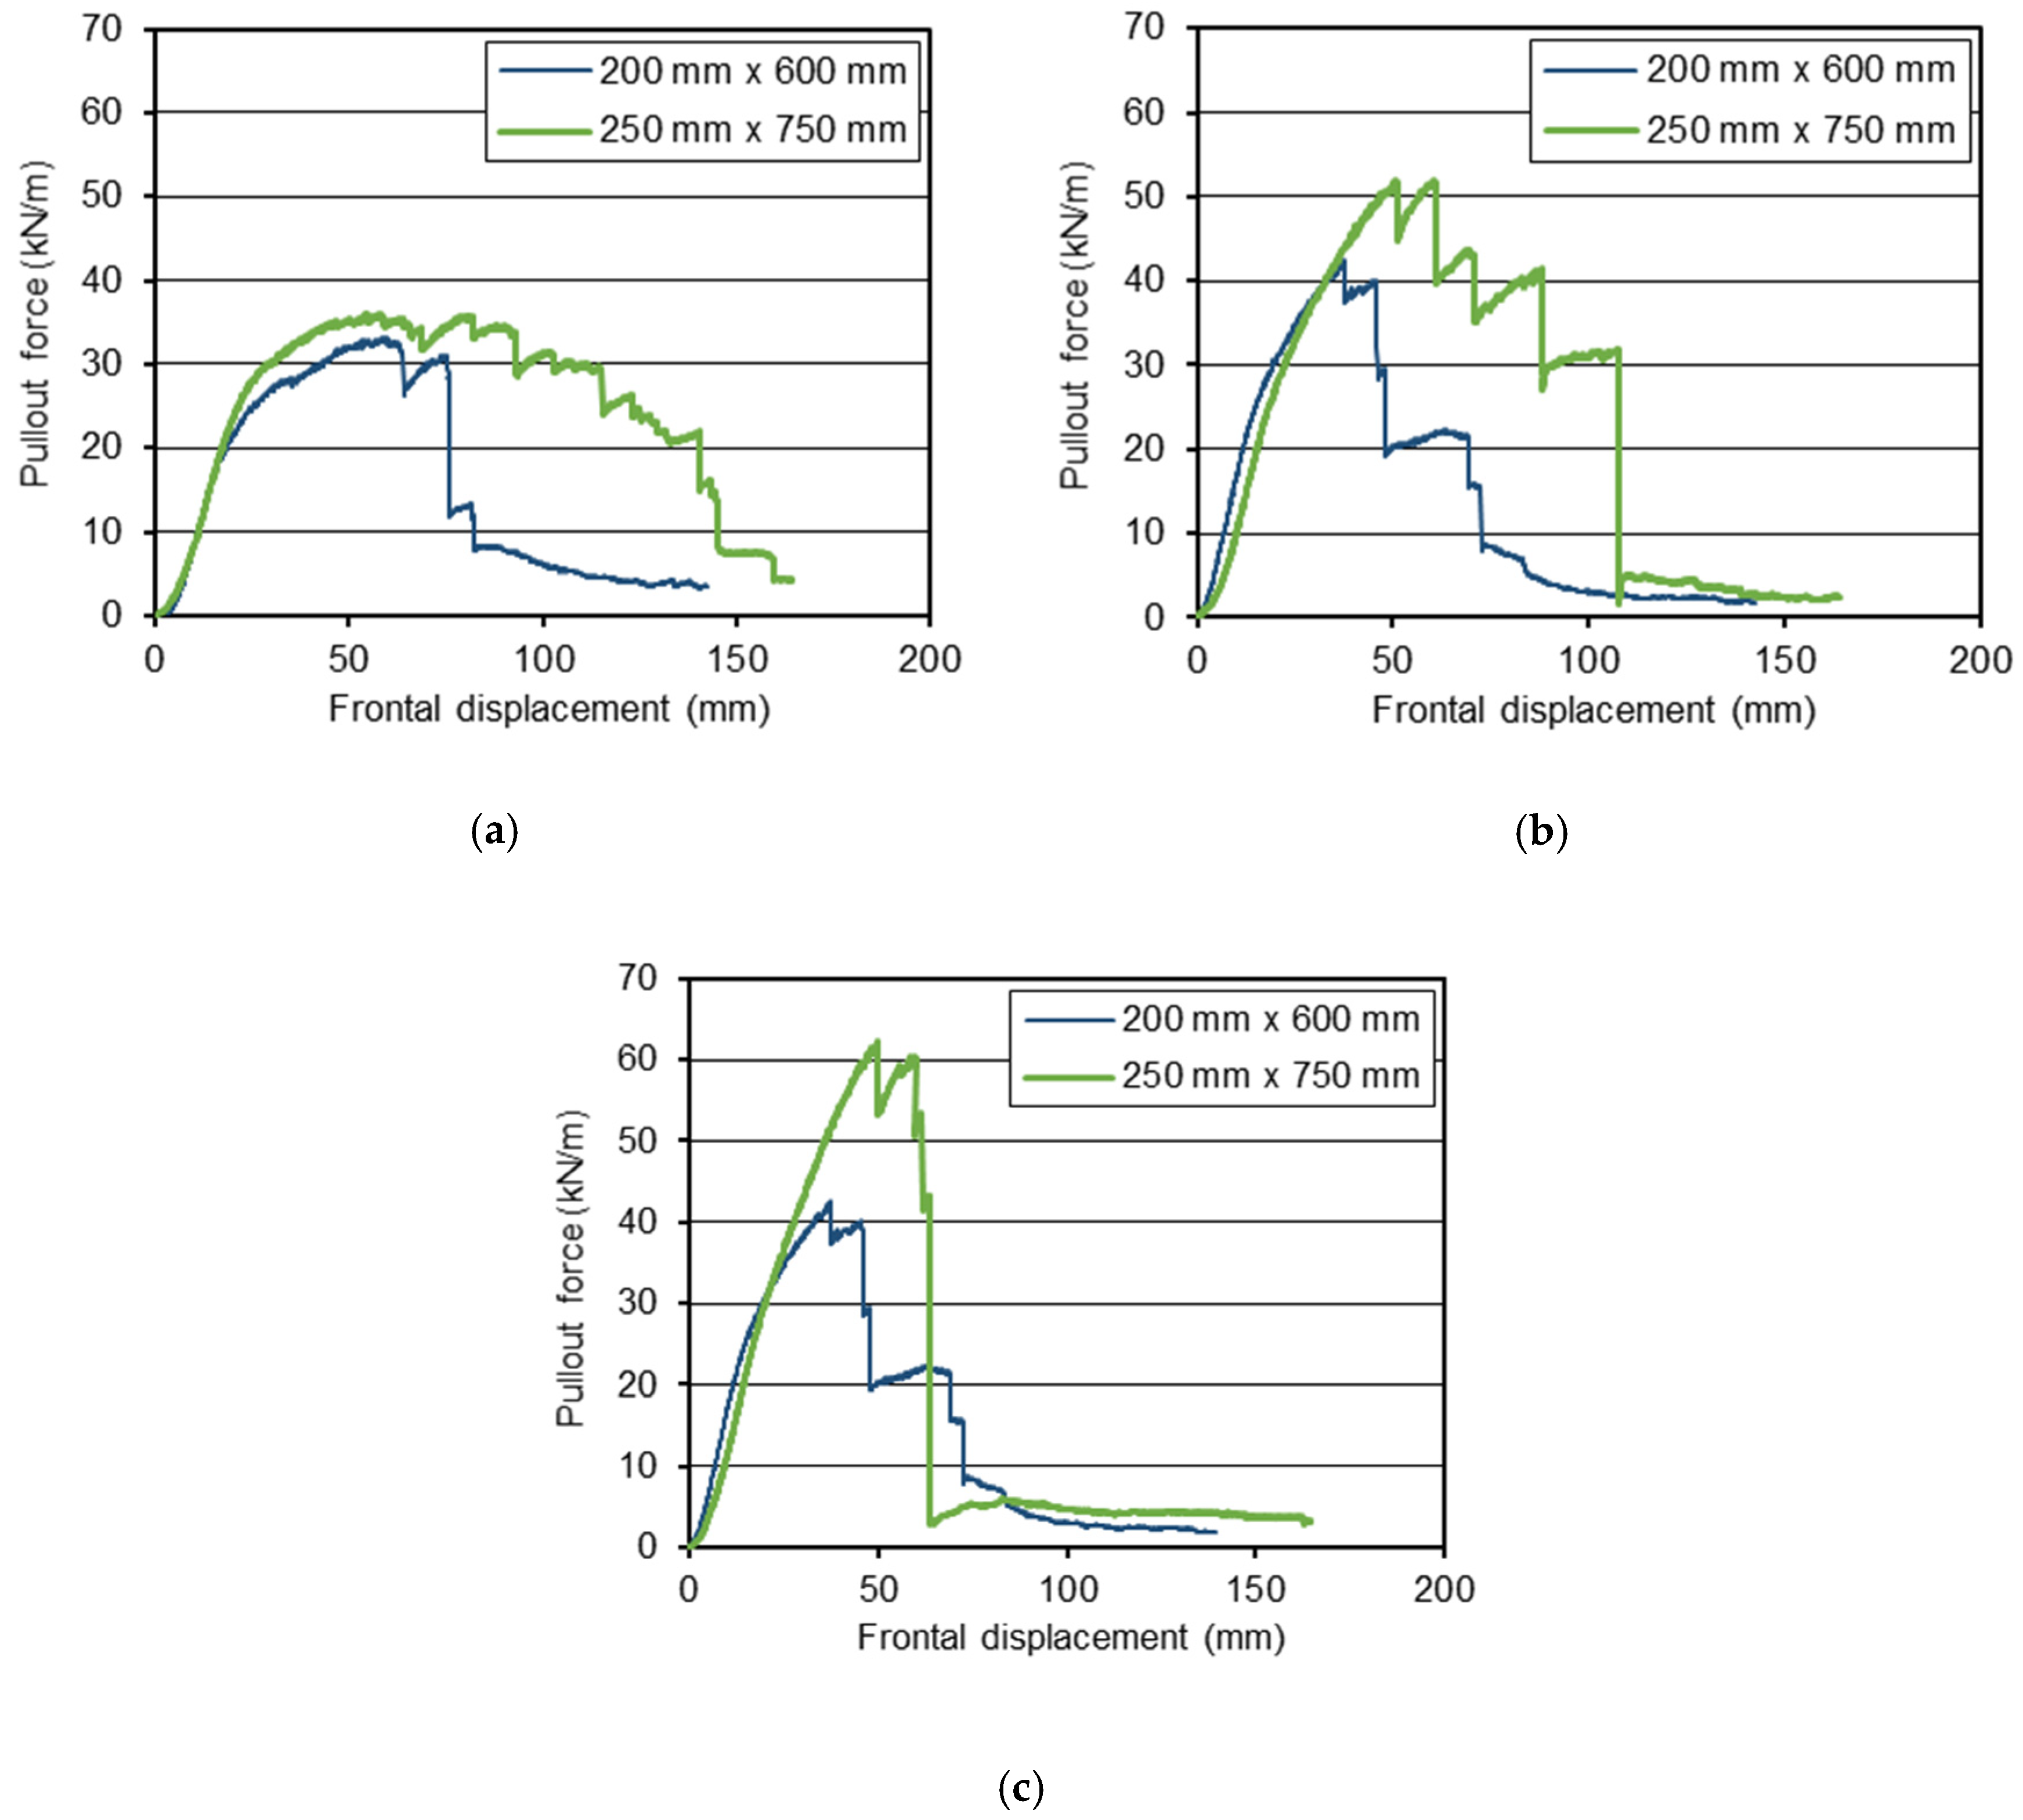
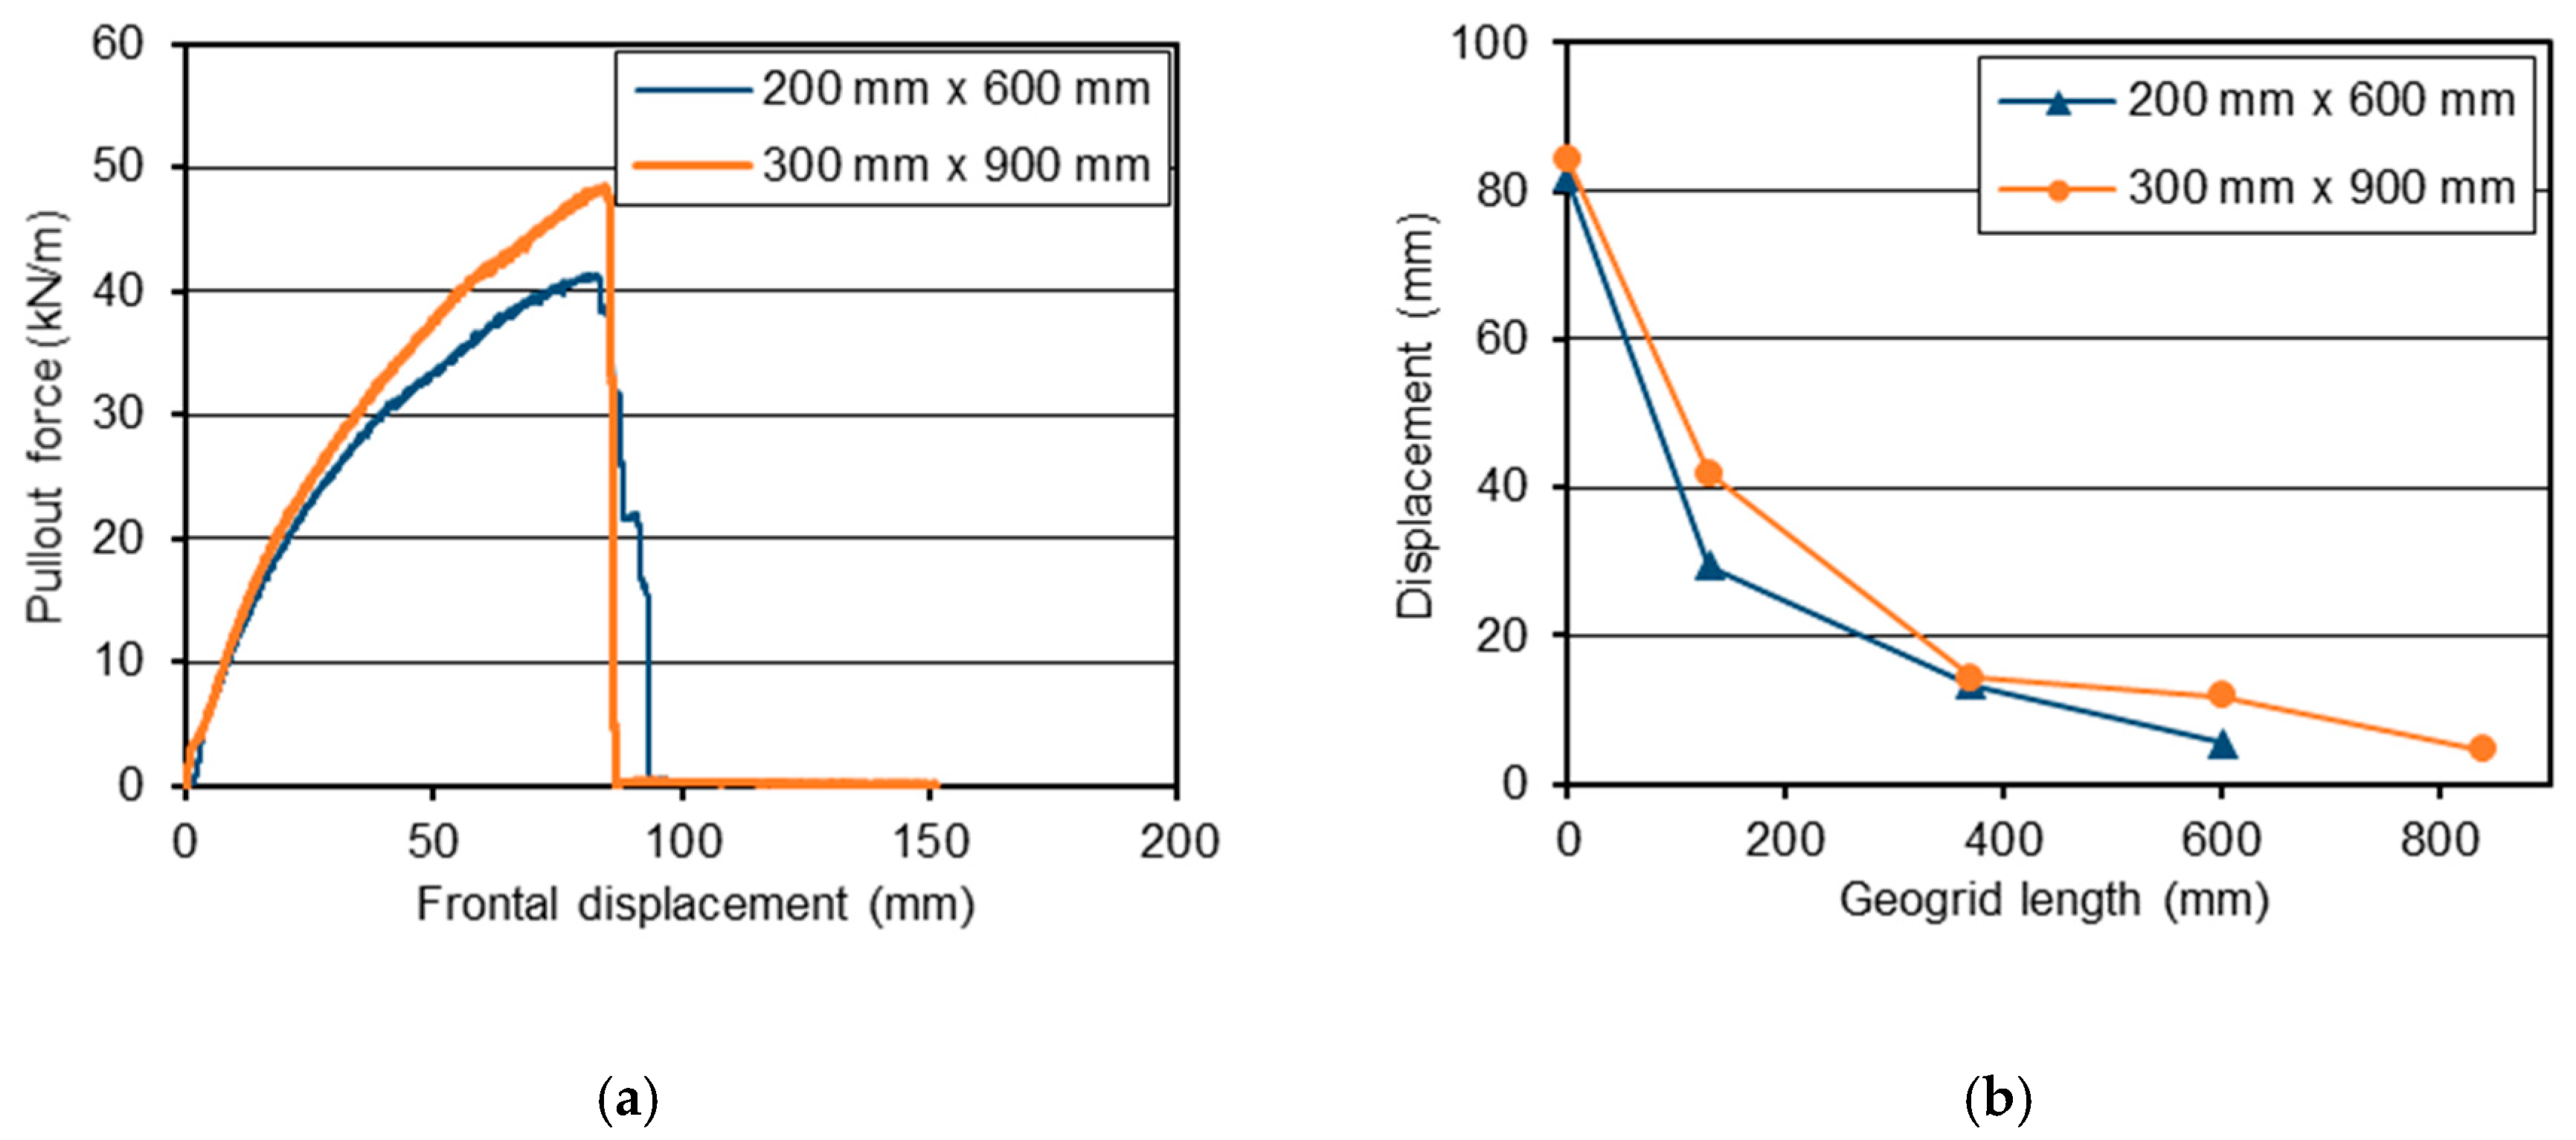
3.1. Effect of Specimen Size

Figure 5 shows the effect of specimen geometry on the variation of the pullout force with the frontal displacement for geogrid GGR1. Here, the three graphs illustrate the representative curves corresponding to different vertical confining pressures imposed at the interface level: 10 kPa (Figure 5a), 25 kPa (Figure 5b) and 50 kPa (Figure 5c).
The plotted data show that, regardless of the confining pressure applied in the tests, the increase in specimen size from 200 mm × 600 mm to 250 mm × 750 mm led to an increment in the peak pullout resistance of the geogrid. Moreover, the influence of specimen dimensions on the peak pullout resistance appears to be more significant at higher confining pressures. Under the lowest vertical pressure (10 kPa), the peak pullout resistance of the geogrid increased about 10% (on average) with the increase in specimen size, and the frontal displacement at peak load remained nearly constant (Figure 5a). However, for the vertical pressures of 25 kPa and 50 kPa, the increase in pullout resistance (associated with the increase in specimen size) was more pronounced (21% and 17%, respectively) and higher frontal displacements were required for mobilisation of the peak load when larger specimens were employed (Figure 5b,c).
It is well known that the pullout resistance of the geogrid is developed primarily by the combination of the passive resistance mobilised against the transverse members and the skin friction at both sides of the reinforcement. Therefore, the increase in the peak pullout resistance of the geogrid achieved when the longer specimens were used is associated with an increase in the surface area available for mobilisation of skin friction along the reinforcement, as well as an increment in the passive resistance provided by the recycled C&D material due to the presence of two additional transverse members contributing to the mobilised forces (the shorter specimens had 7 transverse members, whereas the longer specimens had 9 transverse members). Since the increase in the confining pressure leads to the increase in the passive resistance of recycled C&D material mobilised against the geogrid transverse members during pullout movement, greater increments in the pullout resistance were attained when the longer specimens were subjected to higher confining pressures of 25 and 50 kPa (Figure 5b,c).
The influence of specimen size on the pullout response of GGR2 was evaluated through pullout tests carried out under a vertical pressure of 10 kPa. The results presented in Figure 6a indicate that, similar to the trend observed for GGR1, the increase in specimen size resulted in an increment in the peak pullout resistance of the geogrid. This is mainly related to the fact that the number of transverse members (i.e., bearing members) increased when the specimen length changed from 600 to 900 mm (from 3 to 4 bars). Due to the importance of the passive resistance developed against those bars to the overall pullout resistance of the reinforcement, significantly greater (17%) peak pullout resistance was achieved when the 900 mm long specimen was tested. However, the frontal displacement at peak pullout load remained nearly constant in both tests.
The displacements recorded by the potentiometers throughout the length of the specimens at maximum pullout force are shown in Figure 6b. It can be noted that the total displacements measured at the front and rear ends of the reinforcement were rather similar for both specimens. Regardless of the specimen dimensions, the full length of the reinforcement was mobilised during testing, thus contributing to the mobilised forces. For the shorter specimen, the deformations (i.e., elongations) decreased progressively along the reinforcement length. For the longer specimen, the deformations at the front half of the reinforcement (i.e., the two sections located closer to the clamp system) were significantly greater than those at the back half of the geogrid.

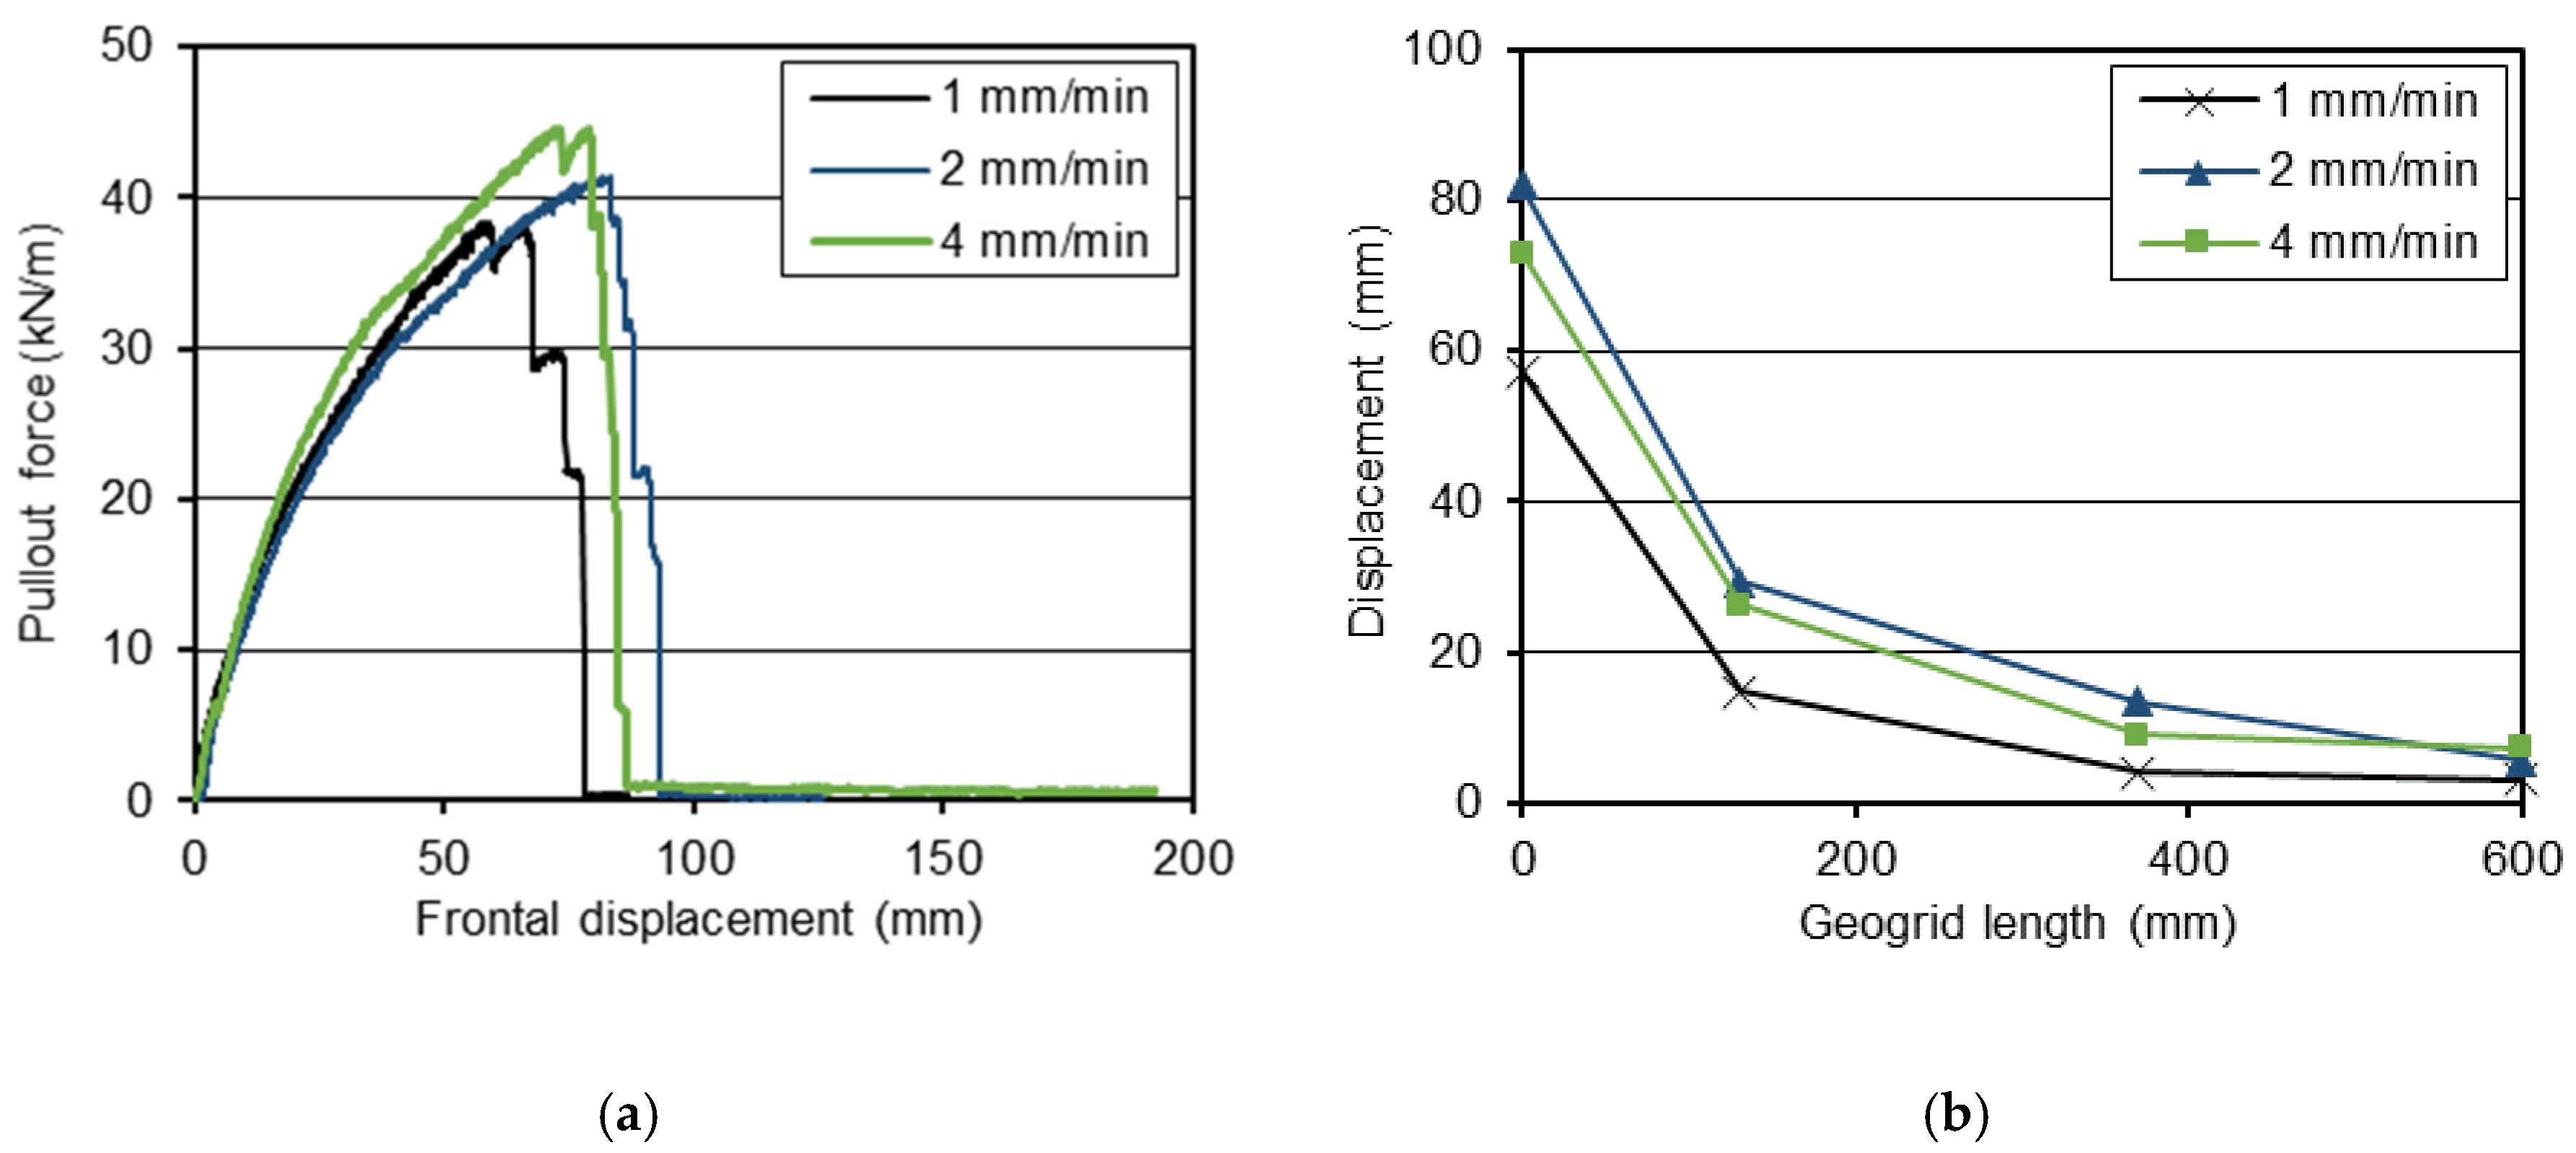
3.2. Effect of Displacement Rate

As mentioned previously, the influence of the displacement rate on the pullout test results involving the geogrid GGR2 was investigated by adopting clamp displacement rates of 1, 2 and 4 mm/min (tests T7 to T9). These tests were carried out under a vertical pressure of 10 kPa (at the interface level) and using 200 mm × 600 mm specimens (Table 5). The obtained pullout force—displacement curves and the profiles of the displacements recorded over the length of the geogrid at maximum pullout force are presented in Figure 7a,b, respectively. Regardless of the displacement rate adopted in the tests, all three specimens failed in tension. Nevertheless, the displacement rate affected the measured pullout resistance of the reinforcement (Figure 7a). In fact, for the conditions investigated, the peak pullout resistance increased progressively and up to 16.2% with increasing displacement rate. The variation of peak pullout resistance attributed to the increment in the displacement rate was more pronounced under lower displacement rates (i.e., 1–2 mm/min). Furthermore, the frontal displacement at peak increased considerably when the rate of displacement varied from 1 to 2 mm/min, but did not significantly change upon a further increase in the displacement rate (i.e., from 2 to 4 mm/min).
The displacements recorded by the potentiometers along the reinforcement length at peak pullout force (Figure 7b) indicate that the deformations induced by pullout loading were more significant along the first confined section of the geogrid and reduced progressively with increasing distance to the point of application of the pullout load (front geogrid end). As expected, the higher the frontal displacement at peak load, the greater the displacements mobilised over the geogrid length.
Previous studies have shown that, because of the intrinsic viscous, time-dependent response of polymeric geosynthetic reinforcements, the peak strength is sensitive to rate of loading and generally decreases with a reduction in the strain rate at failure [36,63]. Lopes and Ladeira [36] evaluated the influence of the displacement rate on the pullout test results of a uniaxial HDPE geogrid embedded in a gravelly sand. The authors observed a progressive increment in the measured pullout resistance of the geogrid with increasing displacement rate from 1.8 to 22 mm/min. Over the range investigated, the geogrid pullout resistance increased by up to 30%, whereas the displacements along the reinforcement resulting from elongation tended to decrease. Hirakawa et al. [63] investigated the loading rate effects on the tensile load-strain behaviour of different geosynthetics and found out that the rupture strength increases linearly with the logarithm of the strain rate at rupture. The results obtained in this study are in good agreement with these previous findings, showing that the strain rate influences the peak load measured in pullout tests, as well as the deformations along the reinforcement at maximum load.

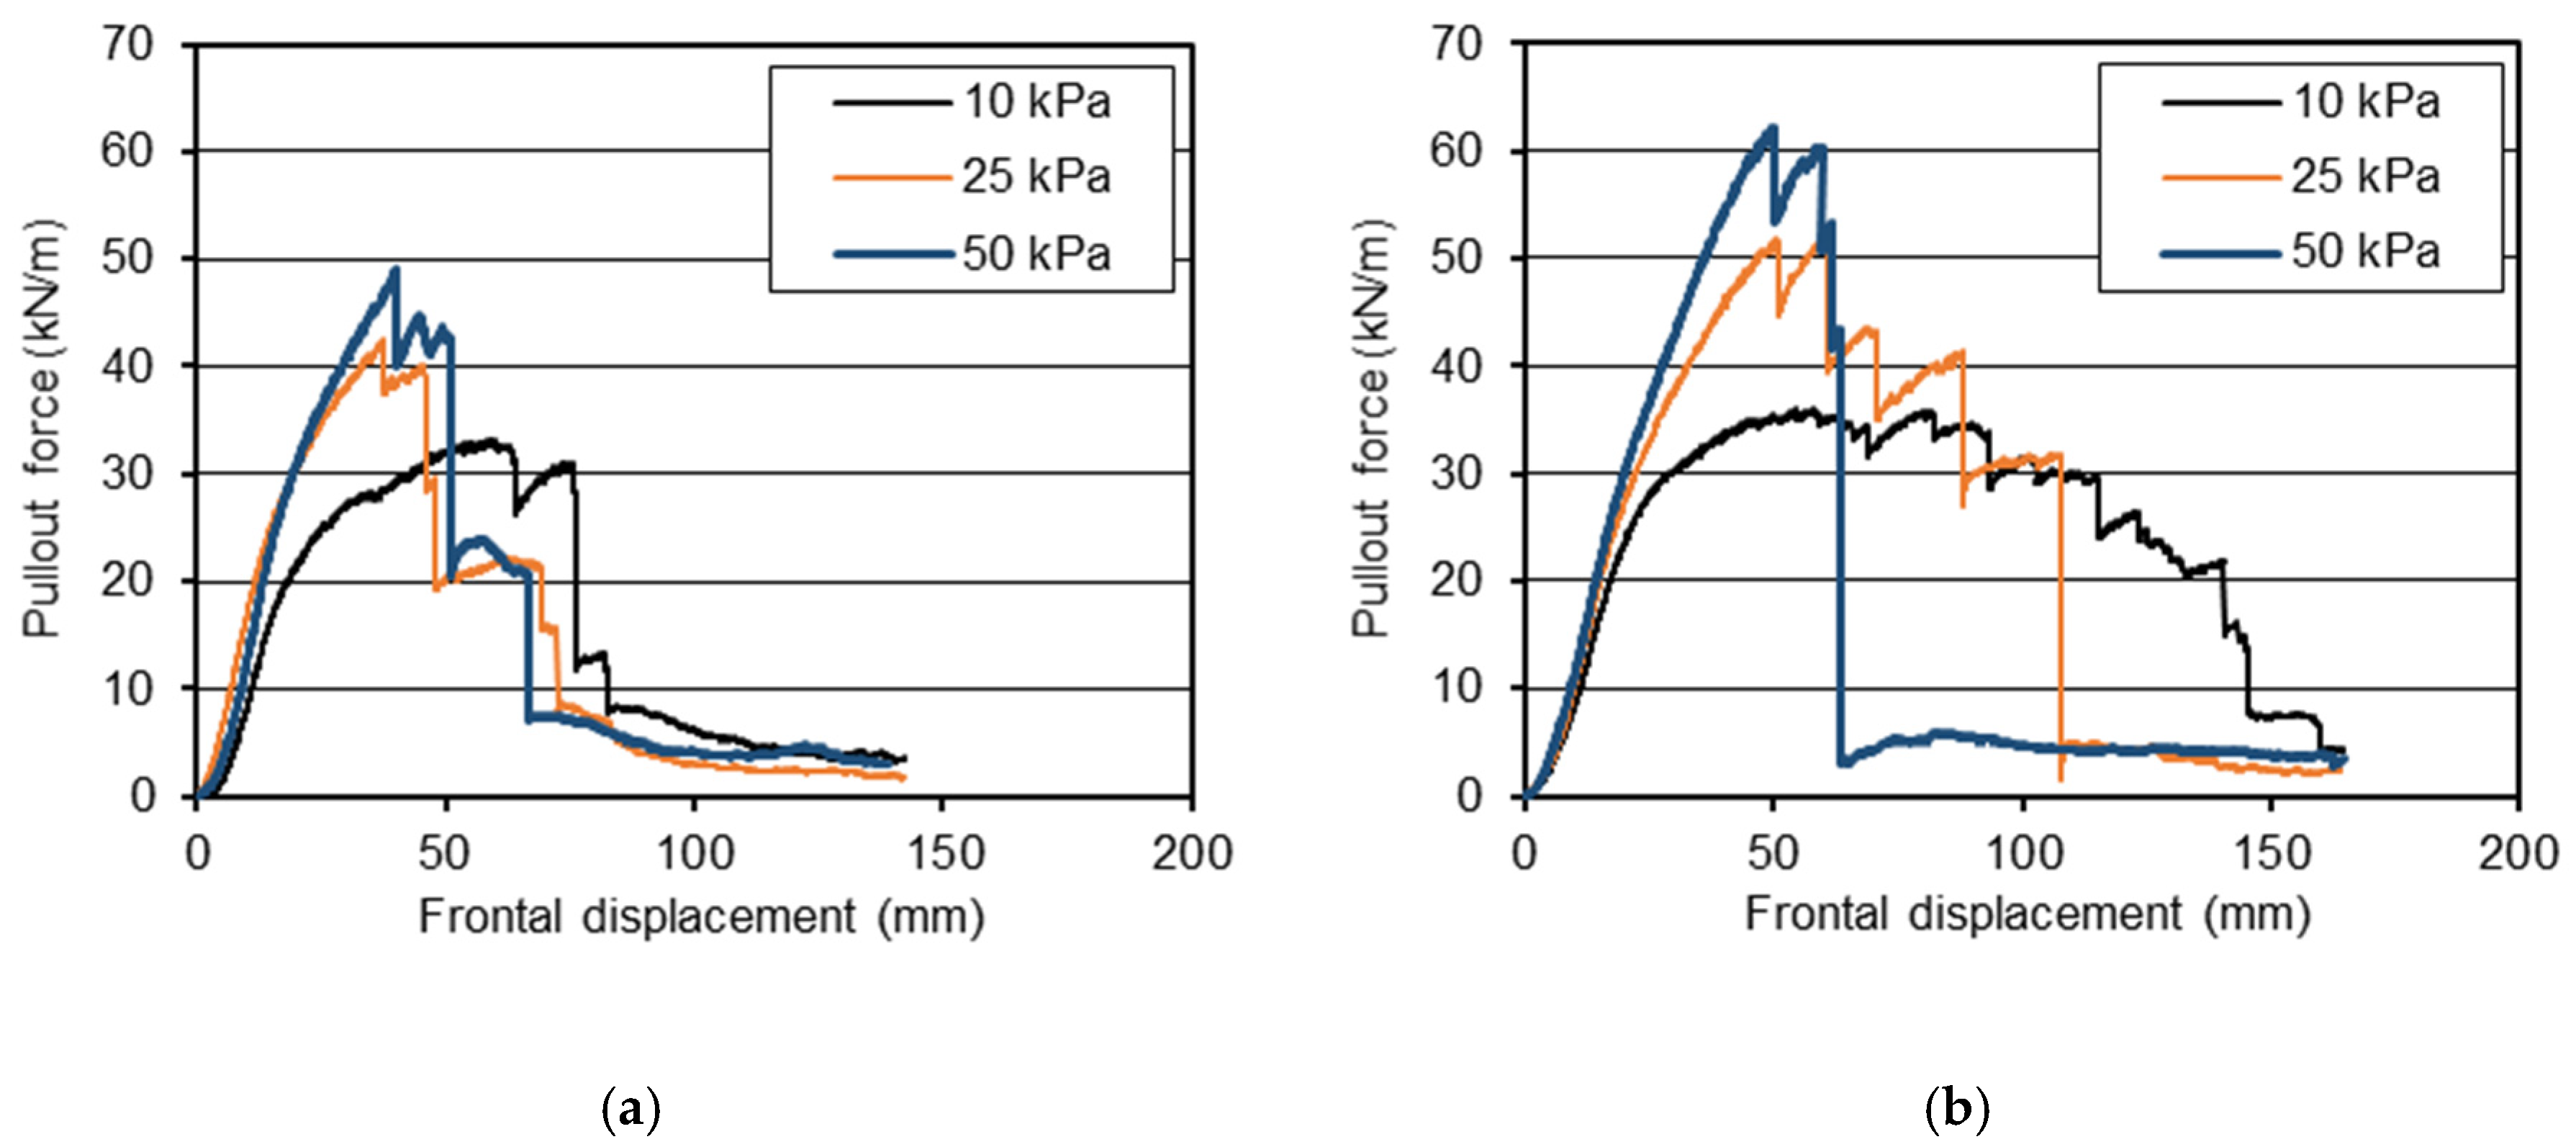
3.3. Effect of Confining Pressure

The effect of the vertical confining pressure on the pullout response of the geogrid GGR1 is shown in Figure 8. Figure 8a presents the pullout force—displacement curves from three representative specimens tested with initial dimensions of 200 mm × 600 mm and subjected to different vertical stresses (tests T1 to T3), whereas the results from tests carried out using 250 mm × 750 mm specimens (tests T4 to T6) are plotted in Figure 8b. These tests were conducted at a constant displacement rate of 2 mm/min (Table 5). As expected, the pullout resistance increased significantly with the confining pressure, regardless of the specimen dimensions. Indeed, when the confining pressure varied from 10 to 50 kPa, the pullout resistance of the reinforcement increased by 57% and 67% for 200 mm × 600 mm and 250 mm × 750 mm specimens, respectively. Moreover, the increment in pullout resistance associated with the confining pressure increase was more pronounced at lower confining pressures (i.e., 10 to 25 kPa).
Despite the fact that the increase in the confining pressure from 10 to 50 kPa may have reduced the tendency of the recycled C&D material to dilate, the increase in the passive resistance of the C&D material mobilised against the geogrid transverse bars (resulting from the confining pressure increase) led to substantially greater pullout resistance of the reinforcement.

3.4. Discussion

The pullout interaction coefficients for the interfaces studied herein were obtained based on Equations (1) and (2), using the results from pullout tests and those from large-scale direct shear tests on the recycled C&D material.
Table 6 summarises the pullout test results for each individual test specimen, including the pullout resistance (PR) and corresponding frontal displacement (dPR), the failure mode (i.e., pullout or tensile failure) observed in the test, the pullout interaction coefficient (fb), as well as the values of τp and τs used in its calculation. Also shown in this table are the average values of PR, dPR and fb from the repeatability tests. Values in brackets in the test designation refers to the sample number. The analysis of the results summarised in Table 6 should be simultaneously performed with Table 5.
It can be observed that the interaction coefficients for the interface involving the laid and welded PET geogrid (GGR1) ranged from 0.79 to 1.35, whereas the values varied from 1.13 to 1.57 for the interface involving the HDPE geogrid (GGR2).
On average the values of fb decreased with increasing confining pressure, regardless of specimen dimensions, which is consistent with the findings of the study by Mohiuddin [64] involving cohesive soil-geosynthetic interfaces.
The increase in the specimen size resulted in an increment in the pullout resistance, PR, for both geogrids (Table 6). However, it should be noted that the confinement length of the geogrid at maximum pullout force, LR, depends on the geogrid length, L, and frontal displacement, dPR, (LR = L-dPR) being higher when the samples are longer. This leads to maximum shear stress (τp) variations and, on average, to its decrease as the sample size increases. According to Equation (1), the decrease of the maximum shear stress mobilised at the interface (τp) induces the reduction of the pullout coefficient, fb. Thus, on average the values of fb decreased when the geogrid specimen size increased.
Comparing the results of tests T7, T8 and T9 carried out on GGR2 samples with dimensions of 200 mm × 600 mm, one can conclude that the pullout resistance (PR) increased with increasing displacement rate. Similar trend was observed for the pullout interaction coefficient (fb). These results follow the know trend for soil-geogrid interfaces [36,63].
The values of fb obtained in this study are generally greater than or equal to the values usually reported in the literature for soil-geosynthetic and recycled material-geosynthetic interfaces. Vieira et al. [20] reported values in the range 0.58–0.63 for interfaces between two geogrids and a fine-grain C&D recycled material under normal stress of approximately 31 kPa. Soleimanbeigi et al. [49] found that the interaction coefficient for reinforced recycled concrete aggregate decreases with increasing normal stress and is lower than 0.5.
Goodhue et al. [65] obtained fb values ranging between 0.25 and 1.4 for different soil-geosynthetic interfaces involving a uniformly-graded quartz sand. Mohiuddin [64] reported values in the range of 0.44–1.04 for a variety of geosynthetics tested in a cohesive soil. Tang et al. [66] investigated the interaction between different geogrids and dense-graded crushed stone and obtained pullout interaction coefficients in the range of 0.62–1.00. Hsieh et al. [67] reported values of fb ranging from 0.18 and 1.25 derived from pullout tests of geosynthetics embedded in granular soils.
It is worth noting that most of the fb values attained in this study exceed the values typically assumed in the design of geosynthetic-reinforced soil structures in the absence of test data.

4. Conclusions

An experimental study was carried out to assess the effects of different parameters with influence on the pullout resistance of geogrids (namely, the geogrid specimen size, the displacement rate and the normal stress) when they are embedded in a C&D recycled material. Previous studies on the pullout behaviour of interfaces between geosynthetics and C&D recycled materials have been performed following the guidance for common backfill materials so, it is important to evaluate whether some assumptions are still valid for alternative backfills. The most relevant findings of the study are listed below.
Regardless of the vertical confining pressure imposed in the tests (10, 25 or 50 kPa), the peak pullout resistance of the geogrids increased with the specimen size. This increment was more pronounced at higher confining pressures (i.e., 25 and 50 kPa).
The displacement rate adopted in the pullout tests affected the measured pullout resistance of the HDPE geogrid (GGR2). This is related to the intrinsic viscous response of polymeric geosynthetics under tensile loads (particularly for geosynthetics manufactured from HDPE). For the conditions investigated in this study, the peak pullout resistance of GGR2 increased by up to 16% with increasing displacement rate (from 1 mm/min to 4 mm/min).
The pullout resistance of the geogrid is positively correlated to the confining pressure acting at the interface level. When the confining pressure varied from 10 to 50 kPa, the peak pullout resistance of the geogrid GGR1 increased by 57% (for 200 mm × 600 mm specimens) and 67% (for 250 mm × 750 mm specimens), which is associated with the increase in the passive resistance of the recycled C&D material developed against the geogrid transverse members.
The values of pullout interaction coefficient, fb, obtained in this study are generally greater than the values usually reported in the literature for soil-geosynthetic and recycled material-geosynthetic interfaces. The pullout interaction coefficients, fb, for the interface involving the PET geogrid (GGR1) ranged from 0.79 to 1.35. For the HDPE geogrid (GGR2), the values of fb were generally higher, ranging from 1.13 to 1.57.
Although the pullout resistance of the geogrids has increased with the specimen size, the pullout interaction coefficient, fb, showed in general the opposite trend.
The increase in the displacement rate led to both an increase in the geogrids pullout resistance and an increase in the pullout interaction coefficient, fb.
Albeit the pullout resistance of the geogrids is positively correlated to the confining pressure, on average and regardless of specimen size the pullout interaction coefficient, fb, decreased with this parameter.
This study has confirmed the expected trends regarding the pullout resistance: higher pullout resistance achieved in laboratory pullout tests for higher confining pressure, displacement rate and specimen size. However, the conclusions concerning pullout interaction coefficient, fb, are very interesting and should be properly considered. Even keeping the ratio of the specimen confined length to width equal to three, as recommended by the European Standard (ASTM standard recommends two), the pullout results are dependent upon geogrid length. It is important to point out that higher pullout resistance (expected in longer geogrids) does not imply higher pullout interaction coefficient. The increase in the confining pressure also led to the decrease of fb.
In the design of geosynthetic-reinforced structures one of the essential parameters is the pullout interaction coefficient, fb. The fb values attained in this study exceed the values typically assumed in the design in the absence of test data (0.5–0.7), which allows to follow the usual practices when the conventional backfill materials (soils) are used.
It should be noted that while the results of this study support the feasibility of using C&D recycled materials in the construction of geogrid-reinforced structures, with obvious benefits in terms of environmental protection and sustainability, the conclusions are limited to the utilized materials and procedures followed.

Author Contributions

C.S.V.: Conceptualization; Funding acquisition; Methodology; Project administration; Supervision; Writing—review & editing. P.P.: Methodology; Data collection; Data curation. F.F.: Data curation; Formal analysis; Writing—original draft preparation. M.d.L.L.: Funding acquisition; Methodology. All authors have read and agreed to the published version of the manuscript.

Funding

This work was financially supported by: Project PTDC/ECI-EGC/30452/2017—POCI-01-0145-FEDER-030452—funded by FEDER funds through COMPETE2020—Programa Operacional Competitividade e Internacionalização (POCI) and by national funds (PIDDAC) through FCT/MCTES.
Sustainability 12 03825 i001

Acknowledgments

The authors would like to acknowledge the contribution of the company RCD for the supply of the C&D materials and Naue and Tensar International for providing geogrid samples.

Conflicts of Interest

The authors declare no conflict of interest. The supplier companies had no role in the design of the study; in the collection, analyses, or interpretation of data; in the writing of the manuscript, or in the decision to publish the results.

References

  1. European Commission, Competitiveness of the Construction Industry. A Report drawn up by the Working Group for Sustainable Construction with Participants from the European Commission, Member States and Industry; European Commission: Brussels, Belgium, 2001. [Google Scholar]
  2. EC DGE. European Commission Directorate-General for Environment, Service Contract on Management of Construction and Demolition Waste SR1 Final Report. Task 2-Study; EU publications: Brussels, Belgium, 2011. [Google Scholar]
  3. European Commission. EU Construction & Demolition Waste Management Protocol. Available online: https://ec.europa.eu/growth/content/eu-construction-and-demolition-waste-protocol-0_en (accessed on 4 April 2020).
  4. Basu, D.; Misra, A.; Puppala, A.J. Sustainability and geotechnical engineering: Perspectives and review. Can. Geotech. J. 2014, 52, 96–113. [Google Scholar] [CrossRef]
  5. Vieira, C.S.; Pereira, P.M. Use of recycled construction and demolition materials in geotechnical applications: A review. Resour. Conserv. Recycl. 2015, 103, 192–204. [Google Scholar] [CrossRef]
  6. Gomes Correia, A.; Winter, M.G.; Puppala, A.J. A review of sustainable approaches in transport infrastructure geotechnics. Transp. Geotech. 2016, 7, 21–28. [Google Scholar] [CrossRef] [Green Version]
  7. Dhir, R.K.; Brito, J.; Silva, R.V.; Lye, C.Q. Sustainable Construction Materials; Woodhead Publishing: Cambridge, UK, 2019; p. 652. [Google Scholar]
  8. Henzinger, C.; Heyer, D. Soil improvement using recycled aggregates from demolition waste. Proc. Inst. Civ. Eng. Ground Improv. 2018, 171171, 74–81. [Google Scholar] [CrossRef]
  9. Kianimehr, M.; Shourijeh, P.T.; Binesh, S.M.; Mohammadinia, A.; Arulrajah, A. Utilization of recycled concrete aggregates for light-stabilization of clay soils. Constr. Build. Mater. 2019, 227, 116792. [Google Scholar] [CrossRef]
  10. Rahman, M.A.; Imteaz, M.; Arulrajah, A.; Disfani, M.M. Suitability of recycled construction and demolition aggregates as alternative pipe backfilling materials. J. Clean. Prod. 2014, 66, 75–84. [Google Scholar] [CrossRef]
  11. Vieira, C.S.; Lopes, M.L.; Cristelo, N. Geotechnical Characterization of Recycled C&D Wastes for Use as Trenches Backfilling. In Proceedings of the International Conference WASTES: Solutions, Treatments and Opportunities; CRC Press: Boca Raton, FL, USA, 2018; pp. 175–182. [Google Scholar]
  12. Del Rey, I.; Ayuso, J.; Barbudo, A.; Galvín, A.P.; Agrela, F.; Brito, J. Feasibility study of cement-treated 0–8 mm recycled aggregates from construction and demolition waste as road base layer. Road Mater. Pavement Des. 2016, 17, 678–692. [Google Scholar] [CrossRef]
  13. Tavira, J.; Jiménez, J.R.; Enrique, F.; Ledesma, E.F.; López-Uceda, A.; Ayuso, J. Real-scale study of a heavy traffic road built with in situ recycled demolition waste. J. Clean. Prod. 2020, 248, 119219. [Google Scholar] [CrossRef]
  14. Yaghoubi, E.; Arulrajah, A.; Choy, W.Y.-C.; Horpibulsuk, S. Stiffness properties of recycled concrete aggregate with polyethylene plastic granules in unbound pavement applications. J. Mater. Civ. Eng. 2017, 29, 04016271. [Google Scholar] [CrossRef]
  15. Pereira, P.M.; Ferreira, F.B.; Vieira, C.S.; Lopes, M.L. Use of Recycled C&D Wastes in Unpaved Rural and Forest Roads—Feasibility Analysis. In Proceedings of the International Conference WASTES: Solutions, Treatments and Opportunities; CRC Press: Boca Raton, FL, USA, 2019; pp. 161–167. [Google Scholar]
  16. Freire, A.C.; Neves, J.M.C.; Roque, A.J.; Martins, I.M.; Antunes, M.L. Feasibility study of milled and crushed reclaimed asphalt pavement for application in unbound granular layers. Road Mater. Pavement Des. 2019, 1–21. [Google Scholar] [CrossRef]
  17. Plati, C.; Cliatt, B. A Sustainability Perspective for Unbound Reclaimed Asphalt Pavement (RAP) as a Pavement Base Material. Sustainability 2019, 11, 78. [Google Scholar] [CrossRef] [Green Version]
  18. Zhang, J.; Ding, L.; Li, F.; Peng, J. Recycled aggregates from construction and demolition wastes as alternative filling materials for highway subgrades in China. J. Clean. Prod. 2020, 255, 120223. [Google Scholar] [CrossRef]
  19. Santos, E.C.; Palmeira, E.M.; Bathurst, R.J. Performance of two geosynthetic reinforced walls with recycled construction waste backfill and constructed on collapsible ground. Geosynth. Int. 2014, 21, 256–269. [Google Scholar] [CrossRef]
  20. Vieira, C.S.; Pereira, P.M.; Lopes, M.L. Recycled construction and demolition wastes as filling material for geosynthetic reinforced structures. Interface properties. J. Clean. Prod. 2016, 124, 299–311. [Google Scholar] [CrossRef]
  21. Vieira, C.S.; Pereira, P.M. Use of mixed construction and demolition recycled materials in geosynthetic reinforced embankments. Indian Geotech. J. 2018, 48, 279–292. [Google Scholar] [CrossRef]
  22. Vieira, C.S.; Ferreira, F.B.; Pereira, P.M.; Lopes, M.L. Pullout behaviour of geosynthetics in a recycled construction and demolition material—Effects of cyclic loading. Transp. Geotech. 2020, 23, 100346. [Google Scholar] [CrossRef]
  23. Poon, C.S.; Chan, D. Feasible use of recycled concrete aggregates and crushed clay brick as unbound road sub-base. Constr. Build. Mater. 2006, 20, 578–585. [Google Scholar] [CrossRef]
  24. Jiménez, J.R.; Ayuso, J.; Galvín, A.P.; López, M.; Agrela, F. Use of mixed recycled aggregates with a low embodied energy from non-selected CDW in unpaved rural roads. Constr. Build. Mater. 2012, 34, 34–43. [Google Scholar] [CrossRef]
  25. Rodrigues, F.; Carvalho, M.T.; Evangelista, L.; Brito, J. Physical-chemical and mineralogical characterization of fine aggregates from construction and demolition waste recycling plants. J. Clean. Prod. 2013, 52, 438–445. [Google Scholar] [CrossRef] [Green Version]
  26. Palmeira, E.M. Soil-geosynthetic interaction: Modelling and analysis. Geotext. Geomembr. 2009, 27, 368–390. [Google Scholar] [CrossRef]
  27. Lopes, M.L. Soil-Geosynthetic Interaction. In Handbook of Geosynthetic Engineering; Shukla, S.K., Ed.; ICE Publishing: London, UK, 2012; pp. 45–66. [Google Scholar]
  28. Vieira, C.S.; Lopes, M.L.; Caldeira, L.M. Sand-geotextile interface characterisation through monotonic and cyclic direct shear tests. Geosynth. Int. 2013, 20, 26–38. [Google Scholar] [CrossRef]
  29. Ferreira, F.B.; Vieira, C.S.; Lopes, M.L. Direct shear behaviour of residual soil–geosynthetic interfaces – influence of soil moisture content, soil density and geosynthetic type. Geosynth. Int. 2015, 22, 257–272. [Google Scholar] [CrossRef]
  30. Khoury, C.N.; Miller, G.A.; Hatami, K. Unsaturated soil-geotextile interface behavior. Geotext. Geomembr. 2011, 29, 17–28. [Google Scholar] [CrossRef]
  31. Liu, C.-N.; Zornberg, J.G.; Chen, T.-C.; Ho, Y.-H.; Lin, B.-H. Behavior of geogrid-sand interface in direct shear mode. J. Geotech. Geoenvironmental Eng. 2009, 135, 1863–1871. [Google Scholar] [CrossRef]
  32. Lopes, M.L.; Ferreira, F.B.; Carneiro, J.R.; Vieira, C.S. Soil-geosynthetic inclined plane shear behavior: Influence of soil moisture content and geosynthetic type. Int. J. Geotech. Eng. 2014, 8, 335–342. [Google Scholar] [CrossRef] [Green Version]
  33. Ferreira, F.B.; Vieira, C.S.; Lopes, M.L. Soil-Geosynthetic Interface Strength Properties from Inclined Plane and Direct Shear Tests—A Comparative Analysis. In Proceedings of GA 2016-6th Asian Regional Conference on Geosynthetics: Geosynthetics for Infrastructure Development; Indian Chapter of International Geosynthetics Society: New Delhi, India, 2016. [Google Scholar]
  34. Pitanga, H.N.; Gourc, J.P.; Vilar, O.M. Enhanced measurement of geosynthetic interface shear strength using a modified inclined plane device. Geotech. Test. J. 2011, 34, 643–652. [Google Scholar]
  35. Briançon, L.; Girard, H.; Gourc, J.P. A new procedure for measuring geosynthetic friction with an inclined plane. Geotext. Geomembr. 2011, 29, 472–482. [Google Scholar] [CrossRef]
  36. Lopes, M.L.; Ladeira, M. Influence of the confinement, soil density and displacement rate on soil-geogrid interaction. Geotext. Geomembr. 1996, 14, 543–554. [Google Scholar] [CrossRef]
  37. Raju, D.M.; Fannin, R.J. Load-strain-displacement response of geosynthetics in monotonic and cyclic pullout. Can. Geotech. J. 1998, 35, 183–193. [Google Scholar] [CrossRef]
  38. Moraci, N.; Recalcati, P. Factors affecting the pullout behaviour of extruded geogrids embedded in a compacted granular soil. Geotext. Geomembr. 2006, 24, 220–242. [Google Scholar] [CrossRef]
  39. Ferreira, F.B.; Vieira, C.S.; Lopes, M.L.; Carlos, D.M. Experimental investigation on the pullout behaviour of geosynthetics embedded in a granite residual soil. Eur. J. Environ. Civ. Eng. 2016, 20, 1147–1180. [Google Scholar] [CrossRef]
  40. Ferreira, F.; Vieira, C.; Lopes, M. Pullout Behavior of Different Geosynthetics—Influence of Soil Density and Moisture Content. Front. Built Environ. 2020, 6, 12. [Google Scholar] [CrossRef] [Green Version]
  41. Mendes, M.J.; Palmeira, E.M.; Matheus, E. Some factors affecting the in-soil load-strain behaviour of virgin and damaged nonwoven geotextiles. Geosynth. Int. 2007, 14, 39–50. [Google Scholar] [CrossRef]
  42. BS 8006. Code of Practice for Strengthened/Reinforced Soils and other Fills. In British Standard Institution; British Standards Institution (BSI): London, UK, 2010; p. 260.
  43. FHWA. Design and Construction of Mechanically Stabilized Earth Walls and Reinforced Soil Slopes. In FHWA-NHI-10-024; Berg, R.R., Christopher, B.R., Samtani, N.C., Eds.; National Highway Institute: Washington, DC, USA, 2010. [Google Scholar]
  44. NCMA. Design Manual for Segmental Retaining Walls. In National Concrete Masonry Association, 3rd ed.; National Concrete Masonry Association: Herndon, VA, USA, 2010; p. 206. [Google Scholar]
  45. AASHTO. LRFD Bridge. Design Specifications. In American Association of State Highway and Transportation Officials, 8th ed.; American Association of State Highway and Transportation Officials: Washington, DC, USA, 2017. [Google Scholar]
  46. Vieira, C.S. Valorization of Fine-Grain Construction and Demolition (C&D) Waste in Geosynthetic Reinforced Structures. Waste Biomass Valorization 2020, 11, 1615–1626. [Google Scholar]
  47. Arulrajah, A.; Rahman, M.A.; Piratheepan, J.; Bo, M.W.; Imteaz, M.A. Evaluation of Interface Shear Strength Properties of Geogrid-Reinforced Construction and Demolition Materials using a Modified Large Scale Direct Shear Testing Apparatus. J. Mater. Civ. Eng. 2014, 26, 974–982. [Google Scholar] [CrossRef]
  48. Vieira, C.S.; Pereira, P.M. Interface shear properties of geosynthetics and construction and demolition waste from large-scale direct shear tests. Geosynth. Int. 2016, 23, 62–70. [Google Scholar] [CrossRef]
  49. Soleimanbeigi, A.; Tanyu, B.F.; Aydilek, A.H.; Florio, P.; Abbaspour, A.; Dayioglu, A.Y.; Likos, W.J. Evaluation of recycled concrete aggregate backfill for geosynthetic-reinforced MSE walls. Geosynth. Int. 2019, 26, 396–412. [Google Scholar] [CrossRef]
  50. EN 13738: 2004, Geotextiles and Geotextile-Related Products-Determination of Pullout Resistance in Soil; European Committee for Standardization: Brussels, Belgium, 2004.
  51. ASTM D6706-01: 2013, Standard Test. Method for Measuring Geosynthetic Pullout Resistance in Soil; ASTM International: West Conshohocken, PA, USA, 2013.
  52. EN 933-11:2009, Tests for Geometrical Properties of Aggregates—Part. 11: Classification Test for the Constituents of Coarse Recycled Aggregate 2009, 16.
  53. EN 933-1: 2012, Tests for Geometrical Properties of Aggregates—Part. 1: Determination of Particle Size Distribution–Sieving Method 2012.
  54. CEN ISO/TS 17892-4: 2004, Geotechnical Investigation and Testing-Laboratory Testing of Soil—Part. 4: Determination of Particle Size Distribution 2004.
  55. EN 13286-2: 2002, Unbound and hydraulically bound mixtures—Part. 2: Test. methods for laboratory reference density and water content-Proctor compaction. Ger. Version EN 2004, 34.
  56. EN 933-9: 2009, Tests for geometrical properties of aggregates. Assessment of fines. Methylene blue test. Assess. Fines. Methylene Blue Test 2009.
  57. EN 12457-4: 2002, Characterisation of waste–Leaching–Compliance test for leaching of granular waste material and sludges. Part 4: One stage batch test at a liquid to solid ratio of 10 l/kg for materials with particle size below 10 mm (without or with size reduction). Part 2002, 2, 30.
  58. EC. Council Decision 2003/33/EC establishing criteria and procedures for the acceptance of waste at landfills pursuant to Article 16 of and Annex II to Directive 1999/31/EC. Off. J. Eur. Union 2003, 11, 27–39.
  59. Jang, Y.-C.; Townsend, T. Sulfate leaching from recovered construction and demolition debris fines. Adv. Environ. Res. 2001, 5, 203–217. [Google Scholar] [CrossRef]
  60. Barbudo, A.; Galvín, A.P.; Agrela, F.; Ayuso, J.; Jiménez, J.R. Correlation analysis between sulphate content and leaching of sulphates in recycled aggregates from construction and demolition wastes. Waste Manag. 2012, 32, 1229–1235. [Google Scholar] [CrossRef]
  61. EN 1744-1: Tests for Chemical Properties of Aggregates—Part. 1: Chemical Analysis; CEN: Brussels, Belgium, 2009; 66p.
  62. EN ISO 10319: 2008, Wide-Width Tensile Tests; European Committee for Standardization: Brussels, Belgium, 2008.
  63. Hirakawa, D.; Kongkitkul, W.; Tatsuoka, F.; Uchimura, T. Time-dependent stress-strain behaviour due to viscous properties of geogrid reinforcement. Geosynth. Int. 2003, 10, 176–199. [Google Scholar] [CrossRef]
  64. Mohiuddin, A. Analysis of Laboratory and Field Pull-Out Tests of Geosynthetics in Clayey Soils. Master’s Thesis, Faculty of the Louisiana State University and Agricultural and Mechanical College, Baton Rouge, LA, USA, 2003. [Google Scholar]
  65. Goodhue, M.J.; Edil, T.B.; Benson, C.H. Interaction of foundry sands with geosynthetics. J. Geotech. Geoenvironmental Eng. 2001, 127, 353–362. [Google Scholar] [CrossRef]
  66. Tang, X.; Chehab, G.R.; Palomino, A. Evaluation of geogrids for stabilising weak pavement subgrade. Int. J. Pavement Eng. 2008, 9, 413–429. [Google Scholar] [CrossRef]
  67. Hsieh, C.W.; Chen, G.H.; Wu, J.H. The shear behavior obtained from the direct shear and pullout tests for different poor graded soil-geosynthetic systems. J. Geoengin. 2011, 6, 15–26. [Google Scholar]
Figure 1. Flowchart of the experimental study.
Sustainability 12 03825 g001
Figure 2. Particle size distribution curve of the C&D material.
Sustainability 12 03825 g002
Figure 3. Photographic views of the geogrids (ruler in centimetres): (a) GGR1 (b) GGR2.
Sustainability 12 03825 g003
Figure 4. Large-scale pullout test apparatus at the University of Porto. (a) Overall view. (b) Detail of the pullout box and steel sleeve. (c) GGR1 specimen. (d) Inextensible wires fixed along a GGR2 specimen.
Sustainability 12 03825 g004
Figure 5. Effect of specimen size on the pullout behaviour of GGR1 (dr = 2 mm/min): (a) σv = 10 kPa; (b) σv = 25 kPa; (c) σv = 50 kPa.
Sustainability 12 03825 g005
Figure 6. Effect of specimen size on the pullout behaviour of GGR2 (σv = 10 kPa, dr = 2 mm/min): (a) Pullout force plotted against frontal displacement; (b) Displacements over the geogrid length at maximum pullout force.
Sustainability 12 03825 g006
Figure 7. Effect of displacement rate on the pullout behaviour of GGR2 (σv = 10 kPa, specimen size = 200 mm × 600 mm): (a) Pullout force plotted against frontal displacement; (b) Displacements over the geogrid length at maximum pullout force.
Sustainability 12 03825 g007
Figure 8. Effect of vertical confining pressure on the pullout behaviour of GGR1: (a) Specimen size of 200 mm × 600 mm; (b) Specimen size of 250 mm × 750 mm.
Sustainability 12 03825 g008
Table 1. Constituents of the recycled C&D material [22].
Constituents Values
Concrete, concrete products, mortar, concrete masonry units [%]40.0
Unbound aggregates, natural stone, aggregates treated with hydraulic binders [%]36.5
Clay and calcium silicate masonry units, aerated non-floating concrete [%]10.8
Bituminous materials [%]0.5
Glass [%]1.3
Soils [%]10.8
Other materials [%]0.1
Floating particles [cm3/kg]10.0
Table 2. Geotechnical properties of the C&D material.
PropertiesValues
D10 [mm]0.01
D50 [mm]0.65
D60 [mm]1.03
Fines fraction (No. 200 sieve) [%]16.9
Minimum void ratio, emin0.434
Maximum void ratio, emax0.877
Particles density, Gs2.58
Maximum dry unit weight, γd,max [kN/m3]20.1
Optimum moisture content, wopt [%]9.0
Methylene blue value, MB [g/kg]3.2
Peak friction angle, φ [°]37.6
Cohesion, c [kPa]16.3
Table 3. Leaching test results and acceptance criteria according to Council Decision 2003/33/EC [58].
Parameter Value
[mg/kg Dry Matter]
Acceptance Criteria
[mg/kg Dry Matter]
Arsenic, As0.0210.5
Lead, Pb<0.010.5
Cadmium, Cd<0.0030.04
Chromium, Cr0.0120.5
Copper, Cu0.102
Nickel, Ni0.0110.4
Mercury, Hg<0.0020.01
Zinc, Zn<0.14
Barium, Ba0.1120
Molybdenum, Mo0.0180.5
Antimony, Sb<0.010.06
Selenium, Se<0.020.1
Chloride, Cl300800
Fluoride, F6.110
Sulphate, SO432001000
Phenol index<0.051
Dissolved Organic Carbon, DOC220500
pH8.2-
Table 4. Main physical and mechanical properties of the geogrids.
PropertyGGR1GGR2
Raw materialPETHDPE
Mass per unit area (g/m2)380450
Aperture dimensions (mm)30 × 7316 × 219
With of longitudinal members (mm)106
With of transverse members (mm)716
Thickness of longitudinal members (mm)1.01.1
Thickness of transverse members (mm)1.02.5 to 2.7
Mean value of the tensile strength 1 (kN/m)8068
Mean value of the tensile strength 2 (kN/m)92.260.3
Elongation at maximum load 1 (%)≤811 ± 3
Elongation at maximum load 2 (%)5.610.1
Secant stiffness at 5% strain 2 (kN/m)1640718
1 As per the manufacturer specifications (machine direction). 2 As per the laboratory tensile tests performed in this study (machine direction).
Table 5. Test programme.
TestGeogridSpecimen Size [mm]Displacement Rate [mm/min]Confining Pressure [kPa]Number of Specimens
T1GGR1200 × 6002103
T2GGR1200 × 6002253
T3GGR1200 × 6002503
T4GGR1250 × 7502103
T5GGR1250 × 7502253
T6GGR1250 × 7502503
T7GGR2200 × 6001101
T8GGR2200 × 6002101
T9GGR2200 × 6004101
T10GGR2300 × 9002101
Table 6. Summary of results.
TestPR [kN/m]PR—Average [kN/m]dPR [mm]dPR—Average [mm]Failure Modeτpτsfbfb Average
[kPa][kPa]
T1 (1)30.8433.2756.7855.75Pullout28.3924.011.18
T1 (2)33.2359.81Pullout30.7624.011.281.27
T1 (3)35.7350.67Pullout32.5224.011.35
T2 (1)41.7143.3243.1847.54Pullout37.4535.921.04
T2 (2)42.4837.31Pullout37.7435.921.051.09
T2 (3)45.7662.14Pullout42.5435.921.18
T3 (1)49.2352.1240.0542.76Pullout43.9552.210.84
T3 (2)46.4540.15Tensile41.4852.210.790.89
T3 (3)60.6948.07Tensile54.9852.211.05
T4 (1)40.8336.6754.5254.05Pullout29.3524.011.22
T4 (2)33.1949.45Pullout23.6924.010.991.10
T4 (3)36.0058.19Pullout26.0224.011.08
T5 (1)51.9752.4260.5157.62Pullout37.6935.921.05
T5 (2)54.6261.46Pullout39.6635.921.101.05
T5 (3)50.6750.88Pullout36.2435.921.01
T6 (1)64.4161.1761.7756.87Tensile46.7952.210.90
T6 (2)56.9158.81Tensile41.1752.210.790.85
T6 (3)62.2050.04Tensile44.4352.210.85
T738.38-57.26-Tensile32.1524.011.34-
T841.37-81.94-Tensile34.8024.011.45-
T944.58-73.00-Tensile37.6024.011.57-
T1048.56-84.46-Tensile27.1224.011.13-

