Dry Bean [Phaseolus vulgaris L.] Growth and Yield Response to Variable Irrigation in the Arid to Semi-Arid Climate


1
Northern Ag Research Center, Montana State University, 3710 Assinniboine Road, Havre, MT 59501-8412, USA
2
Agricultural and Biological Engineering Department, University of Florida, P.O. Box 110570, Gainesville, FL 32611, USA
3
Department of Plant Sciences, Powell Research and Extension Center, University of Wyoming, 747 Road 9, Powell, WY 82435, USA
*
Author to whom correspondence should be addressed.
Sustainability 2020, 12(9), 3851; https://0-doi-org.brum.beds.ac.uk/10.3390/su12093851
Submission received: 31 March 2020
/
Revised: 24 April 2020
/
Accepted: 29 April 2020
/
Published: 8 May 2020
(This article belongs to the Special Issue Sustainable Irrigation Strategies for Improving Crop Water Productivity)
Abstract
:Understanding the crop growth and yield response to variable irrigation and the relationship between crop eco-physiological and morphological parameters is critical for identifying a balanced irrigation management strategy and developing decision support systems for early detection and information for on-ground decisions. Experiments were conducted to evaluate the effect of variable irrigation treatments on dry bean [Phaseolus vulgaris L.] growth traits (plant height, leaf area index, normalized difference vegetation index), seed yield (SY), and yield components (pods plant−1, seeds pod−1, 100-seed weight (SW), and pod harvest index (PHI)) and to develop empirical models between dry bean growth and environmental conditions, SY, and yield components. Five irrigation treatments i.e., FIT (full irrigation treatment), 125% FIT, 75% FIT, 50% FIT, and 25% FIT were investigated. Water deficit at the beginning of the crop growth [vegetative growth (V1-V2) stage], dramatically reduced dry bean growth and development and resulted in a significant reduction in SY. However, the degree to which vegetative growth and SY was reduced depends on the weather conditions. Reducing irrigation by 25% below FIT resulted in an average reduction of 30% in SY. This reduction in SY was significantly correlated with a decline in pods plant−1 and SW. Moreover, the empirical models between growth traits and growing degree days (GDD) have a strong correlation, while growth traits and SY and yield components are moderately correlated. The data and empirical models presented in this research provide valuable information in predicting and estimating dry bean SY in-season and allow for corrective management decisions.
1. Introduction
In the U.S., dry bean (Phaseolus vulgaris L.) is produced in 17 states with a variety of practices and yield differences and responsible for 6% of the world output. The semi-arid to the arid region of the Central High Plains (CHP) (i.e., Colorado, Nebraska, and Wyoming) is among the most important edible dry bean producing regions in the U.S. It is estimated that 20–25% of the U.S dry bean crop is produced in this region. Over the last decade, an overall increase of 34% was observed in dry bean production in the CHP region [1]. For example, in 2017 CHP region harvested approximately 90,000 ha of dry bean with an average seed yield (SY) of 2650 kg ha−1. However, with inadequate precipitation during the growing season and high evaporative demand in the region, the productivity of dry bean is largely dependent on supplement irrigation [2]. Moreover, with increasing water demands from non-agricultural sectors, climate change and variability, increasing frequency of droughts, declining water tables, changing water rights, and the increasing cost of irrigation, it is important to evaluate the various water management strategies for dry bean production. Also, in states like Wyoming, producers are facing significant management options (conversion from furrow to sprinkler irrigation) to conserve irrigation water resources. For example, the adoption of sprinkler irrigation in Wyoming has increased by 50% from 1990 to 2018 [3]. Producers are seeking guidance on how to make maximum use of available water supply, how to efficiently manage on-farm irrigation scheduling, as well as information on crop water use, yield, crop water use efficiency, and how to minimize the energy cost. The answer to these aforementioned questions requires scientifically-based and practical management strategies that can aid producers in their decision-making process to enhance water use efficiency to achieve maximum profitability.
The effect of water stress on dry beans can vary depending on the frequency, duration, timing and intensity of stress and is highly variable in response due to interacting factors [4,5,6]. It is generally accepted that water stress adversely affects the physiological, morphological, and growth traits of dry bean [7], however, the magnitude to which the reduction occurs varies from region to region and there is a lack of consistency in the reported response of dry bean to water stress. Ramirez and Kelly [8] reported that the characteristics of many dry bean traits reduced under water stress conditions and resulted in reduced SY from 22% to 71%. In the upland central plateau of Mexico, Gallegos and Shibata [9] reported many morphological traits were negatively affected by water stress, which resulted in a reduced number of leaves and reduced the SY by 34% to 50%. A water stress study conducted by Stoker [10] on dwarf beans in the sub-tropical climate of New Zealand reported a 13% to 24% reduction in SY caused mainly by the abscission of flowers and young pods. In another study, Miller & Burke [11] reported maximum dry bean SY and biomass when irrigated to replace 100% of estimated crop evapotranspiration (1.0ETc) and observed no significant increase in SY or biomass above 1.0ETc. While, Webber et al. [12], found no significant differences in aboveground biomass and SY for common bean for the three irrigation levels tested (moderate, recommended, and above recommended). In addition to this, water stress decreases root growth and results in decreased nutrient uptake [13], and also, decreases nitrogen fixation in root nodules [14,15,16] by reducing the contact between root and soil and thereby, impacting the growth and SY.
In general, the SY of dry bean under water-stressed conditions is dependent on the crop growth rate and on the efficiency with which plants partition dry matter to the grain. In-depth evaluation and knowledge of various crop eco-physiological and morphological traits, the extent of environmental influence, and its relationship with SY can be a very valuable tool for several applications and decision making, especially to plant breeders, since these traits can be easily measured and may serve as selection criteria. In general, the extent of environmental influence is generally characterized by growing degree days (GDD), primarily represented by thermal or heat units, which is often used to model crop growth and other crop growth related indices [17]. Also, easy-to-measure crop growth variables such as plant height can be used to predict more complex crop growth variables and vice-versa [18]. The models further allow for easy parameter conversions of crop growth indices and for the use in assessing plant growth without destructive sampling and to build more accurate whole-plant growth models with fewer required parameters and improve simulations at a regional scale. Therefore, an understanding of the dry bean response to irrigation levels and the relationship between various crop ecophysiological and morphological parameters, SY, and yield components will not only help identify and select a balanced irrigation management strategy for maximum SY and water-use efficiency but also develop decision support systems for early detection and inform the on-ground decisions. However, despite its importance, only a few studies have focused on understanding dry bean growth, SY, and yield component response to irrigation levels, especially in the arid to semi-arid climate. A companion paper to the research presented here [19] presents the effect of water stress on dry bean soil moisture dynamics, crop evapotranspiration (ETc), and crop water production functions. The objectives of this study were (i) to evaluate the effect of irrigation rates on dry bean growth, SY, and yield components, (ii) to develop empirical models for dry bean growth traits, and (iii) understand and quantify the relationship between dry bean growth and SY, and yield components in the semi-arid to the arid climate.
2. Materials and Methods
2.1. Site Description, Experiment Design, and Management Practices
Field experiments were conducted in 2017, 2018, and 2019 crop growing seasons at the University of Wyoming, Powell Research and Extension Center (PREC), located in the inter-mountain region of Wyoming, near Powell, Wyoming (lat: 44°46′35.03′′ N and long: 108°45′32.50′′ W, 1333 m above sea level). The climate is characterized as arid to semi-arid with long-term average annual and growing season (May to September) precipitation of 159 mm and 110 mm, respectively with significant inter-annual and growing season variation in both magnitude and timing. The soil at the location is a Garland loam with a saturation point (SP), field capacity (FC), and permanent wilting point (PWP) of 0.43 m3 m−3, 0.29 m3 m−3, and 0.15 m3 m−3 for 0.3 and 0.6 m soil depth. The top 0.6 m soil is categorized as deep, well-drained, medium-textured soil with slope ranges from 0 to 1 percent, while the deeper layers are dominated by sands, gravel or cobbles with FC and PWP of 0.17 m3 m−3 and 0.08 m3 m−3, respectively. The total available water holding capacity of the soil profile is 111 mm per 0.9 m profile, with an average bulk density of 1.50 g cm−3. The particle size distribution is 38% sand, 37% silt, and 24% clay, with 1.3% organic matter content in the topsoil.
Dry bean (Phaseolus vulgaris L.) cv. Othello was planted on 3 June, 6 June, and 5 June; at 0.56-m row spacing (east-west direction) and harvested on 8 September, 10 September, and 6 September in 2017, 2018, and 2019, respectively. For all years, experimental field was disc plowed and then roller harrowed, and seedbed was prepared before sowing. Each plot was 30 rows (17 m) wide and 40.5 m long. The seeding rate was 222,395 ha−1, planting depth was 0.05–0.06 m, for all the growing seasons. All the plots were fertilized evenly with the same amount of nitrogen and phosphorous based on the soil samples taken from different locations in the field before the start of crop growing season. The residual soil nitrogen was credited and subtracted from the final nitrogen amount needed. In 2017 growing season, fertilizer in the form of mono-ammonium phosphate and urea was broadcasted at a rate of 55 kg ha−1 of nitrogen (N) and 33 kg ha−1 phosphorus pentoxide (P2O5). In 2018 and 2019, in addition to N (41 kg ha−1 in 2018 and 19 kg ha−1 in 2019) and P2O5 (3 kg ha−1 in both 2018 and 2019), zinc sulphate was applied at a rate of 6 kg ha−1 in both years. Other field managements such as weed, disease, and pests was conducted in accordance with standard conventional management.
Five irrigation levels, full irrigation (FIT), 75% FIT, 50% FIT, 25% FIT, and 125% FIT were evaluated with three replications laid out in a randomized complete block design (RCBD). FIT in this research represents the conditions in which the crop was irrigated when soil water depletion was approximately 35–40% of the total available water, to avoid any potential water deficit impact on crop yield. 125% FIT irrigation treatment was added to assess the impact of over-irrigation on dry bean production. Experimental plots were irrigated using a nine span GPS guided linear-move sprinkler irrigation system with variable rate irrigation (VRI) zone control capability (Valmont Industries, Valley, NE, USA). All the experimental plots were placed in the first three spans of the lateral move irrigation systems in 2017 and 2018 and fourth-fifth-and sixth span in 2019. The irrigation system is fed by the surface water supplies using a large diameter hose attached to a pressurized mainline. The irrigation system consists of a lateral pipeline (0.2 m diameter) with eighteen sprinkler drops spaced at 2.3 m apart on each span. The sprinkler system uses model R3000 rotator (Nelson Irrigation, Walla Walla, Washington, USA) with 69 kPa pressure regulators installed 1.5 m above ground. For each irrigation event, a prescription map was developed using the Valley® VRI-iS prescription program version 8.55, which was then uploaded to the Valley® AutoPilot Linear Control Panel (Valmont Industries, Valley, Nebraska).
Irrigation scheduling was determined using a daily water balance approach [20], which was determined for FIT. The daily water balance considered irrigation and precipitation as inputs, while groundwater contribution was assumed to be negligible, and ETc, deep percolation, and runoff were considered as outputs [19]. Irrigation was applied when the water deficit in the root zone of the FIT treatments was equal to the minimum allowable depletion (MAD; 35–40% of the available soil water). Irrigation was applied one or two times a week to meet the ETc needs. Water deficit values calculated from this approach were also adjusted with measured soil moisture data throughout the growing season. For each growing season, volumetric soil moisture measurements were made preferably twice a week throughout the growing season in each plot at three depths, 0.3 m, 0.6 m, 0.9 m using the CPN 503DR Elite hydroprobe neutron moisture gauge (CPN, Inc., Concord, California, USA). The uniform irrigation of 12.7 mm immediately after planting and 12.7 mm at emergence was applied in all three growing seasons. The purpose of these irrigations was to create a good seedbed and to encourage a full and even plant stand across treatments. The deficit irrigation treatments were initiated while dry bean crop was still in early vegetative stage (V1-V2) on 21 June, 28 June, and 3 July in 2017, 2018, and 2019 growing season, respectively. At the beginning of each growing season, sprinkler irrigation system performance was verified using the catch can test. A total of 14 irrigation events occurred in 2017, a total of 13 irrigation events occurred in 2018, and only 11 irrigation events occurred in 2019. A detailed description of the dates and amount of each irrigation application for each treatment for each growing season is presented in Table 1.
2.2. Growth Parameters, Seed Yield (SY), and Yield Components Measurements
The growth of the plant can be expressed via several variables. In this study, the measurement of the Leaf Area Index (LAI) which is related to the photosynthetic potential of the crop canopy was carried out using LI-COR 2200-C plant canopy analyzer meter (LI-COR, Inc. Lincoln, Nebraska, USA). This equipment calculates the interception of blue light (320–490 nm) at 5 zenith angles (148° field-of-view) utilizing the gap fractions sensed at five different angles taken above and below the canopy. These data are then used to compute foliage amount and orientation. The Normalized Difference Vegetative Index (NDVI) which is the ratio of reflectance of photosynthetically active radiation in the visible and near-infrared regions of the spectrum was measured using GreenSeeker handheld crop sensor NDVI meter (Trimble Inc., Sunnyvale, California, USA). This device measures light reflected from the canopy at 660 nm (red) and 770 nm (near-infrared) bands.
Soil-plant analysis development (SPAD) chlorophyll measurement was carried out by SPAD-portable Chlorophyll meter (Spectrum Technologies, Inc., Aurora, Illinois, USA) by measuring the third uppermost trifoliate leaf. This equipment measures the ratio of the light absorbance in the red and near-infrared region and gives a SPAD value. In addition, plant height (h) was measured using a measuring stick. Measurements of LAI, NDVI, SPAD, and h were initiated after plants had germinated and had attained the 4th trifoliate stage. In 2017, the measurements were started on 7 July, on 26 June in 2018, and in 2019 on 2 July. Afterward, the readings were taken every week from three locations at random from every plot. The h measurements were stopped after the canopy interlocked, and no increase in height was observed. All LAI, NDVI, and SPAD measurements were taken under clear sky conditions between 9 A.M. to 4 P.M.
At harvest, SY samples were collected by hand-harvesting an area of 3 × 1.1 m2 from three locations from each plot and threshing to quantify SY per hectare. SY was adjusted to 14% moisture content after threshing. In addition to this, two-plant samples were also collected from the same locations to quantify the yield components i.e., pods plant−1, seeds pod−1, weight seed−1, 100-seed weight (SW), and pod harvest index (PHI). PHI is defined as the ratio of the dry weight of the seed to the dry weight of pod at harvest (seed weight plus pod weight).
2.3. Growing Degree Days (GDD)
Temperature and solar radiation play a key role in plant growth and development when other factors are not limiting. Crop canopies experience and accumulate heat units throughout the season. This accumulation of heat is termed as a thermal unit or growing degree days (GDD). The GDD is closely related to the phenology of crops and plants. In this study, GDD was calculated using a daily scale and represented by cumulative GDD based on the approach presented by McMaster & Wilhelm [21] as:
where and are daily maximum, and minimum temperatures (°C) and is taken as 5 °C. Tbase is the temperature below which the plant’s physiological processes are temporarily hampered or stopped [22]. Both upper and lower air temperature threshold was applied, with Tmin below 5 °C was taken as 5 °C and Tmax was taken as 30 °C. Tmax and Tmin data used was collected from Wyoming Agricultural Climate Network (WACNet) weather station located at the experimental site [23]. Because of the high dependency of crop growth and development on GDD, all the dry bean growth indices studied in this research such as LAI, NDVI, and h was related to cumulative GDD and also with days after planting (DAP).
2.4. Statistical Analysis
Analysis of variance (ANOVA) was performed using the mixed procedure available in the Statistical Analysis Software (SAS). Tukey’s Honest Significant Difference test at a 95% confidence interval was used to identify potentially significant differences between maximum LAI, NDVI, h, average SPAD-Chlorophyll, SY and yield components (pods plant−1, seeds pod−1, weight seed−1, SW, and PHI) observed for the whole growing season. Moreover, a two-way ANOVA was performed to study the interaction between various growth and yield parameters and years. Also, the coefficient of determination (R2) was used to determine the correlation between developed relationships.
3. Results and Discussion
3.1. Weather Conditions
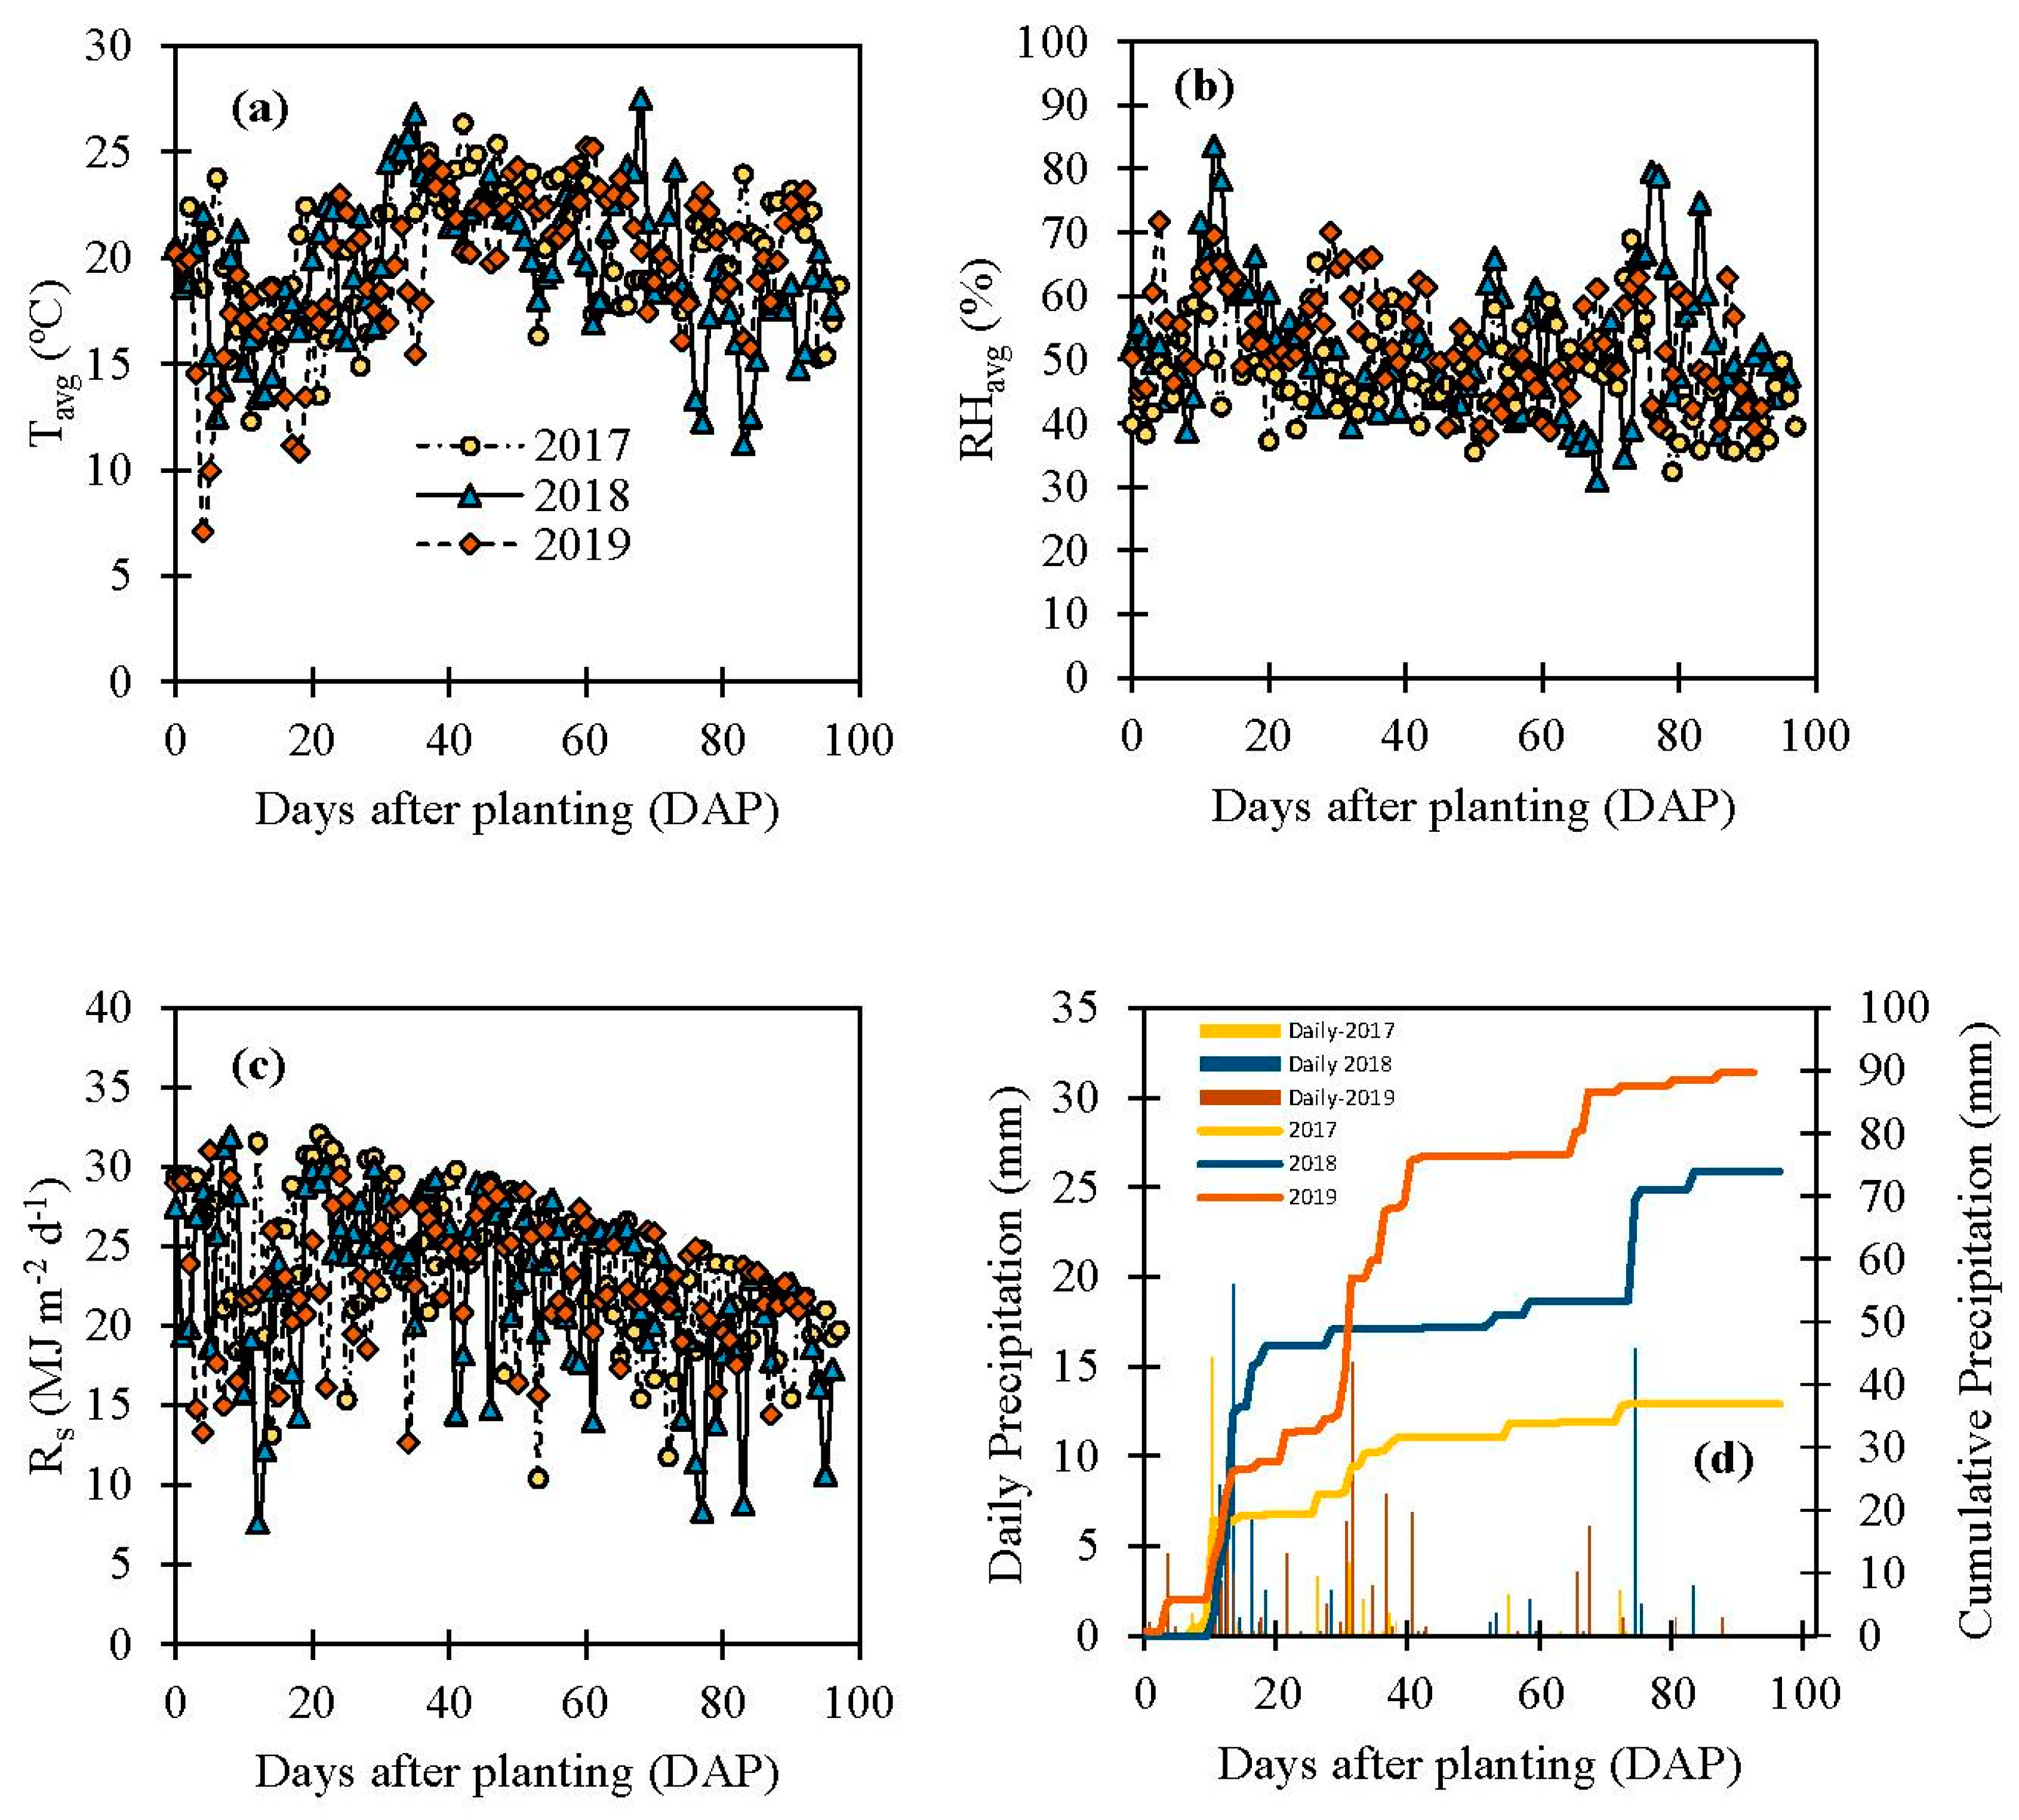
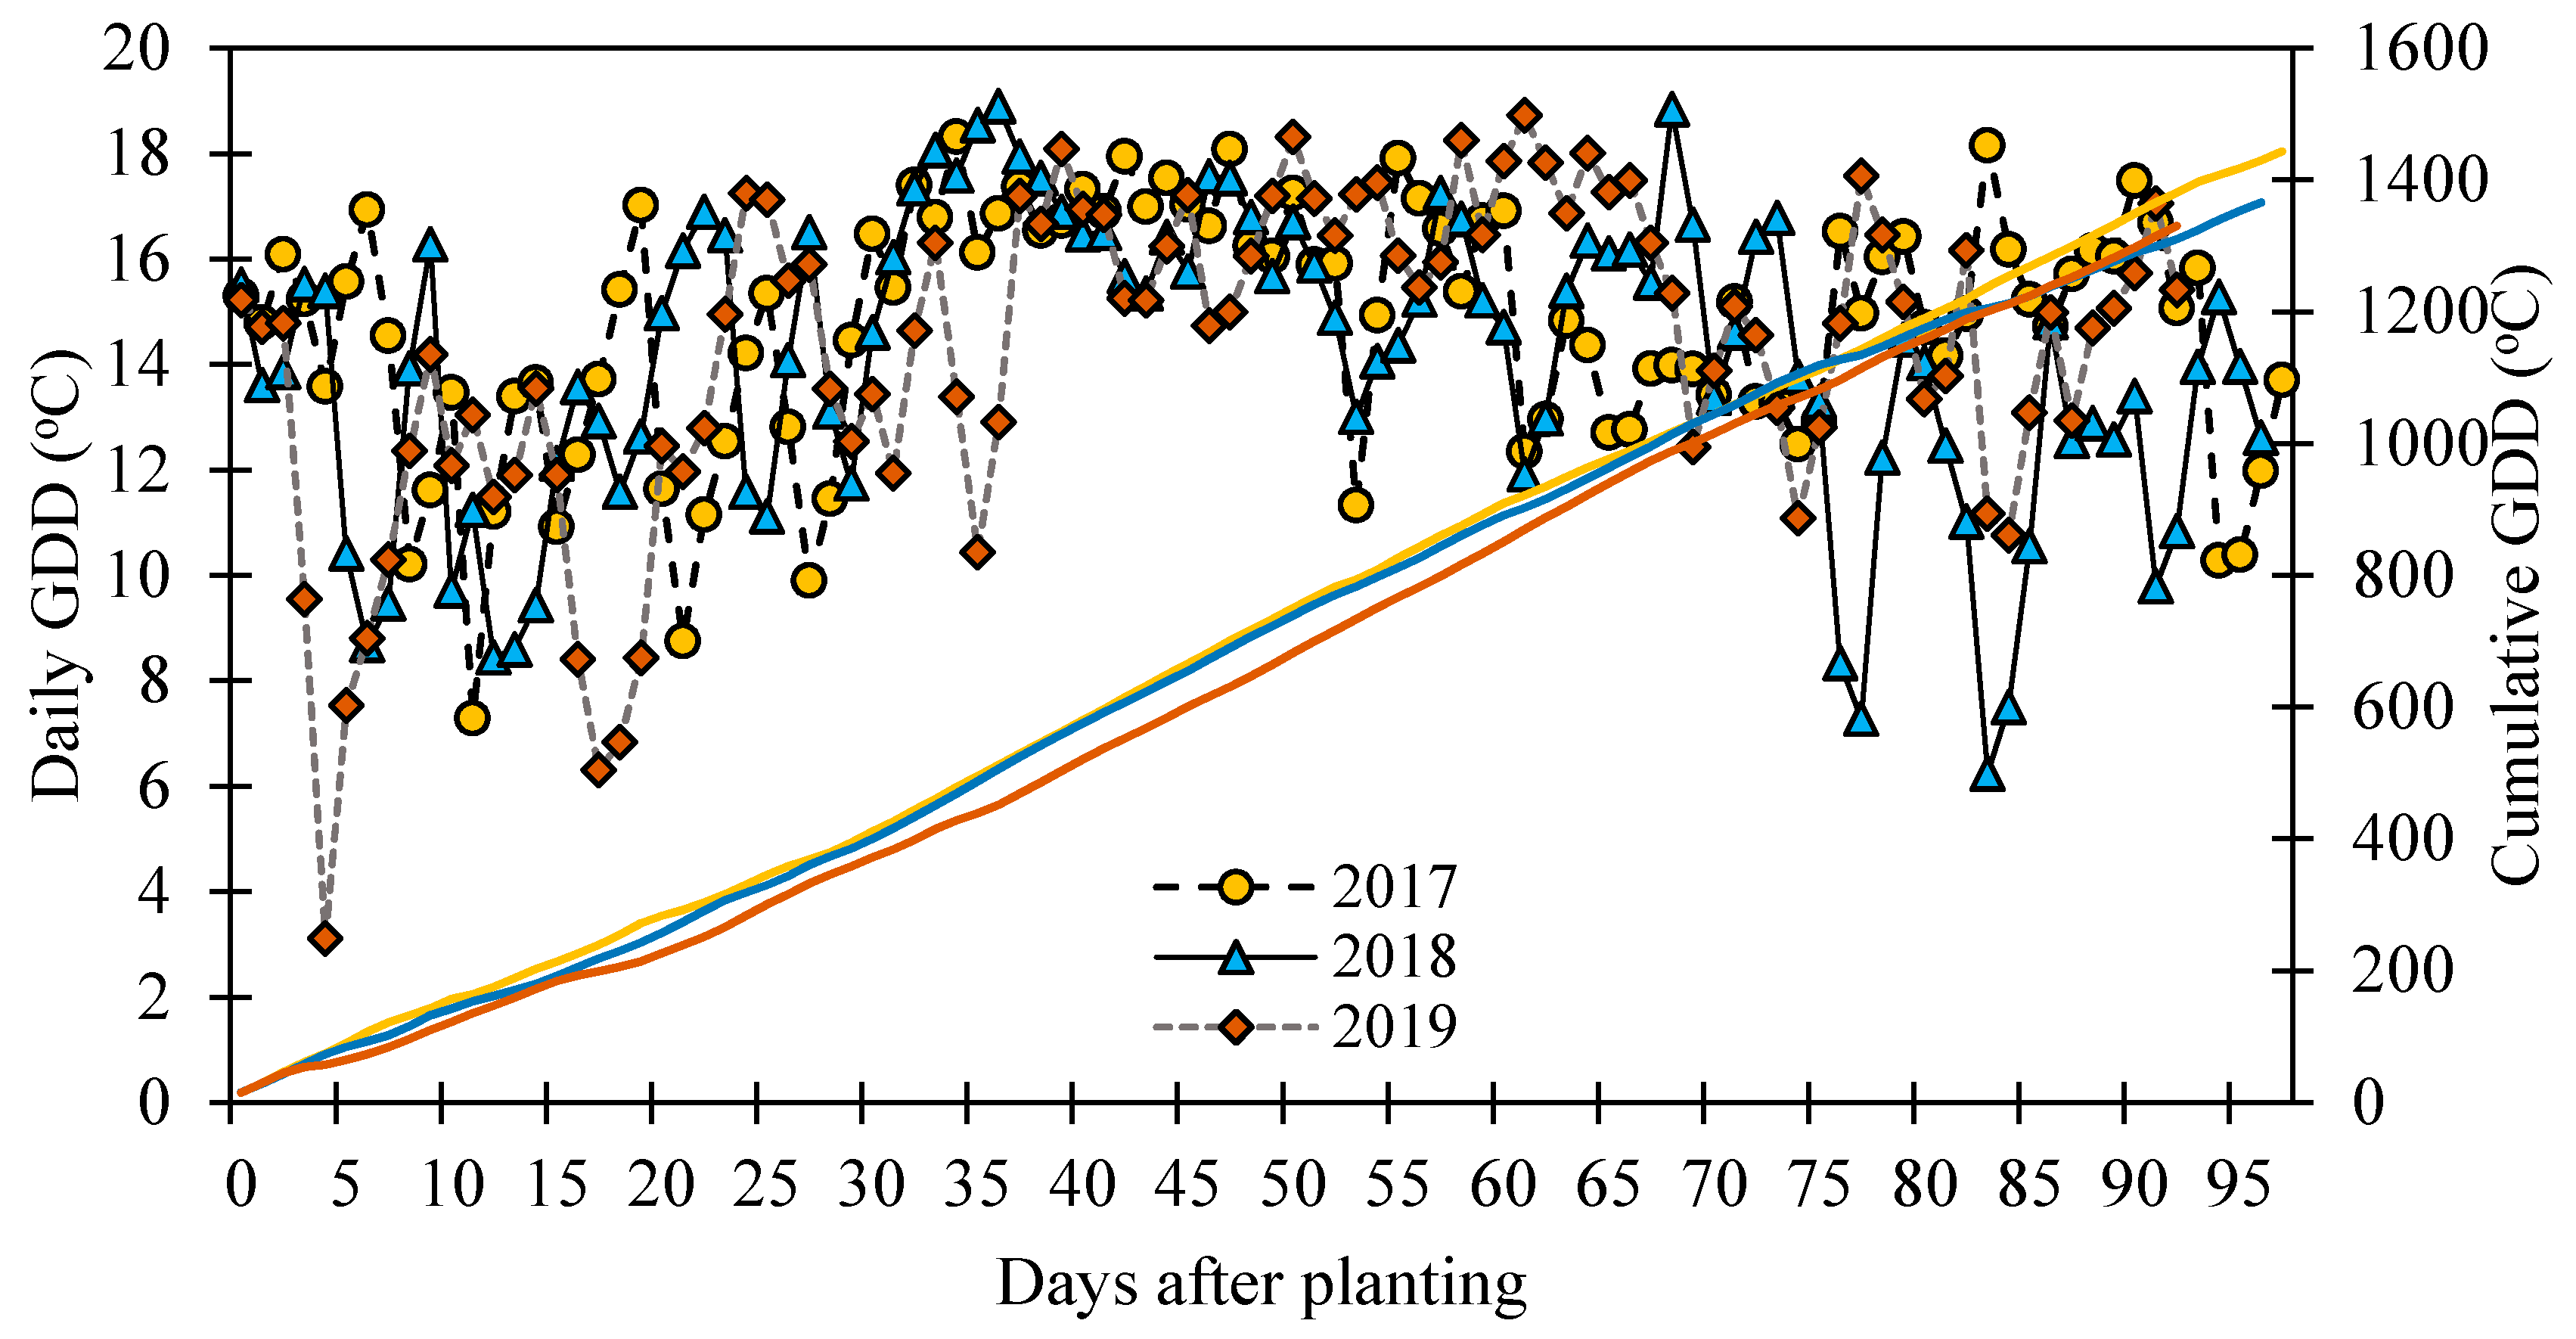
Daily average temperature (Tavg), daily average relative humidity (RHavg), wind speed (u3) at 3 m above the ground, daily average incident shortwave radiation (Rs), and precipitation for 2017, 2018, and 2019 growing season is presented in Figure 1. Substantial variations were observed in weather variables during each of the three years. Compared to long-term average values, 2017 was the driest, 2018 was milder, while 2019 was the wettest growing season. The temperature typically increases from May to July when it peaks and then decreases. For the 2017 growing season, the Tavg for June, July, and August was 18.5 °C, 22.9 °C, and 20.2 °C, respectively. In 2018, the Tavg was 0.9 °C, 1.1 °C, and 0.8 °C lower, while in 2019, the Tavg was 1.9 °C, 1.9 °C, and −0.4 °C lower than 2017 for June, July, and August, respectively. The difference between the Tmax for the three growing seasons was highest for June and July with 2018 being 1.22 °C, and 1.96 °C cooler than 2017. Whereas 2019 was 2.4 °C, and 3.4 °C cooler than 2017 for June and July. Also, the total number of days with temperature above 30 °C for the growing season was 50, 35, and 35 days for 2017, 2018, and 2019 growing seasons, respectively. RHavg was higher by 9.5% for the 2018 growing season, and 11.2% for the 2019 growing season compared to the 2017 growing season. In 2017, the dry bean growing season received only 37 mm of precipitation compared to a total of 74 mm in 2018, and 90 mm in 2019. However, the total number of days receiving precipitation in 2017 and 2018 growing season was 17, whereas, in 2019 the total number of days was 31. Because of the apparent differences between Tmax, Tmin, and Tavg, there were differences in GDD between the years. Figure 2 represents the dynamics of daily and cumulative GDD for 2017, 2018, and 2019 dry bean growing season at the research site. Overall, because of the warmer climate in 2017, the cumulative GDD was higher for 2017 compared to 2018 and 2019 with a total cumulative GDD of 1443°C, 1366°C, and 1330°C from planting to harvesting, respectively.
3.2. Effect of Irrigation Treatment on Dry Bean Growth Dynamics and Other Canopy Traits
Irrigation amount plays a key role in the growth dynamics of the dry bean crop. Any deviation from the trends observed for FIT for any growth trait can indicate plant growth anomaly and allows for early detection of stress agents and mitigation steps. In this study, the weekly measured LAI, NDVI, and h as a function of GDD and DAP were used to study the seasonal progression in response to irrigation treatments (Figure 3). In addition, the following section also discusses the inter-relationship between various growth traits that provide means to estimate more complex indices from relatively simple measurements such as h.
3.2.1. Plant Height (h)
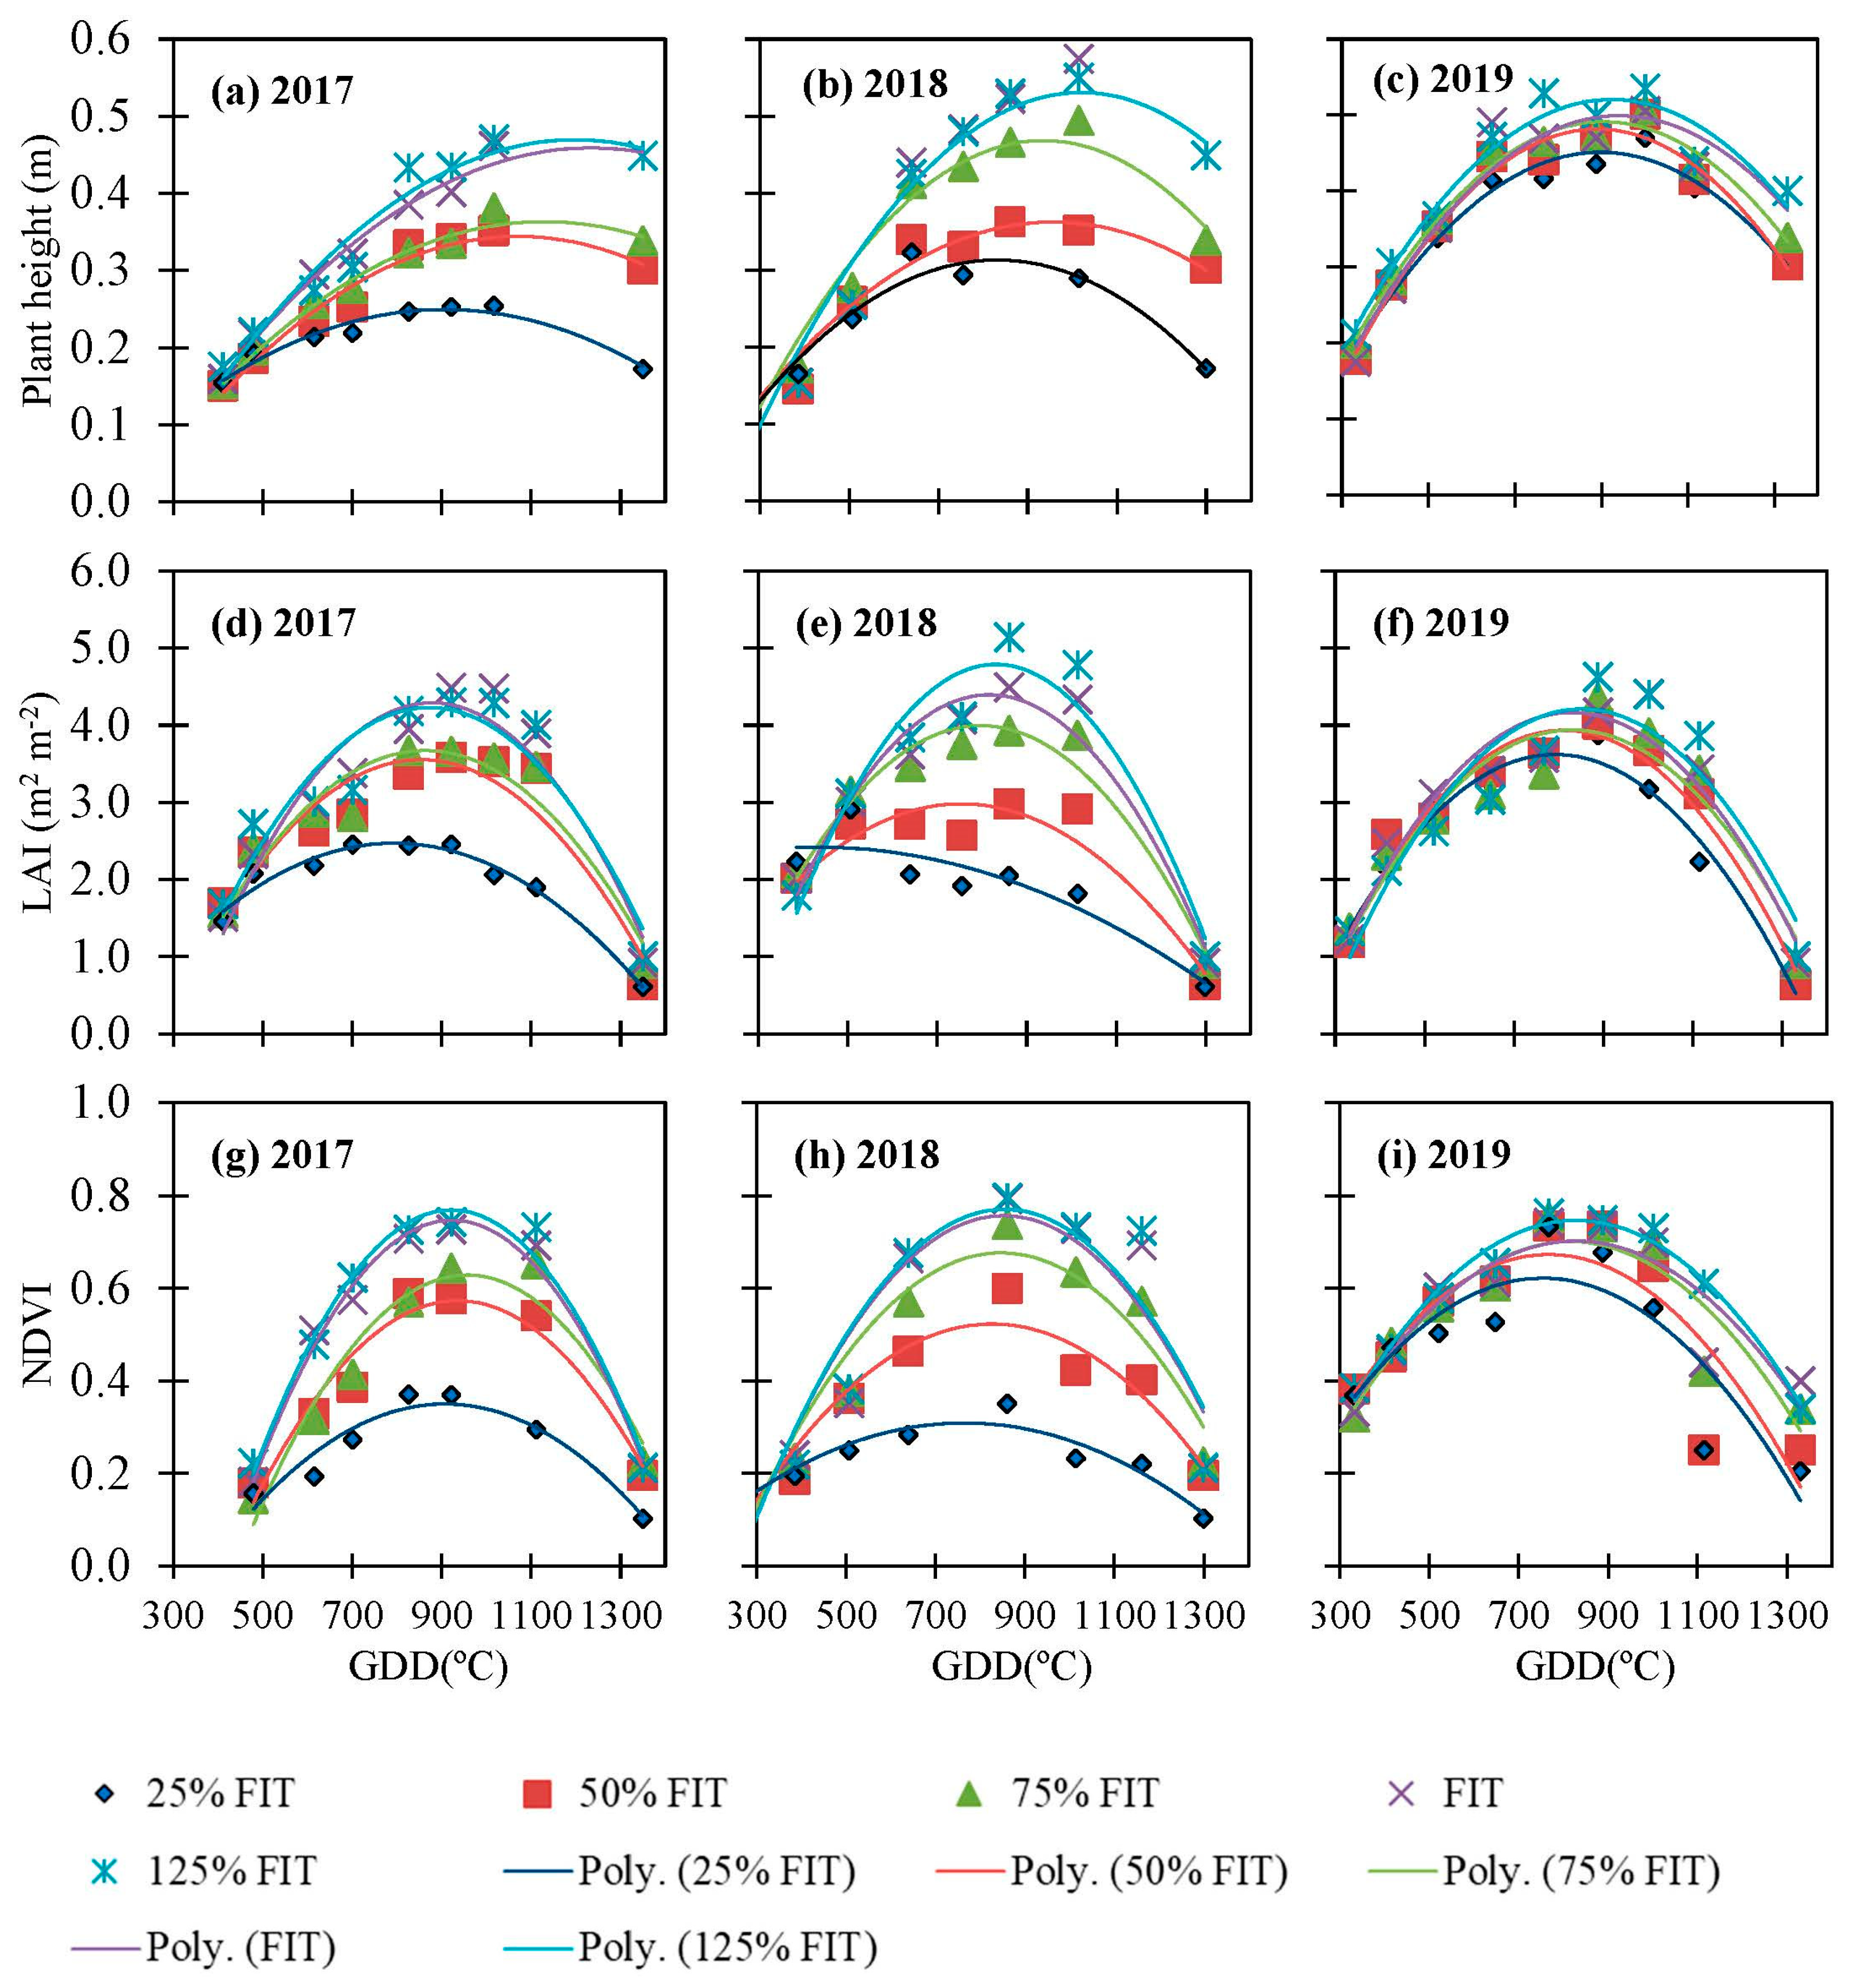
The effect of variable irrigation rate on measured dry bean h and its seasonal progression as a function of GDD for the three growing seasons is presented in Figure 3, while Table 2 represents the maximum h achieved over the growing season. As expected, h increases up to certain growth stages and reaches the maximum value and becomes constant. As evident from Figure 3, water deficit can limit h; however, the magnitude to which the h is limited and when it attains the maximum value varies with the magnitude of water deficit. For example, an analysis of variance (ANOVA) indicated a significant effect of water deficit on maximum h attained at p < 0.05 for the 2017 and 2018 growing season, while no differences in maximum h were observed for 2019 (Table 2). The reason for the non-significant differences between the treatments in 2019 can be attributed to the cooler temperature and a higher amount of precipitation received than the 2017 and 2018 growing seasons. The 2019 growing season received 77 mm of rainfall until 55 DAP (R3-R4 growth stage), due to which water deficit difference among treatments were not significant enough to impact growth since most of the vegetative growth had already taken place. This finding is in accordance with the study by Rosadi et al. [24], they reported that minor differences in water deficit levels may not affect h, whereas more severe water deficit is required for any major effect.
As expected, for all years the 25% FIT achieved the lowest h, with maximum h (0.36 m, average of three years) observed during the R1 (early flower) growth stage, and as the water deficit was progressively relieved, h continued to increase with maximum h of 0.41 m observed for 50% FIT during R3 (early pod set). No further increase in h was observed beyond R1 and R3, for 25% FIT and 50% FIT, respectively, except in 2019 growing season, when higher precipitation resulted in continued increase in h up to R7 (pod filling). Whereas, maximum dry bean h of 0.46, 0.52, and 0.53 m was observed for 75% FIT, FIT, and 125% FIT during R7 growth stage (pod fill and maturation), respectively, and no major differences in the phenology was observed between the years. Increasing h with increasing irrigation application amount observed in this study may have been due to the positive effect of irrigation in maintaining the turgor pressure of the cells which results in optimum plant growth [25]. In addition, our study also indicated no significant differences in h between FIT and 125% FIT, nor were differences present between 25% FIT and 50% FIT.
A two-way ANOVA was conducted that examined the effect of years and treatments on the h. A significant interaction was observed between years and treatments on h (p < 0.005). The maximum attained h for 2019 for 25% FIT and 50% FIT was significantly higher than the 2017 and 2018 growing season due to higher precipitation, whereas, no significant differences were observed for 75% FIT, FIT and 125% FIT. The findings reported in this research are in accordance with the results of Nielsen & Nelson [6] and Shenkut & Brick [26]. They reported that both water stress severity and timing results in shorter bean h, with maximum reduction in dry bean h being observed when water was withheld during the vegetative growth stages. Similarly, Asemanrafat and Honar [27] observed that dry bean h decreased with an increase in water stress and reported no significant differences in h between excess and full irrigation treatments.
3.2.2. Leaf Area Index (LAI)
The leaf area index (LAI) is one of the important indices used to represent the crop growth and related to many aspects of mass and energy balance of vegetative surfaces and often considered challenging to measure and estimate [17,28]. Normally, for annual crops under no-stress conditions, the LAI increases from the vegetative stage to the reproduction stage, attains maximum value and decreases due to the shedding of leaves at physiological maturity. Seasonal dynamics of dry bean LAI, with maximum values and the date of maximum values as a function of GDD and DAP for the growing seasons differed between the irrigation rates (Figure 3 and Table 2). A significant effect (p < 0.05) of water deficit on the maximum LAI attained during the growing season was observed for the 2017 and 2018 growing season. However, the differences were not significant for the 2019 growing season. The significant precipitation events during the early growth stages (vegetative to flowering) in 2019 resulted in negligible differences in water deficit among treatment and differences in LAI appeared late in the season. For all the growing seasons, FIT and 125% FIT had greater LAI than other treatments likely due to greater application of water during the vegetative and reproductive growth stages. The lowest LAI values were observed for 25% FIT. For all deficit irrigation treatments, water deficit early in the vegetative growth stages resulted in reduced leaf growth and rate of leaf emergence. In 2017, no significant difference in LAI was observed between 50% FIT and 75% FIT whereas the difference in 2018 was significant. For all irrigation treatments, LAI trend was very similar, representing a parabolic distribution; however, the magnitude at different crop growth stages and time to attain the maximum LAI was slightly different between different irrigation treatments, except in the 2019 growing season. For example, for 25%FIT, maximum LAI (<3.0) was attained earlier in the development at R2-R3 growth stage (mid flower to early pod set; 44–50 DAP) compared to FIT where maximum LAI (>4.5) was attained at R4-R5 growth stages (early to mid-pod set; 58–65 DAP). A similar magnitude and response to water deficit on dry bean LAI was observed by Boydston et al. [29] in south-central Washington, USA. They tested six different genotypes of pinto beans and reported a mid-season LAI of 3 for deficit irrigated plots compared to 5.6 for FIT. Similar reduction on dry bean LAI with water stress was observed by Gunton and Evenson [30] and Nielson and Nelson [6]. They noted that maximum reduction in leaf area occurs when water stress is imposed during the vegetative stage. A two-way ANOVA showed a significant interaction between the years and treatments on LAI [F (8, 30) = 13.9, p < 0.001]. Similar to the results for maximum attained h, LAI was higher for 25% FIT, and 50% FIT for 2019 growing season compared to 2017 and 2018 growing season, whereas, no significant differences were found among other treatments for the three-growing season.
3.2.3. Normalized Difference Vegetation Index (NDVI) and Soil-Plant Analysis Development (SPAD)
The normalized difference vegetation index (NDVI) and soil-plant analysis development (SPAD) chlorophyll are two of the most important and frequently used vegetative indices for the monitoring of crop growth and development. These traits are used to monitor plant growth and to detect the presence of abiotic stress, and it could be used in various breeding programs for the selection of genotypes with drought tolerance [31,32,33,34,35]. NDVI and SPAD values in response to five irrigation treatments are presented in Figure 3 and Figure 4. Similar to LAI, under non-stress conditions, the NDVI increases as the plant gains biomass from planting to the pod-filling stage and decreases thereafter due to the shedding of leaves as the plant matures and more ground is visible, following a parabolic trend. Compared to LAI, for the 2017 and 2018 growing season, differences in maximum NDVI attained during growing seasons were moderate, with the lowest NDVI observed for 25% FIT, and the maximum observed for 125% FIT (Table 2). Also, the differences in maximum NDVI attained between 75% FIT and FIT, and 125% FIT was not significant. However, no significant difference in NDVI values before flowering was observed between treatments in the 2019 growing season, but this was followed by a small difference in NDVI toward pod- fill and physiological maturity. Contrary to LAI, where maximum LAI was attained early in growing season for deficit irrigation treatments, maximum NDVI for all treatments was observed during the R4 (mid pod set) growth stage. For 2017 and 2018, NDVI decreased significantly under the severe water deficit during branching and vegetative growth stage compared to the optimal irrigation treatments.
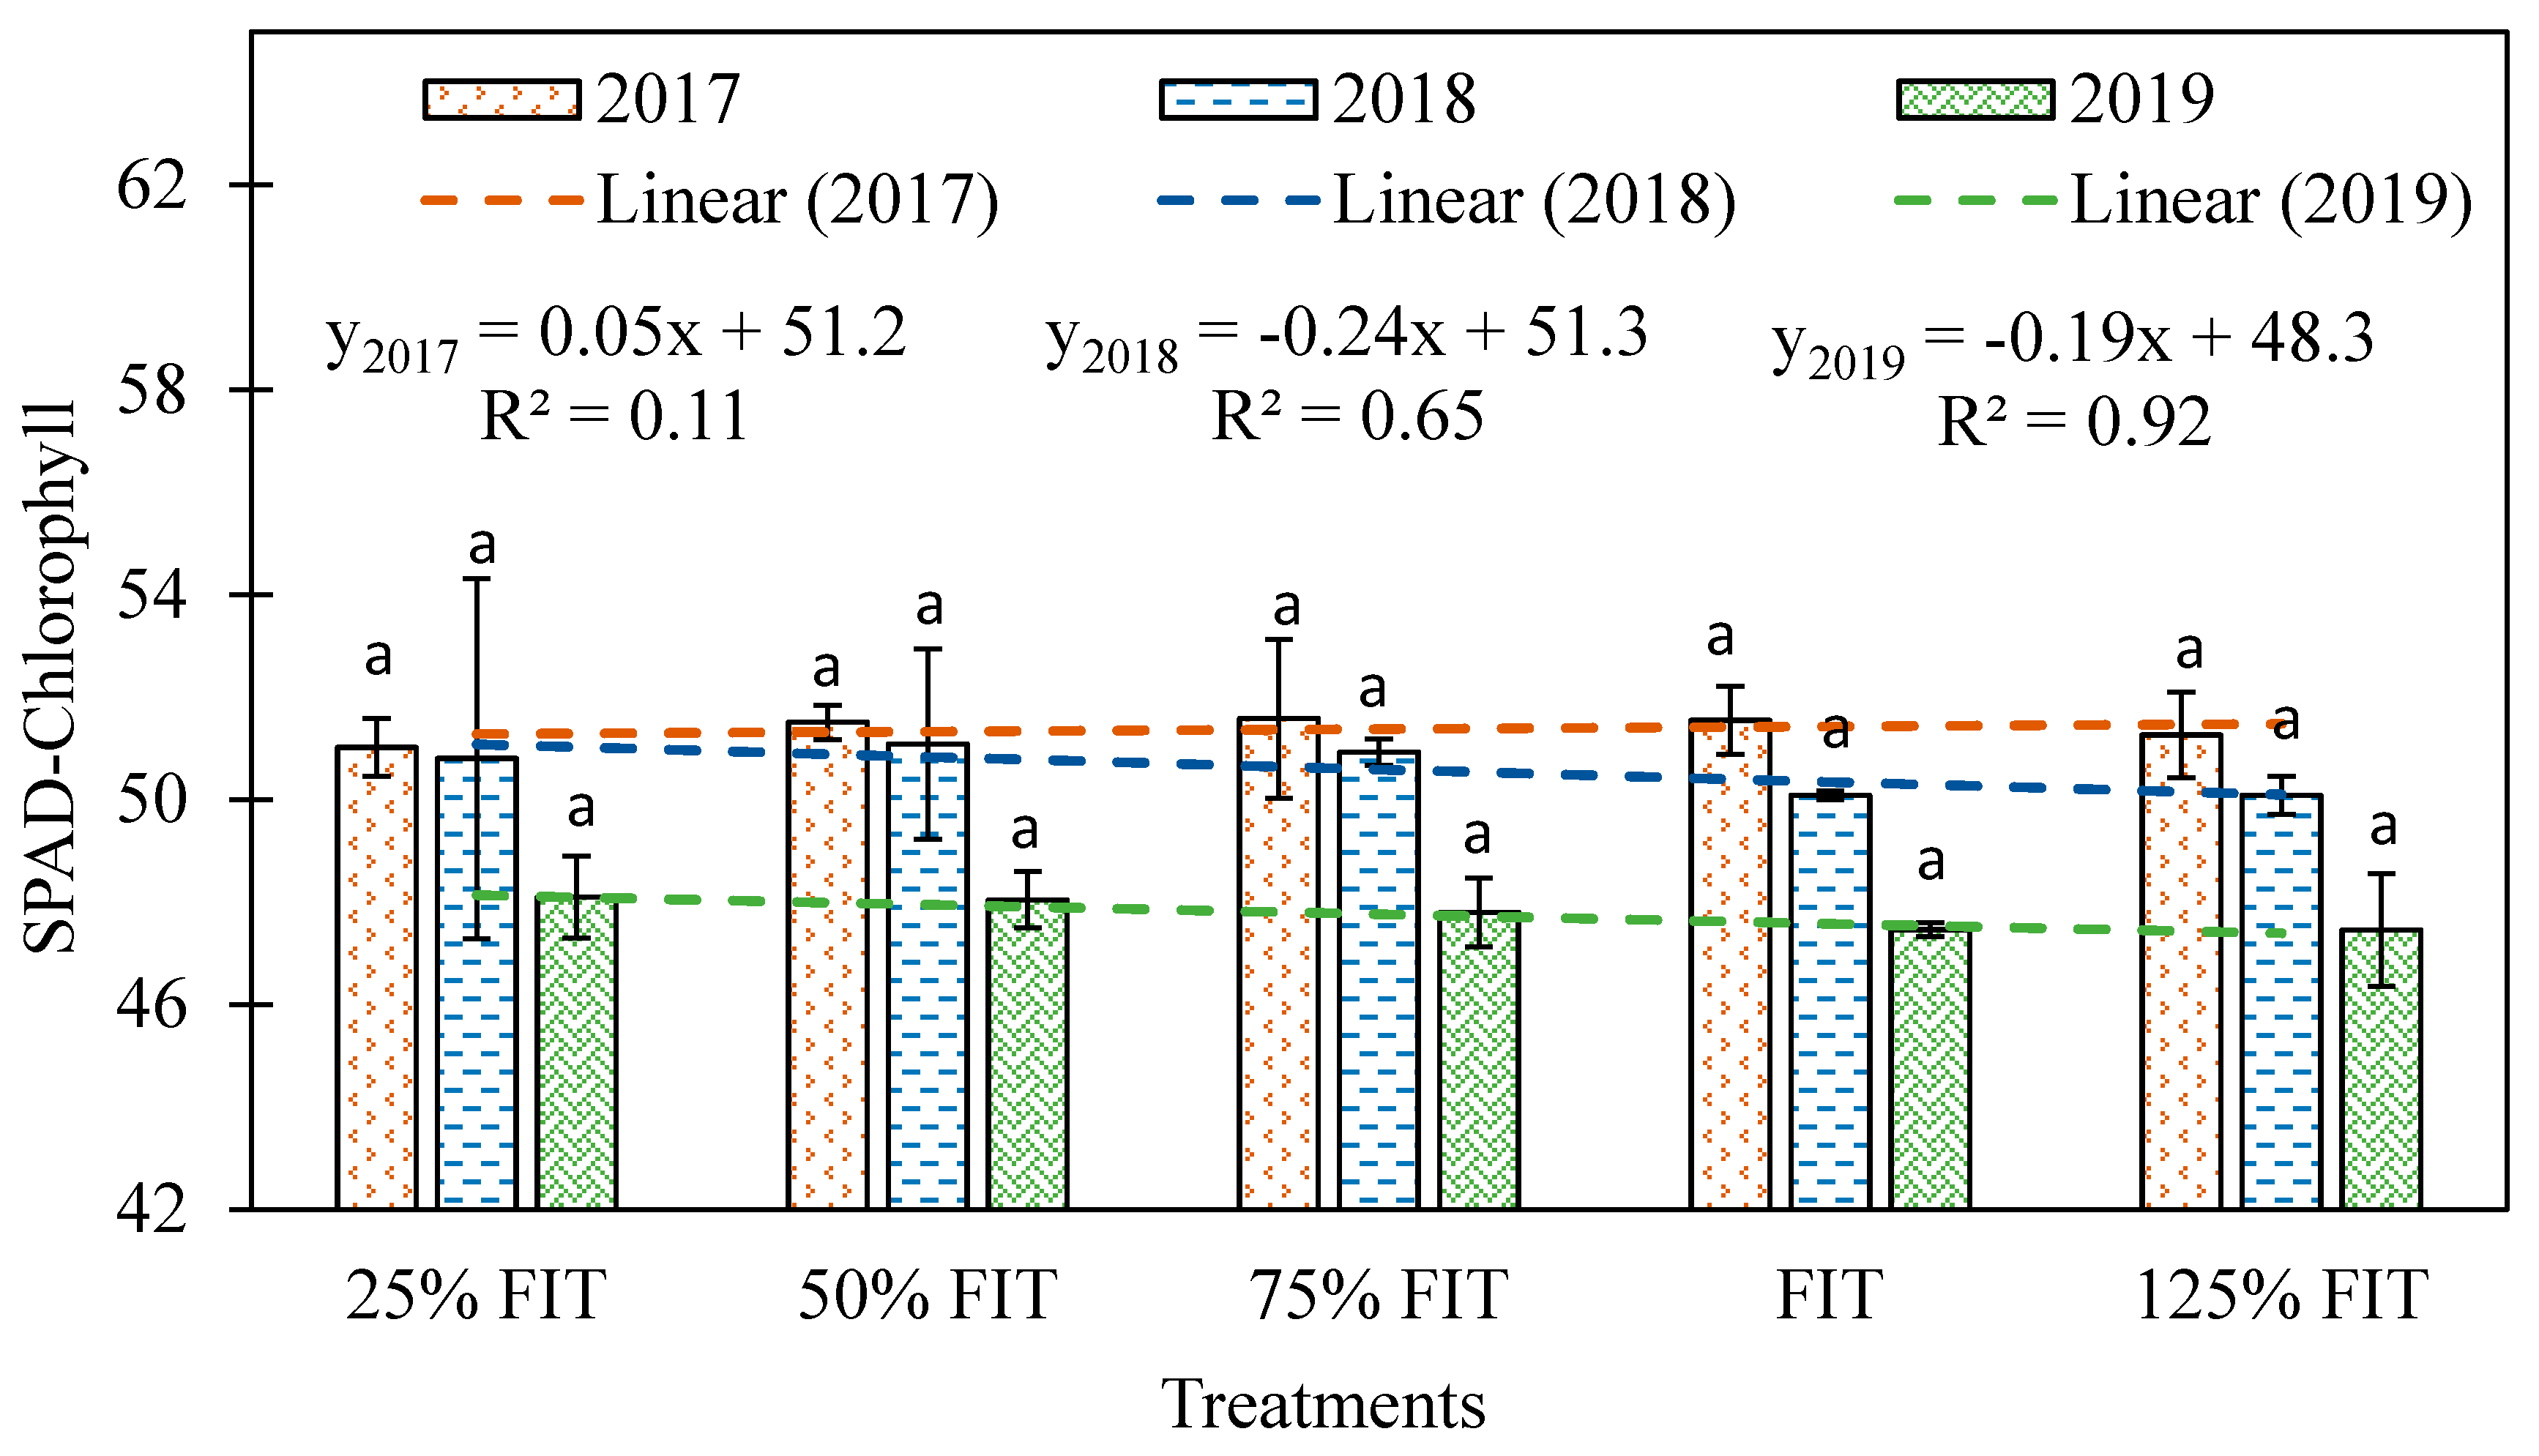
Average SPAD values for different treatments showed a slight negative trend for as irrigation rate increased in 2018 (R2 = 0.62) and 2019 (R2 = 0.92) but not for the 2017 growing season. The magnitude of SPAD for a given irrigation treatment exhibits substantial inter-annual variation (driest 2017 to wettest 2019) as it is influenced by the in-season irrigation management, precipitation amount and timings and other climatic variables, which varied substantially between the years (Figure 2 and Figure 3). The highest values were observed for the most severe water deficit treatment (25% FIT) which decreased towards higher irrigation treatments (Figure 4). However, no significant (p > 0.05) differences in SPAD values were observed between irrigation treatments. A similar observation was made by Boydston et al. [29], who observed a significantly higher SPAD value for deficit irrigation, and lower SPAD value for full irrigation; however, the increased SPAD was not found to be a consistent indicator of water deficit for pinto beans which agrees with our observations reported here.
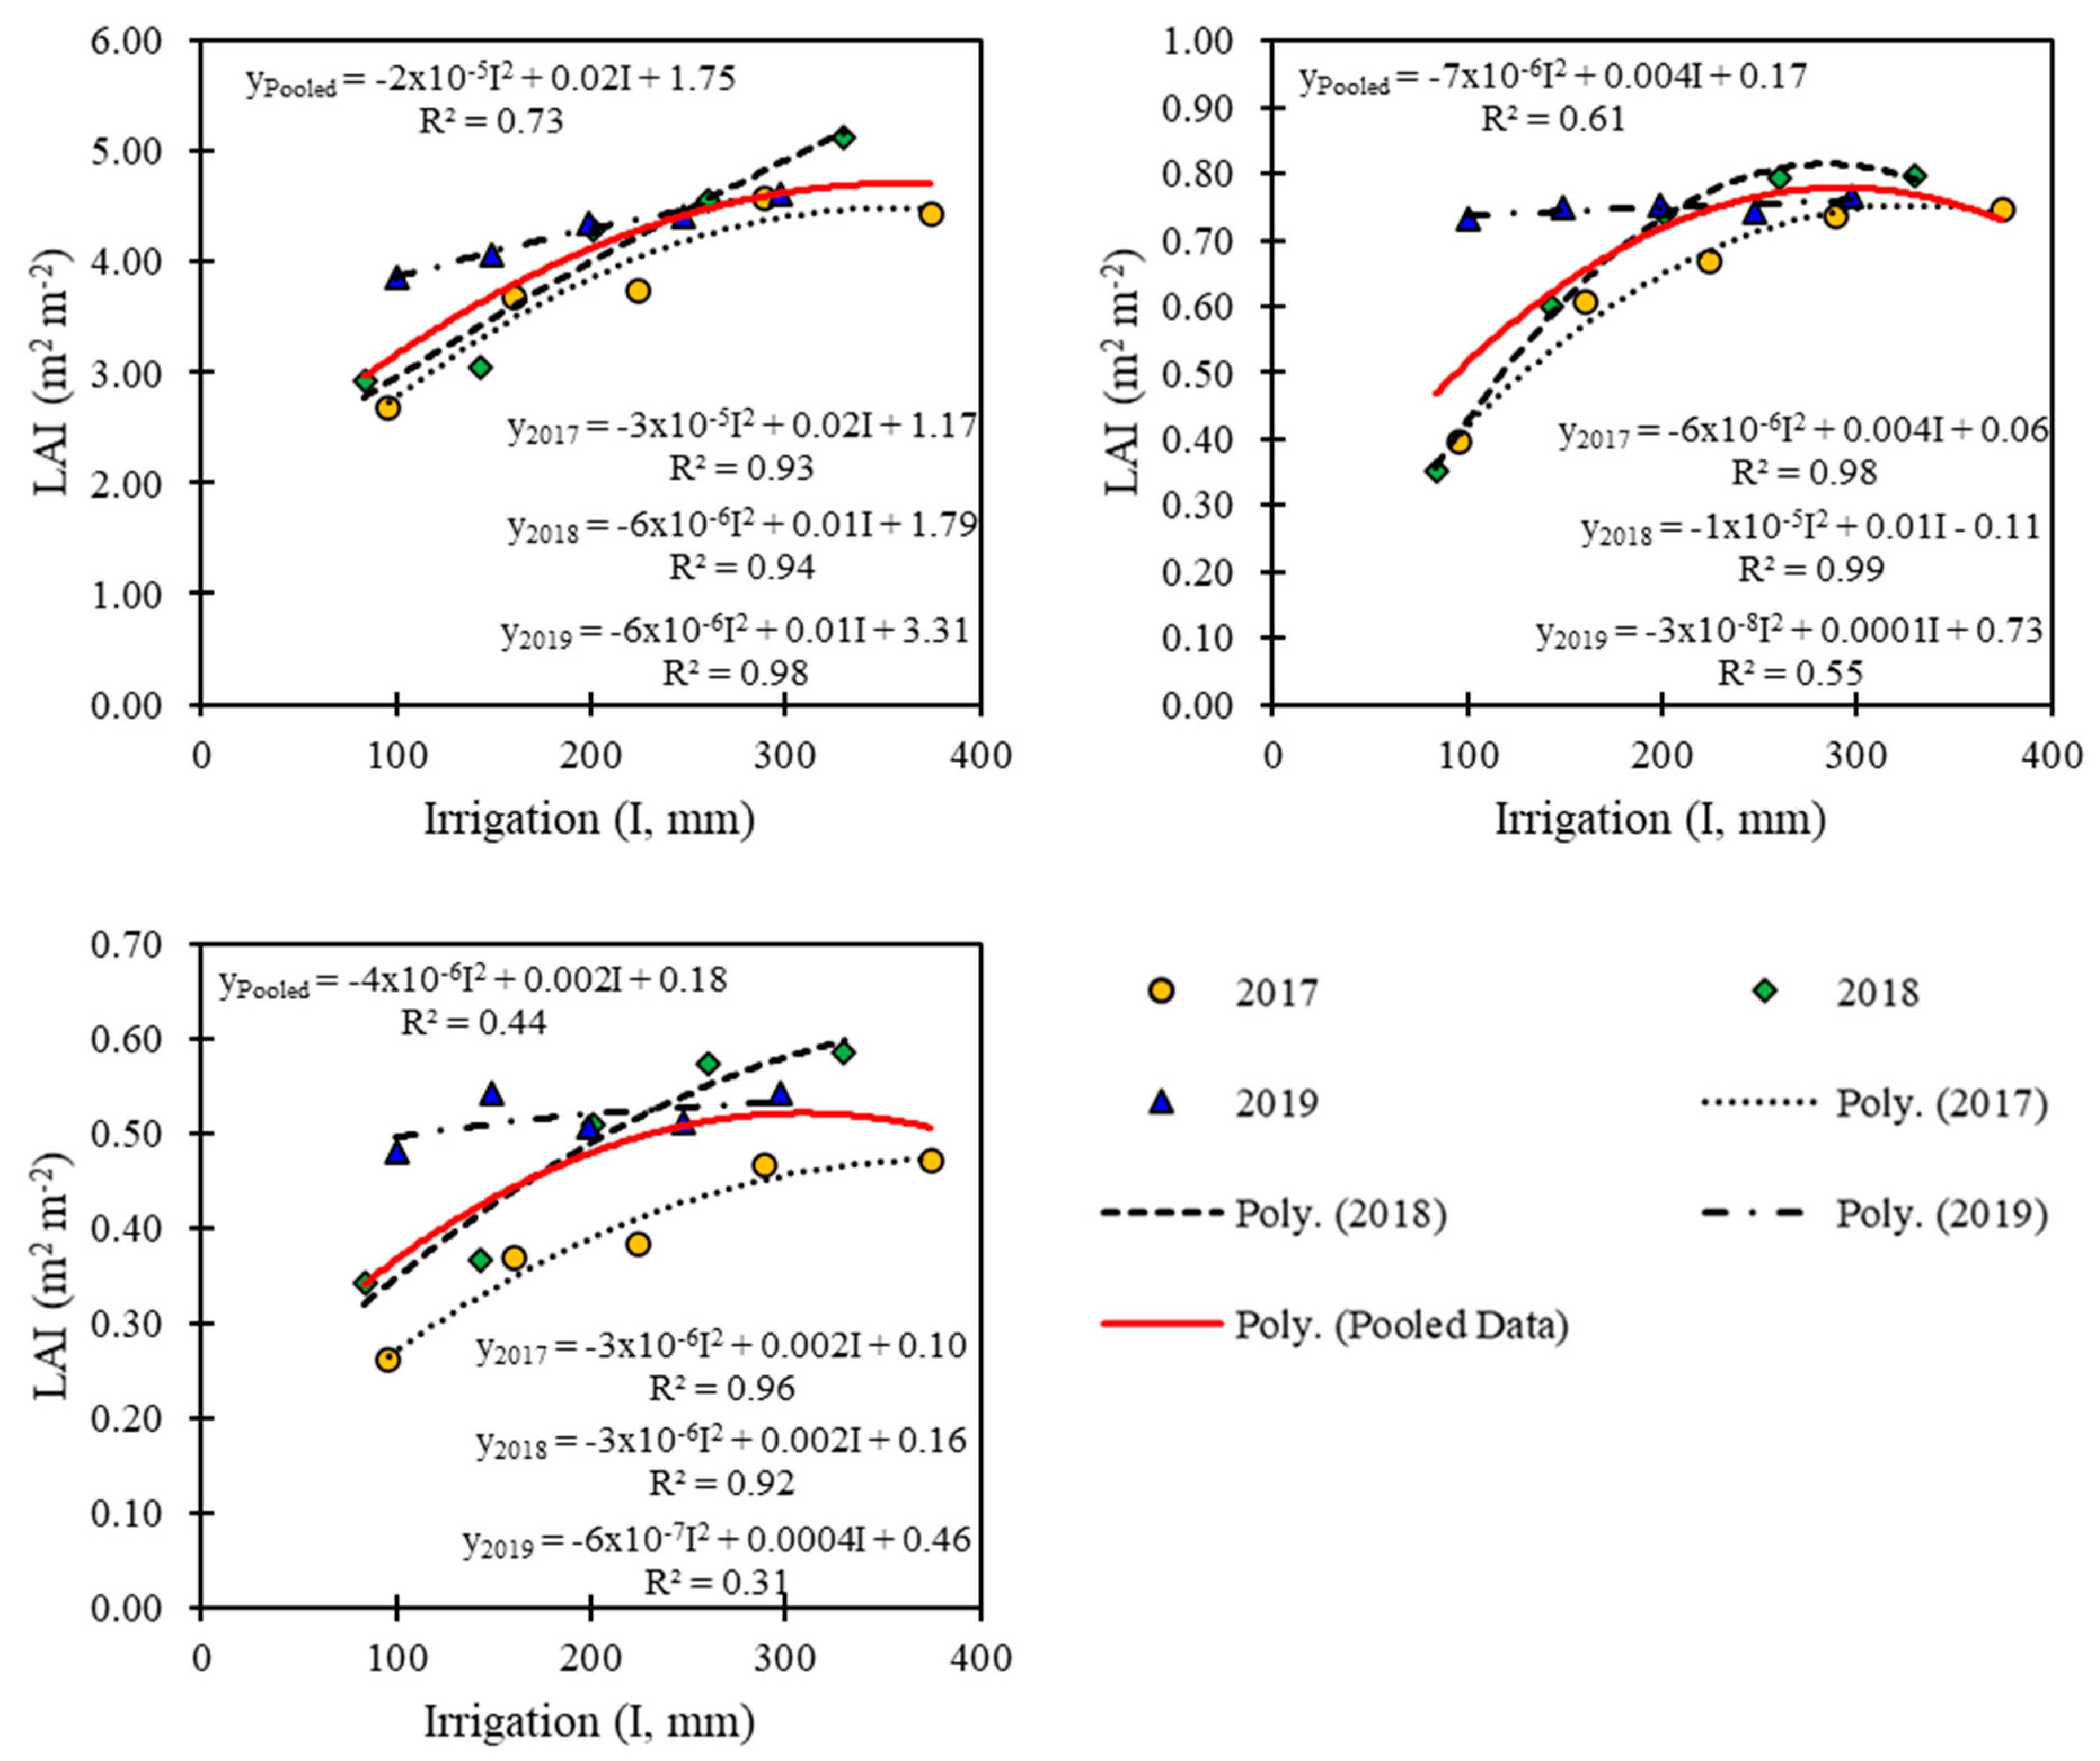
To further understand the effect of water deficit on dry bean growth, relationships were developed between the measured growth traits and irrigation amount (Figure 5). Since there are no significant differences in SPAD values among different irrigation treatments, relationships were developed only for LAI, NDVI, and h. It was observed that a seasonal irrigation amount in the range of 250–270 mm promoted optimum growth (highest LAI, NDVI, and h). Irrigation beyond that range did not lead to any significant increase in plant growth. In the 2017 and 2018 growing season, the quadratic equations indicated that irrigation explained 93% and 94% variability in LAI, 98% and 99% in NDVI, and 96% and 92% in h, respectively. However, the equations only explained 98%, 55%, and 31% of the variability in LAI, NDVI, and h in 2019, respectively. This may be due to the higher precipitation amount which resulted in minor water deficit differences among treatments.
3.2.4. Growth Models of Dry Bean
As already evident from the results of LAI, NDVI, and h, all the traits followed a similar trend in response to irrigation levels and there was a considerable influence on the magnitude of the response. However, all the aforementioned traits are influenced by local environmental conditions and management practices. In general, calendar days [Day after planting (DAP)] are often used to predict crop development. However, in many cases, DAP models can be misleading, especially for the early growth stages. For example, a cool early season can greatly delay the plant development or hotter than normal weather can advance the dry bean growth from mid-pod stage to physiological maturity. The extent of environmental influence is generally determined by GDD which is often used to model crop growth and other crop-growth-related traits [17,36]. In addition, the GDD-based models can be transferred for use in different regions with similar conditions without major deviations. Table 3 represents the generalized function of each growth trait using the pooled data for three growing seasons as a function of GDD as well as DAP. Functions were developed using the fourth-order polynomial function for LAI and NDVI and the second order for h with R2 ranging from 0.36 to 0.97. Similar higher-order polynomial functions (second to fourth order) were reported by Kukal and Irmak [37] for maize, soybeans, sorghum, and winter wheat for LAI, h, and other growth indices related to normalized cumulative growing degree days.
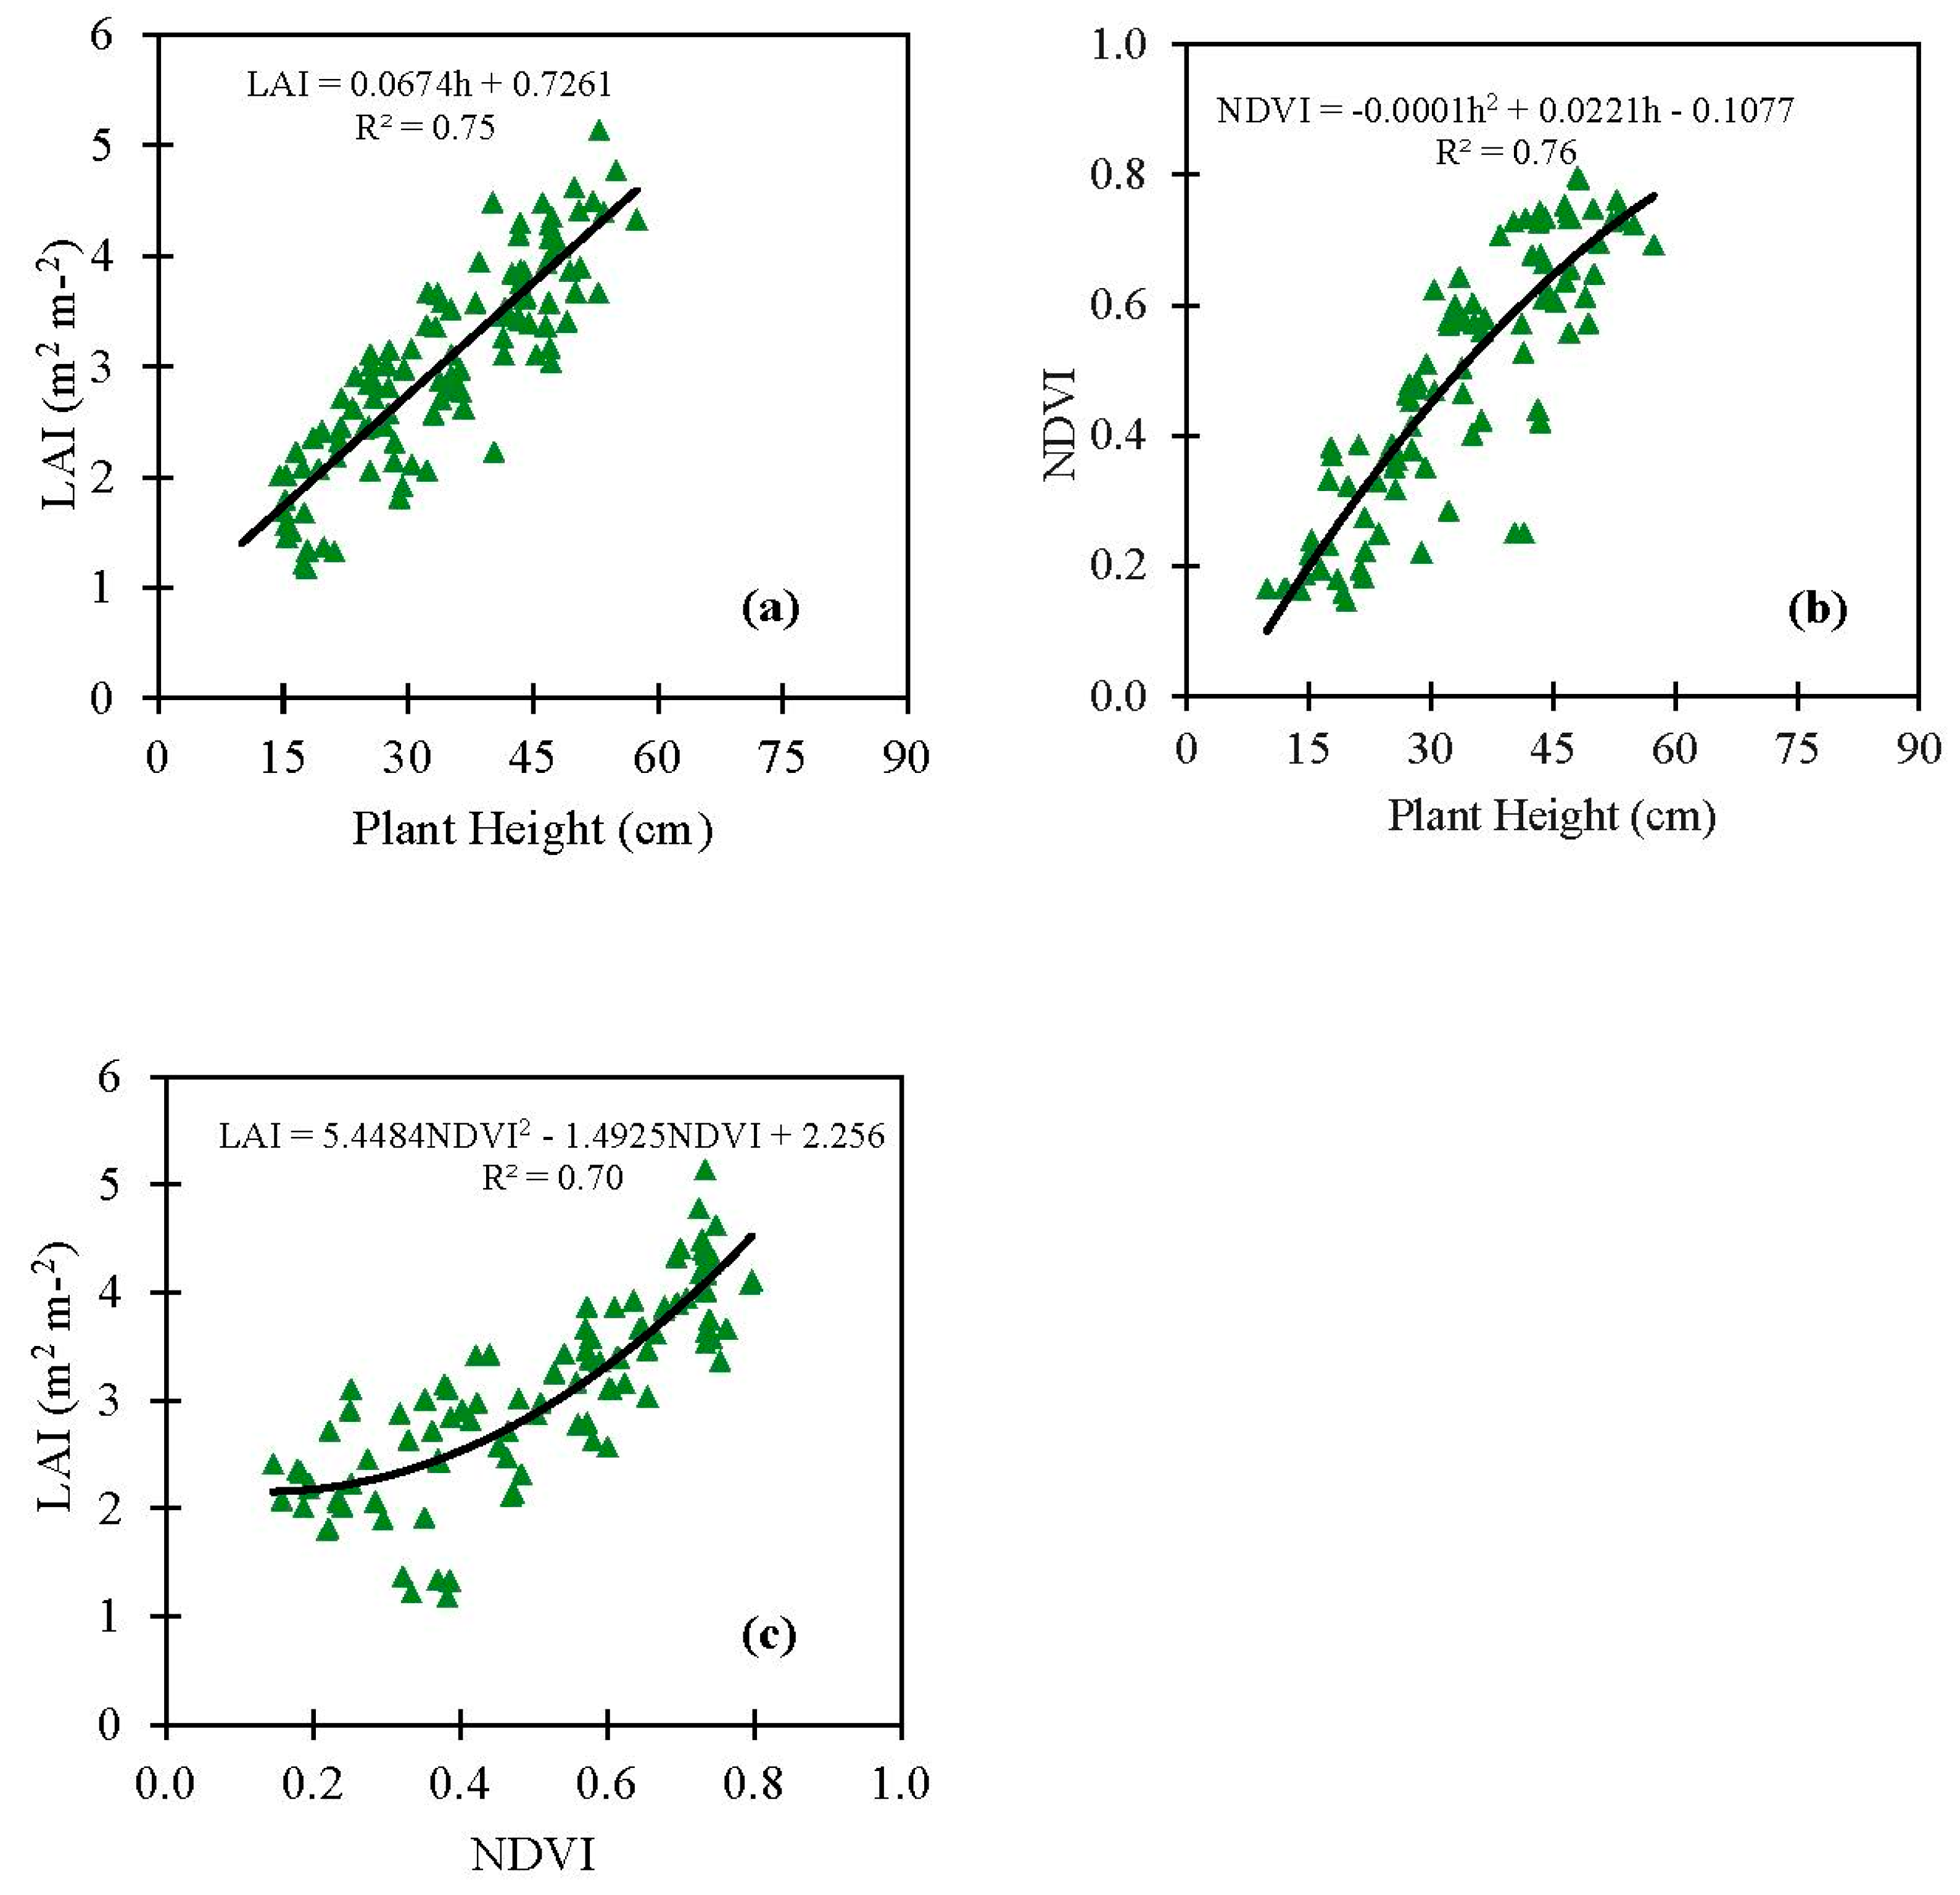
In addition to estimating growth traits using thermal energy available to crops, models were developed to understand the inter-relationship among LAI, NDVI, and h (Figure 6). These models were developed by pooling 2017, 2018, and 2019 growth indices data under different irrigation treatments. Prediction models to quantify traits such as LAI are critically important because of the high cost of instruments used to measure certain parameters, and skills needed. In general, h is relatively the cheapest and most straightforward of all the growth parameters to measure under field conditions but extremely complicated using remote sensing, where NDVI can easily be assessed using the crop reflectance data. These models further allow for easy parameter conversions and for the use in assessing plant growth without destructive sampling and help build more accurate whole-plant growth models with fewer required parameters and improve simulations at a regional scale. It was observed that LAI was linearly related to h, with h explaining 75% of the variability in LAI (pooled data); however, a curvilinear relationship was observed for NDVI, with h explaining 76% of the variability in NDVI. For dry beans, no increase in NDVI values was observed as soon as h reached 50 cm (Figure 6) and canopies interlocked. A curvilinear relationship with NDVI, and LAI explained a 70% variation in LAI (Figure 6c). Similar to dry bean h, no increase in NDVI values was observed beyond LAI values of 4. These results are in agreement with Nemeskéri et al. [38], who used GreenSeeker 505 portable model and LAI2000 Plant Canopy Analyzer to measured NDVI and LAI and reported a strong positive relationship between LAI and NDVI, with NDVI explaining 82% and 94% of the variability in LAI in 2011 and 2013, respectively, for snap beans in Hungary. Similar results were reported by Papadavid et al. [39], who used remote sensing methods to model LAI and h using vegetation indices and found the exponential equation was equally good for estimating the relationship between LAI and NDVI (R2 = 0.93) across the entire growth stages. To best of our knowledge, these empirical models are among the first investigated models developed using measured data for dry beans. Nevertheless, the models developed in this research allows for easy parameter conversions and for the use in assessing plant growth without destructive sampling and help build more accurate whole-plant growth models with fewer required parameters and could improve and lessen the costs of simulations at a regional scale using remote sensing technology. These models can further be used to understand and quantify the response of dry bean growth to different environmental variables across different dry bean grown regions. In addition, the models developed in this study can also be used to supplement remote sensing (Unmanned Aerial Systems (UAS)/Satellite) data. For example, in recent years many studies have used satellite or UAS reflectance data to monitor various crop growth indices to access crop health and development [40,41]. However, in many cases, remotely-sensed measurements are not able to capture the progression of crop growth and development due to constraints such as cloud cover, precipitation, UAV flight restriction, and other operational challenges, etc. Under these conditions, the models developed in this study help to improve simulations on a regional scale by substituting model calculated values for the period of missing data, and also improve accuracy by validating remotely accessed data against the regional models.
3.3. Effect of Irrigation Treatment on Dry Bean Seed Yield (SY) and Yield Components
All agricultural production systems aim to get higher crop yield per unit of land area with optimal resource use. Crop yield is a function of crop growth and development and yield components under different irrigation and management practices. Five yield traits, SY, number of pods plant−1, seeds pod−1, SW, and PHI were investigated. In addition, inter-relationship between SY and yield components were evaluated to determine the most sensitive yield component in response to irrigation rates. A companion paper Sharma and Rai [19] presents the effect of water stress on the dynamics of dry bean soil moisture and ETc and studied the response of dry bean SY to irrigation and ETc by developing irrigation and crop water production functions.
3.3.1. Dry Bean Seed Yield (SY)
Water deficit significantly (p < 0.05) influenced the dry bean SY in all three growing seasons with significant inter-annual variation (Table 4). For all growing seasons, the average SY showed a decreasing trend in response to increasing water deficit. In 2017, SY varied from 264 kg ha−1 (SD = 94 kg ha−1) for 25% FIT to 3630 kg ha−1 (SD = 719 kg ha−1) for FIT, while in 2018 SY varied from 278 kg ha−1 (SD = 65 kg ha−1) for 25% FIT to 3826 kg ha−1 (SD = 257 kg ha−1) for 125% FIT. In the 2019 growing season, SY varied from 1436 kg ha−1 (SD = 61 kg ha−1) for 25% FIT to 3665 kg ha−1 (SD = 109 kg ha−1) for FIT. No significant increase in SY was observed for irrigation beyond FIT in any of the growing seasons. The SY under 75% FIT was significantly lower (p < 0.05) than the SY obtained under FIT in 2018; however, no difference in SY between these two treatments was observed in 2017 and 2019. Several researchers have found dry bean to show a similar decline in SY under water deficit [6,42,43]. Miller & Burke [11] reported a linear increase in dry bean SY for increasing irrigation rates up to 1.0ET and no significant increase beyond this threshold. Al-Kaisi et al. [44] found that the dry bean biomass kept increasing up to the irrigation rate of 1.33ET. However, the irrigation beyond 0.67ETc did not result in a significant increase in SY under drip irrigation in that study.
Moreover, dry bean SY for the same treatment exhibited the inter-annual variation as a function of climate conditions coupled with water deficit magnitude and timing (Table 4). A two-way ANOVA revealed a significant interaction between years and treatments in response to water deficit. The SY for deficit irrigation treatments (25% and 50% FIT) was higher in 2019 compared to 2017 and 2018 growing season. Whereas, there were no significant differences in SY between years for 75% FIT, FIT and 125% FIT. Wetter conditions early in the 2019 growing season up to the reproductive stage allowed a significant increase in SY for 25% FIT and 50% FIT compared to the 2017 and 2018 growing season.
Besides one peculiar result observed was lower SY in 2019 growing season compared to 2018 growing season for higher irrigation rates (FIT and 125% FIT), even though vegetative growth had no major difference. The probable reason for this may be the temperature differences among years. The average Tmax for August in 2019 was 29.3 °C compared to 28.1 °C in 2018, which may have negatively impacted the pod setting and maturation. Masaya & White [45] have shown that temperatures above 28 °C can cause flower drop, a reduction in pollen viability, and abortion of fertilized ovules in common beans. Overall, the climatic condition in 2018 and 2019 had a cooler climate and higher frequency of rain events. The added heat stress of high daily Tmax (number of days with Tmax > 30 °C) in vegetative and flowering growth stages in 2017 resulted in greater negative response in dry bean. Higher temperature reduces photosynthesis and results in excessive flower drop and pollen sterility due to tapetal degeneration in dry bean which further reduces the number of pods and seed per pod and SY [43]. Muñoz-Perea et al. [43] using furrow irrigation with cv. ‘Othello’ at the University of Idaho-Kimberly Research and Extension Center in 2003 and 2004, reported a 24% reduction in SY when irrigation was reduced by 65% in the milder growing season whereas the reduction was 34% when irrigation was reduced by 43% in the hotter growing season.
To further understand the reduction in SY under water-stressed conditions, Deficit Irrigation Stress Index (DISI) was quantified. DISI is defined as a relative reduction in SY compared to the SY under non-stressed conditions [46,47,48]. The 25% FIT treatment experienced severe water deficit and had the highest DISI of 93%, 93%, and 61% in 2017, 2018, and 2019, respectively. Withholding 25% of irrigation water from FIT decreased SY by 37% in 2017, 40% in 2018, and 13% in 2019. Besides, increasing irrigation by 25% above FIT resulted in SY reduction by 8.9% in 2017 and 1.8% in 2019, whereas, no effect was observed in 2018. Yonts et al. [49] have reported dry bean SY reduction of 3%, 23%, and 46% for incremental irrigation deficit of 25%, 50%, and 75%, respectively, in comparison to 100% ET under sprinkler irrigation in Nebraska. These reductions in SY on average are lower than the findings of other studies for similar water-deficit treatments. The probable reasons may be the difference in drought tolerance of the dry bean varieties used, and plant population, and partly due to the difference in weather conditions and soil properties. Boydston et al. [29] reported dry bean SY reduction ranging from 32% to 76% when deficit irrigation was imposed for one month after crop emergence in 2015 and 2016 on the Washington State University research farm near Prosser, WA. Asemanrafat and Honar [27] observed SY reduction of 14%, and 31% when irrigation was reduced by 20%, and 40%, respectively, in comparison to 100% ET, whereas SY increase of 4% was observed when irrigation was increased by 20%, under furrow irrigation. Overall, these results indicated that under normal climatic conditions of the inter-mountain region of Big Horn Basin, reducing irrigation by as little as 25% from the FIT can significantly reduce dry bean SY. The steeper decline in dry bean SY for 25% FIT and 50% FIT in all seasons indicated that dry bean in these plots was more severely stressed compared to 75% FIT during the vegetation growth stages, which resulted in less flowering and reduced pod formation.
3.3.2. Yield Components: Pods Plant−1, Seeds Pod−1, Seed Weight (SW), and Pod Harvest Index (PHI)
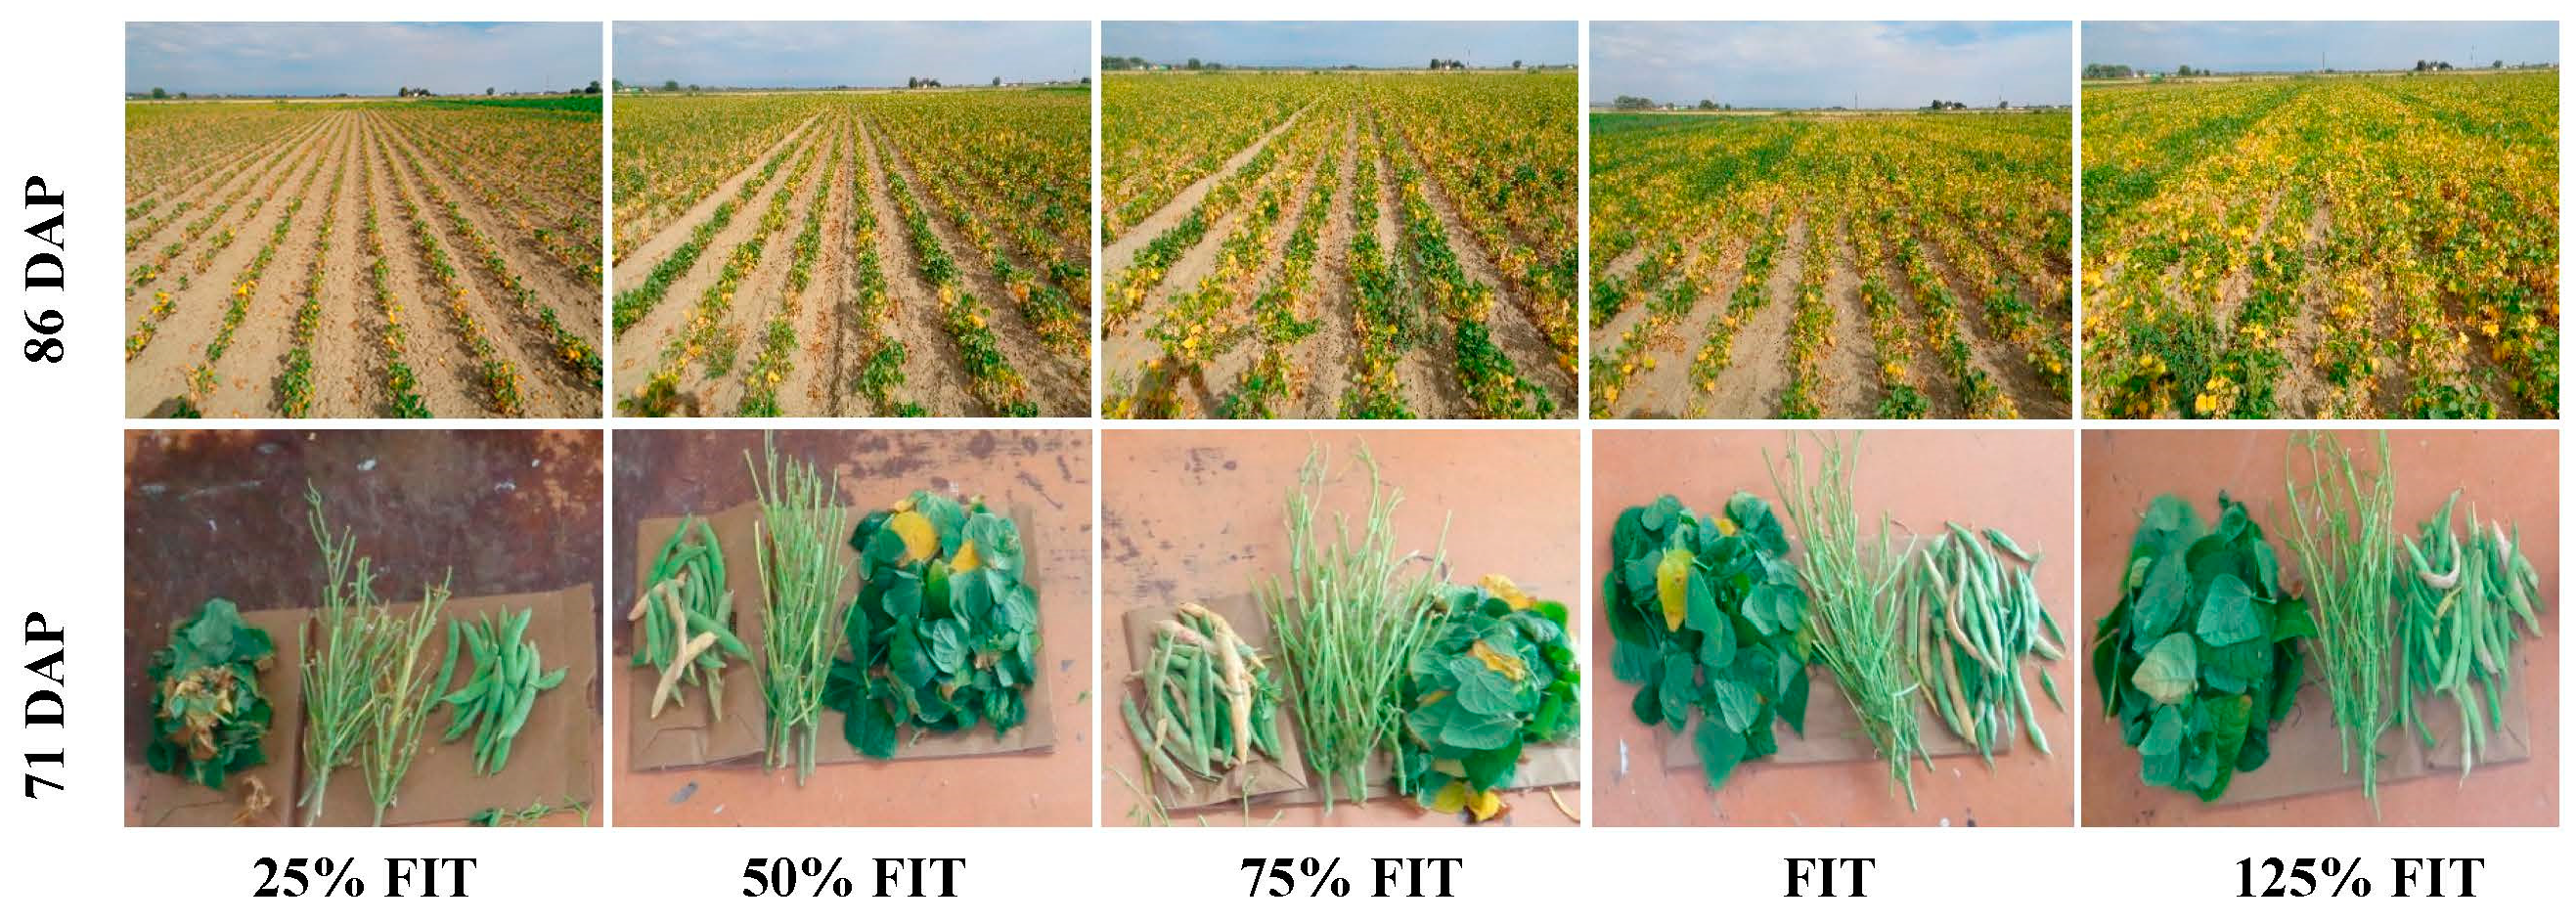
The pods plant−1, seed pod−1, SW, and PHI are important SY components and their variations help to determine the difference in dry bean SY between the growing seasons (Table 4). All yield components exhibited similar variations to SY in response to irrigation levels, except PHI. Images were captured after the flowering and pod formation growth stages to infer the visual difference in crop canopy and yield components among different irrigation treatments (Figure 7). ANOVA revealed a significant effect of irrigation amount on pods plant−1, SW and seed pod−1 in 2017, 2018, and 2019 (Table 4). For all the growing seasons, the highest pods plant−1, seed pod−1, and SW were observed in FIT, and lowest was observed for 25% FIT, whereas, 125% FIT did not lead to any significant increase in any yield components in any of the growing seasons. Higher yield component values produced in 2019 may be due to comparatively lower water deficit during the vegetative stage [9]. PHI did not significantly vary with irrigation amount for any of the growing seasons. However, PHI was always highest for the treatment that had the highest SY for the individual growing season (Table 4). Moreover, no significant interaction between treatments and years was observed for any of the studied yield components. Reduction in irrigation by 25%, 50%, and 75% compared to FIT resulted in average reduction (average of three years) in pod plant−1 by 19%, 34%, and 59%; seed pod−1 by 6%, 17%, and 23%; and SW by 6%, 19%, and 28%, respectively. These results are in line with Asemanrafat and Honar [27], that reported that pods plant−1 of red-bean cultivar (cv. Akhtar) grown under furrow irrigation increased from 60% ET up to irrigation gradient of 100% ET, while there was no significant difference in pod plant−1 when irrigation rate increased from 100% ET to 120% ET. In another study, Saleh et al. [50] found that pods plant−1 (within a green bean market class) increased from 60% ET to 80% ET and declined for 100% ET in an environmentally-controlled greenhouse experiment. Boydston et al. [29] observed significantly higher SW and PHI under full irrigation (100% ET) than deficit irrigation (52% ET) for the eight pinto bean cultivars tested under sprinkler irrigation.
3.4. Relationship between Dry Bean Seed Yield (SY) and Yield Components
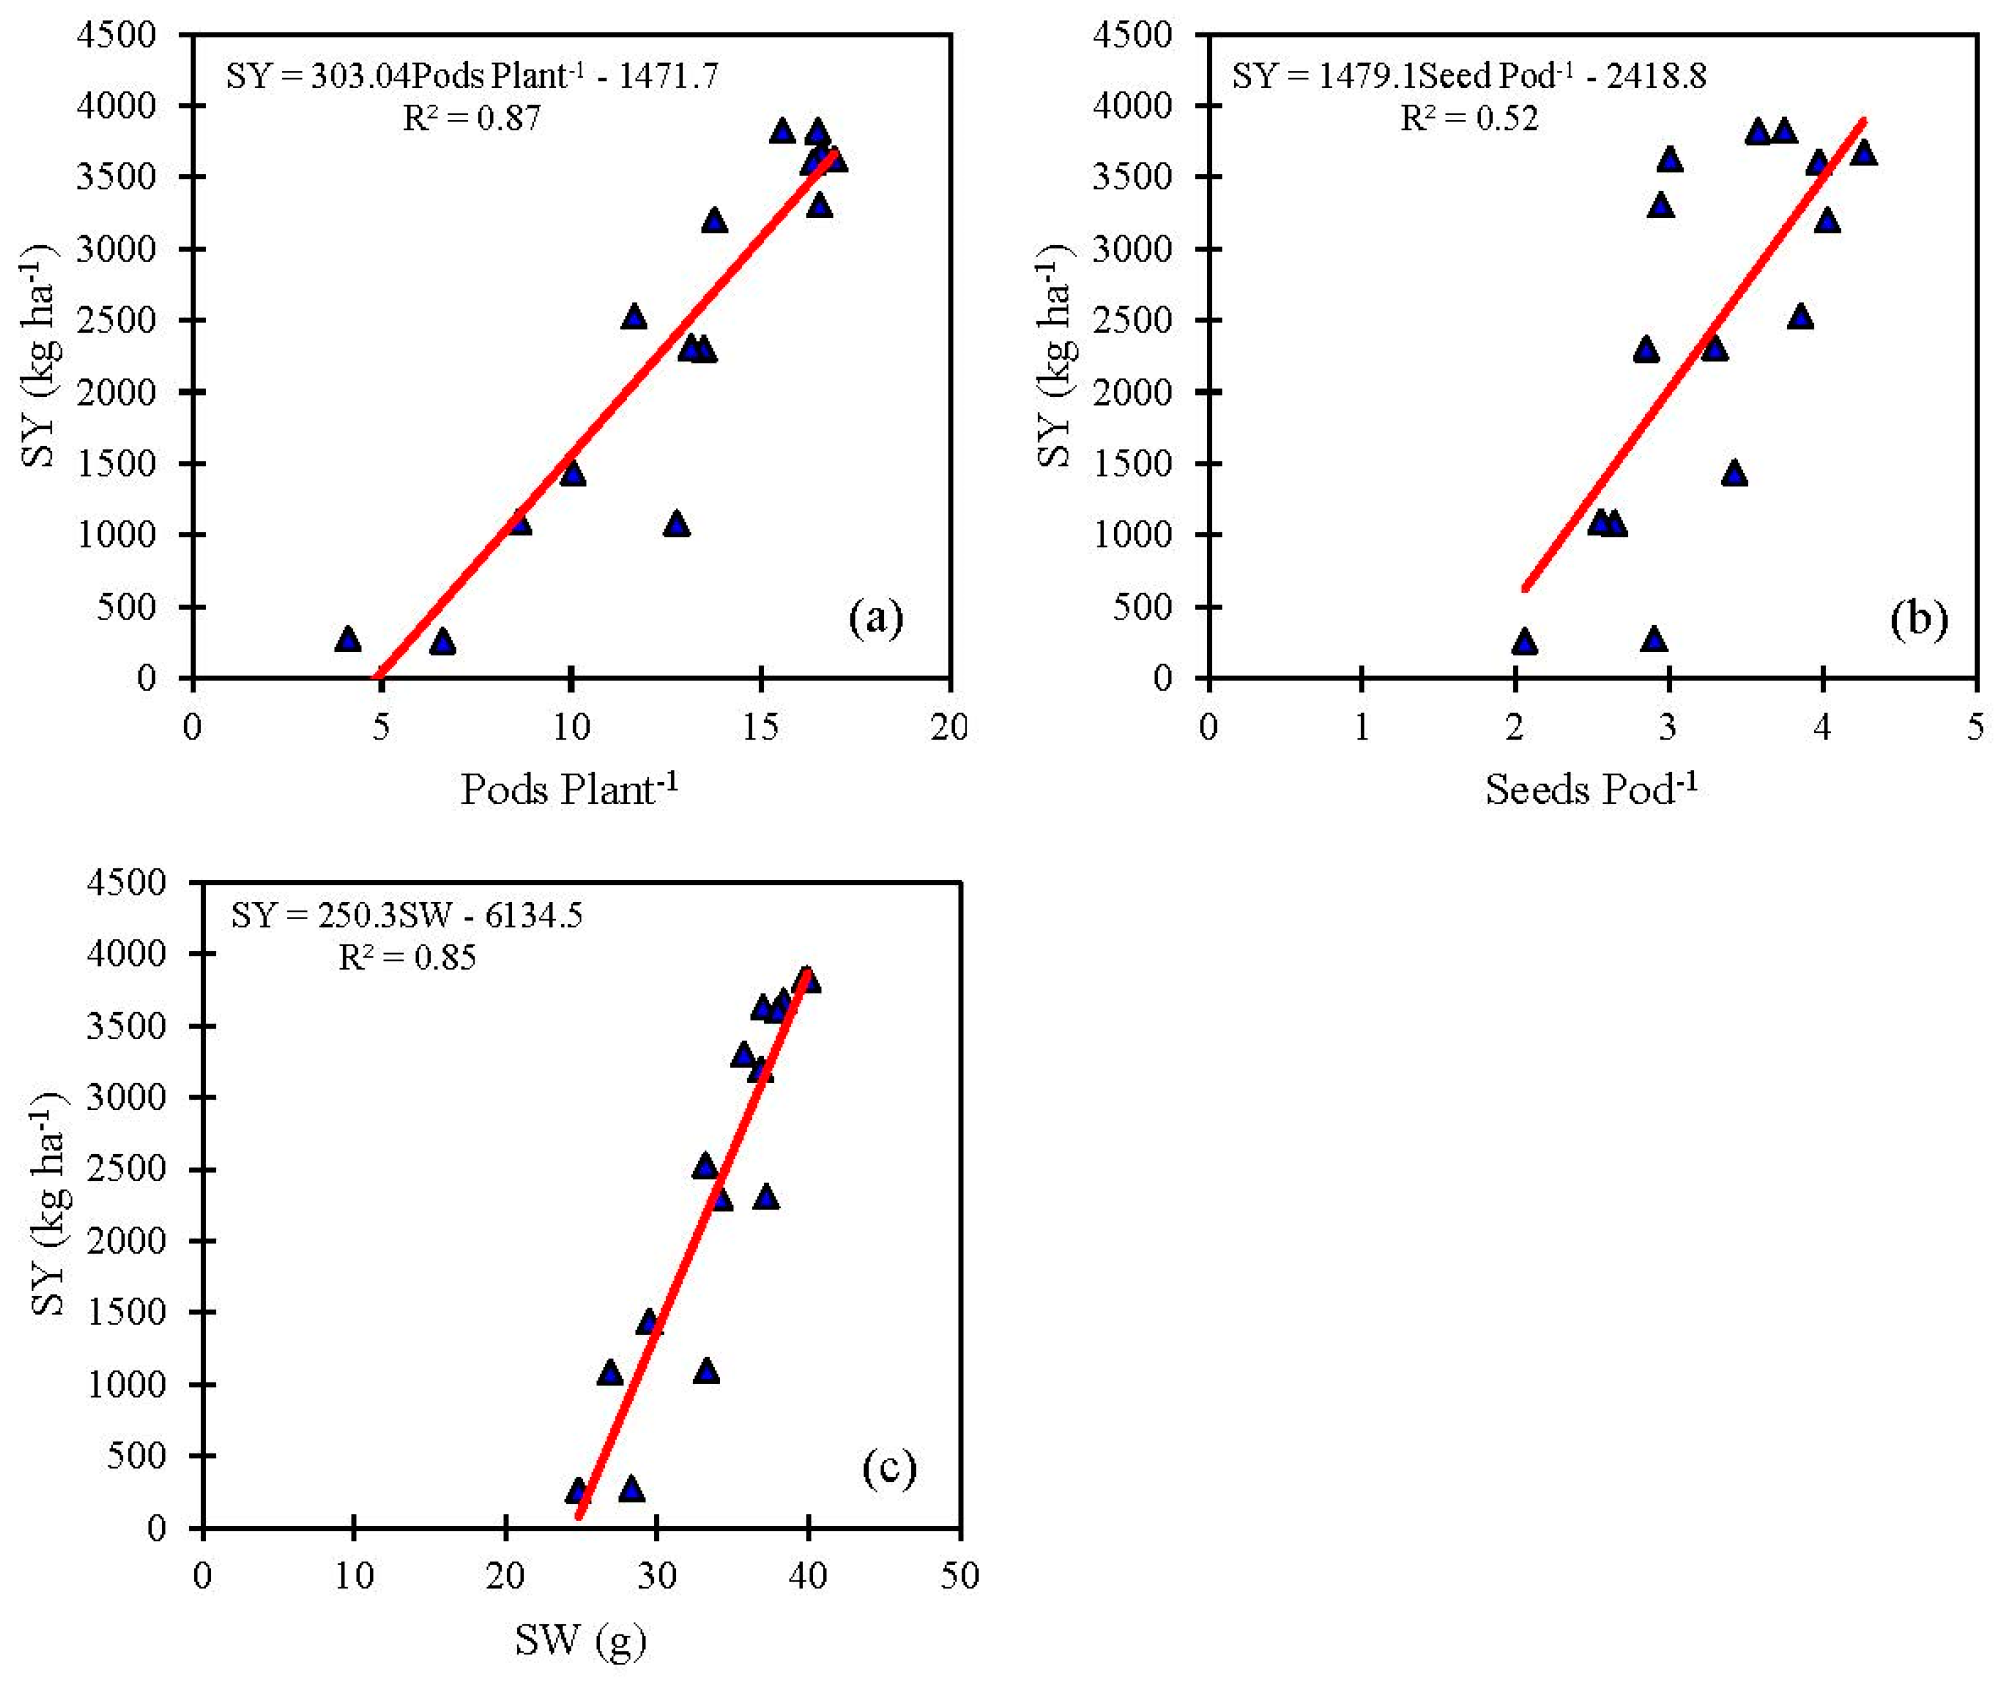
Dry bean SY (kg ha−1) is a function of pods plant−1, seeds pod−1, and SW. To understand the dynamics of dry bean SY variation among different irrigation treatments, relationships were developed between SY and yield components (pods plant−1, seeds pod−1, and SW) (Figure 8). A significant (p < 0.05) positive linear relationship exists between SY and pods plant−1, seeds pod−1, and SW. An increase in yield components increases SY. However, the slopes of the relationships were different for different yield components. For example, a respective unit increase in pods plant−1, seeds pod−1 and SW increased the dry bean SY by 263 kg ha−1, 1390 kg ha−1, and 242 kg ha−1. In general, pods plant−1 and SW were better related to SY and explained 71% and 82% variation in SY. Overall, our research indicated that the SY was affected more by the number of pods plant−1 than by seeds pod−1. The relationship developed in this study confirms the results reported by Nuñez Barrios et al. [4], who found a similar reduction in seeds pod−1, pods plant−1, and individual seed weight in response to water stress. They concluded that drought stress can result in SY losses of up to 60% in common beans and they attributed this to a 63.3% reduction pods plant−1, 28.9% in seeds pod−1 and 22.3% in seed weight. A similar observation was made by Loss and Siddique [7], who reported a significant correlation between faba bean yield with the number of pods plant−1, explaining 79% and 55% variation in yield in 1993 and 1994 in the Mediterranean-type environment. Pandey et al. [46] also reported all three yield components, pods plant−1, seeds pod−1, and seed weight to be important, and a similar decrease in the magnitude of yield components in response to water stress. Overall, dry bean SY is reduced in response to drought due to a reduction in yield components.
3.5. Relationship between Dry Bean Growth Traits and Seed Yield (SY) and Yield Components
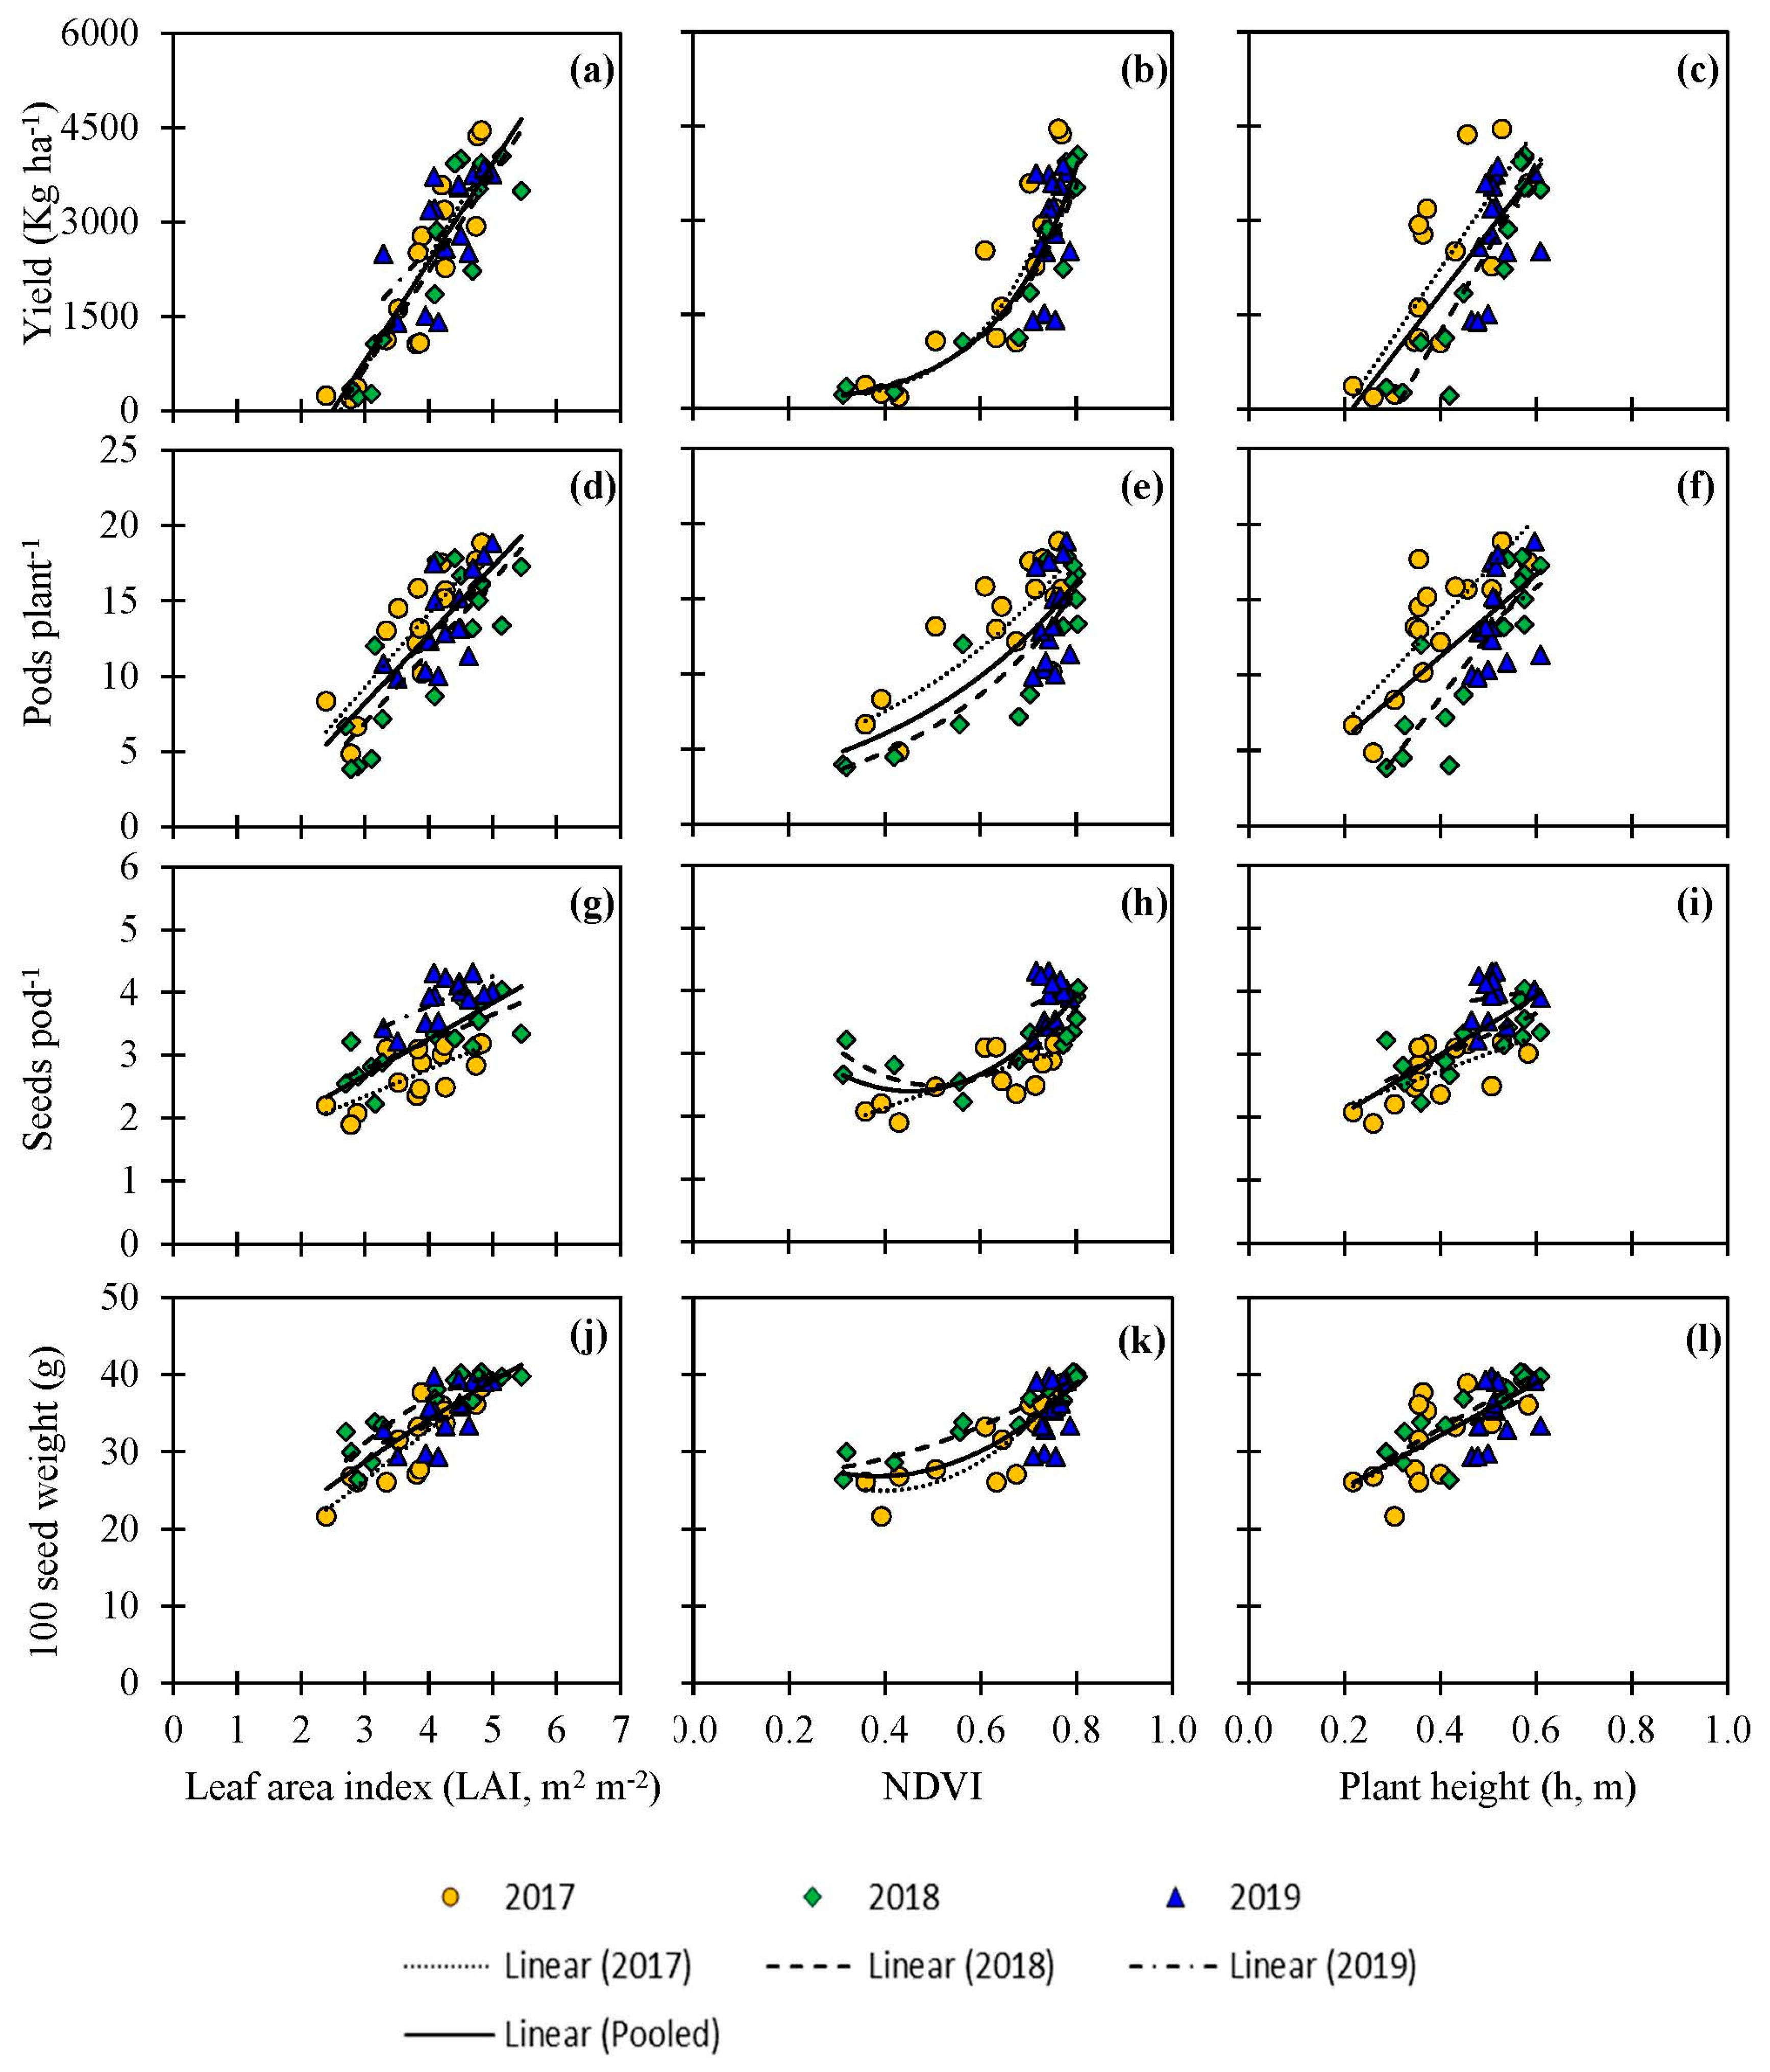
As evident from the discussions in the previous sections, it is clear that irrigation amount affects dry bean growth and development as well as SY and yield components. The present hypothesis is that the irrigation amount directly influences the growth of dry beans and indirectly the SY. To test this hypothesis, relationships were developed between maximum values of growth traits (LAI, NDVI, and h) and SY and yield components to understand and assess the role of growth parameters on SY and yield components. Relationships for SPAD-Chlorophyll and Pod harvest index (PHI) are not shown as these parameters did not significantly vary with irrigation levels. These relationships are shown in Figure 9 and the respective functions with the coefficient of determination (R2) values are presented in Table 5.
All the growth parameters had significant positive correlations with SY and yield components (Figure 9), with an increase in vegetative growth leading to an increase in SY. The relationship between SY and h and LAI was described by the linear function, while exponential relationships were observed between SY and NDVI, respectively. In general, the correlation between growth parameters and SY were slightly larger in magnitude and similar in sign to their corresponding relationship with yield components. Pooled data from three years indicated that maximum LAI explained approximately 74%, 62%, 42%, 65% of the variation in SY, pods plant−1, seeds plant−1, and SW, respectively. NDVI was better related to the SY and yield components and R2 varied from 0.54 for seeds pod−1 to 0.86 for SY. Similar observations were made by Mathobo et al. [51], who reported that drought stress in dry bean results in reduced carbon dioxide concentration in leaves, stomatal conductance, transpiration, and photosynthetic rate, which in turn resulted in a decrease in vegetative growth and SY. A review of several studies showed that water stress in crops results in reduced leaf growth and rate of leaf emergence within days, and if continued for weeks leads to reduced leaf size and lateral shoots, and ultimately the SY [52]. The results from our research indicated that water deficit influences dry bean growth, which results in a parallel response in SY and yield components and that the high yielding ability of dry bean is associated with growth traits. Selection for these traits might result in a correlated response for increased yield. However, it is important to note that these relationships indicated that growth traits and yield components are not independent and the increased level of expression of one growth trait may result in a change in others.
4. Conclusions
The objectives of this research were to quantify the effect of irrigation treatments on dry bean growth, SY, and yield components and to develop empirical models between dry bean growth indices and environmental conditions, SY, and yield components in response to water deficit in the arid to semi-arid climate. The models developed in this study are among the first investigated models developed using the measured data for dry beans. The results of this research showed that both dry bean growth and SY were strongly affected by water deficit. However, the degree to which the vegetative growth and SY were reduced was dependent on the weather conditions. Water deficit at the beginning of the vegetative growth dramatically reduced dry bean h, LAI, and NDVI and shortened the number of days to reach the maximum h, LAI, and NDVI. The growth models presented in this research for different irrigation treatments can act as useful tools to assess in-season crop growth and detection of stress. It was observed that an irrigation amount in the range of 250–270 mm promotes optimum growth (highest LAI, NDVI, and h) and result in high SY. Irrigation beyond that range does not lead to a significant increase in plant growth and SY. Reduction in 25% of irrigation from FIT resulted in an average reduction of 30% in dry bean SY. Much higher SY losses of 40–93% should be expected as a result of severe water deficit. Inter-relationship among different growth parameters presented in this study would allow for easy parameter conversions, assessing plant growth without destructive sampling, help build more accurate whole-plant growth models with fewer required parameters, and improve simulations at a regional scale using remote sensing technology.
An indirect objective of this research is to identify the yield components and growth traits that might prove useful as selection criteria for improvement in dry bean SY. Inter-relationship between dry bean SY and yield components indicated that pods plant−1 and SW were better related to SY and explained 71% and 82% variation. Moreover, the relationship presented between growth parameters and SY and yield components indicated that LAI and NDVI both are good predictors of dry bean SY. Both pods plant−1 and seeds pod−1 were better correlated with NDVI than LAI and h. As the plant growth traits can be more easily estimated compared to other yield components, these relationships might be useful in dry bean breeding programs and help in predicting and estimating crop yield in-season and allow for corrective management decisions.
Author Contributions
V.S. conceptualized the idea, obtained funding, and designed the experiment. A.R. led the field data collection under the supervision of V.S. A.R. and V.S. worked on the data analysis, interpretation, and drafted the manuscript. J.H. contributed in the data interpretation and statistical analysis. V.S. and J.H. edited the manuscript. All authors have read and agreed to the published version of the manuscript.
Funding
This research was funded by the Wyoming Department of Agriculture, Specialty Crop Block Grant Program, project# 1003538, the Wyoming Bean Commission, and National Institute of Food and Agriculture, United States Department of Agriculture, Vivek Sharma’s Hatch Project # WYO-590-18.
Conflicts of Interest
The authors declare no conflict of interest.
References
- USDA. NASS. Available online: https://www.nass.usda.gov/ (accessed on 15 December 2018).
- Schwartz, H.F.; Brick, M.A. Dry Bean Pest Management and Production, 3rd ed.; Cooperative Extension Resource Center, Colorado State University: Fort Collins, CO, USA, 2015. [Google Scholar]
- USDA-FRIS. United State Department of Agriculture- Farm and Ranch Irrigation Survey. Census of Agriculture; National Agricultural Statistics Service: Washington, DC, USA, 2013.
- Nuñez Barrios, A.; Hoogenboom, G.; Nesmith, D.S. Drought stress and the distribution of vegetative and reproductive traits of a bean cultivar. Sci. Agric. 2005, 62, 18–22. [Google Scholar] [CrossRef] [Green Version]
- Terán, H.; Singh, S.P. Comparison of sources and lines selected for drought resistance in common bean. Crop Sci. 2002, 42, 64–70. [Google Scholar] [CrossRef] [PubMed]
- Nielsen, D.C.; Nelson, N.O. Black bean sensitivity to water stress at various growth stages. Crop Sci. 1998, 38, 422–427. [Google Scholar] [CrossRef]
- Loss, S.P.; Siddique, K.H.M. Adaptation of faba bean (Vicia faba L.) to dryland Mediterranean-type environments I. seed yield and yield components. Field Crops Res. 1997, 52, 17–28. [Google Scholar] [CrossRef]
- Ramirez-Vallejo, P.; Kelly, J.D. Traits related to drought resistance in common bean. Euphytica 1998, 99, 127–136. [Google Scholar] [CrossRef]
- Gallegos, J.A.A.; Shibata, J.K. Effect of water stress on growth and yield of indeterminate dry-bean (Phaseolus vulgaris L.) cultivars. Field Crops Res. 1989, 20, 81–93. [Google Scholar] [CrossRef]
- Stoker, R. Effect on dwarf beans of water stress at different phases of growth. N. Z. J. Exp. Agric. 1974, 2, 13–15. [Google Scholar] [CrossRef]
- Miller, D.E.; Burke, D.W. Response of Dry Beans to Daily Deficit Sprinkler Irrigation 1. Agron. J. 1983, 75, 775–778. [Google Scholar] [CrossRef]
- Webber, H.A.; Madramootoo, C.A.; Bourgault, M.; Horst, M.G.; Stulina, G.; Smith, D.L. Water use efficiency of common bean and green gram grown using alternate furrow and deficit irrigation. Agric. Water Manag. 2006, 86, 259–268. [Google Scholar] [CrossRef]
- Mooney, H.A.; Winner, W.E.; Pell, E.J. Response of Plants to Multiple Stresses; Academic Press; Elsevier: Amsterdam, The Netherlands, 1991. [Google Scholar]
- Ramos, M.; Gordon, A.J.; Minchin, F.R.; Sprent, J.L.; Parsons, R. Effect of water stress on nodule physiology and biochemistry of a drought tolerant cultivar of common bean (Phaseolus vulgaris L.). Ann. Bot. 1999, 83, 57–63. [Google Scholar] [CrossRef] [Green Version]
- Serraj, R.; Sinclair, T.R. Soybean cultivar variability for nodule formation and growth under drought. Plant Soil 1998, 202, 159–166. [Google Scholar] [CrossRef]
- Sprent, J.I. Effects of water stress on nitrogen fixation in root nodules. Plant Soil 1971, 35, 225–228. [Google Scholar] [CrossRef]
- Coelho, D.T.; Dale, R.F. An energy-crop growth variable and temperature function for predicting corn growth and development: Planting to Silking 1. Agron. J. 1980, 72, 503–510. [Google Scholar] [CrossRef]
- Colaizzi, P.D.; Evett, S.R.; Brauer, D.K.; Howell, T.A.; Tolk, J.A.; Copeland, K.S. Allometric method to estimate leaf area index for row crops. Agron. J. 2017, 109, 883–894. [Google Scholar] [CrossRef] [Green Version]
- Sharma, V.; Rai, A. Dry bean (Phaseolus vulgaris L) Crop Evapotranspiration, Irrigation and Crop Water Production Functions and Yield Response Factors in Arid to Semi-arid Climate. Agric. Water Manag. 2020. in review. [Google Scholar]
- Allen, R.G.; Pereira, L.S.; Raes, D.; Smith, M. Crop evapotranspiration-guidelines for computing crop water requirements-FAO irrigation and drainage paper 56. FAO Rome 1998, 300, D05109. [Google Scholar]
- McMaster, G.S.; Wilhelm, W.W. Growing degree-days: One equation, two interpretations. Agric. For. Meteorl. 1997, 87, 291–300. [Google Scholar] [CrossRef] [Green Version]
- Jenni, S.; Bourgeois, G.; Laurence, H.; Roy, G.; Tremblay, N. Improving the Prediction of Processing Bean Maturity Based on the Growing-Degree Day Approach. HortScience 2000, 35, 1234–1237. [Google Scholar] [CrossRef] [Green Version]
- Sharma, V.; Nicholson, C.; Bergantino, T.; Cowley, J.; Hess, B.; Tanaka, J. Wyoming Agricultural Climate Network (WACNet). In Agricultural Experiment Station 2018 Field Days Bulletin; University of Wyoming: Laramie, WY, USA, 2018; pp. 52–53. [Google Scholar]
- Rosadi, R.B.; Senge, M.; Ito, K.; Adomako, J.T. Critical water content and water stress coefficient of soybean (Glycine max [L.] Merr.) under deficit irrigation. Paddy Water Environ. 2005, 3, 219–223. [Google Scholar] [CrossRef] [Green Version]
- Vaux, H.J., Jr.; Pruitt, W.O. Crop-water production functions. Adv. Irrig. 1983, 2, 61–97. [Google Scholar] [CrossRef]
- Shenkut, A.A.; Brick, M.A. Traits associated with dry edible bean (Phaseolus vulgaris L.) productivity under diverse soil moisture environments. Euphytica 2003, 133, 339–347. [Google Scholar] [CrossRef]
- Asemanrafat, M.; Honar, T. Effect of water stress and plant density on canopy temperature, yield components and protein concentration of red bean (Phaseolus vulgaris L. cv. akhtar). Int. J. Plant Prod. 2017, 11, 241–258. [Google Scholar]
- Breda, N.J. Ground-based measurements of leaf area index: A review of methods, instruments and current controversies. J. Exp. Bot. 2003, 54, 2403–2417. [Google Scholar] [CrossRef] [PubMed]
- Boydston, R.A.; Porter, L.D.; Chaves-Cordoba, B.; Khot, L.R.; Miklas, P.N. The impact of tillage on pinto bean cultivar response to drought induced by deficit irrigation. Soil Tillage Res. 2018, 180, 63–72. [Google Scholar] [CrossRef]
- Gunton, J.L.; Evenson, J.P. Moisture stress in navy beans. II. relationship between leaf water potential and growth and yield. Irrig. Sci. 1980, 2, 59–65. [Google Scholar] [CrossRef]
- Spitkó, T.; Nagy, Z.; Zsubori, T.; Szőke, C.; Berzy, T.; Pintér, J.; Marton, C.J. Connection between normalized difference vegetation index and yield in maize. Plant Soil Environ. 2016, 62, 293–298. [Google Scholar] [CrossRef]
- Neiff, N.; Dhliwayo, T.; Suarez, E.A.; Burgueno, J.; Trachsel, S. Using an airborne platform to measure canopy temperature and NDVI under heat stress in maize. J. Crop Improv. 2015, 29, 669–690. [Google Scholar] [CrossRef]
- Genc, L.; Inalpulat, M.; Kizil, U.; Mirik, M.; Smith, S.E.; Mendes, M. Determination of water stress with spectral reflectance on sweet corn (Zea mays L.) using classification tree (CT) analysis. Zemdirbyste Agric. 2013, 100, 81–90. [Google Scholar] [CrossRef]
- Romano, G.; Zia, S.; Spreer, W.; Sanchez, C.; Cairns, J.; Araus, J.L.; Müller, J. Use of thermography for high throughput phenotyping of tropical maize adaptation in water stress. Comput. Elec. Agric. 2011, 79, 67–74. [Google Scholar] [CrossRef]
- Stone, C.; Chisholm, L.; Coops, N. Spectral reflectance characteristics of eucalypt foliage damaged by insects. Aust. J. Bot. 2001, 49, 687–698. [Google Scholar] [CrossRef] [Green Version]
- Hunsaker, D.J.; Pinter, P.J.; Barnes, E.M.; Kimball, B.A. Estimating cotton evapotranspiration crop coefficients with a multispectral vegetation index. Irri. Sci. 2003, 22, 95–104. [Google Scholar] [CrossRef]
- Kukal, M.S.; Irmak, S. Comparative canopy growth dynamics in four row crops and their relationships with allometric and environmental determinants. Agron. J. 2019, 111, 1799–1816. [Google Scholar] [CrossRef]
- Nemeskéri, E.; Molnár, K.; Helyes, L. Relationships of spectral traits with yield and nutritional quality of snap beans (Phaseolus vulgaris L.) in dry seasons. Arch. Agron. Soil Sci. 2018, 64, 1222–1239. [Google Scholar] [CrossRef]
- Papadavid, G.; Hadjimitsis, D.G.; Toulios, L.; Michaelides, S. A modified SEBAL modeling approach for estimating crop evapotranspiration in semi-arid conditions. Water Res. Manag. 2013, 27, 3493–3506. [Google Scholar] [CrossRef]
- Das, D.K.; Mishra, K.K.; Kalra, N. Assessing growth and yield of wheat using remotely-sensed canopy temperature and spectral indices. Int. J. Remote Sens. 1993, 14, 3081–3092. [Google Scholar] [CrossRef]
- Zarco-Tejada, P.J.; Berjón, A.; López-Lozano, R.; Miller, J.R.; Martín, P.; Cachorro, V.; González, M.R.; De Frutos, A. Assessing vineyard condition with hyperspectral indices: Leaf and canopy reflectance simulation in a row-structured discontinuous canopy. Remote Sens. Environ. 2005, 99, 271–287. [Google Scholar] [CrossRef]
- Efetha, A.; Harms, T.; Bandara, M. Irrigation management practices for maximizing seed yield and water use efficiency of Othello dry bean (Phaseolus vulgaris L.) in southern Alberta, Canada. Irri. Sci. 2011, 29, 103–113. [Google Scholar] [CrossRef]
- Muñoz-Perea, C.G.; Terán, H.; Allen, R.G.; Wright, J.L.; Westermann, D.T.; Singh, S.P. Selection for drought resistance in dry bean landraces and cultivars. Crop Sci. 2006, 46, 2111–2120. [Google Scholar] [CrossRef] [Green Version]
- Al-Kaisi, M.M.; Berrada, A.F.; Stack, M.W. Dry bean yield response to different irrigation rates in southwestern Colorado. J. Prod. Agric. 1999, 12, 422–427. [Google Scholar] [CrossRef]
- Masaya, P.; White, J.W. Adaptation to photoperiod and temperature. In Common Beans: Research for Crop Improvement; Centro Internacional De Agricultura Tropical: Cali, Colombia, 1991; Chapter 8; pp. 445–500. [Google Scholar]
- Pandey, R.K.; Herrera, W.A.T.; Pendleton, J.W. Drought Response of Grain Legumes Under Irrigation Gradient: I. Yield and Yield Components. Agron. J. 1984, 76, 549–553. [Google Scholar] [CrossRef]
- Pandey, R.K.; Maranville, J.W.; Admou, A. Deficit irrigation and nitrogen effects on maize in a Sahelian environment: I. Grain yield and yield components. Agric. Water Manag. 2000, 46, 1–13. [Google Scholar] [CrossRef]
- Djaman, K. Crop Evapotranspiration, Crop Coefficients, Plant Growth and Yield Parameters, and Nutrient Uptake Dynamics of Maize. Ph.D. Thesis, University of Nebraska-Lincoln, Lincoln, NE, USA, 2011. [Google Scholar]
- Yonts, C.D.; Haghverdi, A.; Reichert, D.L.; Irmak, S. Deficit irrigation and surface residue cover effects on dry bean yield, in-season soil water content and irrigation water use efficiency in western Nebraska high plains. Agric. Water Manag. 2018, 199, 138–147. [Google Scholar] [CrossRef]
- Saleh, S.; Liu, G.; Liu, M.; Ji, Y.; He, H.; Gruda, N. Effect of irrigation on growth, yield, and chemical composition of two green bean cultivars. Horticulturae 2018, 4, 3. [Google Scholar] [CrossRef] [Green Version]
- Mathobo, R.; Marais, D.; Steyn, J.M. The effect of drought stress on yield, leaf gaseous exchange and chlorophyll fluorescence of dry beans (Phaseolus vulgaris L.). Agric. Water Manag. 2017, 180, 118–125. [Google Scholar] [CrossRef] [Green Version]
- Munns, R. Comparative physiology of salt and water stress. Plant Cell Environ. 2002, 25, 239–250. [Google Scholar] [CrossRef]
Figure 1.
Daily (a) Average Temperature (Tavg, °C), (b) Average Relative Humidity (RHavg, %), (c) Daily incident shortwave radiation (Rs, MJ m−2 d−1), (d) Precipitation (mm) from planting date to harvest for 2017, 2018, and 2019 growing season.
Figure 1.
Daily (a) Average Temperature (Tavg, °C), (b) Average Relative Humidity (RHavg, %), (c) Daily incident shortwave radiation (Rs, MJ m−2 d−1), (d) Precipitation (mm) from planting date to harvest for 2017, 2018, and 2019 growing season.

Figure 2.
Daily and cumulative Growing Degree Days (GDD, °C) for 2017, 2018, and 2019 dry bean growing season at Powell Research and Extension Center.
Figure 2.
Daily and cumulative Growing Degree Days (GDD, °C) for 2017, 2018, and 2019 dry bean growing season at Powell Research and Extension Center.

Figure 3.
Seasonal progression of dry bean (a–c) plant height (h), (d–f) Leaf area index (LAI), and (g–i) Normalized Difference Vegetation Index (NDVI) in response to irrigation levels as a function of Growing Degree Days (GDD) for 2017, 2018, and 2019 crop growing season at Powell Research and Extension Center (PREC), Powell. Each value is a mean of three replications.

Figure 4.
Average SPAD-Chlorophyll under different irrigation levels for dry bean for 2017, 2018, and 2019 growing season. Each value is a mean of three replications under each treatment. Means followed by the same letters are not significantly different at p < 0.05.
Figure 4.
Average SPAD-Chlorophyll under different irrigation levels for dry bean for 2017, 2018, and 2019 growing season. Each value is a mean of three replications under each treatment. Means followed by the same letters are not significantly different at p < 0.05.

Figure 5.
Effect of seasonal irrigation (I) on maximum growth indices value attained (a) LAI, (b) NDVI, and (c) Plant Height (h). Each data point is an average of three values.
Figure 5.
Effect of seasonal irrigation (I) on maximum growth indices value attained (a) LAI, (b) NDVI, and (c) Plant Height (h). Each data point is an average of three values.

Figure 6.
Inter-relationships between various growth indices (a) LAI and h, (b) NDVI and h, (c) LAI and NDVI. All points shown are the measured data from experiment fields for the dry bean for all the growing seasons irrespective of treatments.
Figure 6.
Inter-relationships between various growth indices (a) LAI and h, (b) NDVI and h, (c) LAI and NDVI. All points shown are the measured data from experiment fields for the dry bean for all the growing seasons irrespective of treatments.

Figure 7.
The visual difference in dry bean growth and yield components among different irrigation treatments. The images were captured for 2018.
Figure 7.
The visual difference in dry bean growth and yield components among different irrigation treatments. The images were captured for 2018.

Figure 8.
Relationships between (a) Seed yield (SY; kg ha−1) and Pods plant−1, (b) Seed yield (SY; kg ha−1) and seeds pod−1, (c) (SY; kg ha−1) and 100-seed weight (SW). Data was pooled irrespective of treatments and growing season.
Figure 8.
Relationships between (a) Seed yield (SY; kg ha−1) and Pods plant−1, (b) Seed yield (SY; kg ha−1) and seeds pod−1, (c) (SY; kg ha−1) and 100-seed weight (SW). Data was pooled irrespective of treatments and growing season.

Figure 9.
Correlation between dry bean seed yield (SY; kg ha−1), pods plant−1, seeds pod−1 and 100-seed weight (SW; g) with growth parameters (a,d,g,j) Leaf Area Index (LAI); (b,e,h,k) Normalized Difference Vegetation Index (NDVI); (c,f,i,l) plant height (h) at Powell, Wyoming. Data was pooled irrespective of treatments and growing season.


Table 1.
Total amount and timing of irrigation under each irrigation treatment for 2017, 2018, 2019 growing season.
Table 1.
Total amount and timing of irrigation under each irrigation treatment for 2017, 2018, 2019 growing season.
| 2017 | 2018 | 2019 | |||||||||||||||
|---|---|---|---|---|---|---|---|---|---|---|---|---|---|---|---|---|---|
| Date | 125% FIT | FIT | 75% FIT | 50% FIT | 25% FIT | Date | 125% FIT | FIT | 75% FIT | 50% FIT | 25% FIT | Date | 125% FIT | FIT | 75% FIT | 50% FIT | 25% FIT |
| 6/7 | 12.7 | 12.7 | 12.7 | 12.7 | 12.7 | 6/7 | 12.7 | 12.7 | 12.7 | 12.7 | 12.7 | 6/8 | 12.7 | 12.7 | 12.7 | 12.7 | 12.7 |
| 6/17 | 19.1 | 19.1 | 19.1 | 19.1 | 19.1 | 6/12 | 12.7 | 12.7 | 12.7 | 12.7 | 12.7 | 6/12 | 12.7 | 12.7 | 12.7 | 12.7 | 12.7 |
| 6/21 | 19.1 | 14.3 | 10.7 | 3.6 | 7.1 | 6/28 | 19.05 | 12.7 | 9.53 | 6.35 | 3.18 | 6/24 | 23.81 | 19.05 | 14.29 | 9.53 | 4.76 |
| 6/30 | 25.4 | 19.1 | 14.3 | 4.8 | 9.5 | 7/4 | 25.4 | 19.05 | 14.29 | 9.53 | 4.76 | 7/3 | 25.40 | 25.4 | 19.05 | 12.70 | 6.35 |
| 7/3 | 25.4 | 19.1 | 14.3 | 4.8 | 9.5 | 7/9 | 25.4 | 19.05 | 14.29 | 9.53 | 4.76 | 7/8 | 31.75 | 25.4 | 19.05 | 12.70 | 6.35 |
| 7/12 | 31.8 | 23.8 | 17.9 | 6.0 | 11.9 | 7/19 | 25.4 | 19.05 | 14.29 | 9.53 | 4.76 | 7/23 | 31.75 | 25.4 | 19.05 | 12.70 | 6.35 |
| 7/15 | 31.8 | 23.8 | 17.9 | 6.0 | 11.9 | 7/20 | 25.4 | 19.05 | 14.29 | 9.53 | 4.76 | 7/26 | 31.75 | 25.4 | 19.05 | 12.70 | 6.35 |
| 7/20 | 31.8 | 23.8 | 17.9 | 6.0 | 11.9 | 7/26 | 31.75 | 25.4 | 19.05 | 12.7 | 6.35 | 7/31 | 19.07 | 12.7 | 9.53 | 6.35 | 3.18 |
| 7/25 | 31.8 | 23.8 | 17.9 | 6.0 | 11.9 | 7/31 | 31.75 | 25.4 | 19.05 | 12.7 | 6.35 | 8/5 | 25.40 | 19.05 | 14.29 | 9.53 | 4.76 |
| 8/1 | 31.8 | 23.8 | 17.9 | 6.0 | 11.9 | 8/7 | 31.75 | 25.4 | 19.05 | 12.7 | 6.35 | 8/8 | 31.75 | 25.4 | 19.05 | 12.70 | 6.35 |
| 8/4 | 31.8 | 23.8 | 17.9 | 6.0 | 11.9 | 8/12 | 31.75 | 25.4 | 19.05 | 12.7 | 6.35 | 8/18 | 25.40 | 19.05 | 14.29 | 9.53 | 4.76 |
| 8/10 | 31.8 | 23.8 | 17.9 | 6.0 | 11.9 | 8/17 | 31.75 | 25.4 | 19.05 | 12.7 | 6.35 | 8/22 | 25.40 | 19.05 | 14.29 | 9.53 | 4.76 |
| 8/18 | 25.4 | 19.1 | 14.3 | 4.8 | 9.5 | 8/22 | 25.4 | 19.05 | 14.29 | 9.53 | 4.76 | ||||||
| 8/22 | 25.4 | 19.1 | 14.3 | 4.8 | 9.5 | ||||||||||||
| Total | 375 | 289 | 225 | 96 | 160 | 330 | 260 | 202 | 143 | 84 | 297 | 241 | 187 | 133 | 79 | ||
Table 2.
Effect of irrigation treatments on maximum leaf area index (LAI), normalized difference vegetation index (NDVI), plant height (h), and SPAD-Chlorophyll achieved for 2017, 2018, and 2019 growing season at Powell, Wyoming.
Table 2.
Effect of irrigation treatments on maximum leaf area index (LAI), normalized difference vegetation index (NDVI), plant height (h), and SPAD-Chlorophyll achieved for 2017, 2018, and 2019 growing season at Powell, Wyoming.
| 2017 | 2018 | 2019 | ||||||||||
|---|---|---|---|---|---|---|---|---|---|---|---|---|
| Treatments | LAI | NDVI | h (m) | SPAD | LAI | NDVI | h (m) | SPAD | LAI | NDVI | h (m) | SPAD |
| 25% FIT | 2.69 a | 0.39 a | 0.26 a | 51.02 a | 2.92 a | 0.35 a | 0.34 a | 51.79 a | 3.90 a | 0.73 a | 0.48 a | 48.1 a |
| (±0.25) | (±0.04) | (±0.04) | (±0.57) | (±0.16) | (±0.06) | (±0.07) | (±3.52) | (±0.33) | (±0.02) | (±0.02) | (±0.8) | |
| 50% FIT | 3.67 b | 0.61 b | 0.37 a,b | 51.51 a | 3.04 a | 0.60 b | 0.37 a | 51.90 a | 4.06 a | 0.75 a | 0.50 a | 48.0 a |
| (±0.28) | (±0.09) | (±0.03) | (±0.33) | (±0.30) | (±0.07) | (±0.04) | (±1.86) | (±0.7) | (±0.03) | (±0.06) | (±0.55) | |
| 75% FIT | 3.75 b,c | 0.67 b | 0.38 a,b | 51.58 a | 4.30 b | 0.74 c | 0.51 b | 51.54 a | 4.35 a | 0.75 a | 0.51 a | 47.8 a |
| (±0.19) | (±0.07) | (±0.04) | (±1.55) | (±0.33) | (±0.04) | (±0.05) | (±0.26) | (±0.3) | (±0.003) | (±0.01) | (±0.7) | |
| FIT | 4.57 d | 0.73 b | 0.47 c | 51.55 a | 4.56 b,c | 0.79 c | 0.57 b | 50.58 a | 4.41 a | 0.74 a | 0.51 a | 47.5 a |
| (±0.31) | (±0.03) | (±0.11) | (±0.67) | (±0.20) | (±0.01) | (±0.00) | (±0.09) | (±0.30) | (±0.03) | (±0.004) | (±0.15) | |
| 125% FIT | 4.44 c,d | 0.74 b | 0.47 c | 51.26 a | 5.14 c | 0.80 c | 0.58 b | 50.44 a | 4.62 a | 0.77 a | 0.53 a | 47.5 a |
| (±0.33) | (±0.03) | (±0.08) | (±0.83) | (±0.31) | (±0.01) | (±0.02) | (±0.37) | (±0.53) | (±0.02) | (±0.05) | (±1.1) | |
| Years X Treatments Interaction | * | * | * | NS | ||||||||
Within columns, means followed by the same letters are not significantly different at p < 0.05. Values followed by ‘±’ denote standard deviation (SD). NS stands for non-significant. * stands for significant.
Table 3.
Leaf area index (LAI, m2 m−2), normalized difference vegetative index (NDVI), plant height (h, m) growth models based on growing degree days (GDD), and days after planting (DAP) with pooled data from the 2017, 2018, and 2019 growing season.
Table 3.
Leaf area index (LAI, m2 m−2), normalized difference vegetative index (NDVI), plant height (h, m) growth models based on growing degree days (GDD), and days after planting (DAP) with pooled data from the 2017, 2018, and 2019 growing season.
| GDD based (x = GDD °C) | DAP based (x = DAP) | |||
|---|---|---|---|---|
| Treatments | Equations | R2 | Equations | R2 |
| Normalized difference vegetative index (NDVI) | ||||
| 25% FIT | y = 4 × 10−12x4 – 1 × 10−8x3 + 1 × 10−5x2 − 0.0057x + 1.0185 | 0.36 | y = 2 × 10−7x4 – 5 × 10−5x3 + 0.0042x2 − 0.1237x + 1.4368 | 0.41 |
| 50% FIT | y = 4 × 10−12x4 – 1 × 10−8x3 + 2 × 10−5x2 − 0.0064x + 1.0541 | 0.61 | y = 3 × 10−7x4 – 7 × 10−5x3 + 0.0051x2 − 0.1426x + 1.5432 | 0.69 |
| 75% FIT | y = 2 × 10−12x4 – 7 × 10−9x3 + 9 × 10−6x2 − 0.0032x + 0.5965 | 0.70 | y = 2 × 10−7x4 – 4 × 10−5x3 + 0.0034x2 − 0.0949x + 1.0537 | 0.77 |
| FIT | y = 2 × 10−12x4 – 9 × 10−9x3 + 1 × 10−5x2 − 0.0034x + 0.5623 | 0.79 | y = 2 × 10−7x4 – 4 × 10−5x3 + 0.0035x2 − 0.0889x + 0.9026 | 0.84 |
| 125% FIT | y = 6 × 10−13x4 – 4 × 10−9x3 + 5 × 10−6x2 − 0.0014x + 0.2964 | 0.85 | y = 7 × 10−8x4 – 2 × 10−5x3 + 0.0018x2 − 0.0387x + 0.3915 | 0.89 |
| Leaf area index (LAI) | ||||
| 25% FIT | y = −9 × 10−12x4 + 3 × 10−8x3 − 4 × 10−5x2 + 0.0267x − 3.8134 | 0.62 | y = −6 × 10−7x4 + 0.0001x3 − 0.0133x2 + 0.5692x − 6.6388 | 0.63 |
| 50% FIT | y = −3 × 10−11x4 + 8 × 10−8x3 − 9 × 10−5x2 + 0.0468x − 7.0413 | 0.87 | y = −2 × 10−6x4 + 0.0004x3 − 0.0307x2 + 1.15x − 13.708 | 0.92 |
| 75% FIT | y = −1 × 10−11x4 + 3 × 10−8x3 − 4 × 10−5x2 + 0.0231x − 3.2712 | 0.92 | y = −1 × 10−6x4 + 0.0003x3 − 0.0209x2 + 0.836x − 10.197 | 0.94 |
| FIT | y = −1 × 10−11x4 + 3 × 10−8x3 − 3 × 10−5x2 + 0.0198x − 2.9948 | 0.94 | y = −1 × 10−6x4 + 0.0002x3 − 0.0165x2 + 0.7127x − 9.2136 | 0.96 |
| 125% FIT | y = −6 × 10−12x4 + 6 × 10−9x3 − 8 × 10−7x2 + 0.0059x − 0.5561 | 0.93 | y = −8 × 10−7x4 + 0.0001x3 − 0.0100x2 + 0.454x − 5.7071 | 0.93 |
| Plant Height (m) | ||||
| 25% FIT | y = −6 × 10−7x2 + 0.0010x − 0.122 | 0.43 | y = −0.0001x2 + 0.0178x − 0.2117 | 0.48 |
| 50% FIT | y = −6 × 10−7x2 + 0.0011x − 0.1605 | 0.65 | y = −0.0001x2 + 0.0197x − 0.2624 | 0.72 |
| 75% FIT | y = −7 × 10−7x2 + 0.0013x − 0.194 | 0.70 | y = −0.0002x2 + 0.0221x − 0.3039 | 0.76 |
| FIT | y = −7 × 10−7x2 + 0.0014x − 0.2577 | 0.82 | y = −0.0002x2 + 0.0245x − 0.3772 | 0.86 |
| 125% FIT | y = −7 × 10−7x2 + 0.0014x − 0.2425 | 0.80 | y = −0.0002x2 + 0.0247x − 0.3687 | 0.86 |
Table 4.
Effect of irrigation treatments on dry bean seed yield (SY), pods plant−1, seeds pod−1, SW, and pod harvest index (PHI) for 2017, 2018, and 2019 growing season at Powell, Wyoming.
Table 4.
Effect of irrigation treatments on dry bean seed yield (SY), pods plant−1, seeds pod−1, SW, and pod harvest index (PHI) for 2017, 2018, and 2019 growing season at Powell, Wyoming.
| 2017 | 2018 | 2019 | |||||||||||||
|---|---|---|---|---|---|---|---|---|---|---|---|---|---|---|---|
| Treatments | SY | Pods Plant−1 | Seeds Pod−1 | SW (g) | PHI (%) | SY | Pods Plant−1 | Seeds Pod−1 | SW (g) | PHI (%) | SY | Pods Plant−1 | Seeds Pod−1 | SW (g) | PHI (%) |
| (kg ha−1) | (kg ha−1) | (kg ha−1) | |||||||||||||
| 25% FIT | 264 a | 7 a | 2.1 a | 25 a | 72 a | 278 a | 4 a | 2.9 a | 28 a | 77 a | 1436 a | 10 a | 3.4 a | 30 a | 69 a |
| (±94) | (±1.8) | (±0.2) | (±2.8) | (±0.8) | (±65) | (±0.4) | (±0.3) | (±1.8) | (±1.4) | (±61) | (±0.3) | (±0.2) | (±0.2) | (±12.5) | |
| 50% FIT | 1086 a,b | 13 b | 2.6 a,b | 27 a | 72 a | 1095 b | 9 a,b | 2.5 a,b | 33 b | 75 a | 2524 b | 12 a,b | 3.9 a,b | 33 a,b | 77 a |
| (±36) | (±0.5) | (±0.4) | (±0.8) | (±1.7) | (±35) | (±3) | (±0.3) | (±0.6) | (±2.5) | (±46) | (±1.0) | (±0.4) | (±0.3) | (±1.6) | |
| 75% FIT | 2304 b,c | 14 b | 2.9 a,b | 34 c | 74 a | 2311 c | 13 b,c | 3.3 a,b,c | 37 c | 77 a | 3192 b,c | 14 a,b,c | 4 b | 37 b,c | 79 a |
| (±608) | (±3) | (±0.3) | (±3) | (±2) | (±513) | (±4.5) | (±0.1) | (±0.8) | (±0.6) | (±407) | (±1.0) | (±0.1) | (±2.1) | (±2.0) | |
| FIT | 3630 c | 17 b | 3.0 b | 37 c | 75 a | 3822 d | 17 c | 3.6 b,c | 40 c,d | 77 a | 3665 c | 17 c | 4.3 b | 38 c | 82 a |
| (±719) | (±1.1) | (±0.2) | (±1.6) | (±2.8) | (±257) | (±1.4) | (±0.3) | (±0.4) | (±1.2) | (±109) | (±1.3) | (±0.1) | (±1.8) | (±1.8) | |
| 125% FIT | 3306 c | 17 b | 2.9 b | 36 c | 75 a | 3826 d | 16 b,c | 3.8 c | 40 d | 78 a | 3599 c | 16 b,c | 4 a,b | 38 c | 80 a |
| (±1096) | (±2) | (±0.4) | (±2.3) | (±3.5) | (±289) | (±2) | (±0.4) | (±0.3) | (±0.8) | (±362) | (±3.5) | (±0.5) | (±2.0) | (±0.7) | |
| Year X Treatments Interaction | * | NS | NS | NS | NS | ||||||||||
Within columns, means followed by the same letters are not significantly different at p < 0.05. Values followed by ‘±’ denote standard deviation (SD). NS stands for non-significant. * stands for significant.
Table 5.
Relationships between dry bean seed yield (SY) and yield components with growth indices. Each model was developed by pooling the data from 2017, 2018, and 2019 growing season.
Table 5.
Relationships between dry bean seed yield (SY) and yield components with growth indices. Each model was developed by pooling the data from 2017, 2018, and 2019 growing season.
| Dependent Variable (y) | Independent Variable (x) | Function | Pooled Model | R2 |
|---|---|---|---|---|
| SY | LAI | Linear | y = 1569x − 3911 | 0.74 |
| NDVI | Exponential | y = 31.593e6.0001x | 0.86 | |
| h | Linear | y = 9877.5x − 2124.1 | 0.58 | |
| Pod Plant−1 | LAI | Linear | y = 4.5297x − 5.3845 | 0.62 |
| NDVI | Exponential | y = 2.2688e2.4496x | 0.64 | |
| h | Linear | y = 27.129x + 0.3639 | 0.42 | |
| Seeds Pod−1 | LAI | Linear | y = 0.5762x + 0.9539 | 0.42 |
| NDVI | Exponential | y = 1.5779e1.0454x | 0.47 | |
| h | Linear | y = 4.6553x + 1.1307 | 0.52 | |
| SW | LAI | Linear | y = 5.2942x + 12.875 | 0.65 |
| NDVI | Exponential | y = 19.028e0.8485x | 0.60 | |
| h | Linear | y = 33.892x + 18.588 | 0.51 |
© 2020 by the authors. Licensee MDPI, Basel, Switzerland. This article is an open access article distributed under the terms and conditions of the Creative Commons Attribution (CC BY) license (http://creativecommons.org/licenses/by/4.0/).
Share and Cite
MDPI and ACS Style
Rai, A.; Sharma, V.; Heitholt, J. Dry Bean [Phaseolus vulgaris L.] Growth and Yield Response to Variable Irrigation in the Arid to Semi-Arid Climate. Sustainability 2020, 12, 3851. https://0-doi-org.brum.beds.ac.uk/10.3390/su12093851
AMA Style
Rai A, Sharma V, Heitholt J. Dry Bean [Phaseolus vulgaris L.] Growth and Yield Response to Variable Irrigation in the Arid to Semi-Arid Climate. Sustainability. 2020; 12(9):3851. https://0-doi-org.brum.beds.ac.uk/10.3390/su12093851
Chicago/Turabian StyleRai, Abhijit, Vivek Sharma, and Jim Heitholt. 2020. "Dry Bean [Phaseolus vulgaris L.] Growth and Yield Response to Variable Irrigation in the Arid to Semi-Arid Climate" Sustainability 12, no. 9: 3851. https://0-doi-org.brum.beds.ac.uk/10.3390/su12093851
Note that from the first issue of 2016, this journal uses article numbers instead of page numbers. See further details here.