Hybrid Renewable Energy Microgrid for a Residential Community: A Techno-Economic and Environmental Perspective in the Context of the SDG7

 ,
, 
 , and
, and
Abstract
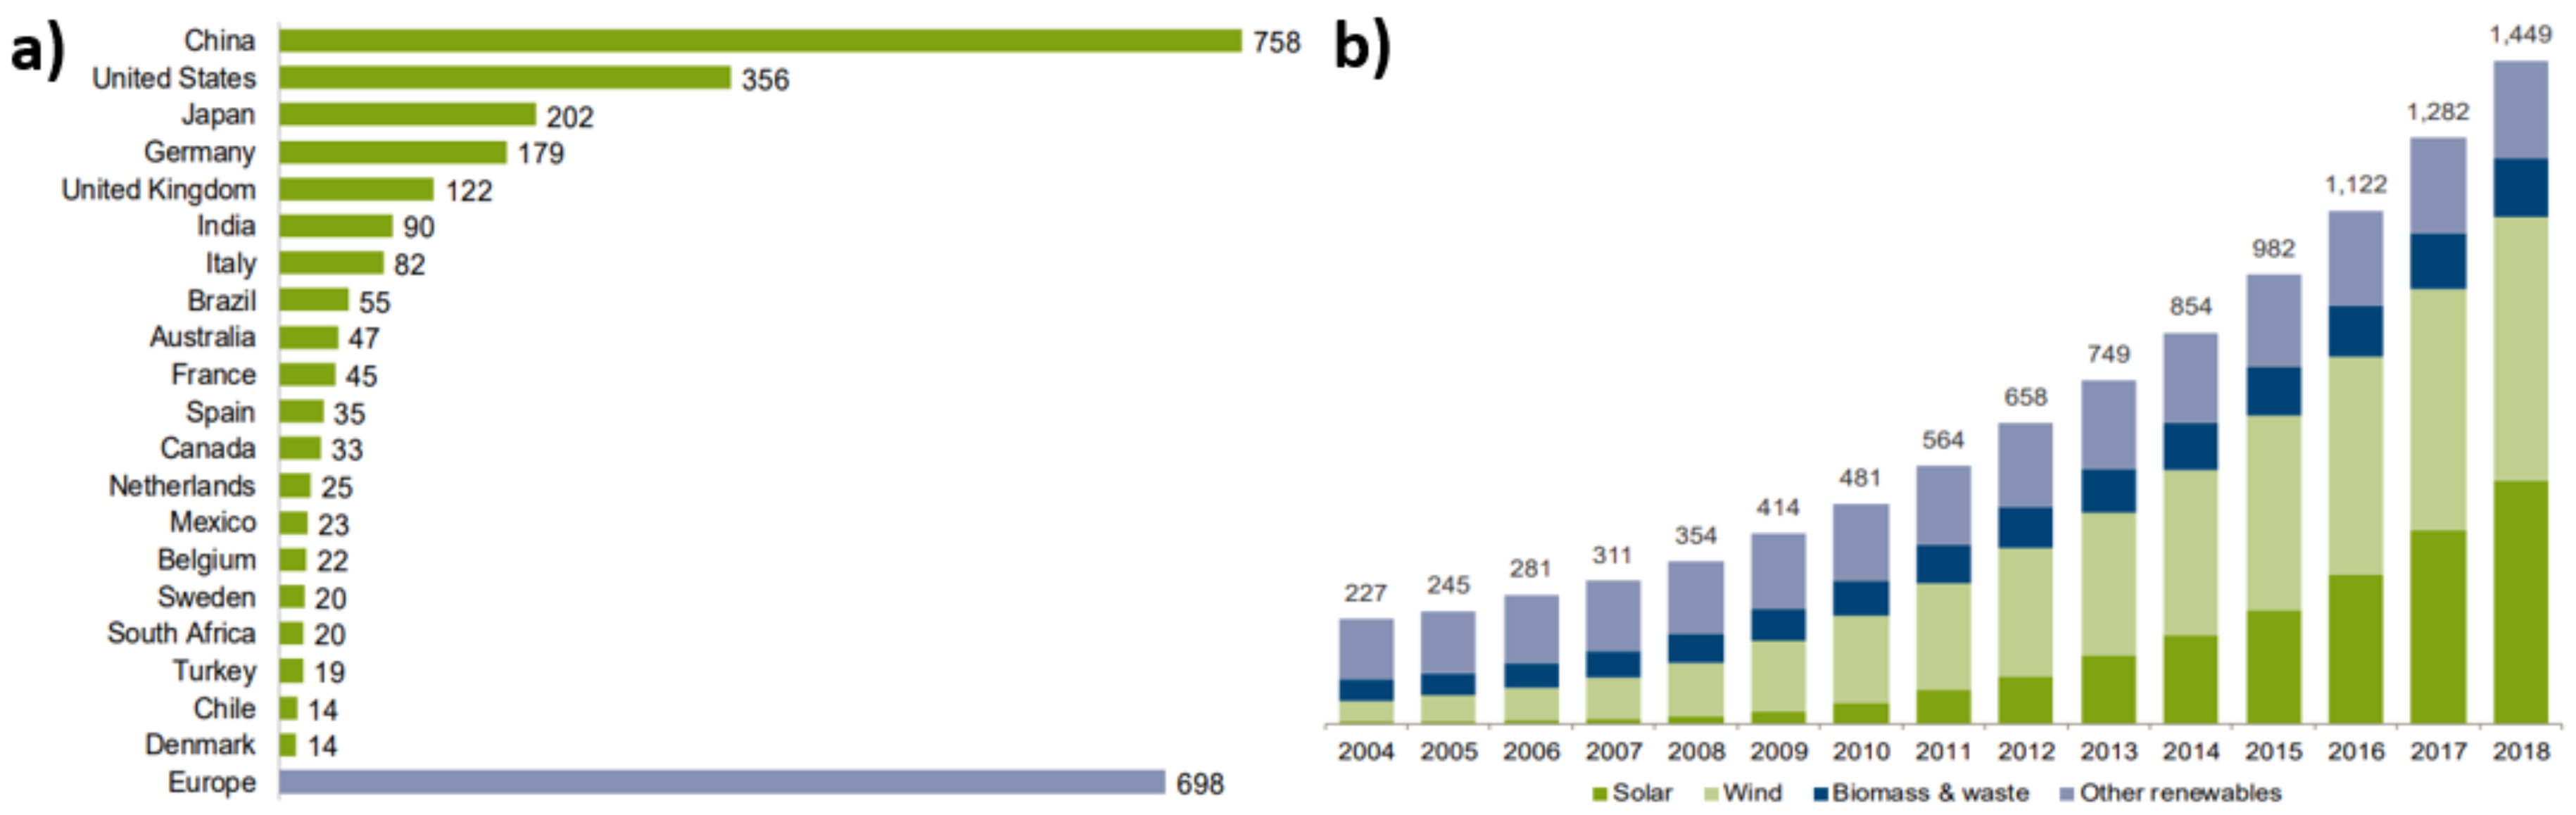
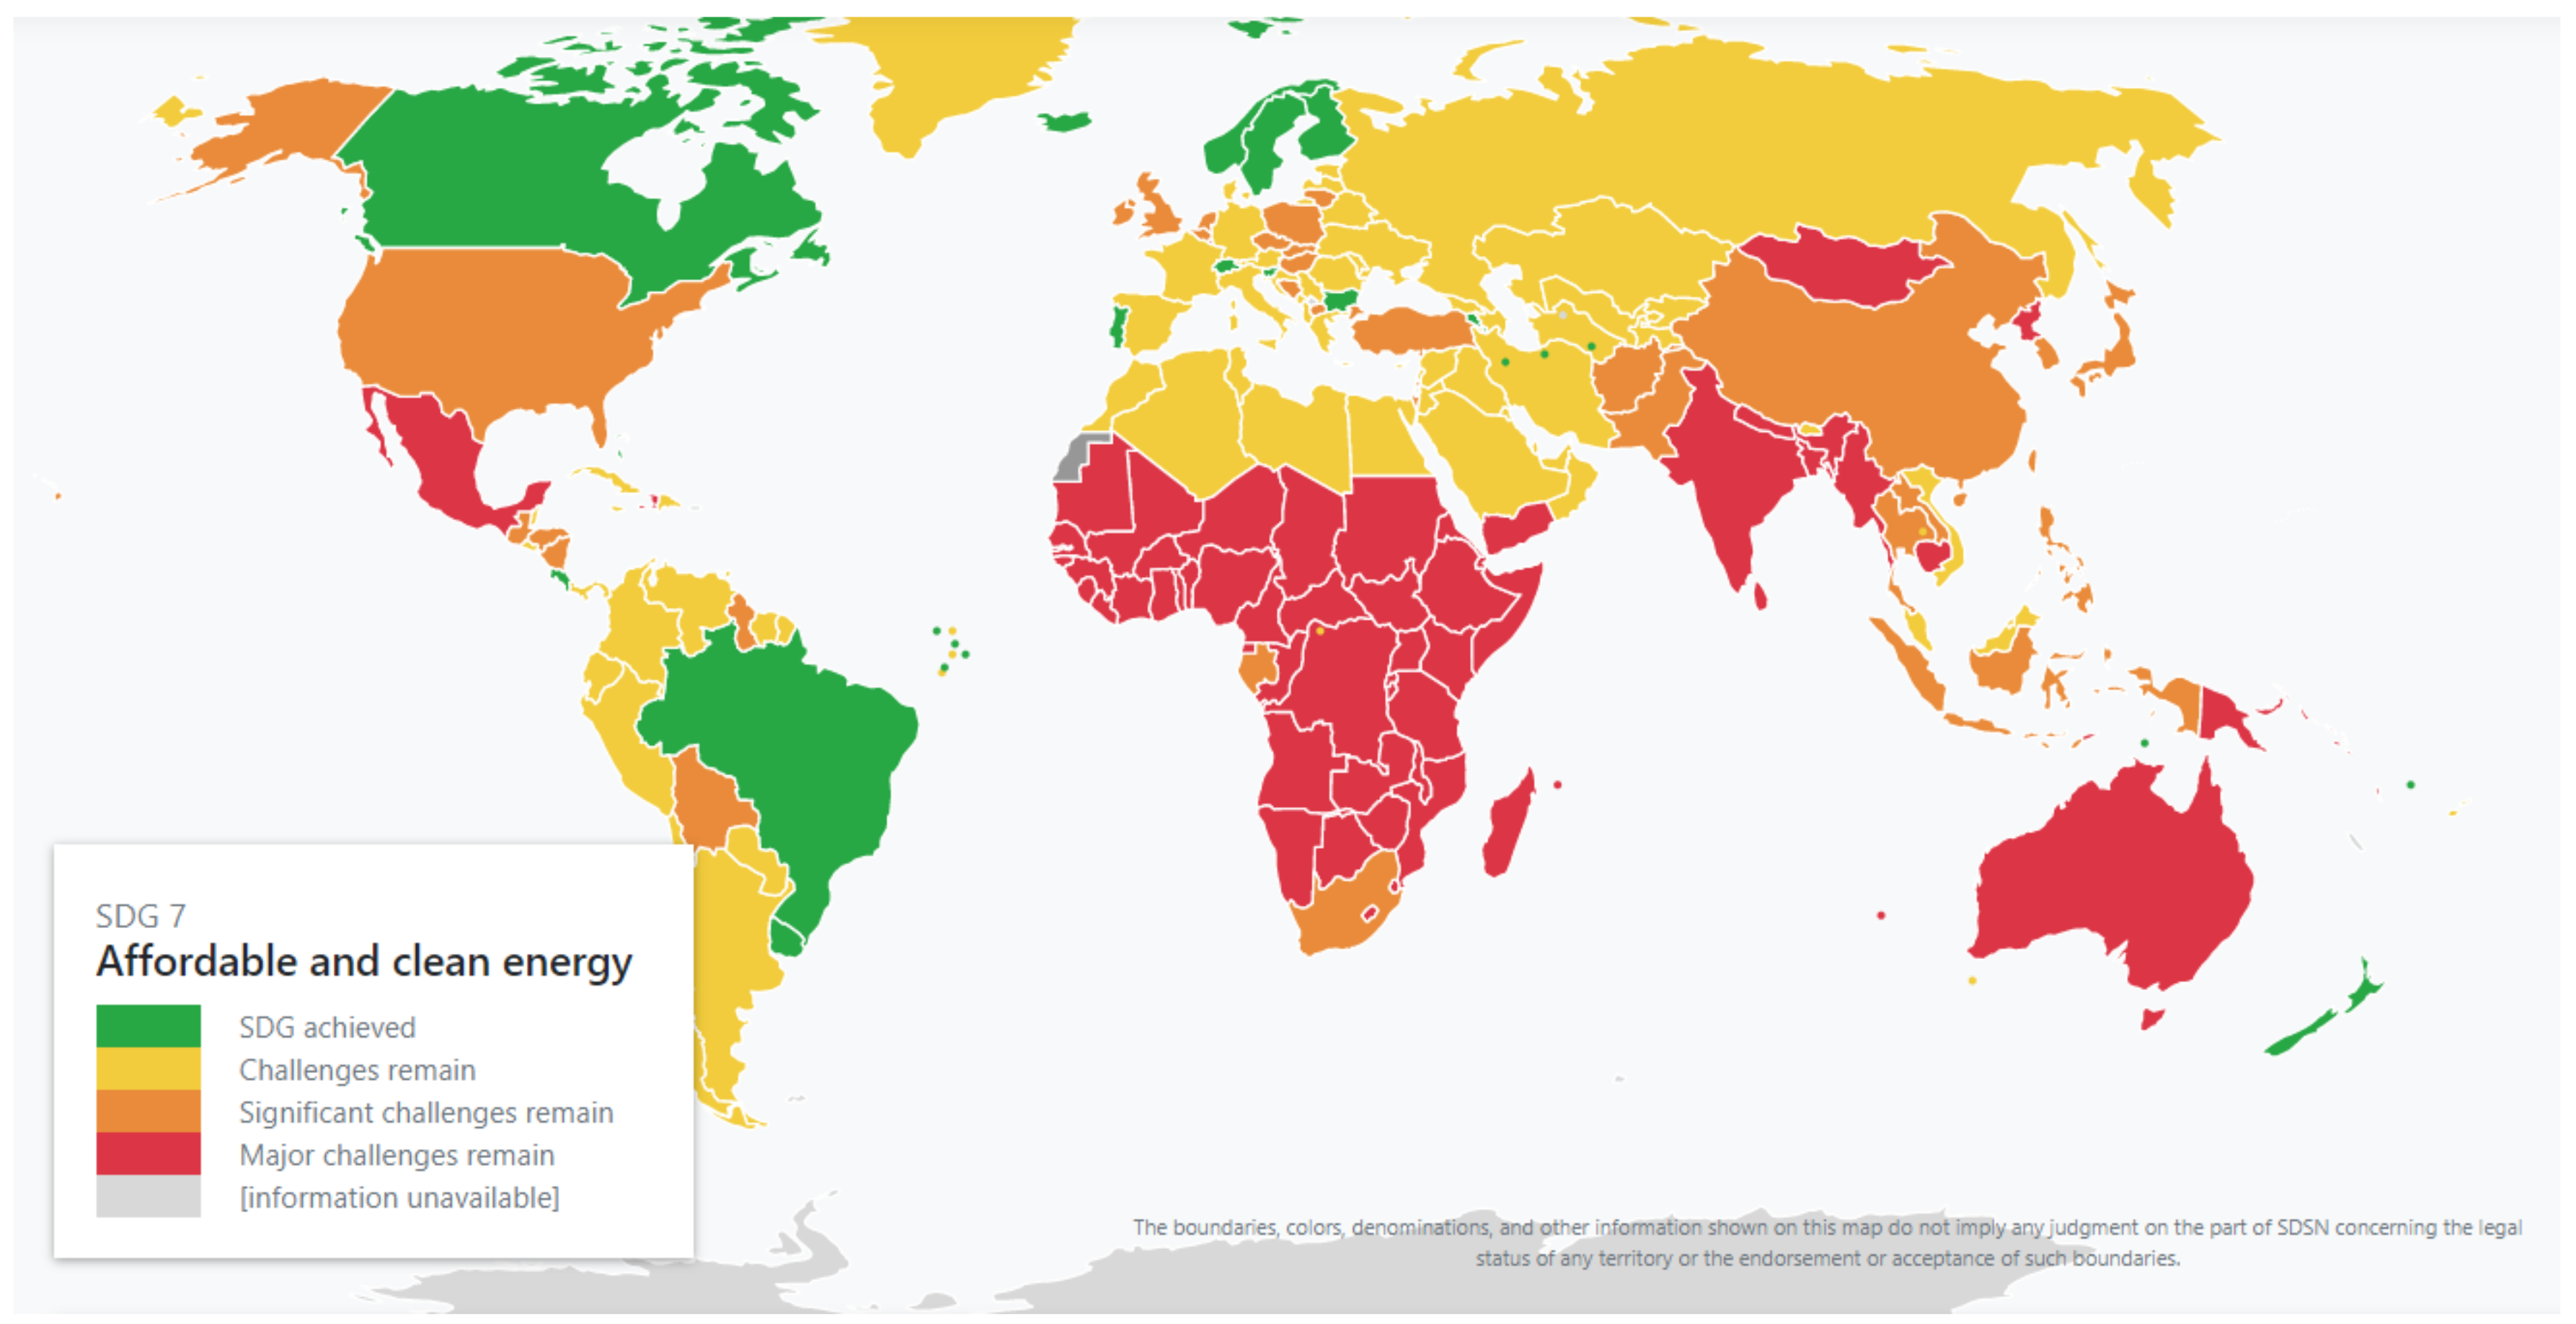
:1. Background
2. Literature Review
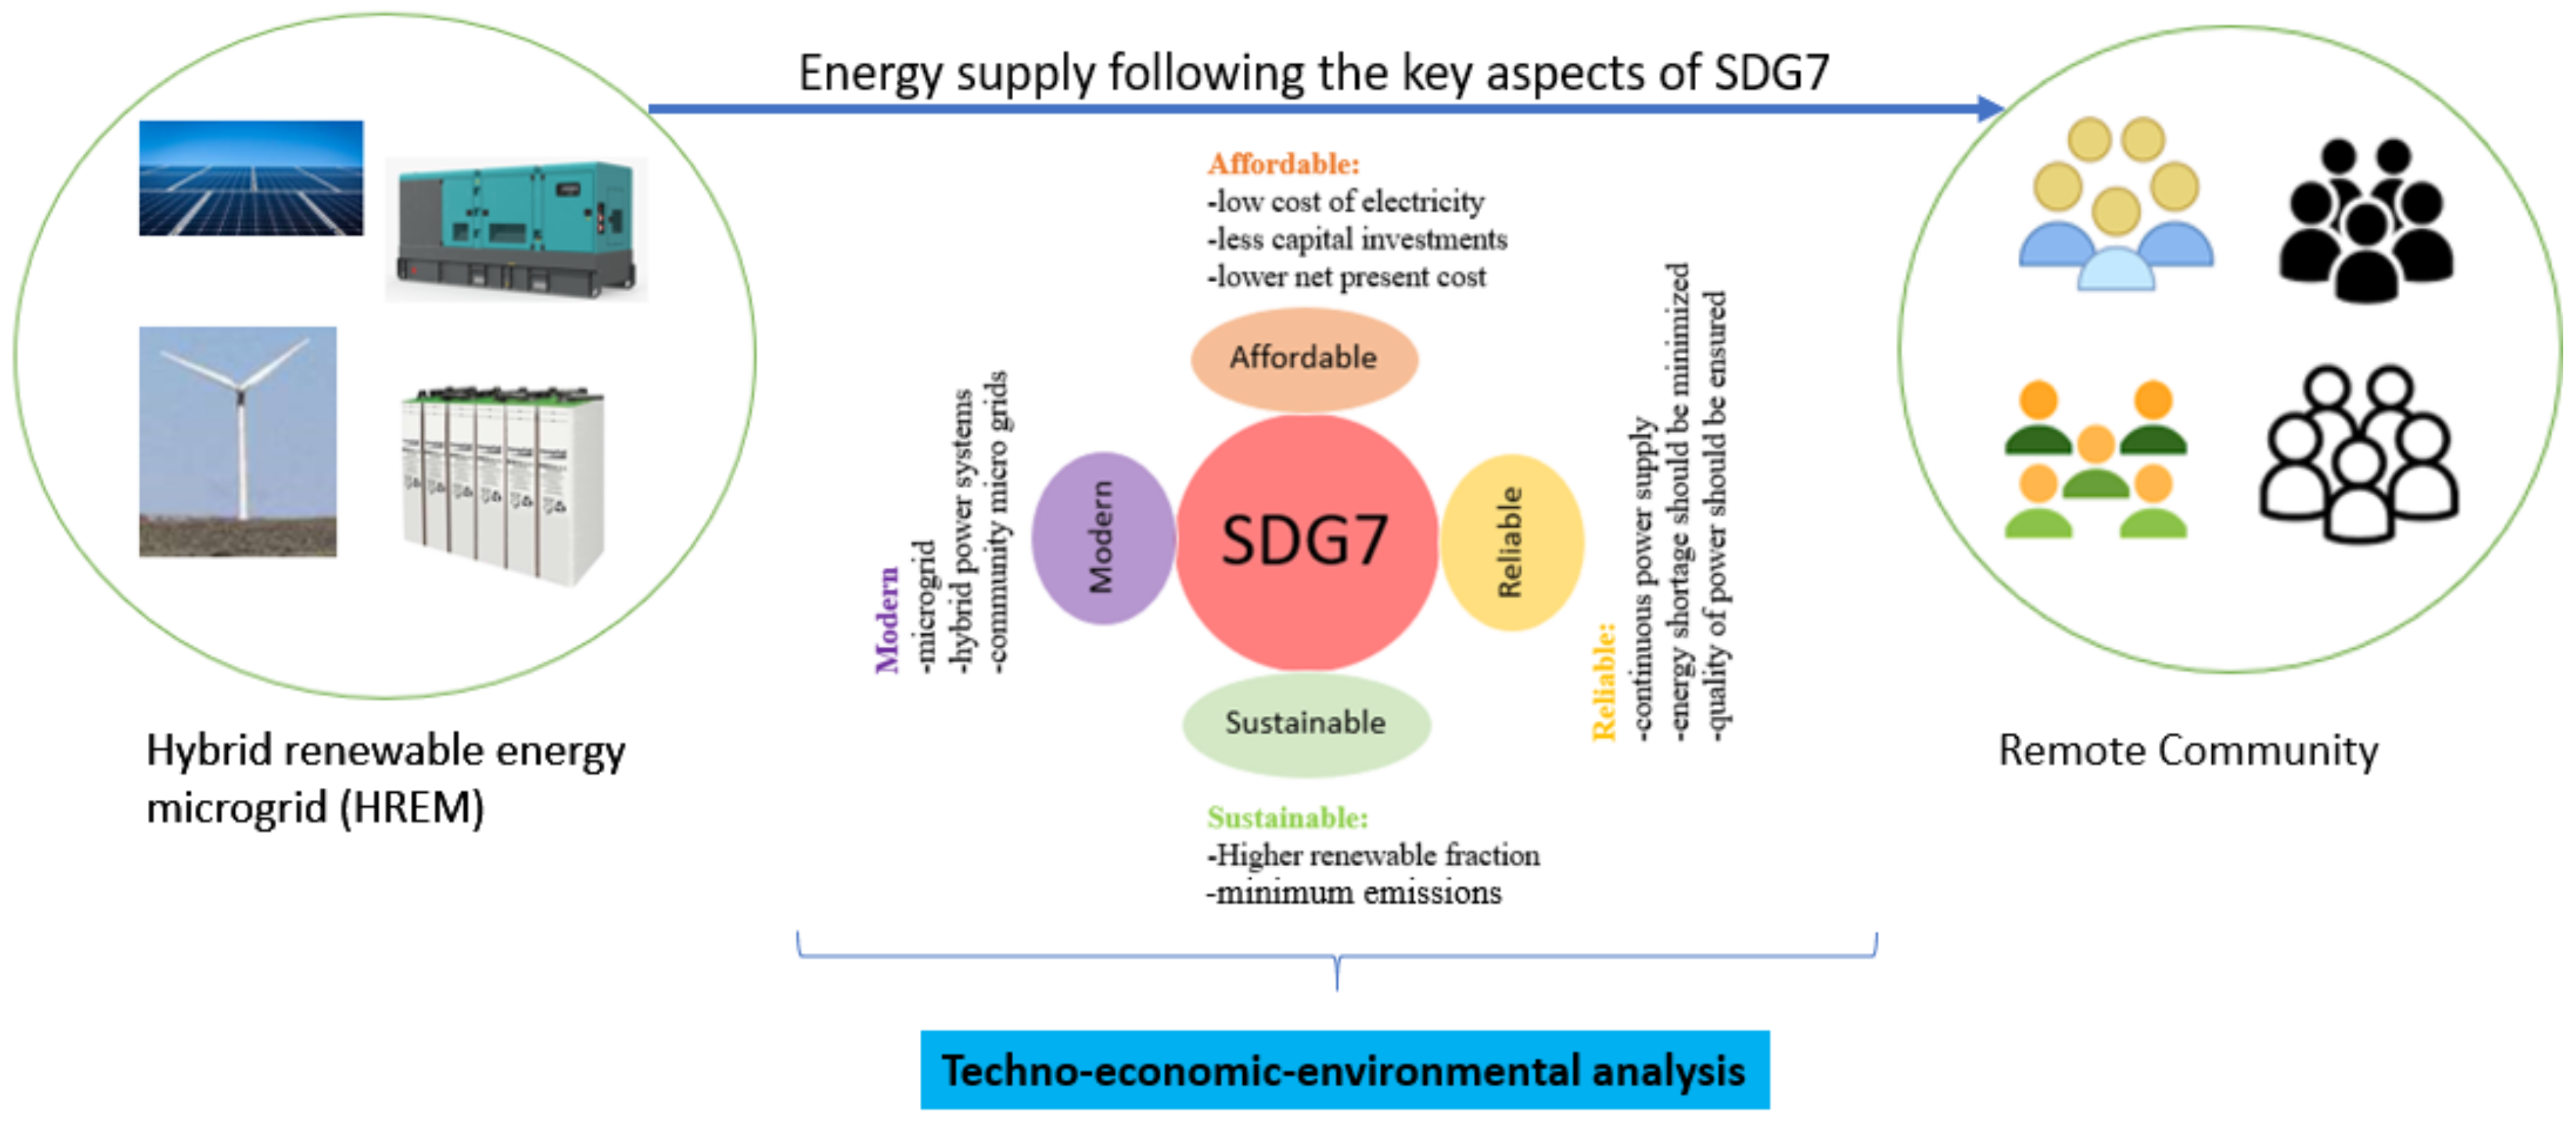
- A framework for hybrid energy system optimization was proposed by considering the key features of the SDG7, i.e., affordable, reliable, sustainable, and modern.
- Under each feature of the SDG7, a few indicators were identified, i.e., affordable: lower COE, NPV, and capital investments; reliable: continuous power supply, minimized energy shortage, and ensured quality of power; sustainable: higher renewable fraction and minimum emissions; and modern: MGs, hybrid power systems, and community MGs.
- Modeling of the HREM considering PV/WT/DG/BESS was designed and analyzed for a household community in South India by considering the weather conditions.
- Optimization of the HREM was carried out to select the best feasible configuration within the context of the SDG7 by considering explored indicators as constraints.
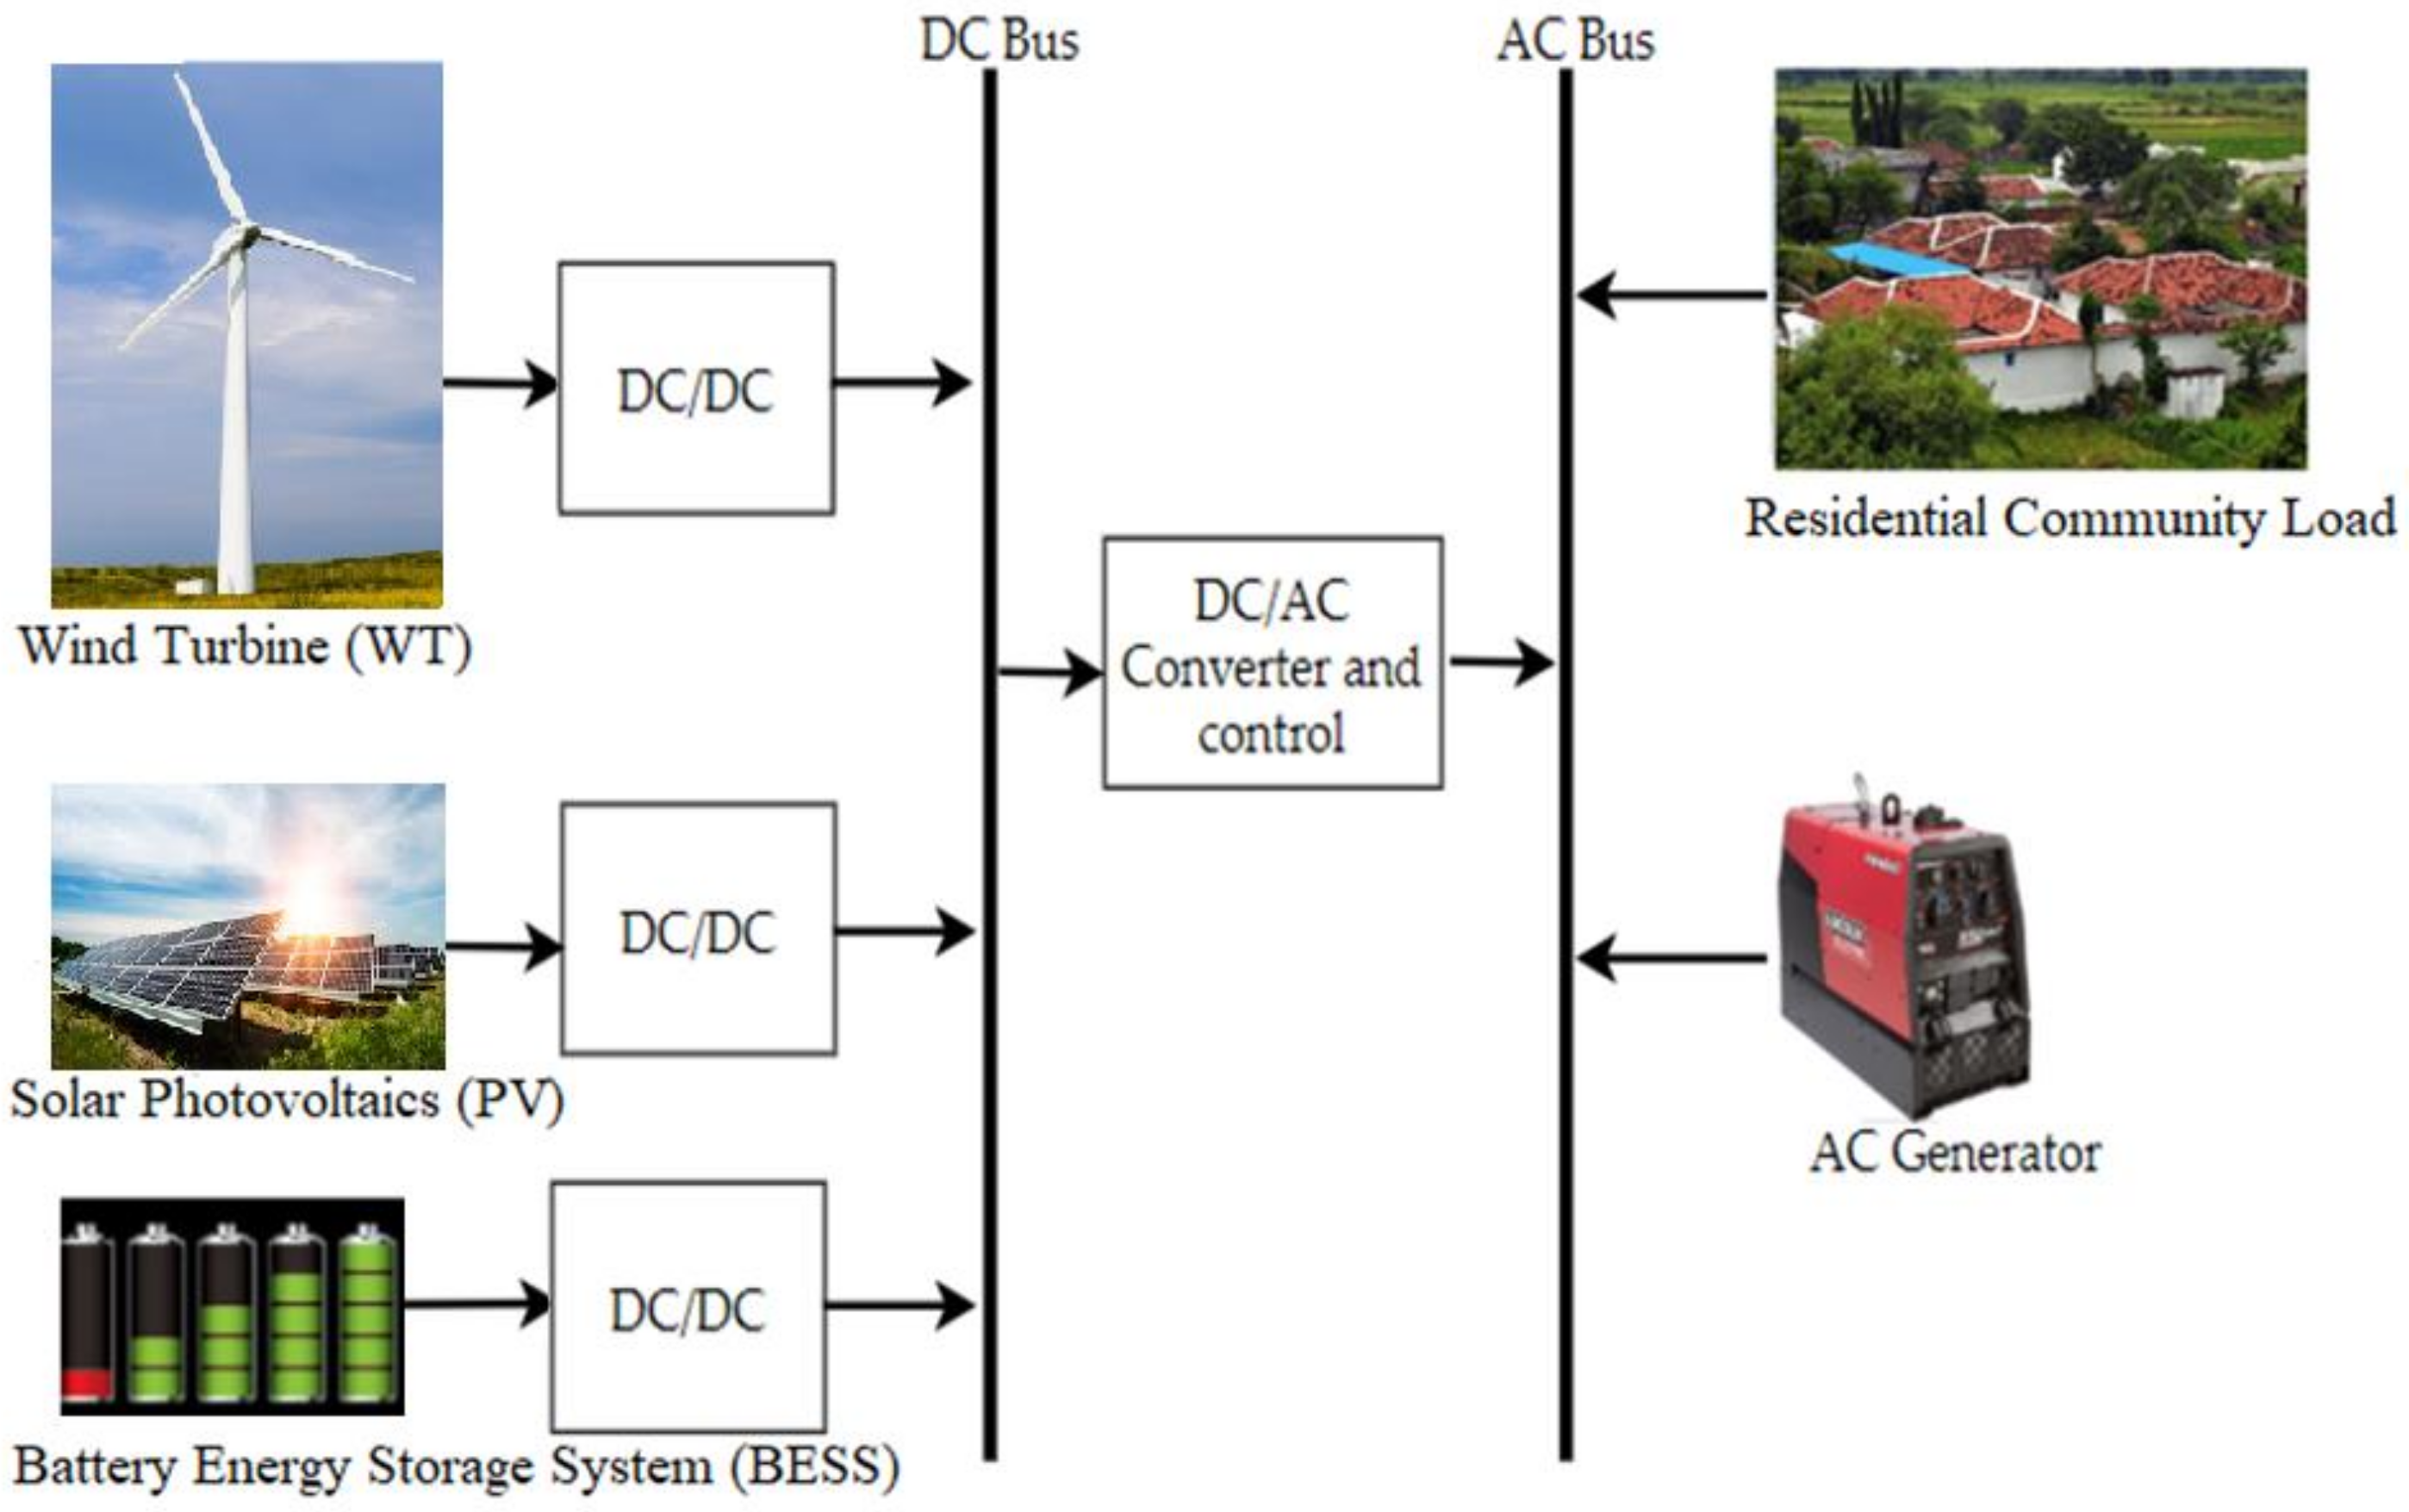
3. Description and Modeling of the Hybrid Renewable Energy Microgrid (HREM)
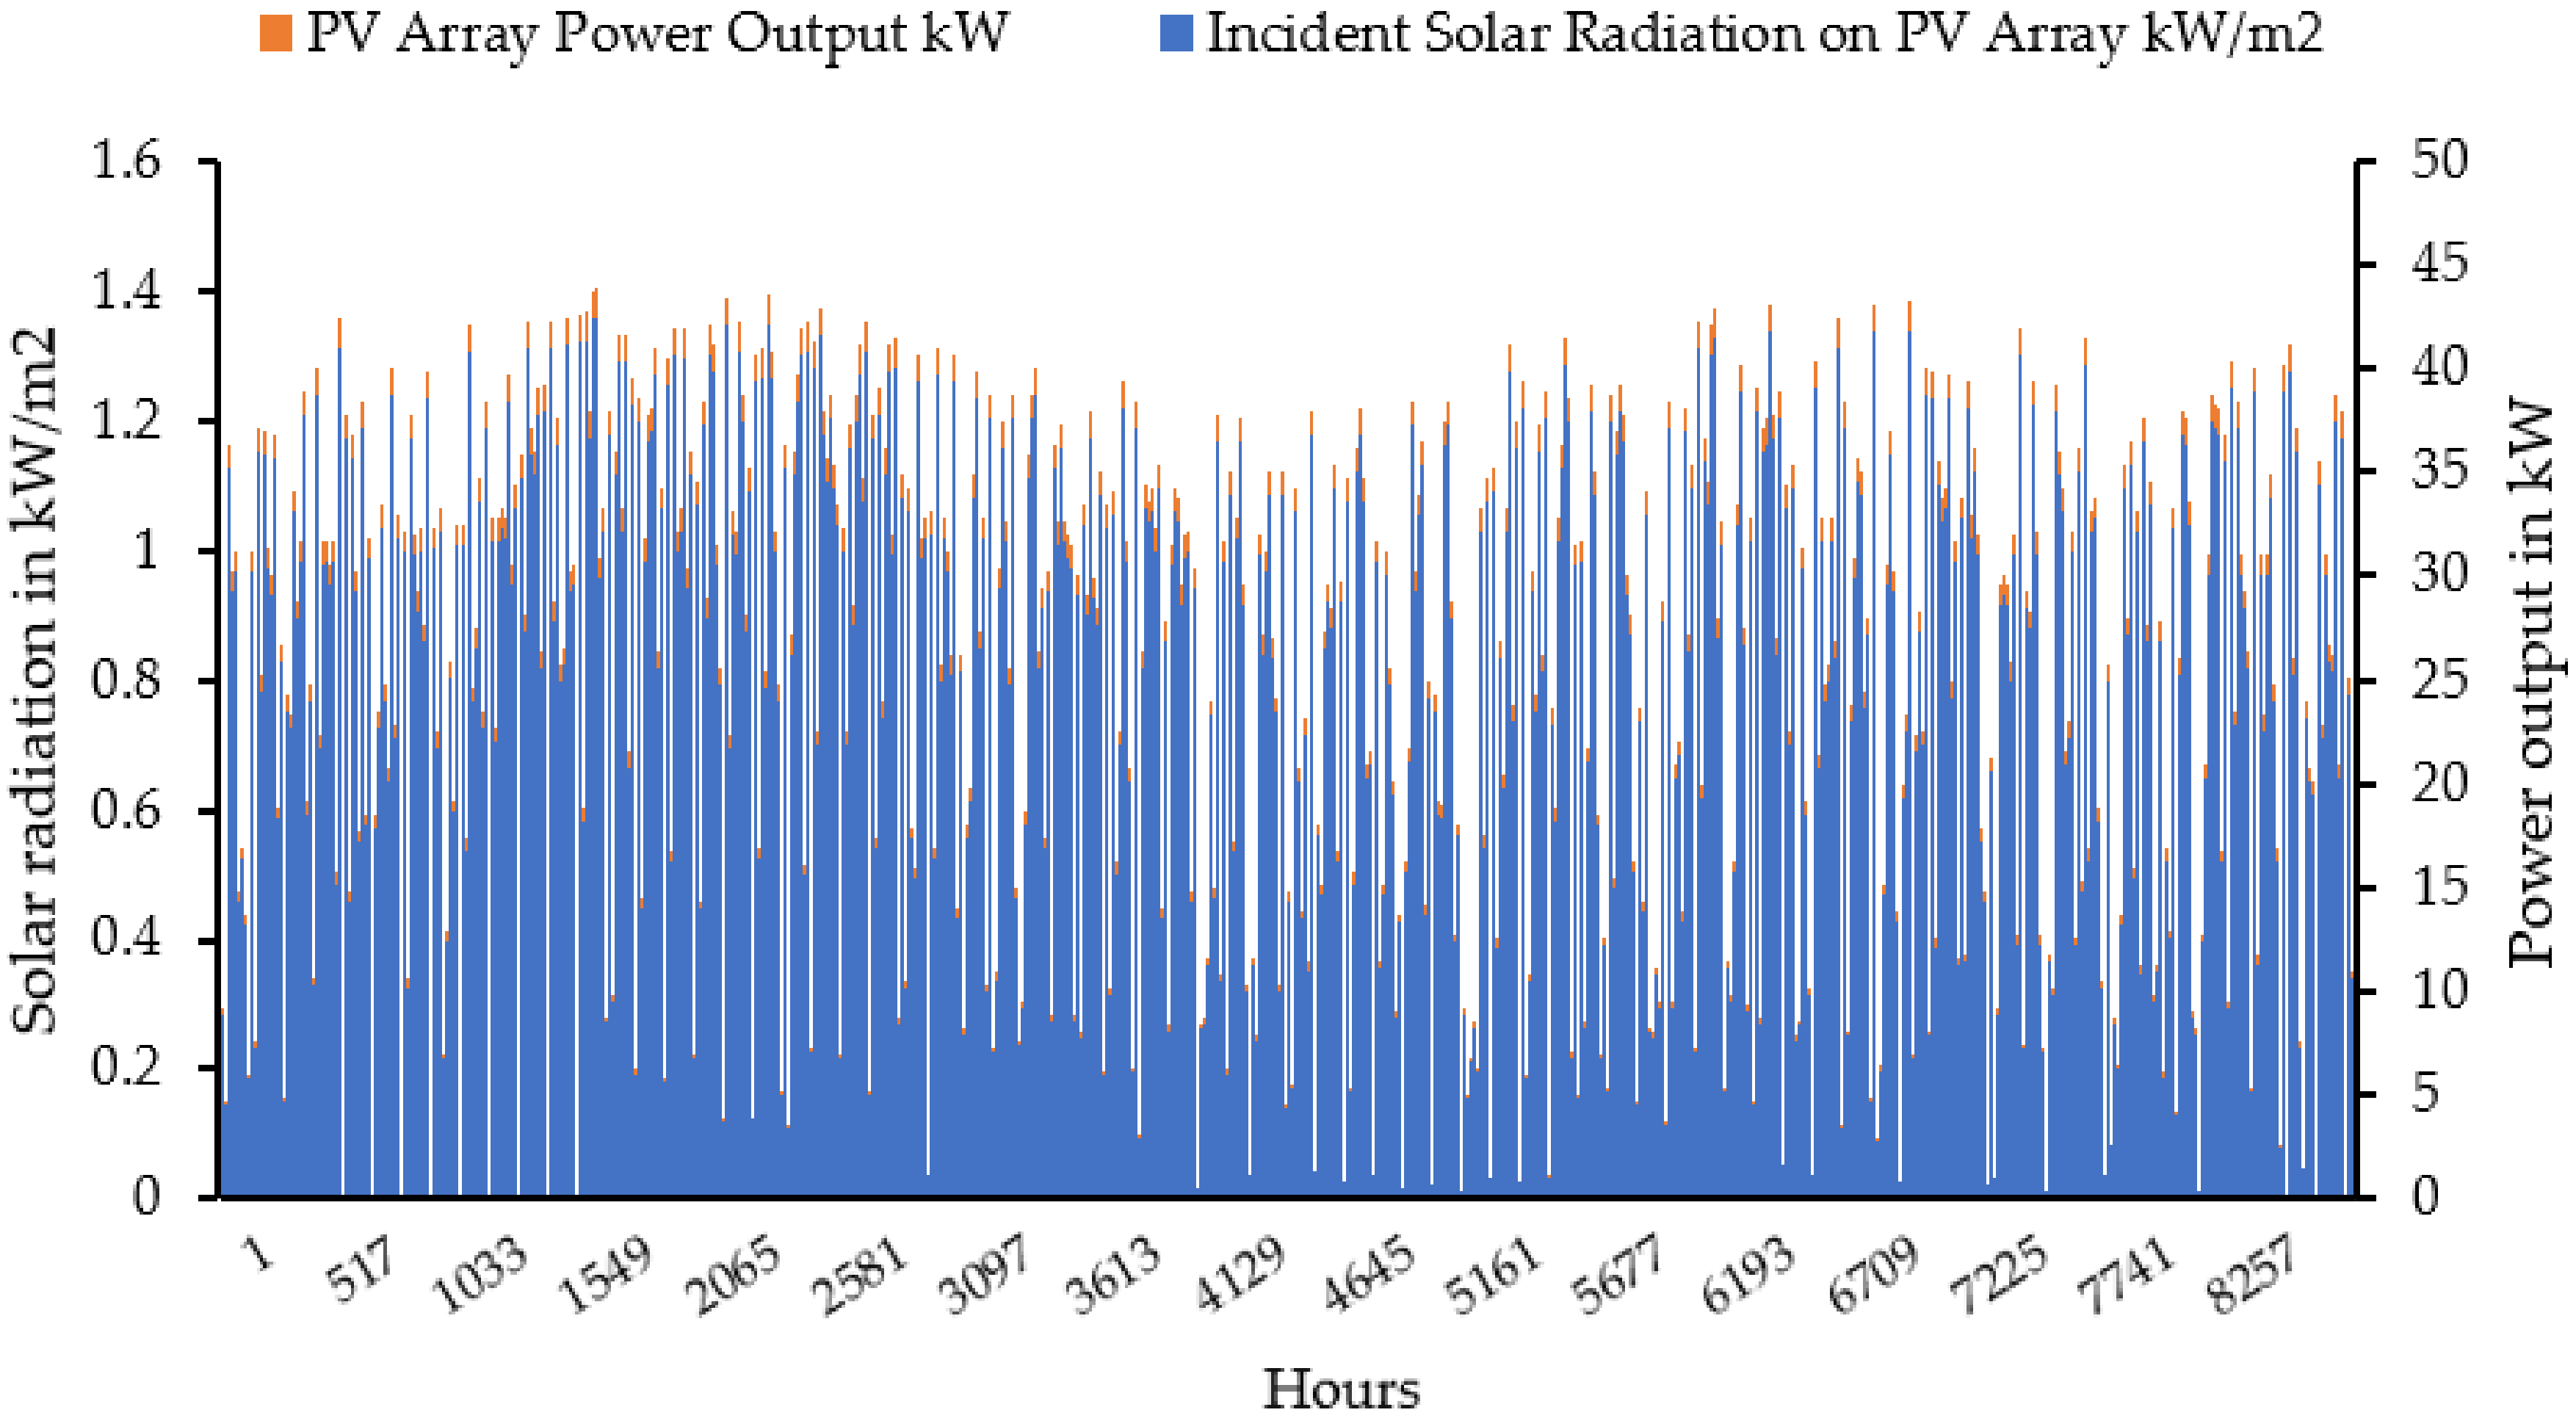
3.1. Solar Energy Conversion System (SECS)
3.2. Wind Energy Conversion System (WECS)
3.3. Battery Energy Storage System (BESS)
3.4. Diesel Generator (DG)
3.5. Power Convertors
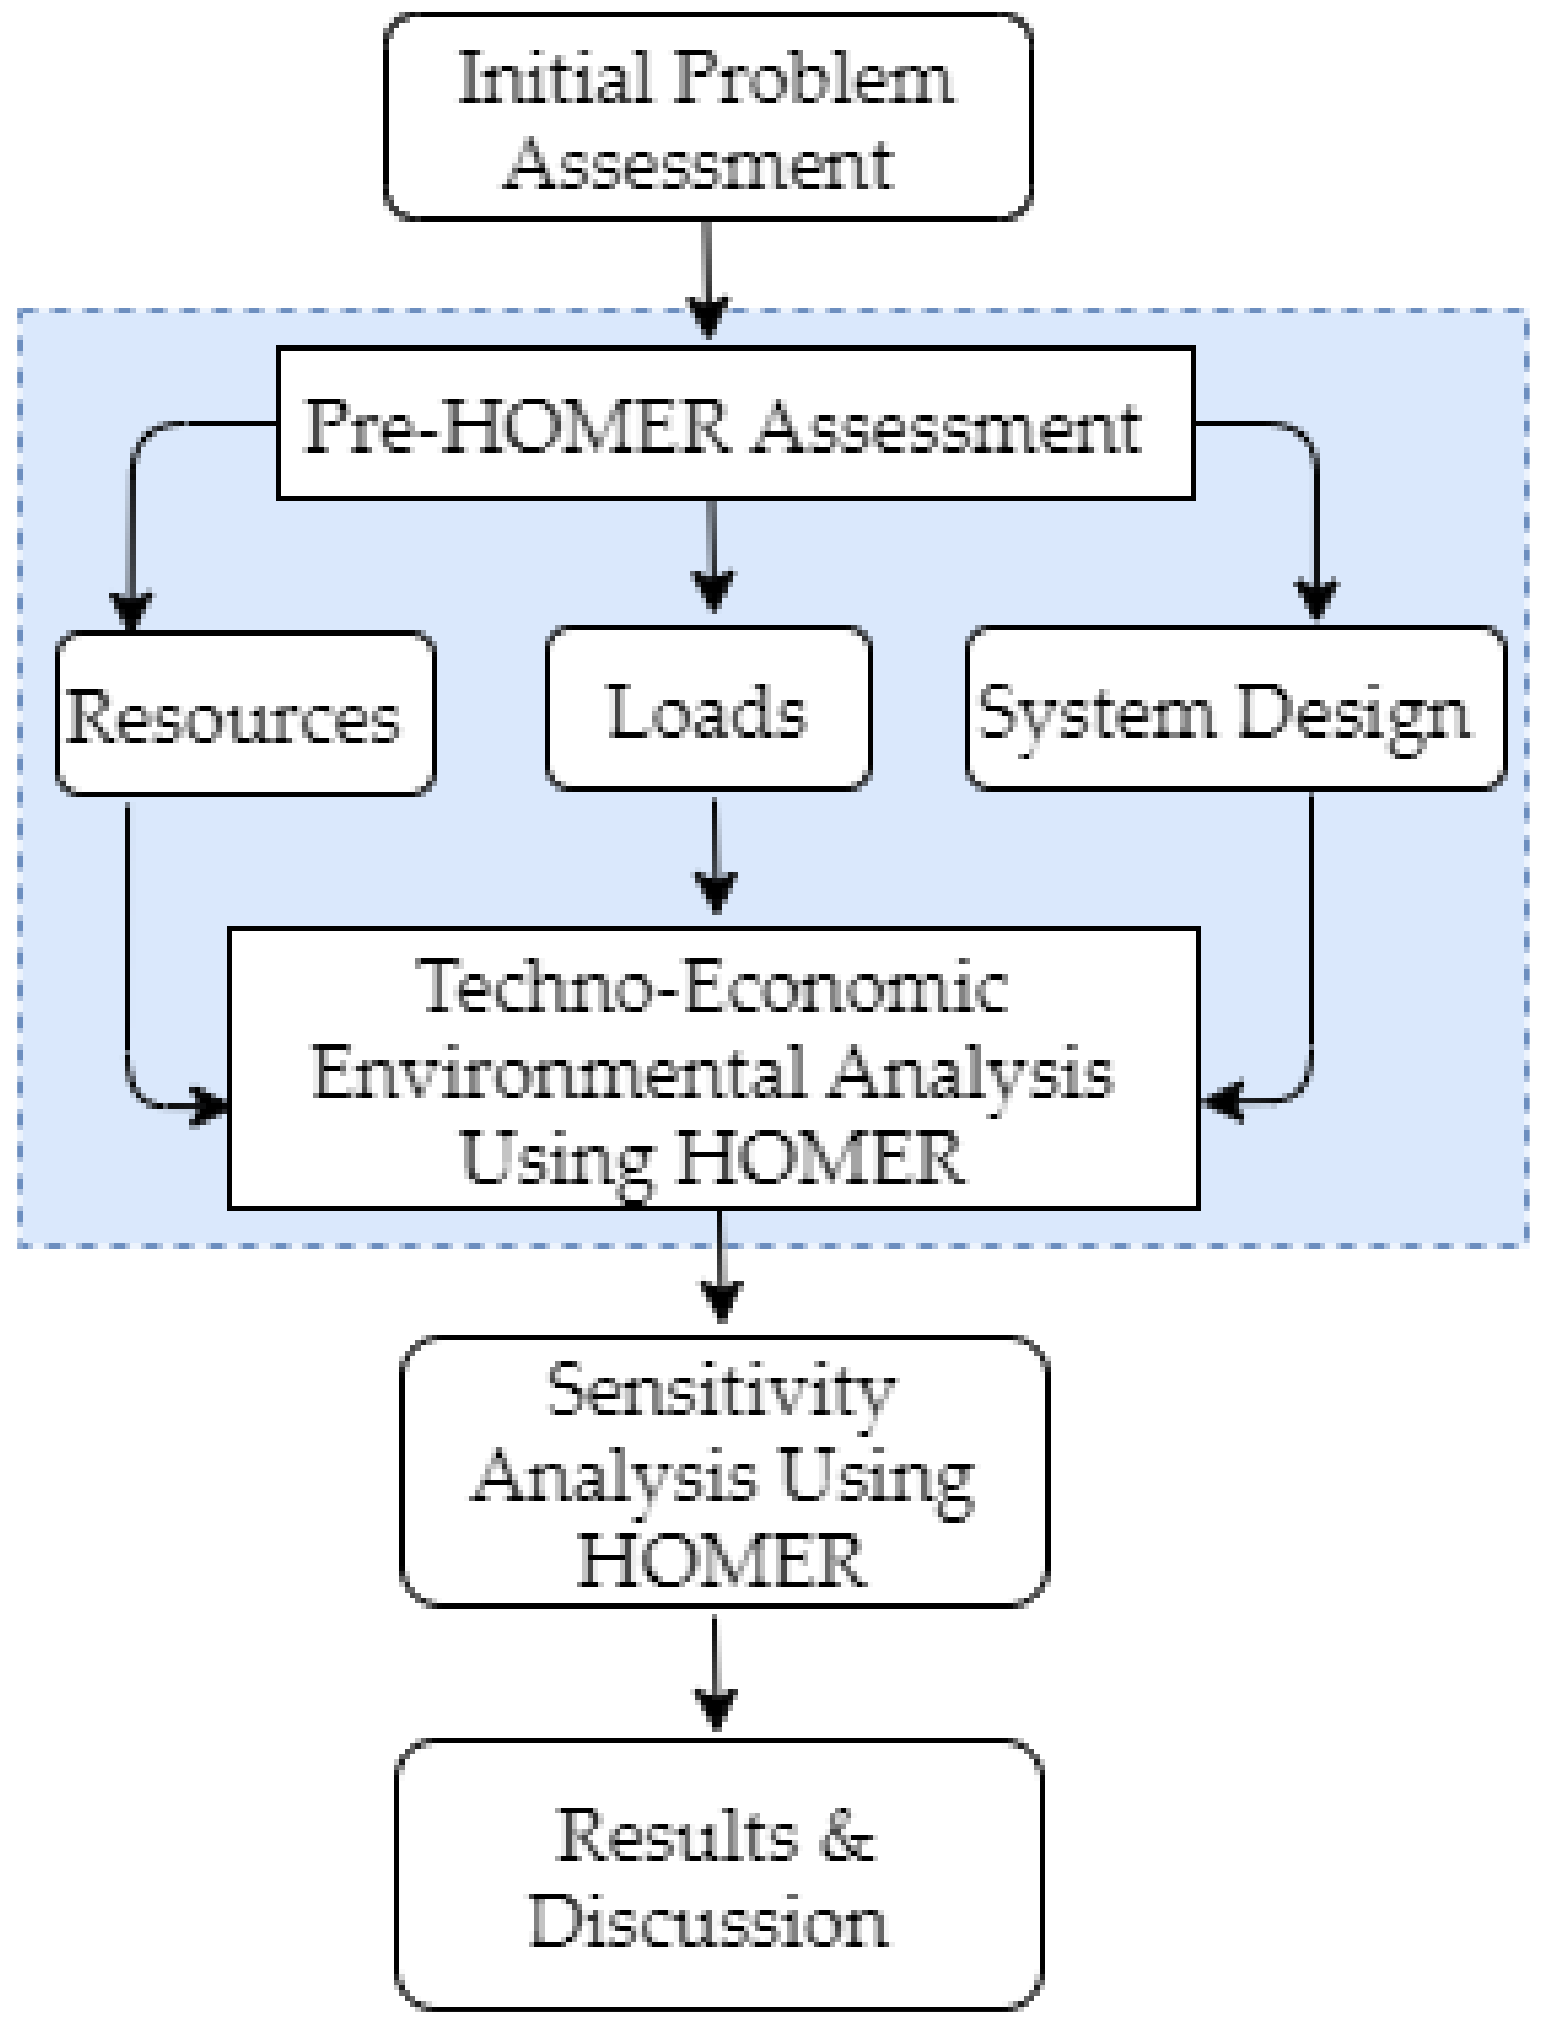
4. Framework and the Optimization Methodology
5. Pre-Assessment and Data Inputs for Simulation
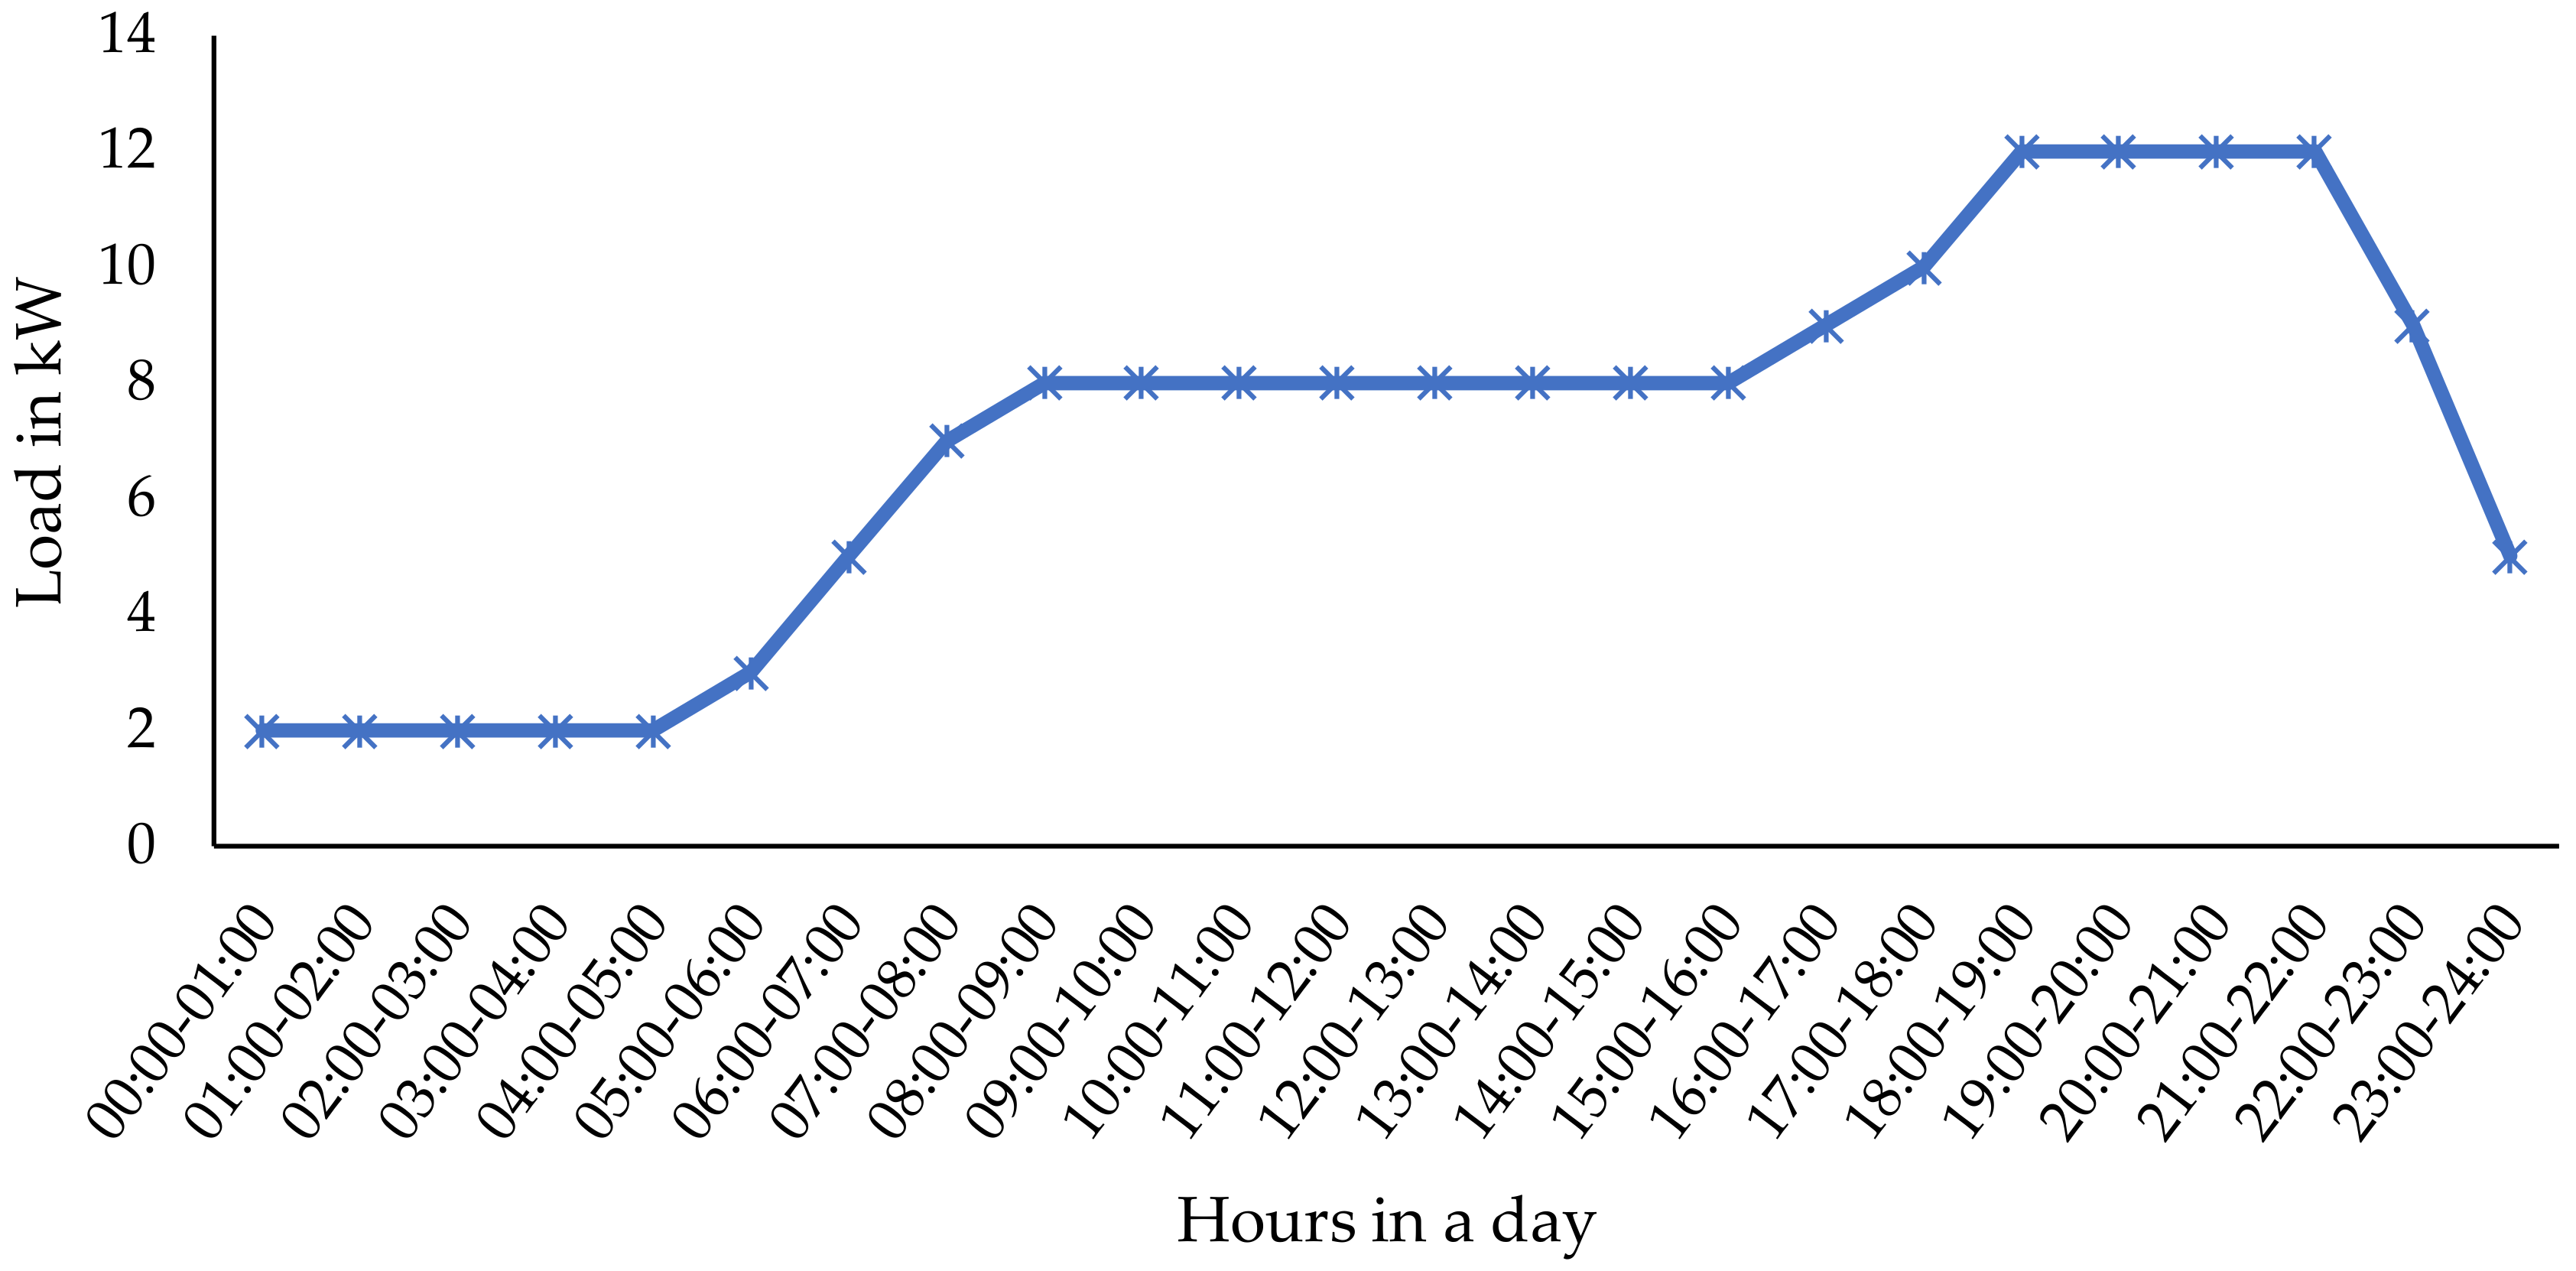
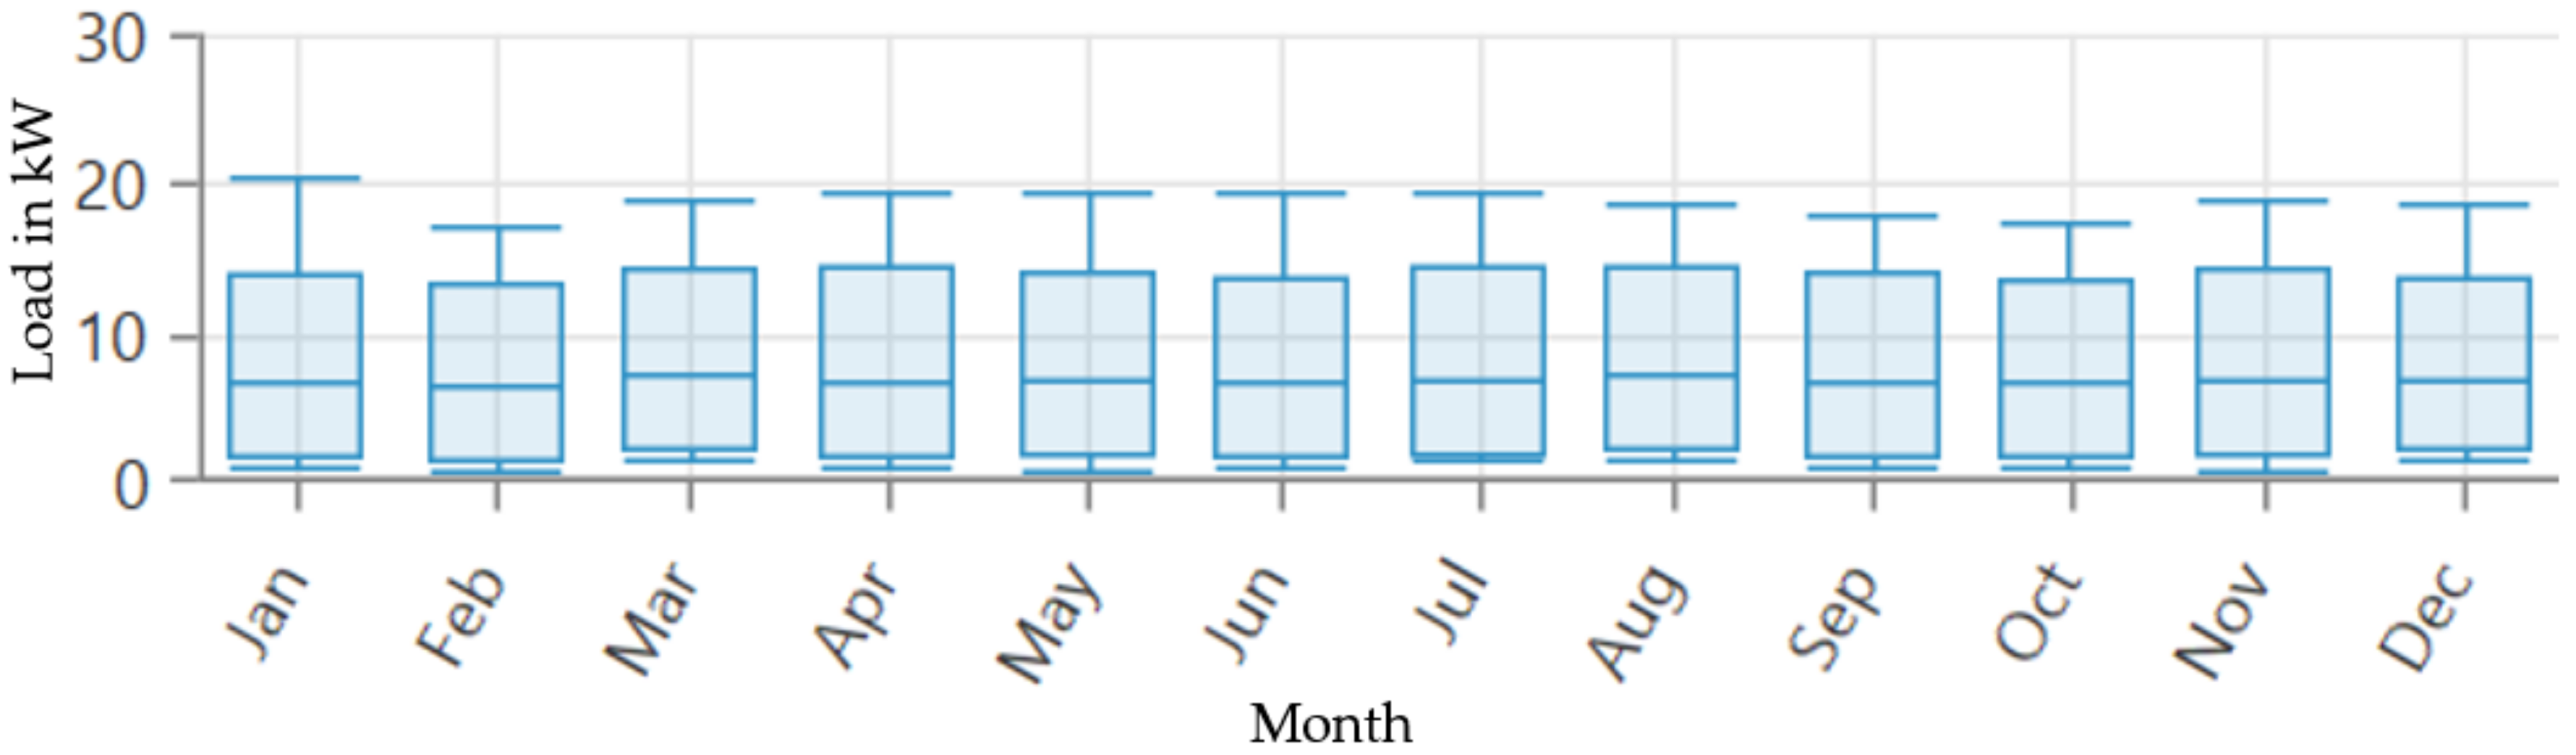
5.1. Load Assessment
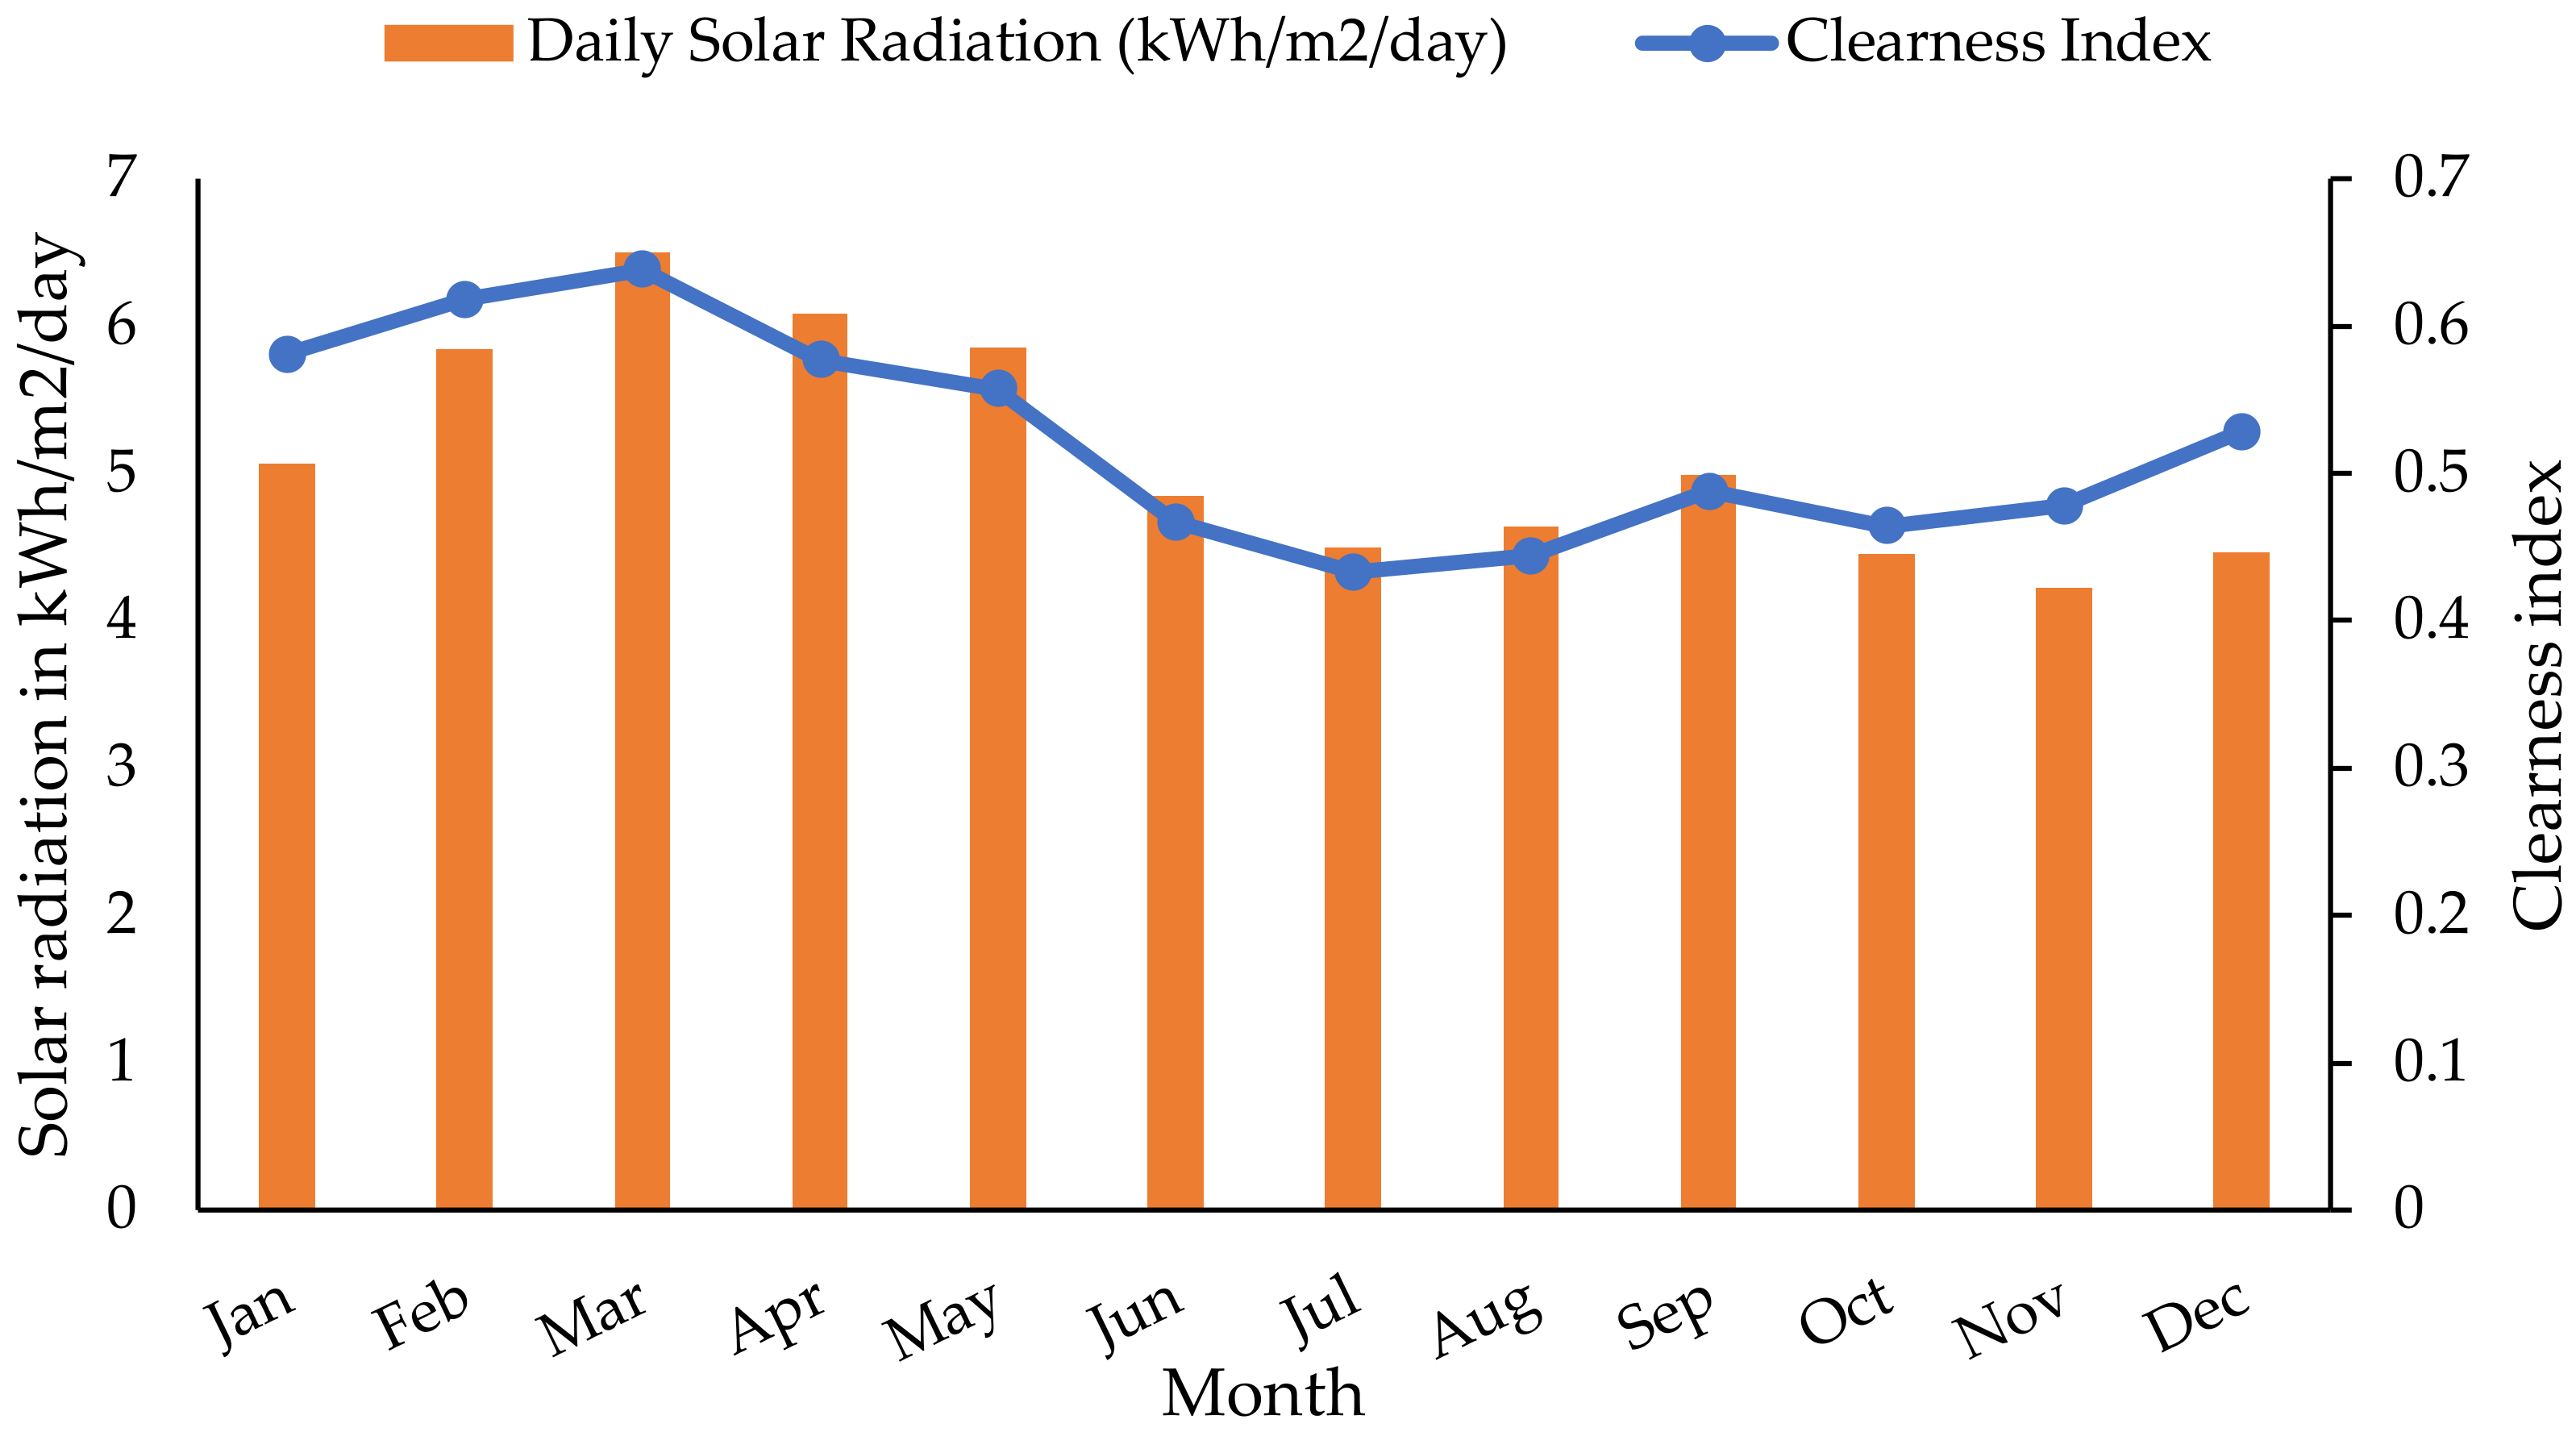
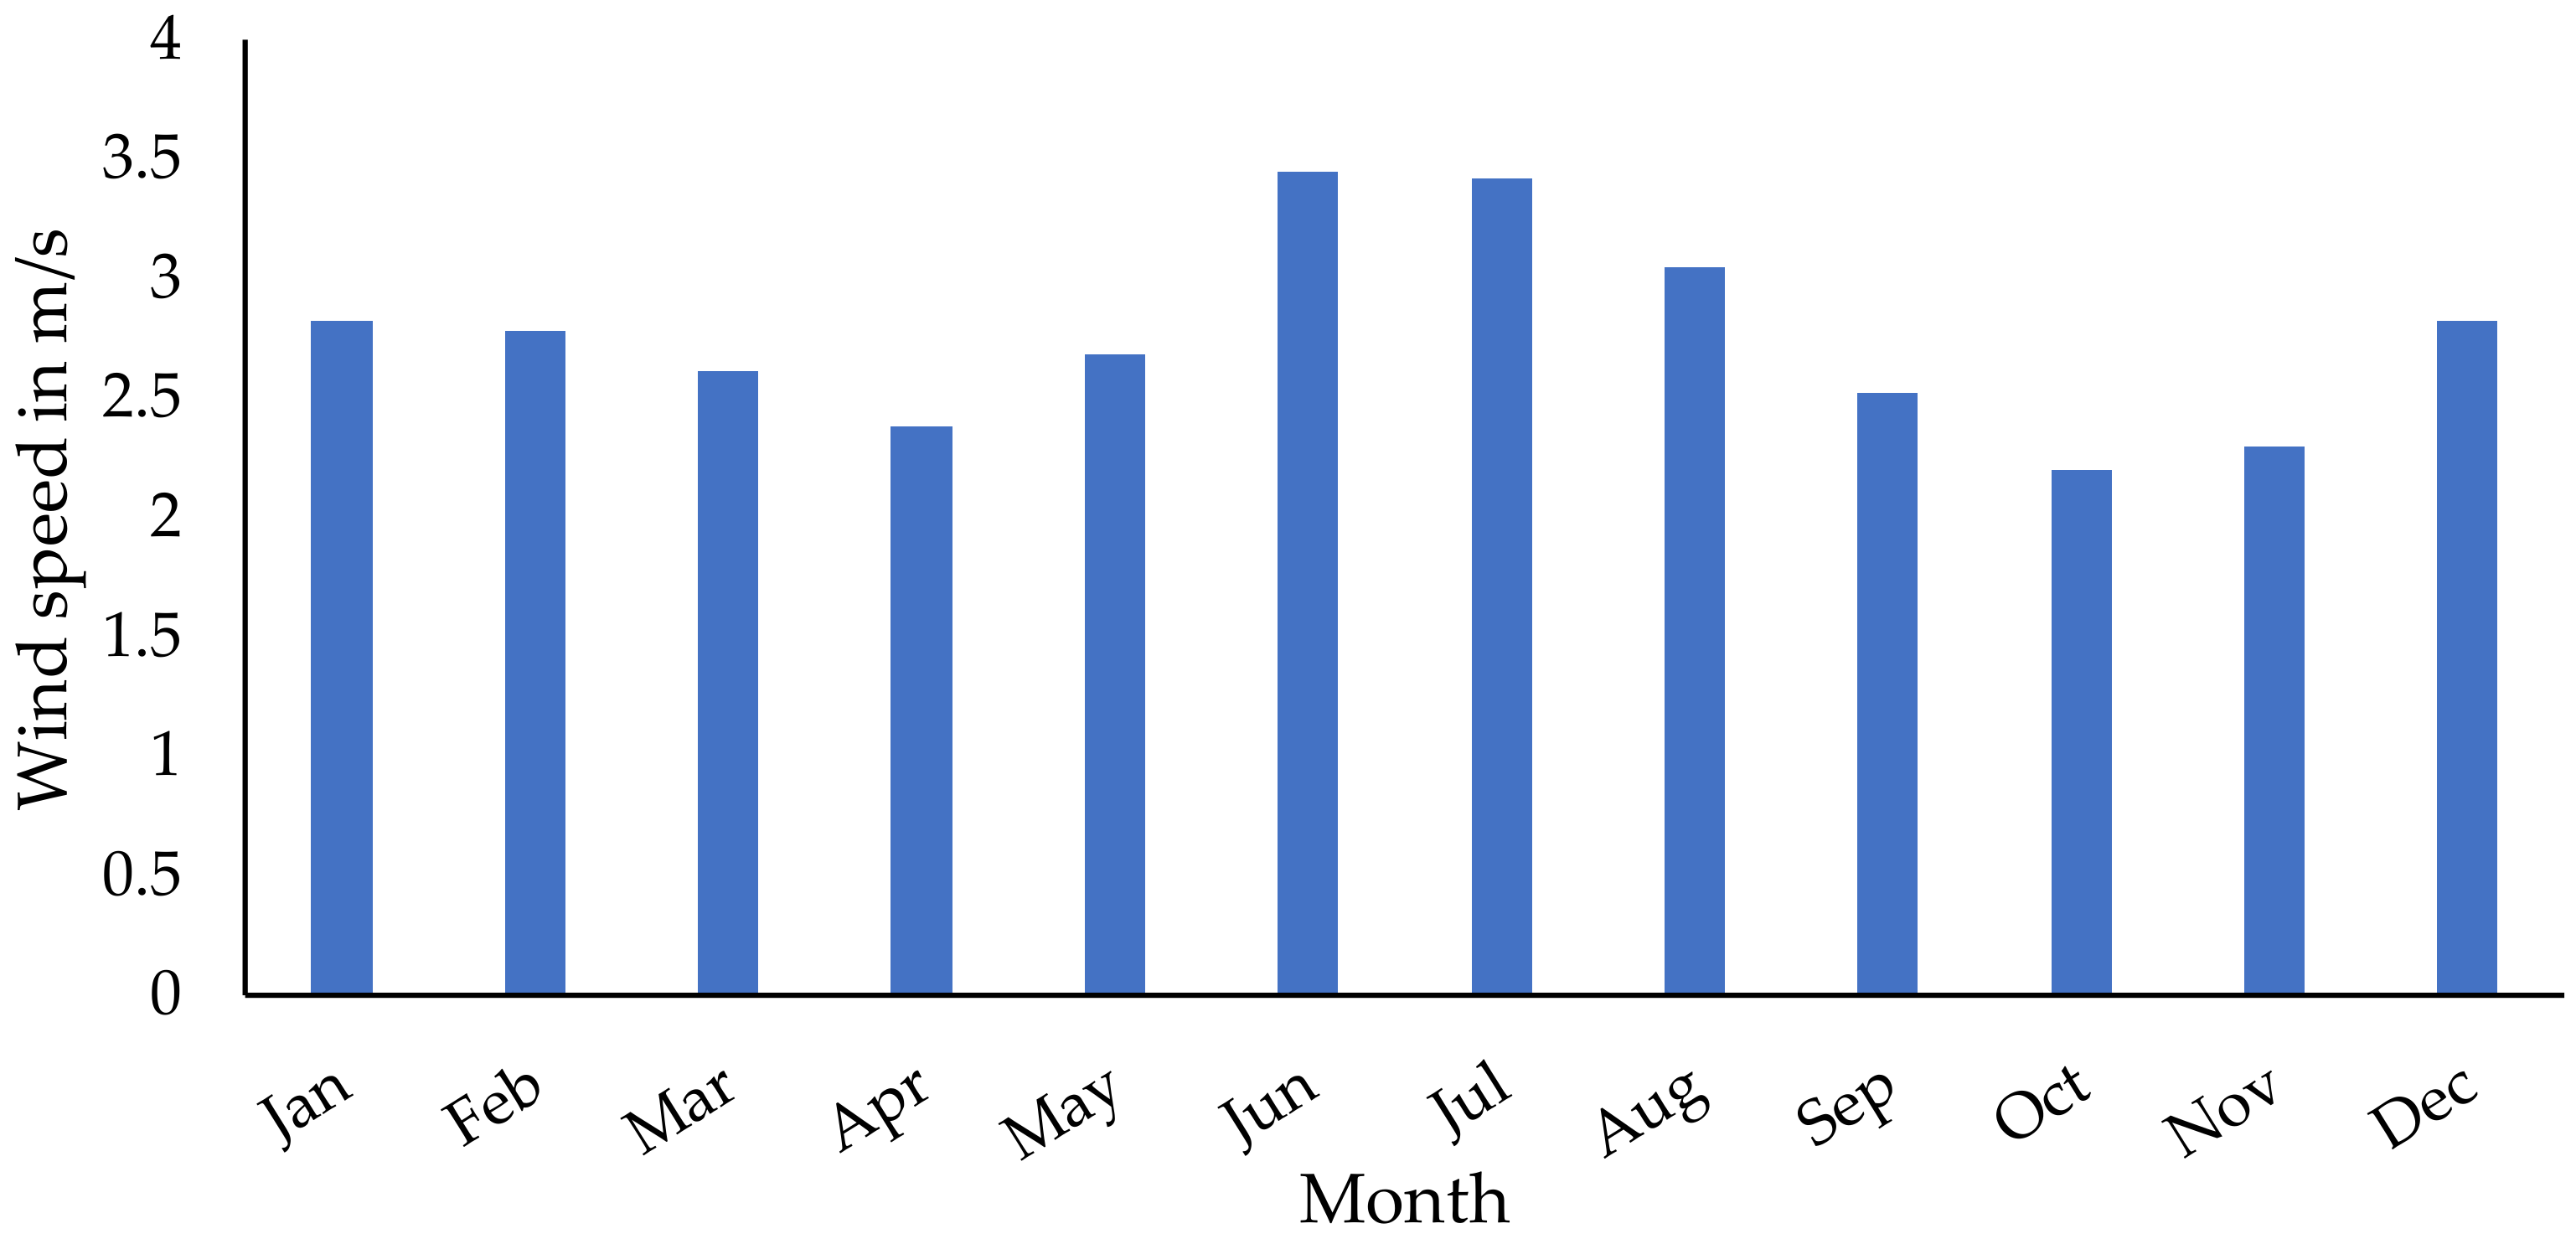
5.2. Resource Assessment
5.3. Load Following Dispatch Strategy
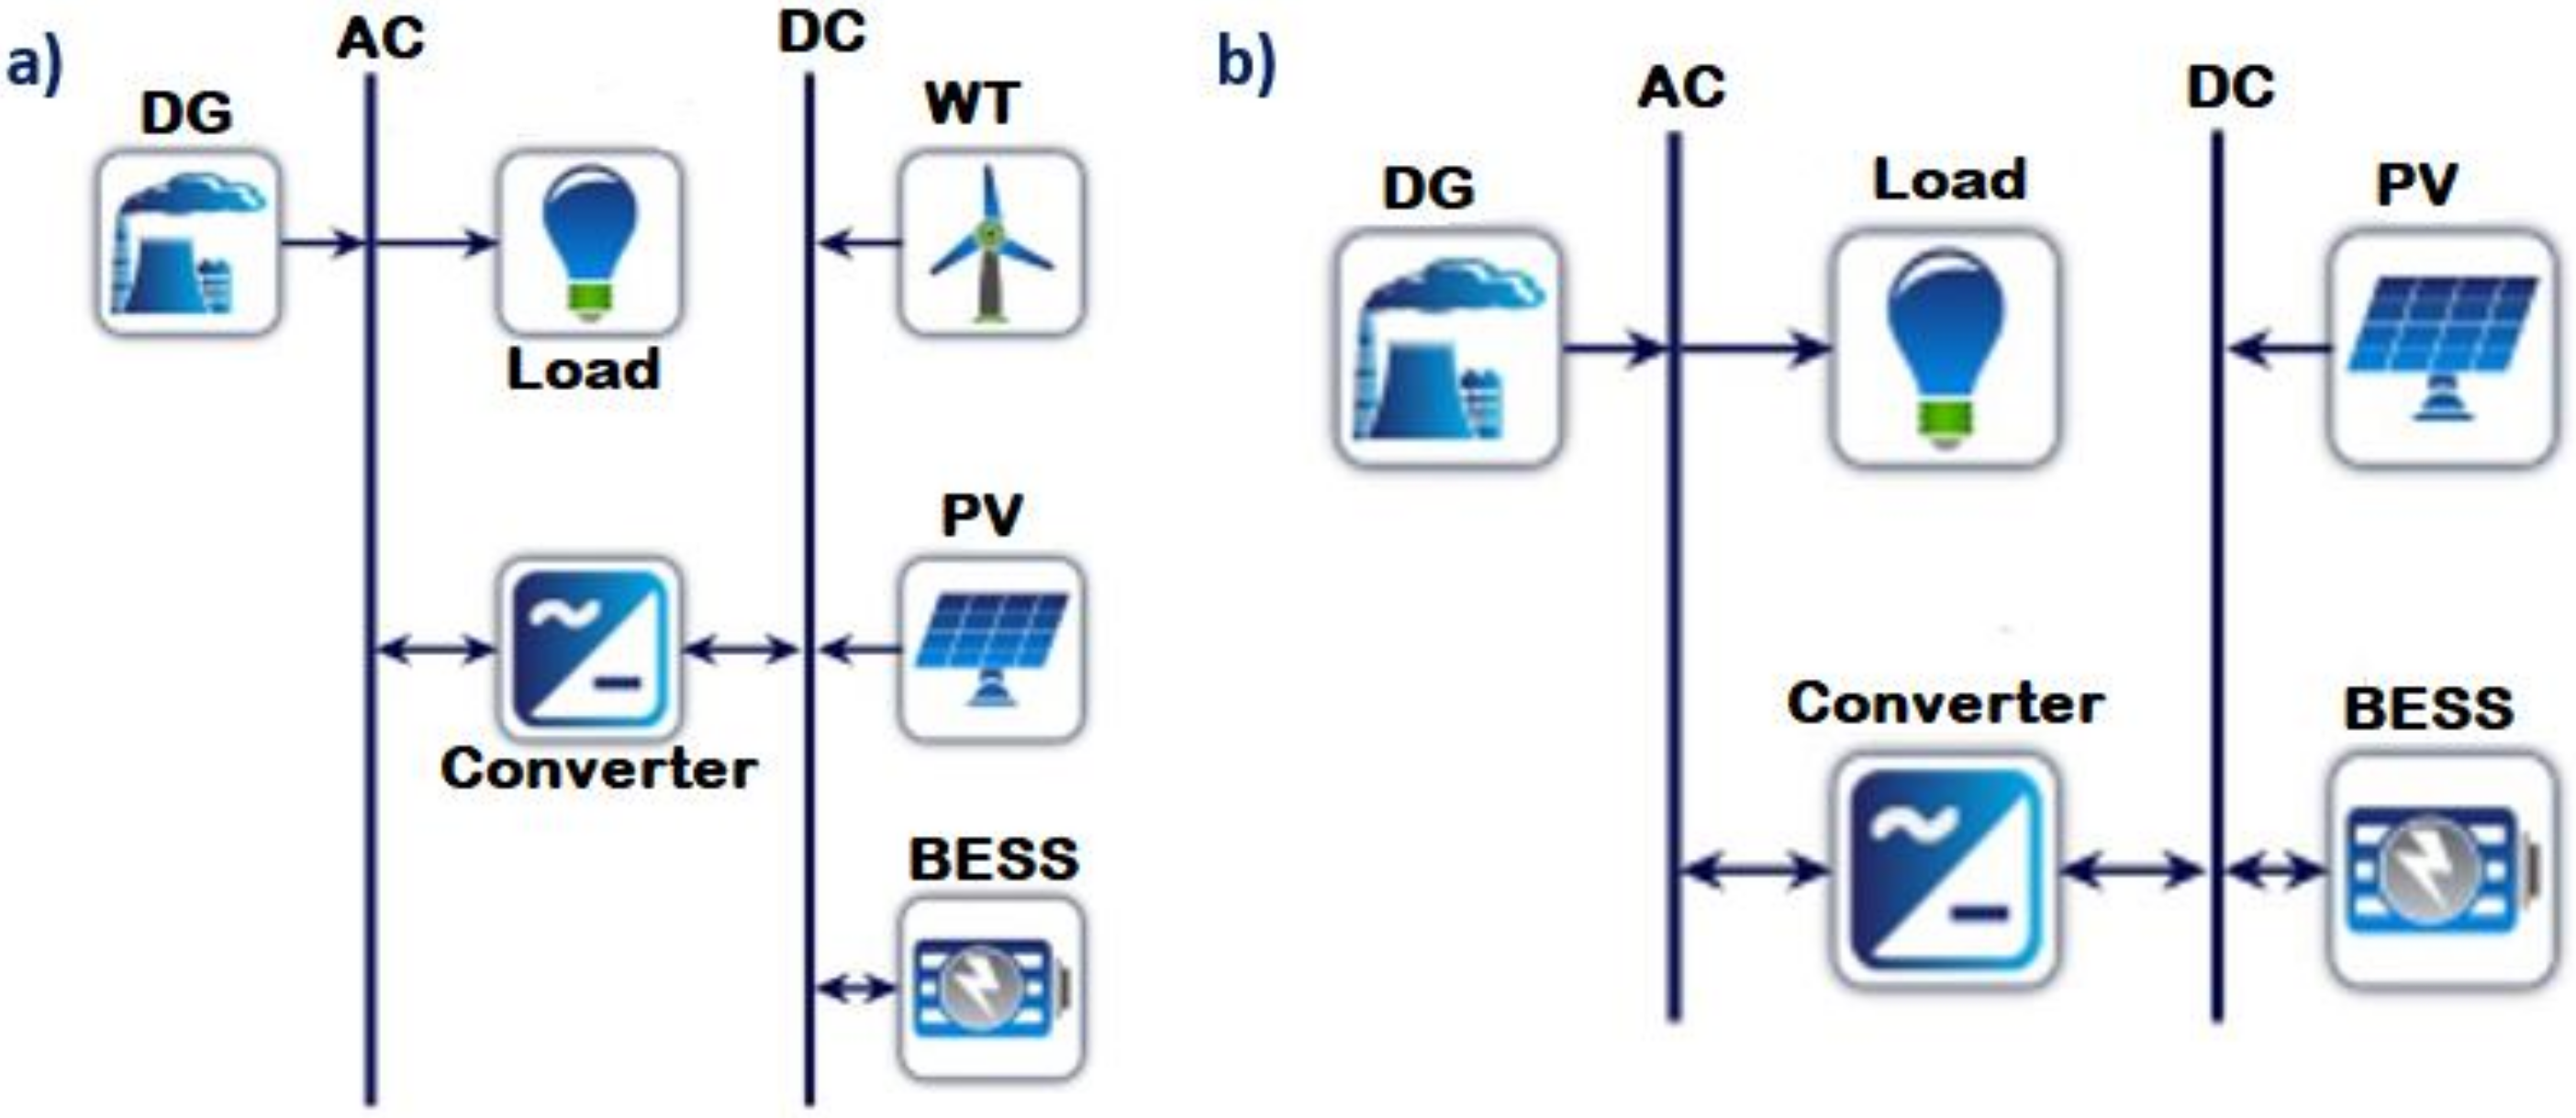
5.4. HREM Model
6. Results and Discussion
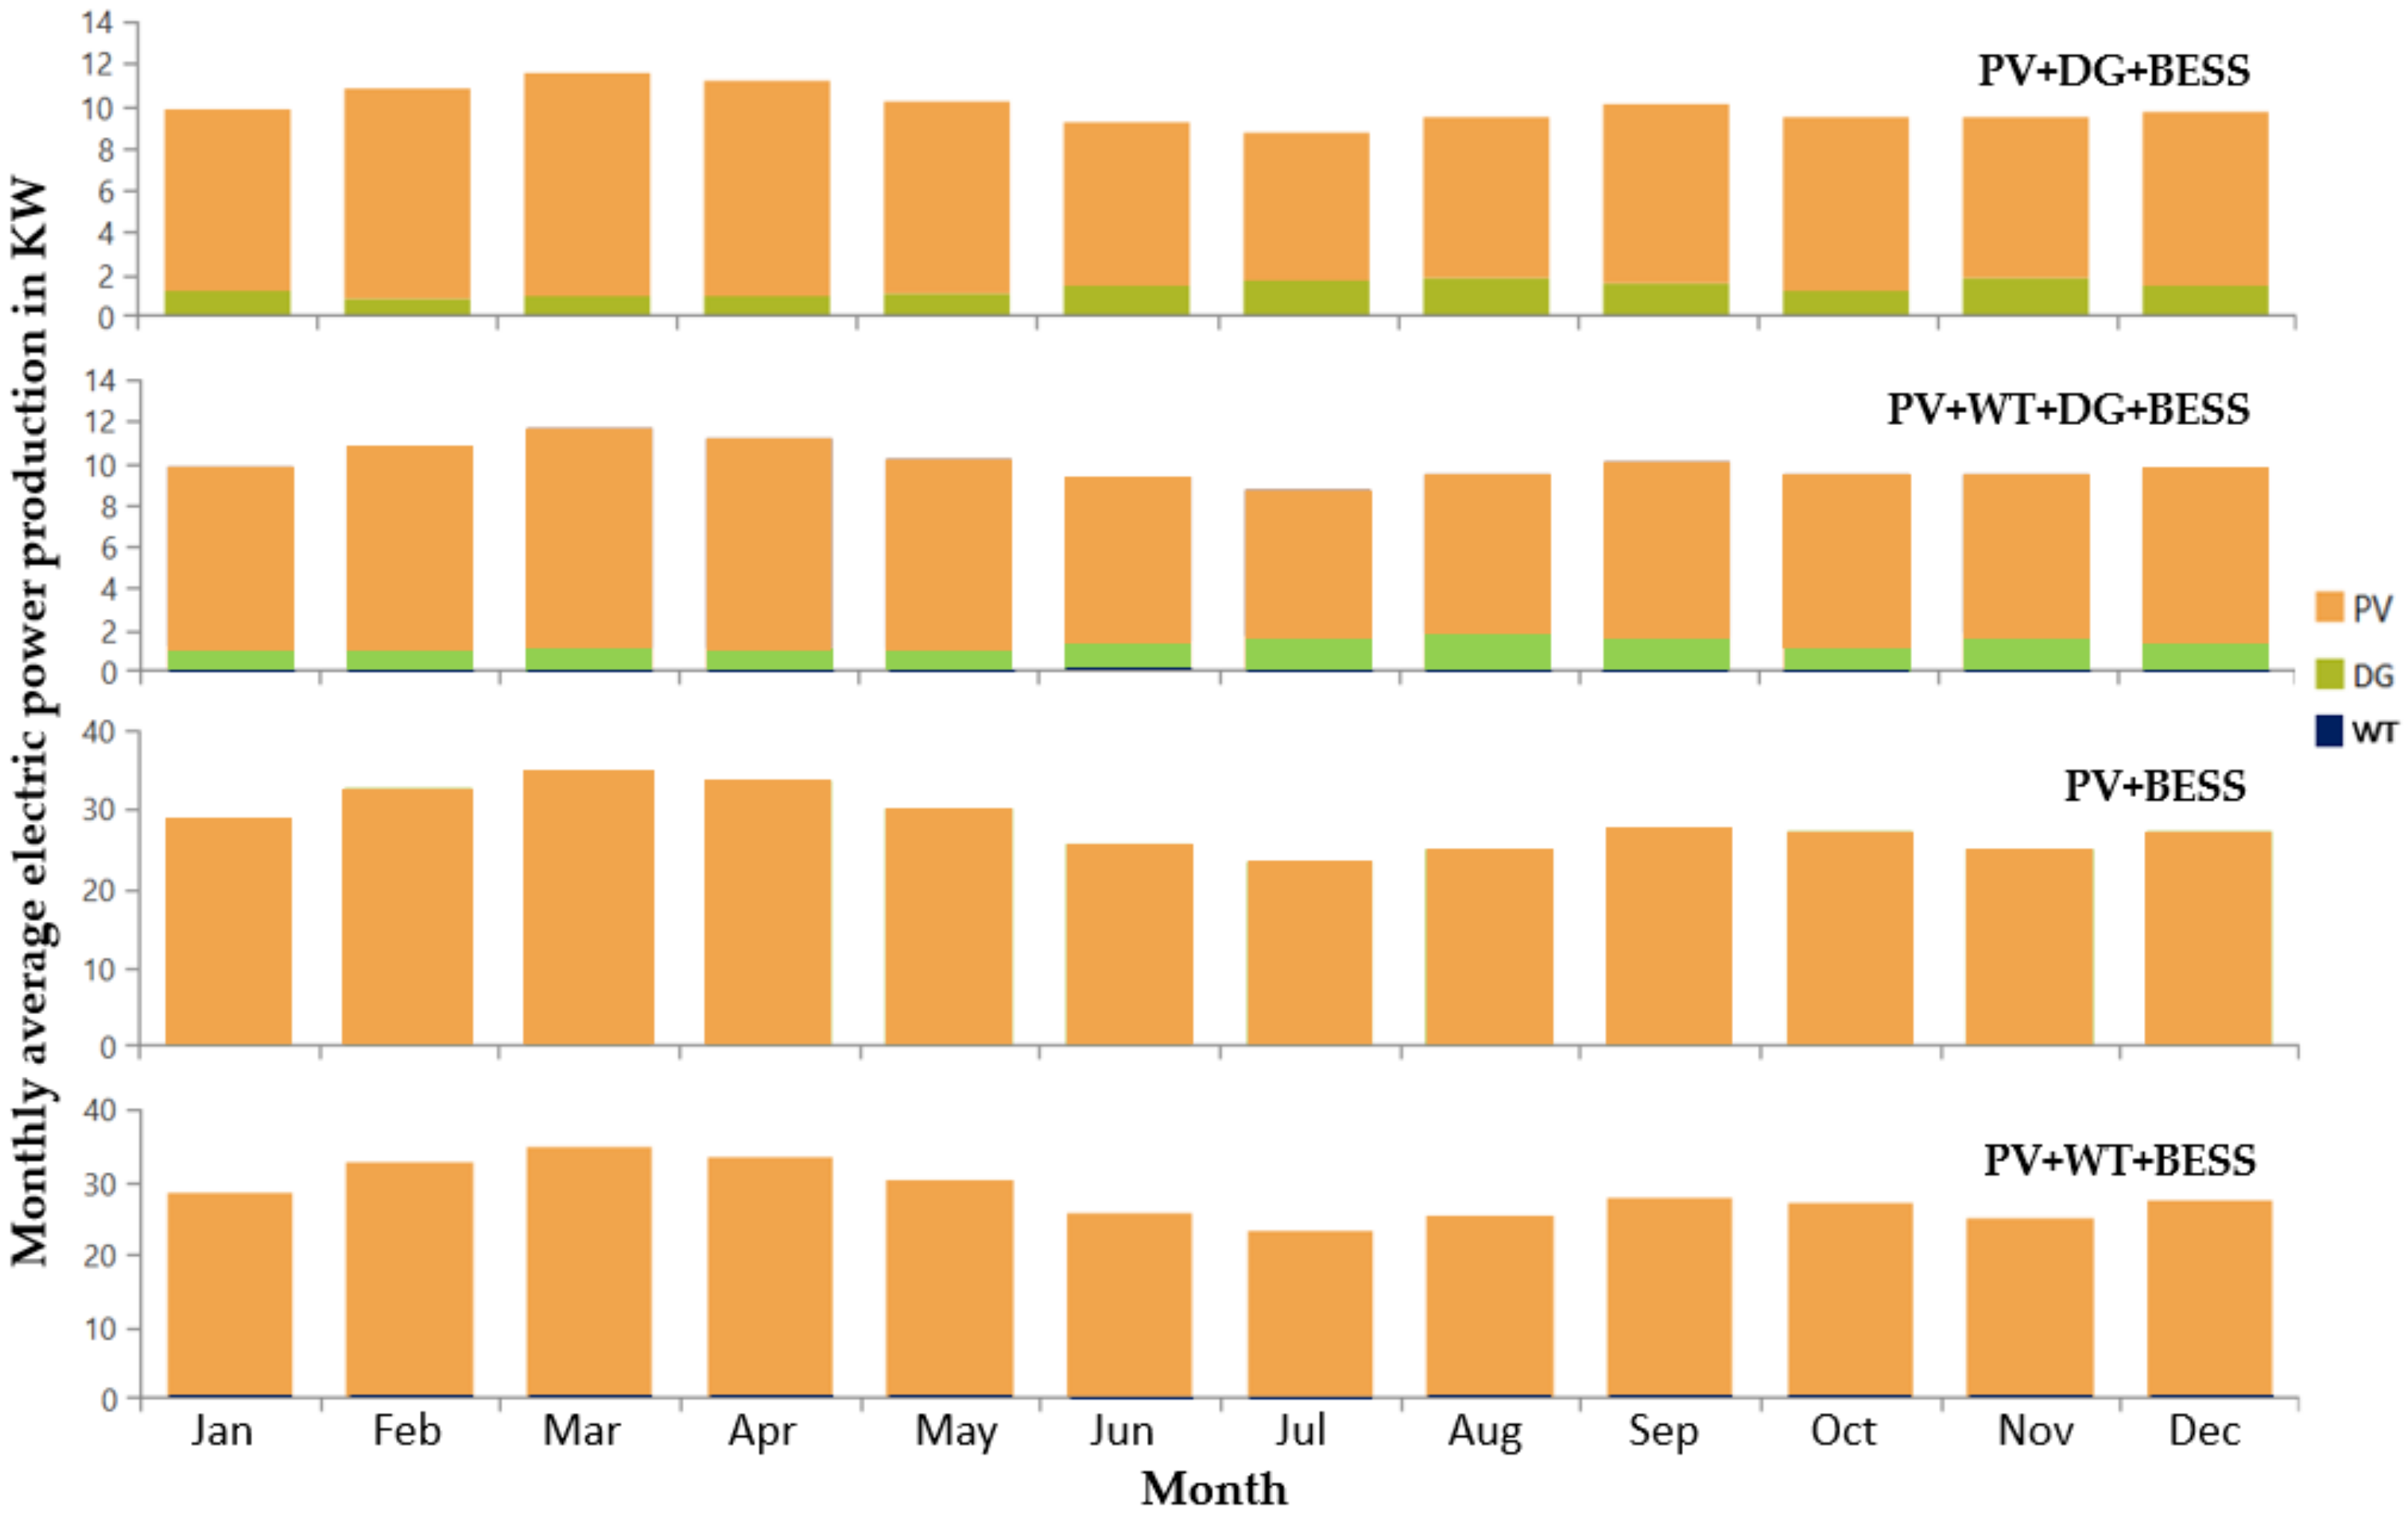
6.1. Technical Analysis
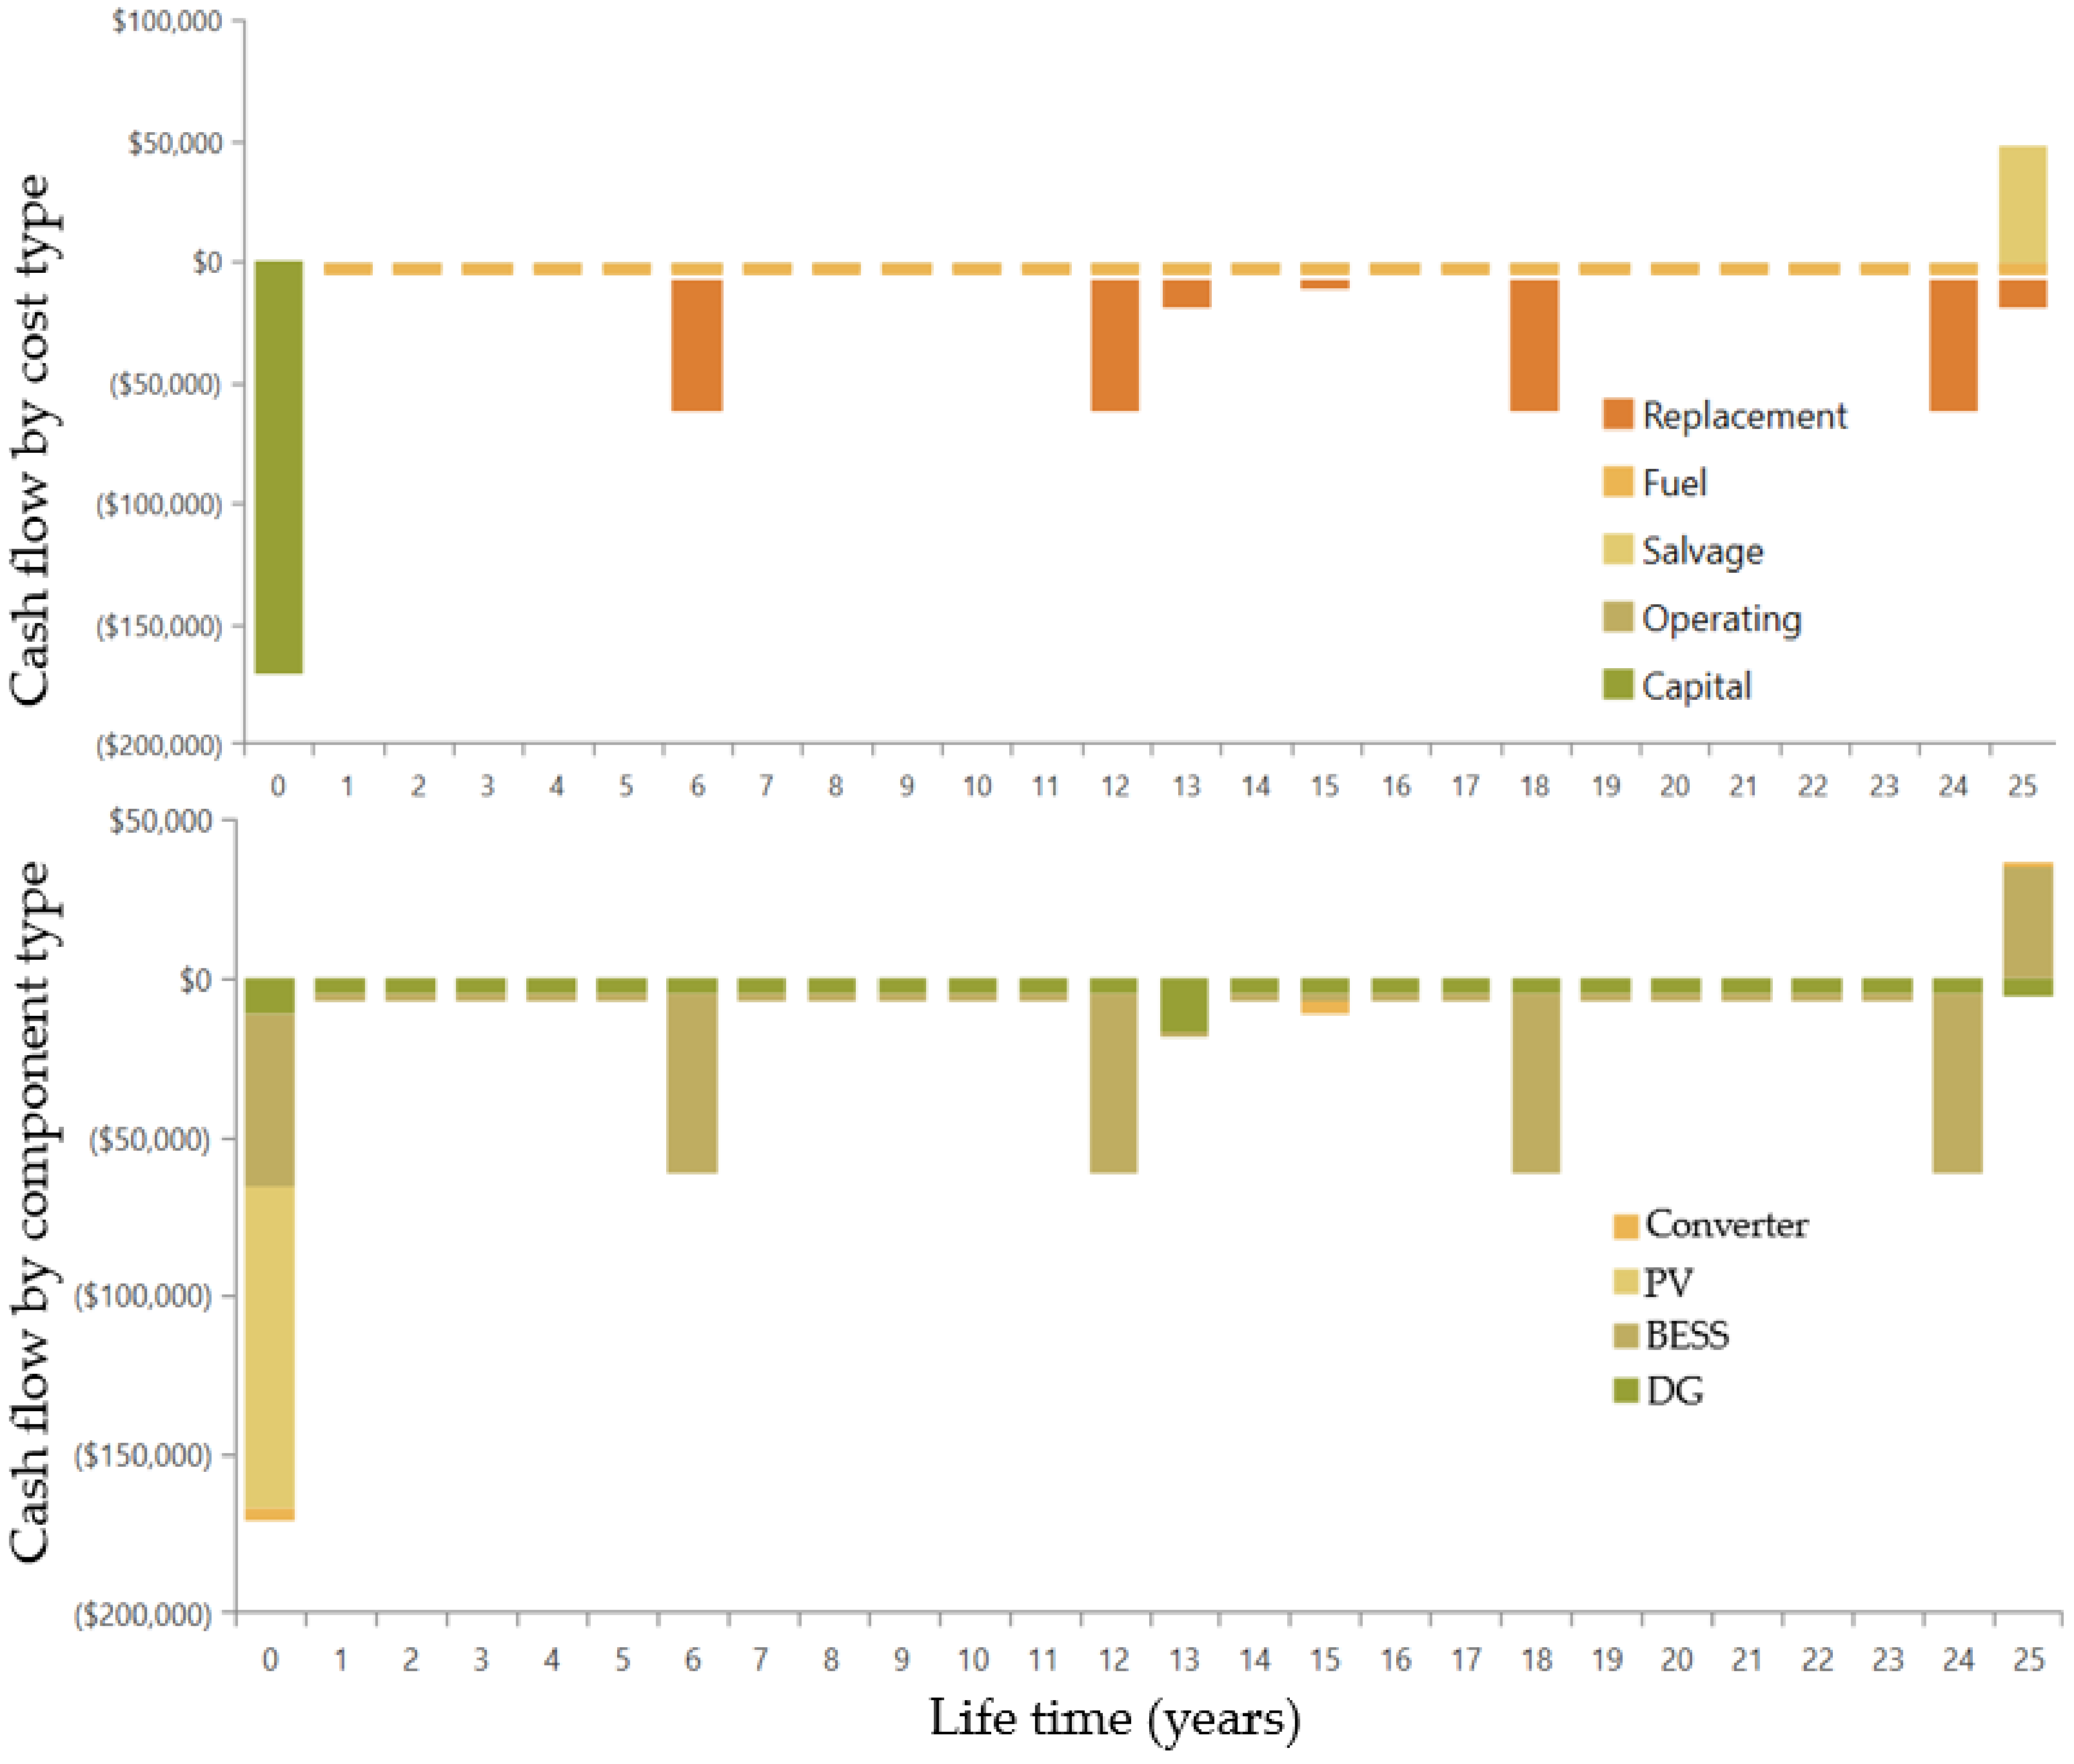
6.2. Economic Analysis
6.3. Environmental Analysis
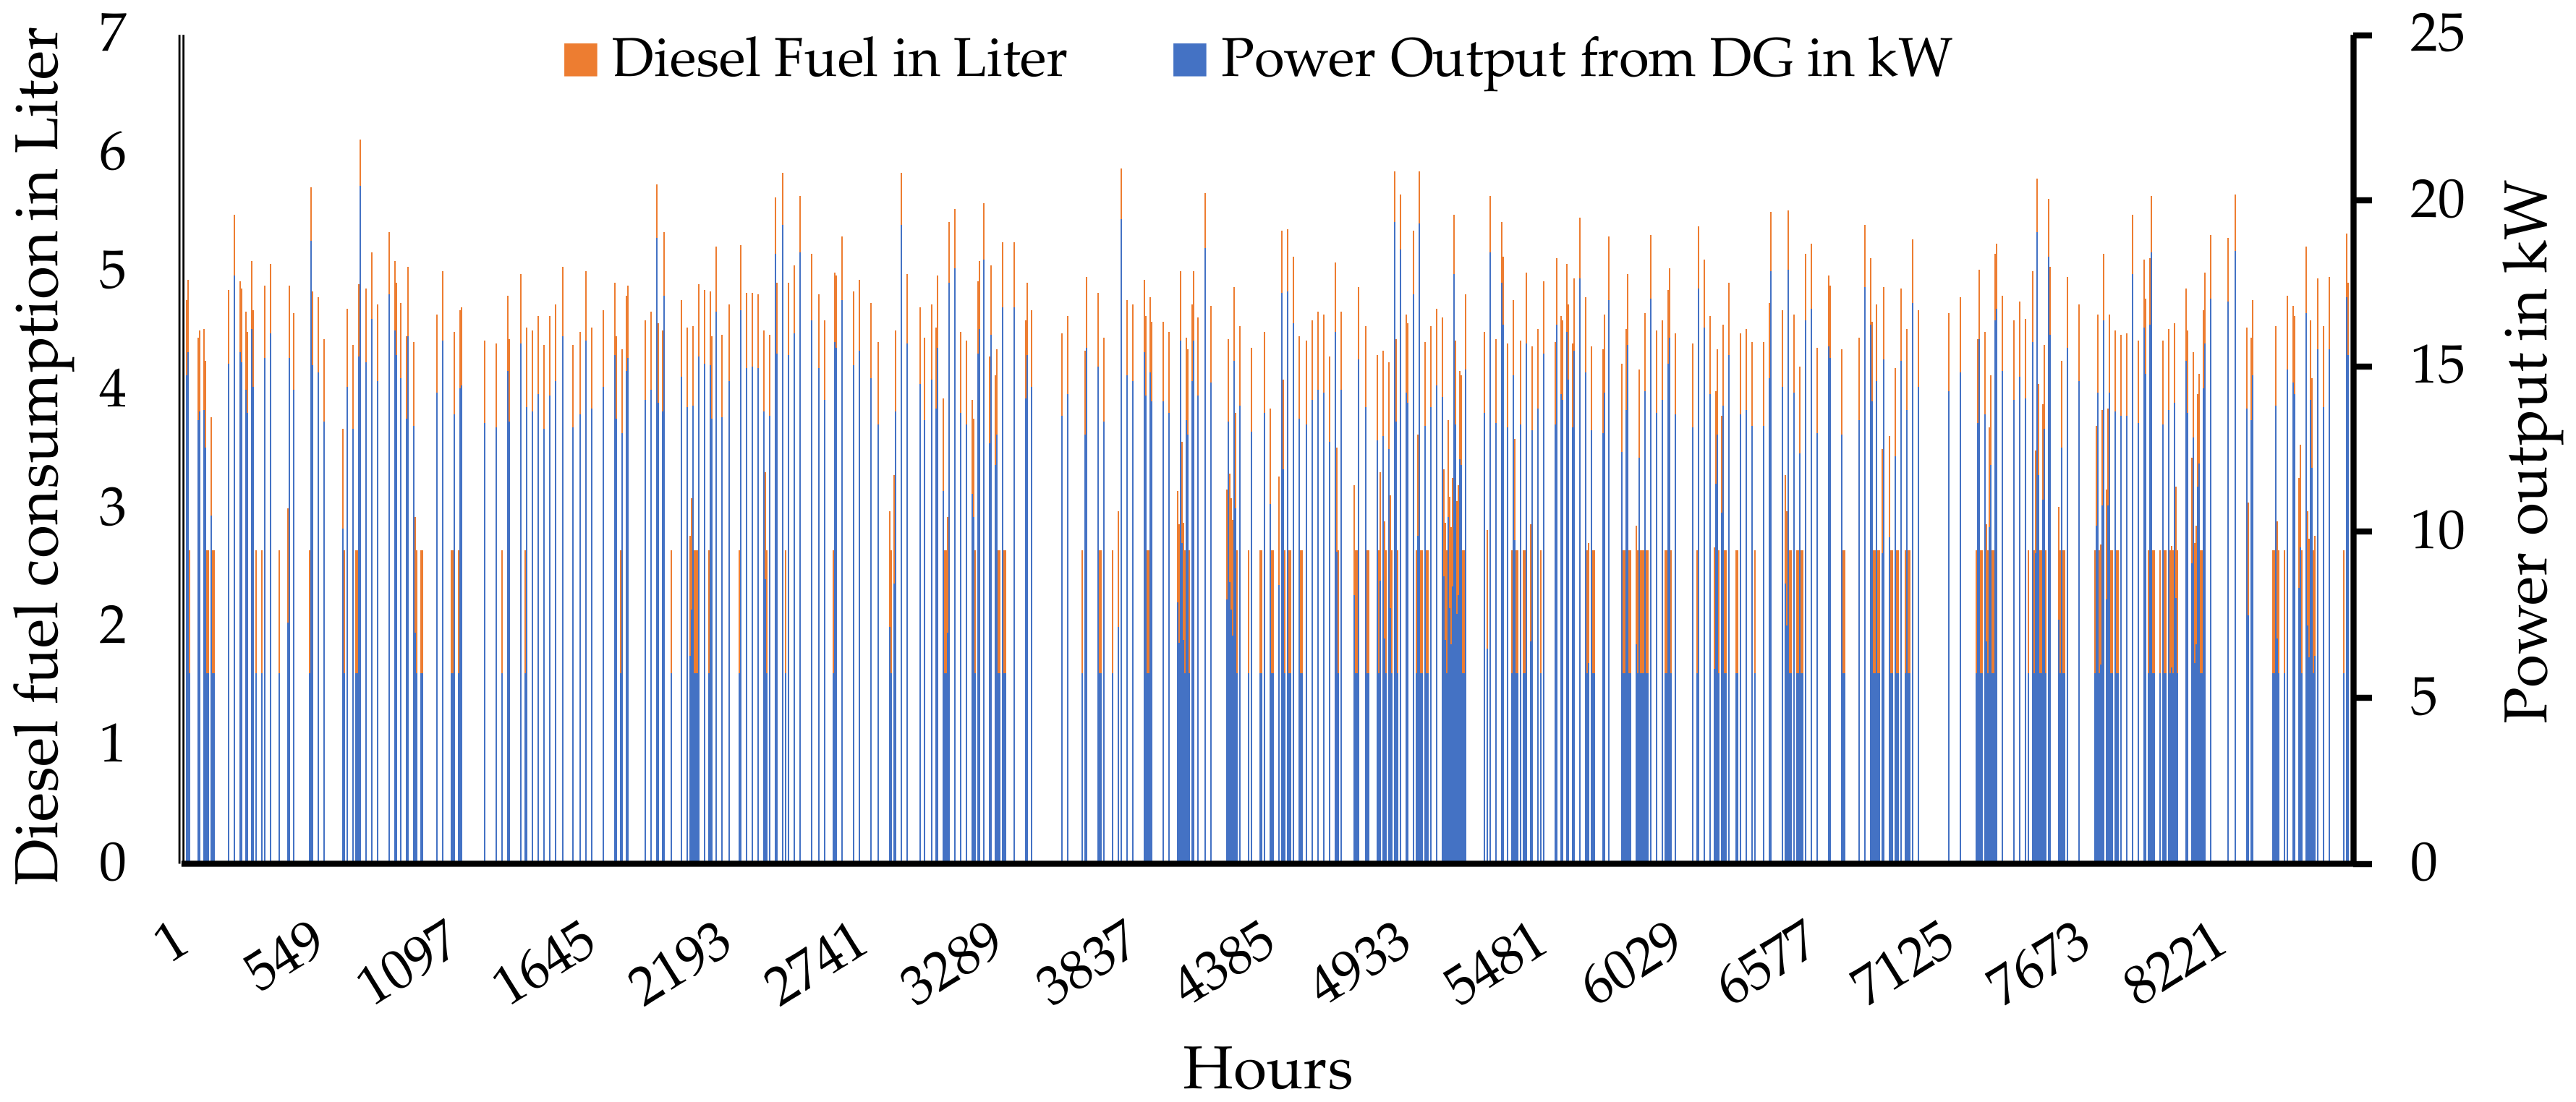
6.4. Performance of PV + DG + BESS HREM Configuration
6.5. HREM Configurations within the Context of the SDG7
7. Conclusions
- A high renewable fraction was ensured, and in addition, the load demand was met continuously.
- Surplus energy from the generation sources was stored in the battery, and that can be used in emergency or deficit situations.
- The proposed LF dispatch strategy ensured effective operation and met the set goals.
- Lower net present cost and cost of electricity were ensured, and this would make the HREM affordable for the community households.
- The obtained HREM configuration was found to be sustainable from the environmental perspective as it produced lower emissions than the other configurations.
- Overall, the proposed HREM configuration was identified to be within the context of the SDG7.
Supplementary Materials
Author Contributions
Conflicts of Interest
References
- Sustainable Development Goal 7 (SDG). Available online: https://sustainabledevelopment.un.org/sdg7 (accessed on 16 February 2020).
- Ajadi, T.; Boyle, R.; Strahan, D.; Kimmel, M.; Collins, B.; Cheung, A.; Becker, L. Global Trends in Renewable Energy Investment 2019; Frankfurt School-UNEP Centre/BNEF: Frankfurt, Germany, 2019; Available online: http://www.fs-unep-centre.org (accessed on 16 February 2020).
- Power Sector at a Glance ALL INDIA, Govt. of India. Available online: https://powermin.nic.in/en/content/power-sector-glance-all-india (accessed on 16 February 2020).
- Singh, R.K. India’s Renewable Energy Capacity Crosses 80GW-Mark. Available online: https://economictimes.indiatimes.com/industry/energy/power/indias-renewable-energy-capacity-crosses-80gw-mark-r-k-singh (accessed on 16 February 2020).
- Kumar, A.; Kumar, N.; Baredar, P.; Shukla, A. A review on biomass energy resources, potential, conversion and policy in India. Renew. Sustain. Energy Rev. 2015, 45, 530–539. [Google Scholar] [CrossRef]
- Sachs, J.; Schmidt-Traub, G.; Kroll, C.; Lafortune, G.; Fuller, G. Sustainable Development Report 2019; Bertelsmann Stiftung and Sustainable Development Solutions Network (SDSN): New York, NY, USA, 2019. [Google Scholar]
- BP Magazine. Available online: https://www.bp.com/en/global/corporate/energy-economics/statistical-review-ofworldenergy/renewable-energy.html (accessed on 27 November 2019).
- Sharma, A.; Chaturvedi, S.; Choudhury, S. India’s Power Network Breaks Down. The Wall Street Journal. 31 July 2012. Available online: https://www.wsj.com/articles/SB10000872396390444405804577560413178678898 (accessed on 16 February 2020).
- Zsiborács, H.; Baranyai, N.H.; Vincze, A.; Zentkó, L.; Birkner, Z.; Máté, K.; Pintér, G. Intermittent renewable energy sources: The role of energy storage in the european power system of 2040. Electronics 2019, 8, 729. [Google Scholar] [CrossRef] [Green Version]
- Chand, A.A.; Prasad, K.A.; Mamun, K.A.; Sharma, K.R.; Chand, K.K. Adoption of Grid-Tie Solar System at Residential Scale. Clean. Technol. 2019, 1, 224–231. [Google Scholar] [CrossRef] [Green Version]
- Lopes, J.P.; Hatziargyriou, N.; Mutale, J.; Djapic, P.; Jenkins, N. Integrating distributed generation into electric power systems: A review of drivers, challenges and opportunities. Electr. Power Syst. Res. 2007, 77, 1189–1203. [Google Scholar] [CrossRef] [Green Version]
- Islam, F.R.; Mamun, K.A. Possibilities and challenges of implementing renewable energy in the light of PESTLE & SWOT analyses for island countries. In Smart Energy Grid Design for Island Countries; Springer: Cham, Switzerland, 2017; pp. 1–19. [Google Scholar]
- Karthik, N.; Parvathy, A.K.; Arul, R. Optimal Operation of Microgrids-A Survey. Int. J. Appl. Power Eng. 2018, 7, 179–185. [Google Scholar]
- Islam, F.R.; Prakash, K.; Mamun, K.A.; Lallu, A.; Pota, H.R. Aromatic network: A novel structure for power distribution system. IEEE Access 2017, 5, 25236–25257. [Google Scholar] [CrossRef]
- Ferraro, M.; Brunaccini, G.; Sergi, F.; Aloisio, D.; Randazzo, N.; Antonucci, V. From Uninterruptible Power Supply to resilient smart micro grid: The case of a battery storage at telecommunication station. J. Energy Storage 2020, 28. [Google Scholar] [CrossRef]
- Sawle, Y.; Gupta, S.C.; Bohre, A.K. Review of hybrid renewable energy systems with comparative analysis of off-grid hybrid system. Renew. Sustain. Energy Rev. 2018, 81, 2217–2235. [Google Scholar] [CrossRef]
- Vishnupriyan, J.; Manoharan, P.S. Optimizing an on-grid hybrid power system in educational institution in Tamil Nadu, India. In Green Buildings and Sustainable Engineering; Springer: Singapore, 2018; pp. 93–103. [Google Scholar]
- Amrollahi, M.H.; Bathaee, S.M.T. Techno-economic optimization of hybrid photovoltaic/wind generation together with energy storage system in a stand-alone micro-grid subjected to demand response. Appl. Energy 2017, 202, 66–77. [Google Scholar] [CrossRef]
- Shafiullah, G.M.; Amanullah, M.T.O.; Ali, A.S.; Jarvis, D.; Wolfs, P. Prospects of renewable energy—A feasibility study in the Australian context. Renew. Energy 2012, 39, 183–197. [Google Scholar] [CrossRef]
- Shoeb, M.; Shafiullah, G.M. Renewable energy integrated islanded microgrid for sustainable irrigation—A Bangladesh perspective. Energies 2018, 11, 1283. [Google Scholar] [CrossRef] [Green Version]
- Akhtari, M.R.; Baneshi, M. Techno-economic assessment and optimization of a hybrid renewable co-supply of electricity, heat and hydrogen system to enhance performance by recovering excess electricity for a large energy consumer. Energy Convers. Manag. 2019, 188, 131–141. [Google Scholar] [CrossRef]
- Ali, I.; Shafiullah, G.M.; Urmee, T. A preliminary feasibility of roof-mounted solar PV systems in the Maldives. Renew. Sustain. Energy Rev. 2018, 18, 18–32. [Google Scholar] [CrossRef]
- Brka, A.; Al-Abdeli, Y.M.; Kothapalli, G. The interplay between renewables penetration, costing and emissions in the sizing of stand-alone hydrogen systems. Int. J. Hydrog. Energy 2015, 40, 125–135. [Google Scholar] [CrossRef]
- Baek, S.; Park, E.; Kim, M.G.; Kwon, S.J.; Kim, K.J.; Ohm, J.Y.; del Pobil, A.P. Optimal renewable power generation systems for Busan metropolitan city in South Korea. Renew. Energy 2016, 88, 517–525. [Google Scholar] [CrossRef]
- Panayiotou, G.; Kalogirou, S.; Tassou, S. Design and simulation of a PV and a PV Wind standalone energy system to power a household application. Renew. Energy 2012, 37, 355–363. [Google Scholar] [CrossRef]
- Gangwar, S.; Bhanja, D.; Biswas, A. Cost, reliability, and sensitivity of a stand-alone hybrid renewable energy system—A case study on a lecture building with low load factor. J. Renew. Sustain. Energy 2015, 7, 013109. [Google Scholar] [CrossRef]
- Islam, A.K.M.S.; Rahman, M.M.; Mondal, M.A.H.; Alam, F. Hybrid energy system for St. Martin Island, Bangladesh: An optimized model. Procedia Eng. 2012, 49, 179–188. [Google Scholar] [CrossRef] [Green Version]
- Colantoni, A.; Allegrini, E.; Boubaker, K.; Longo, L.; Di Giacinto, S.; Biondi, P. New insights for renewable energy hybrid photovoltaic/wind installations in Tunisia through a mathematical model. Energy Convers. Manag. 2013, 75, 398–401. [Google Scholar] [CrossRef]
- Ahmad, J.; Imran, M.; Khalid, A.; Iqbal, W.; Ashraf, S.R.; Adnan, M.; Ali, S.F.; Khokhar, K.S. Techno economic analysis of a wind-photovoltaic-biomass hybrid renewable energy system for rural electrification: A case study of Kallar Kahar. Energy 2018, 148, 208–234. [Google Scholar] [CrossRef]
- Baghdadi, F.; Mohammedi, K.; Diaf, S.; Behar, O. Feasibility study and energy conversion analysis of stand-alone hybrid renewable energy system. Energy Convers. Manag. 2015, 105, 471–479. [Google Scholar] [CrossRef]
- Enevoldsen, P.; Sovacool, B.K. Integrating power systems for remote island energy supply: Lessons from Mykines, Faroe Islands. Renew. Energy 2016, 85, 642–648. [Google Scholar] [CrossRef]
- Sharafi, M.; ELMekkawy, T.Y. Multi-objective optimal design of hybrid renewable energy systems using PSO-simulation based approach. Renew. Energy 2014, 68, 67–79. [Google Scholar]
- Biswas, A.; Kumar, A. Techno-economic optimization of a stand-alone PV/PHS/ Battery systems for very low load situation. Int. J. Renew. Energy Res. (IJRER) 2017, 7, 844–856. [Google Scholar]
- Fazelpour, F.; Soltani, N.; Rosen, M.A. Feasibility of satisfying electrical energy needs with hybrid systems for a medium-size hotel on Kish Island, Iran. Energy 2014, 73, 856–865. [Google Scholar] [CrossRef]
- Bhattacharjee, S.; Acharya, S. PV–wind hybrid power option for a low wind topography. Energy Convers. Manag. 2015, 89, 942–954. [Google Scholar] [CrossRef]
- Türkay, B.E.; Telli, A.Y. Economic analysis of standalone and grid connected hybrid energy systems. Renew. Energy 2011, 36, 1931–1943. [Google Scholar] [CrossRef]
- Thakur, G.; Sharma, K.K.; Kaur, I.; Singh, B. Cost Analysis of Hybrid Power System Design Using Homer; Springer: Singapore, 2018; pp. 247–257. [Google Scholar]
- Nafeh, A.E. Optimal economical sizing of a PV-wind hybrid energy system using genetic algorithm. Int. J. Green Energy 2011, 8, 25–43. [Google Scholar] [CrossRef]
- Li, B.; Roche, R.; Miraoui, A. Microgrid sizing with combined evolutionary algorithm and MILP unit commitment. Appl. Energy 2017, 188, 547–562. [Google Scholar] [CrossRef] [Green Version]
- Abdelhamid, K.; Rachid, I. Techno-economic optimization of hybrid photovoltaic/wind/diesel/battery generation in a stand-alone power system. Sol. Energy 2014, 103, 171–182. [Google Scholar]
- Heydari, A.; Askarzadeh, A. Optimization of a biomass-based photovoltaic power plant for an off-grid application subject to loss of power supply probability concept. Appl. Energy 2016, 165, 601–611. [Google Scholar] [CrossRef]
- Spyrou, I.D.; Anagnostopoulos, J.S. Design study of a stand-alone desalination system powered by renewable energy sources and a pumped storage unit. Desalination 2010, 257, 137–149. [Google Scholar] [CrossRef]
- Zahboune, H.; Zouggar, S.; Krajacic, G.; Varbanov, P.S.; Elhafyani, M.; Ziani, E. Optimal hybrid renewable energy design in autonomous system using Modified Electric System Cascade Analysis and Homer software. Energy Convers. Manag. 2016, 126, 909–922. [Google Scholar] [CrossRef]
- Fazelpour, F.; Soltani, N.; Rosen, M.A. Economic analysis of standalone hybrid energy systems for application in Tehran, Iran. Int. J. Hydrog. Energy 2016, 41, 7732–7743. [Google Scholar] [CrossRef]
- Oyedepo, S.O.; Uwoghiren, T.; Babalola, P.O.; Nwanya, S.C.; Kilanko, O.; Leramo, R.O.; Aworinde, A.K.; Adekeye, T.; Oyebanji, J.A.; Abidakun, O.A. Assessment of Decentralized Electricity Production from Hybrid Renewable Energy Sources for Sustainable Energy Development in Nigeria. Open Eng. 2019, 9, 72–89. [Google Scholar] [CrossRef] [Green Version]
- Al Garni, H.Z.; Awasthi, A.; Ramli, M.A. Optimal design and analysis of grid-connected photovoltaic under different tracking systems using HOMER. Energy Convers. Manag. 2018, 155, 42–57. [Google Scholar] [CrossRef]
- Diemuodeke, E.; Addo, A.; Oko, C.; Mulugetta, Y.; Ojapah, M. Optimal mapping of hybrid renewable energy systems for locations using multi-criteria decision-making algorithm. Renew. Energy 2019, 134, 461–477. [Google Scholar] [CrossRef]
- Radomes, A.A., Jr.; Arango, S. Renewable energy technology diffusion: An analysis of photovoltaic-system support schemes in Medellín, Colombia. J. Clean. Prod. 2015, 92, 152–161. [Google Scholar] [CrossRef]
- Ogunjuyigbe, A.S.; Ayodele, T.R.; Akinola, O.A. Optimal allocation and sizing of PV/ Wind/Split-diesel/Battery hybrid energy system for minimizing life cycle cost, carbon emission and dump energy of remote residential building. Appl. Energy 2016, 171, 153–171. [Google Scholar] [CrossRef]
- Salas, V.; Suponthana, W.; Salas, R.A. Overview of the off-grid photovoltaic diesel batteries systems with AC loads. Appl. Energy 2015, 157, 195–216. [Google Scholar] [CrossRef]
- Shafiullah, G.M. Hybrid renewable energy integration (HREI) system for subtropical climate in Central Queensland, Australia. Renew. Energy 2016, 96, 1034–1053. [Google Scholar] [CrossRef]
- Bhandari, B.; Lee, K.T.; Lee, C.S.; Song, C.K.; Maskey, R.K.; Ahn, S.H. A novel off-grid hybrid power system comprised of solar photovoltaic, wind, and hydro energy sources. Appl. Energy 2014, 133, 236–242. [Google Scholar] [CrossRef]
- Dawood, F.; Shafiullah, G.M.; Anda, M. Stand-alone microgrid with 100% renewable energy: A case study with hybrid solar PV-battery-hydrogen. Sustainability 2020, 12, 2047. [Google Scholar] [CrossRef] [Green Version]
- Abdul-Wahab, S.; Charabi, Y.; Al-Mahruqi, A.M.; Osman, I.; Osman, S. Selection of the best solar photovoltaic (PV) for Oman. Sol. Energy 2019, 188, 1156–1168. [Google Scholar] [CrossRef]
- Shaahid, S.M.; Alhems, L.M.; Rahman, M.K. Techno-economic assessment of establishment of wind farms in different provinces of Saudi Arabia to mitigate future energy challenges. Therm. Sci. 2019, 23, 2909–2918. [Google Scholar] [CrossRef] [Green Version]
- Sami, B.S.; Sihem, N.; Zafar, B.; Adnane, C.; Ahmed, A.E. Performance evaluation of an appraisal autonomous system with hydrogen energy storage devoted for Tunisian remote housing. In Proceedings of the 1st International Conference on Smart Innovation, Ergonomics and Applied Human Factors (SEAHF), Madrid, Spain, 22–24 January 2019; pp. 274–281. [Google Scholar]
- Das, M.; Singh, M.A.K.; Biswas, A. Techno-economic optimization of an off-grid hybrid renewable energy system using metaheuristic optimization approaches–case of a radio transmitter station in India. Energy Convers. Manag. 2019, 185, 339–352. [Google Scholar] [CrossRef]
- Ma, T.; Javed, M.S. Integrated sizing of hybrid PV-wind-battery system for remote island considering the saturation of each renewable energy resource. Energy Convers. Manag. 2019, 182, 178–190. [Google Scholar] [CrossRef]
- Karmaker, A.K.; Hossain, M.A.; Manoj Kumar, N.; Jagadeesan, V.; Jayakumar, A.; Ray, B. Analysis of Using Biogas Resources for Electric Vehicle Charging in Bangladesh: A Techno-Economic-Environmental Perspective. Sustainability 2020, 12, 2579. [Google Scholar] [CrossRef] [Green Version]
- Kumar, N.M.; Vishnupriyan, J.; Sundaramoorthi, P. Techno-economic optimization and real-time comparison of sun tracking photovoltaic system for rural healthcare building. J. Renew. Sustain. Energy 2019, 11, 015301. [Google Scholar] [CrossRef]
- Duffie, J.A.; Beckman, W.A. Design of photovoltaic systems. Sol. Eng. Therm. Process. 1991, 2, 770–781. [Google Scholar]
- Krishan, O.; Suhag, S. Techno-economic analysis of a hybrid renewable energy system for an energy poor rural community. J. Energy Storage 2019, 23, 305–319. [Google Scholar] [CrossRef]
- Krishan, O.; Suhag, S. An updated review of energy storage systems: Classification and applications in distributed generation power systems incorporating renewable energy resources. Int. J. Energy Res. 2018, 43, 6171–6210. [Google Scholar] [CrossRef]
- Adefarati, T.; Bansal, R.C. Reliability, economic and environmental analysis of a microgrid system in the presence of renewable energy resources. Appl. Energy 2019, 236, 1089–1114. [Google Scholar] [CrossRef]
- Ramesh, M.H.; Saini, R.P. Dispatch strategies based performance analysis of a hybrid renewable energy system for a remote rural area in India. J. Clean. Prod. 2020, 259, 120697. [Google Scholar] [CrossRef]
- Fthenakis, V.M.; Kim, H.C.; Alsema, E. Emissions from photovoltaic life cycles. Environ. Sci. Technol. 2008, 42, 2168–2174. [Google Scholar] [CrossRef] [Green Version]
- Thomson, R.C.; Harrison, G.P. Life Cycle Costs and Carbon Emissions of Offshore Wind Power; ClimateXChange: Edinburgh, UK, 2017. [Google Scholar]
- Liu, W.; Sang, J.; Chen, L.; Tian, J.; Zhang, H.; Palma, G.O. Life cycle assessment of lead-acid batteries used in electric bicycles in China. J. Clean. Prod. 2015, 108, 1149–1156. [Google Scholar] [CrossRef]


| Ref. | Descriptions |
|---|---|
| Baghdadi et al. [30] | Optimized a hybrid fossil-power system to ensure higher fuel saving while maximizing renewable electricity. |
| Enevoldsen and Sovacool [31] | An isolated microgrid energy system was designed for Faroe Islands using a storage system to increase its reliability. |
| [32] | Utilized particle swarm optimization-based simulation for HRES. |
| Biswas and Kumar [33] | An HRES was used for designing a PV/pumped hydro energy storage (PHES)/BESS system for an academic building of an engineering institution. |
| Fazelpour et al. [34] | In Kish Island, Iran, a feasibility study was carried out on various hybrid energy systems, including diesel generator, battery, wind system, and PV, to cover the electrical load of a hotel. |
| Bhattacharjee and Acharya [35] | An HRES study was carried out in a northeastern city, Tripura, to show the low wind area for a small-scale educational building. |
| Türkay and Telli [36] | The analysis shows a better performance of grid-connected HRES than that of completely renewable configurations by exploring the grid-connected PV/WT/fuel cell (FC) system. In addition, the impacts of PV and hydrogen systems on the main grid were explored. The average solar radiation intensity and wind energy capacity of Istanbul projected a feasible solution. |
| Thakur et al. [37] | A hydropower project was deemed to be better than wind power in terms of its efficiency and reliability. |
| Nafeh [38] | A feasibility study on a photovoltaic PV/WT hybrid energy home system, incorporating a storage battery, was developed. |
| Li et al. [39] | The size optimization of a micro-grid based on the evolutionary algorithm was accomplished. |
| Abdelhamid and Rachid [40] | Techno-economical optimization was addressed for an isolated system (PV/WT/DG/BESS). |
| Heydari and Askarzadeh [41] | Sizing of an isolated system (PV/WT/DG/BESS) was minimized using a harmony search algorithm. |
| Spyrou and Anagnostopoulos [42] | A standalone HRES comprised of PV/WT/PHES for powering desalination plants was designed using a stochastic evolutionary algorithm, which reduced the actual water transportation cost by a significant amount. |
| Location | Year of the Study | Simulation Platform | Configuration Types | Contributions and Main Ideas | Reference |
|---|---|---|---|---|---|
| Oman | 2019 | HOMER | PV + BESS | Finding a suitable location to install the PV system to replace DG. | Abdul-Wahab et al. [54] |
| Minimize carbon emissions. | |||||
| Lower NPC and COE. | |||||
| Saudi Arabia | 2019 | HOMER | WT + BESS | Design 15 MW wind farms and carry out a techno-economic feasibility study. | Shaahid et al. [55] |
| To see significant COE reduction. | |||||
| Tunisia | 2019 | MATLAB | PV + FC + UC | Improve power security by involving an energy management strategy. | Sami et al. [56] |
| Ensuring energy supply without interruption. | |||||
| Detailed feasibility study and economic analysis of a hybrid energy system. | |||||
| India | 2019 | MATLAB | PV + WT + BESS | Lower COE. | Das et al. [57] |
| China | 2019 | MATLAB | PV + WT + BESS | Mitigating the disharmony between load/generation balance, cost optimization, and saturation. | Ma and Javed [58] |
| Bangladesh | 2020 | HOMER | Biogas + EV | Feasibility study and economic analysis. | Karmaker et al. [59] |
| Lower NPC and COE. |
| Parameters | PV + DG + BESS | PV + WT + DG + BESS | PV + BESS | PV + WT + BESS |
|---|---|---|---|---|
| HREM system architecture | PV—40.3 kW DG—23 kW BESS—181 strings | PV—40.3 kW WT—3 kW (1) DG—23 kW BESS—186 strings | PV—133 kW BESS—324 strings | PV—133 kW WT—3 kW (1) BESS—327 strings |
| Energy production | PV—75,317 kWh/y DG—12,051 kWh/y Total—87,368 kWh/y | PV—75,247 kWh/y WT—176 kWh/y DG—12,015 kWh/y Total—87,438 kWh/y | PV—247,951 kWh/y Total—247,951 kWh/y | PV—247,951 kWh/y WT—176 kWh/y Total—248,127 kWh/y |
| Energy consumption | Primary load—60,386 kWh/y | |||
| Unmet electric load | 0 kWh/y | 0 kWh/y | 37.4 kWh/y | 33.8 kWh/y |
| Capacity shortage | 0 kWh/y | 0 kWh/y | 59.8 kWh/y | 55.8 kWh/y |
| Excess energy | 18,868 kWh/y | 18,976 kWh/y | 177,148 kWh/y | 177,334 kWh/y |
| Renewable fraction | 80% | 80.1% | 100% | 100% |
| Economic Indicators | PV + DG + BESS | PV + WT + DG + BESS | PV + BESS | PV + WT + BESS |
|---|---|---|---|---|
| Cost of electricity ($) | 0.4157 | 0.4382 | 0.6319 | 0.6555 |
| Net present cost ($) | 440,038.84 | 463,824.70 | 668,370.80 | 693,396.90 |
| Annualized cost ($) | 25,105.15 | 26,462.18 | 38,131.97 | 39,559.76 |
| Initial capital cost ($) | 170,919.23 | 190,292.24 | 435,612.61 | 454,552.17 |
| Operating and maintenance cost ($/y) | 53,575.06 | 57,370.08 | 80,067.14 | 83,747.99 |
| Replacement cost ($) | 161,894.52 | 173,999.49 | 192,266.17 | 203,231.30 |
| Fuel cost ($) | 77,382.17 | 76,803.08 | 0.00 | 0.00 |
| Salvage cost ($) | 23,732.13 | 34,640.99 | 39,575.16 | 48,134.51 |
| Emission Parameter | PV + DG + BESS | PV + WT + DG + BESS | PV + BESS | PV + WT + BESS |
|---|---|---|---|---|
| Values (kg/y) | ||||
| CO2 | 11,556 | 11,470 | 0 | 0 |
| CO | 72.8 | 72.3 | 0 | 0 |
| UHC | 3.18 | 3.15 | 0 | 0 |
| PM | 0.441 | 0.438 | 0 | 0 |
| SO2 | 28.3 | 28.1 | 0 | 0 |
| NO2 | 68.4 | 67.9 | 0 | 0 |
| Emission Parameter | PV + DG + BESS | PV + WT + DG + BESS | PV + BESS | PV + WT + BESS |
|---|---|---|---|---|
| Values (kg/Service Life) | ||||
| CO2 | 85,104.31 | 86,661.88 | 1,23,149.31 | 1,24,181.97 |
| CO | 124.63 * | 123.78 * | NA | NA |
| UHC | 5.44 * | 5.39 * | NA | NA |
| PM | 0.75 * | 0.75 * | NA | NA |
| SO2 | 77.47 a | 77.12 a | 94.95 a | 94.95 a |
| NO2 | 132.16 b | 131.29 b | 49.59 b | 49.59 b |
| Criteria and Aim | SDG7 Criteria | Indicator with Units | HREM Configuration | |||
|---|---|---|---|---|---|---|
| PV + DG + BESS | PV + WT + DG + BESS | PV + BESS | PV + WT + BESS | |||
| Criteria | Affordable | Lower NPC ($) | 440,038.84 | 463,824.70 | 668,370.80 | 693,396.90 |
| Lower COE ($/kWh) | 0.4157 | 0.4382 | 0.6319 | 0.6555 | ||
| Lower initial capital cost ($) | 170,919.23 | 190,292.24 | 435,612.61 | 454,552.17 | ||
| Reliable | Continuous power supply (when renewables and BESS fail) | DG helps continuous power supply | DG and BESS helps with continuous power supply | Only BESS has to support the continuous power supply, but if we increase capacity it will add a financial burden to the community | ||
| Excess electricity or buffer for future (kWh/y) | 18,868 | 18,976 | 177,148 | 177,334 | ||
| Minimize the capacity shortage (kWh/y) | 0 | 0 | 59.8 | 55.8 | ||
| Quality of power * | Optimized results suggest the quality of power is ensured in each HREM configuration. | |||||
| Sustainable | Lower emissions per year (kg/y) a | 11,556 | 11,470 | 0 | 0 | |
| Lower emissions per service life (kg/service life) b | 85,104.31 | 86,661.88 | 1,23,149.31 | 1,24,181.97 | ||
| Higher renewable energy fraction (%) | 80 | 80.1 | 100 | 100 | ||
| Modern | MGs b | ✓ | ✓ | ✗ | ✓ | |
| Hybrid power systems b | ✓ | ✓ | ✗ | ✓ | ||
| Community MGs b | ✓ | ✓ | ✗ | ✓ | ||
| Aim | Energy access | Unmet electricity (kWh/y) | 0 | 0 | 37.4 | 33.8 |
© 2020 by the authors. Licensee MDPI, Basel, Switzerland. This article is an open access article distributed under the terms and conditions of the Creative Commons Attribution (CC BY) license (http://creativecommons.org/licenses/by/4.0/).
Share and Cite
Kumar, N.M.; Chopra, S.S.; Chand, A.A.; Elavarasan, R.M.; Shafiullah, G.M. Hybrid Renewable Energy Microgrid for a Residential Community: A Techno-Economic and Environmental Perspective in the Context of the SDG7. Sustainability 2020, 12, 3944. https://0-doi-org.brum.beds.ac.uk/10.3390/su12103944
Kumar NM, Chopra SS, Chand AA, Elavarasan RM, Shafiullah GM. Hybrid Renewable Energy Microgrid for a Residential Community: A Techno-Economic and Environmental Perspective in the Context of the SDG7. Sustainability. 2020; 12(10):3944. https://0-doi-org.brum.beds.ac.uk/10.3390/su12103944
Chicago/Turabian StyleKumar, Nallapaneni Manoj, Shauhrat S. Chopra, Aneesh A. Chand, Rajvikram Madurai Elavarasan, and G.M. Shafiullah. 2020. "Hybrid Renewable Energy Microgrid for a Residential Community: A Techno-Economic and Environmental Perspective in the Context of the SDG7" Sustainability 12, no. 10: 3944. https://0-doi-org.brum.beds.ac.uk/10.3390/su12103944