Exploring the Relationships between the Topological Characteristics of Subway Networks and Service Disruption Impact


1
School of Economics and Management, University of Science and Technology Beijing, Beijing 100083, China
2
Information Systems Engineering Laboratory, National University of Defense Technology, Changsha 410073, China
3
Department of Building and Real Estate, The Hong Kong Polytechnic University, Hong Kong, China
*
Authors to whom correspondence should be addressed.
Sustainability 2020, 12(10), 3960; https://0-doi-org.brum.beds.ac.uk/10.3390/su12103960
Submission received: 17 March 2020
/
Revised: 30 April 2020
/
Accepted: 7 May 2020
/
Published: 12 May 2020
(This article belongs to the Collection Sustainable Rail and Metro Systems)
Abstract
:Although numerous studies have considered the topological characteristics and the impact of disruptions in subway systems, their results have not been verified by empirical data. To address this limitation, we used a data set containing 392 detailed records of disruptions to subway services in Beijing from 2011 to 2017. The Spearman rank correlation coefficient analysis results indicate that the delay duration exhibits no significant relationship with the topological characteristics, whereas the reverse is true for the relationship between the number of affected trains and the topological characteristics. The results also demonstrate that subway network expansion will not result in a paradox between convenience and vulnerability from an actual data perspective. Moreover, contrary to previous research results, no significant relationship was found to exist between service interruption impact and the transit and key bridge stations. However, a high degree of clustering, characterized by redundant tracks between neighbours, tends to provide protection against service disruption for stations. In terms of the spatial variation, the influence of the disruption is greater when the station is further from the centre of the line. These results can support sustainable design in subway network planning.
1. Introduction
As a safer, greener, faster, and more punctual tool, subways have become a widely accepted means of public travel [1]. In this paper, a “subway” refers to urban rail transit that has exclusive right of way—whether on the ground, underground, or elevated—as defined in [2]. In the urban and suburban areas of Beijing, tens of millions passengers were transported by subway every day in 2018 [3]. The Beijing subway has been continually expanding its network by investing in new stations and lines. During the study period, there were a total of 14 operation lines, 174 stations, and 370 sections in 2011. At the end of 2017, there were 20 operation lines, 291 stations, and 658 sections in total. Moreover, the passenger traffic increased from 2.193 billion in 2011 to 3.778 billion in 2017 [3].
The rapid expansion of the network scale and rapid increase in passenger flow have brought a series of challenges to efficient subway operation. To minimize costs, subway systems are often designed to operate at short intervals and to carry passengers close to maximum capacity of trains [4] with little redundancy. This renders them sensitive to various disruptions [1]. Owing to the typical complexity of a subway network, when a disruption occurs at one station, it can easily cause knock-on delays [4,5] at other related stations. Knock-on delay here refers to that if a train breaks down, this will cause late on subsequent trains as defined in reference [4]. The dependent subway system will fail or function at a low-level service [4]. In the first half of 2019, a total of 709 disturbance cases occurred. There were 1622 trains that were at least 2 min late, as reported by the Beijing Metro network control centre, Beijing Municipal Commission of Transport, in 2019. The same problems have been reported in other international cities; for example, in Japan, where the number of subway accidents in Tokyo, along with the impact of these disruptions on society, has been increasing [6].
It is questionable whether passengers should suffer from the negative impacts of disruptions while enjoying the high-level commuter services provided by subways. System theory asserts that the function of a networked system is determined by the system structure [7]. It is challenging to determine an appropriate optimization strategy which reduces the negative impacts of disruption in a subway network. This is partly owing to the lack of an effective understanding of the influence of the network topological attributes on the performance of networked transport systems. Although numerous studies have suggested that the topological characteristics, such as the degree, betweenness, and clustering, of stations play an important role in serviceability under disruptions [8,9], their results have not been verified by empirical data. To fill this research gap, this study aims to explore the associations between the topological characteristics and disruption impact in a subway network using service disruption data.
It is often perceived that the topological characteristics of a subway system significantly affect its resilience under service disruptions [8]. However, perception may not always be the reality. Clarifying these issues is crucial for at least two reasons: Firstly, it is helpful to improve the serviceability management level of transportation agencies, in order to improve understanding of the impact of the network structure on system performance. Secondly, the research results may enable traffic planners to gain an improved understanding of the different topological structures characteristics of service reliability. These will subsequently facilitate the development of network strategies to improve transport services and further enhance system resilience. To the best of our knowledge, this study is the first of its kind to provide an analysis, using empirical evidence, in order to demonstrate the correlation between the topological characteristics and extent of damage in a subway network. The remainder of this paper is organized as follows: In Section 2, a literature review of the impact of topological characteristics on disruption in general is presented and the drawbacks of the current research are discussed. The methods employed in the analysis are presented in Section 3. In Section 4, the Beijing subway is taken as a case study. A complete description of the data, including the service disruption data set (recorded from 2011 to 2017) and the network structure, which represents the underlying space in which these disruptions occurred, is presented. In Section 5, the results of the correlation and regression analyses between the topological characteristics and service disruption impacts are presented and discussed. The conclusions, along with the implications of our findings and directions for further research, are outlined in Section 6.
2. Literature Review
In recent years, an increasing number of researchers have used scientific network indicators to test the serviceability of subway networks [7,10,11]. The impacts of disruption on the serviceability of subway networks are often quantified by graph theory and complex network indicators, such as a decrease in the operational efficiency of the subway network following failure of a station or section [7]. In studies relating to transport and territory, the impact is generally measured in terms of accessibility or serviceability indicators, such as the proportion of delayed passengers [12], the proportion of cut-off passengers [12,13], or the time loss when passengers select alternative routes that are not optimal [13].
Disruption has been simulated by complete closure of a station or track section [13] which is passed by several lines with a high degree (an indicator used to measure the number of times a station is passed by subway lines) [14], high betweenness (an indicator used to measure the role that a station or section plays as a key bridge in all shortest paths in a network) [12], high closeness (an indicator used to measure how easily a station is reached from other stations) [15], and high clustering (characterized by redundant tracks between neighbours) [9]. Stations passing by more than three lines have been proven to be not as vulnerable to targeted attacks [14]. This finding contradicted the results of [9], who demonstrated that stations with high degree and high closeness tend to exhibit increased vulnerability. Moreover, stations with high betweenness were found to tend to reduce the impact of service disruption [9]. However, it has been proven that stations with higher betweenness and degree are more vulnerable to disruptions [14]. Stations with high clustering tend to provide higher levels of protection against disruptions [9]. Furthermore, the addition of edges to a network can improve network resilience [2]. Links on the branch, which exhibit limited redundancy, have been proved to be particularly vulnerable to disruptions [16]. In contrast, stations in the central parts of the network exhibit lower vulnerability to disruptions.
According to the overall characteristics of network structure, the mass rapid transport (MRT) network has been proven to be a highly efficient transportation system on a global scale; however, it is not fault-tolerant [17]. Moreover, it has been found that subway networks provide robustness against random attacks and are more vulnerable to targeted attacks [18]. When a subway network is more heterogeneous, it is more vulnerable to targeted attacks [7]. With increasing network size, a subway network tends to become more clustered while the scaling factor settles at a relatively high value [10]. A high cluster coefficient and low scale factor are preferable for subway network robustness. The robustness in the case of disturbance becomes stronger with the network complexity [12,14]. Likewise, the resilience quantified by the connectivity decreases with an increase in the network span, but increases with the degree of stations [8].
Based on the above literature review, it can be concluded that the existing findings are inconsistent. These studies were conducted using failure scenarios and numerical simulations, and the multi-platform characteristics of the transfer stations were always overlooked. Furthermore, these findings have not been verified using empirical data. The majority of empirical investigations into the impact analysis under service disruptions within a transportation context has paid little attention to subways [19]. From an empirical perspective, only the relationship between the transfer station and delay duration has been analysed [19]. These authors found, by utilizing accelerated failure time hazard models, that the delay duration was shorter at transfer stations than at non-transfer stations. Although several researchers have focused on service disruption from an empirical analysis perspective [20,21,22,23], they have not paid attention to the influence of the topological characteristics and the impact of transit service disruptions. Moreover, the delay duration has been widely used as a quantification tool for the resilience of subway systems under disruption. However, certain disruptions, such as train malfunctions, have resulted in the complete closure of stations, although the duration is short. Moreover, in some cases (e.g., track failure), although the duration is long, the result is lower train speeds in the segment. The results of a train cancellation are generally larger than that when there is no train cancellation [22]. Therefore, the delay duration is not an effective indicator to reflect the impact of disruption on transport services.
It can be observed, from the literature review, that the existing studies on public transport disruption are far from sufficient, in terms of considering topological factors from an empirical perspective. Therefore, the aim of this study is to verify the relationship between the topological factors and the impacts of transit service disruption in subway systems on the empirical level.
3. Methods
In order to verify the relationship between topological characteristics and disturbance effects from an empirical perspective, we selected station and network topological characteristics, which have been discussed and analysed in most previous studies. Station topological characteristics are the station degree, clustering, betweenness, and distance from the centre of the line. From the perspective of the whole network, relevant indices to measure the scale-free and small-world [24] characteristics of the subway network are scaling factor, clustering of the network, and average minimum path length. In this section, the concepts and the measures that can be used to describe these station and subway network topologies are reviewed. Thereafter, the algorithm is formalized based on these definitions.
3.1. The Degree of a Station
The degree of a station is an indicator which describes the connectivity of a station within a subway network in L-space. The node degree is defined according to Formula (1), which represents the number of neighbours that a node has; that is, the higher the degree of the node, the more connected it is and the more importance it has in the network [7]. The same applies to a subway network:
where is the degree of station and corresponds to the tracks connected to the station. These tracks take a value of one if station has a track leading in or out. If the degree of a station is greater than four, two or more subway lines pass through the station and it is considered a transfer station. Most stations with a degree of four or less pass only one line, and are referred to as non-transfer stations; in rare cases, if a station is the original and destination stop of two non-circular lines, it is also a transfer station, even though the degree of the station is equal to four.
3.2. The Scaling Factor of a Subway Network
The scaling factor of a subway network is an important indicator for scale-free networks. It is used to describe the heterogeneity of the station degree distribution in the subway network [18,25]. The degree distribution of a subway network following the drift power law distribution [26] is given by:
where is the proportion of stations with degree in the network and is the scaling factor of the network, which has a negative value; the smaller its absolute value is, the lower the degree of heterogeneity of the network and more transfer stations exist in the network.
3.3. The Clustering of a Station and Subway Network
Clustering of stations is an indicator which measures the degree of stations clustered together in a network. In the other words, the station which has higher clustering means that its neighbour stations can be easily arrived each other because of redundant tracks among neighbourhoods. The clustering degree is based on triples of stations [27]. Therefore, a triangle graph includes three closed triplets, with one centred on each node [24]. In an L-space subway network, if there are no direct tracks between any two stations on the same line, but these can be reached without transfer, this type of station has been defined as an indirect neighbour in [28]. Therefore, the calculation of the clustering of a station needs to reflect the variance between the direct and indirect neighbours between two stations in the network:
where describes the path that station passes through, the number of track segments connecting any two stations is denoted by , , is the number of all neighbouring stations of station and the number of stations on line corresponds to . For detailed explanations and physical meanings of the transformed clustering, please refer to [28].
The clustering of a subway network is a common property describing the small-world characteristics of the network [24]. It is the average of all individual . It has been proven that, in a subway network, the clustering is typically much larger than in a comparable random network:
where C is the clustering of the whole network (the value of C is between zero to one, the higher the tighter) and N is the total number of stations in the subway network.
3.4. The Betweenness of a Station
The betweenness of a station is considered as a means of detecting the amount of influence that the station has in a subway network. It is often used to determine nodes or edges that serve as a bridge from one part of a graph to another [28]. The betweenness of a station is calculated by the proportion of the number of shortest paths passing through that station of all of the shortest paths between all origin–destination pairs in the network [12,29]:
where is the betweenness of station i, is the total number of shortest paths between stations and in the network, and is used to describe the number of shortest paths between station and that pass through station . The shortest path in this study is considered with respect to the number of edges passengers have to traverse to get from one station to another [7]. The distance between stations and is the number of track segments in any route.
3.5. The Distance from the Centre of the Line
The distance from the centre of the line is defined as the number of track segments between a given station and the line central station, as proposed in [29]. For example, a distance of zero means that the line central station corresponds to the station under consideration, while a distance of 12 means that there are 12 track segments from the considered station to the line central station.
4. Case Study
Two types of data were used in the study: data of the transit service disruptions occurring in the Beijing subway from 2011 to 2017, and data of the evolution of the Beijing subway network from 2011 to 2017.
4.1. Beijing MRT Service Disruption Data
A total of 392 subway transit service disruptions, recorded by the Department of Safety Supervision of Beijing Subway Limited during the years 2011 to 2017, were used. The delay durations, which are also referred to as the disruption duration, of all the incidents were more than 5 min from occurrence to the resumption of normal operation. Subway service disruptions, such as lower speed of trains in the track segment or longer dwelling times at stations during peak hours, and large disruptions, such as incomplete or complete closure of a track segment, were all considered as disruptions in this research. Each disruption case was composed of an incident date and location, as well as a description of the incident process (from occurrence to normal service). The number of trains cancelled, the number of trains running late, the number of trains turning back to the depot empty, cause, disruption disposal measures, and the time at which normal operation was reinstated were described in the incident process. Normal operation means that all disruptions were cleared up, but not all services ran according to schedule again. Five examples of the total of 392 disruption records are listed in Table 1.
Disruption disposal measures vary, according to the cause [19]. For example, for train malfunctions, such as a stuck door, malfunctioning brakes, or traction faults, the driver is first asked to perform a recovery operation. If the function cannot be restored, the train is requested to be removed from service and to return to the depot empty. In this case, the following trains may be able to arrive on time or slightly late. If the train cannot move by itself, another train nearby will be requested to perform the rescue operation. When the rescue train arrives at the disruption location, it pulls the faulty train to the nearest station to clear the passengers, and then returns to the depot. In this case, prior to the arrival of the rescue train, the following trains must stop to wait for the front tracks to be cleared and service on the line is temporarily suspended. When the faulty train returns to the depot, the line service returns to normal, which means that several trains may be late; the accumulation of delays may result in the cancellation of numerous trains. For signal failure, such as shaft-counting faults in the station and turnout malfunctions, the train’s movement is requested to follow telephone blocking instead of automatic signals, at a lower speed. Certain disruptions may last for a long time, such as the power failure in 2014 that lasted for 116 min, although only eight trains were affected (Case No. 3). However, although the disruption duration may be very short, the consequences may have long-reaching effects, such as the train failure in 2011 that lasted for 11 min, but which ultimately caused the cancellation of nine trains and 47 trains delayed more than 5 min (Case No. 1).
Based on the above description of the disposal measures for disruptions, the service disruption duration (also referred to as the delay duration) cannot reflect the actual negative effect on the transport service. It is largely dependent on ability of operators, disposal regulations, types of disruptions, and so on. However, delayed and cancelled trains—defined as the number of affected trains in this study—have a serious negative impact on passenger travel. Our aim is to compare the delay duration and the number of affected trains, which have relationship with topological characteristic. Accordingly, our chosen response variables are the delay duration and number of affected trains.
4.2. Beijing Subway Network Structure
The Beijing subway network structure, which is no exception to service disruptions, was expanded with new lines and stations every year during the study period from 2011 to 2017. These changes in the network structure affected the station network characteristics. Therefore, according to the time when the new stations and lines of the Beijing subway were placed into operation and the time when the disruptions occurred at the stations, a total of seven subway network structures were established from 2011 to 2017. The suspended relationship between stations under disturbance cannot be reflected by C-space or R-space [30]. Therefore, the subway network map was established and analysed based on L-space, with reference to [30]. A straightforward representation of a subway network in the form of a graph indicates every station as a node, while each edge corresponds to a track between two stations [2].
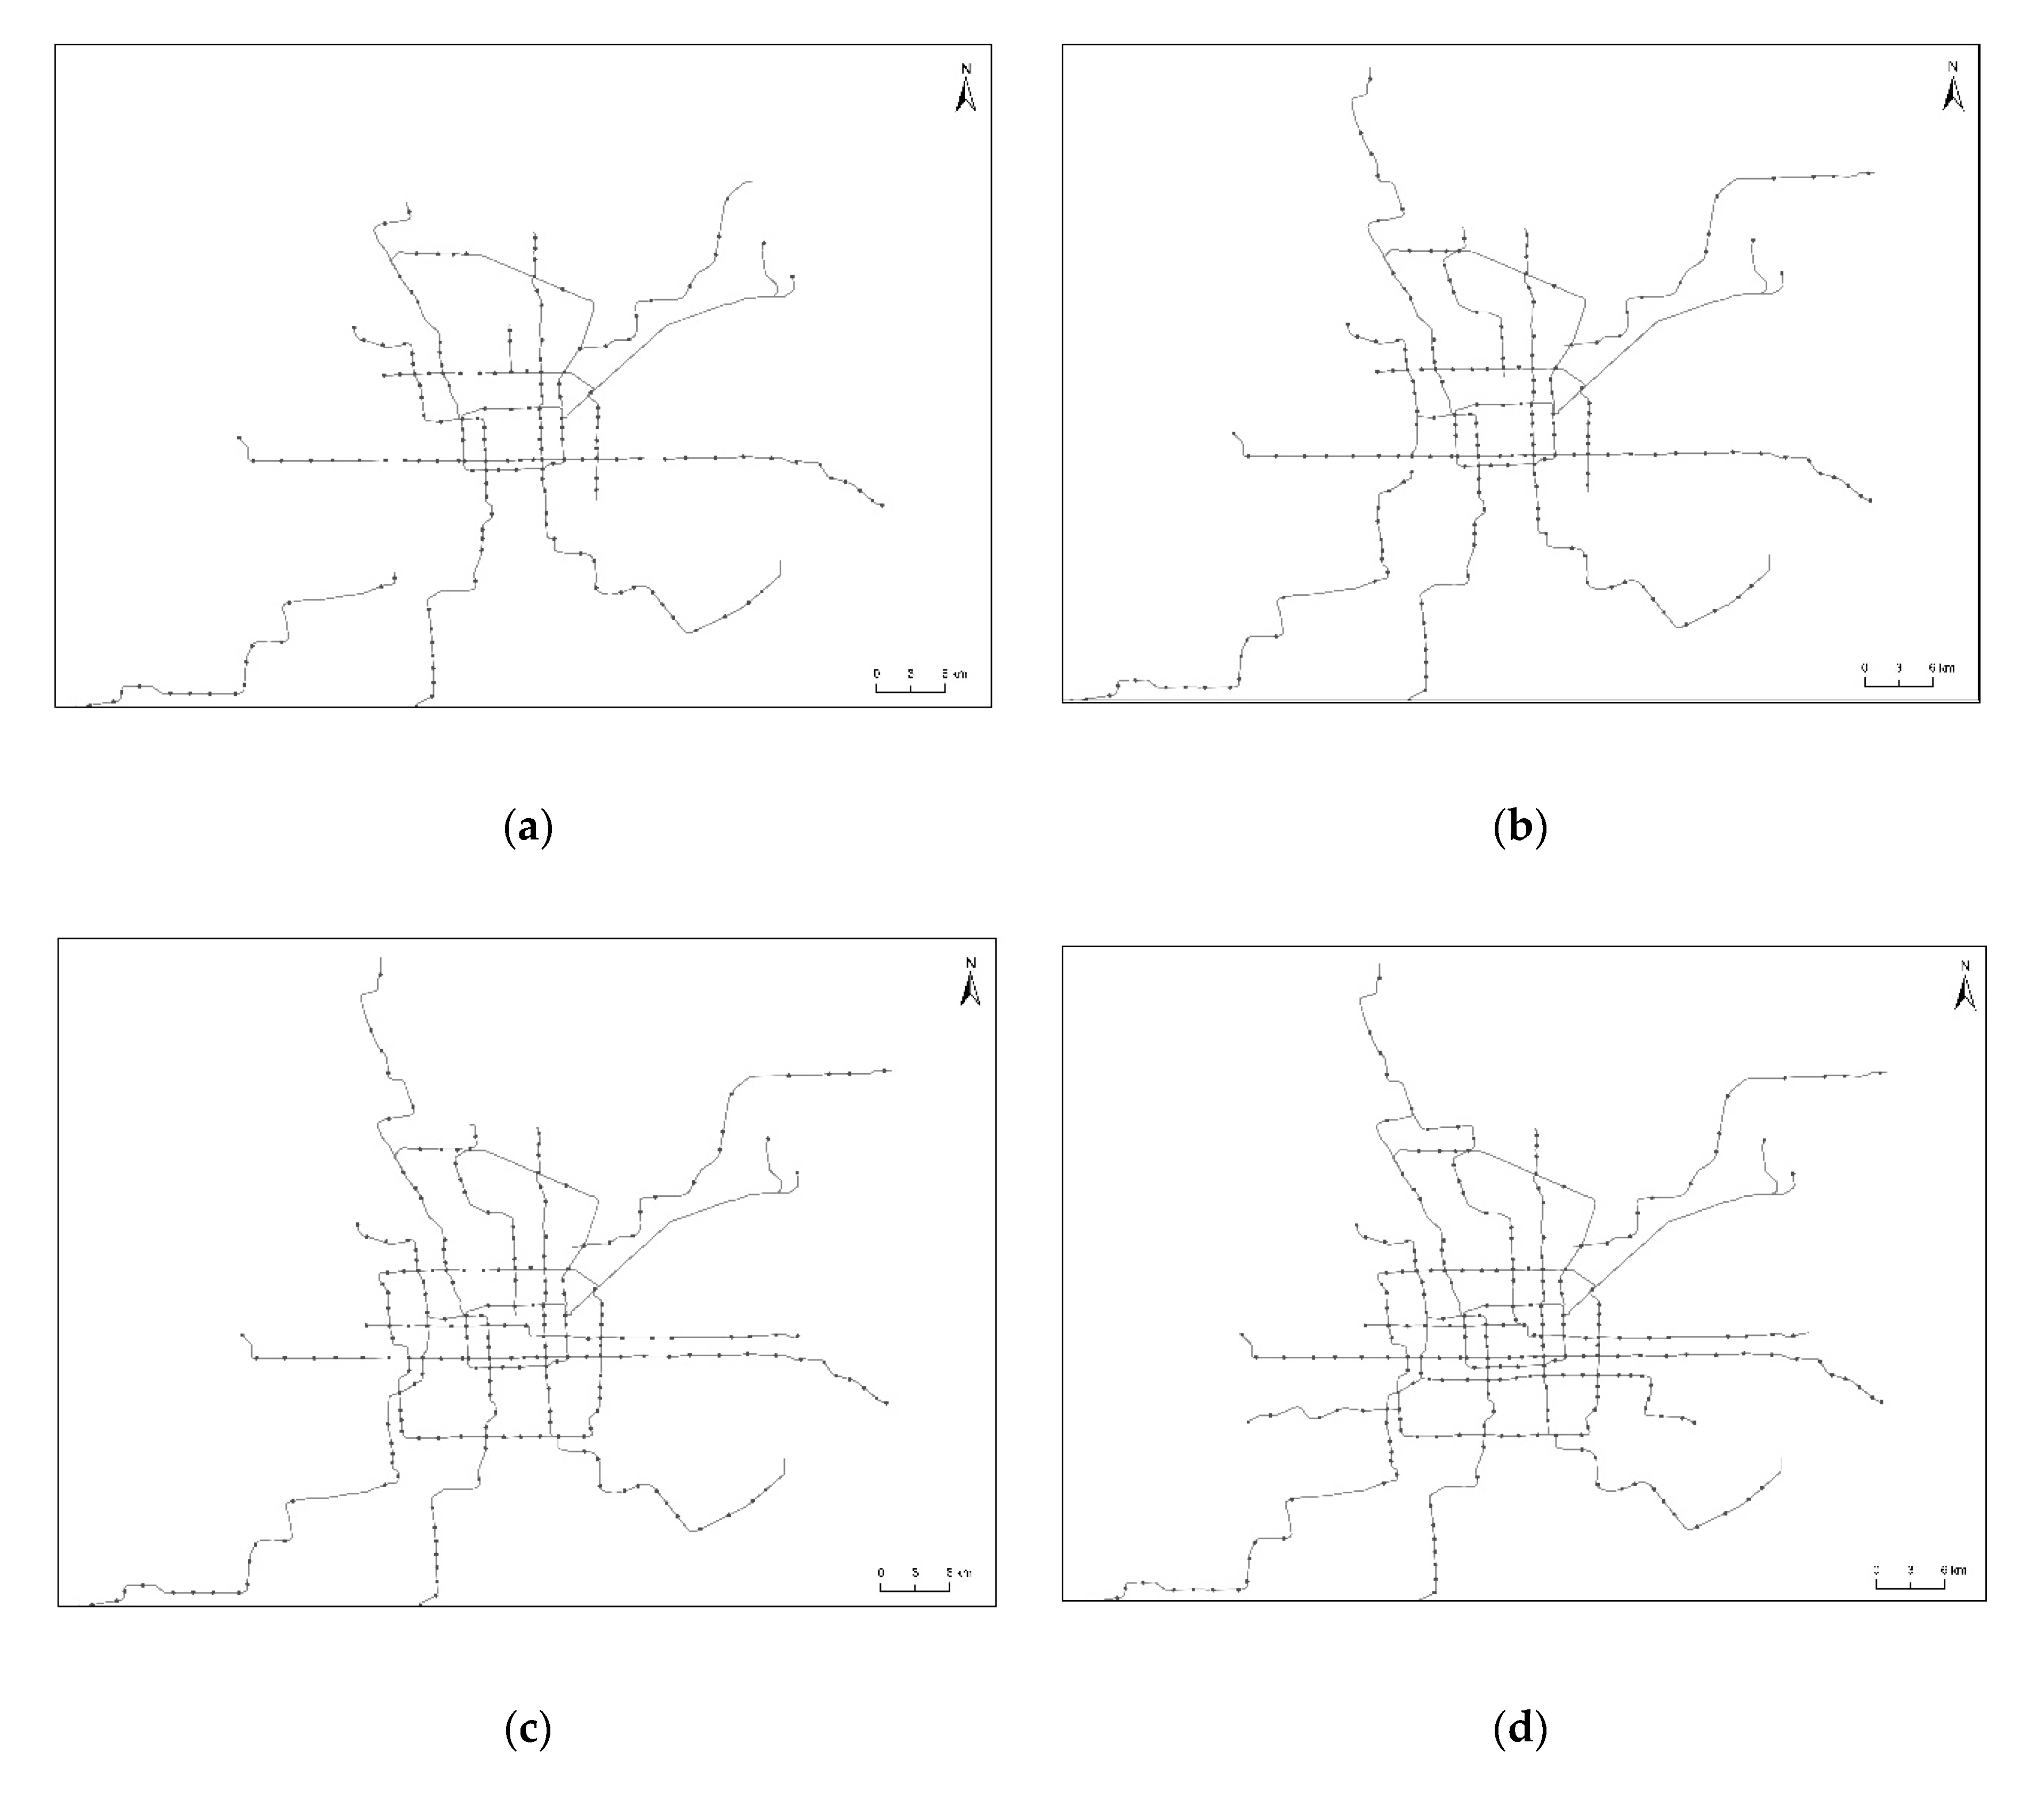
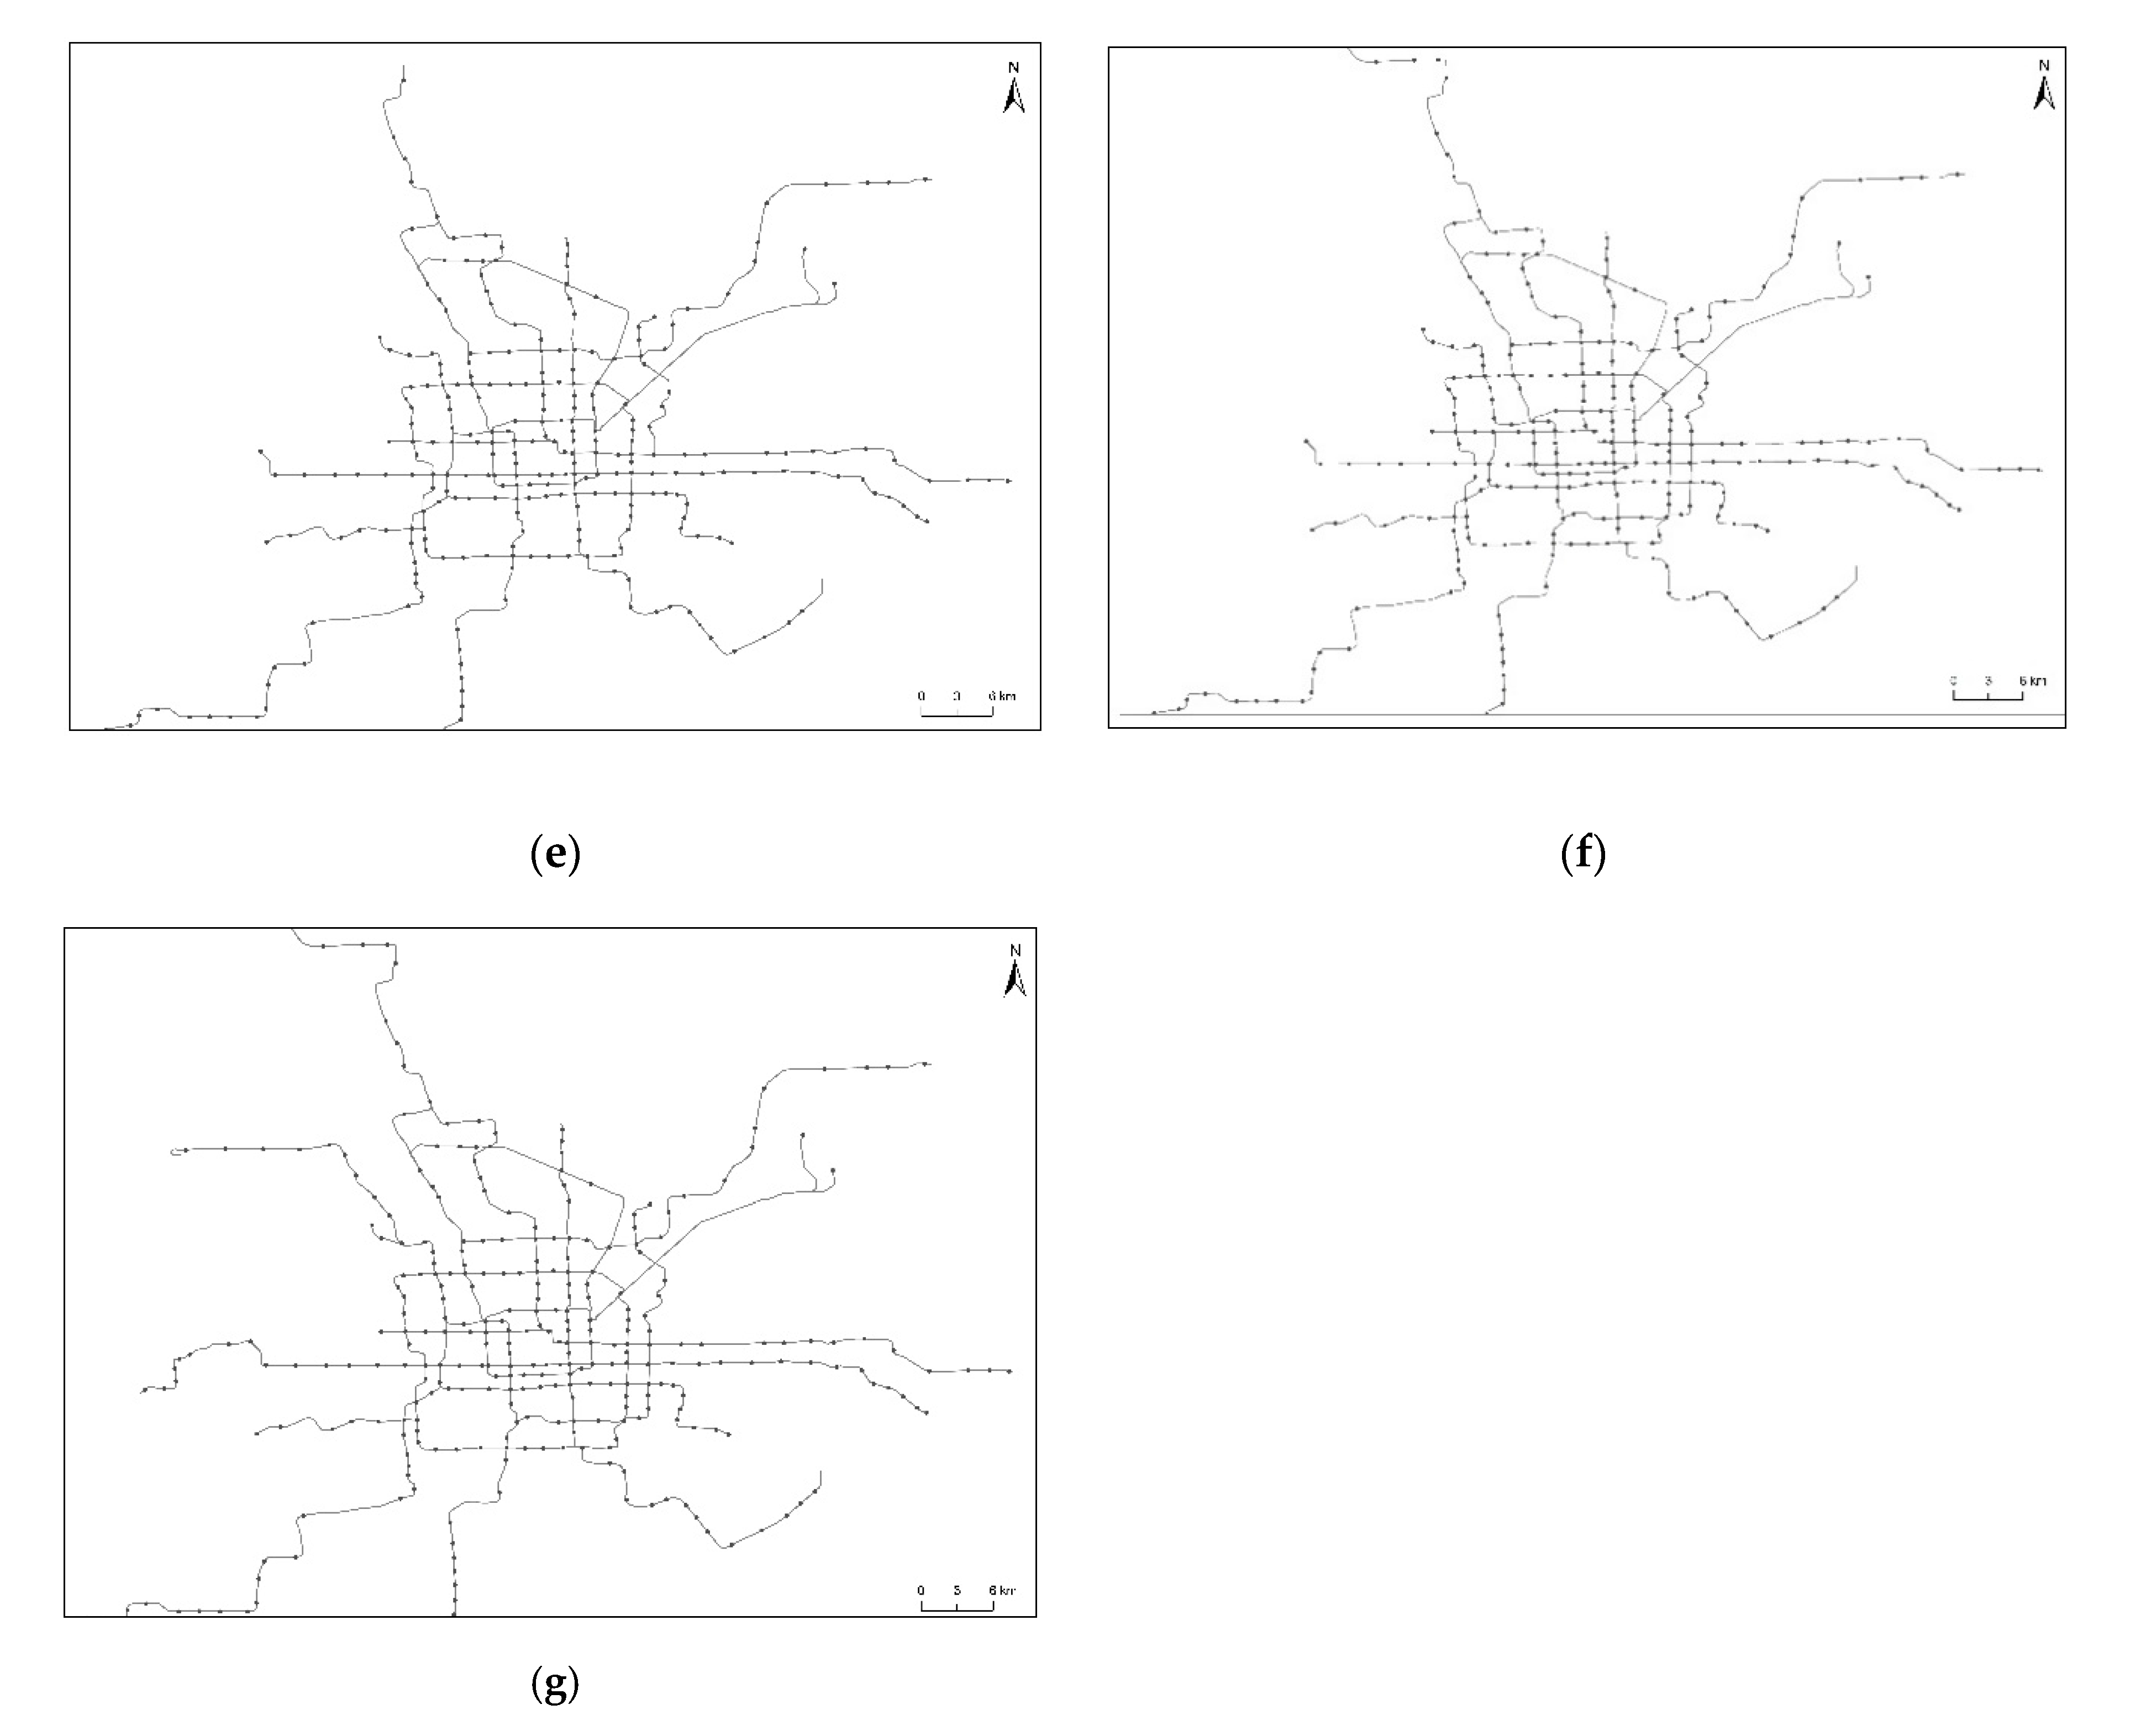
In 2011, the network was composed of 14 lines, 174 stations, and 370 tracks (two shared tracks); in 2017, the network consisted of 20 lines, 291 stations, and 658 tracks. The expansion of the Beijing subway network structure is illustrated in Figure 1.
Although the network expansion significantly improved the accessibility of subway stations to passengers, owing to the increasingly accessible routes (all connected station pairs within the network were increased from 24,644 in 2011 to 84,390 in 2017), the length of the shortest path also increased, regardless of whether this calculation was based on the number of transfers or number of stations passed. The overall evolution characteristics of the Beijing subway network structure from 2011 to 2017 are summarized in Table 2.
Table 3 summarizes four independent variables regarding the complexity characteristics of the subway stations and two dependent variables regarding the impacts of service disruption based on the above definitions. As the calculations of the station degree, betweenness, and clustering differ from the calculation of nodes in social networks, popular complex network analysis software (e.g., Pajeck or Ucinet) could not be used in this study. Therefore, calculation of the four topological characteristics of stations was conducted using the subway simulation analysis system known as Urban-metro-cas (Patent no. CN108897920-A), which was developed in [31].
4.3. Descriptive Statistics of Data
In this study, there were only seven subway networks. Consequently, the scaling factor, clustering, average minimum path length, and average minimum transfer describing the characteristics of the whole network had only seven values, which are listed in Table 4. Their descriptive statistics, with the exception of four indicators which describe the overall subway network, are also presented.
This analysis is of interest for verifying the hypothesis that the complexity characteristics of the subway network and the topological characteristics of the subway stations interact to affect number of affected trains and delay duration. The Pearson correlation coefficient is used to quantify the relationship level between linearly related variables [32]. Therefore, the variables should be normally distributed for the Pearson correlation coefficient analysis. The results of the normality test for our data are presented in Table 5. It can be observed that neither the four independent variables nor the two dependent variables were normally distributed. The data required for the Spearman rank correlation coefficient analysis is not as strict as that of the Pearson correlation coefficient [33]. The Spearman rank correlation coefficient can be used for correlation analysis, regardless of the shape, sample size, or overall distribution of the two variables, provided that the observed values of the two variables are paired rank data or continuous variable observation data for the level of information [34]. Therefore, the Spearman rank correlation coefficient was used for the correlation analysis in this study. Variable rank was used, instead of the value itself, which is its position in ascending or descending order of the value.
5. Results
5.1. Subsection Effects of Complexity of Beijing Subway Network on Disruption Impact
The complex characteristics changed with the evolution of the Beijing subway network from 2011 to 2017. According to Table 6, with increasing network size, the scaling factor of the Beijing subway network tended to settle to a relatively high value. However, it became less clustered as the clustering decreased, and both the average minimum distance and average minimum transfer increased. According to the observation, the average disruption impact, in terms of both the number of affected trains and delay duration, exhibited no obvious patterns.
A bivariate correlation analysis was conducted using the Spearman correlation coefficients to explore the depth of relationships between the holistic topological characteristics of subway network and the impact. As the intervals of trains during rush and non-rush hours are different, bivariate correlation analyses were conducted respectively for rush and non-rush hours. The correlation relationship results are presented in Table 7. Although the independent variables had high correlation with each other, the Spearman correlation coefficient test was carried out between any pair of variables. Therefore, the test results were not affected by multicollinearity. In addition, the purpose of this table is to understand whether there was any correlation between the topological characteristics of the holistic network and the average disruption impact on the network. From Table 7, we can see which variable was related with the disruption impact from a holistic perspective.
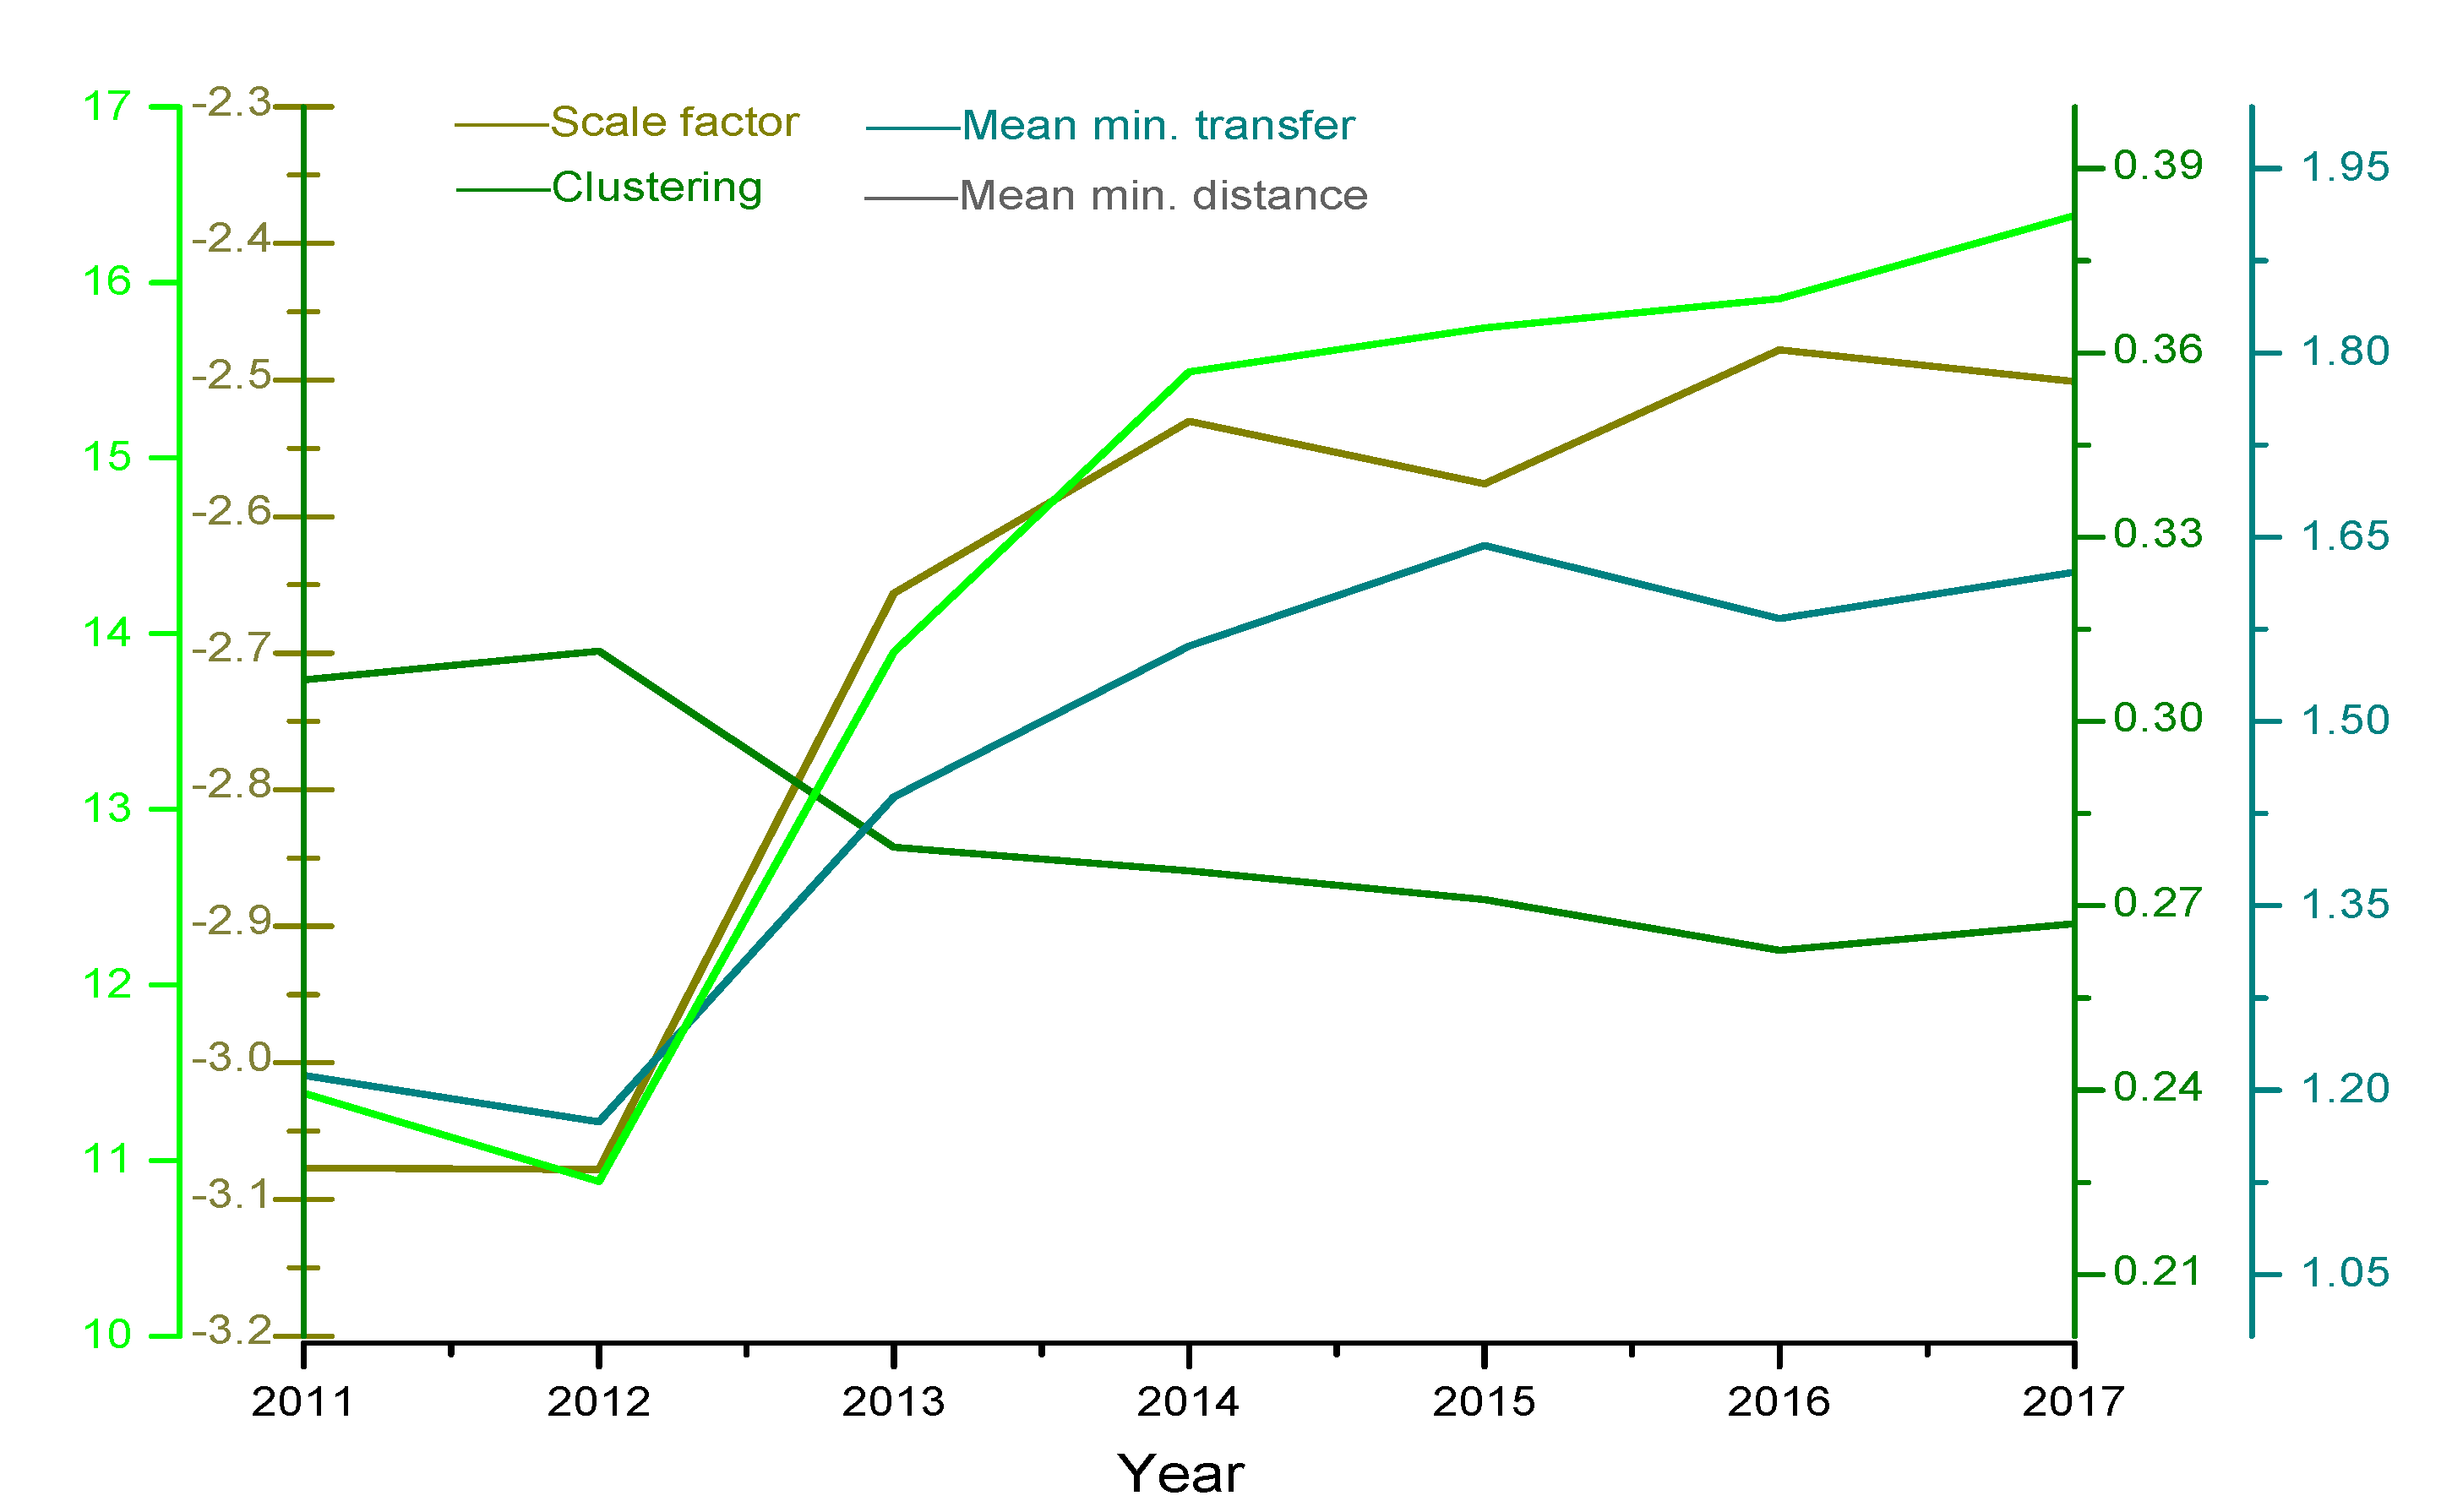
On one hand, the scale-free characteristic (scaling factor) of the network exhibited a strong correlation with the small-world characteristic (clustering of the network, average minimum transfer, and average minimum distance). The curves of the related variables are illustrated in Figure 2. The scaling factor was negatively correlated with the network clustering, but positively correlated with the shortest path length, in terms of both the average minimum transfer and average minimum distance. The network clustering was negatively correlated with the shortest path length, in terms of both the average minimum transfer and average minimum distance. The average minimum transfer was positively correlated with the average minimum distance.
On the other hand, there was no significant correlation between average delay duration and the holistic topological characteristics of both the rush group and the non-rush hour group. However, the average number of affected trains was correlated both with the scale-free and small-world holistic topological characteristics of the subway network in the non-rush hour group. Therefore, the average number of affected trains was positively correlated with scaling factor, average min. transfer, and average min. distance, but negatively correlated with clustering.
5.2. Correlation of Disruption Impact with Topological Characteristics of Stations
In general, the degree and betweenness of a station tends to increase the service disruption impacts, while clustering has an opposite effect. However, the distance from the centre of the line is rarely discussed. To test the hypothesis that a more important station exhibits a higher number of affected trains or longer delay duration, we further analysed the correlation between the topological characteristic variables and number of affected trains and delay duration by means of the Spearman correlation test, as indicated in Table 8. The test was carried out in both the rush hour and non-rush hour groups. Clustering and distance rejected the null hypothesis when the response variable was the number of affected trains in both groups. Surprisingly, when the response variable was the delay duration, none of the four variables exhibited a significant correlation in both groups.
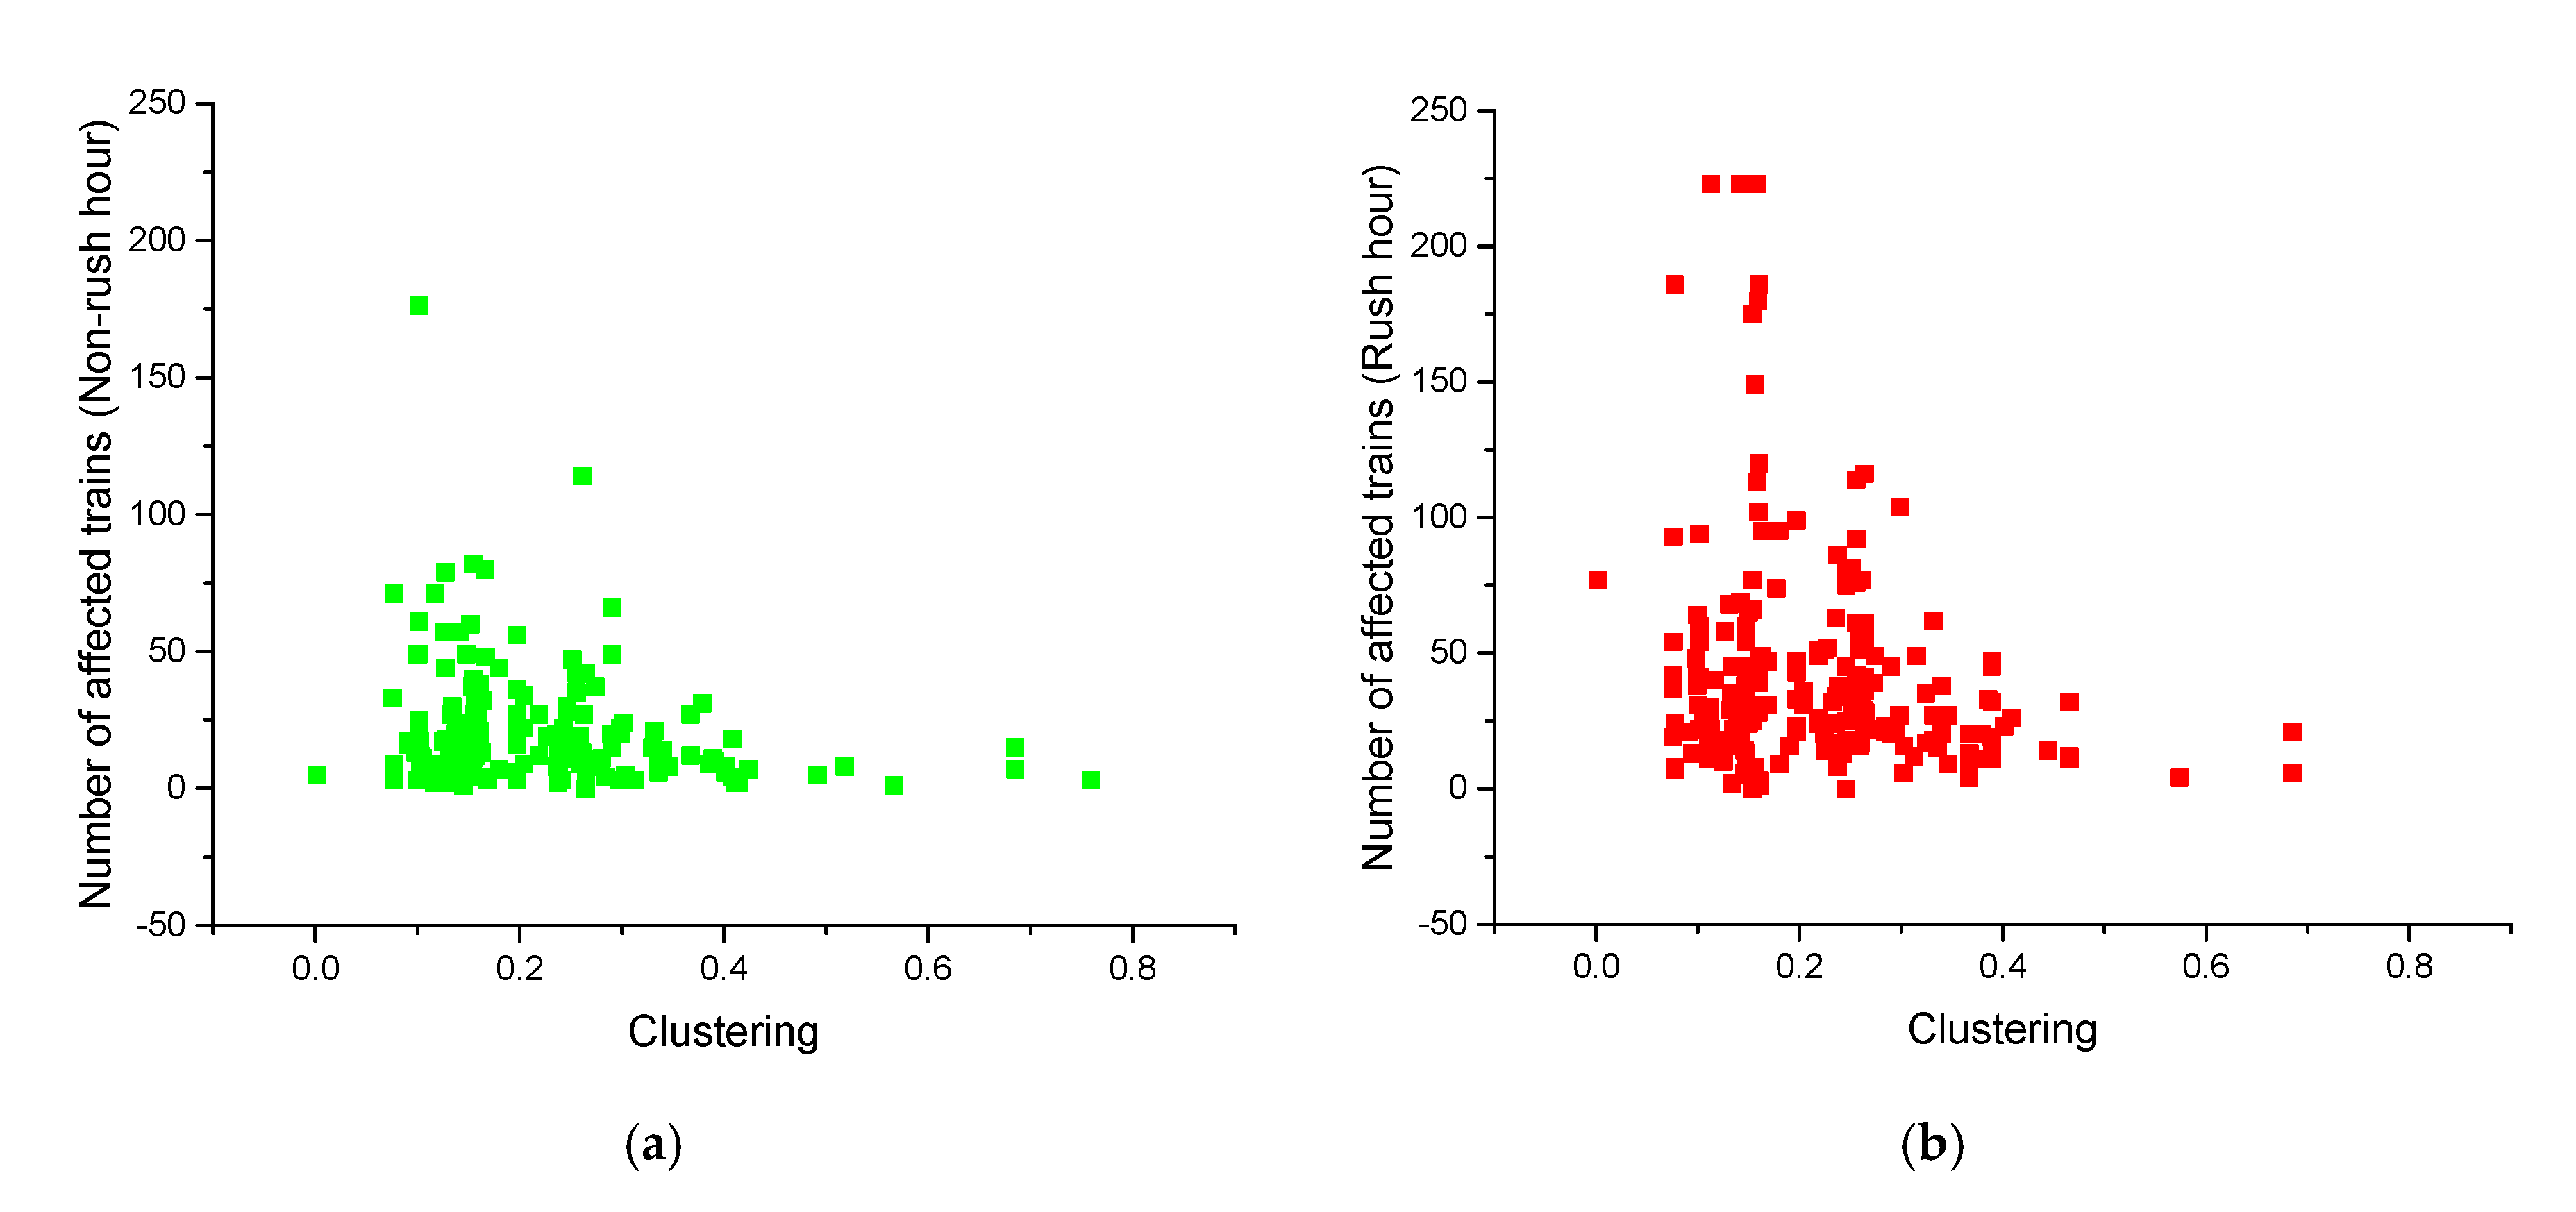
Higher clustering tends to provide protection against service disruption in stations for which the coefficient is significant at conventional significance levels. By plotting the clustering of stations versus the number of affected trains (as illustrated in Figure 3), it is easy to observe that the disruptions with the largest number of affected trains always occurred at stations with a clustering value of less than 0.2. As the station clustering increased, the number of affected trains became more concentrated around 50, as indicated in Figure 3. The distribution of the number of affected trains with clustering of less than 0.5 was very discrete; that is, even if a disruption occurred, stations with higher clustering did not affect the service operations of its neighbouring stations.
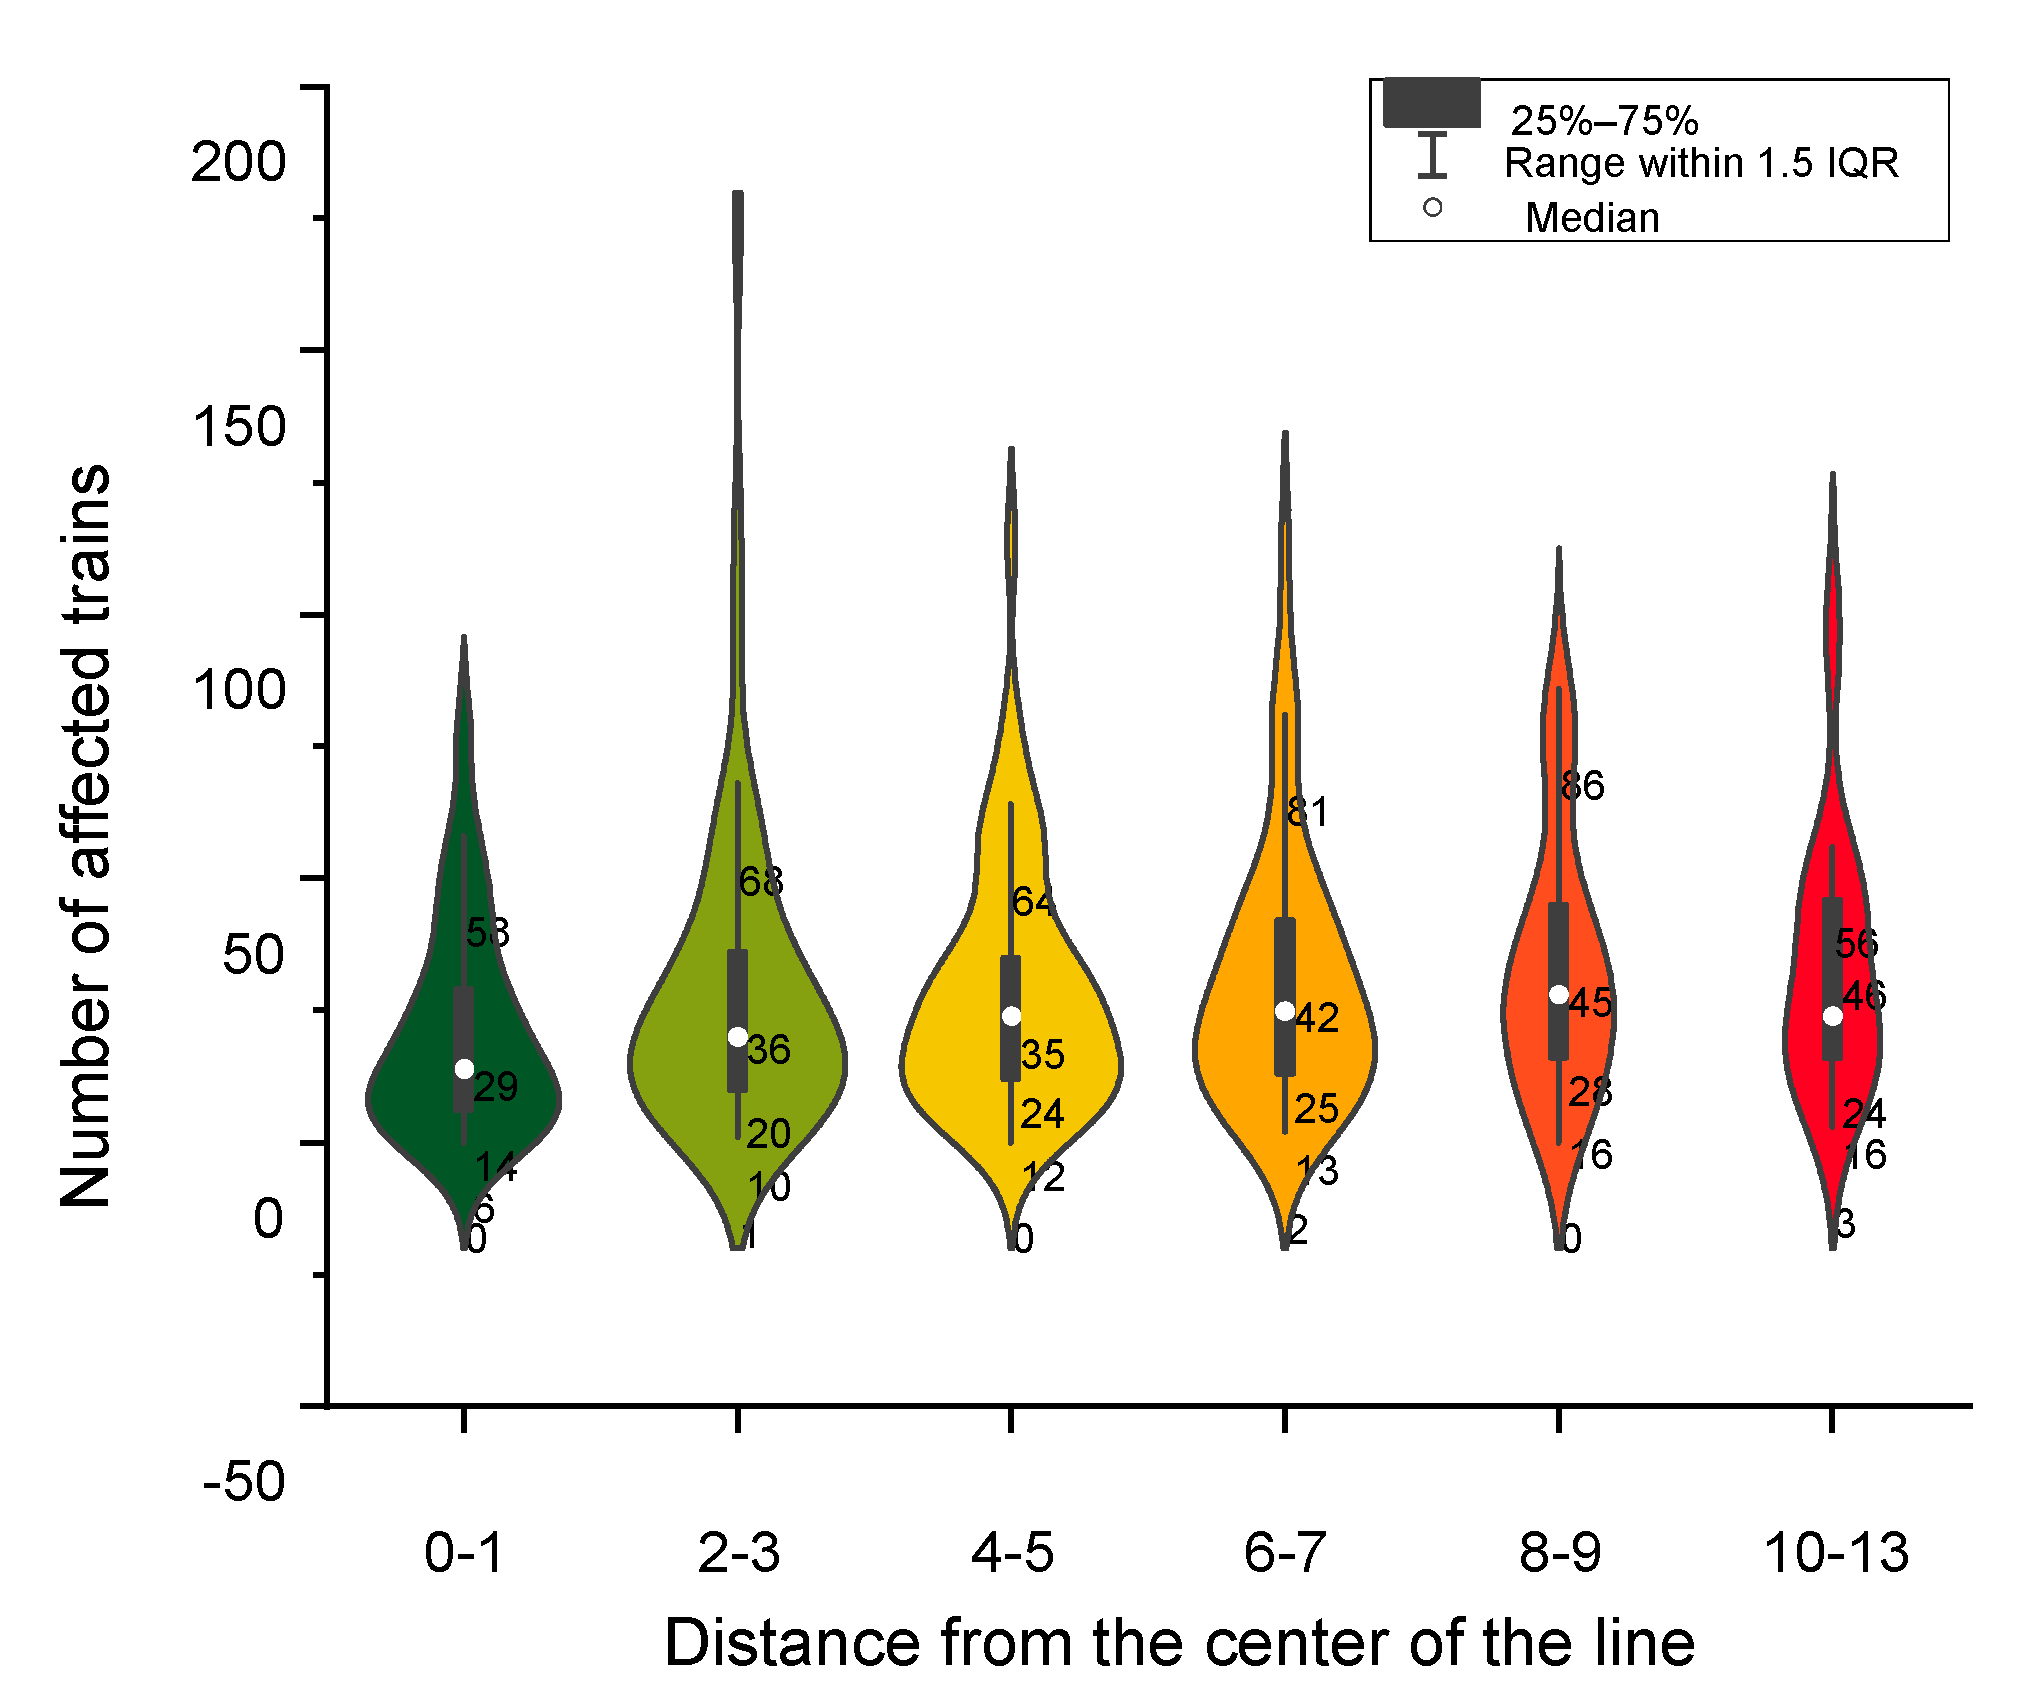
Furthermore, station lines within 16 stations or more than 20 stations can be planned to improve the resilience of the subway service under disruptions. This finding is consistent with [8], where it was found that networks with a higher diameter are often sparser and contain less redundant connections. However, when the diameter is sufficiently large, service disruptions occurring at the edge of the network have a limited radiation capacity, which reduces the impact (as illustrated in Figure 4). Networks with a larger diameter are often sparser and contain less redundant connections. Therefore, the positive relationship between the distance of the station from the centre of the line and the number of affected trains under service disruption is demonstrated. However, as transfer stations are less likely to appear at the edge of the network, when the network diameter continues to increase, the service disruptions occurring at the edge of the network will have a limited radiation capacity, thereby reducing the impact.
5.3. Regression Model of Disruption Impact with Topologcial Characteristic of the Station
Accordingly, the response variables—clustering and distance—which were identified as correlated variables, were considered in the regression model. The dependent variable was the number of affected trains. Firstly, multicollinearity of two correlated variables was diagnosed, as shown in Table 9. Variable proportion shows that distance can explain more than 70% of clustering. Additionally, in two groups, the eigenvalue of the distance variable was close to 0 and the condition index of distance was bigger than clustering. Therefore, distance was excluded in the following regression analysis.
Logarithmic regression and inverse regression were used for comparison with linear regression. The results of the three regression models are shown in Table 9. In non-rush hour, clustering and number of affected trains maintained a linear relation. However, in rush hour, they maintained linear and logarithmic relations. The R-Square value in the linear model was larger than in the logarithmic model in the rush hour group. In both groups, the R-Square value was far from 1. The reason for this is that we only had one variable in the model. The parameter estimate is shown in Table 10 and the linear fit curve is shown in Figure 3.
6. Conclusions
In this paper, we presented a correlation analysis of the topological characteristics of a subway network with number of affected trains and delay duration. In contrast to studies based on simulation and graph theoretic methods, we used the data of 392 actual service disruptions that occurred in the Beijing subway network from 2011 to 2017. The Spearman rank correlation coefficient was used to analyse the correlations among the complex attributes of the holistic network, the complex attributes of local stations, and the service disruption. This enabled not only clarification of the relationships, but also an assessment of the possible means of optimizing the planning of subway networks. The information provided by the research results may aid scholars in identifying the shortcomings of several hypotheses in theoretical research. Moreover, this information can be provided to aid the preparation of planners and managers, in order to mitigate the impact of accidents on the network by planning new routes or expanding existing routes to reduce vulnerability and critical factors.
From a complex network theory perspective, the evolution of a subway network does not definitely increase the network complexity while improving its convenience to passengers. Up to 2017, the main objective of the Beijing subway extension was to expand its coverage areas. At this stage, the Beijing subway is expanding its network mainly by constructing new stations to the edges along radial lines, rather than by adding tracks between existing stations to increase the network density. Nonetheless, the expansion of new stations will generate substantially more non-transfer stations than transfer stations. An increase in transfer stations may decrease the heterogeneity of the network. From a mathematical perspective, an increasing scaling factor is demonstrated. The rapid increase in the number of stations leads to a lack of connectivity between existing stations, which eventually results in an increasing length of the shortest path of the network and a decrease in the clustering. This is the reason that the scale-free feature of the network grows, but the small-world feature of the network does not improve significantly. Only at a later stage, in which the evolution of the network is based on the construction of tracks to connect old stations, will both the scale-free and small-world complexity attributes increase simultaneously.
Additionally, although the number of affected trains increases with an increase of the scaling factor, the negative impact is absorbed by the high clustering characteristic of the subway network. At a developed stage, in which the network evolves by constructing tracks among old stations, both the scale-free and small-world complexity attributes increase simultaneously. This means that, if the subway network is extended by adding tracks between existing stations, the vulnerability caused by an increase of the scale-free features can be absorbed by improving the small-world features of the network. These results demonstrate subway network expansion will not result in a paradox between convenience and vulnerability from an actual data perspective.
Meanwhile, the number of affected trains is a valuable indicator to quantify the relationship with service delivery level under disruption and topological characterise of MRT network structure than delay duration, according to our empirical result. This is because of the two dependent variables under service disruption: only the number of affected trains exhibited correlation with the independent variables, while the delay duration exhibited no correlation. The service disruption duration cannot reflect the actual negative effect on the transport service. That is because certain disruptions that last for a long time may only affect a few trains. However, certain disruptions with very short durations ultimately cause the delay of more trains. In most transportation-related studies, the delay duration or delay time-superimposed passenger flow is generally used to quantify the impact of disruptions.
The conclusion of most studies—that subway networks are more vulnerable to targeted attacks than to random attacks—was not supported by our empirical data from service delivery perspective. In such studies, targeted attacks were simulated in numerous manners, such as deleting stations with higher degree, betweenness, or clustering. The results of our empirical analysis demonstrated no significant relationship between transfer and non-transfer stations. The station betweenness also showed no significant difference in the number of affected trains. In theoretical studies, the platforms and tracks of transfer stations were assumed to be unique. This assumption induces the conclusion that, once an incident occurs at the transfer station, the platform and tracks will be occupied; which means that all trains planning to pass this station will be affected by travelling at a lower speed or being cancelled. However, in actual operations, the platforms and tracks are not unique: different lines occupy different platforms and tracks. An incident on one platform does not necessarily affect the normal operation of trains on other platforms. Therefore, there was no significant difference in the number of affected trains at different station degrees. Furthermore, the irrelevancy of transfer stations serves as a reminder to establish the problem of multi-platform transfer in metro transfer stations correctly when conducting research based on simulation methods, rather than all lines of a transfer station sharing the same platform.
Moreover, the negative correlation between the clustering and number of affected trains indicates that the impact on the subway service disruption occurring at stations with high clustering was smaller than that at stations with low clustering. In practice, increasing the construction of tracks between existing stations can improve the clustering coefficient of the stations. Higher clustering tends to provide protection against service disruption for stations by means of alternative tracks. For example, in the Beijing subway network, the airport line has four stations in total: Dongzhimen station, Sanyuanqiao station, T2 station, and T3 station. Sanyuanqiao station, T2 station, and T3 station are all connected by tracks, forming a triple. Therefore, the clustering values of T2 and T3 are greater than 0.6. If a disruption occurs at the T3 station, T2 can be reached directly from Sanyuanqiao station, thereby providing a highly significant protective effect. Additionally, station lines within 16 stations or more than 20 stations can be planned to improve the resilience of the subway service under disruptions. This finding is consistent with [8], that networks with a higher diameter are often sparser and contain less redundant connections. However, when the diameter is sufficiently large, service disruptions occurring at the edge of the network have a limited radiation capacity, which will reduce the impact.
Last of all, we want to note several drawbacks of the study. Firstly, using of ‘number of affected trains’ as indicator for disruption impacts is from transport service delivery perspective. When a disruption happened, providers of the transport service or manager of transport service can know how the planned service delivery level is affected by ‘number of affected trains’. The actual passenger capacity or density of trains is not considered in this indicator. Although we have separated the analysis into rush hour and non-rush hour group, actual passenger capacity or density of trains may be different in city centre line and suburban line. How many passengers affected due to disruptions cannot be known by ‘number of affected trains’. Researchers had used AFC data to evaluate disruption impact on passengers. On one hand, affected passenger has delay effect and escape effect. The delayed effect refers to that affected passengers will be reflected on the AFC data after the disruption is over. The escape effect means that some of affected passengers will leave MRT system and cannot be reflected by the AFC data. Therefore, if AFC data are to be used as a tool for disruption impact assessment, the time duration selected for AFC data is very critical, which will directly change results. On the other hand, even if the appropriate time duration is selected to extract the AFC data, only the number of passengers actually served can be known. If we want to know how many passengers are affected by the disruption, simulation method is needed to support the calculation of the number of passengers that should be provided transport service. Therefore, the results also depend on the accuracy of the simulation data of passenger flow.
Secondly, the length of shortest path was calculated by the number of transfers and number of stations passed in this study. This makes the shortest path length between stations will only increase if adding a new station between existing stations when extend subway network. The Beijing subway network was not a whole connected in 2011 and 2012. It became a whole connected network till to 2013. Since 2013, there were 30,450 connected pairs existing in those 174 stations. The average shortest path length of the 30,450 OD pairs was increased from 15.9713 in 2013 to 16.6098 in 2014. That was because new stations had been added between existing stations. Whereas the reverse is true if the length of shortest path would calculate the geodesic link length; whilst using link travel times might increase the shortest path length somewhat if the dwell times result in longer journey times for through passengers. In the future study, the appropriate way to calculated the shortest path should be used according to the purpose of the research.
Thirdly, some of disruptions was the result of domino effect of another disruption, while the domino effect was not considered here. Such a disposition, may let space correlation information be missed. Therefore, in the future study, the disruptions should be considered as chains or even formulate into networks. The factors related with spatial, such as geographical, economic, and demographic attributes and so on should be taken into account when carrying out spatial autocorrelation analysis. It is really an interesting question whether there are spatial autocorrelation characteristics of subway disruption incidents.
From the perspective of prediction analysis, the regression analysis results showed that using only topological features cannot demonstrate a good interpretation of the disruption impact. Therefore, in the future, we need to consider not only the topological characteristics, but also the factors from GIS information, operations, passenger flow, and the cause of disruptions in the regression analysis.
Author Contributions
Z.W. designed the research, collected and analysed the data, and drafted the paper; W.M. collected and analysed the data; A.C. contributed in reviewing the final work to enhance/improved the outcomes. All authors have read and agreed to the published version of the manuscript.
Funding
This research was funded by the Natural Science Foundation of Beijing Municipality, grant number L181009 and 9194028; Humanities and Social Science Fund of Ministry of Education of China, grant number 18YJC630193; and Fundamental Research Funds for the Central Universities, grant number 2015M570121.
Acknowledgments
The Beijing subway provided disruption data in this study is gratefully acknowledged. The author also thanks three anonymous reviewers and the editor for their insightful and helpful comments.
Conflicts of Interest
The authors declare no conflict of interest. The funders had no role in the design of the study; in the collection, analyses, or interpretation of data; in the writing of the manuscript, or in the decision to publish the results.
References
- Cadarso, L.; Marín, Á. Combining robustness and recovery in rapid transit network design. Transp. A 2016, 12, 203–229. [Google Scholar] [CrossRef] [Green Version]
- Li, M.; Wang, H.; Wang, H. Resilience Assessment and Optimization for Urban Rail Transit Networks: A Case Study of Beijing Subway Network. IEEE Access 2019, 7, 71221–71234. [Google Scholar] [CrossRef]
- Beijing Municipal Bureau of Statistics. Public transport from 1978–2018. In Beijing Statistical Yearbook; Beijing Municipal Bureau of Statistics: Beijing, China, 2019; pp. 180–181. [Google Scholar]
- Mattsson, L.; Jenelius, E. Vulnerability and resilience of transport systems—A discussion of recent research. Transp. Res. Part A-Policy Pract. 2015, 81, 16–34. [Google Scholar] [CrossRef]
- Wang, Z.; Chan, A.P.C.; Yuan, J.; Xia, B.; Skitmore, M.; Li, Q. Recent Advances in Modeling the Vulnerability of Transportation Networks. J. Infrastruct. Syst. 2015, 21, 06014002. [Google Scholar] [CrossRef]
- Naohiko, H.; Osamu, N.; Shigeru, M.; Hitoshi, I.; Norio, T. Recovery measure of disruption in train operation in Tokyo Metropolitan Area. Transp. Res. Procedia 2017, 25, 4370–4380. [Google Scholar] [CrossRef]
- Xiao, X.; Jia, L.; Wang, Y. Correlation between heterogeneity and vulnerability of subway networks based on passenger flow. J. Rail Transp. Plann. Manag. 2018, 8, 145–157. [Google Scholar] [CrossRef]
- Zhang, X.; Miller-Hooks, E.; Denny, K. Assessing the role of network topology in transportation network resilience. J. Transp. Geogr. 2015, 46, 35–45. [Google Scholar] [CrossRef] [Green Version]
- Lopez, F.A.; Paez, A.; Carrasco, J.A.; Ruminot, N.A. Vulnerability of nodes under controlled network topology and flow autocorrelation conditions. J. Transp. Geogr. 2017, 59, 77–87. [Google Scholar] [CrossRef]
- Derrible, S.; Kennedy, C. The complexity and robustness of metro networks. Physica A 2010, 389, 3678–3691. [Google Scholar] [CrossRef]
- Lu, Q. Modeling network resilience of rail transit under operational incidents. Transp. Res. A-Policy Pract. 2018, 117, 227–237. [Google Scholar] [CrossRef]
- Cats, O. The robustness value of public transport development plans. J. Transp. Geogr. 2016, 51, 236–246. [Google Scholar] [CrossRef]
- Eduardo, R.; Juan, G.C. Measuring the vulnerability of public transport networks. J. Transp. Geogr. 2014, 35, 50–63. [Google Scholar]
- Shi, J.; Wen, S.; Zhao, X.; Wu, G. Sustainable development of urban rail transit networks: A vulnerability perspective. Sustainability 2019, 11, 1335. [Google Scholar] [CrossRef] [Green Version]
- Latora, V.; Marchiori, M. Efficient behavior of small-world networks. Phys. Rev. Lett. 2001, 87, 198701. [Google Scholar] [CrossRef] [PubMed] [Green Version]
- Cats, O.; Vermeulen, A.; Warnier, M.; van Lint, H. Modelling growth principles of metropolitan public transport networks. J. Transp. Geogr. 2020, 82, 102567. [Google Scholar] [CrossRef]
- Angeloudis, P.; Fisk, D. Large subway systems as complex networks. Physica A 2006, 367, 553–558. [Google Scholar] [CrossRef]
- Zhang, J.; Xu, X.; Hong, L.; Wang, S.; Fei, Q. Networked analysis of the Shanghai subway network, in China. Physica A 2011, 390, 4562–4570. [Google Scholar] [CrossRef]
- Louie, J.; Shalaby, A.; Habib, K.N. Modelling the impact of causal and non-causal factors on disruption duration for Toronto’s subway system: An exploratory investigation using hazard modelling. Accid. Anal. Prev. 2017, 98, 232–240. [Google Scholar] [CrossRef]
- Jin, J.G.; Tang, L.C.; Sun, L.; Lee, D. Enhancing metro network resilience via localized integration with bus services. Transp. Res. Part E-Logist. Transp. Rev. 2014, 63, 17–30. [Google Scholar] [CrossRef]
- Weng, J.; Zheng, Y.; Yan, X.; Meng, Q. Development of a subway operation incident delay model using accelerated failure time approaches. Accid. Anal. Prev. 2014, 73, 12–19. [Google Scholar] [CrossRef]
- Weng, J.; Zheng, Y.; Qu, X.; Yan, X. Development of a maximum likelihood regression tree-based model for predicting subway incident delay. Transp. Res. Part C-Emerg. Technol. 2015, 57, 30–41. [Google Scholar] [CrossRef]
- Weng, J.; Feng, L.; Du, G.; Xiong, H. Maximum likelihood regression tree with two-variable splitting scheme for subway incident delay. Transp. A 2019, 15, 1061–1080. [Google Scholar] [CrossRef]
- Albert, R.; Barabasi, A.L. Statistical mechanics of complex networks. Rev. Mod. Phys. 2002, 74, 47–97. [Google Scholar] [CrossRef] [Green Version]
- Wei, Y.; Ning, S. Establishment and analysis of the super network model for Nanjing metro transportation system. Complexity 2018, 2018, 1–11. [Google Scholar]
- Wang, Z.; Liang, Z.; Yuan, J.; Li, Q. Scale-free analysis of subway network. J. Southeast Univ. Nat. Sci. Ed. 2013, 43, 895–899. [Google Scholar]
- Wang, Z.; Su, G.; Liang, Z. Information transfer efficiency based small-world assessment methodology for metro networks. J. Tsinghua Univ. Sci. Technol. 2016, 56, 411–416. [Google Scholar]
- Wang, Z.; Niu, F.; Yang, L.; Su, G. Modeling a subway network: A hot-point attraction-driven evolution mechanism. Physica A 2020, 537, 122625. [Google Scholar] [CrossRef]
- Hu, Y.; Chen, F.; Chen, P.; Tan, Y. The influence of passenger flow on the topology characteristics of urban rail transit networks. Int. J. Mod. Phys. B 2017, 12, 175–181. [Google Scholar] [CrossRef] [Green Version]
- Von Ferber, C.; Holovatch, T.; Holovatch, Y.; Palchykov, V. Public transport networks: Empirical analysis and modeling. Eur. Phys. J. B 2009, 68, 261–275. [Google Scholar] [CrossRef] [Green Version]
- Wang, Z.; Liang, Z. Subway Network Model Construction Method. China Patent CN108897920-A, 27 December 2018. [Google Scholar]
- Saccenti, E.; Hendriks, M.H.; Smilde, A.K. Corruption of the Pearson correlation coefficient by measurement error and its estimation, bias, and correction under different error models. Sci. Rep.-UK 2020, 10, 1–19. [Google Scholar] [CrossRef] [Green Version]
- Yang, Z.; Chen, Y.; Zheng, Z.; Huang, Q.; Wu, Z. Application of building geometry indexes to assess the correlation between buildings and air temperature. Build. Environ. 2020, 167, 106477. [Google Scholar] [CrossRef]
- Zhang, W.; Wei, Z.; Wang, B.; Han, X. Measuring mixing patterns in complex networks by Spearman rank correlation coefficient. Physica A 2016, 451, 440–450. [Google Scholar] [CrossRef]
Figure 1.
Expansion of the Beijing subway network from 2011 to 2017. Source: The maps were drawn according to the subway maps from 2011 to 2017 provided by Beijing subway. (a) The Beijing subway network in 2011. (b) The Beijing subway network in 2012. (c) The Beijing subway network in 2013. (d) The Beijing subway network in 2014. (e) The Beijing subway network in 2015. (f) The Beijing subway network in 2016. (g) The Beijing subway network in 2017.


Figure 2.
Curves of related variables.

Figure 3.
Scatter plot and linear fit curve of station clustering and number of affected trains. (a) Relationship between station clustering and number of affected trains on non-rush hour. (b) Relationship between station clustering and number of affected trains on non-rush hour.
Figure 3.
Scatter plot and linear fit curve of station clustering and number of affected trains. (a) Relationship between station clustering and number of affected trains on non-rush hour. (b) Relationship between station clustering and number of affected trains on non-rush hour.

Figure 4.
Violin distribution of number of affected trains ordered by station distance from the centre of the line.
Figure 4.
Violin distribution of number of affected trains ordered by station distance from the centre of the line.


Table 1.
Five examples of 392 disruption records.
| Case No. | Date | Line | Descriptions of the Incident Process |
|---|---|---|---|
| 1 | 18 April 2011 | Line 1 | At 8:06, the No. 1073 vehicle could not leave Xidan station on time because the door light could not turn off; at 8:11, the driver asked to return back to the depot empty; at 8:16, all passengers left the No. 1073 vehicle; at 8:17, the track was cleared up and No. 1073 vehicle went back to the depot. This disruption caused the cancellation of 9 trains, and 47 trains were delayed more than 5 min. |
| 2 | 10 August 2011 | Airport Line | From 6:00 to 23:59, the upstream waveguide of the T2 station was broken down. The upstream trains passing the T2 station were switched to the inter-station automatic blocking mode at a lower speed. This disruption caused cancellation of 3 trains and 6 trains delayed more than 1 min. |
| 3 | 12 July 2014 | Line 1 | At 7:38, the integrated monitoring system of the power centre showed that the No. 30 switch of the Dawang road station was jumped for tripping, causing no power of tracks; at 7:40, the operator at Dawanglu station was asked to release the No. 30 switch; at 9:34, the No. 30 switch transmission test was successful. As a result, 2 trains were suspended, 4 trains arrived late (all above 5 min), and 2 trains were adjusted to return to the depot empty. |
| 4 | 12 September 2014 | Line 2 | At 7:31, the No. 2034 vehicle needed to open its door in downgrade mode due to malfunction of train ATP at Changchun street station; at 7:32, the No. 2034 vehicle was asked to return to the depot in blocking mode; at 8:05, all passengers were asked to leave the train; at 8:06, the train left the track and went back to the depot. As a result, 3 trains were suspended, 12 trains arrived late (2 trains late by 2 min, another 10 trains late by more than 5 min), and 2 trains were adjusted to return to the depot empty. |
| 5 | 23 October 2015 | Line 10 | At 7:35, because the outbound signal of Caoqiao station was not open, the trains were asked to operate in telephone blocking instead of by automatic signals; at 15:42, the signal was recovered. This incident caused the cancellation of 101 trains, 107 trains delayed more than 5 min, and 41 trains to return to the depot empty. |
Table 2.
Evolution of Beijing subway network structure from 2011 to 2017.
| 2011 | 2012 | 2013 | 2014 | 2015 | 2016 | 2017 | |
|---|---|---|---|---|---|---|---|
| Line | 14 | 15 | 16 | 17 | 19 | 19 | 20 |
| Station | 174 | 191 | 224 | 235 | 270 | 281 | 291 |
| Track | 370 | 406 | 498 | 528 | 606 | 638 | 658 |
| All connected pairs | 24,644 | 27,774 | 50,850 | 55,460 | 72,630 | 78,680 | 84,390 |
| Max. connected pairs | 30,450 | 36,672 | 50,850 | 55,460 | 72,630 | 78,680 | 84,390 |
| Max. transfers | 4 | 4 | 4 | 4 | 4 | 4 | 4 |
| Mean min. transfers | 1.2201 | 1.1789 | 1.4280 | 1.5618 | 1.6430 | 1.5838 | 1.6216 |
| Mean min. distance | 11.3074 | 10.8013 | 13.6117 | 15.2952 | 15.7431 | 15.9077 | 16.3829 |
Source: Subway line, station, and track data are from the Beijing Municipal Bureau of Statistics, 2019. Public transport from 1978 to 2018 in Beijing Statistical Yearbook 2019. Other indicators in this table are calculated by the Urban-metro-cas (Patent no. CN108897920-A) software [31], according to subway maps from 2011 to 2017 provided by Beijing subway.
Table 3.
Variable definitions and descriptions.
| Variable | Definitions and Descriptions |
|---|---|
| DependentVariables | |
| Number of affected trains | An integer continuous variable equaling the total number of delayed and cancelled trains. |
| Delay duration | An integer continuous variable equaling the duration from the occurrence of disruption to normal operations resuming (disruption clearing). |
| Independent Variables Regarding Station | |
| Degree of station | An ordered categorical variable equaling the number of tracks into and out of a station. |
| Transfer station | A dummy variable equaling one if the station is passed by more than one line. |
| Clustering of stations | An integer continuous variable reflecting the tightness of a station, calculated using Equation (3) |
| Betweenness of station | An integer continuous variable reflecting the criticality of a station as a bridge, calculated using Equation (5) |
| Distance to centre of line | An ordered categorical variable reflecting the distance of the station to the centre of the line, which is categorised into six groups. When the distance is within zero to one track, it is group 1; two to three tracks is group 2; four to five tracks is group 3; six to seven tracks is group 4; eight to nine tracks is group 5; and 10 to 13 tracks is group 6. |
| Independent Variables Regarding the Whole Network | |
| Scaling factor | A negative value. The smaller its absolute value, the lower the degree of heterogeneity of the network and the more transfer stations in the network. |
| Clustering of network | An integer continuous variable between zero and one, calculated using Equation (4). |
| Average minimum distance | An integer continuous variable, calculated as the average of the number of track segments between all pairs. |
| Average minimum transfer | An integer continuous variable, calculated as the average of the number of transfers between all pairs. |
Table 4.
Descriptive statistics of four independent variables and two dependent variables.
| N | Minimum | Maximum | Mean | Std. Deviation | |
|---|---|---|---|---|---|
| Number of affected trains | 392 | 0 | 223 | 33.1800 | 35.4280 |
| Delay duration | 392 | 1 | 624 | 53.8300 | 74.3270 |
| Degree of station | 392 | 2 | 10 | 5.0900 | 2.1100 |
| Transfer station | 392 | 0 | 1 | 0.3700 | 0.4830 |
| Clustering of station | 392 | 0.0017 | 0.7593 | 0.2196 | 0.1124 |
| Betweenness of station | 392 | 0.0000 | 1.0000 | 0.3519 | 0.2765 |
| Distance to centre of line | 392 | 0 | 13 | 5.0300 | 3.0820 |
Table 5.
Normality tests of four independent variables and two dependent variables.
| Variable | Kolmogorov–Smirnov a | Shapiro–Wilk | ||||
|---|---|---|---|---|---|---|
| Statistic | df | Sig. | Statistic | df | Sig. | |
| Number of affected trains | 0.175 | 392 | 0.000 | 0.713 | 392 | 0.000 |
| Delay duration | 0.240 | 392 | 0.000 | 0.583 | 392 | 0.000 |
| Degree of station | 0.340 | 392 | 0.000 | 0.810 | 392 | 0.000 |
| Transfer station | 0.409 | 392 | 0.000 | 0.610 | 392 | 0.000 |
| Clustering of station | 0.141 | 392 | 0.000 | 0.891 | 392 | 0.000 |
| Betweenness of station | 0.102 | 392 | 0.000 | 0.930 | 392 | 0.000 |
| Distance to centre of line | 0.121 | 392 | 0.000 | 0.962 | 392 | 0.000 |
a Lilliefors significance correction.
Table 6.
Changes in scale-free characteristic, small-world characteristic, and disruption impact with increase in Beijing subway network from 2011 to 2017.
Table 6.
Changes in scale-free characteristic, small-world characteristic, and disruption impact with increase in Beijing subway network from 2011 to 2017.
| Year | Scale-Free Characteristic (p(k) = ak b) | Small-World Characteristic | Average Disruption Impact | |||||
|---|---|---|---|---|---|---|---|---|
| Scaling Factor | SSE | R-Square | Clustering | Average Min. Transfer | Average Min. Distance | Number of Affected Trains | Delay Duration | |
| 2011 | −3.077 | 0.0001881 | 0.9996 | 0.3068 | 1.2119 | 11.3812 | 45 | 45.3333 |
| 2012 | −3.078 | 0.0002374 | 0.9995 | 0.3114 | 1.1742 | 10.8781 | 54 | 38.6154 |
| 2013 | −2.656 | 0.0009636 | 0.9975 | 0.2795 | 1.4387 | 13.8952 | 95 | 60.7727 |
| 2014 | −2.53 | 0.001532 | 0.9958 | 0.2757 | 1.5614 | 15.4913 | 70 | 70.3385 |
| 2015 | −2.576 | 0.001203 | 0.9968 | 0.2710 | 1.6430 | 15.7431 | 58 | 49.2222 |
| 2016 | −2.478 | 0.001717 | 0.9952 | 0.2627 | 1.5838 | 15.9077 | 37 | 42.7838 |
| 2017 | −2.501 | 0.001658 | 0.9954 | 0.2671 | 1.6216 | 16.3829 | 33 | 51.3226 |
Table 7.
Correlation relationships between scale-free and small-world characteristics (Spearman correlation coefficient test).
Table 7.
Correlation relationships between scale-free and small-world characteristics (Spearman correlation coefficient test).
| Holistic Topological Character | Scaling Factor | Clustering | Average Min. Transfer | Average Min. Distance | Rush Hour | Non−Rush Hour | ||
|---|---|---|---|---|---|---|---|---|
| Average Number of Affected Trains | Average Delay Duration | Number of Affected Trains | Delay Duration | |||||
| Scaling Factor | 1 | −0.964 ** | 0.750 | 0.929 ** | 0.357 | 0.500 | 0.857 * | −0.393 |
| Clustering | 1 | −0.857 * | −0.964 ** | −0.286 | −0.286 | −0.893 ** | 0.321 | |
| Average min. transfer | 1 | 0.893 ** | 0.429 | 0.071 | 0.821 * | 0.107 | ||
| Average min. distance | 1 | 0.464 | 0.357 | 0.786 * | −0.286 | |||
| Number of affected trains | 1 | 0.643 | 1 | −0.036 | ||||
| Delay duration | 1 | 1 | ||||||
** Correlation is significant at the 0.01 level (two-tailed); * Correlation is significant at the 0.05 level (two-tailed).
Table 8.
Correlation between topological characteristic variables and service disruption impact.
| Response Variables | Non-Rush Hour | |||
| Number of Affected Trains | Delay Duration | |||
| Coefficient | Sig. (Two-Tailed) | Coefficient | Sig. (Two-Tailed) | |
| Degree | 0.032 | 0.675 | 0.012 | 0.875 |
| Transfer | 0.041 | 0.585 | 0.084 | 0.268 |
| Clustering | −0.171 * | 0.024 | 0.013 | 0.864 |
| Betweenness | 0.101 | 0.183 | 0.025 | 0.740 |
| Distance | 0.224 ** | 0.003 | −0.015 | 0.838 |
| Response Variables | Rush Hour | |||
| Number of Affected Trains | Delay Duration | |||
| Coefficient | Sig. (Two−Tailed) | Coefficient | Sig. (Two−Tailed) | |
| Degree | 0.007 | 0.916 | −0.119 | 0.075 |
| Transfer | −0.095 | 0.156 | −0.069 | 0.306 |
| Clustering | −0.152 * | 0.023 | 0.038 | 0.570 |
| Betweenness | 0.051 | 0.448 | −0.097 | 0.149 |
| Distance | 0.157 * | 0.019 | 0.061 | 0.367 |
** Correlation is significant at the 0.01 level (two-tailed); * Correlation is significant at the 0.05 level (two-tailed).
Table 9.
Collinearity Diagnostics.
| Group | Dimension | Eigenvalue | Condition Index | Variance Proportions | ||
|---|---|---|---|---|---|---|
| Constant | Clustering | Distance | ||||
| Non-rush hour group | Constant | 20.576 | 10.000 | 0.02 | 0.03 | 0.03 |
| Clustering | 0.350 | 20.713 | 0.00 | 0.28 | 0.44 | |
| Distance | 0.074 | 50.889 | 0.98 | 0.70 | 0.52 | |
| Rush hour group | Constant | 20.669 | 10.000 | 0.01 | 0.02 | 0.03 |
| Clustering | 0.277 | 30.105 | 0.00 | 0.27 | 0.43 | |
| Distance | 0.054 | 70.046 | 0.99 | 0.71 | 0.54 | |
Dependent Variable: Number of affected trains.
Table 10.
Regression Model Summary and Parameter Estimates.
| Group | Equation | Model Summary | Parameter Estimates | |||||
|---|---|---|---|---|---|---|---|---|
| R-Square | F | df1 | df2 | Sig. | Constant | b1 | ||
| Non-rush hour group | Linear | 0.045 | 80.209 | 1 | 166 | 0.005 | 280.996 | −380.390 |
| Logarithmic | 0.020 | 30.502 | 1 | 166 | 0.063 | 120.128 | −50.083 | |
| Inverse | 0.002 | 0.315 | 1 | 166 | 0.575 | 200.819 | −0.021 | |
| Rush hour group | Linear | 0.049 | 110.383 | 1 | 222 | 0.001 | 610.190 | −850.967 |
| Logarithmic | 0.035 | 70.933 | 1 | 222 | 0.005 | 200.373 | −130.426 | |
| Inverse | 0.004 | 0.998 | 1 | 222 | 0.319 | 410.834 | 0.067 | |
Dependent Variable: Number of affected trains. The independent variable is Clustering.
© 2020 by the authors. Licensee MDPI, Basel, Switzerland. This article is an open access article distributed under the terms and conditions of the Creative Commons Attribution (CC BY) license (http://creativecommons.org/licenses/by/4.0/).
Share and Cite
MDPI and ACS Style
Wang, Z.; Ma, W.; Chan, A. Exploring the Relationships between the Topological Characteristics of Subway Networks and Service Disruption Impact. Sustainability 2020, 12, 3960. https://0-doi-org.brum.beds.ac.uk/10.3390/su12103960
AMA Style
Wang Z, Ma W, Chan A. Exploring the Relationships between the Topological Characteristics of Subway Networks and Service Disruption Impact. Sustainability. 2020; 12(10):3960. https://0-doi-org.brum.beds.ac.uk/10.3390/su12103960
Chicago/Turabian StyleWang, Zhiru, Wubin Ma, and Albert Chan. 2020. "Exploring the Relationships between the Topological Characteristics of Subway Networks and Service Disruption Impact" Sustainability 12, no. 10: 3960. https://0-doi-org.brum.beds.ac.uk/10.3390/su12103960
Note that from the first issue of 2016, this journal uses article numbers instead of page numbers. See further details here.