Article

Primary Air Pollutants Emissions Variation Characteristics and Future Control Strategies for Transportation Sector in Beijing, China

1
National Engineering Research Center of Urban Environmental Pollution Control, Beijing Municipal Research Institute of Environmental Protection, Beijing 100037, China
2
Beijing Municipal Ecology and Environment Bureau, Beijing 100048, China
3
College of Resource Environment and Tourism, Capital Normal University, Beijing 100048, China
*
Author to whom correspondence should be addressed.
Sustainability 2020, 12(10), 4111; https://0-doi-org.brum.beds.ac.uk/10.3390/su12104111
Submission received: 24 March 2020 / Revised: 1 May 2020 / Accepted: 14 May 2020 / Published: 18 May 2020
(This article belongs to the Section Sustainable Transportation)

Abstract

:
Air pollutant emissions from vehicles, railways, and aircraft for freight and passenger transportation are major sources of air pollution, and strongly impact the air quality of Beijing, China. To better understand the variation characteristics of these emissions, we used the emission factor method to quantitatively determine the air pollutant emissions from the transportation sector. The emission intensity of different modes of transportation was estimated, and measures are proposed to prevent and control air pollutants emitted from the transportation sector. The results showed that air pollutant emissions from the transportation sector have been decreasing year by year as a result of the reduction in emissions from motor vehicles, benefiting from the structural adjustment of motor vehicles. A comparison of the emission intensity of primary air pollutants from different modes of transportation showed that the emission level of railway transportation was much lower than that of road transportation. However, Beijing relies heavily on road transportation, with road freight transportation accounting for 96% of freight transportation, whereas the proportion of railway transportation was low. Primary air pollutants from the transportation sector contributed significantly to the total emissions in Beijing. The proportion of NOX emissions increased from 54% in 2013 to 58% in 2018. To reduce air pollutant emissions from the transportation sector, further adjustments and optimization of the structure of transportation in Beijing are needed. As for the control of motor vehicle pollutant emissions, vehicle composition must be adjusted and the development of clean energy must be promoted, as well as the replacement of diesel vehicles with electric vehicles for passenger and freight transportation.

1. Introduction

As a megacity, Beijing has a large permanent resident population and a high demand for transportation, food, and consumer products, resulting in a large number of motor vehicles and a high volume of passenger and freight transportation [1]. Motor vehicles, trains, and airplanes generate a large quantity of atmospheric pollutants such as nitrogen oxides (NOX), hydrocarbons (HC), carbon monoxide (CO), and particulate matter (PM) during the fuel combustion process, which has a strong impact on the atmospheric environment and human health [2,3,4,5]. According to analysis of PM2.5 sources in Beijing, the pollution contribution from mobile sources such as motor vehicles increased from 31% in 2013 to 45% in 2018 [6,7]. Air pollution prevention in the transportation sector is significant for future air quality improvement [8,9,10].
The reduction of air pollution from the transportation sector depends on adjusting the structure of transportation networks and prioritizing to transportation methods with fewer pollutant emissions. The vehicle composition for each mode of transportation must be adjusted to reduce total fuel consumption and pollutant emissions [11,12,13]. Scholars in China and other countries have researched the quantification of motor vehicle pollutant emissions and their impact on air quality [14,15,16,17,18,19]. Cheng et al. comprehensively analyzed multi-source traffic data, such as the fine trajectory of vehicles, road traffic conditions, and road networks, to establish a high-temporal-resolution emission inventory of heavy-duty diesel vehicles in Beijing and to identify their emission patterns [14]. Cell phone global positioning system (GPS) data was used by Gately et al. to quantify motor vehicle congestion and its impact on air pollution in eastern Massachusetts, USA [17]. Some scholars proposed adjusting transportation structure [20,21,22,23,24]. For instance, Kelly et al. stated that it is necessary to fundamentally change urban transportation systems to improve air quality [22]. However, there are few studies on the quantitative assessment of air pollutant emissions from the transportation sector and emission comparisons for different types of transportation.
We aimed to better understand the current status of air pollution emissions from the transportation sector and the emission contributions of different modes of transportation in Beijing. The emission factor method was used to quantify the effect of changes in activity levels, including fuel consumption in the transportation sector, the stock of vehicles, and the number of aircraft trips, thus identifying the variation characteristics in air pollutant emissions from Beijing’s transportation sector. Correlation analysis was performed with changes in air pollutant emissions recorded at certain transportation and atmospheric environment monitoring stations in Beijing. Considering changes in passenger and freight transportation volume, the differences in emission levels and the economic costs of different modes of transportation were compared. On the basis of these analyses, suggestions are proposed for reducing air pollution in the transportation sector and adjusting and optimizing transportation structure and vehicle composition. This could provide support for atmospheric environmental management and for the regulation of control measures.

2. Materials and Methods

2.1. Research Objectives

The transportation sector in Beijing mainly includes motor vehicles (gasoline, diesel, and other passenger vehicles and trucks), railways (fossil-fuel-burning internal combustion engines and electric locomotives), and airplanes (fossil fuel-burning aircraft) [25]. The spatial distribution of motor vehicle roads, railway lines, and airports is shown in Figure 1. According to data from the Beijing Statistical Yearbook 2019 [26], there were approximately 5.73 million fossil fuel motor vehicles in Beijing, and the consumption of gasoline and diesel was approximately 6.2 million tons in 2018. The operating mileage of the railway in Beijing is approximately 130,000 km, accounting for about 1% of the total mileage across the country, which is much higher than its ratio of land area. Railway resources are relatively abundant in Beijing but are not fully used for freight. As the electrification of railways has accelerated, the amount of fossil fuels used for railway transportation has decreased. In 2018, the fuel consumption of railway internal combustion engines was 76,000 tons. There are two civil airports in Beijing, and air traffic has increased year by year, with annual trips approaching 6.6 billion.
Due to the large population and high residential density of Beijing, the demand for passenger transportation is high. In addition, due to economic development, residents have a large demand for energy, food, and consumer products, resulting in a large volume of freight transportation. A large quantity of air pollutants is generated by motor vehicles, trains, and aircraft engines during the fuel combustion process, which affects the atmospheric environment and human health. Therefore, the transportation sector is a significant source of air pollution.

2.2. Emission Evaluation Method

Emissions of atmospheric pollutants from road vehicles, railway internal combustion engines, and airplanes in the transportation sector were calculated using the emission factor method. As air pollutants are mainly emitted from the fuel combustion process, non-exhaust particulate emissions were not included in this study [27,28]. Road vehicles were divided into three categories based on vehicle types (freight, passenger, and motorcycles), fuel types (gasoline, diesel, and natural gas), and emission levels (pre-National I, National I, National II, National III, National IV, and National V). Details of the emission evaluation method can be seen in our previous study [29].
E = i P i × E F i × V K T i
where P is the stock of motor vehicles; EF represents the emission coefficient based on mileage, as recommended by the technical guidelines for the compilation of an air pollutant emission inventory for road motor vehicles, which was based on practical emission monitoring; VKT represents vehicle kilometers of travel for a year; and i represents the type of vehicle. The internal combustion engines of railway vehicles were analyzed based on their fuel quantity, and airplanes were analyzed based on the number of take-off and landing cycles. The specific formula is:
E = A × E f
where A is the number of take-off and landing cycles of the airplanes or the fuel consumption of the railway vehicles’ internal combustion engines based on statistical data, and Ef is the pollutant emission factor. See previous studies for discussions of specific emission factors [29].

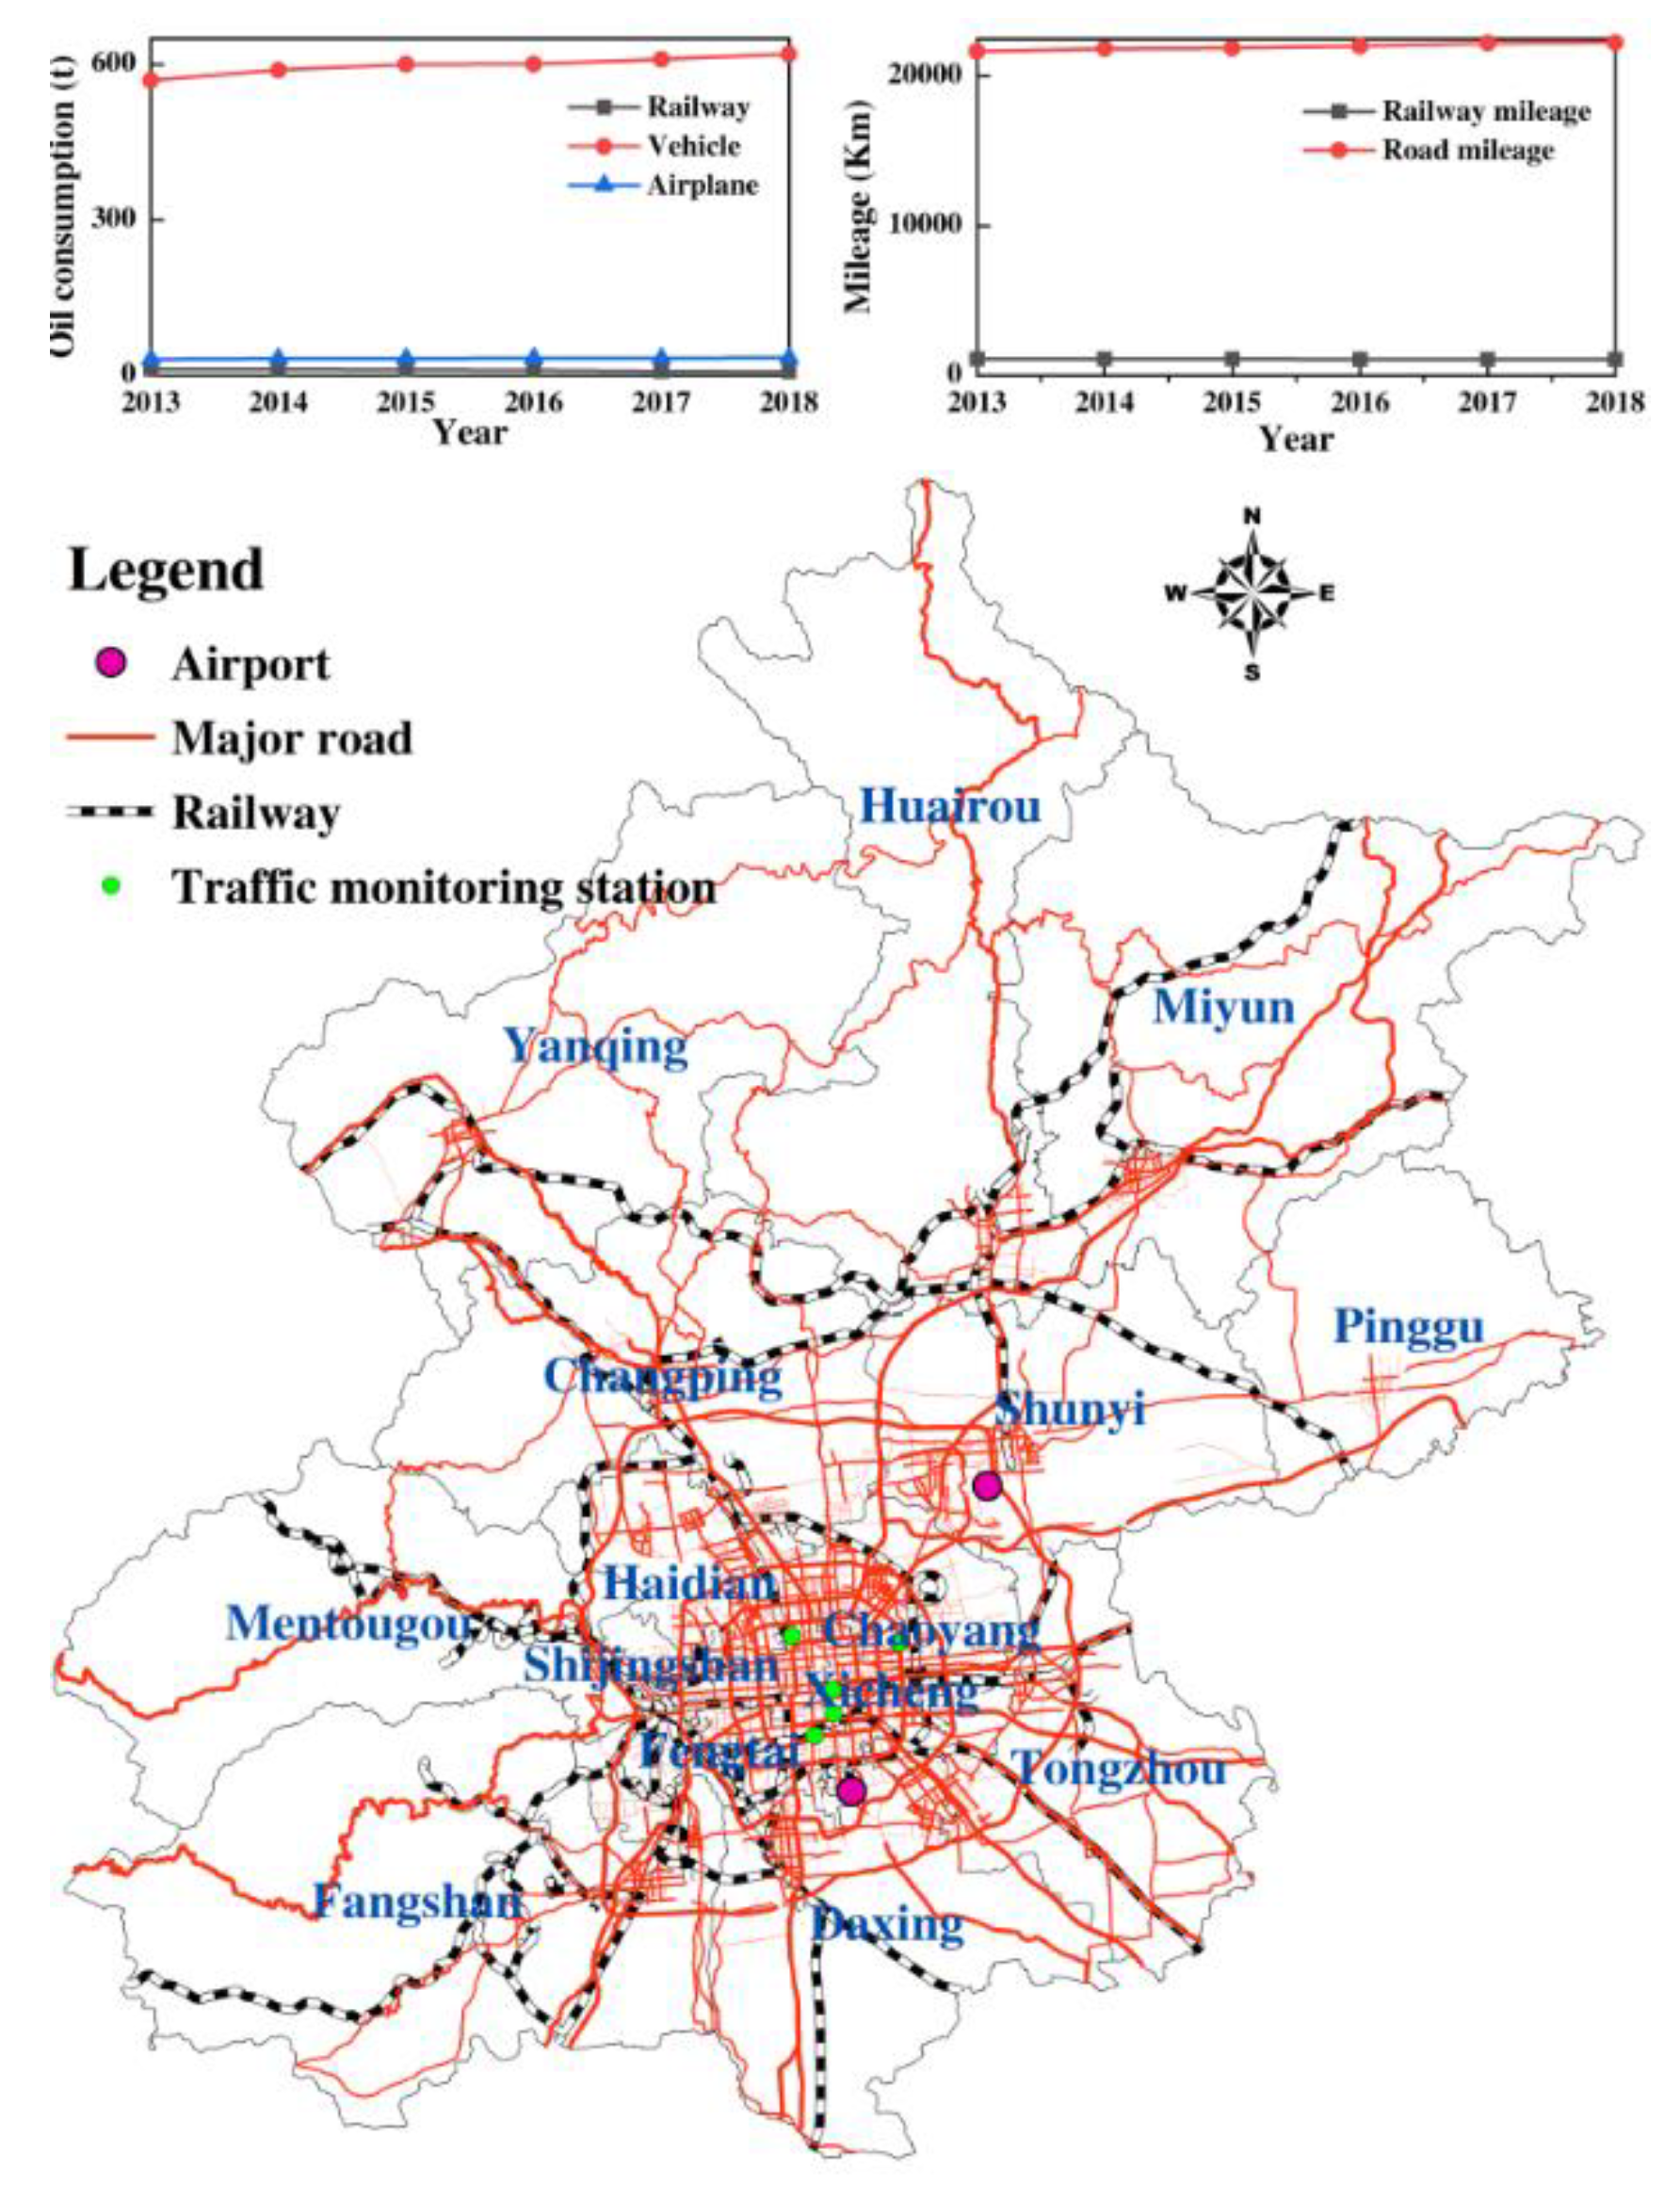
2.3. Traffic and Atmospheric Environment Monitoring Stations and Data

The official air quality monitoring system in Beijing consists of 35 monitoring stations, which are divided into 4 categories: background, suburban, urban, and traffic stations. There are currently five stations for monitoring the impact of road traffic pollution on ambient air quality: Yongdingmen, Qianmen, South Third Ring Road, East Fourth Ring Road, and Xizhimen North. These monitoring stations may also be affected by other atmospheric pollution sources such as heating boilers and dust, but they mainly measure the effects of road traffic pollution emissions. Each monitoring station is equipped with automatic monitoring instruments for SO2, NO2, CO, O3, PM10, and PM2.5; their concentrations in the air are published in real-time (http://zx.bjmemc.com.cn).
The environmental pollution concentration levels from the five road traffic monitoring stations from 2013 to 2018 were compared with the average concentrations of the city (Figure 2). The concentrations of the four pollutants (SO2, NO2, PM10, and PM2.5) at the traffic stations were all higher than the averages in the city. The concentration of NO2 was the highest, which was related to the large NOX emissions from road vehicles.

3. Results and Discussion

3.1. Changing Trends in Emissions from the Transportation Sector

The emissions of the four air pollutants from Beijing’s transportation sector from 2013 to 2018 and the contribution ratios of the different transportation types are shown in Figure 3. The emissions of the major pollutants in the transportation sector exhibited a downward trend, falling by 51.4% from 2013 to 2018, which was mainly related to a decline in emissions from motor vehicle pollution. With the implementation of the Beijing Municipal Government’s clean air action plan [30], the number of motor vehicles and the emissions from new motor vehicles are strictly controlled. In addition, the adjustment of the composition of motor vehicles was accelerated through the retirement of old high-emission vehicles. From 2013 to 2017, 2.167 million old motor vehicles were phased out. The compositions of buses, taxis, dirt trucks, garbage trucks, and freight trucks were also adjusted. Diesel vehicles and vehicles that met National III standards or lower were retired. The replacement vehicles and newly added vehicles were mostly new-energy vehicles. The transition to electric vehicles among industrial vehicles was also accelerated to effectively promote pollutant emission reductions and to adjust the composition of industrial motor vehicles.
The impact of the reduction in motor vehicle pollutant emissions on the improvement of air quality was also confirmed by the data from the road traffic pollution monitoring stations. The concentrations of NO2, PM2.5, and CO at the five traffic monitoring stations decreased by 15.6%, 42.8%, and 47.0%, respectively. The NO2 concentration decreased from 78.6 μg/m3 in 2013 to 66.3 μg/m3 in 2018. Compared with road vehicles, airplanes and railways contributed less to emissions from the transportation sector. Each of these forms of transportation contributed 4% to the NOX emissions from the transportation sector. Driven by economic development, the number of air passengers and the amount of freight traffic continued to increase, and pollution emissions also increased. Railway transportation volume continued to increase, but the pollution emissions were mainly from fossil fuel internal combustion locomotives. As the proportion of electric locomotives increased, the fuel volume for passenger and freight trains decreased year by year, as did railway pollution emissions. The NOX emissions fell from 7133 tons in 2013 to 4241 tons in 2018—a drop of 40%.
The highest proportion of emissions in the transportation sector was from motor vehicles, which contributed the vast majority of the HC, CO, and PM2.5. The NOX emission contributions were also relatively large, at 84–87%. This contribution was related to the large volumes of road passengers and road freight transportation, which accounted for 65.4% and 80.3% of the total passenger and freight transportation, respectively. In terms of energy consumption, the fuel consumption of motor vehicles, airplanes, and railways was 6.72 million, 345,000, and 76,000 tons, respectively. The consumption of gasoline and diesel by motor vehicles was large, at 19 and 88 times the consumption by airplanes and railways, respectively.

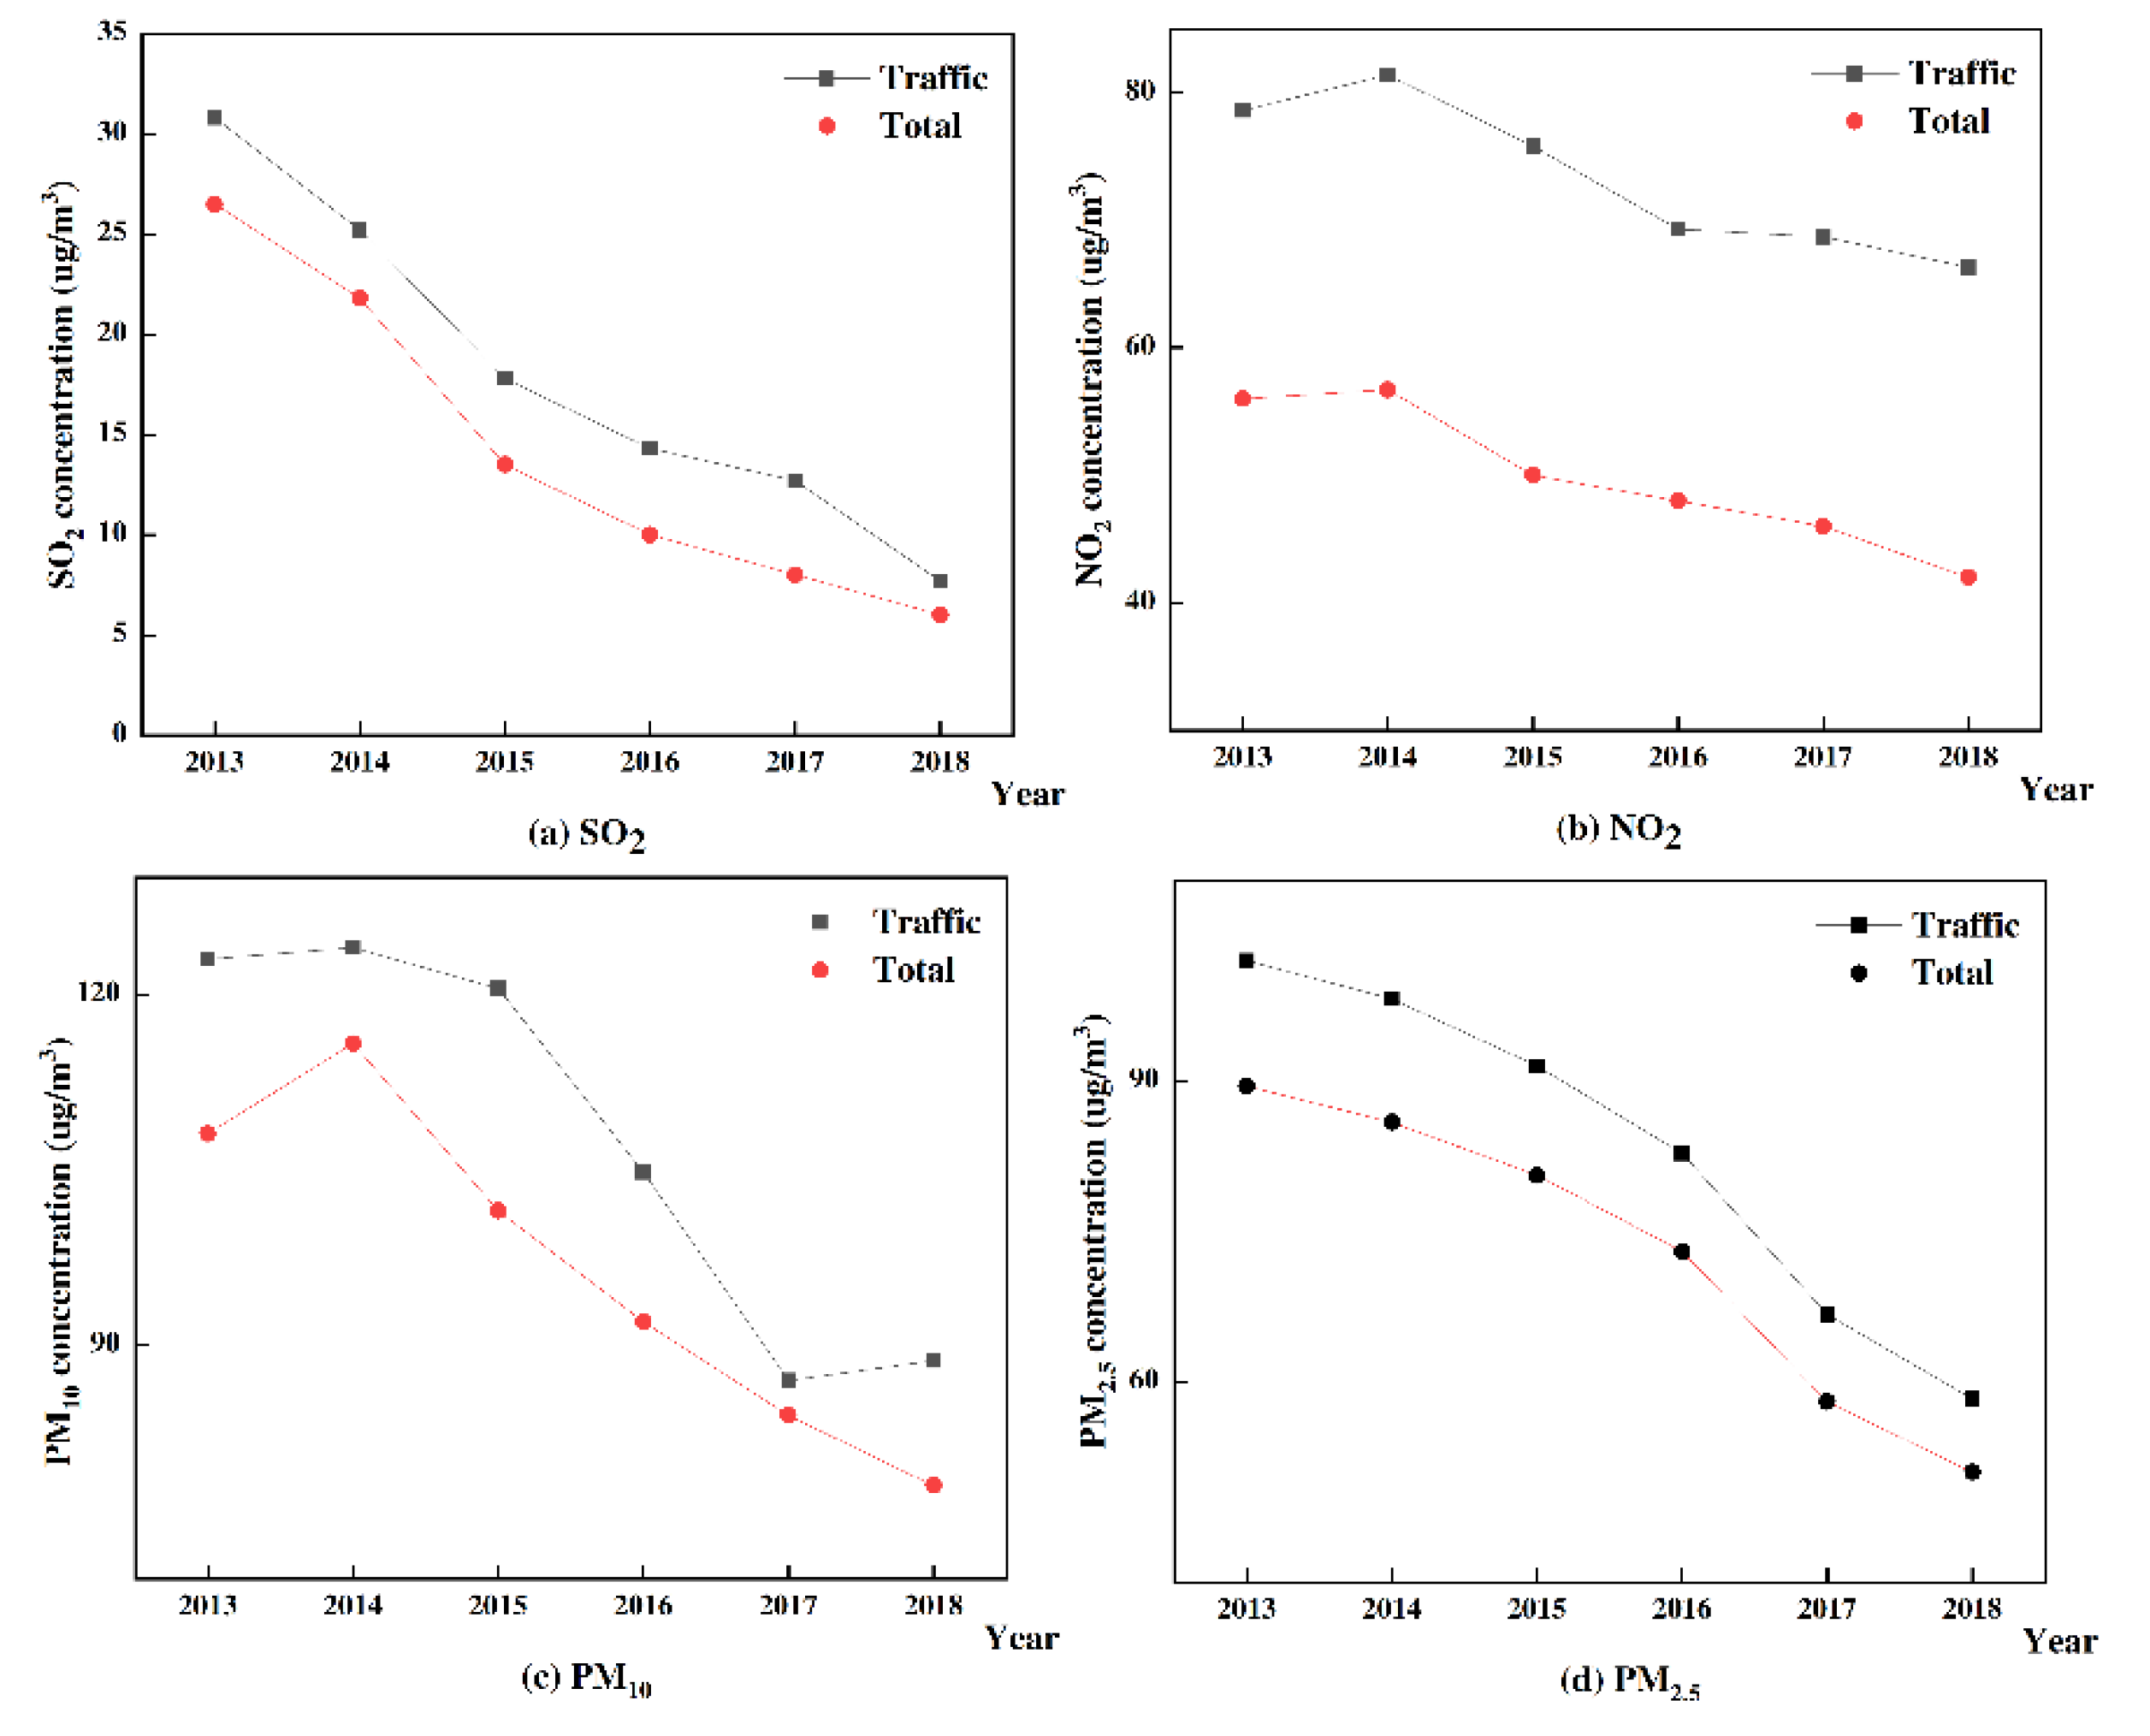
3.2. Contribution to Total Emissions and Impact on Environmental Quality

Pollutant emissions from the transportation sector contributed significantly to total air pollutant emissions in Beijing. According to NOX emissions of Beijing from 2013 to 2018 published in the Beijing Statistical Yearbook 2019, the proportion of NOX from the transportation sector increased significantly as a proportion of Beijing’s total emissions, increasing from 54% in 2013 to 58% in 2018. CO accounted for approximately 60% of total emissions and HC emissions contributed 15–21% of the total, mainly from motor vehicle exhaust and fuel evaporation (Figure 4).
Based on the air quality data from traffic monitoring stations, vehicle emissions from the transportation sector also had a large impact on air quality. According to the concentration of ambient air pollutants at five traffic environmental monitoring stations in Beijing from 2013 to 2018, the 6-year average NO2, PM10, and PM2.5 concentrations at the stations were 1.5, 1.1, and 1.2 times the average concentrations in the city, respectively.

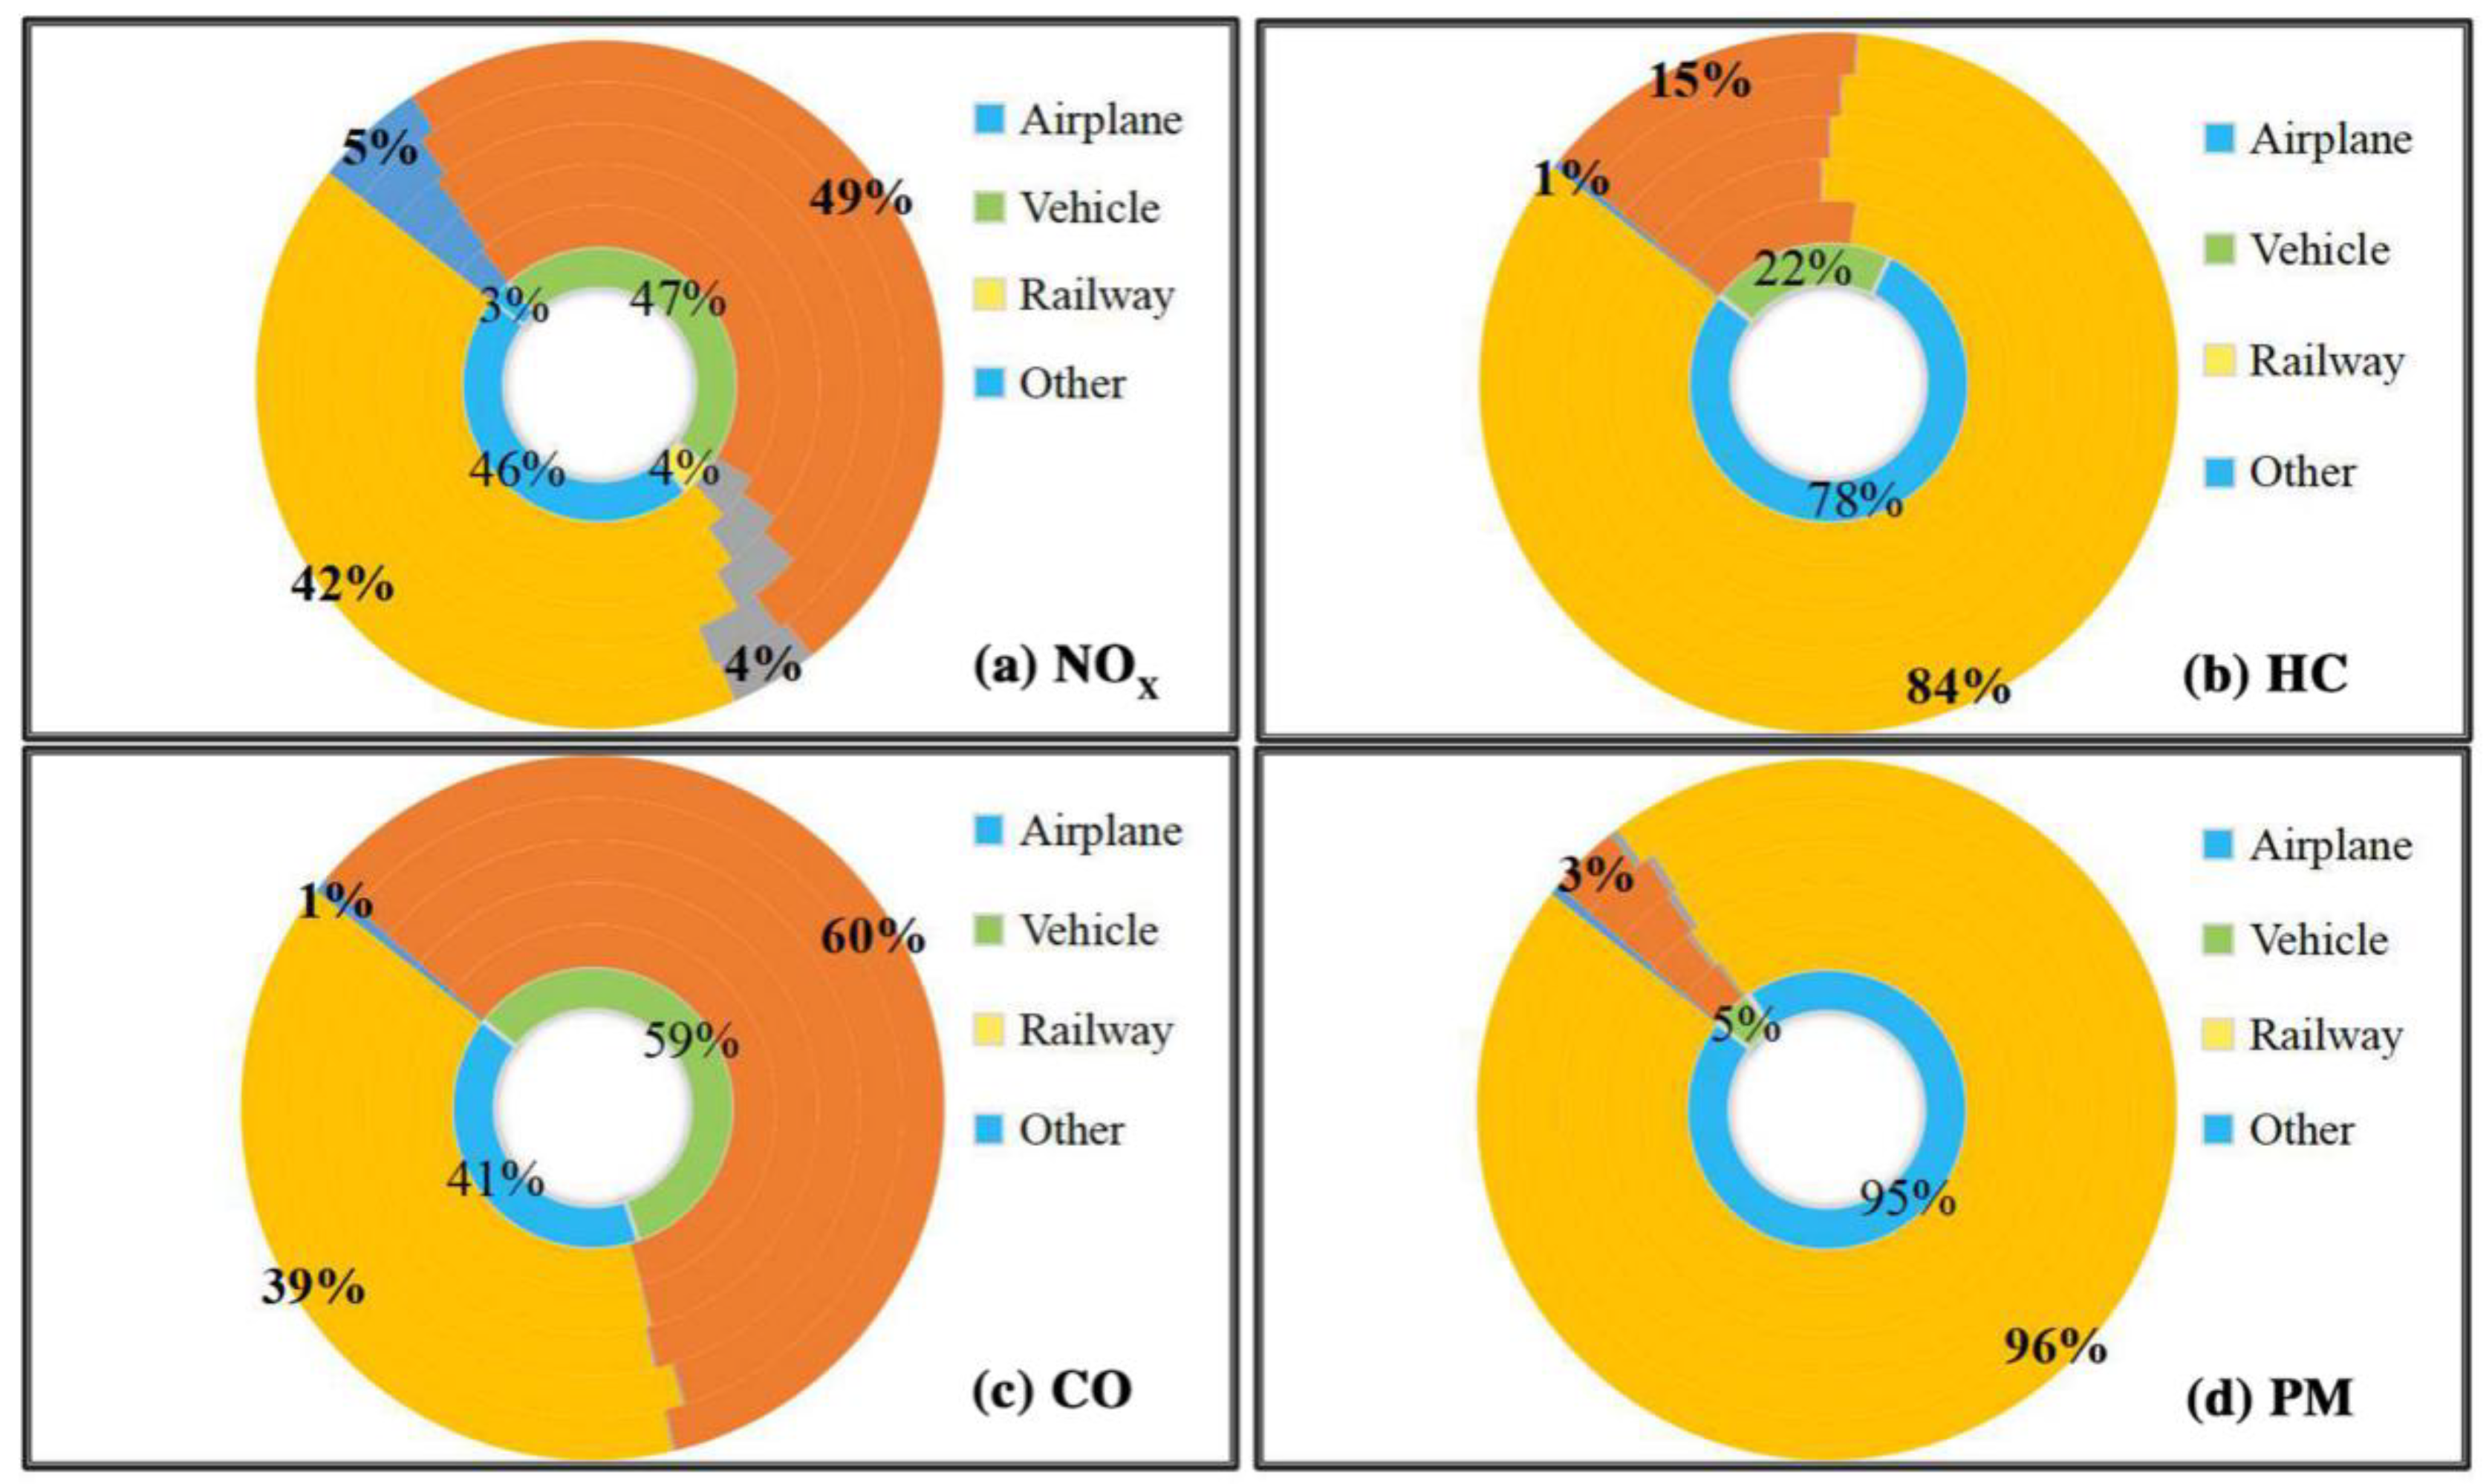
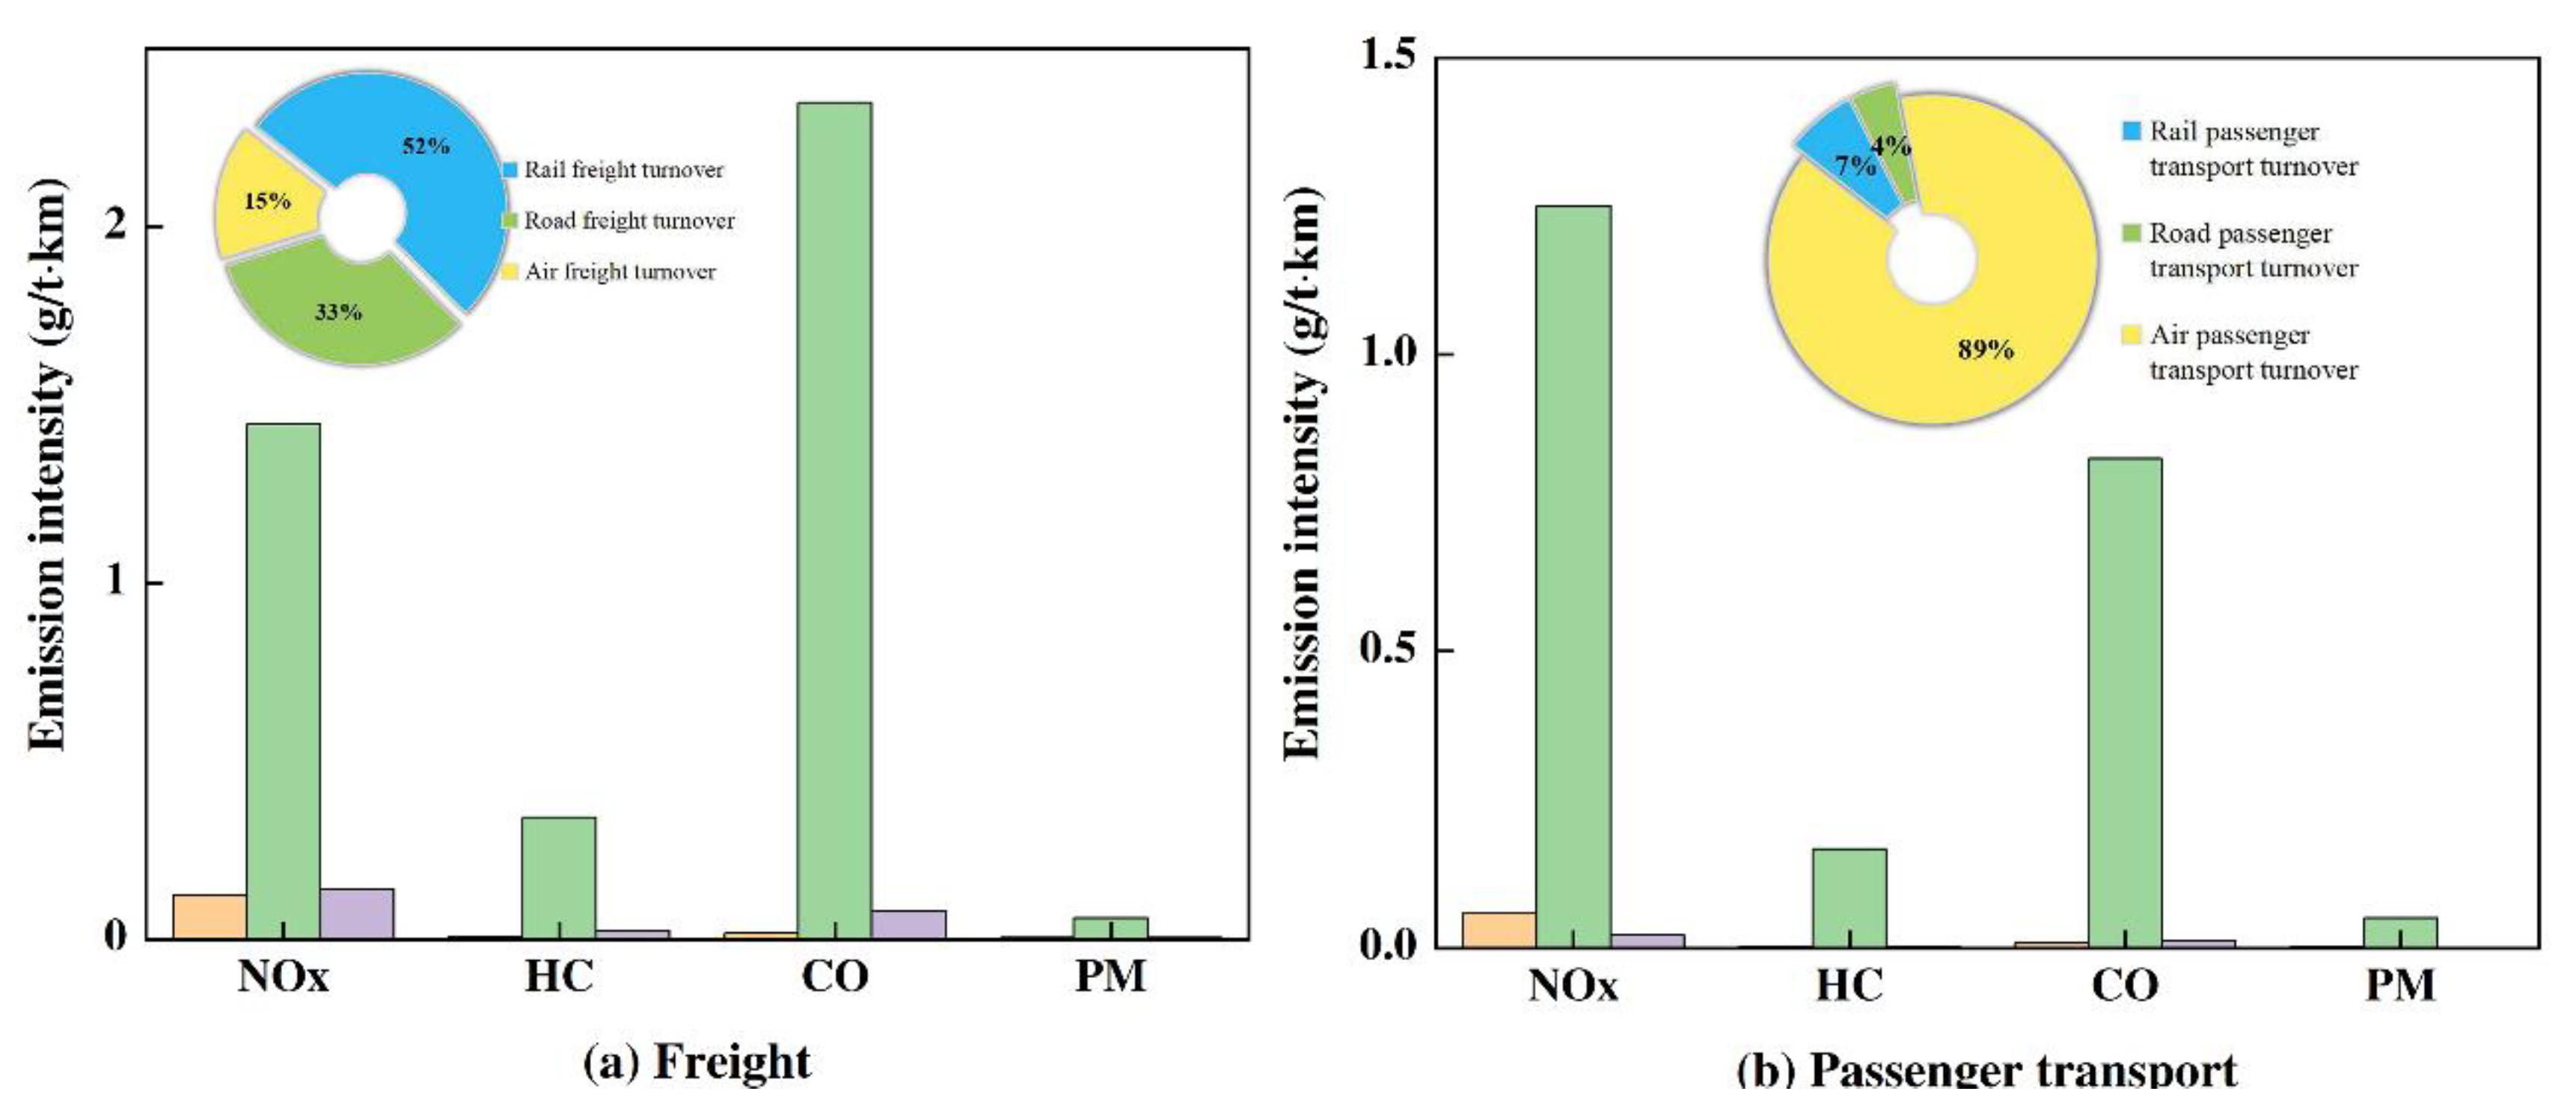
3.3. Comparison of the Emissions from Different Modes of Transportation

We observed obvious differences in the pollution emissions for different modes of transportation (Figure 5). The emission intensities of the four types of air pollutants per unit mileage of road freight and passenger transportation were the highest, at 4.2 and 2.3 g/person·km, respectively. These numbers were 28 and 33 times the railway freight and passenger transportation numbers, respectively, and 17 and 57 times the air freight and passenger transportation numbers, respectively. The intensity of the air freight pollutant emissions was greater than that of the railways, but that of the air passenger pollutant emissions was less than that of railway passenger transportation.
Specific to each pollutant, the NOX emission intensities from passenger and freight road transportation were still dozens of times higher than those of railways and airplanes, but the multiples were lower than that of other pollutants. The CO, HC, and PM emissions of railways and airplanes were relatively small, related to the higher combustion efficiency of their engines compared to trucks. From the comparison of the pollution emission intensities of the different transportation types, we found obvious environmental benefits from railway freight and air passenger transportation.
From comparison of the economic costs of unit mileage for the different types of transportation (Table 1) based on field investigations, it was observed that the cost of road freight transportation was the lowest, at 0.07 dollars per ton·kilometer, with the advantages of fast transportation and convenience [31]. These are the reasons for the high proportion of road freight transportation in Beijing. Railway freight transportation is more suitable for bulk freight and the transportation cost is approximately three times that of road freight. Railway connections from factories to departure stations and between arrival stations and destinations have not been developed. Road freight is needed for these connections, which restricts the volume of railway freight. The cost of air freight is approximately 10 times higher than that of road transportation, which is a limiting factor for the growth of its volume. In terms of passenger transportation, the costs of different transportation methods are relatively close, but they show the same trend as freight transportation. The cost of road passenger transportation is slightly lower than that of railways, and the cost of air passenger transportation is again the highest.

3.4. Control Strategies for the Transportation Sector

Considering the characteristics and contribution of air pollutant emissions from the transportation sector, the transportation structure must be adjusted and optimized and the prevention and control of pollution must be strengthened to reduce the emissions from the transportation sector. Specific emission reduction measures and recommendations are as follows:
  • The structure of transportation should be improved. As can be seen from the results of variation trends in emissions from the transportation sector, the transportation structure in Beijing is relatively simple and relies too much on road transportation. The proportions of railway freight and air freight are relatively low. These two methods have relatively low pollution emission intensities. Therefore, it is necessary to adjust and optimize the transportation structure and formulate overall plans to promote the construction of multiple types of transportation network, to coordinate the use of existing railway transportation resources, and to promote the priority use of railways to transport bulk freight for key industrial enterprises, logistics parks, and industrial parks.
  • The composition of road freight transportation vehicles needs to be adjusted and optimized. Diesel vehicles are still the main form of road freight transportation, emitting large amounts of NOX and PM based on calculations of emission intensity from different vehicle types. However, for short-distance freight transportation, road transportation is to some extent irreplaceable. The vehicle structure can nevertheless be adjusted to promote the replacement and update of diesel trucks that fall below the National III standard. The use of energy-saving, environmentally friendly, and new-energy trucks should be promoted by prioritizing them in related policies such as road accessibility.
  • Road passenger vehicles should be electrified. According to the comparison of emissions from different modes of transportation and motor vehicle types in Section 3.3, passenger vehicles, such as buses, taxis, and coaches, greatly contribute to HC and CO emissions due to their intensive use. Increasing the replacement of these passenger vehicles by electric vehicles can reduce their pollution emissions. These types of electric vehicle models are more mature in technology, and their battery life and supporting infrastructure are constantly being improved. As the technology continues to progress, the cost is decreasing.
  • The supervision and enforcement of emission standards need to be strengthened. Remote sensing monitoring, remote emission management terminals, and other methods can be used to monitor the emissions of freight transportation vehicles, thus effectively and quickly identifying excessive emissions. A closed-loop management system for maintenance and inspection should be established to ensure that vehicles with excessive emissions are repaired and rectified in a timely manner. Daily maintenance should be strengthened to ensure that emissions standards are met during actual use and to effectively reduce pollutant emissions.

4. Conclusions

As they are a major source of air pollution, reducing the emissions of primary air pollutants in the transportation sector would play an important role in improving Beijing’s air quality in the future. We estimated the emission variation characteristics for the transportation sector from 2013 to 2018 and their impacts on total emissions and air quality. We also compared and analyzed the emission intensity and economic costs of different types of transportation. On this basis, suggestions for reducing air pollution from the transportation sector were proposed.
Although the absolute value of primary air pollutant emissions from road transportation decreased with the optimization of the motor vehicle composition in Beijing, the transportation sector’s contribution to total emissions increased because its rate of reduction was lower than that of total emissions. The air pollutant concentrations measured by road traffic monitoring stations were much higher than those measured in other places, showing that road transportation had a greater impact on air quality. By comparing the emission intensities of various modes of transportation, we also observed that the pollutant emissions from passenger and freight transportation on roads were much higher than those of railway and air transportation.
As for future policy implications, reasonably arranging and optimizing the transportation structure, improving the capacities of railway and air transportation, and reducing the proportion of road transportation would all be conducive to pollution reduction and air quality improvement. Controls upon vehicle emissions need to be further strengthened. The introduction of strict supervision, the elimination of high-emission diesel vehicles through emission standards, and the replacement of fuel vehicles with electric vehicles have all played essential roles in decreasing emissions from the transportation sector.

Author Contributions

Conceptualization, Y.X.; methodology, Y.X. and X.C.; formal analysis, Y.X. and Y.Z.; data curation, Y.Z. and K.X.; writing—original draft preparation, Y.X.; writing—review and editing, Y.A. All authors have read and agreed to the published version of the manuscript.

Funding

This work was supported by the National Natural Science Foundation of China (21806012); the National Key Research and Development Program of China (2016YFC0201106); and the Science Foundation of Beijing Municipal Research Institute of Environmental Protection (2019B02).

Conflicts of Interest

The authors declare no conflict of interest.

Disclaimer

The opinions expressed in this manuscript are those of the authors and should not be considered to represent an official position of BJMEEB.

References

  1. Takeshita, T. Global Scenarios of Air Pollutant Emissions from Road Transport through to 2050. Int. J. Environ. Res. Public Health 2011, 8, 3032–3062. [Google Scholar] [CrossRef]
  2. Charron, A.; Polo-Rehn, L.; Besombes, J.L.; Golly, B.; Buisson, C.; Chanut, H.; Marchand, N.; Guillaud, G.; Jaffrezo, J.L. Identification and quantification of particulate tracers of exhaust and non-exhaust vehicle emissions. Atmos. Chem. Phys. 2019, 19, 5187–5207. [Google Scholar] [CrossRef] [Green Version]
  3. Guo, X.R.; Fu, L.W.; Ji, M.; Lang, J.L.; Chen, D.S.; Cheng, S.Y. Scenario analysis to vehicular emission reduction in Beijing-Tianjin-Hebei (BTH) region China. Environ. Pollut. 2016, 216, 470–479. [Google Scholar] [CrossRef] [PubMed]
  4. Keyte, I.J.; Albinet, A.; Harrison, R.M. On-road traffic emissions of polycyclic aromatic hydrocarbons and their oxy- and nitri- derivative compounds measured in road tunnel environments. Sci. Total Environ. 2016, 566, 1131–1142. [Google Scholar] [CrossRef] [PubMed] [Green Version]
  5. Sun, S.D.; Jin, J.X.; Xia, M.; Liu, Y.M.; Gao, M.; Zou, C.; Wang, T.; Lin, Y.C.; Wu, L.; Mao, H.J.; et al. Vehicle emissions in a middle-sized city of China: Current status and future trends. Environ. Int. 2020, 137, 105514. [Google Scholar] [CrossRef]
  6. BJMEEB (Beijing Municipal Ecological Environment Bureau). Beijing Has Released the Newest Source Apportionment Results of Ambient PM2.5 Concentrations. 2018. Available online: http://www.xinhuanet.com/politics/2018-05/15/c_1122832062.html (accessed on 10 February 2020).
  7. Zhao, S.; Xu, Y. Exploring the Spatial Variation Characteristics and Influencing Factors of PM2.5 Pollution in China: Evidence from 289 Chinese Cities. Sustainability 2019, 11, 4751. [Google Scholar] [CrossRef] [Green Version]
  8. Li, X.; Zhang, Q.; Zhang, Y.; Zheng, B.; Wang, K.; Chen, Y.; Wallington, T.J.; Han, W.J.; Shen, W.; Zhang, X.Y.; et al. Source contributions of urban PM2.5 in the Beijing-TianjinHebei region: Changes between 2006 and 2013 and relative impacts of emissions and meteorology. Atmos. Environ. 2015, 123, 229–239. [Google Scholar] [CrossRef] [Green Version]
  9. Zhang, S.J.; Wu, Y.; Wu, X.M.; Li, M.L.; Ge, Y.S.; Liang, B.; Xu, Y.Y.; Zhou, Y.; Liu, H.; Fu, L.X.; et al. Historic and future trends of vehicle emissions in Beijing, 1998–2020: A policy assessment for the most stringent vehicle emission control program in China. Atmos. Environ. 2014, 89, 216–229. [Google Scholar] [CrossRef]
  10. Yang, D.Y.; Zhang, S.J.; Niu, T.L.; Wang, Y.J.; Xu, H.L.; Zhang, K.M.; Wu, Y. High-resolution mapping of vehicle emissions of atmospheric pollutants based on large-scale, real-world traffic datasets. Atmos. Chem. Phys. 2019, 19, 8831–8843. [Google Scholar] [CrossRef] [Green Version]
  11. Liu, Y.H.; Liao, W.Y.; Lin, X.F.; Li, L.; Zeng, X.L. Assessment of Co-benefits of vehicle emission reduction measures for 2015–2020 in the Pearl River Delta region China. Environ. Pollut. 2017, 223, 62–72. [Google Scholar] [CrossRef]
  12. Song, C.B.; Ma, C.; Zhang, Y.J.; Wang, T.; Wu, L.; Wang, P.; Liu, Y.; Li, Q.; Zhang, J.S.; Dai, Q.L.; et al. Heavy-duty diesel vehicles dominate vehicle emissions in a tunnel study in northern China. Sci. Total Environ. 2018, 637, 431–442. [Google Scholar] [CrossRef] [PubMed]
  13. Wang, Y.J.; Zhang, S.J.; Hao, J.M. Air pollution control in China: Progress, challenges and paths. Environ. Sci. 2019, 32, 1755–1762. [Google Scholar]
  14. Cheng, S.F.; Lu, F.; Peng, P. A high-resolution emissions inventory and its spatio-temporal pattern variations for heavy-duty diesel trucks in Beijing, China. J. Clean. Prod. 2020, 250, 119445. [Google Scholar] [CrossRef]
  15. Jia, T.; Li, Q.; Shi, W.Z. Estimation and analysis of emissions from on-road vehicles in Mainland China for the period 2011-2015. Atmos. Environ. 2018, 191, 500–512. [Google Scholar] [CrossRef]
  16. Jing, B.Y.; Wu, L.; Mao, H.J.; Gong, S.N.; He, J.J.; Zou, C.; Song, G.H.; Li, X.Y.; Wu, Z. Development of a vehicle emission inventory with high temporal-spatial resolution based on NRT traffic data and its impact on air pollution in Beijing-Part 1: Development and evaluation of vehicle emission inventory. Atmos. Chem. Phys. 2016, 16, 3161–3170. [Google Scholar] [CrossRef] [Green Version]
  17. Gately, C.K.; Hutyra, L.R.; Peterson, S.; Wing, I.S. Urban emissions hotspots: Quantifying vehicle congestion and air pollution using mobile phone GPS data. Environ. Pollut. 2017, 229, 496–504. [Google Scholar] [CrossRef]
  18. Wang, M.L.; Li, S.Y.; Zhu, R.C.; Zhang, R.Q.; Zu, L.; Wang, Y.J.; Bao, X.F. On-road tailpipe emission characteristics and ozone formation potentials of VOCs from gasoline, diesel and liquefied petroleum gas fueled vehicles. Atmos. Environ. 2020, 223, 117294. [Google Scholar] [CrossRef]
  19. Zhang, S.J.; Wu, Y.; Liu, H.; Huang, R.K.; Un, P.K.; Zhou, Y.; Fu, L.X.; Hao, J.M. Real-world fuel consumption and CO2 (carbon dioxide) emissions by driving conditions for light-duty passenger vehicles in China. Energy 2014, 69, 247–257. [Google Scholar] [CrossRef]
  20. Fameli, K.M.; Kotrikla, A.M.; Psanis, C.; Biskos, G.; Polydoropoulou, A. Estimation of the emissions by transport in two port cities of the northeastern Mediterranean, Greece. Environ. Pollut. 2020, 257, 113598. [Google Scholar] [CrossRef]
  21. Hatzopoulou, M.; Miller, E.J. Linking an activity-based travel demand model with traffic emission and dispersion models: Transport’s contribution to air pollution in Toronto. Transp. Res. D Transp. Environ. 2010, 15, 315–325. [Google Scholar] [CrossRef]
  22. Kelly, F.J.; Zhu, T. Transport solutions for cleaner air. Science 2016, 352, 934–936. [Google Scholar] [CrossRef] [PubMed] [Green Version]
  23. Vallamsundar, S.; Lin, J.; Konduri, K.; Zhou, X.; Pendyala, R.M. A comprehensive modeling framework for transportation-induced population exposure assessment. Transp. Res. D Transp. Environ. 2016, 46, 94–113. [Google Scholar] [CrossRef]
  24. Wu, Y.; Zhang, S.J.; Li, M.L.; Ge, Y.S.; Shu, J.W.; Zhou, Y.; Xu, Y.Y.; Hu, J.N.; Liu, H.; Fu, L.X.; et al. The challenge to NOX emission control for heavy-duty diesel vehicles in China. Atmos. Chem. Phys. 2012, 12, 9365–9379. [Google Scholar] [CrossRef] [Green Version]
  25. Fan, F.; Lei, Y. Decomposition analysis of energy-related carbon emissions from the transportation sector in Beijing. Transp. Res. Part D 2016, 42, 135–145. [Google Scholar] [CrossRef] [Green Version]
  26. BMBS (Beijing Municipal Bureau of Statistics). Beijing Statistical Yearbook. 2019. Available online: http://202.96.40.155/nj/main/2019-tjnj/zk/indexch.htm (accessed on 11 February 2020).
  27. Timmers, V.R.J.H.; Achten, P.A.J. Non-exhaust PM emissions from electric vehicles. Atmos. Environ. 2016, 134, 10–17. [Google Scholar] [CrossRef]
  28. Air Quality Expert Group. Non-Exhaust Emissions from Road Traffic. 2019. Available online: https://uk-air.defra.gov.uk/assets/documents/reports/cat09/1907101151_20190709_Non_Exhaust_Emissions_typeset_Final.pdf (accessed on 15 February 2020).
  29. Xue, Y.F.; Zhang, S.H.; Zhou, Z.; Wang, K.; Liu, K.Y.; Wang, X.Y.; Shi, A.J.; Xu, K.L.; Tian, H.Z. Spatio-temporal variations of multiple primary air pollutants emissions in Beijing of China, 2006–2015. Atmosphere 2019, 10, 494. [Google Scholar] [CrossRef] [Green Version]
  30. Beijing Municipal Government. Clean Air Action Plan in Beijing, 2013–2017. 2017. Available online: http://www.beijing.gov.cn/zhengce/zfwj/zfwj/szfwj/201905/t20190523_72673.html (accessed on 14 February 2020).
  31. Lee, S.; Hwang, T. Estimating emissions from regional freight delivery under different urban development scenarios. Sustainability 2018, 10, 1188. [Google Scholar] [CrossRef] [Green Version]
Figure 1. Distribution of roads, railways, and airports in Beijing.
Sustainability 12 04111 g001
Figure 2. Ambient air pollutant concentrations of all monitoring stations and traffic monitoring stations from 2013 to 2018.
Sustainability 12 04111 g002
Figure 3. Changes in the major air pollutant emissions and contributions from the transportation sector in Beijing, 2013–2018: (a) NOX; (b) HC; (c) CO; (d) PM.
Sustainability 12 04111 g003
Figure 4. Changes in the contribution of air pollutant emissions from the transportation sector to total emissions, 2013–2018: (a) NOX; (b) HC; (c) CO; (d) PM.
Sustainability 12 04111 g004
Figure 5. Pollutant emission intensity for different modes of transportation (a) Freight; (b) Passenger transport.
Sustainability 12 04111 g005
Table 1. Comparison of the economic costs of different types of transportation.
Type of TransportationTransportation CostUnit
FreightRailway0.18Dollar/ton·kilometer
Road0.07
Air0.67
PassengerRailway0.07Dollar/person·kilometer
Road0.06
Air0.11

