1. Introduction
According to UNESCO [
1], cultural heritage (CH) is the legacy of physical artifacts and intangible attributes of a group or society that are inherited from past generations, maintained in the present and bestowed for the benefit of future generations. Tangible CH encompasses natural and archaeological sites, historic cities and buildings, monuments, artworks and a plethora of artifacts, located in museums around the word. CH is an important resource for economic growth, employment, new skills, and social cohesion, offering the potential to revitalize urban and rural areas and promote sustainable tourism [
2]. Furthermore, CH provides significant information on our origin, knowledge, practices, and traditions. Therefore, CH preservation is an important task in both its tangible and intangible facets [
3,
4]. Three dimensional (3D) reconstruction is a widely adopted technique in the case of tangible CH content.
Three dimensional reconstruction from multiple images is the process of capturing the shape and appearance of real objects [
5]. Other definitions include the creation of virtual model of a lost or partially lost building/artifact [
6,
7,
8], and virtual reconstruction, which replicates an environment that simulates physical presence [
9]. In this paper, we focus on the former case, i.e., 3D reconstruction from multiple images. The image sets required for such a task are available online in either repositories (e.g., Flickr) or social media (e.g., Facebook, Twitter). There is only a major drawback: the sources are unrefined; limited/incorrect tags, noise, occlusions, nonexistent angle-of-view, and low resolution are the main problems. In our case, we address all these problems using Twitter as the image repository.
Twitter is a popular and widely used microblogging service, as manifested by the hundreds of millions of new tweet microposts that are posted online daily, providing various research opportunities in data extraction and information retrieval [
10,
11,
12]. In addition, tweets may contain photos. Thus, the Twitter medium can be seen as a network of “distributed cameras.” Ideally, a set of images supporting an adequate 3D reconstruction can be retrieved from Twitter. In the sequel, the Structure from Motion (SfM) algorithm can be exploited to provide the 3D model [
13]. Yet, prior to any early conclusions, we should consider the limitations of such an approach.
Generally, 3D reconstruction of a CH asset from images-on-the-wild was investigated [
14]. However, focusing on Twitter-located-resources is a challenging process mainly because the images were collected for various purposes but not digitization [
14]. Therefore, they are i) inadequate as raw data, since several parts of the CH objects are missing; ii) present a lot of noise (e.g., occlusions of any type); and iii) were captured under quite different conditions, i.e., varying resolution, image calibration, and registration. Although SfM is able to handle noisy images, computational complexity is a problem. As such, content-based retrieval and filtering tools need to be implemented to select only a small subset from the available images, i.e., the ones that contribute most to the 3D modeling.
In this paper, we propose a novel mechanism for automatic 3D reconstruction of important cultural sites and monuments from photos originating from tweet messages. Nowadays, users often post photos from sites they visit and comment on them using Twitter. Therefore, a significant number of images are available online, allowing for 3D reconstruction of CH objects. The core idea is to see the tweets as “distributed social sensors” and, thus, exploit the huge volume of such information for fast—and approximate—digitization of CH content.
The remainder of the paper is organized as follows:
Section 2 describes previous works. An overview of the proposed approach is presented in
Section 3.
Section 4 describes the image collection process as an event detection problem, whereas
Section 5 presents the content-based filtering step for representative image selection for 3D reconstruction.
Section 6 provides an experimental evaluation of the proposed methods, and
Section 7 concludes the paper with a summary of findings.
2. Related Work
Previous work reviewed here can be grouped into two main categories: one referring to event detection on Twitter and one regarding content-based filtering.
2.1. Event Detection on Twitter
Any tweet event detection algorithm could be efficiently implemented in two main steps. Firstly, we have the textual characterization of tweet content, which is accomplished through the extraction of textual features that categorize the significance of a word in tweets. The second step involves the development of learning strategies for event retrieval by analyzing the fluctuations in the appearance count of certain words.
Text characterization is usually implemented using the term frequency–inverse document frequency (TF–IDF) metric [
15] or distributional features [
16]. Yet, both approaches are not appropriate for the Twitter case. Tweets are short messages, usually less than 280 characters [
17], leading to statistical inaccuracies in estimated traditional document metrics. At this point, there are two more topics we should consider: following and retweet features. The former allows users to subscribe to other users’ tweets, i.e., follow the tweets. The latter gives users the ability to forward an interesting tweet to their followers.
A family of approaches trying to structure tweet content is called news content aggregators. The work of [
18] proposes a spatial–temporal algorithm to classify tweets into geographical clusters and then proceed to produce local news, while the work of [
19] introduces a TweetSieve demo, in which a user can submit textual queries. However, both approaches are in fact indirect event detection mechanisms that return tweet posts containing words of a submitted query instead of identifying the most important events. Ranking the tweets according to predefined importance scores is also considered, by using either a combination of tweet properties (e.g., retweets, followers) [
20] or applying additional features, such as URL links [
21].
Elaborating more on the event-detection algorithms for Twitter, two main approaches exist [
22]: document-based and feature-based. The first approach detects events by clustering tweet posts, while the second exploits the distributions of words by extracting a pool of key words that present similar temporal behavior [
23]. The proposed event detection method in this paper exploits feature-based metrics. As such, the following paragraphs focus on the specific topic.
The most commonly used static feature-based methods use latent Dirichlet allocation (LDA) [
24]. In particular, [
25,
26,
27,
28] combined LDA with graph models, appropriate metrics (exploiting specific Twitter’s parameters, such as followers), and features able to identify the most important events within tweets. Geographic-based topic analyses using LDA models were presented in [
29,
30]. The works of [
31,
32] modify the LDA metric to cover sequential summarization of trendy stories over Twitter, and the location–time constrained topic (LTT) for capturing the spatial and temporal content properties, respectively.
The work of [
23] introduces a frequent pattern mining method. Alternatively, the authors of [
33] analyze temporal feature trajectories for event detection and then apply the discrete Fourier transformation (DFT) on the time–word signals. In this case, events are detected by analyzing spikes in the frequency domain. However, when using DFT, time information is lost. In the same direction, the work of [
22] exploits a clustering methodology based on wavelet-transformed word’s distribution signals in order to identify events from a collection of tweet posts.
Recently, an event photo mining approach was proposed [
34], where tweets, including geotags and photos, were mined to detect various events. Spatial and temporal analysis is presented in [
35], while one of the first approaches of visual detection of events in Twitter messages is given in [
36]. Finally, clustering methods are proposed in [
37,
38,
39]. In [
40], 3D reconstruction of cultural images is accomplished exploiting tweet messages. This work, however, focuses only a simple theoretic information metric, exploits limited advances in graph theory regarding the analysis of the content, and introduces a small set of results.
2.2. Content-Based Filtering
Many works in the content-based filtering field start from an initial retrieved image set and then apply hierarchical clustering to filter out images. However, the efficacy of such an approach inherently depends on the visual properties of the reference image(s) and the way the data were captured, e.g., camera parameters, lighting conditions, and existence of occlusions. In [
41], a content-based retrieval system was presented with the objective to recall all views (instances) of an object in a large database upon a query exploiting visual similarities. Video content-based retrieval was introduced in [
42,
43], while a mobile agent was presented in [
44]. All the methods, however, need a query to get the retrievals, something which is not relevant in our approach.
In this context, [
45] uses image signatures to form clusters of photos that share similar properties. The grouping exploits color information. On the other hand, the work of [
46] uses fuzzy support vectors machines for the unsupervised clustering. These approaches share the same limitation; they use global image features to encode visual content. Global visual representation fails to describe the different view instances of an object, since both the geometry of the foreground, as projected onto the 2D image plane, and the content of the background are quite dissimilar. A fast content-based image retrieval system that relies on hierarchical embedded image clouds is presented in [
47]. The work of [
48] integrates wavelet transforms, local binary patterns, and moments for an efficient content-based image retrieval system.
In this paper, we need to identify and cluster different views of a CH monument. Such an approach was initially introduced by [
14]. The key difference of this approach to the present one is the use of a Twitter-based event detection scheme so as to extract key textual events upon which the clustering will be accomplished. This constitutes one of the main originalities of this paper; a social network is exploited as a medium for rapid 3D reconstruction of cultural heritage items.
3. An Overview of the Proposed Approach
Our approach towards 3D reconstruction over Twitter resources is decomposed into two innovative steps, plus a one for reconstruction. The first step refers to the application of a Twitter-oriented event detection algorithm [
49] so as to classify tweets with respect to their content and then extract images describing a particular CH site. The second step involves the application of an automatic algorithm [
14] that will cluster the selected images into main groups with respect to the orientation of the cultural site they view, removing outliers so as to accelerate the time of 3D reconstruction. The final step involves the use of the SfM algorithm, which is a photogrammetric range imaging method for calculating three dimensional structures from two-dimensional image sequences, possibly coupled with local motion signals [
50].
At first, an event detection algorithm from tweets, based on new information characterization metrics, is utilized. The new metrics are based on the TF–IDF metric [
15], appropriately modified to fit tweet characteristics such as number of followers and retweets, as in [
49]. Then, a wavelet transformation is exploited to localize the signals in time and frequency domain, simultaneously. Recall that tweets are not synchronized messages. Thus, localization is important prior to any event–cluster approach implemented.
A graph–cut approach, over the calculated metrics’ scores, is applied to identify the various events. In order to create the graph, the cross-correlation criterion serves as the distance metric; it can express the similarity of two feature vectors, while being invariant in scale and translation. Once the graph over tweets is completed, clustering can be interpreted as a graph partitioning problem. The adopted graph cut problem is formulated in a way that an optimal solution can be found so that intracluster elements present the maximum coherence, while the intercluster elements present the minimum one. As such, no feedback is required for the definition of number of clusters. In this graph partitioning problem, we contribute by allowing for a multiassignment clustering since, in our context, one word can belong to several clusters (events).
Multiassignment clustering is achieved by introducing a modification of the spectral clustering algorithm. In our approach, we estimate the membership function of a word as the degree to which it may belong to an event, and then we obtain a discrete approximation to this continuous solution that satisfies the multiassignment clustering property. Finally, tweets of similar content (i.e., located at the same cluster) are organized further to create 3D models by “structuring” image content of the same object/place.
The creation of any 3D model is straightforward. Initially, we analyze the image content through suitable features and locate correspondences between similar images. Then, to remove image outliers from the retrieved tweet photos, we consider each image as a point onto a multidimensional hyperspace manifold, as in [
14]. The coordinates of each image point on the manifold express the position of the images on the hyperspace. Therefore, they constitute a clear indicator of how close the images are, allowing for the implementation of a density-based approach for the outlier detection.
The distribution of the tweet photos share similar textual information. The first is derived from the tweet events in our case, instead of [
12] where a simple textual information is exploited to discard unrelated images. This is one of the main innovation elements of this work since we relate the properties of Twitter for the 3D reconstruction using unstructured, uncalibrated, and not properly annotated images. The advantages of Twitter as the selected social network for the discussed application pertain to its API, as well as the brevity of the posts (tweets), which facilitates the application of event detection methods, in contrast with other social media, e.g., Facebook, where posts are far more text-heavy. One of the drawbacks of this approach (not just using Twitter, but of crowdsourcing for images) is that crowdsourced images do not equally cover all surfaces of a cultural monument, since the majority of the photos posted on social media depict the facades of monuments that are most accessible by visitors (e.g., front face vs. roofs). This limitation unavoidably leads to an imbalanced reconstruction density, whereby the more popular and accessible parts of a monument are reconstructed in a more precise manner compared to the remaining ones. However, creating a fully accurate 3D model with equal reconstruction density necessarily requires sophisticated equipment that would allow acquisition of images from all parts to be processed using photogrammetric techniques; such an approach entails a far larger scale of resources and expertise and has a different scope compared to the proposed work.
In the sequel, we leverage a density-based spatial clustering algorithm to eliminate outliers. In particular, we select the density-based spatial clustering of applications with noise (DBSCAN) algorithm, because of its robustness to outliers. For visual analysis, the ORB (Oriented FAST and Rotated BRIEF) descriptor is utilized. In the next phase, the compact subspace is partitioned regions including salient geometric perspectives of each asset. The goal is to find representative views and then these views are fed as input to the SfM algorithm for 3D reconstruction.
4. Image Collection as a Twitter Event Detection Problem
4.1. Tweet-Post Characterization
There are specific research challenges that have to be addressed for an adequate tweet-post characterization. First, tweet messages are often unstructured, meaning that words of an event do not appear absolutely synchronized, requiring new forms of presentation to compensate for these temporal variations. Second, multiassignment clustering approaches are needed since one word can belong to several events. This is in contrast to conventional one-class assignment clustering methods. Third, since words belong to several events, clusters are not well-separable, requiring advanced methods, such as graph partitioning.
The adopted information theoretic metrics, for tweet-post characterization, are based on modifications of the TF–IDF score. TF–IDF score is a statistical measure that evaluates how important a word is to a document in a collection of documents. The importance of a word proportionally increases with the number of times the word appears in a document but is logarithmically offset by the frequency of the word in the corpus of documents. For the sake of completeness, consider the following example.
We are given a document containing 100 words wherein the word “Cat” appears 3 times. The term frequency (TF) for the word “Cat” is then 0.03. Now, assume that we have a corpus of 10 million documents and the word “Cat” appears in one thousand documents. Then, the inverse document frequency (IDF) is calculated as log(10,000,000/1,000) = 4, and the TF–IDF score is the product of these quantities: 0.03 × 4 = 0.12. Thus, TF expresses how often a word appears within the tweets extracted at the current time instance k, while IDF expresses the information contained in the word based on tweets gathered at previous time instances. If a given word is common, IDF takes low values to compensate for the high values expected for TF. On the contrary, if the word is rare (thus the reader gets a surprise, or “more information,” when he/she sees it), IDF is high and strengthens the TF term. Consequently, TF–IDF takes high values for words that are not statistically frequent in the previous collections of tweets, but present high appearance rate at the current time instances k.
4.2. Twitter-Based Information Metrics
As explained in
Section 4.1, TF–IDF is not suitable for the Twitter case. Consequently, the same modifications as in [
49] are adopted. The first theoretic metric,
, is defined as:
where
counts the number of tweets that contains a specific word
within the
-th time interval compensating over the number of tweets that include this word over
previous time intervals. The second metric
measures the frequency of the word
in the tweet posts compensating over the frequency of
previous time intervals:
Variable counts how many times a word appears in the tweets and is the total number of words that appear within the tweets.
The third metric
takes into consideration the significance of a tweet as expressed either by the number of followers or by the number of retweets it produces. The number of followers, denoted as
with
, indicates the credibility of the author of the tweet. The number of retweets
is a metric for ranking the importance of the textual content posted on the tweets. The variable
is defined as:
Variable
is defined as:
Variables
and
are the normalized versions of number of followers and retweets over the
-th time interval. They are defined as:
and
The outputs of the information theoretic metrics, over the long period of intervals, are utilized for the calculation of a signal , which measures the impact of the word on the posted tweet content. Please note that and are different variables; is a time window over which we evaluate the time series signal of a word . Instead, refers to a time period over which we take statistics for calculating the term IDF of Equations (1)–(3).
Noise variations, due to time shifts (i.e., temporal variations), of a word are observed. Such variations are caused by temporal delays and the fact that messages posted on the Twitter are not synchronized. Discrete wavelet transform (DWT) is applied on the gross signal of the information theoretic metrics, as in [
49], to mitigate such noise effects. DWT is chosen since it can localize both time and frequency domains simultaneously. In what follows, let us denote
as the wavelet transformed signal of
.
4.3. Defining the Similarity Metric
Euclidean distance is a commonly used approach in many cases, e.g., [
51,
52,
53]. Yet, the main limitation such distance is that it does not directly express the similarity between two feature vectors. Euclidean distance is sensitive to feature vector scaling and/or translation. For this reason, normalized cross-correlation has been widely used as it remains unchanged with respect to feature vector scaling or translation. For example, adding to or multiplying by a constant value all elements of a feature vector affects the Euclidean distance but not the normalized cross-correlation.
The normalized cross-correlation
between the two words’ signals
and
is given by:
Thus, in the following, we adopt the normalized cross-correlation distance as the similarity metric. Initially, we discuss how the signal behaves on the cross-correlation metric. We recall that signal refers to one of the three metrics (see Equations (1)–(3)).
4.4. Multiassignment Graph Partitioning Approach to Event Detection in Twitter
For the detection of the events, we exploit concepts of the graph partitioning problem under a multiassignment perspective. More specifically, if we denote as
the graph, the vertex of which
corresponds to the set of
different words and its edges
refers distances between two words
, as described in
Section 4.3 then our goal is to divide the graph into
partitions (clusters), each of which will contain words that were extracted from the tweet-post collection and present similar burst patterns. Since one word can belong to more than one event, a multiassignment graph partitioning is adopted [
49].
More specifically, the partitioning is carried out using concepts of spectral clustering [
54] and properly modifying them to cope with the multiassignment graph partitioning problem. Spectral clustering finds the most suitable clusters so as to maximize the coherence for all nodes belonging to a partition while simultaneously minimizing the coherence of the nodes assigned to different partitions. For the minimization, the graph is represented as a matrix and then the Ky Fan theorem [
55] is applied to decompose the matrix from into optimal solutions based on an eigenvalue decomposition approach. The key problem of such optimization is that it gives the optimal solution in a continuous form [
56]. In our tweet-based event detection problem, each message belongs to a limited number of events. To address this, we need to approximate the solution under a multiassignment clustering framework. This is addressed by allowing each row of the matrix to have more than one unit element. In the sequel, an iterative methodology is carried out to recover the optimum discrete approximate solution. This methodology recursively estimates an optimal rotation matrix in a way that the continuous solution will be as close as possible to the discrete one. This optimization can be solved through a singular value decomposition problem as described in [
49].
Spectral clustering is selected in lieu of other partitioning methods such as k-means and min cut graph. More specifically, in [
49], we compared the effect of different clustering methods on event detection performance from tweets on the basis of precision–recall scores on a ground truth dataset. The analysis concludes that the multiassignment graph partitioning algorithm outperforms other simpler forms of partitioning that use objective metric criteria. This is the reason for selecting this clustering scheme than other approaches, as it seems to better “model” the structure of tweet messages.
5. Representative Image Selection as a Content-Based Filtering Problem
Having detected the events from the tweet messages, the next step of our approach is to identify the most relevant images on a given CH asset, removing the outliers, and finding the most representative views of the monument. To achieve this objective, the following steps are incorporated in our research.
5.1. Visual Modeling and Image Representation onto Multidimensional Manifolds
Local visual descriptors are used to capture the different geometric perspectives of an object. The calculated local similarities, among the selected images, are required for a 3D reconstruction. In this paper, we constrained the problem so that the selected images lay on the same event, which represents the same touristic location and monument. ORB descriptor [
57] is utilized since is fast and, simultaneously, robust. Let us now assume that we have two images named
and
, selected from different tweets that refer to the same cultural object. In order to find the corresponding points for these two images, multiprobe locality sensitive hashing [
58] is used for nearest-neighbor search exploiting the Hamming distance. The proposed approach is used because ORB keypoints are described by a binary pattern.
For a given dataset, all possible pairs of images are considered for a two-way matching of the corresponding points. The corresponding points allow for the calculation of a similarity metric among all images, as presented in [
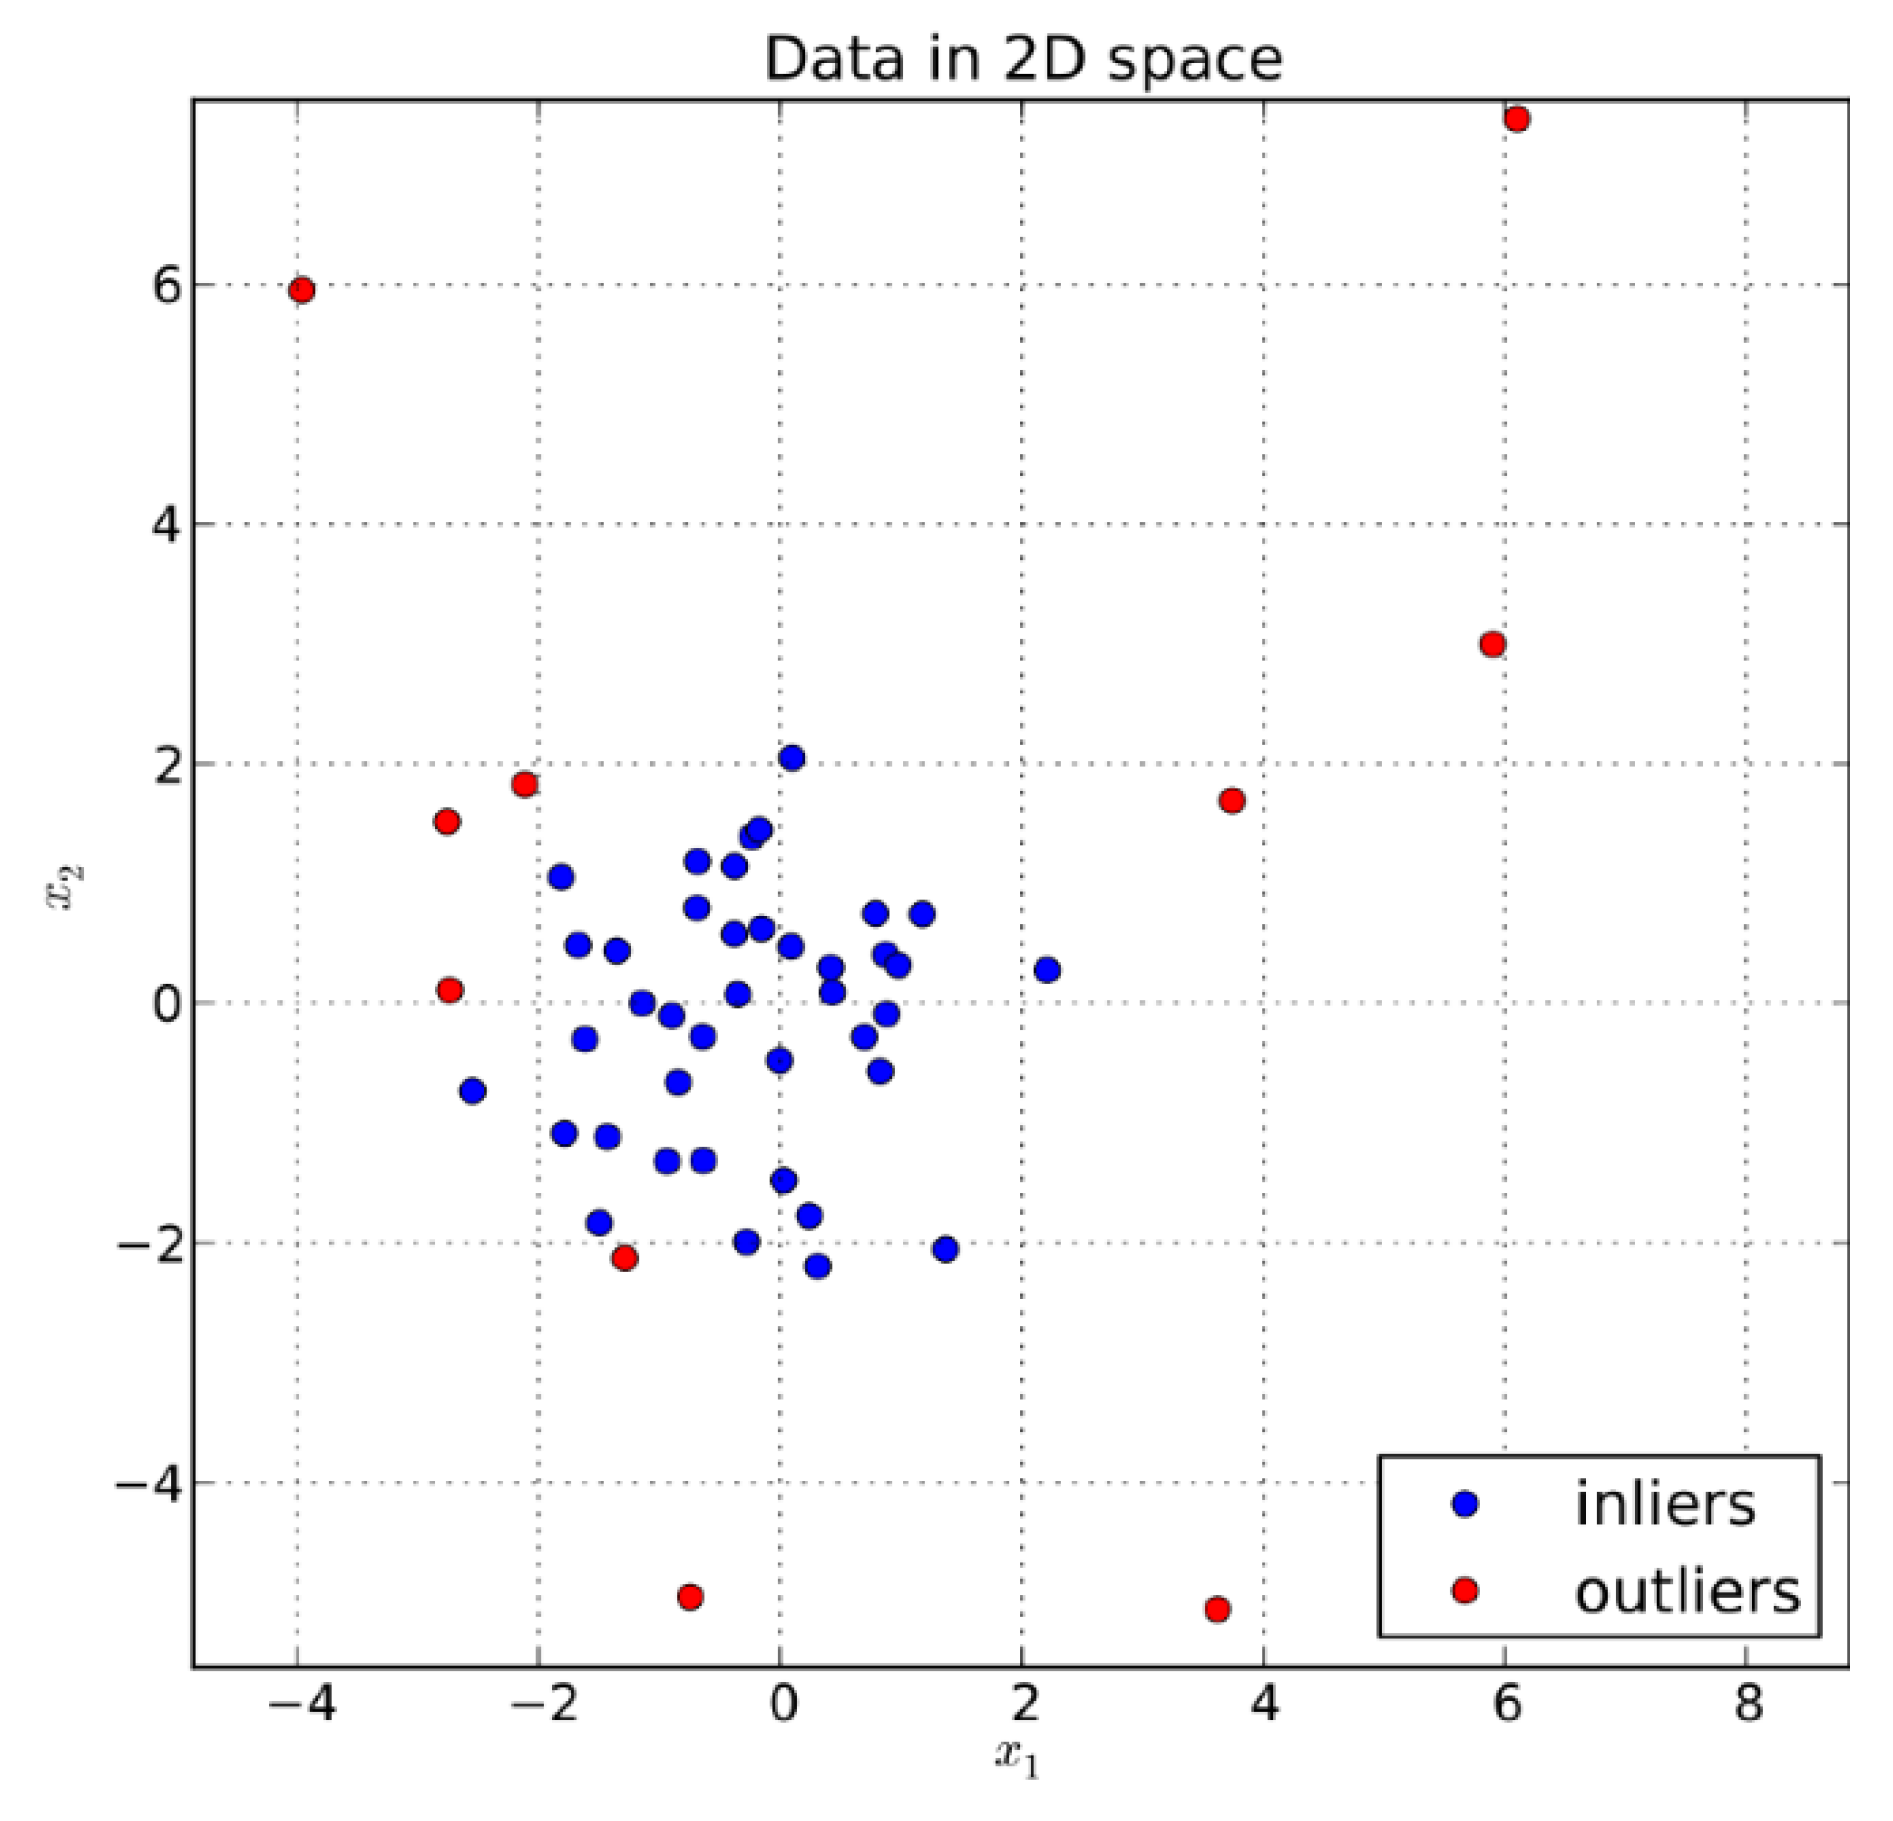
14]. If the two images are visually similar, the respective values in the similarity matrix will be small. This means that if images are represented as points onto a multidimensional manifold, then visually similar images will belong to high spatial density subspaces, and image outliers that will be spread out. If we define as
a matrix containing the coordinates of all
images in the dataset, the classical multidimensional scaling (cMDS) [
59] can be used to establish a connection between the space of the distances and the space of Gram matrix
, as proven in [
60].
Figure 1 depicts the position of inliers and outliers in a 2D space case when applying the classical multidimensional scaling (cMDS) on a set of image data.
5.2. Additional Content Refinement and Extraction of Representative Views
Outlier removal exploits density properties of the projected images. In particular, we assume that outliers lie onto isolated regions. Then, we extract these outliers by identifying corresponding areas as in [
14]. To further improve the outlier removal accuracy, we implement a variation of the density-based spatial clustering of applications with noise (ST–DBSCAN) algorithm [
61]. Then, we apply a graph-partitioning algorithm for finding the most diverse views of a cultural heritage asset. The partitioning is applied on the detected compact subset of relevant images as explained in the previous paragraph. The main goal of this partitioning is to separate the image data into clusters of representative views of an object.
The discrimination among representative views of an object is achieved by using spectral clustering. In this way, clustering is addressed as a graph partitioning problem, hence no assumptions are made regarding the generated clusters. Let us, again, assume a graph , where V denotes the vertices of the graph and E the edges of the graph. In this case, vertex set V includes the images of the detected compact subset as extracted by DBSCAN. We also denote as the weight of the edge connecting the with the vertex. In this representation, edge weight is equal to the similarity distance between the descriptors of the images corresponding to the vertices i and j. The spectral clustering approach is similar to the one adopted for event detection. However, in this case the conventional spectral approach is followed since we do not need a multiassignment partitioning.
5.3. Twitter Content Copyright Issues
An important issue pertains to social media content and copyright issues. Today, there is a tremendously vast amount of data available on social media and posted daily on Twitter, but simultaneously there is a confusion regarding if these data are for public domain, fair user, creative commons, or even copyrighted [
62]. The key question is if “will a short description of 140 characters cause intellectual property rights infringement”? This question cannot be answered with the same manner for all cases and for all countries.
In the US, short quotations or a public Twitter message would most likely qualify as fair use [
63]. This is in accordance with the 1961 Report of the Register of Copyrights on the General Revision of the US Copyright Law that cites examples of activities that courts have regarded as fair use, such as, for instance, “quotation of short passages in a scholarly or technical work, for illustration or clarification of the author’s observations; reproduction by a teacher or student of a small part of a work to illustrate a lesson; reproduction of a work in legislative or judicial proceedings or reports; incidental and fortuitous reproduction, in a newsreel or broadcast, of a work located in the scene of an event being reported.”
In other words, the fair use principle allows others to use copyrighted material but under a reasonable manner and without the owner’s consent mainly for teaching, scholarship, and research purposes [
62]. This restriction does not refer to a certain amount of words, but the restriction is applied to a case-to-case basis. It all depends on the circumstances [
63].
6. Experimental Results
In the following, we first evaluate the event detection algorithms from tweets (
Section 4) and then the proposed content-based filtering method (
Section 5) that eventually lead to 3D reconstruction after employing SfM techniques. In this work, VisualSFM was used, a GUI application for 3D reconstruction using SfM, exploiting multicore parallelism for feature detection, feature matching, and bundle adjustment [
64].
6.1. Evaluation of Event Detection on Twitter
6.1.1. Evaluation under a Controlled Environment
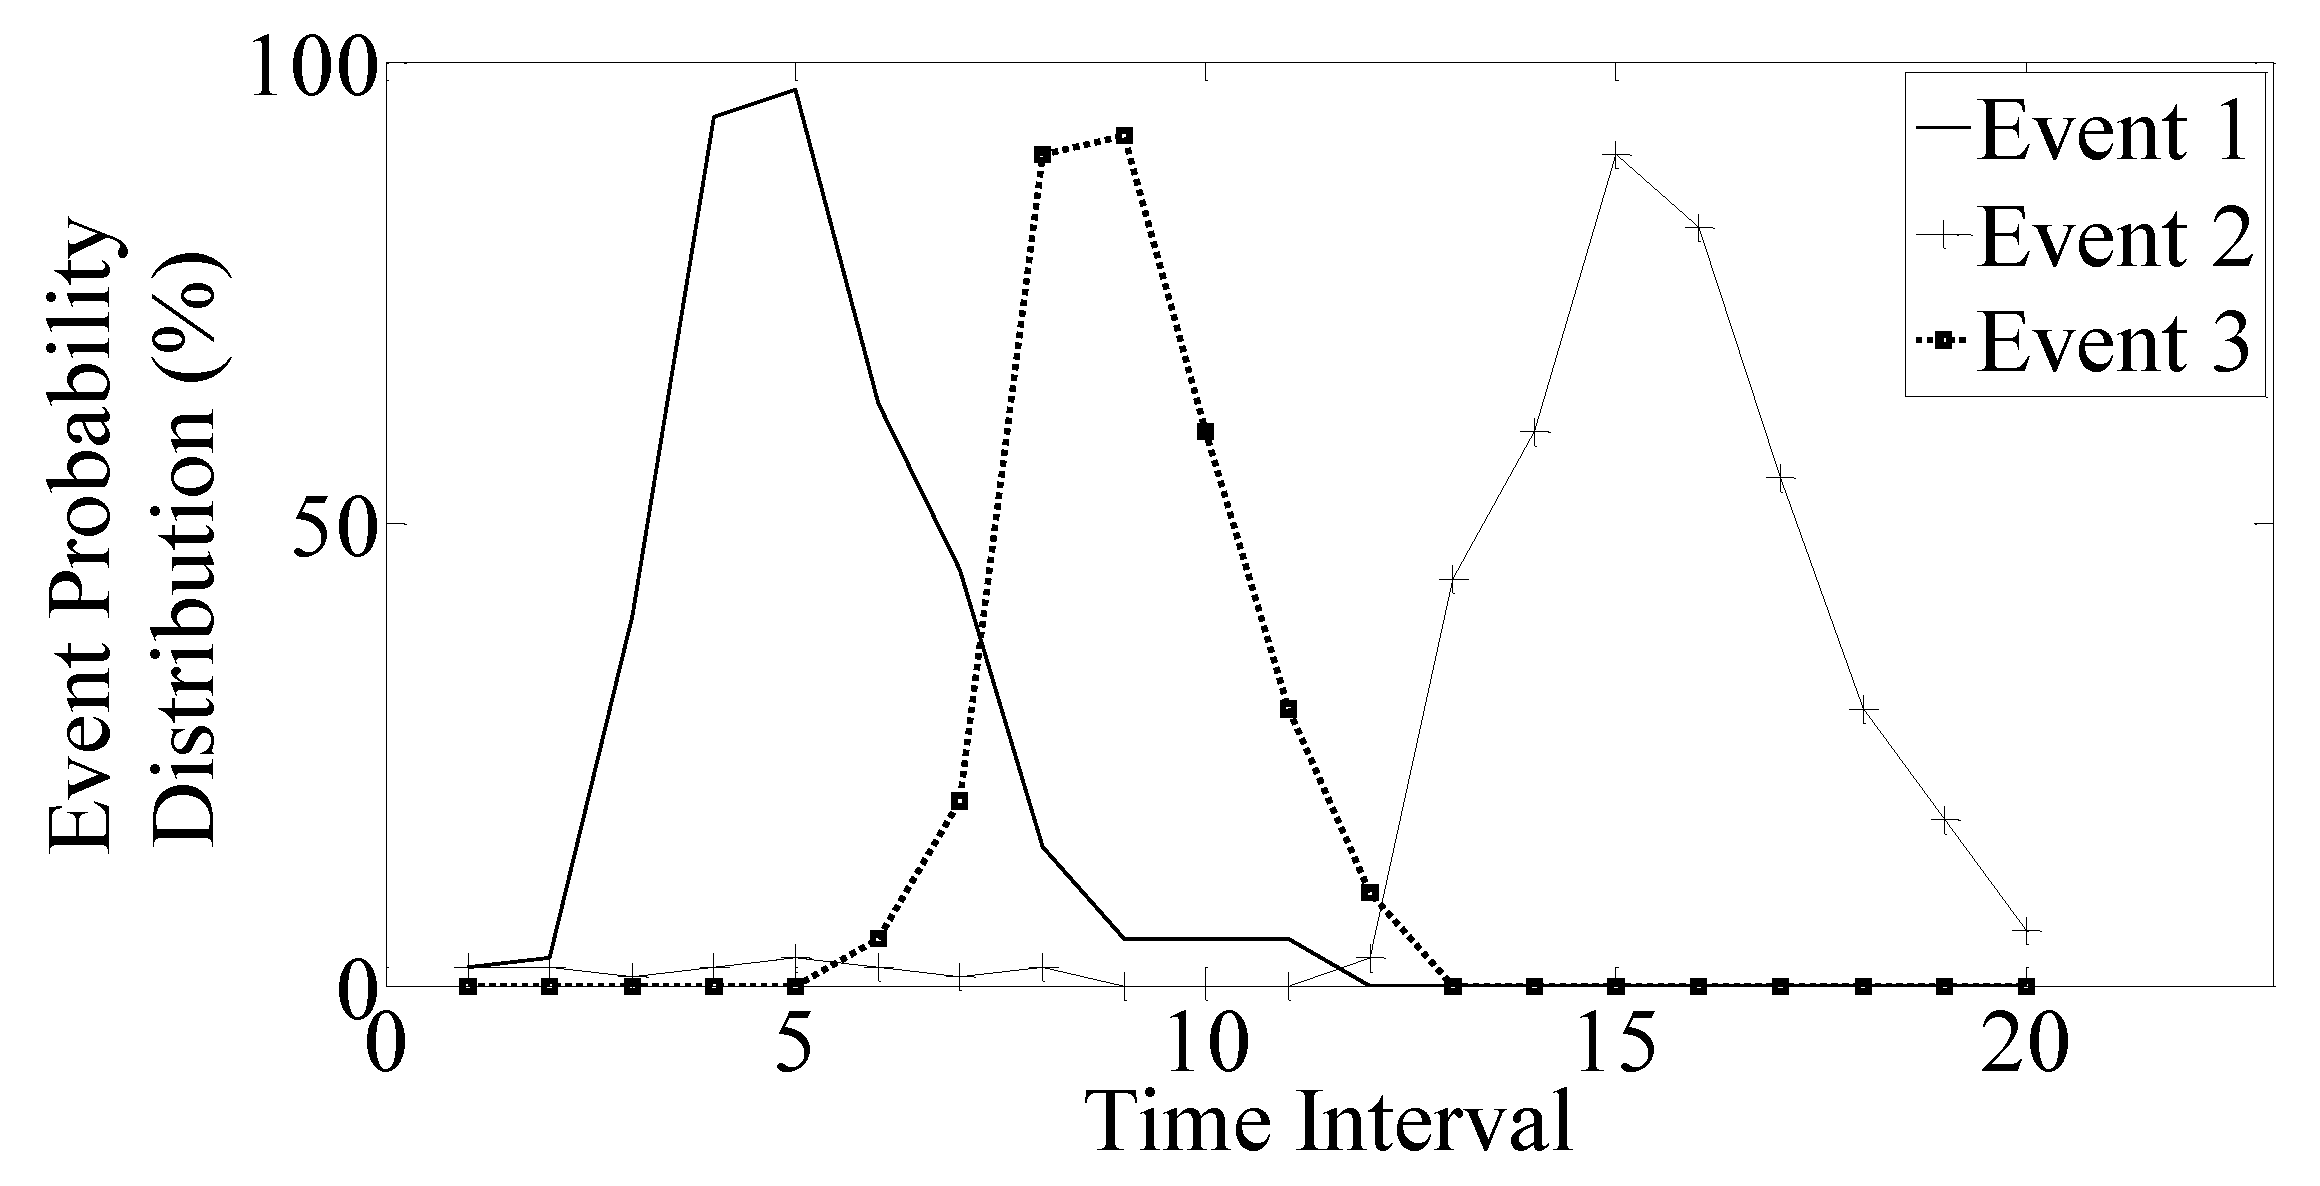
We assume that at each time interval k, 3000 tweets are posted which are equally categorized as being of high, medium, or low importance. We also assume that 10 events take place, each consisting of five words in order to form the ground truth set Wgt. To generate the words within an event, we develop a word generator. This generator produces tweets that contain the particular word based on a probability that indicates the percentage of the tweets of a particular category (high, medium, low importance) that have posted the specific word. In our experiments, this probability follows a Gaussian distribution; the mean value corresponds to the probability of the event this word is assigned to (average number of tweet-post words of this event over the total number of tweets), while the standard deviation regulates the coherence degree that the respective event has in terms of word appearance. Small values for the standard deviation means that almost all the words within an event are synchronized in time, since their appearance probability is quite similar for every time interval. The opposite is held for high standard deviation values.
Figure 2 shows an example of the probability distribution for three out of the ten events generated under the controlled environment being posted by the most important tweets over 20 time intervals (periods). We observe that the three events have a different time period of occurrence. To reduce the statistical noise, 500 experiments are conducted and then we take the average.
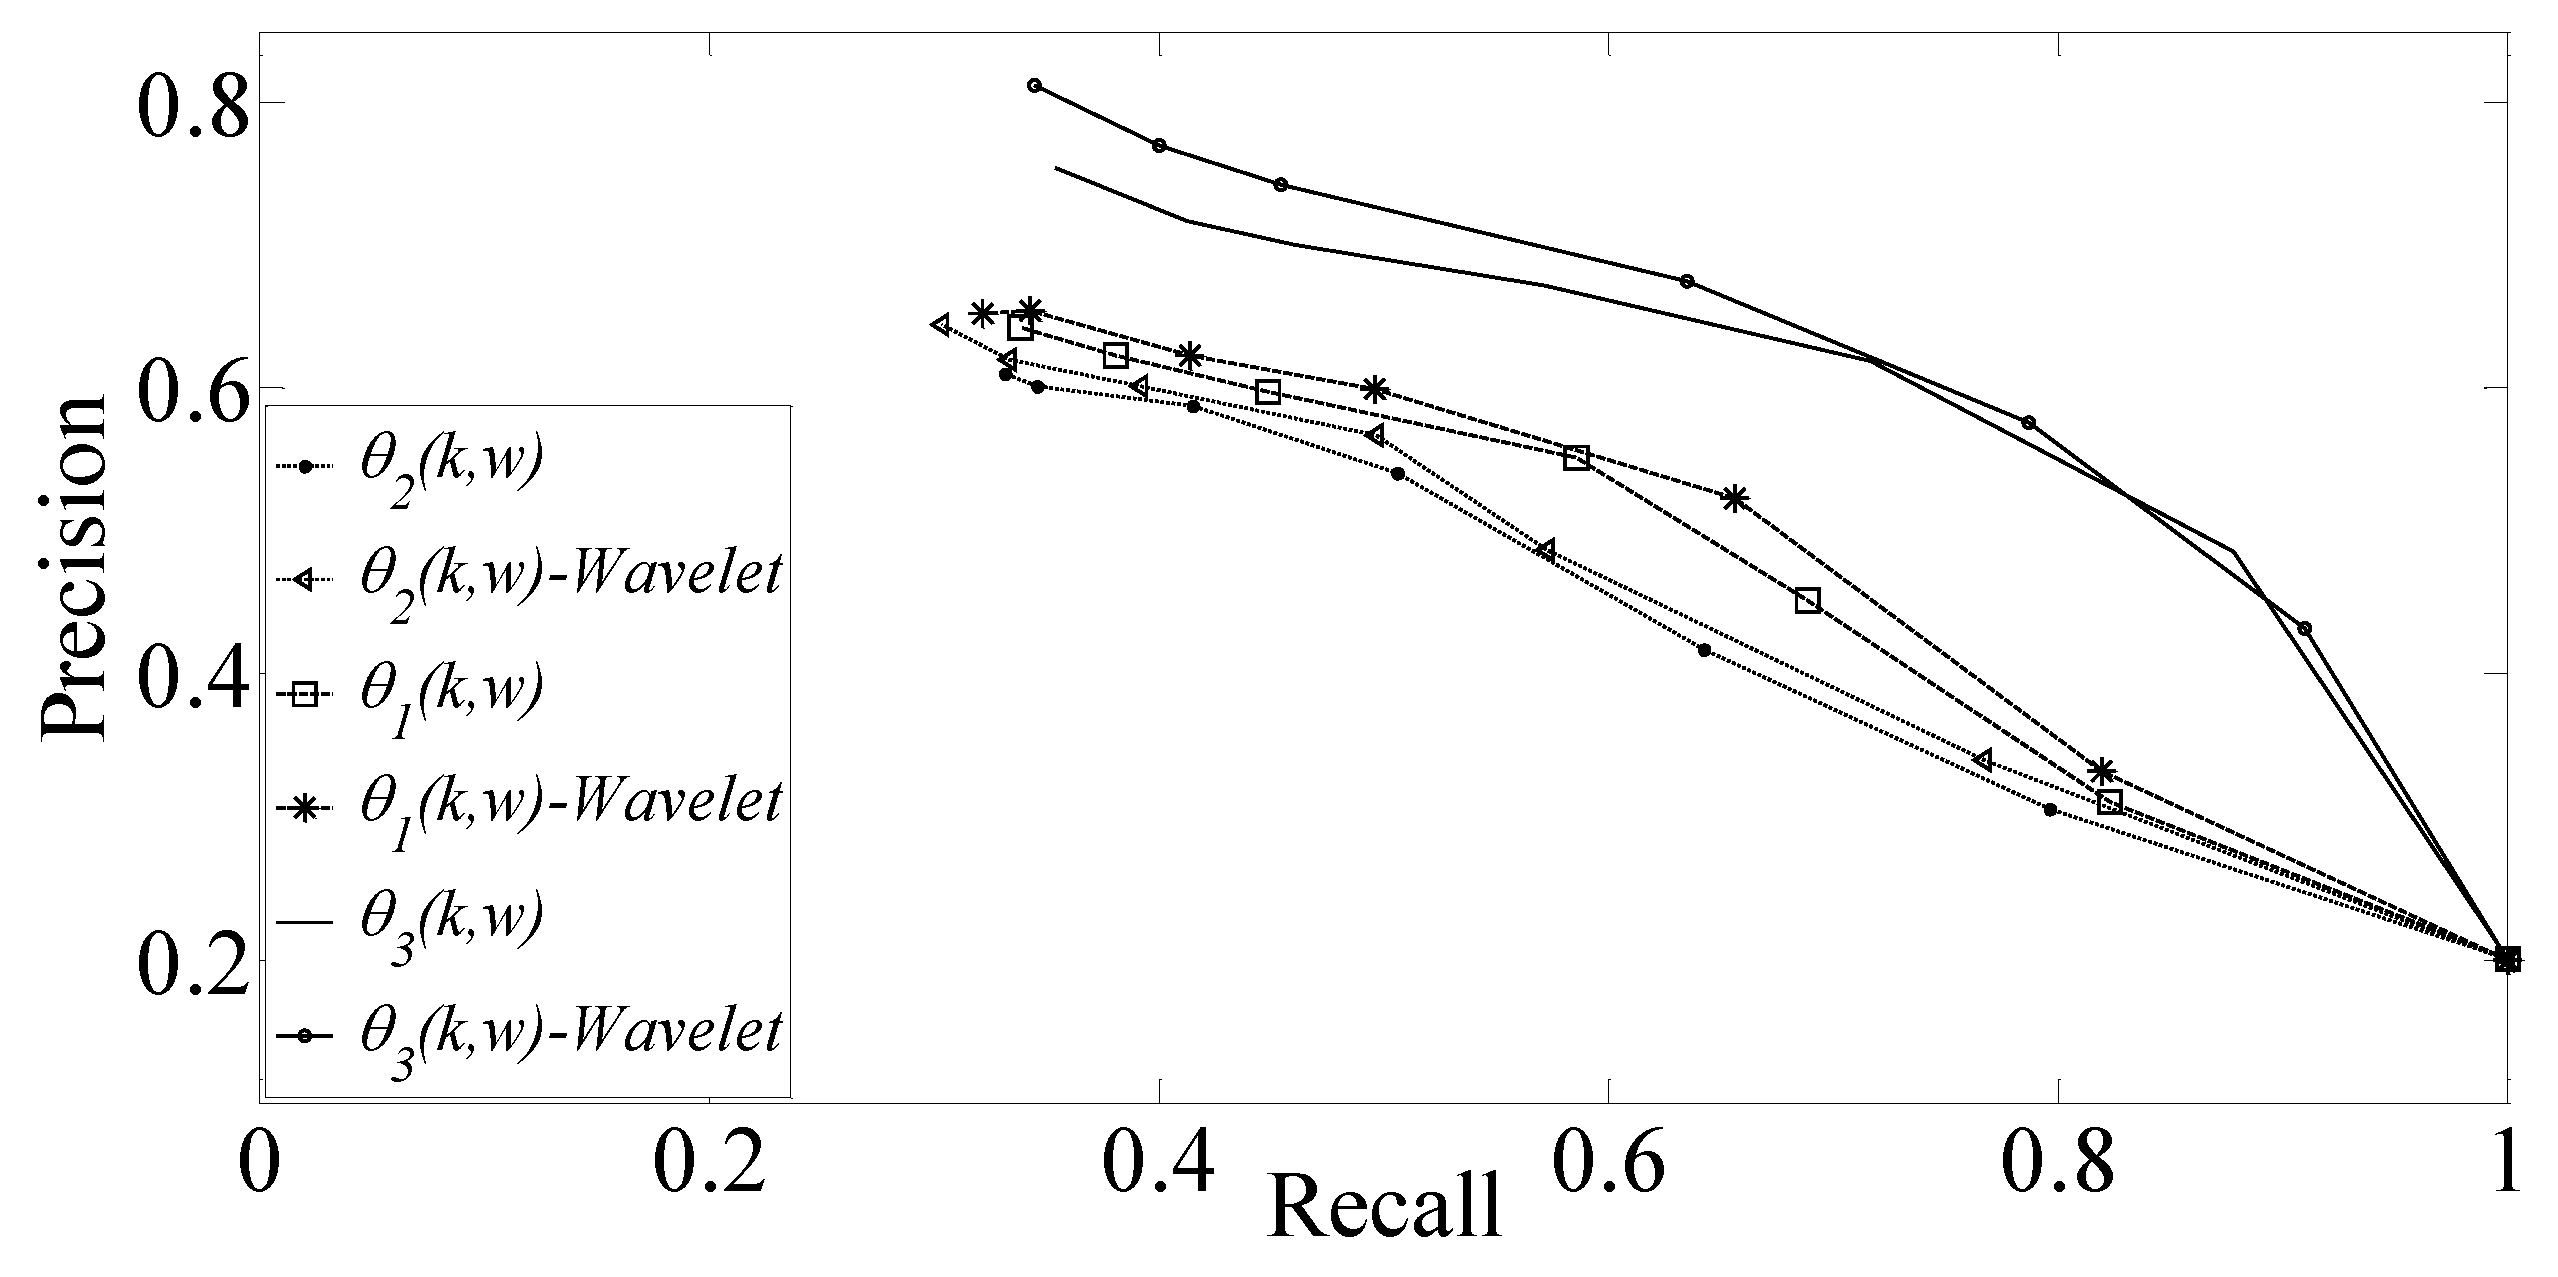
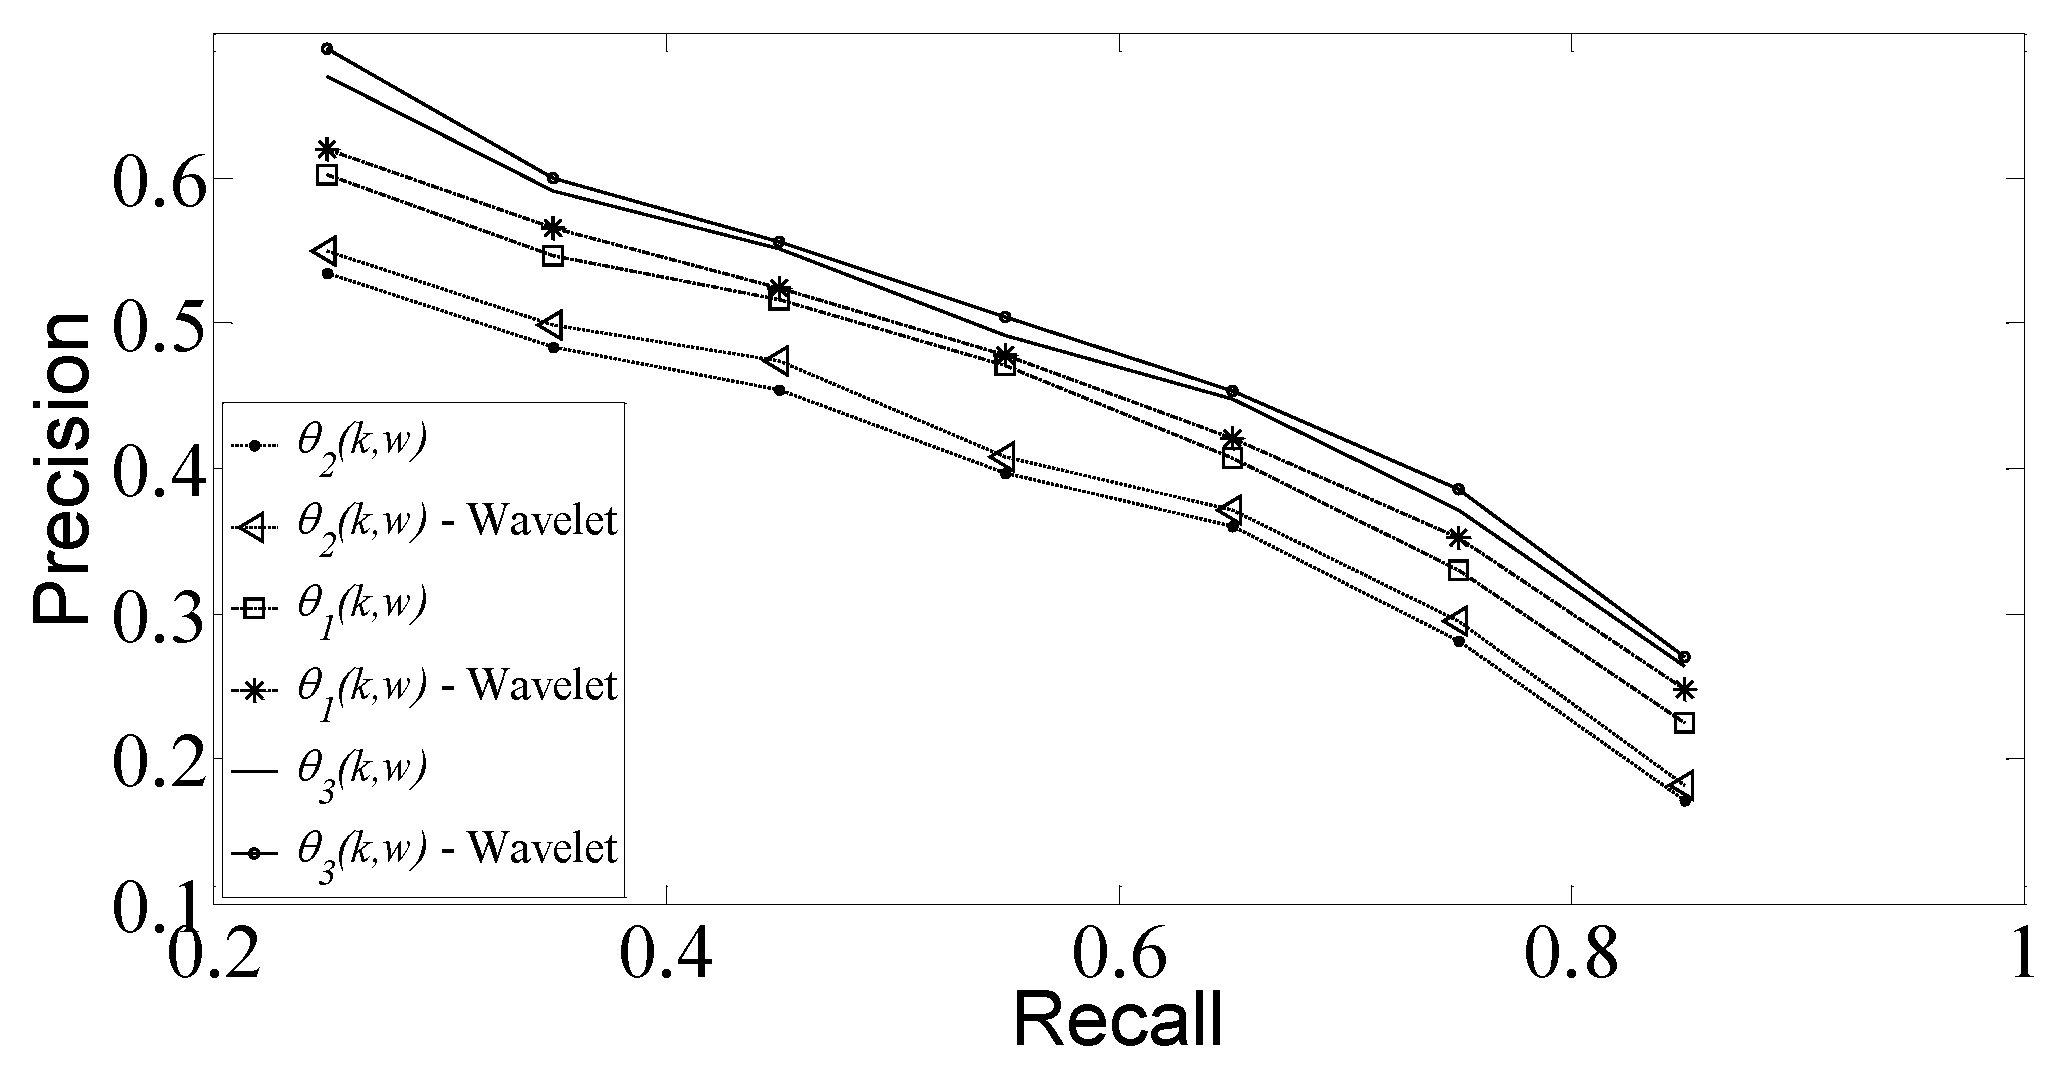
Figure 3 presents the precision–recall results for the three metrics
,
when the wavelet representation described in
Section 4.2 is applied (wavelet) or not (nonwavelet). We observe that metric
yields higher precision values for the same recall than the other two metrics, while the lowest precision values are achieved for metric
. A slight improvement in the precision values is also noticed for the wavelet representation described in
Section 4.2 and for all metrics due to a better compensation of the temporal variations of the words signals.
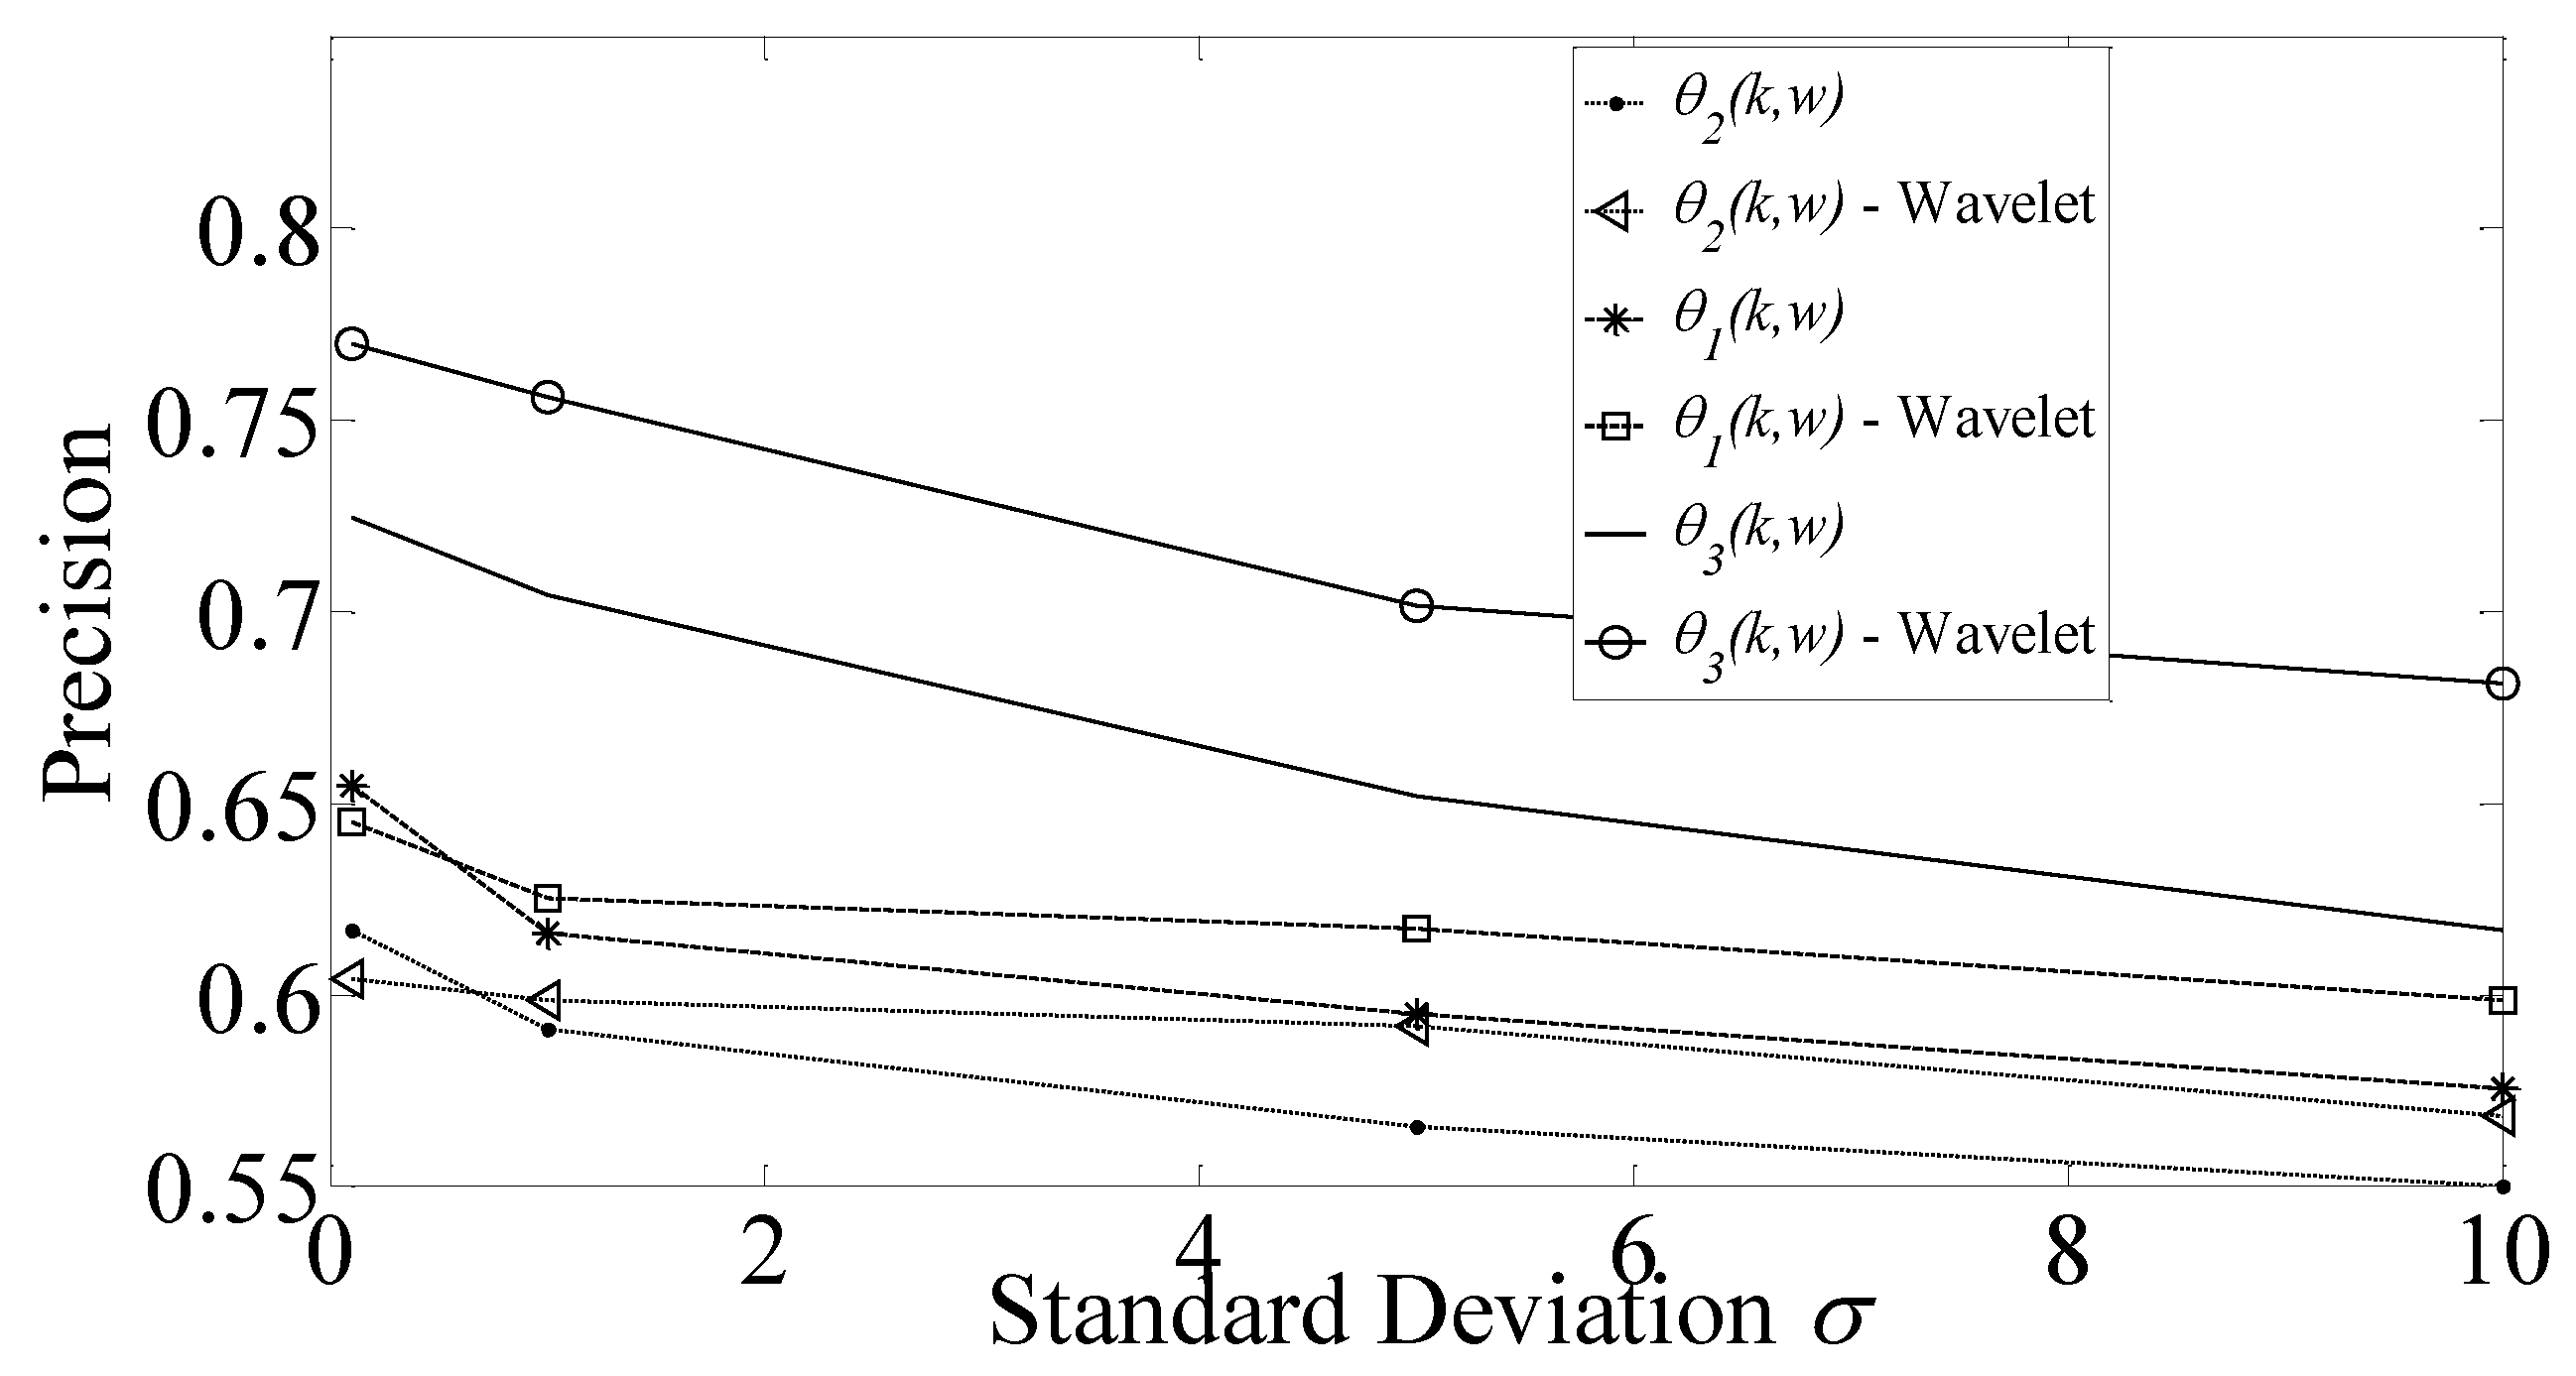
In
Figure 4 precision values are plotted against the standard deviation
, for recall value RE equals to 0.7. We notice that as
increases, the precision decreases for all metrics, since higher standard deviation means that the words of an event are not posted under a synchronized framework. Additionally, from
Figure 4, we can see that the use of wavelet representation makes the proposed event detection algorithm more robust to noise. Instead, for small values of noise (standard deviation) the effect of the wavelet on precision performance is eliminated, since the words are posted in a synchronized way. Similar conclusions are drawn in
Figure 5 for RE = 0.4.
6.1.2. Evaluation on Real-World Data
We extracted real-world tweet data using a publicly available API of Twitter. Using this API, we downloaded tweets spanning a one-month period, with six-hour duration time intervals. We filtered the results using cultural heritage and touristic domains.
Figure 6 shows the precision–recall curve on real-life data. Again, the weighted conditional word tweet frequency metric
yields the highest precision for a given recall value, while word frequency
provides the lowest precision accuracy. In
Figure 6, we also depict the effect of the wavelet representation on the three information theoretic metrics, verifying again that the use of wavelet representation increases precision scores.
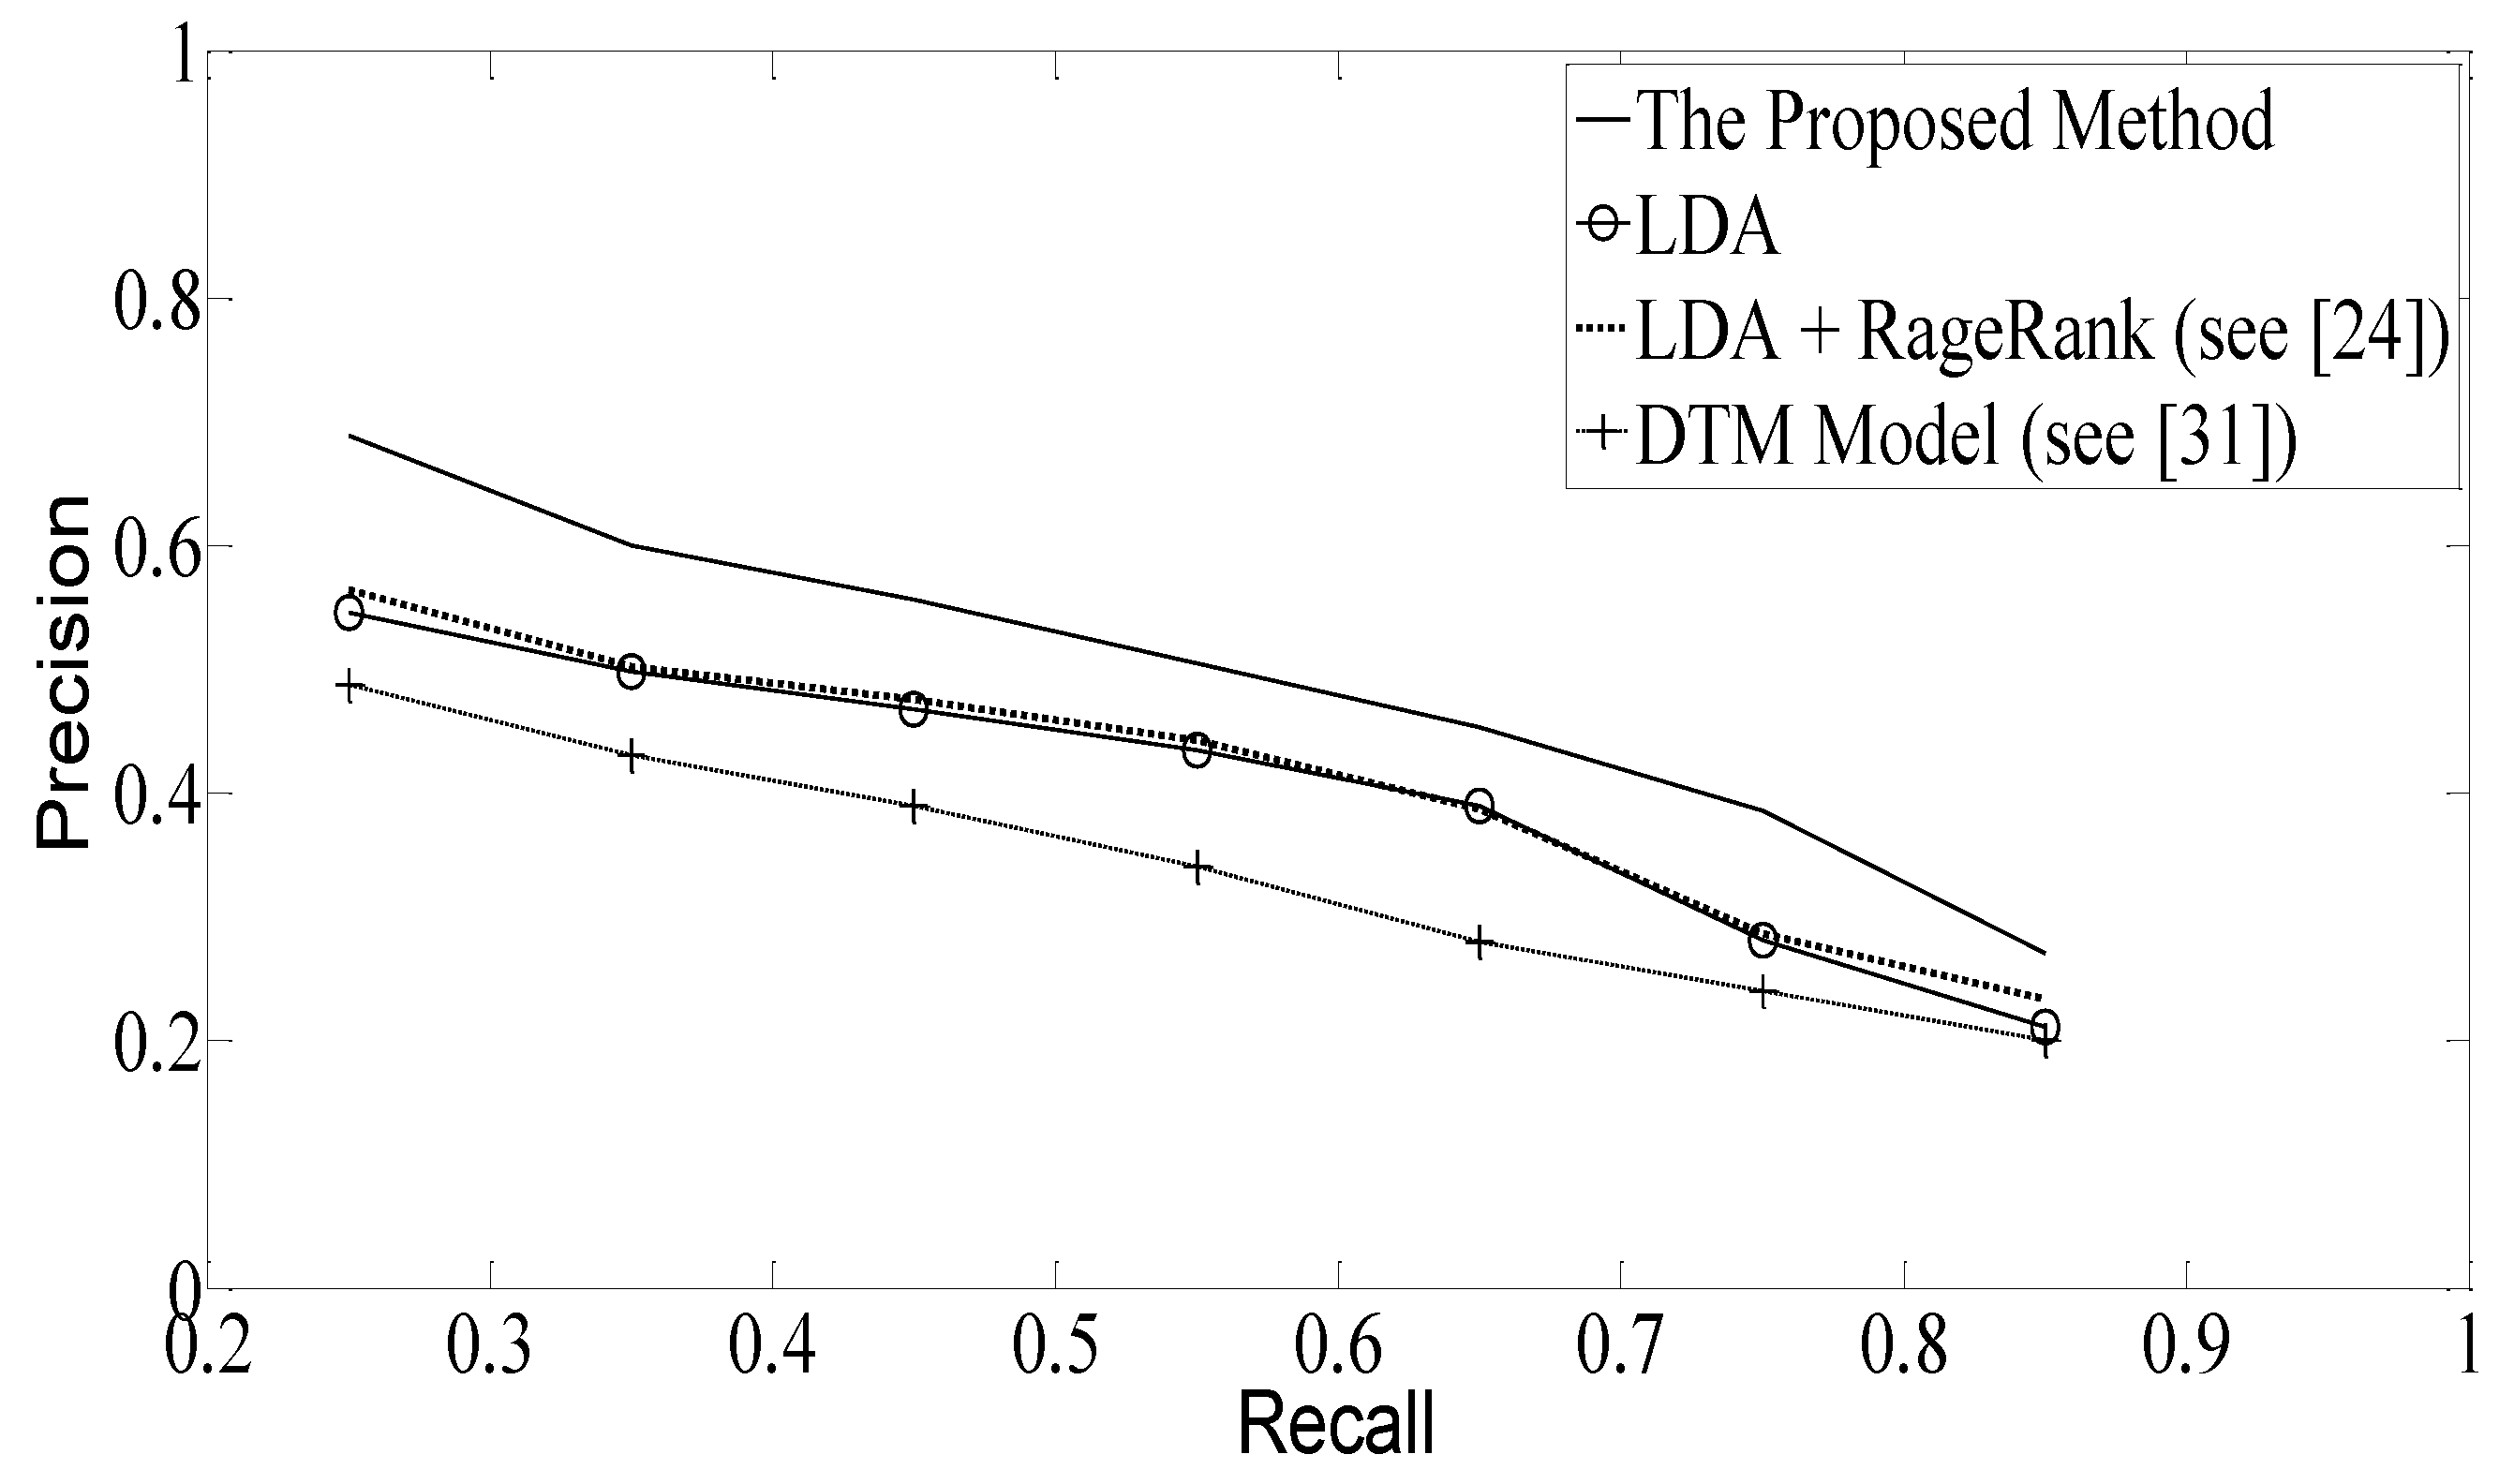
In
Figure 7, we compare several methods proposed in the literature for tweet-based event detection with ours in terms of precision–recall, including (a) the LDA approach, (b) the method of [
31], and (c) the method of [
26], where event detection on Twitter is based on a combination of LDA with the PageRank algorithm. As is observed, our method outperforms the other methods that are compared, since it better models the dynamic behavior of Twitter data while simultaneously compensating for the time vagueness in an event’s appearance.
6.1.3. Computational Complexity
The computational complexity of the proposed algorithm includes (i) the computational cost needed to construct the word signals and their wavelet representation, and (ii) the clustering computational cost. The complexity for constructing the word signals is of order
for
,
where
is the number of previously examined time intervals, and of order
for
, where
is the maximum number of tweets over the
periods. The wavelet representation adds a small cost to the word signal construction. Similarly, the main bottleneck for the multiassignment graph partitioning algorithm is the eigenvalue decomposition optimization. The fastest implementation for the eigenvalue decomposition problem is though the Lanczos method [
65] whose complexity is
, where
is the number of eigenvalues that have to be computed (the number of events),
is the number of words, and
the number of iterations of the algorithm. Typically,
is several times smaller than L and the complexity is of order
, where
is bounded since it indicates the number of words.
By adopting a simpler clustering algorithm, like k-means, we can get slightly lower complexity than with the proposed multiassignment graph partitioning. In particular, k-means has complexity, where again bounds the iterations of the algorithm and q is the size of vector . Usually, q is smaller than L, resulting in slightly faster convergence of the k-means than the proposed multiassignment graph partitioning. However, in case of event detection from tweet posts, the number of words L is often of the order of some hundreds/thousands, meaning that the actual extra running time is of order of some milliseconds, making the computational efficiency of k-means practically negligible compared to what we lose in terms of event detection performance. This implies that it is more important to have a better clustering algorithm rather than to try to improve the running time by few milliseconds.
6.1.4. Reconstruction Efficiency
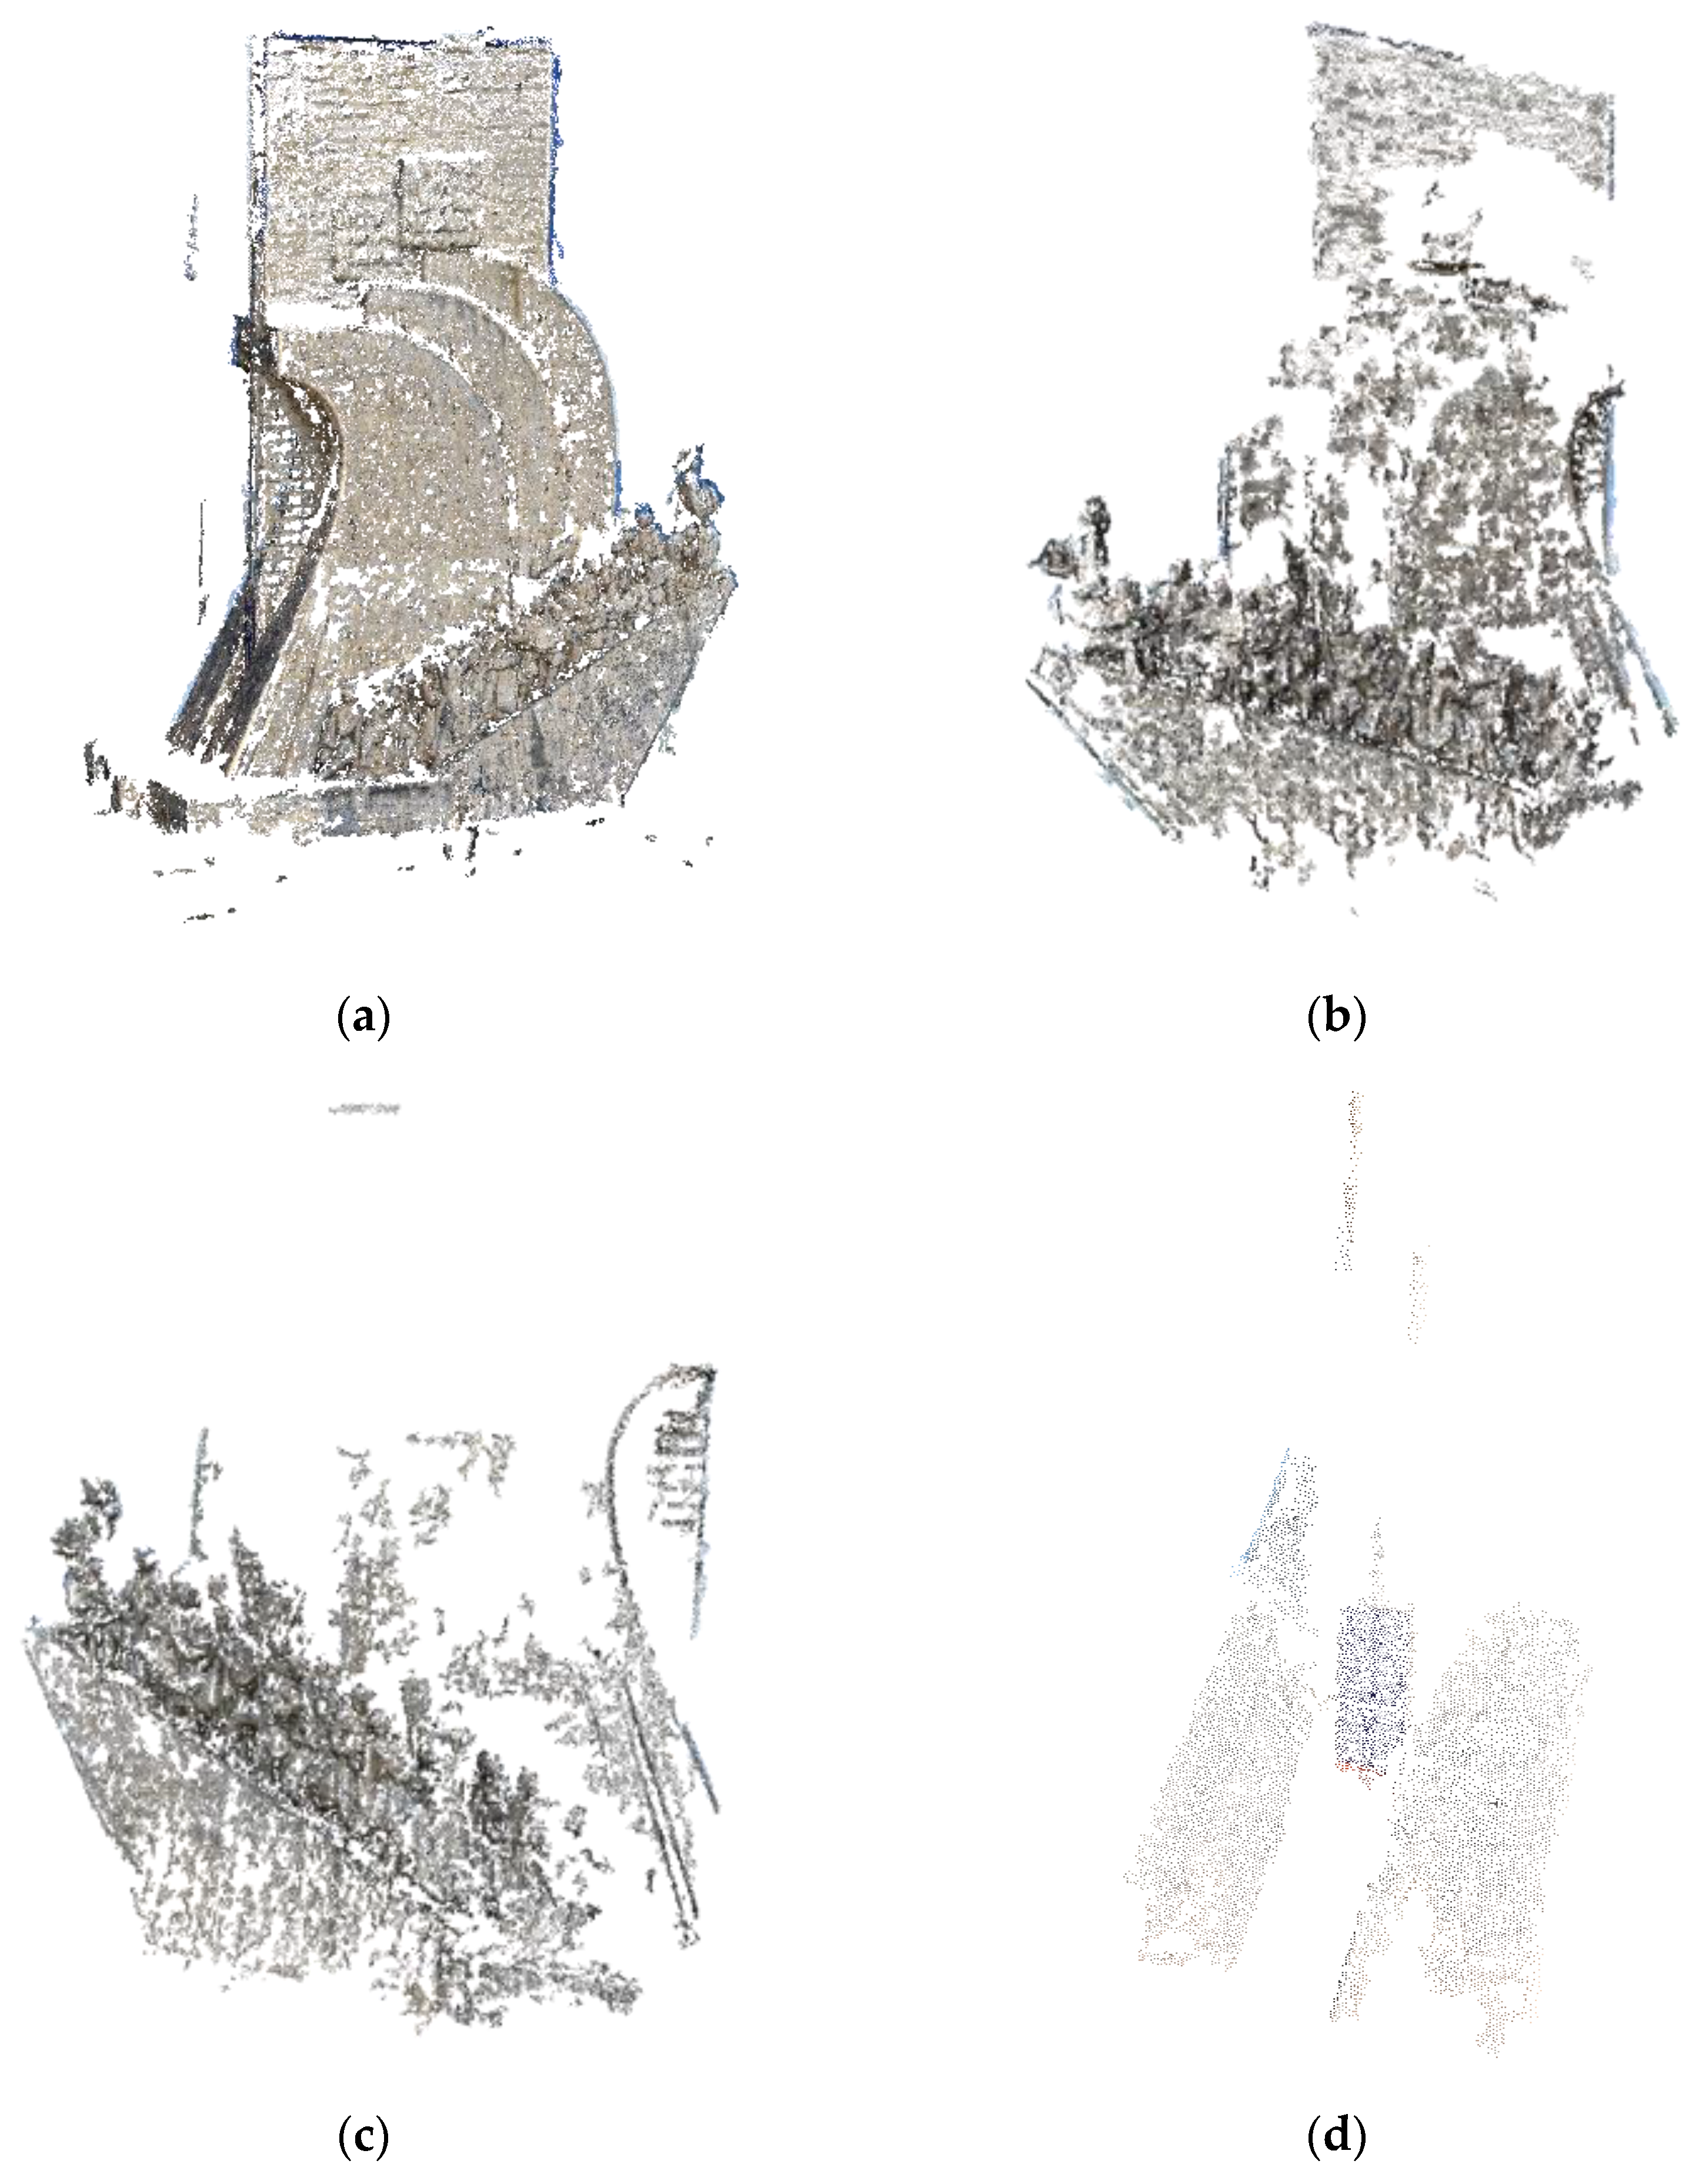
In this section, we evaluate the efficiency of 3D reconstruction with and without the use of the proposed Twitter-based algorithm. In particular, in
Figure 8a, we depict the reconstruction accuracy using the SfM scheme using 100 inliers and 0 outliers for images all captured from the Monument to the Discoveries (Padrão dos Descobrimentos) in Lisbon, Portugal. These images were randomly selected from tweet posts of users’ visits this monument. In
Figure 8b, we show that the reconstruction accuracy was severely affected by the inclusion of 10% of outliers in the image data, that is, 90 inliers and 10 outliers. The results become really very bad when the number of outliers is significantly large, reaching 30% (
Figure 8c) or even 40% (
Figure 8d) of the total number of images. In the last case, indeed, the reconstruction is so poor that we are unable to understand which monument the reconstruction refers to.
What deteriorates the situation in
Figure 9 is that the selected images are not captured using proper geometry as they should. Instead, they are randomly selected from tweet messages and thus they do not correspond to a proper geometry of the whole space. This proves the significance of our scheme. We remove the outliers and we keep only the most geometrically representative images. So, though we use a small number of images, we get very high reconstruction accuracy rather than just feeding all the images into the SfM structure. In addition, we get much higher computational cost. More specifically, if we remove the outliers, then we will get the times depicted in
Table 1.
As a result, in our approach about 100 images are considered adequate to provide a satisfied reconstruction of the monument. However, these images have been selected by removing the plethora our outliers and keeping only the most representative data as being automatically extracted by our algorithms.
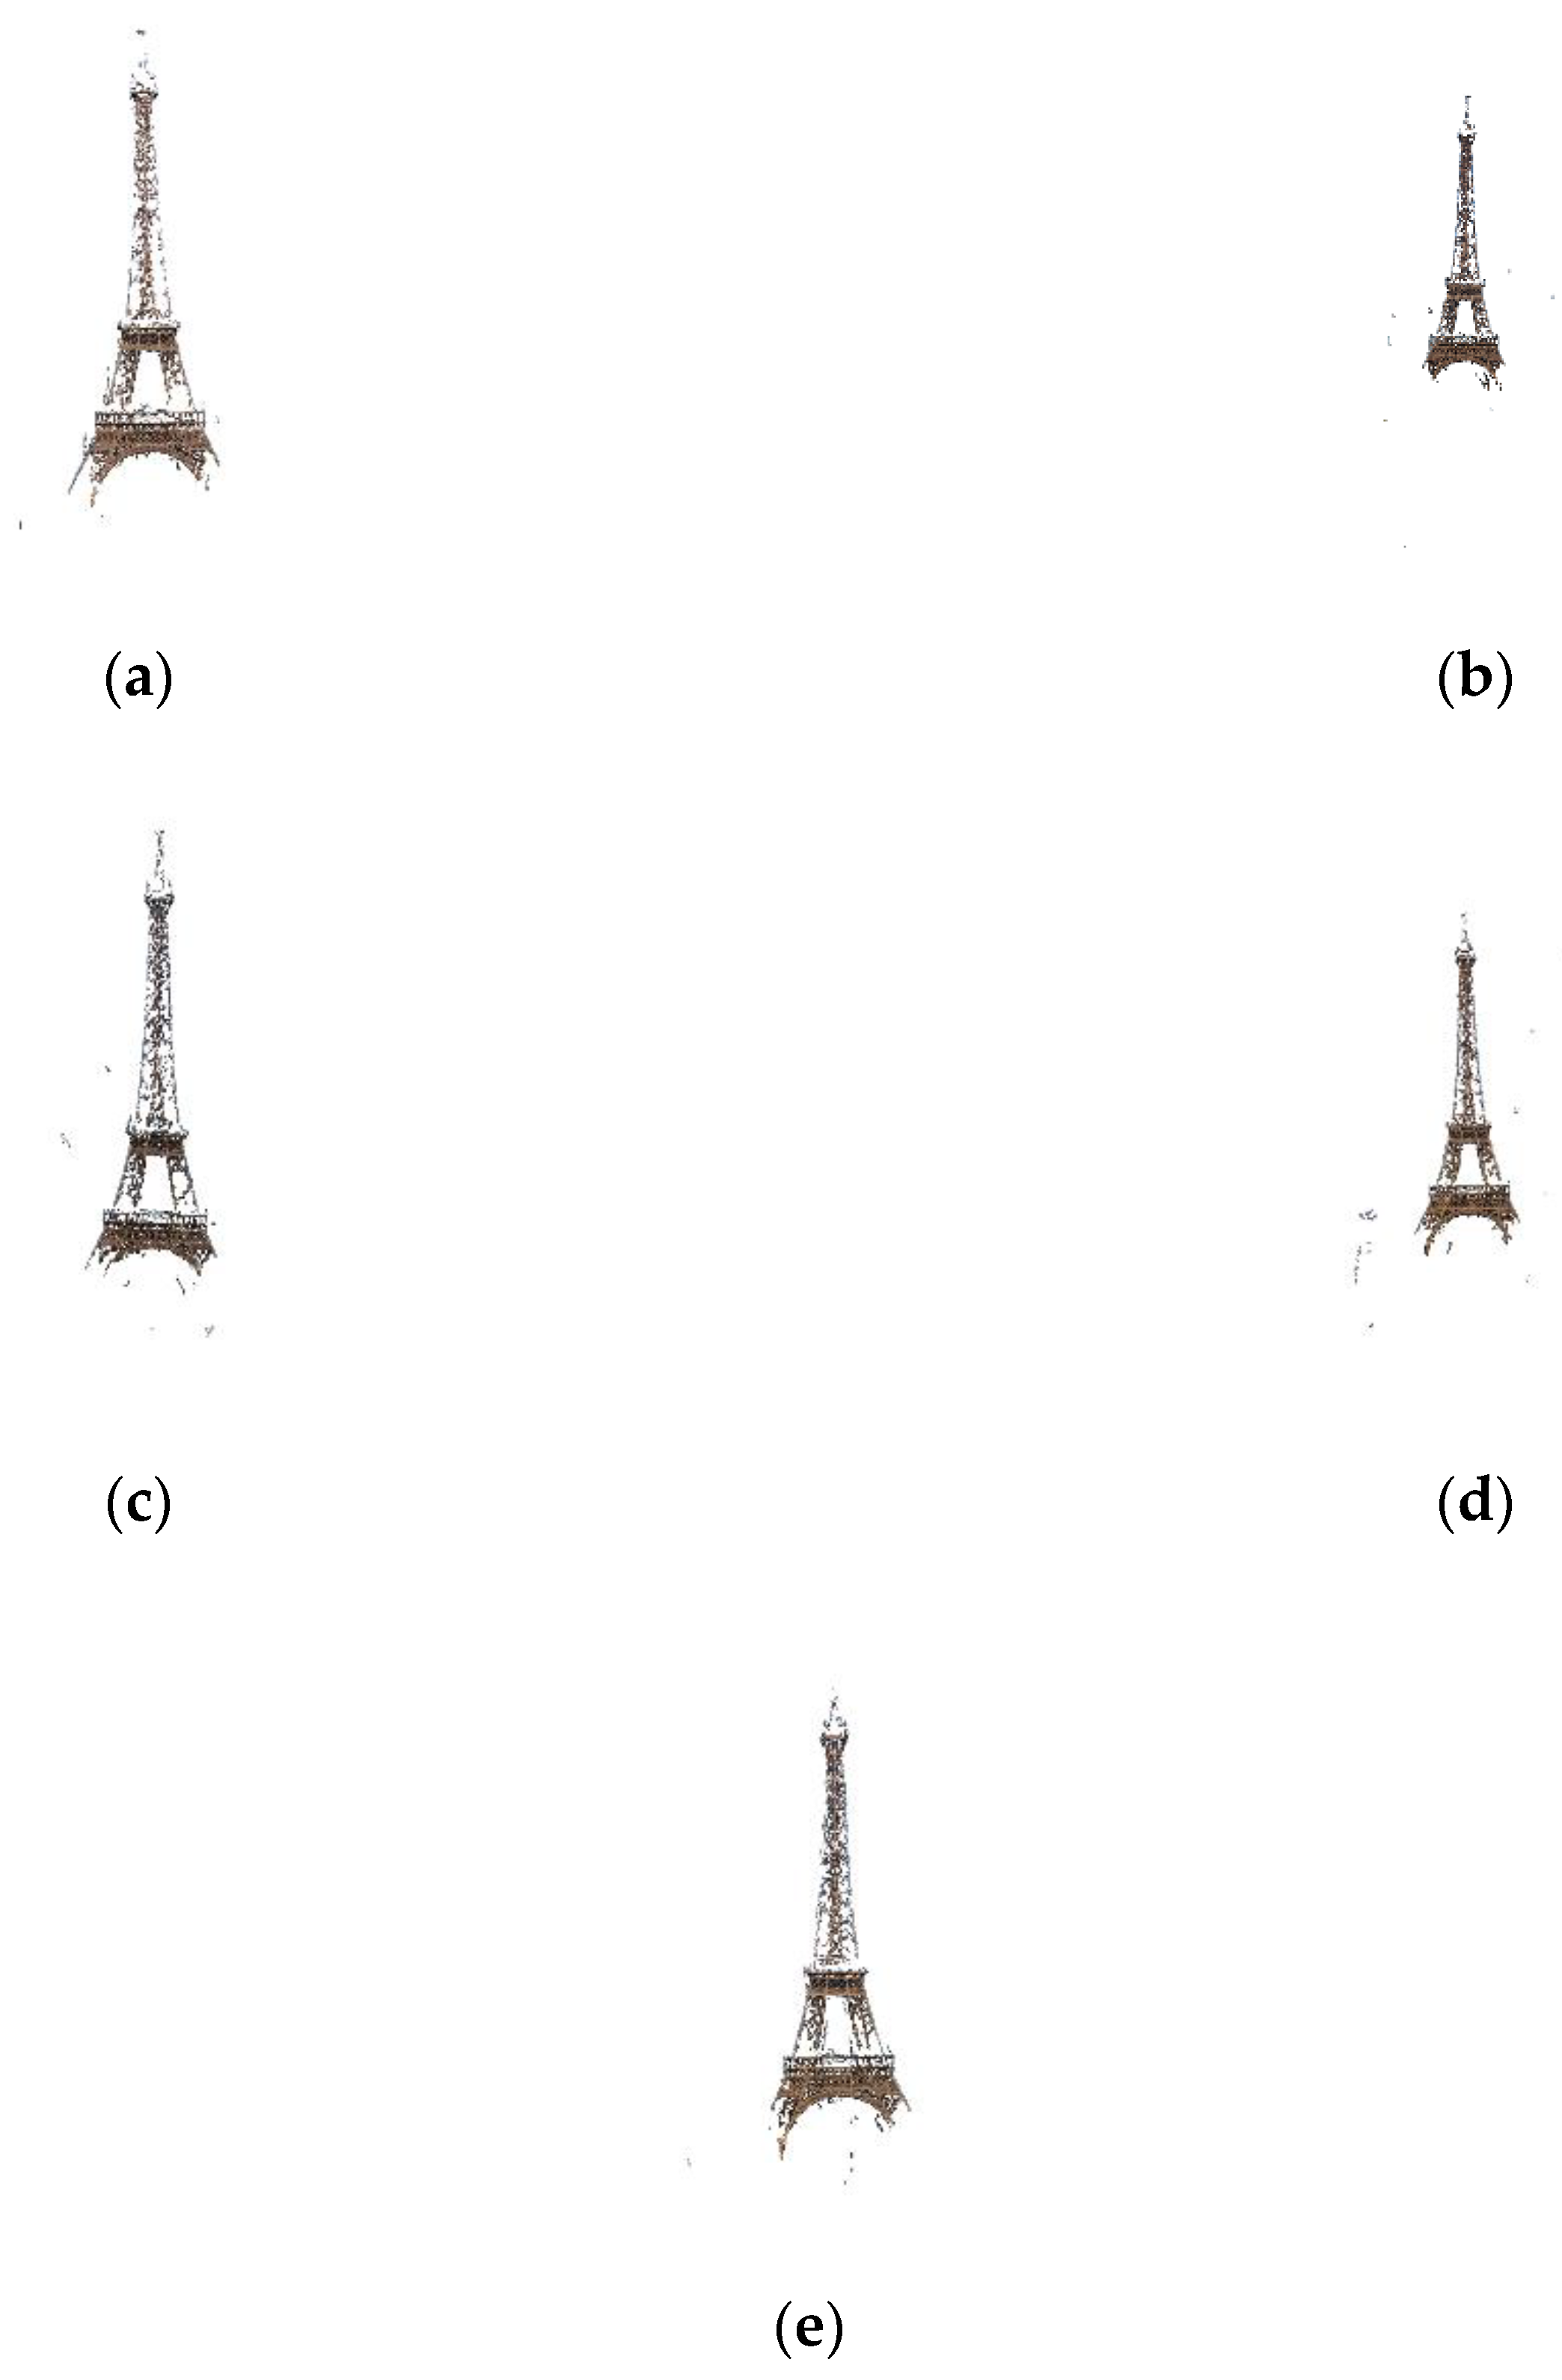
Another example of the effect of the number of outliers/inliers on 3D reconstruction performance is shown in
Figure 9, depicting the most popular monument of Paris, the Eiffel Tower. The same results are extracted, also showing scale properties of the proposed approach. This means that our method can be useful for different types of users and different information needs regarding the 3D reconstruction accuracy.
7. Conclusions
The rapid expansion of Twitter as a social messaging medium stimulated a series of new services that can leverage its power. A prominent space of interest is cultural heritage since nowadays, millions of users share opinions and comments over Twitter on cultural matters, especially when they visit new places for tourism. In other words, Twitter can be seen as a “distributed camera” sensor at the hands of users who can capture and comment (thus implicitly annotate) cultural content when they are in a place of interest. This is presented in this paper by combing algorithms for event detection and content-based filtering.
Experiments were conducted using both a controlled environment and real-world data. The experiments showed that the proposed Twitter-oriented information metric outperforms the conventional TF–IDF schemes stressed to different objective criteria such as precision, recall, and F1-score. Comparisons were given with other tweet-post event detection algorithms that indicate the superior performance of our approach compared to that of previous approaches. Finally, we investigated the computational complexity of our proposed methods.
Regarding the content-based filtering, we demonstrate that our scheme is able to perform adequate 3D reconstruction using a small set of images. This significantly reduces the time for 3D modeling while allowing for a massive digitalization of world-rich cultural identity. The final results show that we can significantly accelerate the time needed for a 3D reconstruction exploiting only a small but representative number of image views for a particular monument. This promises massive reconstruction of the 3D geometry of cultural sites of interest, though without high precision. Such a massive 3D reconstruction can be significantly useful for preservation purposes.
Regarding future research, it would be interesting to investigate dynamic aspects of graph partitioning construction and the use of incremental learning algorithms. A combination of a multilevel graph partitioning technique with the proposed eigenvalue decomposition could be examined. Finally, metrics that rank the importance of a tweet according to previous statistics based on a variety of criteria could also be applied.
Author Contributions
Conceptualization, A.D. and N.D.; Formal analysis, A.D., A.V., and K.M.; Funding acquisition, A.D.; Methodology, A.D., A.V., and K.M.; Project administration, A.D. and N.D.; Software, A.V., E.P., and K.M.; Supervision, A.D. and N.D.; Validation, E.P. and K.M.; Writing—original draft, A.D., A.V., and E.P.; Writing—review and editing, A.V., E.P., and N.D. All authors have read and agreed to the published version of the manuscript.
Funding
This paper is supported by the research project "4DBeyond: 4D Analysis Beyond the Visible Spectrum in Real-Life Engineering Applications", project No. HFRI-FM17-2972 funded by the Hellenic Foundation for Research & Innovation.
Conflicts of Interest
The authors declare no conflict of interest.
References
- Labadi, S. UNESCO, Cultural Heritage, and Outstanding Universal Value: Value-Based Analyses of the World Heritage and Intangible Cultural Heritage Conventions; Rowman & Littlefield: Lanham, MD, USA, 2013. [Google Scholar]
- Bowitz, E.; Ibenholt, K. Economic impacts of cultural heritage—Research and perspectives. J. Cult. Herit. 2009, 10, 1–8. [Google Scholar] [CrossRef]
- Dimoulas, C.A.; Kalliris, G.M.; Chatzara, E.G.; Tsipas, N.K.; Papanikolaou, G.V. Audiovisual production, restoration-archiving and content management methods to preserve local tradition and folkloric heritage. J. Cult. Herit. 2014, 15, 234–241. [Google Scholar] [CrossRef]
- Doulamis, A.; Voulodimos, A.; Doulamis, N.; Soile, S.; Lampropoulos, A. Transforming Intangible Folkloric Performing Arts into Tangible Choreographic Digital Objects: The Terpsichore Approach.; SCITEPRESS: Setubal, Portugal, 2017; Volume 6, pp. 451–460. [Google Scholar]
- Stentoumis, C.; Livanos, G.; Doulamis, A.; Protopapadakis, E.; Grammatikopoulos, L.; Zervakis, M. Precise 3D Reconstruction of Cultural Objects Using Combined Multi-component Image Matching and Active Contours Segmentation. In Advances in Visual Computing; Bebis, G., Boyle, R., Parvin, B., Koracin, D., Li, B., Porikli, F., Zordan, V., Klosowski, J., Coquillart, S., Luo, X., et al., Eds.; Lecture Notes in Computer Science; Springer: Berlin/Heidelberg, Germany, 2013; pp. 148–157. ISBN 978-3-642-41938-6. [Google Scholar]
- Wahbeh, W.; Nebiker, S.; Fangi, G. Combining public domain and professional panoramic imagery for the accurate and dense 3D reconstruction of the destroyed Bel Temple in Palmyra. ISPRS Ann. Photogramm. Remote Sens. Spat. Inf. Sci. 2016, 3, 81. [Google Scholar] [CrossRef]
- Voulodimos, A.; Doulamis, N.; Fritsch, D.; Makantasis, K.; Doulamis, A.; Klein, M. Four-dimensional reconstruction of cultural heritage sites based on photogrammetry and clustering. J. Electron. Imaging 2016, 26, 011013. [Google Scholar] [CrossRef]
- Doulamis, A.; Doulamis, N.; Protopapadakis, E.; Voulodimos, A.; Ioannides, M. 4D Modelling in Cultural Heritage. In Advances in Digital Cultural Heritage; Springer: Cham, Switzerland, 2018; pp. 174–196. [Google Scholar] [CrossRef]
- Doulamis, A.; Liarokapis, F.; Petridis, P.; Miaoulis, G. Serious Games for Cultural Applications. In Intelligent Computer Graphics 2011 (Studies in Computational Intelligence); Springer: Berlin/Heidelberg, Germany, 2012; pp. 97–115. ISBN 978-3-642-22906-0. [Google Scholar]
- Sun, A.; Hu, M. Query-Guided Event Detection from News and Blog Streams. IEEE Trans. Syst. Manand Cybern. Part A Syst. Hum. 2011, 41, 834–839. [Google Scholar] [CrossRef]
- Petcu, D.; Vazquez-Poletti, J.L. European Research Activities in Cloud Computing; Cambridge Scholars Publishing: Newcastle upon Tyne, UK, 2012. [Google Scholar]
- Kazienko, P.; Chawla, N. Applications of Social Media and Social Network Analysis; Springer: Cham, Switzerland, 2015. [Google Scholar]
- Huang, T.S.; Netravali, A.N. Motion and structure from feature correspondences: A review. Proc. IEEE 1994, 82, 252–268. [Google Scholar] [CrossRef]
- Makantasis, K.; Doulamis, A.; Doulamis, N.; Ioannides, M. In the wild image retrieval and clustering for 3D cultural heritage landmarks reconstruction. Multimed. Tools Appl. 2016, 75, 3593–3629. [Google Scholar] [CrossRef]
- Aizawa, A. The Feature Quantity: An Information Theoretic Perspective of Tfidf-like Measures. In Proceedings of the 23rd Annual International ACM SIGIR Conference on Research and Development in Information Retrieval, Athens Greece, 24–28 July 2000; ACM: New York, NY, USA, 2003; pp. 104–111. [Google Scholar]
- Xue, X.B.; Zhou, Z.H. Distributional Features for Text Categorization. IEEE Trans. Knowl. Data Eng. 2009, 21, 428–442. [Google Scholar]
- Counting Characters. Available online: https://developer.twitter.com/en/docs/basics/counting-characters (accessed on 18 May 2020).
- Sankaranarayanan, J.; Samet, H.; Teitler, B.E.; Lieberman, M.D.; Sperling, J. TwitterStand: News in Tweets. In Proceedings of the 17th ACM SIGSPATIAL International Conference on Advances in Geographic Information Systems, Seattle, DC, USA, 4–6 November 2009; ACM: New York, NY, USA, 2009; pp. 42–51. [Google Scholar]
- Grinev, M.; Grineva, M.; Boldakov, A.; Novak, L.; Syssoev, A.; Lizorkin, D. Sifting Micro-blogging Stream for Events of User Interest. In Proceedings of the 32Nd International ACM SIGIR Conference on Research and Development in Information Retrieval, Boston, MA, USA, 19–23 July 2009; ACM: New York, NY, USA, 2009; p. 837. [Google Scholar]
- Cha, M.; Haddadi, H.; Benevenuto, F.; Gummadi, P.K. Measuring user influence in twitter: The million follower fallacy. ICWSM 2010, 10, 30. [Google Scholar]
- Duan, Y.; Jiang, L.; Qin, T.; Zhou, M.; Shum, H.-Y. An Empirical Study on Learning to Rank of Tweets. In Proceedings of the 23rd International Conference on Computational Linguistics, Beijing, China, 23–27 August 2010; Association for Computational Linguistics: Stroudsburg, PA, USA, 2010; pp. 295–303. [Google Scholar]
- Weng, J.; Lee, B.-S. Event detection in twitter. ICWSM 2011, 11, 401–408. [Google Scholar]
- Aiello, L.M.; Petkos, G.; Martin, C.; Corney, D.; Papadopoulos, S.; Skraba, R.; Göker, A.; Kompatsiaris, I.; Jaimes, A. Sensing Trending Topics in Twitter. IEEE Trans. Multimed. 2013, 15, 1268–1282. [Google Scholar] [CrossRef]
- Blei, D.M.; Ng, A.Y.; Jordan, M.I. Latent Dirichlet Allocation. J. Mach. Learn. Res. 2003, 3, 993–1022. [Google Scholar]
- Bellaachia, A.; Al-Dhelaan, M. NE-Rank: A Novel Graph-Based Keyphrase Extraction in Twitter. In Proceedings of the 2012 IEEE/WIC/ACM International Conferences on Web Intelligence and Intelligent Agent Technology, Macau, China, 4–7 December 2012; Volume 1, pp. 372–379. [Google Scholar]
- Bellaachia, A.; Al-Dhelaan, M. Learning from Twitter Hashtags: Leveraging Proximate Tags to Enhance Graph-Based Keyphrase Extraction. In Proceedings of the 2012 IEEE International Conference on Green Computing and Communications, Besancon, France, 20–23 November 2012; pp. 348–357. [Google Scholar]
- Kim, Y.; Shim, K. TWILITE: A recommendation system for Twitter using a probabilistic model based on latent Dirichlet allocation. Inf. Syst. 2014, 42, 59–77. [Google Scholar] [CrossRef]
- Yang, M.-C.; Rim, H.-C. Identifying interesting Twitter contents using topical analysis. Expert Syst. Appl. 2014, 41, 4330–4336. [Google Scholar] [CrossRef]
- Sizov, S. GeoFolk: Latent Spatial Semantics in Web 2.0 Social Media. In Proceedings of the Third ACM International Conference on Web Search and Data Mining, New York, NY, USA, 3–6 February 2010; ACM: New York, NY, USA, 2010; pp. 281–290. [Google Scholar]
- Yin, Z.; Cao, L.; Han, J.; Zhai, C.; Huang, T. Geographical Topic Discovery and Comparison. In Proceedings of the 20th International Conference on World Wide Web, Hyderabad, India, 28 March–1 April 2011; ACM: New York, NY, USA, 2011; pp. 247–256. [Google Scholar]
- Gao, D.; Li, W.; Cai, X.; Zhang, R.; Ouyang, Y. Sequential Summarization: A Full View of Twitter Trending Topics. IEEE ACM Trans. Audio Speech Lang. Proc. 2014, 22, 293–302. [Google Scholar] [CrossRef]
- Zhou, X.; Chen, L. Event detection over twitter social media streams. VLDB J. 2014, 23, 381–400. [Google Scholar] [CrossRef]
- He, Q.; Chang, K.; Lim, E.-P. Analyzing Feature Trajectories for Event Detection. In Proceedings of the 30th Annual International ACM SIGIR Conference on Research and Development in Information Retrieval, Amsterdam, The Netherlands, 23–27 July 2007; ACM: New York, NY, USA, 2007; pp. 207–214. [Google Scholar]
- Kaneko, T.; Yanai, K. Visual event mining from geo-tweet photos. In Proceedings of the 2013 IEEE International Conference on Multimedia and Expo Workshops (ICMEW), San Jose, CA, USA, 15–19 July 2013; pp. 1–6. [Google Scholar]
- Musleh, M. Spatio-temporal Visual Analysis for Event-specific Tweets. In Proceedings of the 2014 ACM SIGMOD International Conference on Management of Data, Snowbird, UT, USA, 22–27 June 2014; ACM: New York, NY, USA, 2014; pp. 1611–1612. [Google Scholar]
- Kaneko, T.; Yanai, K. Event photo mining from Twitter using keyword bursts and image clustering. Neurocomputing 2016, 172, 143–158. [Google Scholar] [CrossRef]
- Cai, H.; Yang, Y.; Li, X.; Huang, Z. What Are Popular: Exploring Twitter Features for Event Detection, Tracking and Visualization. In Proceedings of the 23rd ACM International Conference on Multimedia, Brisbane, Australia, 26–30 October 2015; ACM: New York, NY, USA, 2015; pp. 89–98. [Google Scholar]
- Kaleel, S.B.; Abhari, A. Cluster-discovery of Twitter messages for event detection and trending. J. Comput. Sci. 2015, 6, 47–57. [Google Scholar] [CrossRef]
- Voulodimos, A.S.; Patrikakis, C.Z.; Karamolegkos, P.N.; Doulamis, A.D.; Sardis, E.S. Employing Clustering Algorithms to Create User Groups for Personalized Context Aware Services Provision. In Proceedings of the 2011 ACM Workshop on Social and Behavioural Networked Media Access, Scottsdale, AZ, USA, 1 December 2011; pp. 33–38. [Google Scholar] [CrossRef]
- Doulamis, A.; Katsaros, G. 3D modelling of cultural heritage objects from photos posted over the Twitter. In Proceedings of the 2016 IEEE International Conference on Imaging Systems and Techniques (IST), Chania, Greece, 4–6 October 2016; pp. 389–394. [Google Scholar]
- Chum, O.; Philbin, J.; Sivic, J.; Isard, M.; Zisserman, A. Total Recall: Automatic Query Expansion with a Generative Feature Model for Object Retrieval. In Proceedings of the IEEE 11th International Conference on Computer Vision, Rio de Janeiro, Brazil, 14–20 October 2007; IEEE Computer Society: Washington DC, USA, 2007; pp. 1–8. [Google Scholar]
- Kosmopoulos, D.I.; Doulamis, A.; Makris, A.; Doulamis, N.; Chatzis, S.; Middleton, S.E. Vision-based production of personalized video. Signal Process. Image Commun. 2009, 24, 158–176. [Google Scholar] [CrossRef] [Green Version]
- Halkos, D.; Doulamis, N.; Doulamis, A. A secure framework exploiting content guided and automated algorithms for real time video searching. Multimed. Tools Appl. 2009, 42, 343–375. [Google Scholar] [CrossRef]
- Papadakis, N.; Doulamis, A.; Litke, A.; Doulamis, N.; Skoutas, D.; Varvarigou, T. MI-MERCURY: A mobile agent architecture for ubiquitous retrieval and delivery of multimedia information. Multimed. Tools Appl. 2008, 38, 147–184. [Google Scholar] [CrossRef]
- Kekre, D.H.B.; Sarode, T.K.; Thepade, S.D.; Vaishali, V. Improved texture feature based image retrieval using Kekre’s fast codebook generation algorithm. In Thinkquest~2010; Pise, S.J., Ed.; Springer: New Delhi, India, 2011; pp. 143–149. ISBN 978-81-8489-988-7. [Google Scholar]
- Min, R.; Cheng, H.D. Effective image retrieval using dominant color descriptor and fuzzy support vector machine. Pattern Recognit. 2009, 42, 147–157. [Google Scholar] [CrossRef]
- Angelov, P.; Sadeghi-Tehran, P. Look-a-Like: A Fast Content-Based Image Retrieval Approach Using a Hierarchically Nested Dynamically Evolving Image Clouds and Recursive Local Data Density. Int. J. Intell. Syst. 2017, 32, 82–103. [Google Scholar] [CrossRef] [Green Version]
- Srivastava, P.; Khare, A. Integration of wavelet transform, Local Binary Patterns and moments for content-based image retrieval. J. Vis. Commun. Image Represent. 2017, 42, 78–103. [Google Scholar] [CrossRef]
- Doulamis, N.D.; Doulamis, A.D.; Kokkinos, P.; Varvarigos, E.M. Event Detection in Twitter Microblogging. IEEE Trans. Cybern. 2016, 46, 2810–2824. [Google Scholar] [CrossRef] [PubMed]
- Ullman, S.; Brenner, S. The interpretation of structure from motion. Proc. R. Soc. London. Ser. B Biol. Sci. 1979, 203, 405–426. [Google Scholar]
- Protopapadakis, E.; Doulamis, A. Semi-Supervised Image Meta-Filtering Using Relevance Feedback in Cultural Heritage Applications. Int. J. Herit. Digit. Era 2014, 3, 613–627. [Google Scholar] [CrossRef]
- Protopapadakis, E.; Voulodimos, A.; Doulamis, A.; Camarinopoulos, S. A Study on the Use of Kinect Sensor in Traditional Folk Dances Recognition via Posture Analysis. In Proceedings of the 10th International Conference on PErvasive Technologies Related to Assistive Environments, Rhodes, Greece, 21–23 June 2017; ACM: New York, NY, USA, 2007; pp. 305–310. [Google Scholar]
- Protopapadakis, E.; Voulodimos, A.; Doulamis, A.; Camarinopoulos, S.; Doulamis, N.; Miaoulis, G. Dance Pose Identification from Motion Capture Data: A Comparison of Classifiers. Technologies 2018, 6, 31. [Google Scholar] [CrossRef] [Green Version]
- Bach, F.R.; Jordan, M.I. Learning spectral clustering. In Proceedings of the Advances in Neural Information Processing Systems, Whistler, BC, Canada, 13–16 December 2004; MIT Press: British Columbia, Canada, 2005; pp. 305–312. [Google Scholar]
- Fan, K. Maximum Properties and Inequalities for the Eigenvalues of Completely Continuous Operators. Proc. Natl. Acad. Sci. USA 1951, 37, 760–766. [Google Scholar] [CrossRef] [Green Version]
- Doulamis, N.D.; Kokkinos, P.; Varvarigos, E. Resource Selection for Tasks with Time Requirements Using Spectral Clustering. IEEE Trans. Comput. 2014, 63, 461–474. [Google Scholar] [CrossRef]
- Rublee, E.; Rabaud, V.; Konolige, K.; Bradski, G. ORB: An efficient alternative to SIFT or SURF. In Proceedings of the 2011 IEEE International Conference on Computer Vision (ICCV), Barcelona, Spain, 6–13 November 2011; pp. 2564–2571. [Google Scholar]
- Lv, Q.; Josephson, W.; Wang, Z.; Charikar, M.; Li, K. Multi-probe LSH: Efficient Indexing for High-dimensional Similarity Search. In Proceedings of the 33rd International Conference on Very Large Data Bases, Vienna, Austria, 23–27 September 2007; VLDB Endowment: Vienna, Austria, 2007; pp. 950–961. [Google Scholar]
- Cox, M.A.A.; Cox, T.F. Multidimensional Scaling. In Handbook of Data Visualization; Springer Handbooks Comp. Statistics; Springer: Berlin/Heidelberg, Germany, 2008; pp. 315–347. ISBN 978-3-540-33036-3. [Google Scholar]
- Cayton, L. Algorithms for manifold learning. Univ. Calif. San Diego Tech. Rep 2005, 12, 1. [Google Scholar]
- Birant, D.; Kut, A. ST-DBSCAN: An algorithm for clustering spatial—Temporal data. Data Knowl. Eng. 2007, 60, 208–221. [Google Scholar] [CrossRef]
- Themistocleous, K. Model reconstruction for 3d vizualization of cultural heritage sites using open data from social media: The case study of Soli, Cyprus. J. Archaeol. Sci. Rep. 2017, 14, 774–781. [Google Scholar] [CrossRef]
- Kierkegaard, S. Twitter thou doeth? Comput. Law Secur. Rev. 2010, 26, 577–594. [Google Scholar] [CrossRef]
- VisualSFM: A Visual Structure from Motion System. Available online: http://ccwu.me/vsfm/index.html (accessed on 17 May 2020).
- Paige, C.C. Computational variants of the Lanczos method for the eigenproblem. IMA J. Appl. Math. 1972, 10, 373–381. [Google Scholar] [CrossRef]
© 2020 by the authors. Licensee MDPI, Basel, Switzerland. This article is an open access article distributed under the terms and conditions of the Creative Commons Attribution (CC BY) license (http://creativecommons.org/licenses/by/4.0/).

 ,
, 


