Article

Somatotype and Bioimpedance Vector Analysis: A New Target Zone for Male Athletes

1
Department for Life Quality Studies, University of Bologna, 47921 Rimini, Italy
2
Exercise and Health Laboratory, CIPER, Faculdade Motricidade Humana, Universidade de Lisboa, 1499-002 Cruz Quebrada, Portugal
3
Department of Clinical Research and Development, Akern Ltd., 56121 Pisa, Italy
4
Department of Physical Education and Special Motricity, University Transilvania of Brasov, 500068 Brasov, Romania
5
Department of Biomedical and Neuromotor Sciences, University of Bologna, 40126 Bologna, Italy
*
Author to whom correspondence should be addressed.
Sustainability 2020, 12(11), 4365; https://0-doi-org.brum.beds.ac.uk/10.3390/su12114365
Submission received: 5 May 2020 / Revised: 24 May 2020 / Accepted: 25 May 2020 / Published: 26 May 2020

Abstract

:
Background: Bioelectrical impedance vector analysis (BIVA) is a body composition assessment method based on the interpretation of the raw bioimpedance parameters. While it was initially proposed in clinical settings, its use in the sports field has grown considerably. The aim of this study was: (i) to explore the role of somatotype on BIVA patterns and (ii) to propose a new target zone to improve BIVA analysis in ball games athletes. Methods: One hundred and sixty-four male volleyball, soccer, and rugby players (age 26.2 ± 4.4 yrs; body mass index (BMI) 25.4 ± 2.4 kg/m2) were included in this study. Somatotype and BIVA were measured from anthropometric and bioelectrical data, respectively. Results: Forty-six athletes were classified with an endomorphic mesomorphic somatotype, 26 showed a balanced mesomorphy, 55 were ectomorphic mesomorph, 10 resulted as mesomorph ectomorphs, 13 with a mesomorphic ectomorph somatotype, and in 14 athletes a balanced ectomorphy was assessed. The results of the Hotelling’s T2 test showed significant differences in BIVA patterns for the endomorphic mesomorph group (p < 0.001) in comparison with all the other groups, while mesomorphic balanced athletes presented a more inclined vector compared to the athletes with a balanced ectomorphy (p < 0.003). In addition, the endomorphic mesomorph group showed a greater BMI (p < 0.001) with respect to the athletes grouped in the other somatotype categories. Discriminant analysis revealed two significant functions (p < 0.001). The first discriminant function primarily represented differences based on the bioelectrical standardized resistance parameter (R/H) measure, while the second function reflected differences based on the bioelectrical standardized reactance parameter (Xc/H). Conclusions: Athletes presenting a higher endomorphic component have a lower vector, whereas those with a larger mesomorphic component display higher vector inclinations on the R-Xc graph. We propose a new target zone to improve the interpretation of BIVA analysis in athletes engaged in team sports.

1. Introduction

The assessment of body composition is essential for monitoring health status and the effects of exercise and nutritional regimen in athletes, as well as in the general population.
Morphologic features observed at the whole-body level of body composition analysis are relevant for sports performance [1,2]. In particular, useful information regarding body shape, proportionality, and composition can be obtained by assessing athletes’ somatotype [3]. The anthropometric-based method proposed by Heath and Carter [4] is the most widely used for somatotyping individuals. The calculation is based on rating three numbers: the first number indicates the endomorphy, the second number the mesomorphy, and the third the ectomorphy component. The three calculated components are applied to a spherical triangle (a somatochart) on which the peaks reflect the predominance of one of the three components and the balance between the other two. In this regard, it should be considered that many athletes are not categorized as an exact stereotypical structure but have a preponderance that determines their position in the Heath-Carter proposed somatochart [3].
Nutrition and exercise have been demonstrated to influence somatotype [4]. Thus, anthropometry and body composition features play a crucial role in determining potential success in a particular sport [1,2,5]. Athletes vary in morphology and physical features according to the player’s position in the team. Mesomorphic component is linked to individual sports that require muscle strength such as ball games and martial arts [6,7], while ectomorphy is predominant in runners, especially those involved in long distance [8]. Finally, athletes such as sumo wrestlers require a high amount of body fat, which determines a higher endomorphic component [9].
One of the most used methods to measure body composition in sports is the bioelectrical impedance analysis (BIA) [10]. The obtained raw impedance parameters allow two types of evaluations to be performed. The first is based on a quantitative assessment of body composition, where raw BIA measures (resistance (R) and reactance (Xc)) are inserted into prediction equations to then estimate the body composition variables, including fat mass (FM), fat free mass (FFM), total body water (TBW), and intracellular (ICW) and extracellular water (ECW). The second approach to BIA parameters is represented by a qualitative analysis where the raw impedance measurements are considered simultaneously through the bioimpedance vector analysis (BIVA). In BIVA, R and Xc are standardized for the height of the subject and plotted inside a graph as a point. The vector position can be compared with the percentiles of the reference population, or it is possible to study its displacements by collecting multiple measurements during a period of time (e.g., during a season, after exercise or an intervention program) [11,12,13,14]. Vector elongations or shortenings over time represent decreases or increases in TBW, while lateral displacements reflect changes in inclination, increases or decreases in the ICW/ECW ratio, and are therefore measured in the soft tissues [15,16].
BIVA was first proposed by Piccoli and colleagues in 1994 [17] and has become widely used in clinical settings. Based on the limited data collected, specific target zones were initially identified on the reference tolerance ellipses of the normal population [18,19,20,21,22]. In these ellipses, the athletes were positioned in the upper left side, while the obese population were placed in the lower left portion. Additionally, the right side of the vector analysis represented anorexics and cachexic who were positioned at the top and bottom, respectively. Although these target areas are still reported in recent clinical studies [23,24], latest evidence shows that heavier athletes can be placed in a portion of BIVA typically occupied by obese subjects [25,26,27,28]. Additionally, athletes show different BIVA patters than the normal population as well as among themselves in relation to the type of sport practiced. In particular, cyclists show a less inclined vector when compared to soccer players, indicating less muscle mass, while volleyball players show a shorter and inclined vector compared to these two groups due to a heavier body weight [26].
On this basis, body composition variables at the whole-body level (morphologic characteristics) could contribute to influencing the vector position on the R-Xc graph. A complete understanding of all contributing factors that change vector position would enable researchers and sports and nutrition professionals to correctly interpret BIVA, allowing for a more sustainable approach in assessing body composition. As mentioned above, this is due to the restrictive nature of the actual proposed target zone for athletes. In fact, those with a higher body weight appeared in the zone where obese subjects were categorized [23,24,26]. Therefore, a new target zone can help sports-related professionals and researchers when interpreting athletes’ measurements in BIVA.
Kim et al. in 2010 [29] conducted a pilot study on 21 subjects including fashion models and dancers, demonstrating how BIVA patterns are influenced by somatotype. However, no study, so far, has investigated the influence of the somatotype on the bioimpedance vector in athletes varying in morphologic and physical features. Our hypothesis is that BIVA patterns are influenced by somatotype regardless of body composition characteristics at the molecular level in athletes. Therefore, the aim of this study was to explore the role of somatotype on BIVA patterns and to propose a new target zone in order to improve BIVA analysis in male ball game athletes.

2. Materials and Methods

2.1. Subjects

This was a cross-sectional observational study on 164 athletes (88 volleyball, 41 soccer, and 35 rugby players) belonging to 7 professional Italian teams participating in Series A2, Series B, and Series A divisions in volleyball, soccer, and rugby, respectively (age 26.2 ± 4.4 yrs; body mass index (BMI) 25.4 ± 2.4 kg/m2). The following inclusion criteria were used: (1) a minimum of 10 h to a maximum of 13 h of training per week; (2) tested negative for performance-enhancing drugs; and (3) not taking any medications. All participants gave informed consent after receiving a detailed description of the study procedures. Athletes were tested in the morning (9.00 AM) during the off-season period at the facilities of each team. The project was conducted according to the Declaration of Helsinki and was authorized by the Bioethics Committee of the University of Bologna.

2.2. Procedures

The subjects came to the sport center refraining from vigorous exercise at least 15 h prior, no caffeine and alcohol intake during the preceding 24 h, and consuming a normal evening meal the night before. All athletes were tested to ensure a well-hydrated state using the urine specific gravity test (refractometer Urisys 1100; Roche Diagnostics), from a fasting baseline urine sample, according to Armstrong et al. [30]. A urine specific gravity value <1.022 for the first urine was used to categorize euhydration.
The anthropometric traits were body mass, height, humerus and femur breadths, upper arm (relaxed and contracted), calf, and thigh girths. All anthropometric measurements were taken according to standard methods [31]. Height was recorded to the nearest 0.1 cm using a stadiometer (Raven Equipment Ltd., Great Donmow, UK) and body mass was measured to the nearest 0.1 kg using a high-precision mechanical scale (Seca, Basel, Switzerland). BMI was calculated as the ratio of body weight to height squared (kg/m2). Girths were taken to the nearest 0.1 cm using a tape measure (GMP, Zürich, Switzerland). Breadths were measured to the nearest 0.1 cm using a sliding caliper (GMP, Zürich, Switzerland). Skinfold thicknesses at 8 sites (biceps, triceps, subscapular, supraspinal, suprailiac, lateral calf, medial calf, and thigh) were measured to the nearest 0.1 mm using a Lange skinfold caliper (Beta technology Inc., Cambridge, Maryland). The muscle area of the thigh (TTM), calf (CMA) and upper arm (UMA), as well as the fat area of the thigh, calf, and upper arm (UFA) were calculated according to Frisancho [32].
The impedance measurements were performed by a phase-sensitive single-frequency bioimpedance analyzer (BIA 101 Anniversary, Akern, Florence, Italy), which applies an alternating current of 400 microamperes at 50 kHz. The subjects were in the supine position with a leg opening of 45° compared to the median line of the body and the upper limbs positioned 30° away from the trunk. After cleansing the skin with alcohol, two Ag/AgCl low-impedance electrodes (Biatrodes, Akern Srl, Florence, Italy) were placed on the back of the right hand and two electrodes on the corresponding foot, with a distance of 5 cm between each other. Vector length (Z) was calculated as (adjusted R2 + adjusted Xc2)0.5 and phase angle (PhA) as the arctangent of Xc/R x 180/. BIVA was carried out using the classic methods, e.g., normalizing Z, R, and Xc for height in meters [33].
The BIA parameters obtained for each subject were used to calculate the FM, FFM, TBW, ICW, and ECW values using the software Bodygram®. Somatotype components were calculated, and athletes grouped according to the Heath-Carter method [34].

2.3. Statistical Analysis
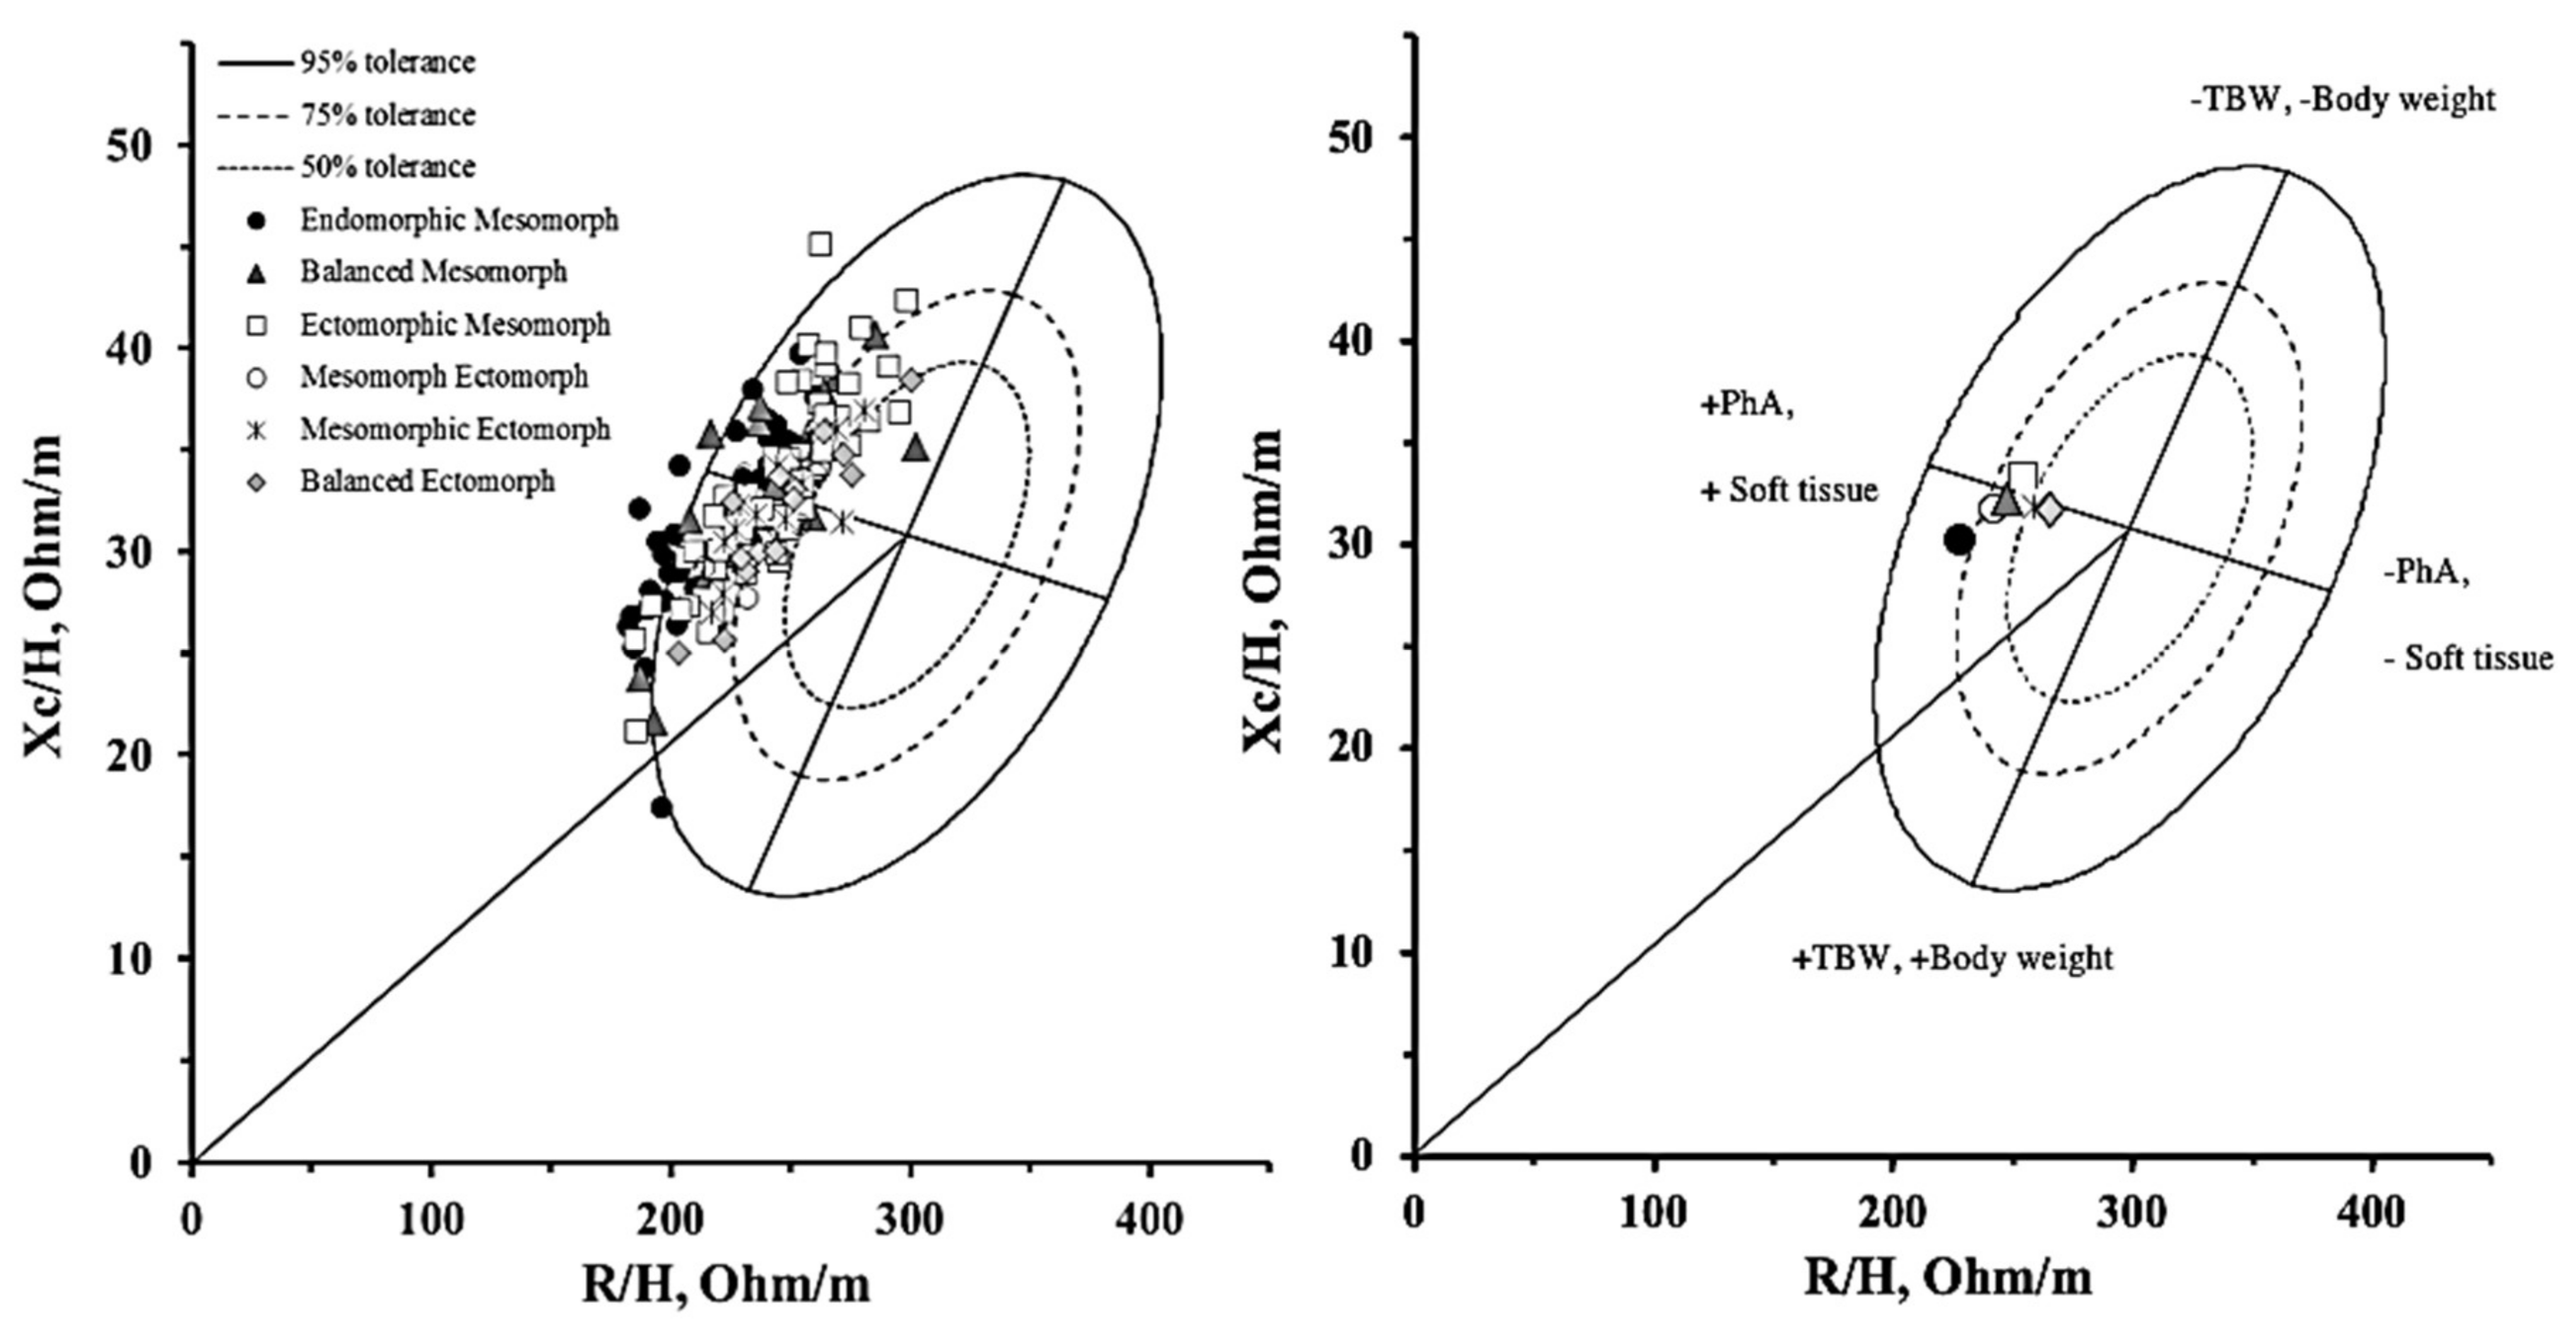
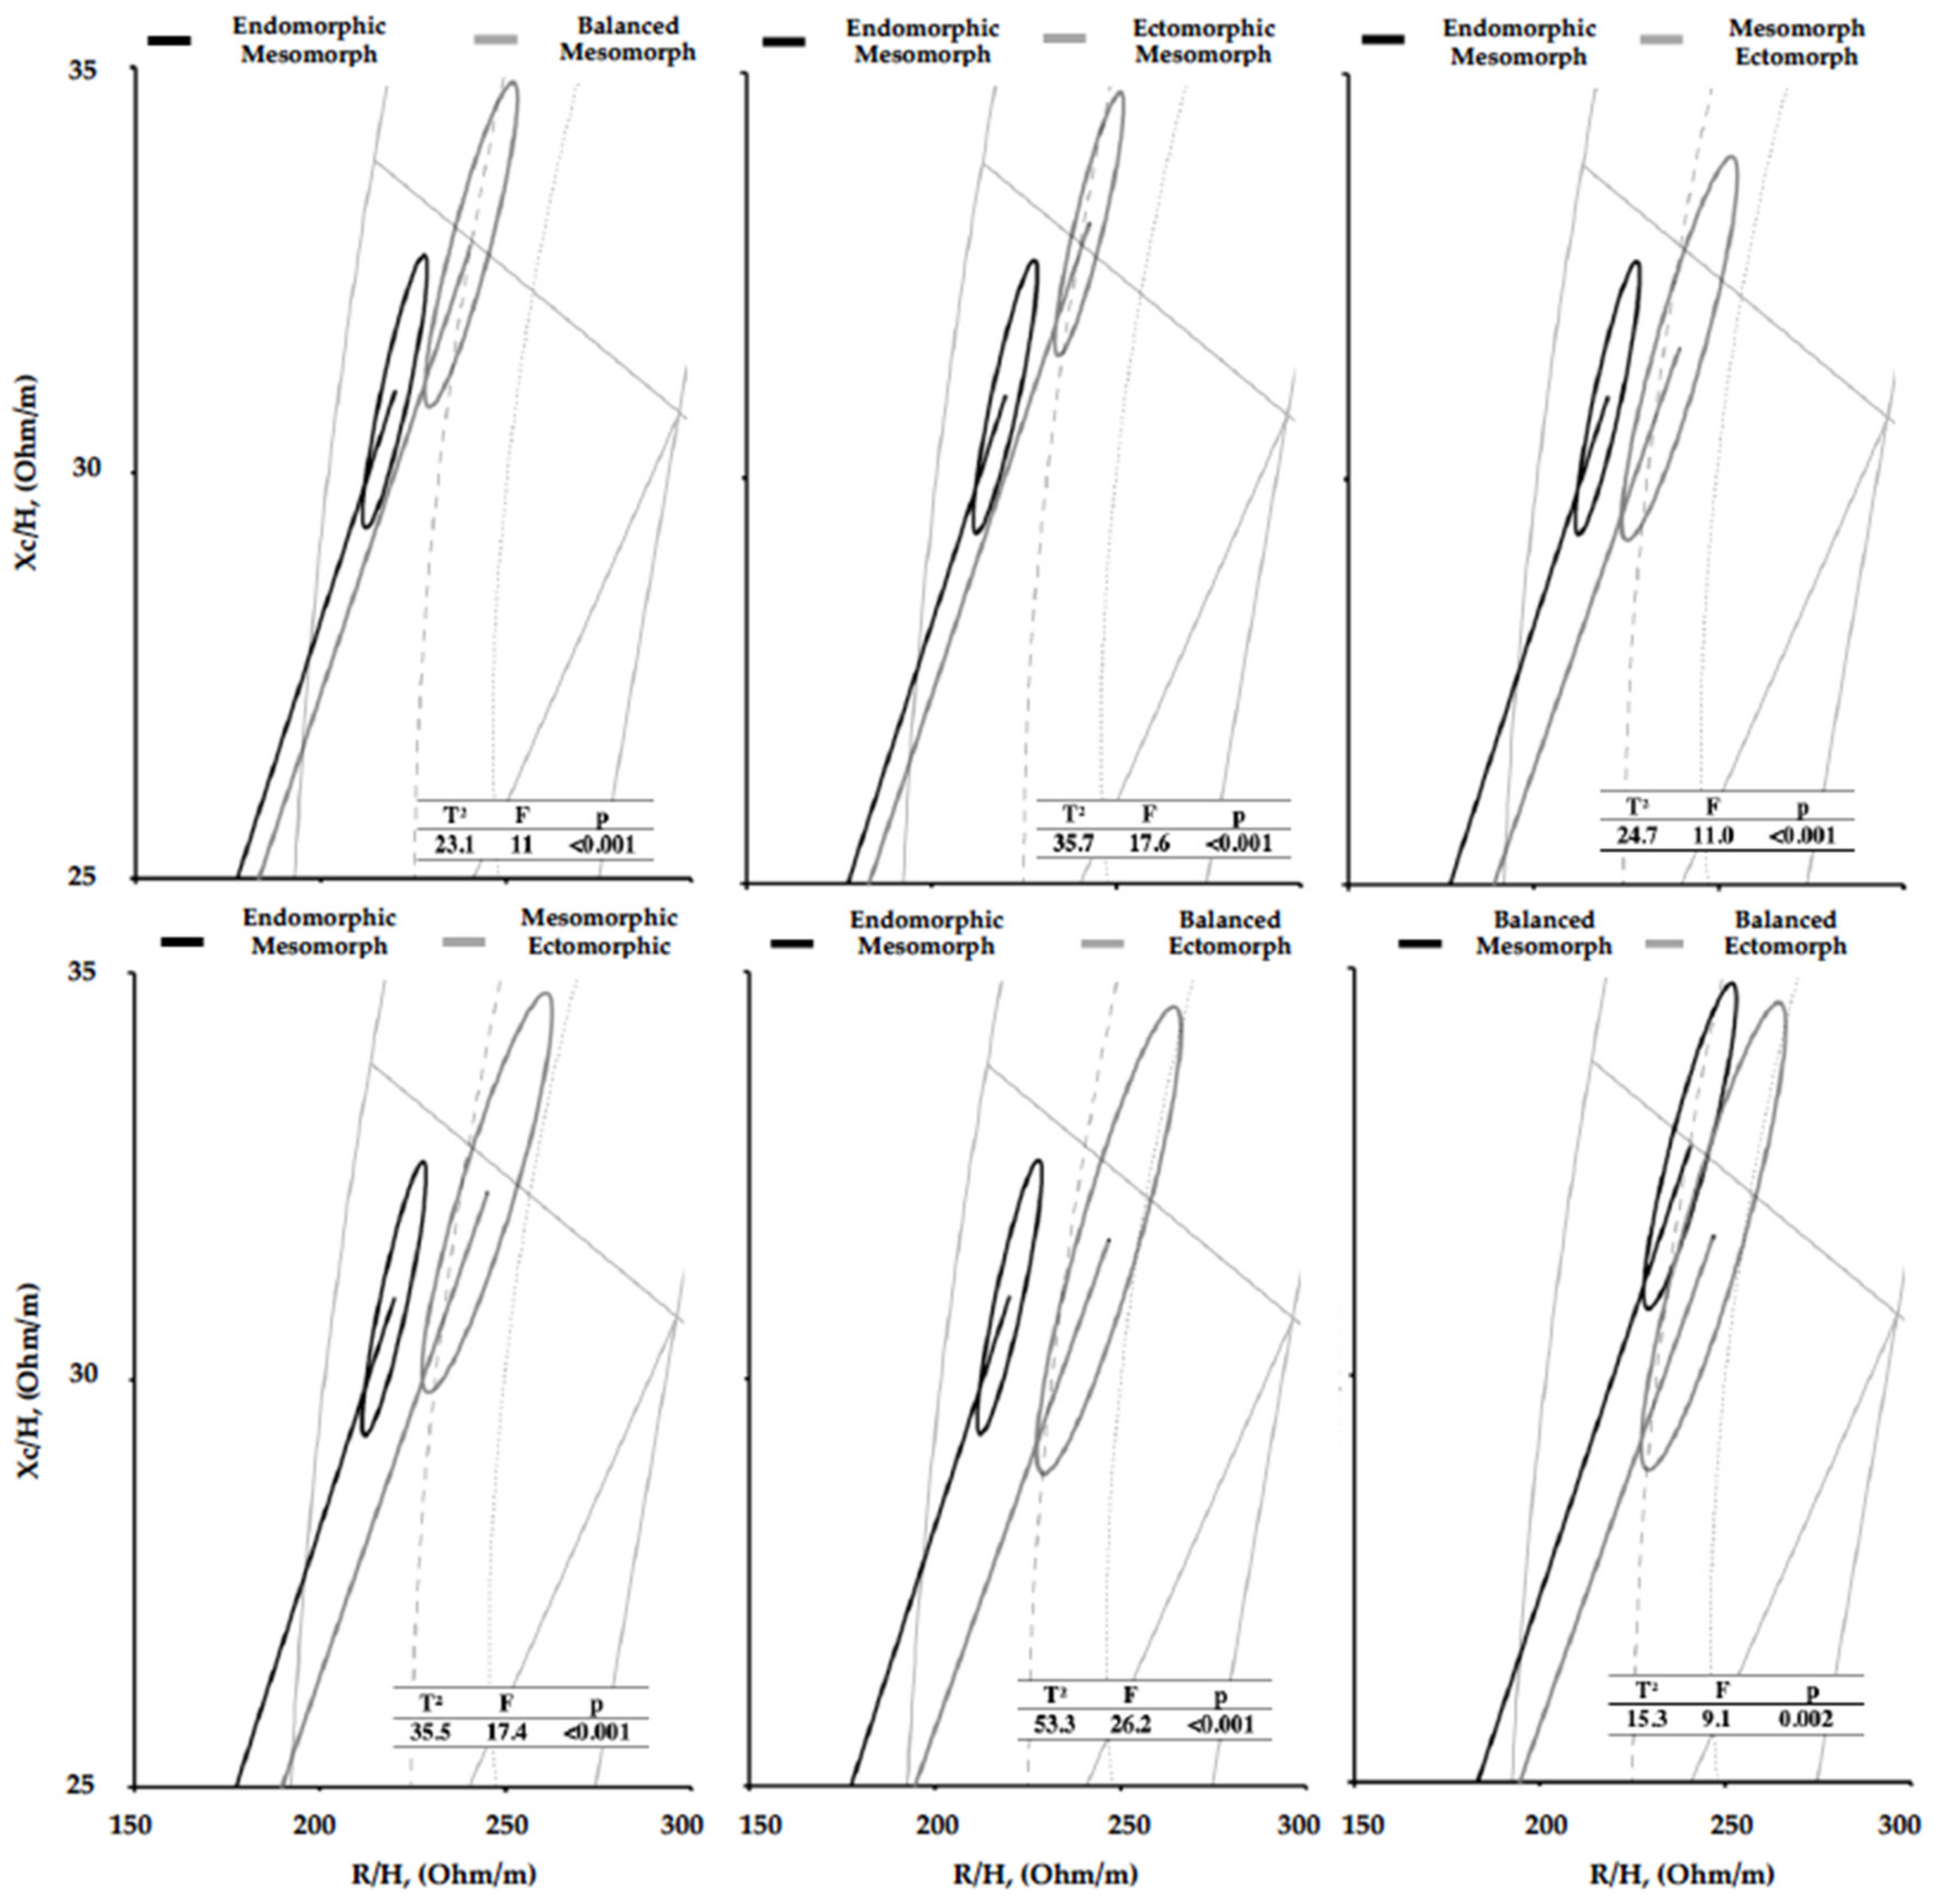
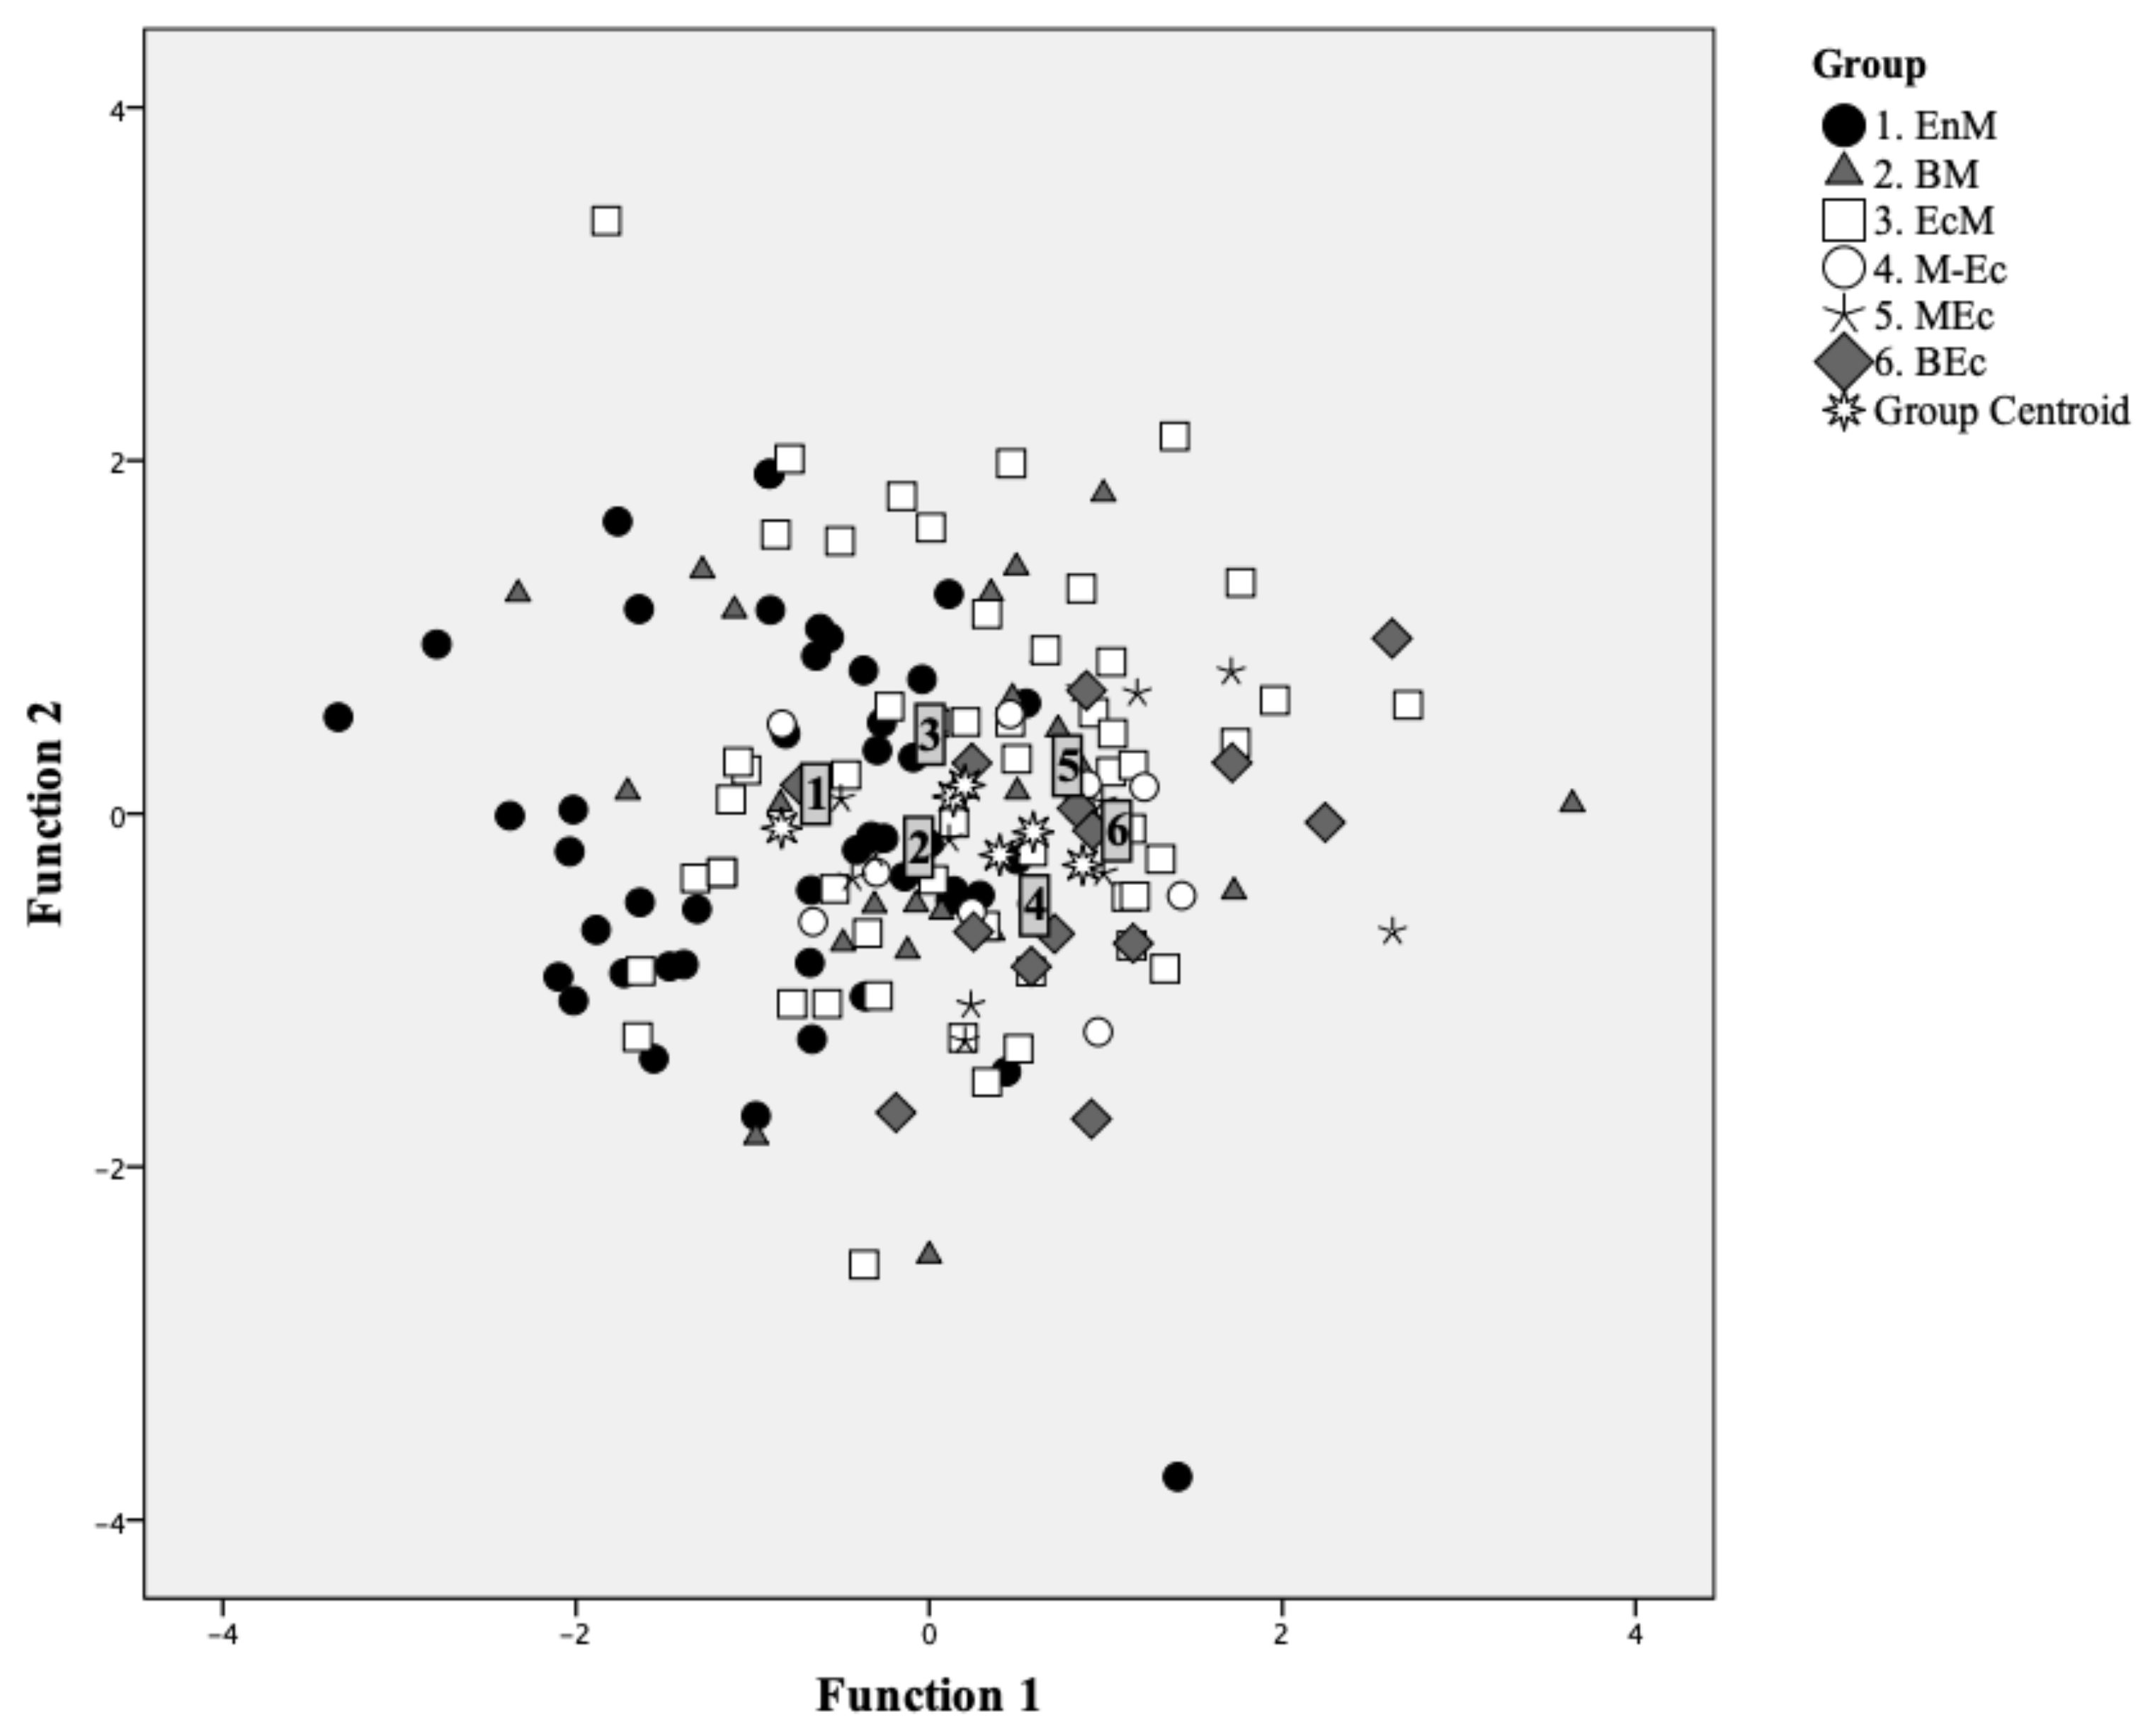
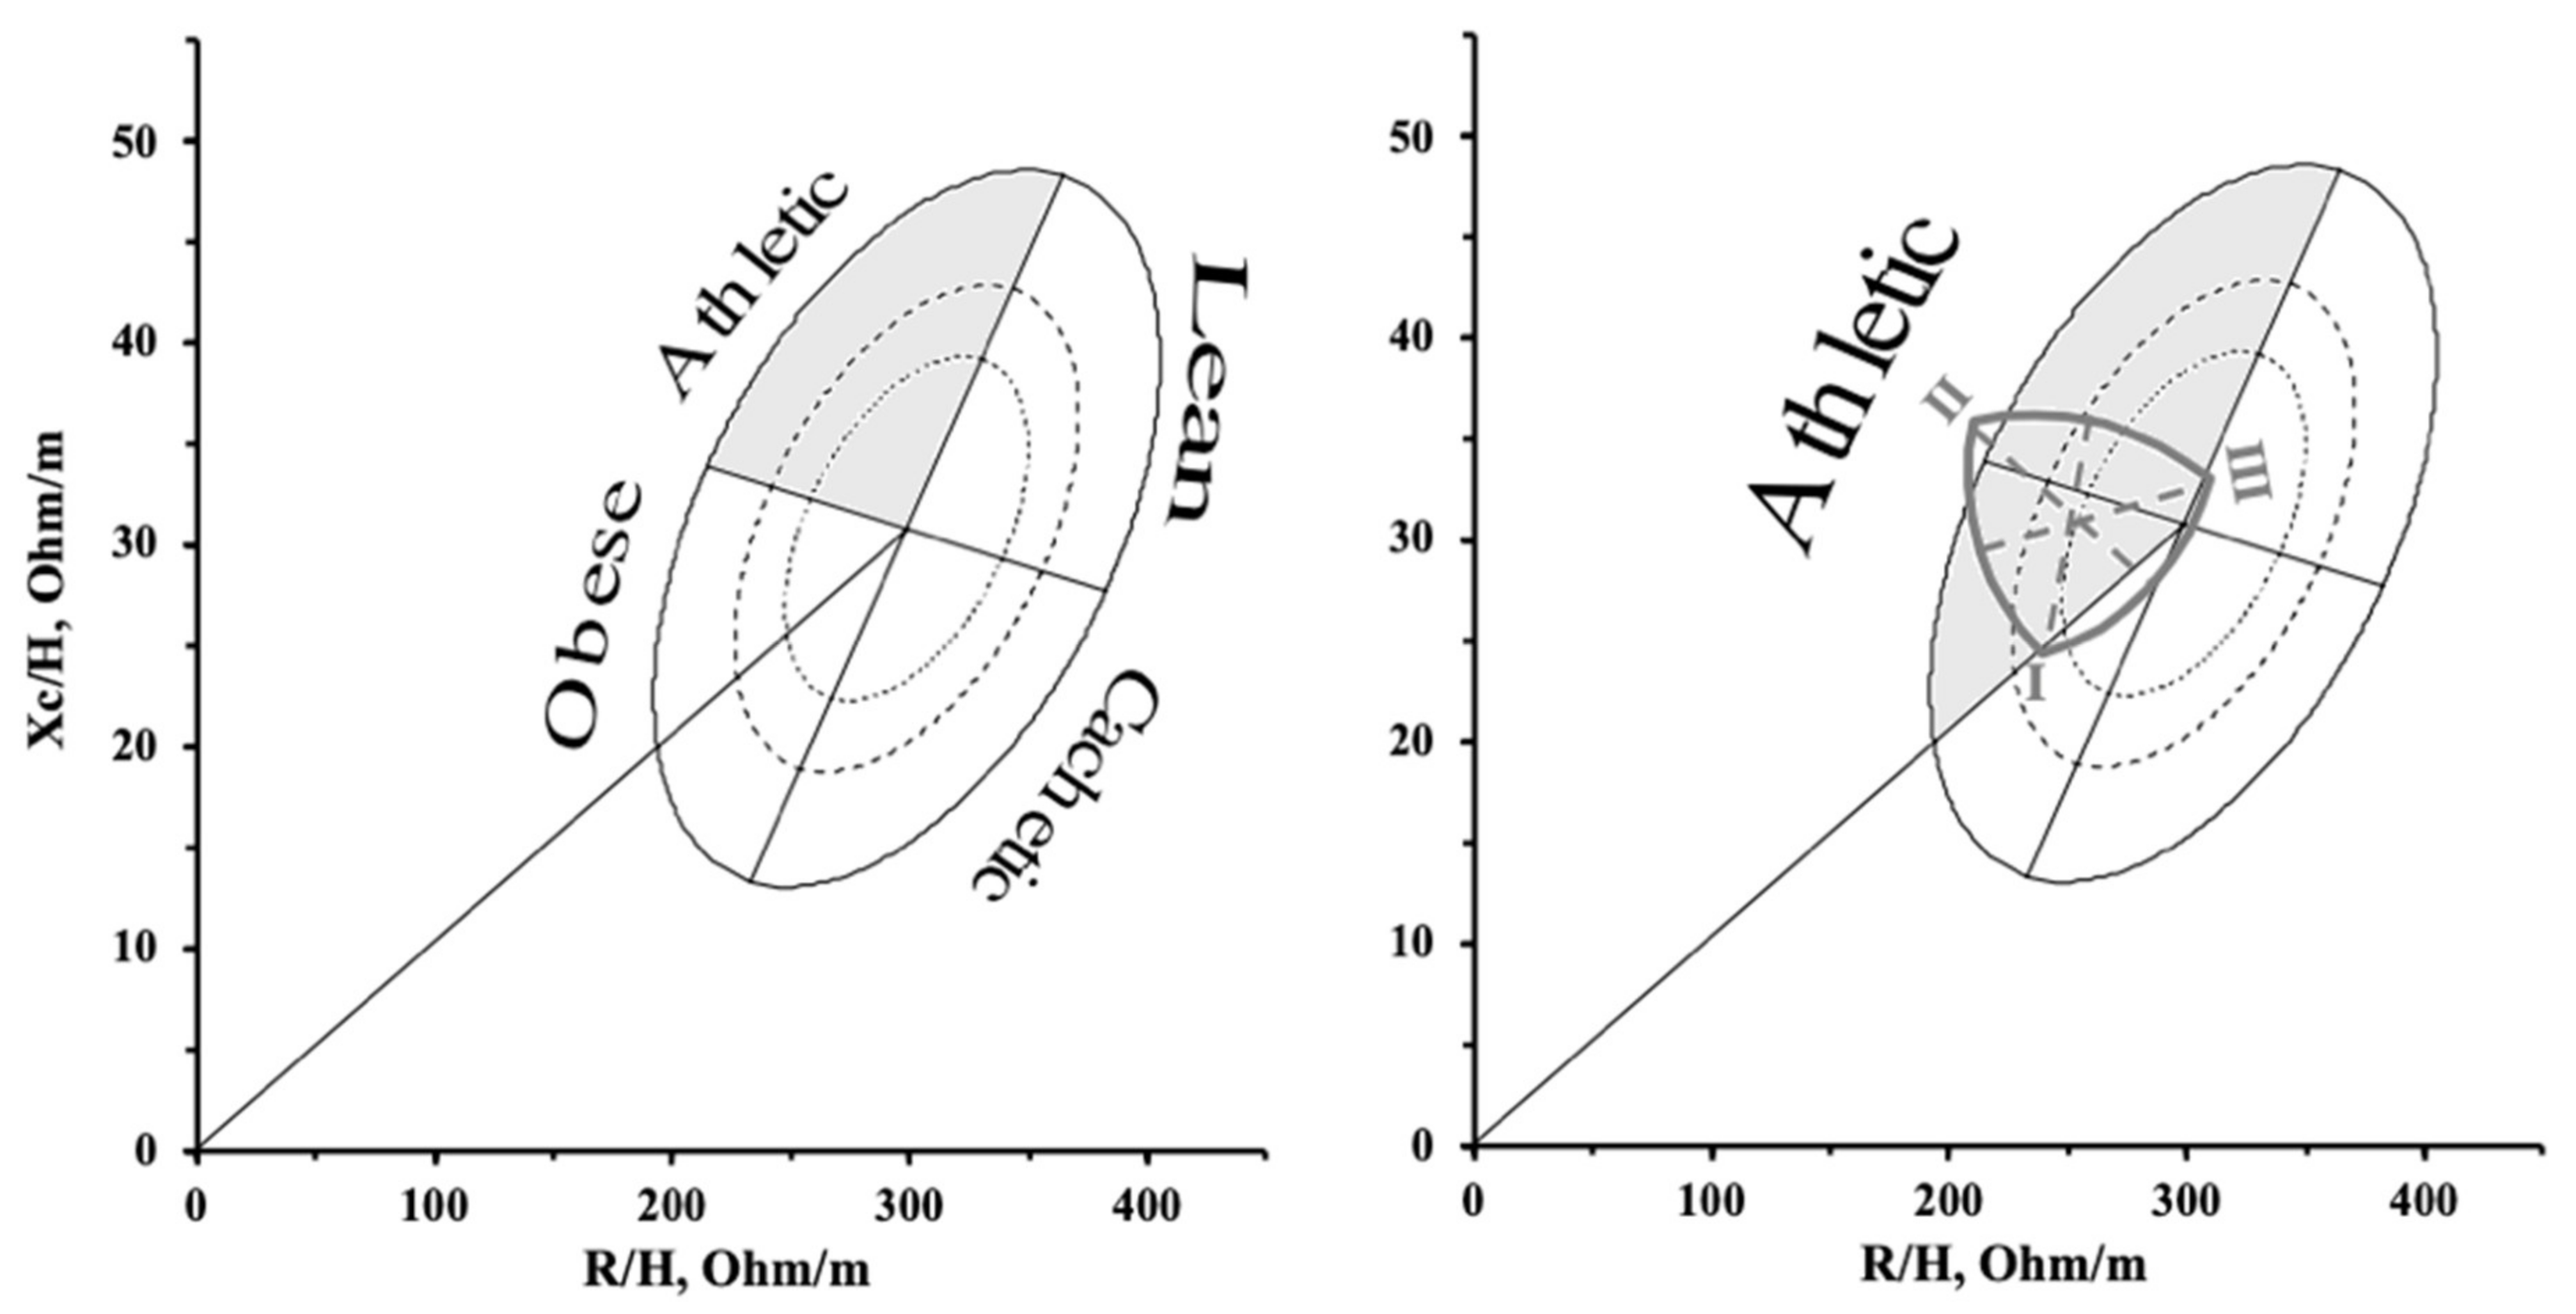
The mean standard deviation was calculated for each variable. To verify the normality of the data, the Shapiro–Wilk test was applied. Univariate analysis of variance for multiple comparisons was performed. When a significant F ratio was obtained, the Bonferroni post hoc test was used to assess the differences among the groups (p < 0.003). The two-sample Hotelling’s T2 test was used to compare the mean impedance vectors of the different somatotype categories. Discriminant function analysis (stepwise criteria) was then applied to R/H, Xc/H, Z/H, and PhA to classify athletes into the different somatotype categories according to bioelectric features. Data was analyzed with IBM SPSS Statistics (version 24.0; IBM, Chicago, IL).

3. Results

The descriptive statistics of anthropometric, body composition, bioelectrical, and somatotype components are presented in Table 1.
Six types of somatotypes have been recognized based on the athlete’s position on the somatochart (Figure 1):
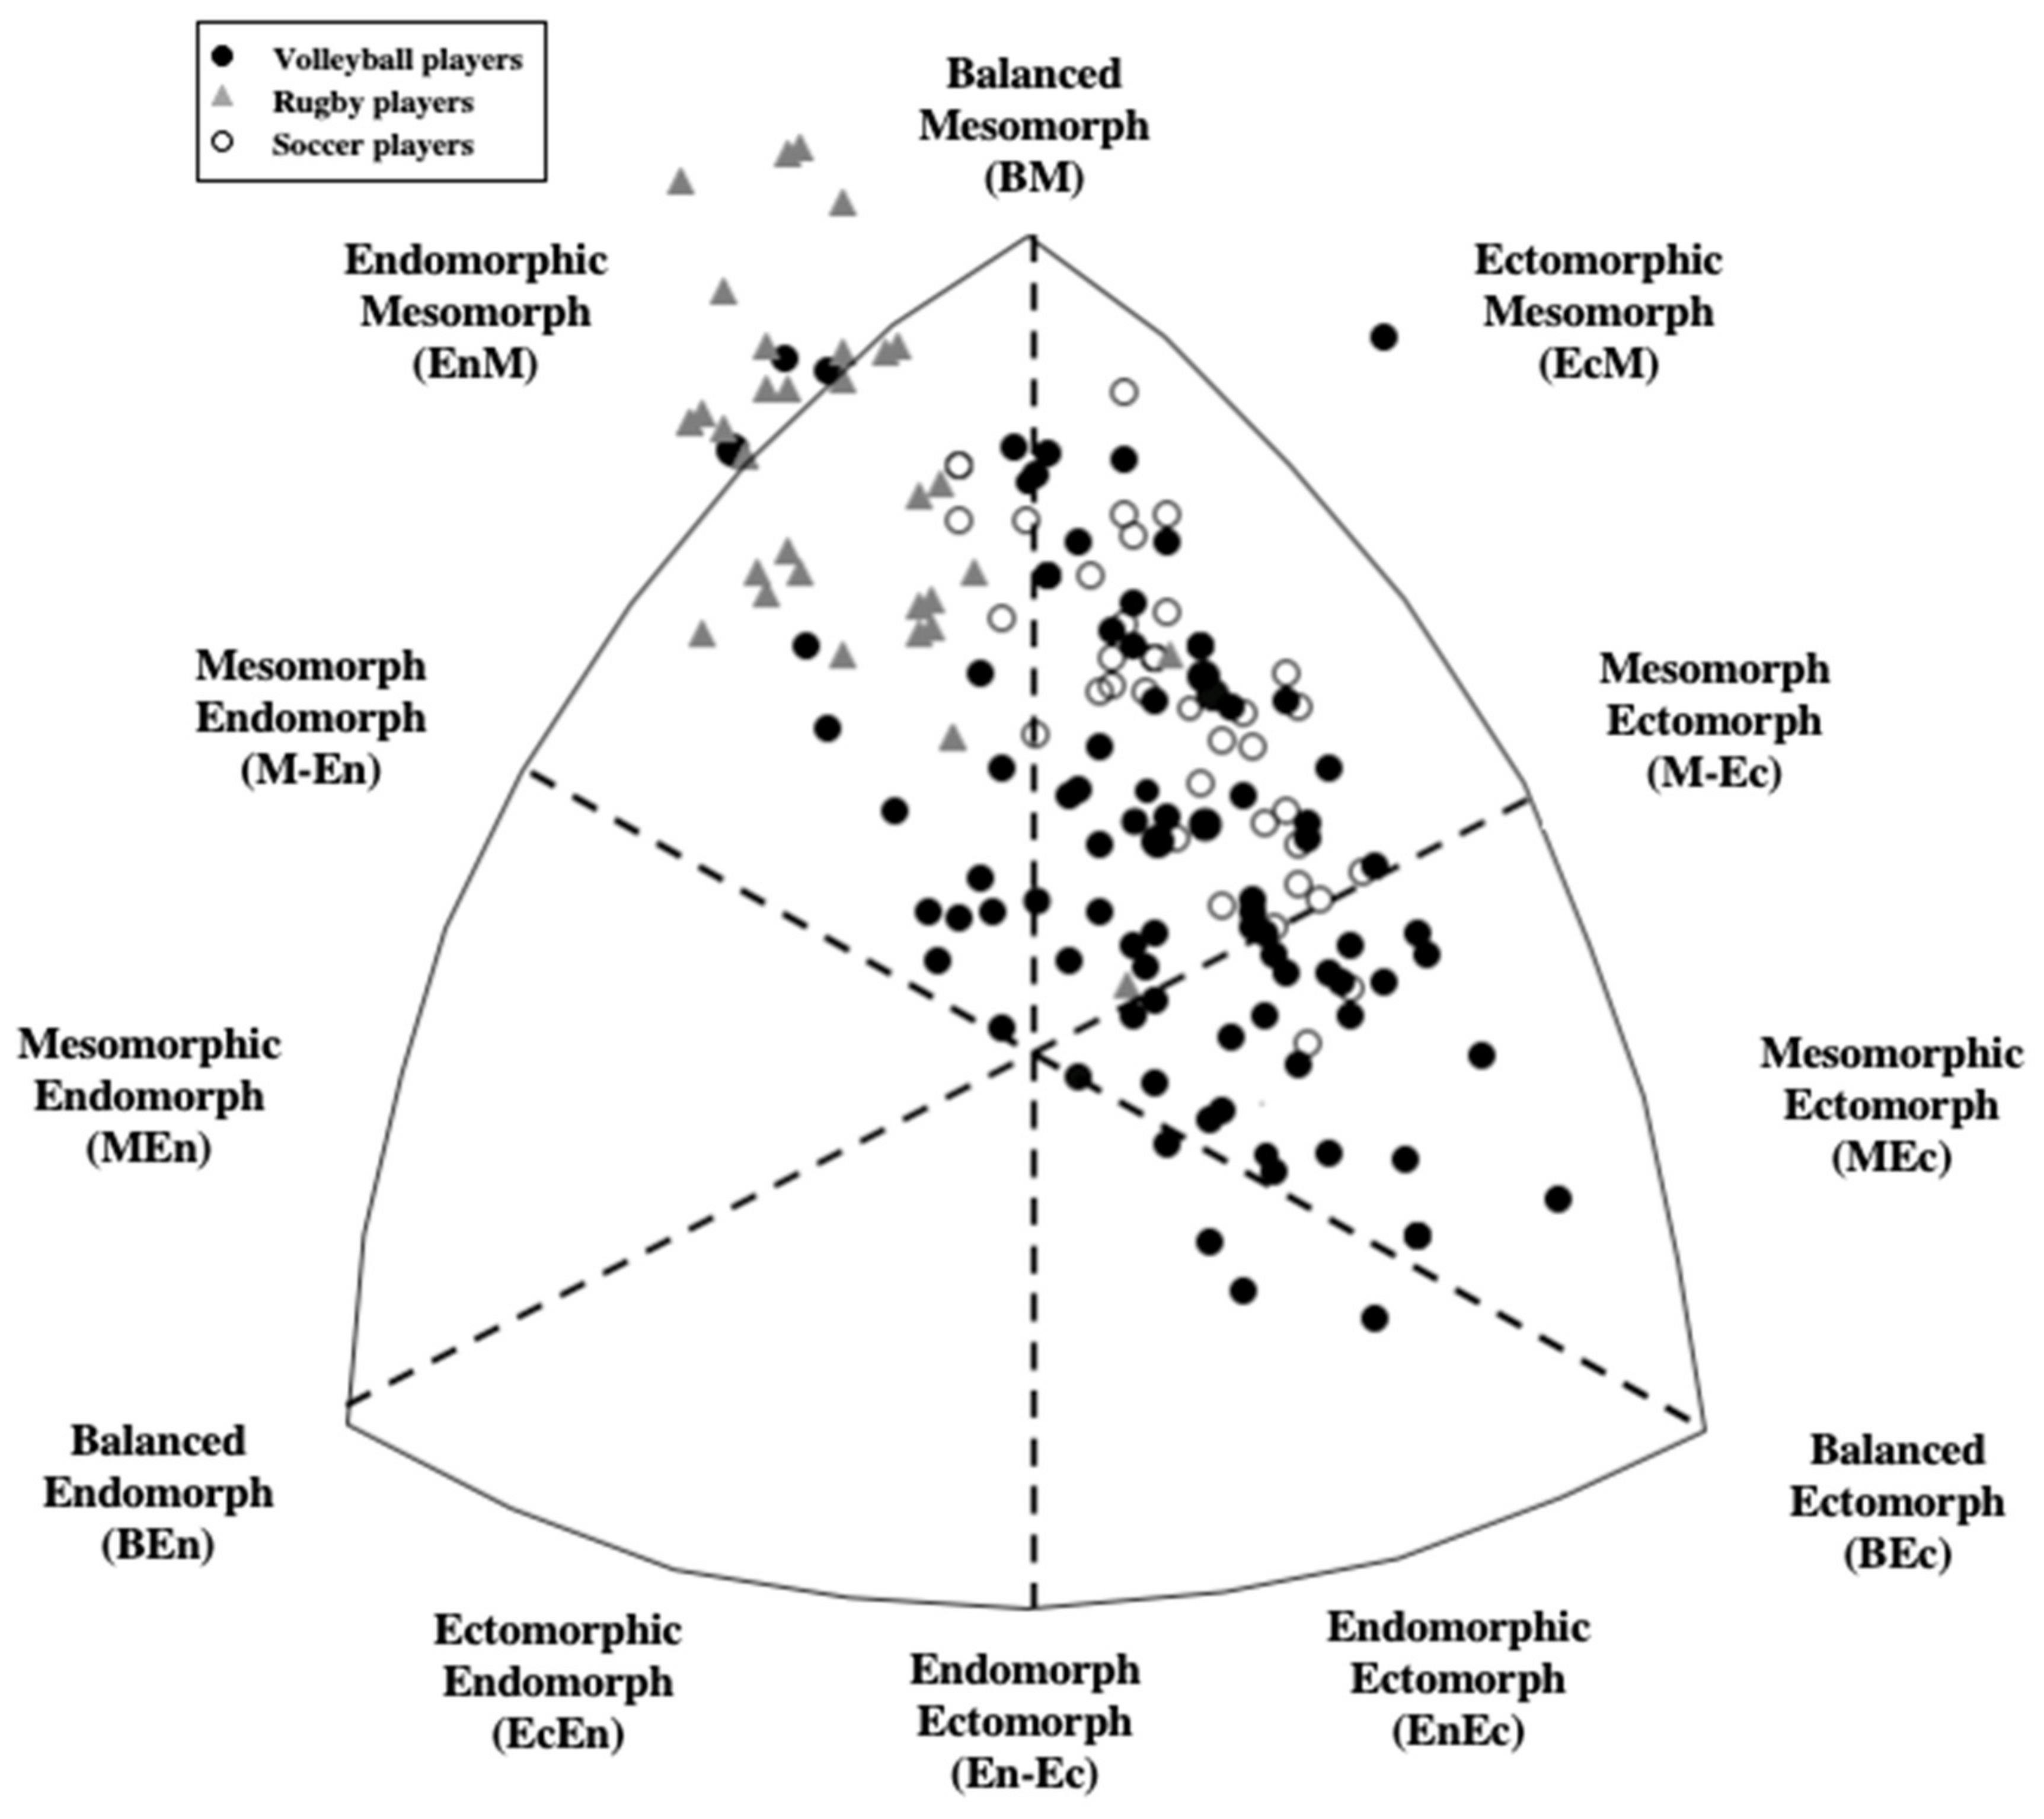
  • Endomorphic mesomorph: mesomorphy was dominant and endomorphy was greater than ectomorphy (more than 0.5 units).
  • Balanced mesomorph: mesomorphy was dominant, and endomorphy and ectomorphy were similar (no difference or <0.5 units).
  • Ectomorphic mesomorph: mesomorphy was dominant and ectomorphy was greater than endomorphy (more than 0.5 units).
  • Mesomorph ectomorph: endomorphy and ectomorphy were similar (no difference or <0.5 units).
  • Mesomorphic ectomorph: ectomorphy was dominant and mesomorphy was greater than endomorphy (more than 0.5 units).
  • Balanced ectomorphy: ectomorphy was dominant, and endomorphy and ectomorphy were similar (no difference or <0.5 units).
Endomorphic mesomorph athletes included 33 rugby, 10 volleyball, and 3 soccer players; balanced mesomorph athletes included 19 volleyball and 7 soccer players; ectomorphic mesomorph athletes included 22 volleyball, 31 soccer, and 2 rugby players; mesomorph ectomorph athletes included 10 volleyball players; mesomorphic ectomorph athletes included 13 volleyball players; and balanced ectomorph athletes included 14 volleyball players. Overall, rugby players showed on average an endomorphic mesomorph somatotype, while soccer and volleyball player presented an ectomorphic mesomorph profile.
Table 2 provides the comparison of anthropometric, body composition, bioelectrical, and somatotype features. Endomorphic mesomorph athletes showed a higher BMI than all the other groups (p < 0.003), and additionally presented greater endomorphy, mesomorphy, and ectomorphy components compared with the athletes of different somatotype.
Figure 2 shows the vector displacement of the six somatotype groups on the R-Xc graph. Endomorphic mesomorph athletes showed a shorter vector in comparison with the other groups (p < 0.001), while athletes with a balanced mesomorphy presented a more inclined vector compared to athletes with a balanced ectomorphy (p < 0.001) (Figure 3). No statistically significant differences were found between the other groups. Figure 3 shows the results of the Hotelling’s T2 test; separate 95% confidence ellipses indicated a significant vector difference.
Discriminant analysis revealed two significant functions (p < 0.001) (Table 3). The first discriminant function primarily represented differences based on the R/H. The second discriminant function represented differences based on the Xc/H proportion. All of the variance explained by the model is due to the first two discriminant functions. Based on values of Wilk’s lambda, the first discriminant function accounted for 93.1% (eigenvalue = 0.326) of the total variance, while the second discriminant function explained 6.9% (eigenvalue = 0.024) of the remaining variance. Figure 4 represents group centroid distances between somatotype categories for both discriminant functions.

4. Discussion

This study showed the role of somatotype on BIVA patterns in athletes. In particular, when the endomorphic component was higher, the vector resulted in a lower position on the R-Xc graph, while a larger mesomorphic component resulted in a higher vector inclination and, thus, an increased PhA. We also proposed a new target zone that improves BIVA analysis in this particular sample of male athletes. This new target zone extends the area where athletes can be positioned, showing how the three somatotype components (I = endomorphy, II = mesomorphy, and III = ectomorphy) contribute to the vector placements (Figure 5).
The athletes tested in this study were involved in one of three typical team sports where optimal body composition features are necessary [1,2]. However, some of these athletes had a greater BMI and an FM% slightly higher than average compared to their teammates. These resulted in an athlete with a somatotype where the mesomorphic component was predominant, but the endomorphic value was greater than the ectomorphic measurement. In fact, 94% of the rugby players evaluated showed an endomorphic mesomorph somatotype. This can be an advantage for rugby players, especially those who play the position of pylon, where a greater weight is favorable for their performance [35,36]. This group of athletes presented a greater BMI but also tended to have a greater FM distribution in the arm, thigh, and calf segments. This trend reflected a significantly shorter vector in comparison to the other groups. The analysis of the average impedance vectors also showed a significant difference between the groups with balanced mesomorphy and ectomorphy. In particular, subjects with a greater mesomorphic component showed a vector significantly more inclined and a greater PhA when compared to athletes with a balanced ectomorphic somatotype. Although not statistically significant, athletes with a balanced mesomorphy showed a tendency for a greater TMA, CMA, and UMA as an expected result of a higher skeletal muscle component. Vector length has recently been associated with the amount of intra- and extracellular fluids obtained through dilution techniques as the reference method, while the inclination that determines the PhA is directly associated with the ICW/ECW ratio [15,16].
The R/H variable stands for the first discriminant function that primarily represents differences between athletes of different somatotypes. The main difference in BIVA patterns among the athletes examined in this study was linked to the different morphology of the athletes categorized with an endomorphic mesomorph somatotype. This was reflected in a lower and more inclined vector in the R-Xc graph observed in these athletes compared to the other somatotype classes. This is in accordance with previous studies that the major differences among high-level and elite athletes can be found considering R/H and X/C simultaneously in BIVA [26,27,37], which is due to the inverse association of R with TBW, while Xc is directly proportionate to the cellular density [17]. Therefore, while ICW/ECW ratio can be similar among athletes, the absolute values of ICW and ECW can differ, reflecting the different body structures. In this regard, BIVA has a higher efficiency when evaluating body composition than only the interpretation on PhA [26]. This is due to BIVA taking into consideration the vector inclination, which reflects PhA and, therefore, ICW/ECW ratio, in addition to the vector length, which represents TBW [15]. In this study, the endomorphic mesomorph athletes showed that both values for R/H and Xc/H tended to be lower. These values, when analyzed simultaneously through the Hotelling’s T2 test, resulted in a significantly shorter and inclined vector in the R/Xc graph in comparison to the other athletes.
The athletes involved in this study showed a somatotype in line with earlier studies conducted in volleyball, rugby, and soccer players [2,38,39]. In particular, rugby players were found to have an endomorphic mesomorph somatotype, while soccer players and volleyball players presented an ectomorphic mesomorph somatotype. Some athletes showed different morphological characteristics compared to those of their group average, but this is due to the different requirements of the positions played, as already recognized [39,40]. In line with reports by previous studies [26,27] athletes were positioned outside the 50th percentile of the tolerance ellipses, indicating greater ICW/ECW ratio and soft tissues compared to the general population. On the other hand, for the same type of sport, differences in the inclination angle between the impedance vector and the standardized resistance were found according to competitive levels, with greater PhA observed in top-level athletes [26,27,41].
Considering that, in our study, athletes underwent a single measurement, the vector position in the R-Xc graph reflects body composition features. On the contrary, studies in which more than one BIVA test has been collected have shown that the vector may undergo temporary changes. Exercise that causes fluid loss, for example, generates a vector lengthening in the short term [42,43]. On the other hand, Pollastri et al. [44] demonstrated that during a cycling tour, vector shortening is accompanied by an increase in body weight. This condition could have identified water retention and edema, a scenario that also occurs following muscle injuries. In this regard, Nescolarde and colleagues [45] conducted an observational prospective study with professional soccer players that presented muscle injuries. The authors monitored bioimpedance parameters using a localized approach and observed decreases in R as a result of edema in the injured limb, and decreases in PhA as a consequence of increases in the ECW/ICW ratio [45]. Therefore, if the somatotype does not change over time, the vector position can be influenced by the loss or gain of body fluids that can occur in athletes as a result of a variety of different conditions.
BIVA patterns can also change during the competitive season, which highlights this approach as a useful tool in providing information on training adaptations occurring throughout the season [46]. Shortening and lengthening in the vector inclination are instead obtained with the increase of somatic maturation, reflecting changes in body composition that occur alongside growth [47]. Otherwise, in response to following an exercise program, there is a lengthening and a shift to the left of the vector due to a reduction in extracellular fluids and an increase in ICW/ECW ratio. Finally, an anomalous case of vector alteration can be represented by measurements taken immediately after exercise, where a high body temperature can lead to flaws in BIA [48].
Some limitations in this study should be considered. First, our results are applicable to single-frequency BIA equipment. In fact, different results in measuring raw BIA parameters are obtained using devices that work on single- or multi-frequency [49]. In addition, our results are only generalized for male athletes involved in team sports. Further studies should be conducted in other sports, with a different body composition profile, and also in the female athletic population. Lastly, BIVA should not be considered as an alternative tool for measuring the somatotype, but as an additional approach to evaluating athletes considering that morphology, together with other body composition parameters, influences the vector position in the R-Xc graph.

5. Conclusions

This study demonstrates how the different components of the somatotype are associated with the BIVA patterns. A greater endomorphic component is associated with a shorter vector, while a larger mesomorphic component is associated with an increase in the vector inclination in the R-Xc graph. The vector position is therefore determined by the body composition characteristics at the molecular and whole-body levels. A new target zone should be considered to improve the interpretation of BIVA analysis in a male athletic population involved in team sports.

Author Contributions

Conceptualization, F.C. and S.T.; methodology, F.C., A.M.S., C.N.M., J.T., and S.T.; software, F.C. and S.T.; formal analysis, F.C. and S.T.; investigation, F.C. and S.T.; data curation, A.M.S., C.N.M., F.C., J.T., G.B., and S.T.; writing—original draft preparation, F.C., A.M.S., C.N.M., J.T., G.B., and S.T.; visualization, F.C., G.B., J.T., and S.T.; supervision, S.T., J.T.; project administration, F.C. All authors have read and agreed to the published version of the manuscript.

Funding

This research received no external funding.

Acknowledgments

The authors are grateful to all the athletes who took part in this study.

Conflicts of Interest

The authors declare no conflict of interest.

References

  1. Campa, F.; Semprini, G.; Júdice, P.B.; Messina, G.; Toselli, S. Anthropometry, physical and movement features, and repeated-sprint ability in soccer players. Int. J. Sports Med. 2019, 40, 100–109. [Google Scholar] [CrossRef]
  2. Toselli, S.; Campa, F. Anthropometry and functional movement patterns in elite male volleyball players of diferent competitive levels. J. Strength Cond. Res. 2018, 32, 2601–2611. [Google Scholar] [CrossRef] [PubMed]
  3. Carter, J.E.L.; Heath, B.H. Somatotyping Development and Applications; Cambridge University Press: Cambridge, UK, 1990. [Google Scholar]
  4. Carter, J.E.; Phillips, W.H. Structural changes in exercising middle-aged males during a 2-year period. J. Appl. Physiol. 1969, 27, 787–794. [Google Scholar] [CrossRef] [PubMed]
  5. Choudhary, S.; Singh, S.; Singh, I.; Varte, L.R.; Sahani, R.; Rawat, S. Somatotypes of Indian Athletes of Different Sports. Online J Health Allied Sci. 2019, 18, 6. [Google Scholar]
  6. Gualdi, R.E.; Graziani, I. Anthropometric somatotype of Italian sport participants. J. Sports Med. Phys. Fit. 1993, 33, 282–291. [Google Scholar] [PubMed]
  7. Raković, A.; Savanović, V.; Stanković, D.; Pavlović, R.; Simeonov, A.; Petković, E. Analysis of the elite athletes’ somatotypes. Acta Kinesiol. 2015, 9, 47–53. [Google Scholar]
  8. Sánchez Muñoz, C.; Muros, J.J.; López Belmonte, Ó.; Zabala, M. Anthropometric characteristics, body composition and somatotype of elite male young runners. Int. J. Environ. Res. Public Health 2020, 17, 674. [Google Scholar] [CrossRef] [Green Version]
  9. Sánchez-Muñoz, C.; Zabala, M.; Williams, K. Anthropometric variables and its usage to characterise elite youth athletes. In Handbook of Anthropometry; Preedy, V., Ed.; Springer: New York, NY, USA, 2012; ISBN 978-1-4419-1787-4. [Google Scholar]
  10. Castizo-Olier, J.; Irurtia, A.; Jemni, M.; Carrasco-Marginet, M.; Fernández-García, R.; Rodríguez, F.A. Bioelectrical impedance vector analysis (BIVA) in sport and exercise: Systematic review and future perspectives. PLoS ONE 2018, 13, e0197957. [Google Scholar] [CrossRef]
  11. Campa, F.; Matias, C.N.; Marini, E.; Heymsfield, S.B.; Toselli, S.; Sardinha, L.B.; Silva, A.M. Identifying athlete body-fluid changes during a competitive season with bioelectrical impedance vector analysis. Int. J. Sports Physiol. Perform. 2020, 15, 361–367. [Google Scholar] [CrossRef]
  12. Campa, F.; Silva, A.M.; Toselli, S. Changes in phase angle and handgrip strength induced by suspension training in older women. Int. J. Sports Med. 2018, 39, 442–449. [Google Scholar] [CrossRef]
  13. Souza, M.F.; Tomeleri, C.M.; Ribeiro, A.S.; Schoenfeld, B.J.; Silva, A.M.; Sardinha, L.B.; Cyrino, E.S. Effect of resistance training on phase angle in older women: A randomized controlled trial. Scand. J. Med. Sci. Sports 2017, 27, 1308–1316. [Google Scholar] [CrossRef] [PubMed]
  14. Toselli, S.; Badicu, G.; Bragonzoni, L.; Spiga, F.; Mazzuca, P.; Campa, F. Comparison of the effect of different resistance training frequencies on phase angle and handgrip strength in obese women: A randomized controlled trial. Int. J. Environ. Res. Public Health 2020, 17, 1163. [Google Scholar] [CrossRef] [PubMed] [Green Version]
  15. Marini, E.; Campa, F.; Buffa, R.; Stagi, S.; Matias, C.N.; Toselli, S.; Sardinha, L.B.; Silva, A.M. Phase angle and bioelectrical impedance vector analysis in the evaluation of body composition in athletes. Clin. Nutr. 2020, 39, 447–454. [Google Scholar] [CrossRef]
  16. Francisco, R.; Matias, C.N.; Santos, D.A.; Campa, F.; Minderico, C.S.; Rocha, P.; Heymsfield, S.B.; Lukaski, H.; Sardinha, L.B.; Silva, A.M. The predictive role of raw bioelectrical impedance parameters in water compartments and fluid distribution assessed by dilution techniques in athletes. Int. J. Environ. Res. Public Health 2020, 17, 759. [Google Scholar] [CrossRef] [PubMed] [Green Version]
  17. Piccoli, A.; Rossi, B.; Pillon, L.; Bucciante, G. A new method for monitoring body fluid variation by bioimpedance analysis: The RXc graph. Kidney Int. 1994, 46, 534–539. [Google Scholar] [CrossRef] [PubMed] [Green Version]
  18. Piccoli, A.; Nigrelli, S.; Caberlotto, A.; Bottazzo, S.; Rossi, B.; Pillon, L.; Maggiore, Q. Bivariate normal values of the bioelectrical impedance vector in adult and elderly populations. Am. J. Clin. Nutr. 1995, 61, 269–270. [Google Scholar] [CrossRef] [PubMed]
  19. Piccoli, A.; Pillon, L.; Dumler, F. Impedance vector distribution by sex, race, body mass index, and age in the United States: Standard reference intervals as bivariate Z scores. Nutrition 2002, 18, 153–167. [Google Scholar] [CrossRef]
  20. Rösler, A.; Lehmann, F.; Krause, T.; Wirth, R.; Von Renteln-Kruse, W. Nutritional and hydration status in elderly subjects: Clinical rating versus bioimpedance analysis. Arch. Gerontol. Geriatr. 2010, 50, e81–e85. [Google Scholar] [CrossRef]
  21. Bronhara, B.; Piccoli, A.; Pereira, J.C.R. Fuzzy linguistic model for bioelectrical impedance vector analysis. Clin. Nutr. 2012, 31, 710–716. [Google Scholar] [CrossRef]
  22. Maioli, M.; Toso, A.; Leoncini, M.; Musilli, N.; Bellandi, F.; Rosner, M.H.; McCullough, P.A.; Ronco, C. Pre-procedural bioimpedance vectorial analysis of fluid status and prediction of contrast-induced acute kidney injury. J. Am. Coll. Cardiol. 2014, 63, 1387–1394. [Google Scholar] [CrossRef]
  23. González-Correa, C.H. Body composition by bioelectrical impedance analysis. In Bioimpedance in Biomedical Applications and Research; Simini, F., Bertemes-Filho, P., Eds.; Springer: Cham, Switzerland, 2018; ISBN 978-3-319-74387-5. [Google Scholar]
  24. Nwosu, A.C.; Mayland, C.R.; Mason, S.; Cox, T.F.; Varro, A.; Stanley, S.; Ellershaw, J. Bioelectrical impedance vector analysis (BIVA) as a method to compare body composition differences according to cancer stage and type. Clin. Nutr. 2019, 30, 59–66. [Google Scholar] [CrossRef] [PubMed] [Green Version]
  25. Campa, F.; Toselli, S. Bioimpedance vector analysis of elite, subelite, and low-level male volleyball players. Int. J. Sports Physiol. Perform. 2018, 13, 1250–1253. [Google Scholar] [CrossRef] [PubMed]
  26. Campa, F.; Matias, C.; Gatterer, H.; Toselli, S.; Koury, J.C.; Andreoli, A.; Melchiorri, G.; Sardinha, L.B.; Silva, A.M. Classic bioelectrical impedance vector reference values for assessing body composition in male and female athletes. Int. J. Environ. Res. Public Health 2019, 16, 5066. [Google Scholar] [CrossRef] [PubMed] [Green Version]
  27. Micheli, M.L.; Pagani, L.; Marella, M.; Gulisano, M.; Piccoli, A.; Angelini, F.; Burtscher, M.; Gatterer, H. Bioimpedance and impedance vector patterns as predictors of league level in male soccer players. Int. J. Sports Physiol. Perform. 2014, 9, 532–539. [Google Scholar] [CrossRef] [PubMed]
  28. Carrasco-Marginet, M.; Castizo-Olier, J.; Rodríguez-Zamora, L.; Iglesias, X.; Rodríguez, F.A.; Chaverri, D.; Brotons, D.; Irurtia, A. Bioelectrical impedance vector analysis (BIVA) for measuring the hydration status in young elite synchronized swimmers. PLoS ONE 2017, 12, e0178819. [Google Scholar] [CrossRef] [Green Version]
  29. Kim, C.H.; Park, J.H.; Kim, H.; Chung, S.; Park, S.H. Modeling the human body shape in bioimpedance vector measurements. In Proceedings of the 2010 Annual International Conference of the IEEE Engineering in Medicine and Biology, Buenos Aires, Argentina, 31 August–4 September 2010; pp. 3872–3874. [Google Scholar]
  30. Armstrong, L.E.; Pumerantz, A.C.; Fiala, K.A.; Roti, M.W.; Kavouras, S.A.; Casa, D.J.; Maresh, C.M. Human hydration indices: Acute and longitudinal reference values. Int. J. Sport Nutr. Exerc. Metab. 2010, 20, 145–153. [Google Scholar] [CrossRef]
  31. Lohman, T.G.; Roche, A.F.; Martorell, R. Anthropometric Standardization Reference Manual; Human Kinetics Books: Champain, IL, USA, 1988. [Google Scholar]
  32. Frisancho, A.R. Anthropometric standards. In An Interactive Nutritional Reference of Body Size and Body Composition for Children and Adults; University of Michigan Press: Ann Arbor, MI, USA, 2008. [Google Scholar]
  33. Lukaski, H.C.; Piccoli, A. Bioelectrical impedance vector analysis for assessment of hydration in physiological states and clinical conditions. In Handbook of Anthropometry; Preedy, V., Ed.; Springer: Berlin, Germany, 2012; pp. 287–305. [Google Scholar]
  34. Carter, J.E.L.; Heath, B.H. The heath-carter somatotype rating form. In The Heath-Carter Anthropometric Somatotype; San Diego State University: San Diego, CA, USA, 1990. [Google Scholar]
  35. Cheng, H.L.; O’Connor, H.; Kay, S.; Cook, R.; Parker, H.; Orr, R. Anthropometric characteristics of Australian junior representative rugby league players. J. Sci. Med. Sport 2014, 17, 546–551. [Google Scholar] [CrossRef]
  36. Hohenauer, E.; Rucker, A.M.; Clarys, P.; Küng, U.M.; Stoop, R.; Clijsen, R. Anthropometric and performance characteristics of the German rugby union 7s team. J. Sports Med. Phys. Fit. 2017, 57, 1633–1641. [Google Scholar]
  37. Di Vincenzo, O.; Marra, M.; Scalfi, L. Bioelectrical impedance phase angle in sport: A systematic review. J. Int. Soc. Sports Nutr. 2019, 16, 49. [Google Scholar] [CrossRef] [Green Version]
  38. Gutnik, B.; Zuoza, A.; Zuozienė, I.; Alekrinskis, A.; Nash, D.; Scherbina, S. Body physique and dominant somatotype in elite and low-profile athletes with different specializations. Medicina (Kaunas) 2015, 51, 247–252. [Google Scholar] [CrossRef]
  39. Slimani, M.; Nikolaidis, P.T. Anthropometric and physiological characteristics of male soccer players according to their competitive level, playing position and age group: A systematic review. J. Sports Med. Phys. Fit. 2019, 59, 141–163. [Google Scholar] [CrossRef] [PubMed]
  40. Cárdenas-Fernández, V.; Chinchilla-Minguet, J.L.; Castillo-Rodríguez, A. Somatotype and body composition in young soccer players according to the playing position and sport success. J. Strength Cond. Res. 2019, 33, 1904–1911. [Google Scholar] [CrossRef] [PubMed]
  41. Giorgi, A.; Vicini, M.; Pollastri, L.; Lombardi, E.; Magni, E.; Andreazzoli, A.; Orsini, M.; Bonifazi, M.; Lukaski, H.; Gatterer, H. Bioimpedance patterns and bioelectrical impedance vector analysis (BIVA) of road cyclists. J. Sports Sci. 2018, 36, 2608–2613. [Google Scholar] [CrossRef] [PubMed]
  42. Gatterer, H.; Schenk, K.; Laninschegg, L.; Lukaski, H.; Burtscher, M. Bioimpedance identifies body FluidLoss after exercise in the heat: A pilot study with body cooling. PLoS ONE 2014, 9, e109729. [Google Scholar] [CrossRef]
  43. Campa, F.; Piras, A.; Raffi, M.; Trofè, A.; Perazzolo, M.; Mascherini, G.; Toselli, S. The effects of dehydration on metabolic and neuromuscular functionality during cycling. Int. J. Environ. Res. Public Health 2020, 17, 1161. [Google Scholar] [CrossRef] [Green Version]
  44. Pollastri, L.; Lanfranconi, F.; Tredici, G.; Schenk, K.; Burtscher, M.; Gatterer, H. Body fluid status and physical demand during the Giro d’Italia. Res. Sports Med. 2016, 24, 30–38. [Google Scholar] [CrossRef]
  45. Nescolarde, L.; Yanguas, J.; Lukaski, H.; Alomar, X.; Rosell-Ferrer, J.; Rodas, G. Effects of muscle injury severity on localized bioimpedance measurements. Physiol. Meas. 2015, 36, 27–42. [Google Scholar] [CrossRef]
  46. Mascherini, G.; Gatterer, H.; Lukaski, H.; Burtscher, M.; Galanti, G. Changes in hydration, body-cell massand endurance performance of professional soccer players through a competitive season. J. Sports Med. Phys. Fit. 2015, 55, 749–755. [Google Scholar]
  47. Campa, F.; Silva, A.M.; Iannuzzi, V.; Mascherini, G.; Benedetti, L.; Toselli, S. The role of somatic maturation on bioimpedance patterns and body composition in male elite youth soccer players. Int. J. Environ. Res. Public Health 2019, 16, 4711. [Google Scholar] [CrossRef] [Green Version]
  48. Campa, F.; Gatterer, H.; Lukaski, H.; Toselli, S. Stabilizing bioimpedance-vector-analysis measures with a 10-minute cold shower after running exercise to enable assessment of body hydration. Int. J. Sports Physiol. Perform. 2019, 14, 1006–1009. [Google Scholar] [CrossRef]
  49. Silva, A.M.; Matias, C.N.; Nunes, C.L.; Santos, D.A.; Marini, E.; Lukaski, H.C.; Sardinha, L.B. Lack of agreement of in vivo raw bioimpedance measurements obtained from two single and multi-frequency bioelectrical impedance devices. Eur. J. Clin. Nutr. 2019, 73, 1077–1083. [Google Scholar] [CrossRef] [PubMed]
Figure 1. Representation of the athletes’ somatotype.
Sustainability 12 04365 g001
Figure 2. Scatter plots of the individual (on the left side) and mean (on the right side) impedance vectors, divided by somatotype categories and plotted on the tolerance ellipses of the general population [18].
Sustainability 12 04365 g002
Figure 3. Mean impedance vectors with the 95% confidence ellipses for somatotype groups that showed significant differences (p < 0.003). The Hotelling’s T2 test results are included.
Sustainability 12 04365 g003
Figure 4. Canonical discriminant functions. EnM = Endomorphic Mesomorph, BM = Balanced Mesomorph, EcM = Ectomorphic Mesomorph, M-Ec = Mesomorph Ectomorph, MEc = Mesomorphic Ectomorph, BEc = Balanced Ectomorph.
Sustainability 12 04365 g004
Figure 5. (Left side) The target zone on the R-Xc graph proposed earlier for the general population [18,19,20,21,22]. (Right side) The new target zone proposed for athletes.
Sustainability 12 04365 g005
Table 1. Anthropometric, body composition, bioelectric, and somatotype data of the athletes.
VariableSoccer
(n = 41)
Volleyball
(n = 88)
Rugby
(n = 35)
Age (years)26.3 ± 3.226.5 ± 5.625.9 ± 4.3
Height (m)180.6 ± 7.0194.1 ± 10.1184.2 ± 8.4
Weight (kg)74.7 ± 8.889.5 ± 10.4100.7 ± 15.7
BMI (kg/m2)22.8 ± 1.723.8 ± 1.929.6 ± 3.5
FM (%)11.8 ± 2.613.5 ± 2.115.5 ± 4.3
FM (kg)8.9 ± 2.612.2 ± 2.816.1 ± 6.3
FFM (kg)65.7 ± 7.077.3 ± 8.684.6 ± 10.6
TBW (l)54.1 ± 3.459.8 ± 4.064.2 ± 6.1
ECW (l)12.1 ± 1.114.1 ± 1.315.3 ± 2.1
ICW (l)42.0 ± 2.345.7 ± 2.748.9 ± 4.1
UMA (cm2)59.1 ± 10.370.8 ± 14.783.7 ± 14.1
UFA (cm2)8.6 ± 2.49.9 ± 3.312.9 ± 3.7
CMA (cm2)104.7 ± 16.7104.9 ± 14.9122.1 ± 40.1
CFA (cm2)9.8 ± 2.312.1 ± 4.314.7 ± 5.5
TMA (cm2)200.2 ± 29.2222.8 ± 37.5260.1 ± 57.1
TFA (cm2)22.7 ± 8.228.9 ± 13.432.3 ± 11.0
R/H (Ohm/m)255.6 ± 21.3236.4 ± 23.4213.6 ± 21.8
Xc/H (Ohm/m)35.3 ± 3.831.8 ± 3.930.2 ± 4.2
Z/H (Ohm/m)258.1 ± 21.5238.5 ± 24.7215.7 ± 22.1
PhA (°)7.9 ± 0.57.7 ± 0.68.0 ± 0.8
Endomorphy1.6 ± 0.32.0 ± 0.72.1 ± 0.7
Mesomorphy4.7 ± 0.94.0 ± 1.36.0 ± 1.1
Ectomorphy2.9 ± 0.83.2 ± 1.10.9 ± 0.3
Note: Data are presented as mean ± SD, BMI = body mass index, FM = fat mass, FFM = fat free mass, TBW = total body water, ECW = extracellular water, ICW = intracellular water, UMA = upper arm muscle area, UFA = upper arm fat area, CMA = calf muscle area, CFA = calf fat area, TMA = thigh muscle area, TFA = thigh fat area, R/H = resistance standardized for height, Xc/H = reactance standardized for height, Z/H = vector length standardized for height, PhA = phase angle.
Table 2. Anthropometric, body composition, and bioelectrical data of the athletes separated by somatotype.
VariableEndomorphic Mesomorph
(n = 46)
Balanced Mesomorph
(n = 26)
Ectomorphic
Mesomorph
(n = 55)
Mesomorph
Ectomorph
(n = 10)
Mesomorphic Ectomorph
(n = 13)
Balanced Ectomorph
(n = 14)
ANOVA
p
Height (m)183.6 ± 8.7 4,5,6186.7 ± 12.3 5186.7 ± 9.4 4,5199.9 ± 3.4 1,3201.1 ± 5.3 1,2,3195.9 ± 9.4 112.7<0.01
Weight (kg)96.6 ± 15.6 385.0 ± 14.281.2 ± 13.1 192.2 ± 6.490.9 ± 5.888.1 ± 10.67.3<0.01
BMI (kg/m2)28.6 ± 3.7 2,3,4,5,624.2 ± 1.8 123.1 ± 1.7 123 ± 1 122.4 ± 1.1122.9 ± 1.6132.8<0.01
FM (%)15.1 ± 3.9 313.2 ± 1.811.8 ± 2.2 114.2 ± 2.414.2 ± 1.913.9 ± 2.67.1<0.01
FM (kg)15 ± 5.9 211.3 ± 2.99.7 ± 2.9 113.1 ± 312.9 ± 1.812.4 ± 3.29.1<0.01
FFM (kg)81.5 ± 10.8 373.6 ± 11.671.4 ± 10.8 179 ± 4.478 ± 5.575.7 ± 8.55.4<0.01
TBW (l)62.5 ± 6 358.1 ± 5.456.6 ± 5 160.8 ± 2.460.3 ± 2.259.3 ± 47.3<0.01
ECW (l)14.7 ± 1.9 313.3 ± 1.812.8 ± 1.6 114.2 ± 0.8114.1 ± 0.7413.7 ± 1.37.3<0.01
ICW (l)47.8 ± 4.0 344.8 ± 3.643.8 ± 3.3 146.6 ± 1.646.2 ± 1.545.6 ± 2.77.3<0.01
UMA (cm2)80.0 ± 14.4 368.2 ± 12.566.0 ± 14.7 167.1 ± 8.470.9 ± 12.864.1 ± 10.56.5<0.01
UFA (cm2)12.5 ± 3.5 3,511.1 ± 3.1 3,8.1 ± 2.3 1,210.1 ± 4.48.6 ± 2.4 110.8 ± 3.311.1<0.01
CMA (cm2)117.7 ± 36.1103.3 ± 13.6108.8 ± 17.4101.0 ± 16.099.5 ± 13.699.9 ± 12.52.60.02
CFA (cm2)14.1 ± 5.7 312.5 ± 3.910.1 ± 2.9 111.6 ± 3.611.6 ± 3.712.9 ± 3.94.7<0.01
TMA (cm2)255.9 ± 61.4 3,6220.65 ± 25.1212.8 ± 33.7 1212.3 ± 16.7210.0 ± 26.8203.3 ± 32.2 17.3<0.01
TFA (cm2)34.9 ± 16.0 331.1 ± 12.722.7 ± 8.7 129.8 ± 10.223.4 ± 10.926.5 ± 9.24.9<0.01
R/H (Ohm/m)220.0 ± 23.1 3240.4 ± 26.9242.7 ± 27.1 1239.3 ± 15.5245.0 ± 21.4246.7 ± 25.05.6<0.01
Xc/H (Ohm/m)31.3 ± 4.432.8 ± 4.333.1 ± 4.731.6 ± 2.332.3 ± 2.931.7 ± 3.71.10.39
Z/H (Ohm/m)222.3 ± 23.3 3242.7 ± 27.1245.1 ± 27.4 1241.5 ± 15.6247.2 ± 21.6248.8 ± 25.35.5<0.01
PhA (°)8.1 ± 0.74 67.7 ± 0.657.7 ± 0.587.5 ± 0.437.5 ± 0.407.3 ± 0.39 14.8<0.01
Endomorphy2.8 ± 0.59 2,3,4,5,62.3 ± 0.50 1,3,51.5 ± 0.28 1,2,61.8 ± 0.64 11.4 ± 0.41 1,2,62.1 ± 0.44 1,3,543.8<0.01
Mesomorphy5.9 ± 1.1 2,3,4,5,64.5 ± 1.1 1,5,64.6 ± 0.82 1,5,63.6 ± 0.43 13.1 ± 0.39 1,2,32.2 ± 0.54 1,2,347.7<0.01
Ectomorphy0.9 ± 0.3 2,3,4,5,62.3 ± 0.51 1,3,4,5,63.1 ± 0.57 1,2,5,63.6 ± 0.27 1,24.4 ± 0.67 1,2,34.2 ± 0.56 1,2,3132.0<0.01
Note: Data are presented as mean ± SD, BMI = body mass index, FM = fat mass, FFM = fat free mass, TBW = total body water, ECW = extracellular water, ICW = intracellular water, UMA = upper arm muscle area, UFA = upper arm fat area, CMA = calf muscle area, CFA = calf fat area, TMA = thigh muscle area, TFA = thigh fat area, R/H = resistance standardized for height, Xc/H = reactance standardized for height, Z/H = vector length standardized for height, PhA = phase angle.
  • Differences (p < 0.003) compared with the Endomorphic Mesomorph group;
  • Differences (p < 0.003) compared with the Balanced Mesomorph group;
  • Differences (p < 0.003) compared with the Ectomorphic Mesomorph group;
  • Differences (p < 0.003) compared with the Mesomorph Ectomorph group;
  • Differences (p < 0.003) compared with the Mesomorphic Ectomorph group;
  • Differences (p < 0.003) compared with the Balanced Ectomorph group.
Table 3. Results of stepwise discriminant analyses.
StepEntredWilks’ LambdaFp
1R/H (Ohm/m)0.8495.63<0.001
2Xc/H (Ohm/m)0.7365.19<0.001
Note: R/H = resistance standardized for height, Xc/H = reactance standardized for height.

