Self-Organising Floor Plans in Care Homes


1
School of Creative Arts, University of Hertfordshire, College Lane, Hatfield AL10 9AB, UK
2
Wilson School of Design, Kwantlen Polytechnic University, 12666 72 Avenue, Surrey, BC V3W 2M8, Canada
3
Department of Computer Science, Brunel University, Kingston Lane, Uxbridge UB8 3PH, UK
4
Morphogen, 325 E 84th Street, New York, NY 10028, USA
*
Author to whom correspondence should be addressed.
Sustainability 2020, 12(11), 4393; https://0-doi-org.brum.beds.ac.uk/10.3390/su12114393
Submission received: 29 April 2020
/
Revised: 18 May 2020
/
Accepted: 20 May 2020
/
Published: 27 May 2020
(This article belongs to the Special Issue Self-Organised Simulation for Sustainable Building Design)
Abstract
:This paper presents and discusses an optimisation approach applied to spatial layouts in care home building design. With this study, we introduce a method for increasing the floor plan efficiency using a self-organising genetic algorithm, thus reducing energy consumption, improving the wellbeing of residents and having an implicit impact on the costs of energy and health care. In order to find an optimal spatial configuration, we elaborated and tested a number of design criteria based on existing literature reviews and interpreted through initial considerations of care home layouts. These are used as objectives in a Genetic Algorithm (GA) to evaluate the best design solution. The self-organised floor plan is then used to run a final simulation to observe how residents could use the optimised spaces and to measure the improved efficiency of the new plans. The paper concludes with the discussion of the results and some considerations for future studies and experiments using emergence behaviour models to improve sustainable development in design.
1. Introduction
This article introduces a method for increasing the floor plan efficiency in care homes using a self-organising genetic algorithm, thus reducing energy consumption, improving the wellbeing of residents and having an implicit impact on the costs of energy and health care. The efficiency of building floor plans therefore has a direct impact on the three pillars of sustainability: Environmental, social and economic.
The primary focus of this study is the design of spatial layouts in care homes and a possible method to optimise their design based on a number of predetermined design criteria. We argue that the proposed method may help designers in producing more sustainable and energy efficient floor plans in care home projects. This study includes design criteria based on existing literature on spatial characteristics of layouts in facilities with people with dementia. This work does not focus on possible spatial solutions to help specifically people with dementia. This would require more studies on the relationship between spatial layout and the various stages of dementia, as well as different needs over time of residents, and the relationships of residents with care workers, visitors and other people involved in their care and the maintenance of the facility. All these aspects are outside of the scope of this study.
The spatial design of care homes is traditionally based on functionality, safety and adherence to regulatory bodies. For example, the Care Quality Commission (CQC) is the independent regulator of health and social care in England that sets out the Fundamental Standards by which every design of care homes in England needs to abide. Usual spatial distributions include rationalised spaces with often long central corridors leading to residents’ rooms and common facilities. Care homes are not generally designed as a therapeutic resource [1] but as safe, welcoming and functional environments. More importantly, care home facilities are traditionally designed with a top-down approach (from handbooks, guidelines and design briefs) and very rarely emergence-based approaches (by looking at what happens at the scale of individuals, perhaps through simulations) are used as a part of the design process. Emphasis on programmatic functionality, practicality and safety are often sought at the expenses of sustainable aspects in the building. For example, spatial configurations that comply with design guidelines are often inefficient from an energetic viewpoint. This imbalance between spatial organisation of the programme and the sustainable aspects of the building is not necessarily related to the design guidelines per se. Often guidelines do not directly include questions of carbon footprint, energy loss, and the overall energy transmission and usage in the building [2] (p. 1216).
With this study, we investigate a novel strategy, whereby we use an emergent approach to the design of spatial configurations based on genetic algorithms. The main goal is to test the efficiency of a generative approach based on natural behaviours in designing more sustainable floor plans.
Contemporary care home design has evolved from larger scale hospitals, laid out to optimise the delivery of medical care, to facilities designed to support contemporary person-centred and psycho-social models of care, and intended to support the remaining abilities of residents [3]. These smaller scale residential layouts are intended to replicate home environments familiar from early life and provide manageable levels of stimulation. Well researched precedents such as the Corinne Dolan Center (Ohio 1989) and Woodside Place (Pennsylvania 1991) [4] have demonstrated that this evolution has resulted in improvements to resident wellbeing and support contemporary criteria and guidelines for care home environment design, such as clear visibility to all important spaces and activities of other people to support orientation [5]. However, even with these guidelines, resident disorientation, wayfinding problems and an inability to independently access recreational and therapeutic spaces within care homes are still ongoing concerns. Current literature in the fields of nursing and dementia environments addresses these behaviours [6,7,8], suggesting that even within current architectural care home models spatial design could be further optimised.
Wayfinding and orientation problems impact residents’ ability to move about care homes independently. These problems are frequently conceptualised as wandering. Wandering has been defined as “a syndrome of dementia-related locomotion behaviour having frequent, repetitive, temporally-disordered and/ or spatially-disoriented nature that is manifested in lapping, random and/or pacing patterns, some of which are associated with eloping, eloping attempts or getting lost unless accompanied” [9] (p. 696). The impact of wandering is significant; it has been reported in 100% of ambulatory care home residents [10] and is one of the leading reasons for people being placed in residential care in the first place [11]. The role of spatial design in mitigating these problems is widely recognised [12,13,14,15].
In particular, orientation within a care home facility is related to spatial layouts: “Orientation is further impacted by building configuration. Simple building configuration is associated with resident orientation, when residents are also provided with explicit environmental information [16]. In a quasi-experiment with 105 residents in several group living facilities, residents were found to experience greater spatial orientation in facilities designed around L-, H-, or square-shaped corridors, compared with facilities with corridor designs [12]. Corridor designs were also associated with higher degrees of restlessness and dyspraxia and with reduced vitality and identity [12]. Residents in facilities with more hallway space demonstrated less disorientation and less lack of vitality [12]” [1] (p. 410).
In the practice of care home architecture, designers typically begin layout design by determining what rooms are required, deciding which spaces need to be directly adjacent or convenient to other spaces, then generating diagrams of spatial organisations. Time constraints and designers’ awareness of a multitude of code constraints, budgetary factors and design biases typically limit number of iterations produced and the variety of approaches considered. In contrast, the use of generative design, and genetic algorithms (GAs) in particular (where designers set out a series of desired parameters and values to an algorithm that outputs a spatial configuration based on an optimised combination of the given requirements), can be elaborated to produce vast numbers of different spatial organisations and refine them in an iterative fashion to optimise a specific set of criteria.
2. Materials and Methods
In order to explore how the design of the spatial distribution and general layout in care homes can optimise visual access and travel distances, we devised a new set of design criteria and employed the following workflow:
- Take an existing floor plan of a care home designed using current design criteria as a case study and starting point (in this case the Irene Baron Eden Centre, Winnipeg, Manitoba, MMP Architects 2009);
- Elaborate a new set of design criteria based on existing literature and their interpretation;
- Design a Genetic Algorithm GA based on NeuroEvolution of Augmenting Topologies (NEAT) that uses the design criteria (2) as objectives;
- Run (3) until finding a satisfying value of the fitness function and isolate the correspondent floor plan configuration;
- The embedded fitness function is used to evaluate the efficiency and accuracy of the self-organising approach;
- Build a model in Rhinoceros/Grasshopper of the optimised configuration (4) and run a BOID simulation to observe how residents will be using the new configuration;
- Compare the result of the simulation run on the optimised floor plan (6) with the initial configuration of the care home (1);
- Discussion of results.
2.1. Design Criteria and Objectives
Four design criteria for care home layout optimisation were synthesised from reviews of design recommendations for dementia environments. The criteria considered are:
- Criterion 1: Facility is subdivided into units of less than 13 residents’ private bedrooms
Evidence supporting small-scale residential units (around 10–15) having positive effects for people with dementia are well supported in the literature [3,6,17,18,19]. Layouts with smaller scale floor plans inherently allow for a more ‘homelike’ and familiar ambiance than a larger facility [19]. Smaller units also afford lower levels of acoustic and social stimulation, which could contribute to reducing overstimulation and associated agitation, confusion and anxiety [20,21]. Common causes of overstimulation are busy entry doors that are visible to residents, clutter, public address systems [22,23,24], alarms, loud televisions [25,26], corridors and crowding [27]. Smaller units have less of all these overstimulation sources [18].
- Criterion 2: Each unit has a functional kitchen accessible to residents
A ‘homelike’ character with a kitchen and dining room has been shown to contribute to the wellbeing of people with dementia (PWD) [1,13,28,29]. In order to be analogous to residential spatial layouts and afford familiar domestic scale social interactions kitchens and dining rooms are recommended as unit hubs. Functional kitchens accessible to residents and their carers and visitors allow for more freedom of choice on mealtimes and food choices. Choice is central to concepts of personhood in contemporary dementia care philosophies. Meal preparation is also a significant opportunity for PWD to participate in the ordinary activities of daily living (ADL) which is important to the wellbeing of PWD and helps maintain their abilities.
- Criterion 3: Each unit has a dining room not used for other activities
Keeping dining rooms dedicated to eating rather than serving as multipurpose rooms for crafts and other activities as well has been shown to improve food consumption. Having other spaces for activities other than eating could reduce distractions which may negatively affect food consumption [4,22,30].
- Criterion 4: Each unit has multiple, lounges/activity spaces with varying sizes
Having specific rooms dedicated to different functions promotes resident wellbeing [21,31]. Lounges and activity spaces can be furnished with cues to participate in a variety of activities of daily living. A range of room sizes has been shown to improve resident quality of life [32]. Varying space sizes affords different scales of social interaction, from intimate to gregarious, to suite residents’ varying needs, as well as providing a choice of different levels of sensory stimulation. A variety of activity spaces of different sizes can also provide residents with a range of environmental stimulation levels. While overstimulation is a problem for people with dementia, so is under-stimulation. Providing the right stimulation levels for people with dementia is important [32,33,34], but the right levels vary from person to person and can fluctuate over time. For people with dementia, who may have problems communicating their needs, providing a variety of activity spaces with varying sizes could allow residents to self-select their preferred levels of social and sensory stimulation provided they can access these spaces independently.
The design criteria for optimisation have been condensed in Table 1 below.
2.2. Genetic Algorithms
Traditional algorithms exploring optimised spatial solution for floor plans are based on the idea of iteratively generating all the possible solutions, measuring them, and selecting the one that best fits all requirements. Generally, these greedy (or brute-force) techniques require intensive computations and use of computing resources [35].
In this study, we use Genetic Algorithms (GAs): A different class of algorithms designed to address this set of problems where multiple objectives need to be computed at the same time [36]. GAs work by analogy with the natural selection process, whereby highest performing breeds have a better chance to survive and result in the evolution of a certain species. The best (i.e., highest performing based on a set of given criteria) mates are matched in order to find an optimised chromosomic combination.
Genetic algorithms are largely employed in design to find optimised spatial solutions (e.g., [37]), including spatial arrangement [38], location of specific activities in a building (e.g., [39]), building shapes (e.g., [40,41]) and optimise material distribution for energy performance-related tasks [42]. In general terms, GAs are extensively used as a tool in building performance and energy research work. They are less used in the optimisation of spatial layout and spatial planning. In this work, we employed GAs to find an optimised configuration of a floor plan where the requirements for the fitness function are based on design recommendations for residents with dementia.
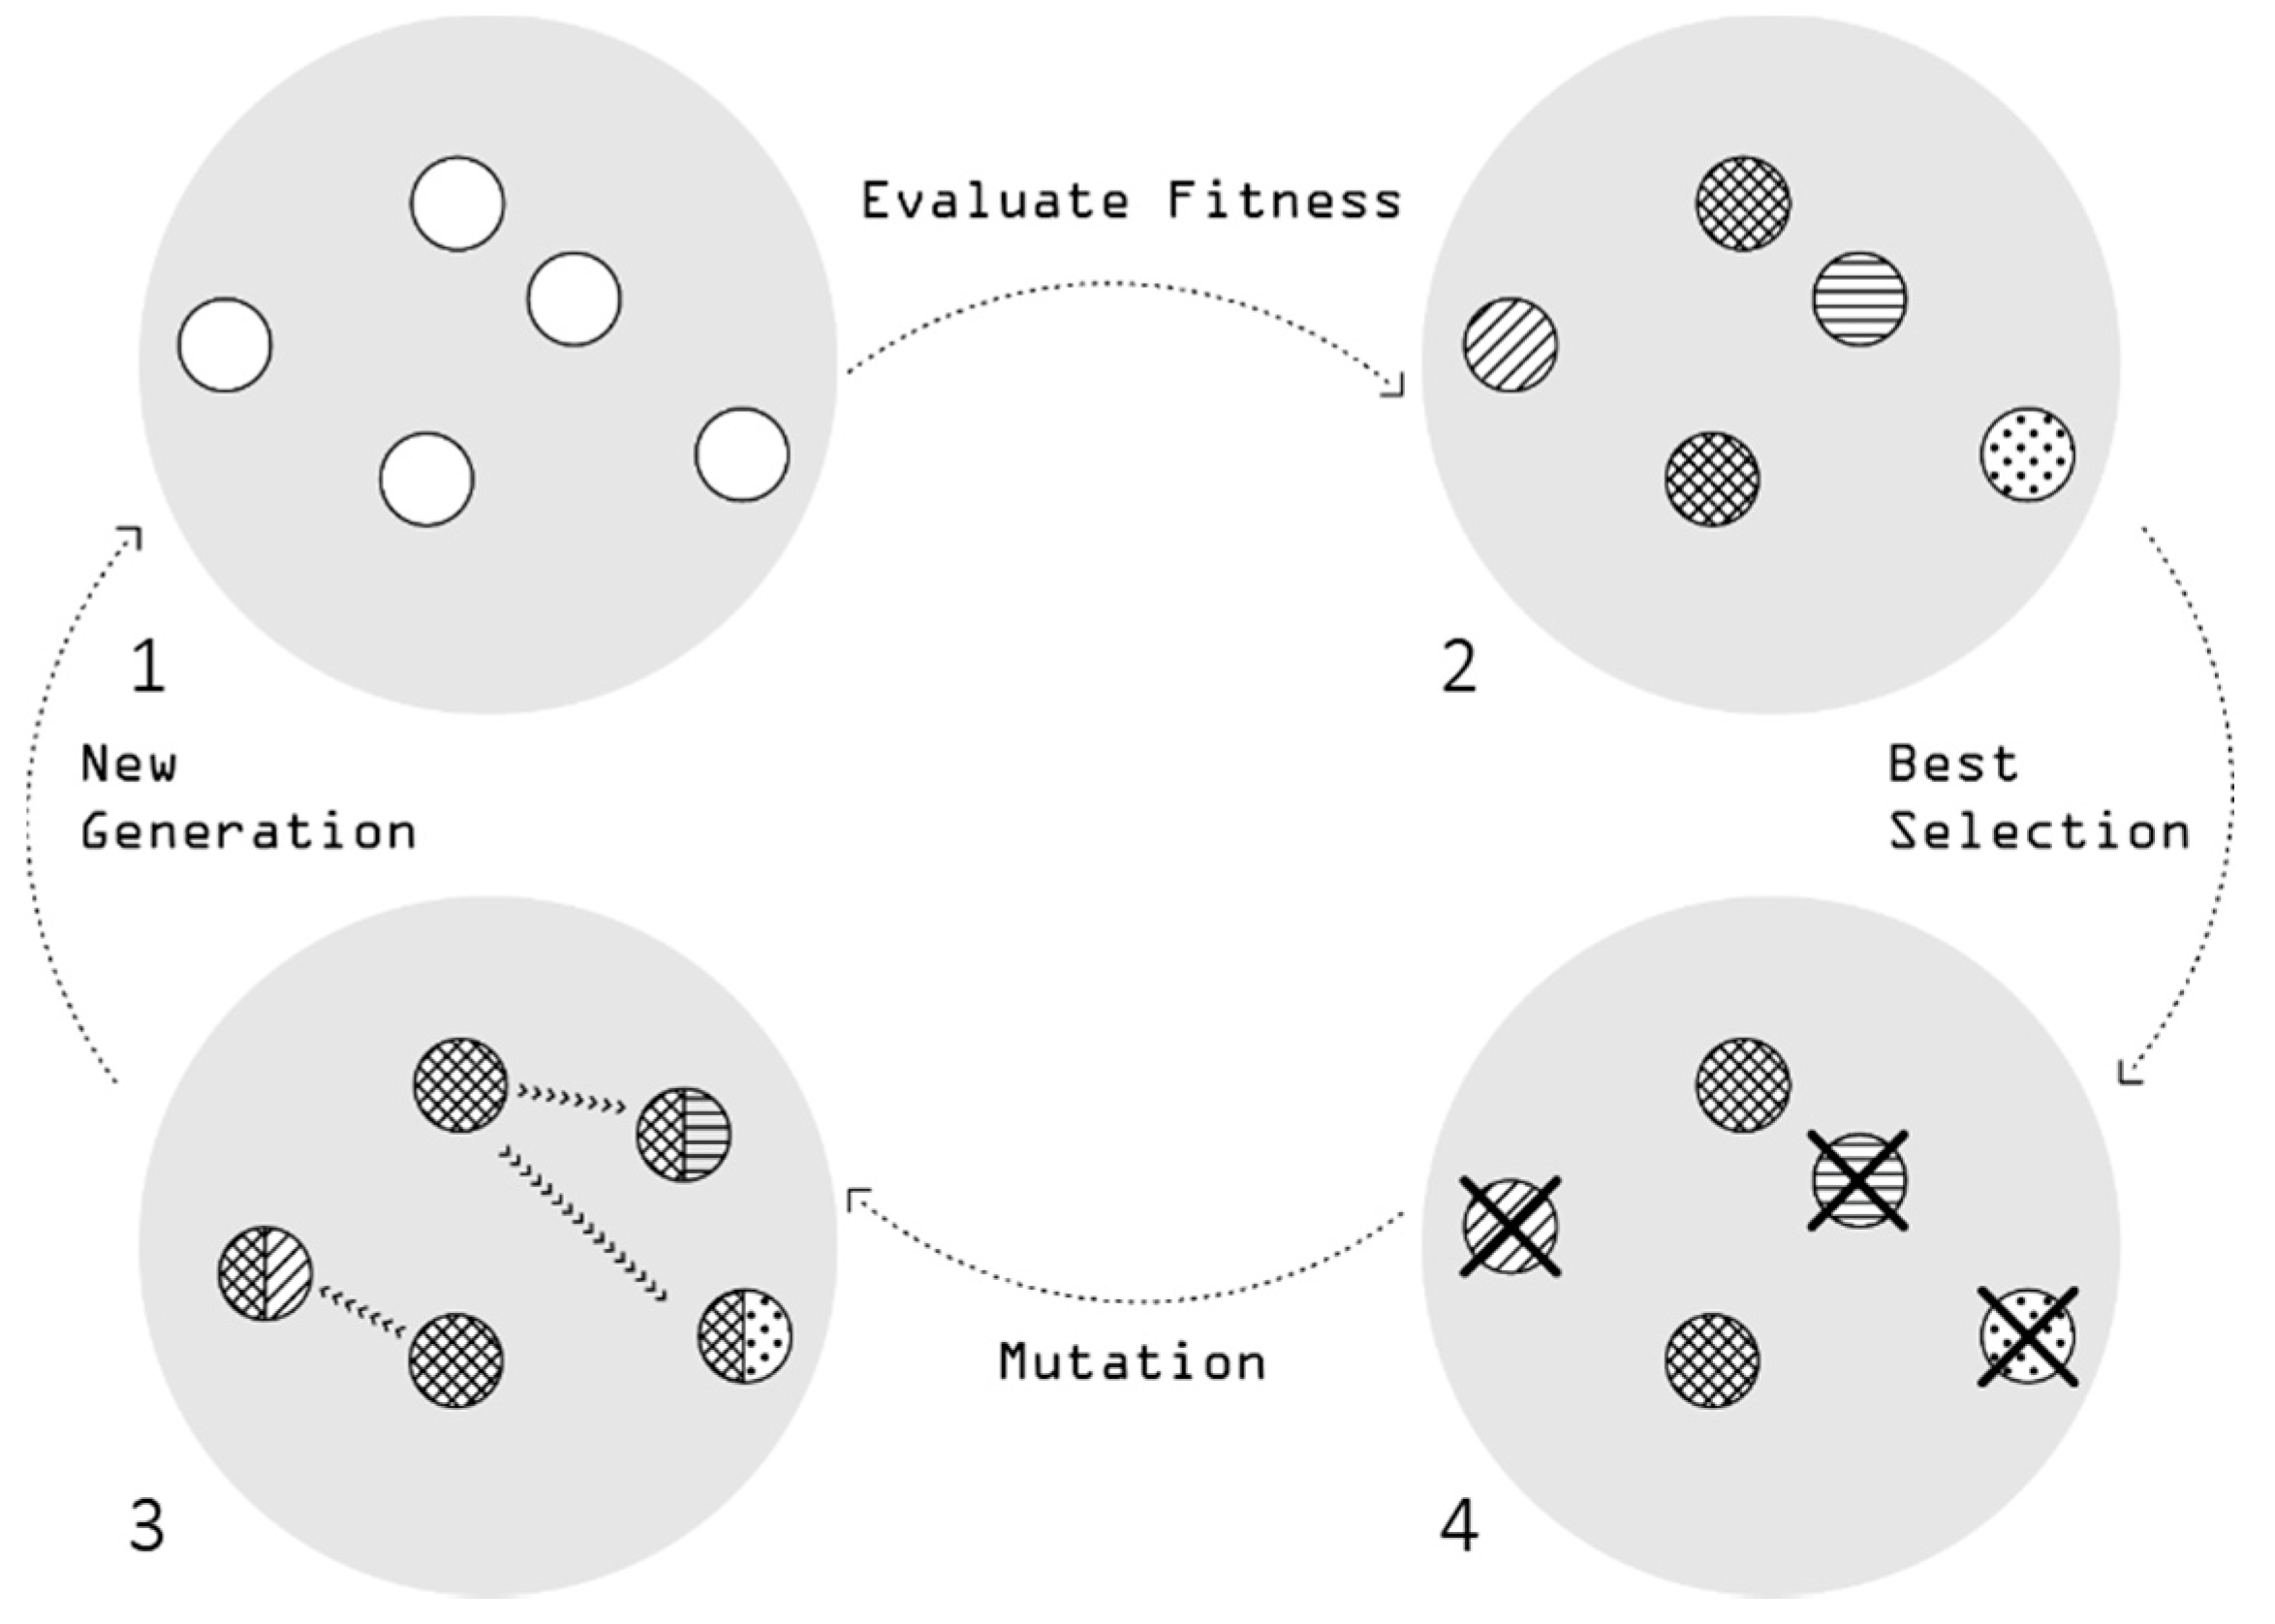
Following the genetic evolution analogy, we set up an initial population (i.e., a set) of candidate design solutions that have been selected randomly in the first iteration and then gradually optimised through a cycle of iterations (see Figure 1).
Each iteration creates a new set of solutions called “generation” that, in turn, is evaluated through a pre-defined fitness function which measures how well each solution (also called genome) meets the objectives set by the initial design problem. The most fit solutions are selected and “evolved” into the new generation to be evaluated, namely they are modified by recombining them together and randomly mutated. This happens by finding the parts of the genomes that perform better and combining them. It may occur in fact that, within a possible good solution, one part of a sequence is performing well while another part is not. GAs allow for identifying couples of good solutions and their best performing parts and to combine them to generate a third solution with the best parts of the first two sequences (thus evolving the species).
The algorithm terminates when it has produced a set number of generations or a population with a satisfactory fitness level.
To summarise, each genetic algorithm usually includes the following functions: Evaluating the fitness of the generation, selection of the best solutions, and mutation to a new generation of solutions. The overall process is depicted in Figure 1.
In order to include the design criteria as elaborated in Section 2.1, we codified the chosen constraints in the initial population fed to the GA by adding two clusters of nodes to the graph, each representing an individual unit. We placed twelve nodes representing the suites on each unit (thus adhering to the requirement 1), two nodes for the dining area and kitchen (2 and 3), and two nodes for an activity area and a living area (4). Other rooms found on the existing case study (e.g., salon, spa, laundry, etc.) were added as individual nodes outside of existing clusters.
Each graph node stores the corresponding room’s size in square metres, from the original care home floor plan, and all its adjacency requirements. In this case, we added the direct proximity of the kitchen to the dining area.
Finally, from these data the algorithm tried to minimise both the distance within each cluster (thus having each unit’s suites, kitchen, dining room, activity and living area close to each other) and the distance between the clusters, in order to reduce the possible distance that residents may need to travel within the facility.
2.3. Evolving Floorplans
In this study we employed a GA strategy initially developed by Joel Simon and based on NeuroEvolution of Augmenting Topologies (NEAT) [43,44].
In order to apply a GA strategy to the optimisation of floor plan designs, we needed to identify a way of encoding the solutions (i.e., the floor plans) and specifying the evolutionary processes described above and, at the base of any GA, the selection of the most fit solutions within each generation and their mutation into a new generation.
NEAT is a method that allows to effectively represent topologies to be evolved using a GA. Each solution (or genome) is represented by a series of nodes and a series of connections: Nodes store information used by the fitness function to evaluate the corresponding solution, while connections store the linked nodes, their weight (usually representing the cost of that connection, e.g., the distance between the rooms), and whether it is enabled or not in the current instance. In their work “Evolving neural networks through augmenting topologies”, Stanley and Miikkulainen [43] provided a very clear illustration of this method (cf. for example, the graph solution in [43] (pp. 106–107). This way, the mutation of each solution can either create new connections between existing nodes or add new nodes to the graph.
Once a random mutation has taken place, the graph is converted to a candidate solution and added to the new generation that will be evaluated through the chosen fitness function.
NEAT allows us to encode the problem of optimising floor plan designs and devise a GA that can effectively solve it.
Thus, the implemented GA strategy for evolving floor plans is summarised in the following:
- Generate an initial random population of graphs connecting the rooms, satisfying adjacency requirements, if any;
- Apply NEAT mutations to generate a new genome;
- Map the new genome into the related floor plan designs;
- Use an Ant-Colony Optimisation algorithm to generate the hallways connecting the rooms;
- Evaluate the candidate solutions with a certain fitness function;
- Map candidate solutions into a new generation;
- Repeat the process from (2) until a set number of generations have been evaluated.
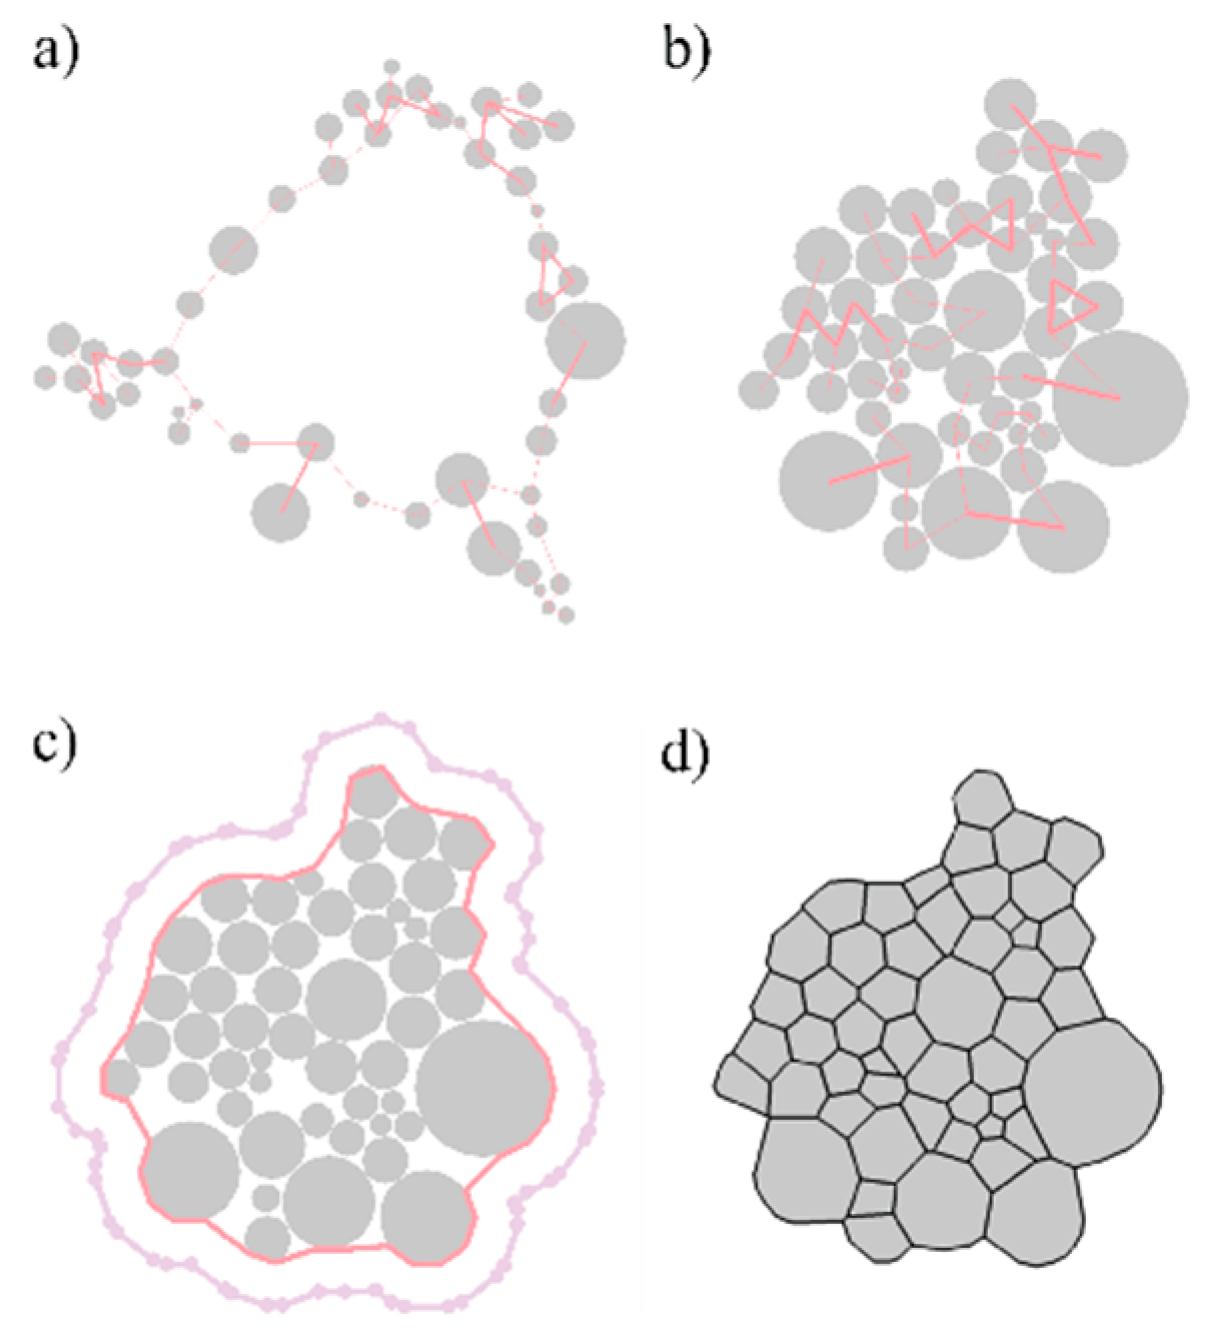
More specifically, the mapping process in step 3 consists of three parts, as summarised in Figure 2: (1) The nodes are arranged with a spectral layout (Figure 2a); (2) a physics simulation places the nodes to their final coordinates, corresponding to the centre of the rooms in the floor plan (Figure 2b); (3) the layout is converted into a polygonal mesh representing the walls (Figure 2c,d).
This process maps graphs generated by the NEAT’s mutations into a floor plan design, but without the hallways. The next step generates them along the edges of the resulting polygonal mesh with an Ant-Colony Optimisation (ACO) algorithm.
ACO is a probabilistic method for finding “good” paths through graphs inspired by the way ants forage for food: Each ant explores its surroundings in a somewhat random fashion, but when it finds something of interest, it returns to the colony depositing pheromone, a chemical substance that other ants can detect. This way, it creates a trail signalling the path between the food source and the colony, which will guide the other ants.
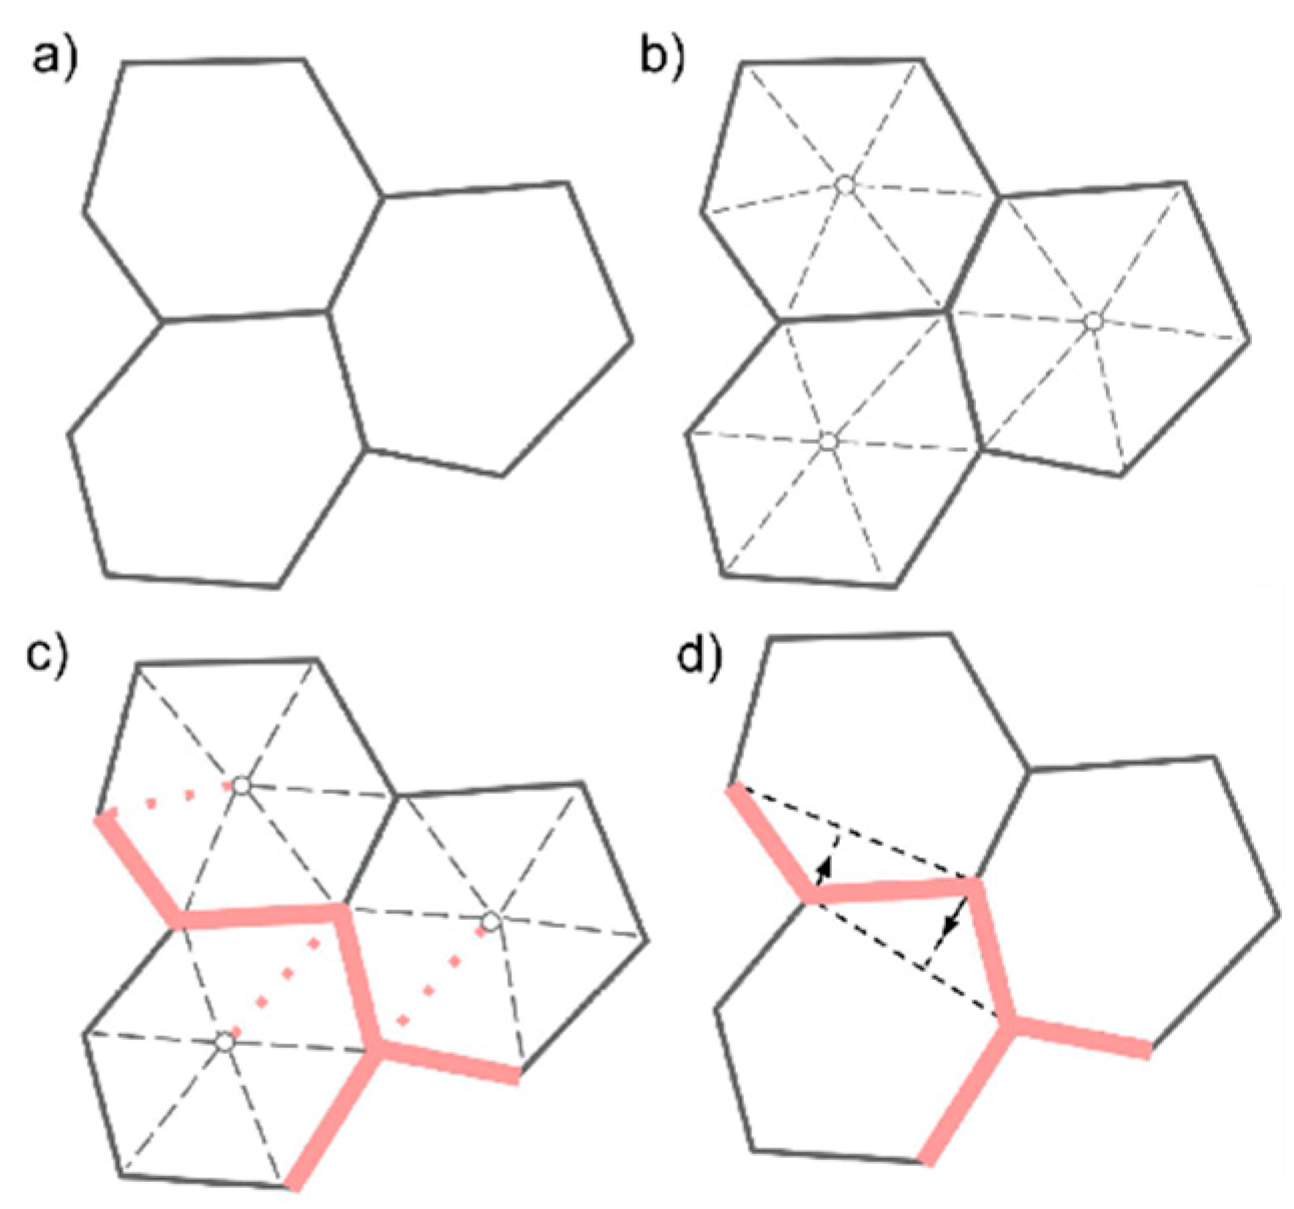
The hallway generation process is summarised in Figure 3 for a three rooms floor plan (Figure 3a): interior nodes and edges are created for each room (Figure 3b); an ACO strategy finds the best path connecting the rooms (Figure 3c); hallways gets smoothened by moving their vertices halfway to their neighbours (Figure 3d).
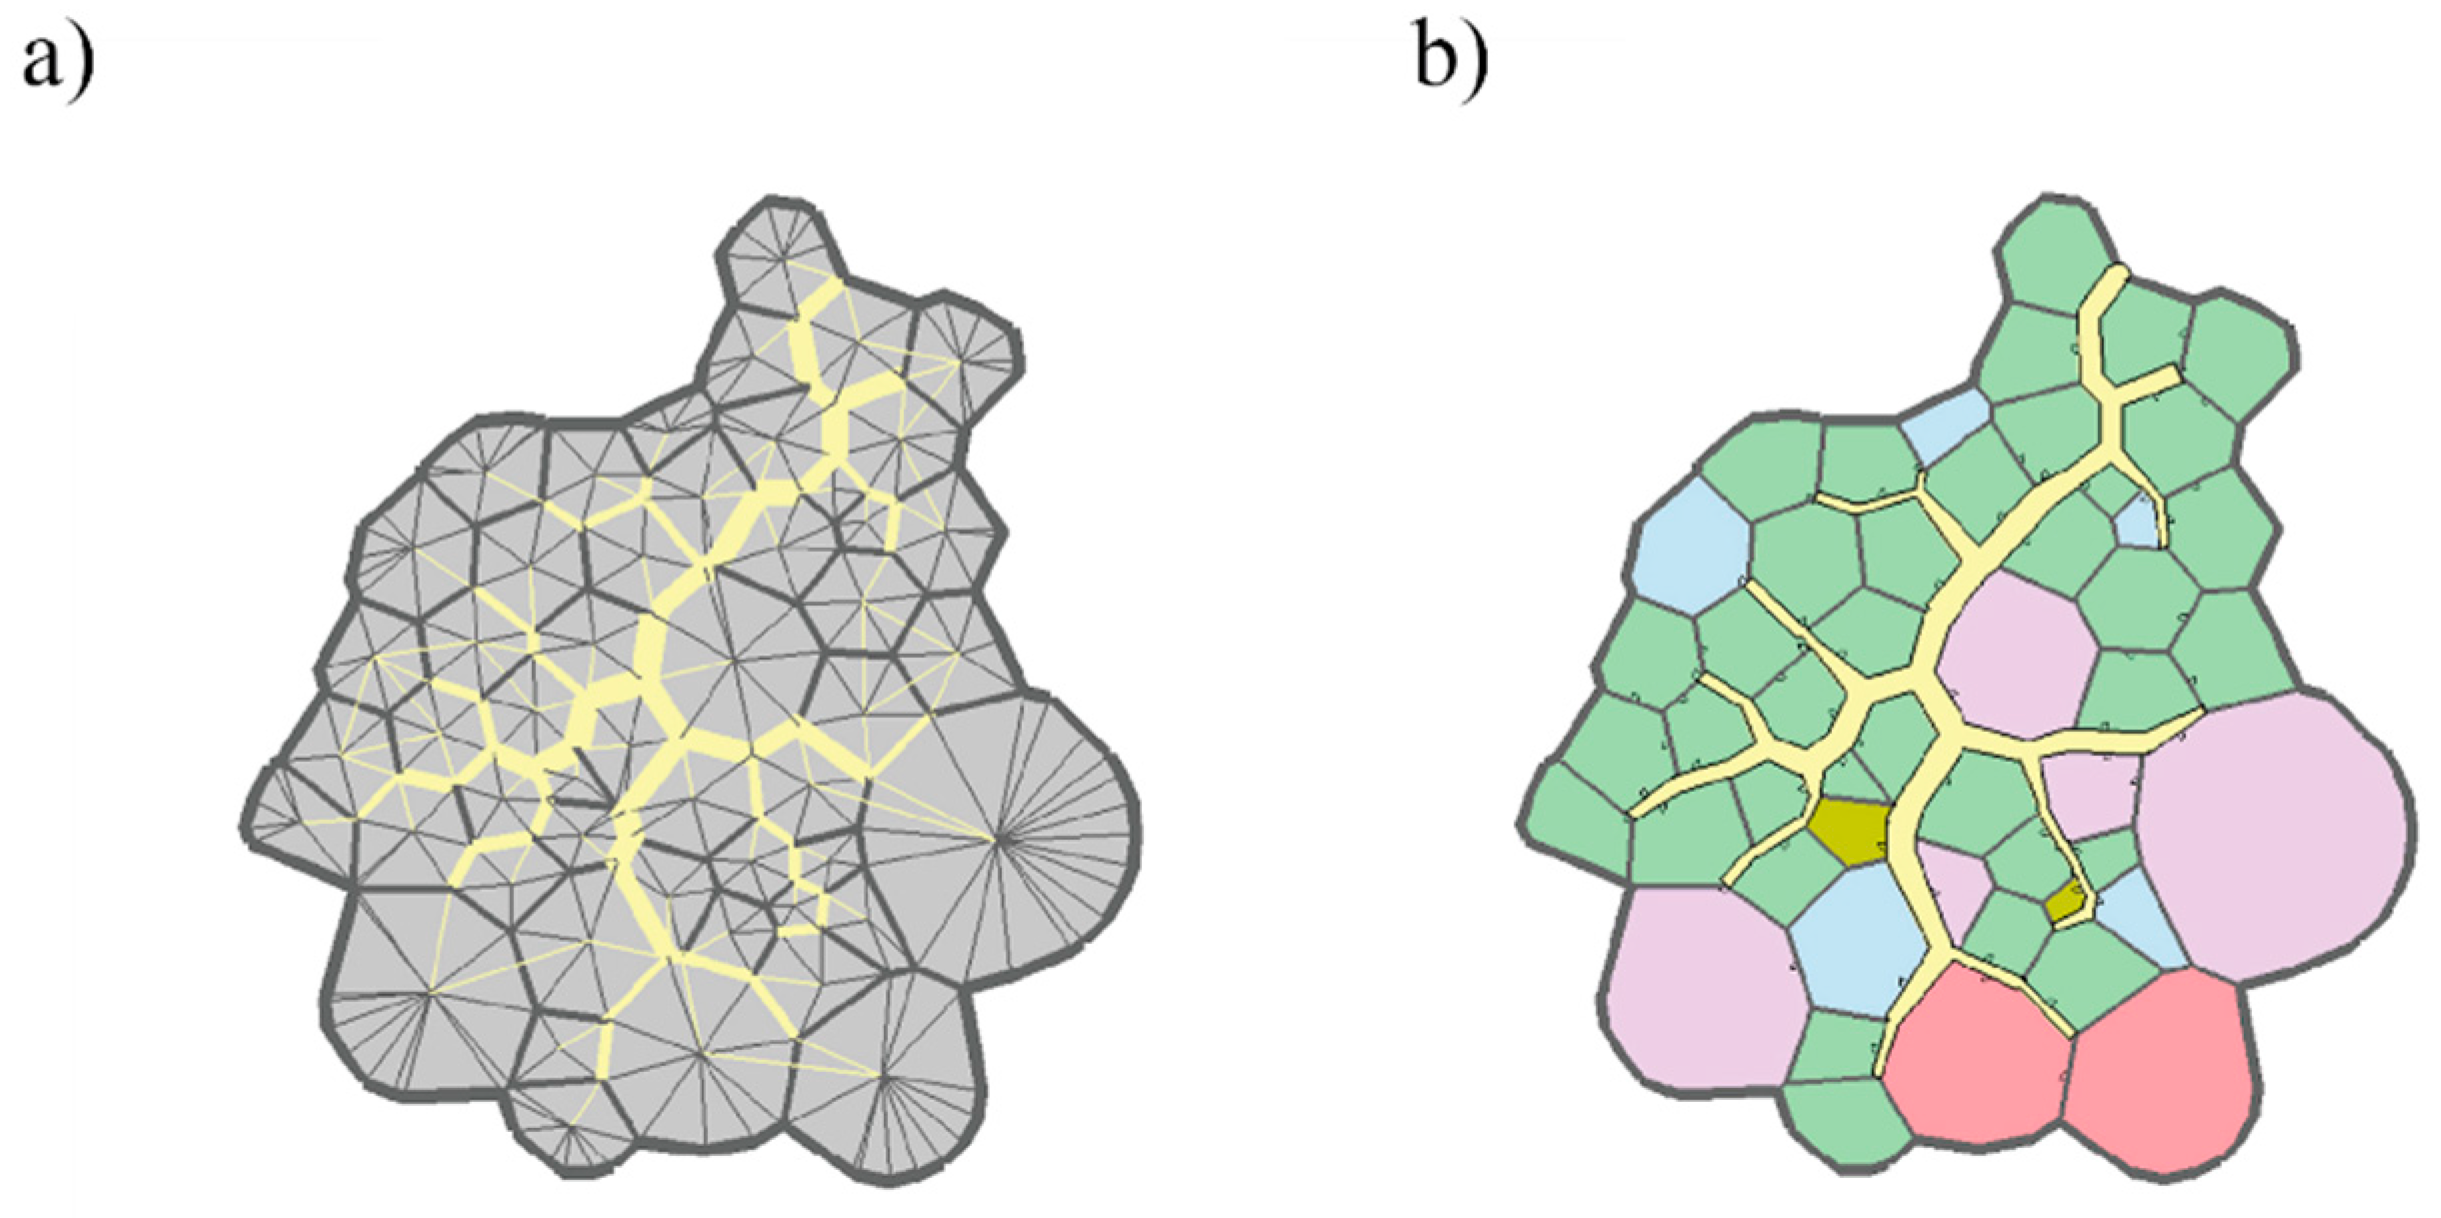
Now the hallways are added to the generated floor plan (Figure 4a), then merged into a final geometry, with interior edges used for door placements (Figure 4b).
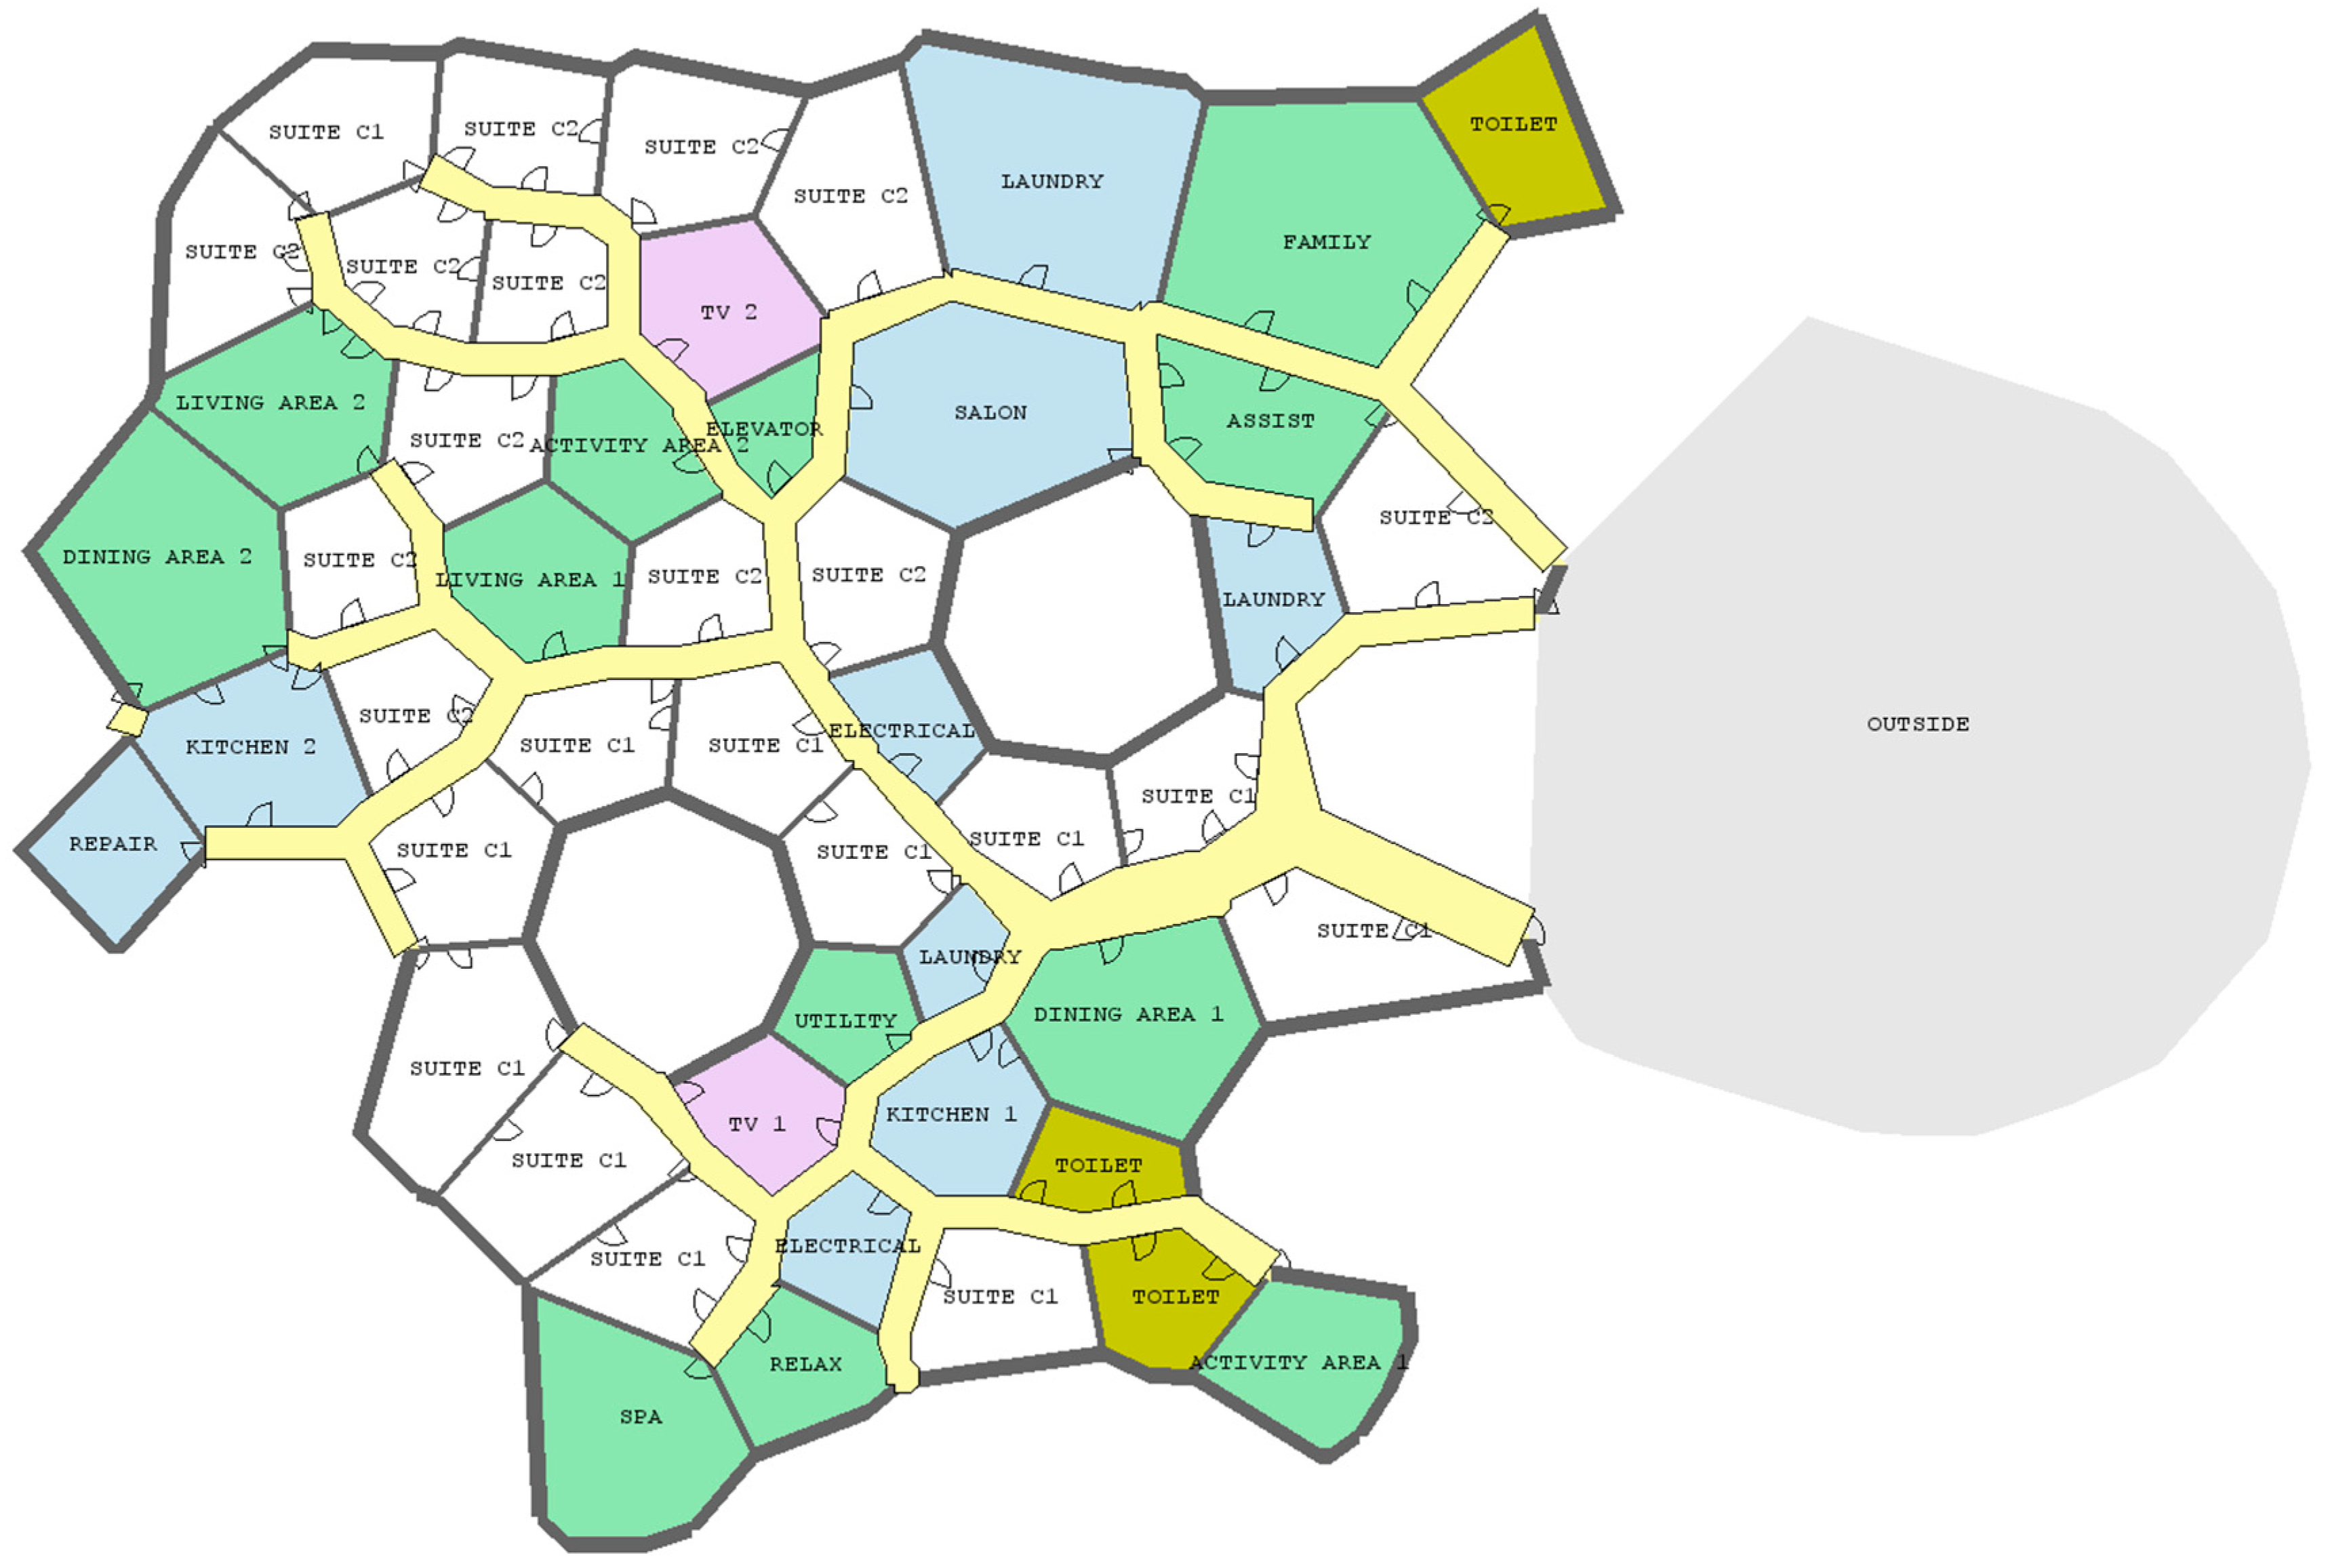
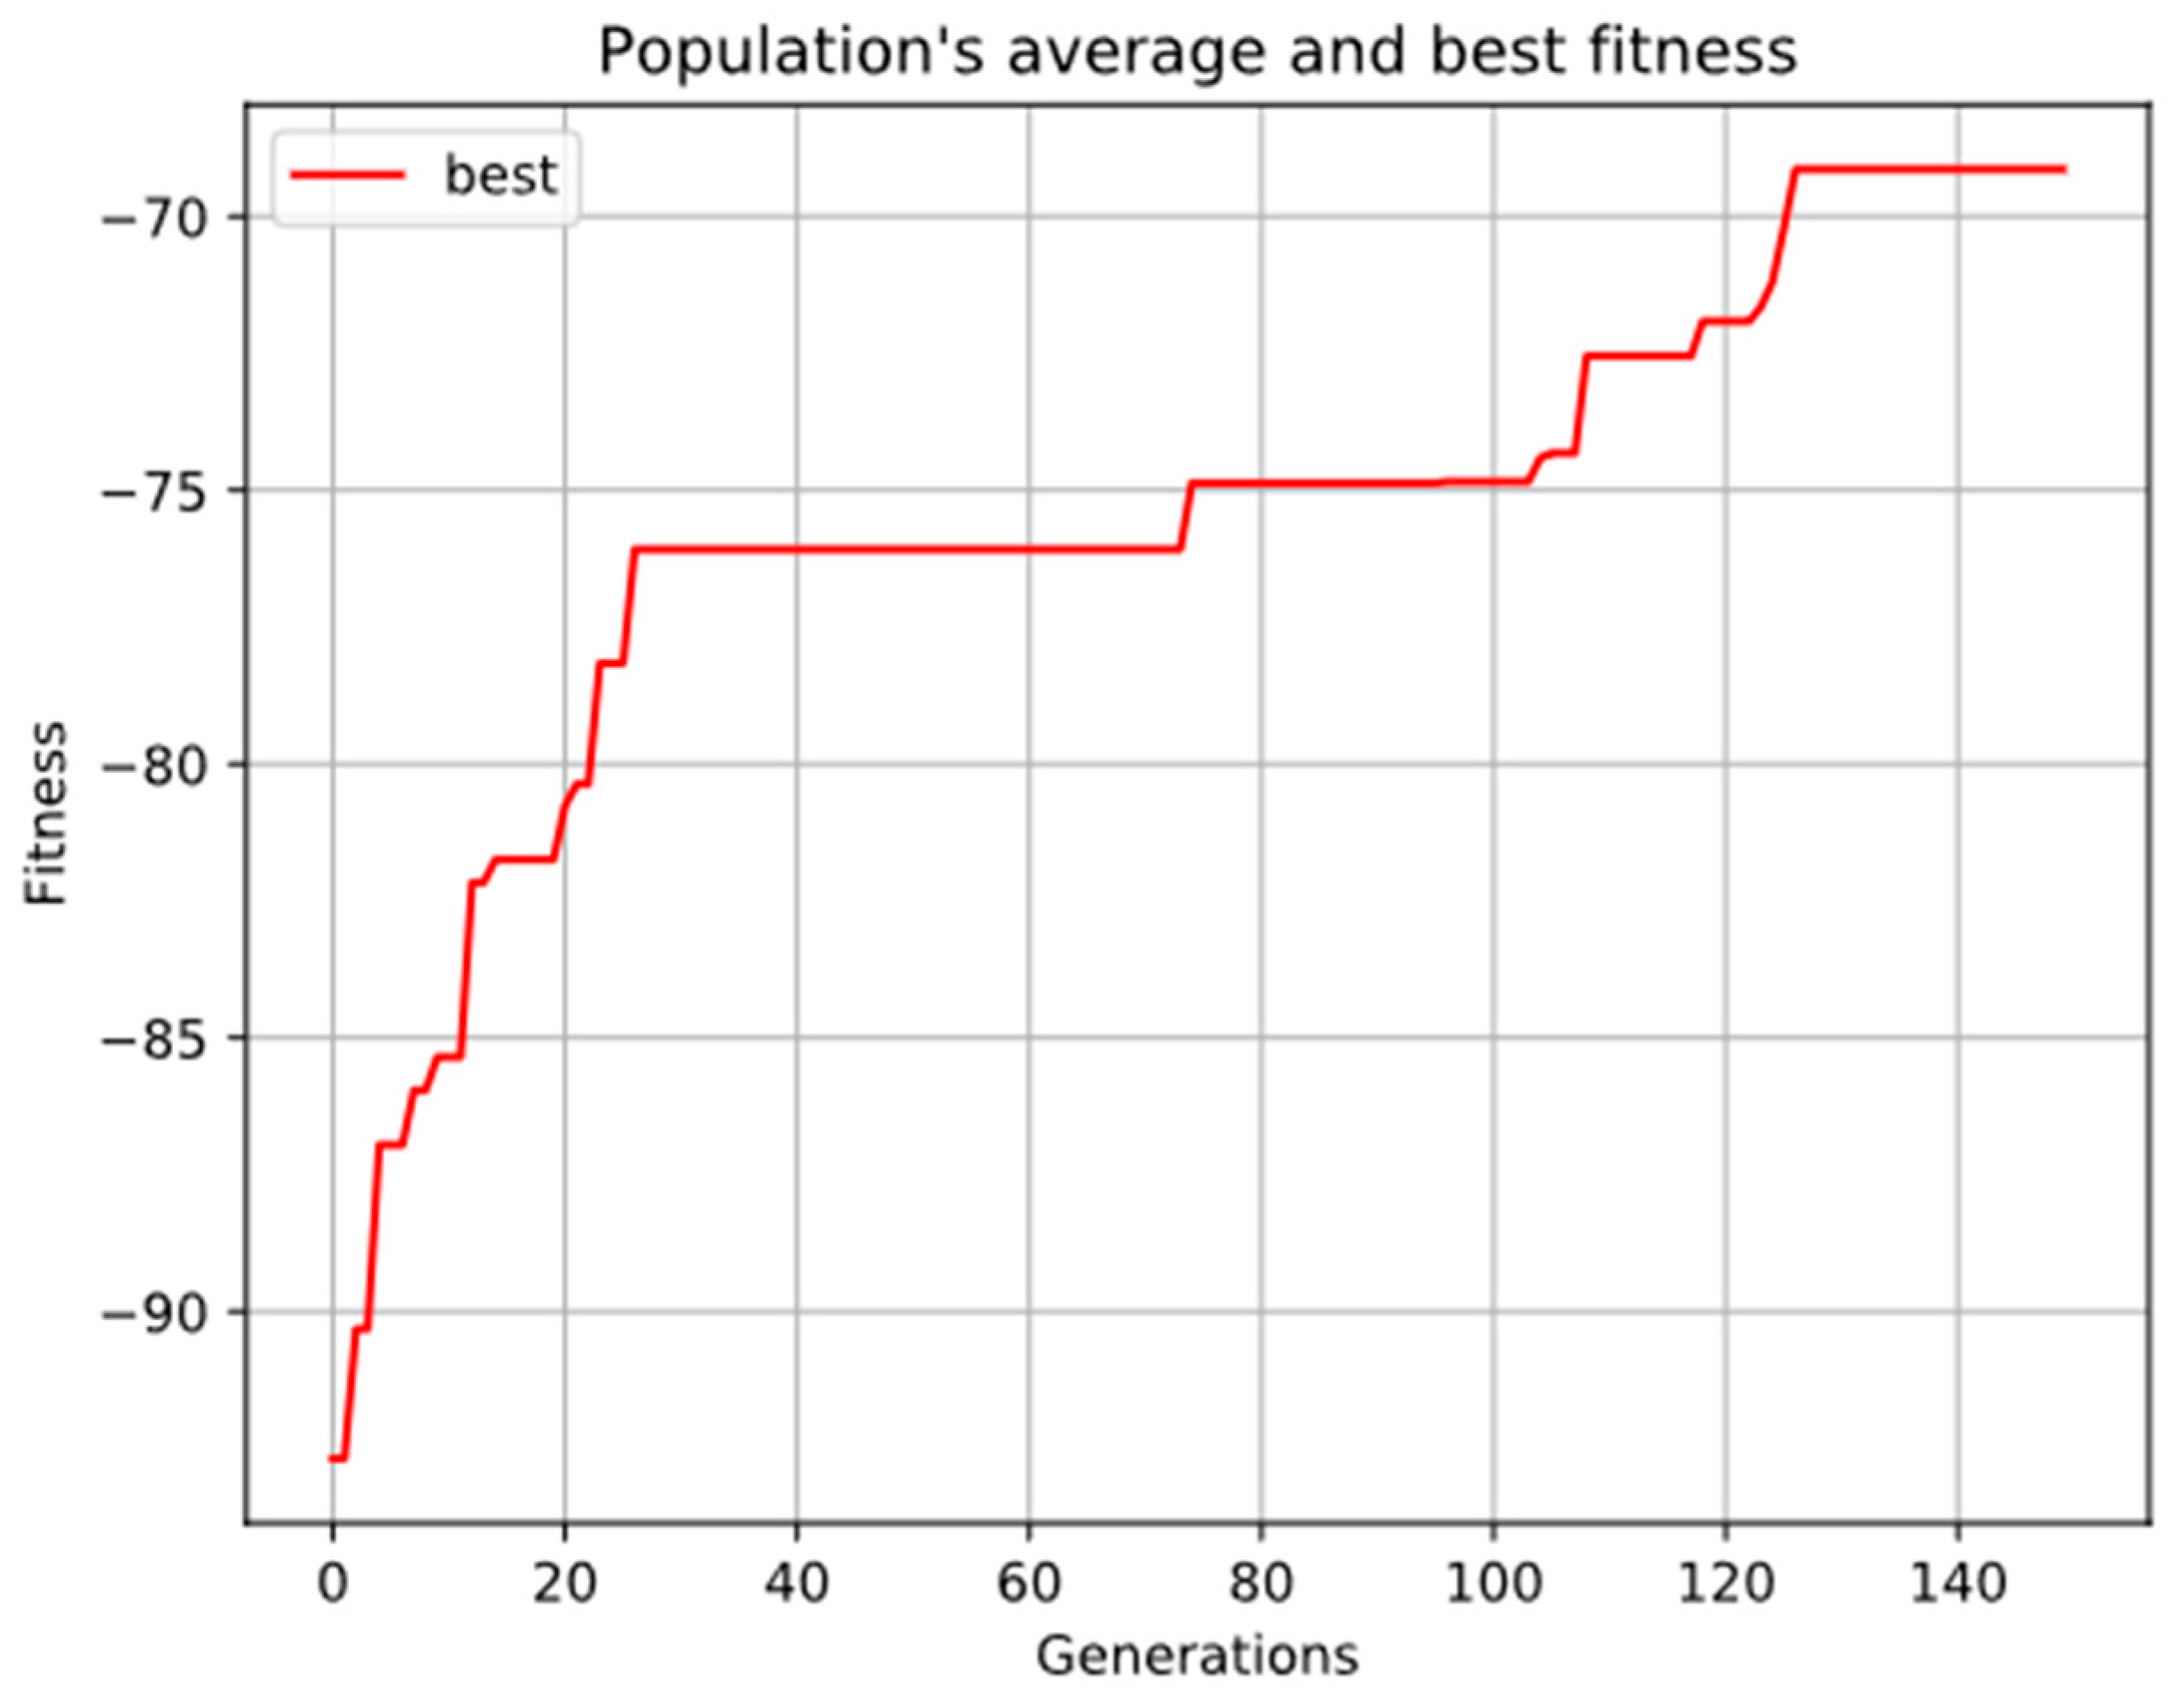
The fitness function of step 5 strictly depends on the initial problem’s optimisation objectives. We set out to generate an optimal floor plan design using the criteria summarised in Table 1. We selected the most suitable criteria to be included in the chosen NEAT encoding and that we felt were better captured by the optimisation strategy. The final result is presented in Figure 5, with the related fitness function diagram in Figure 6.
3. Results
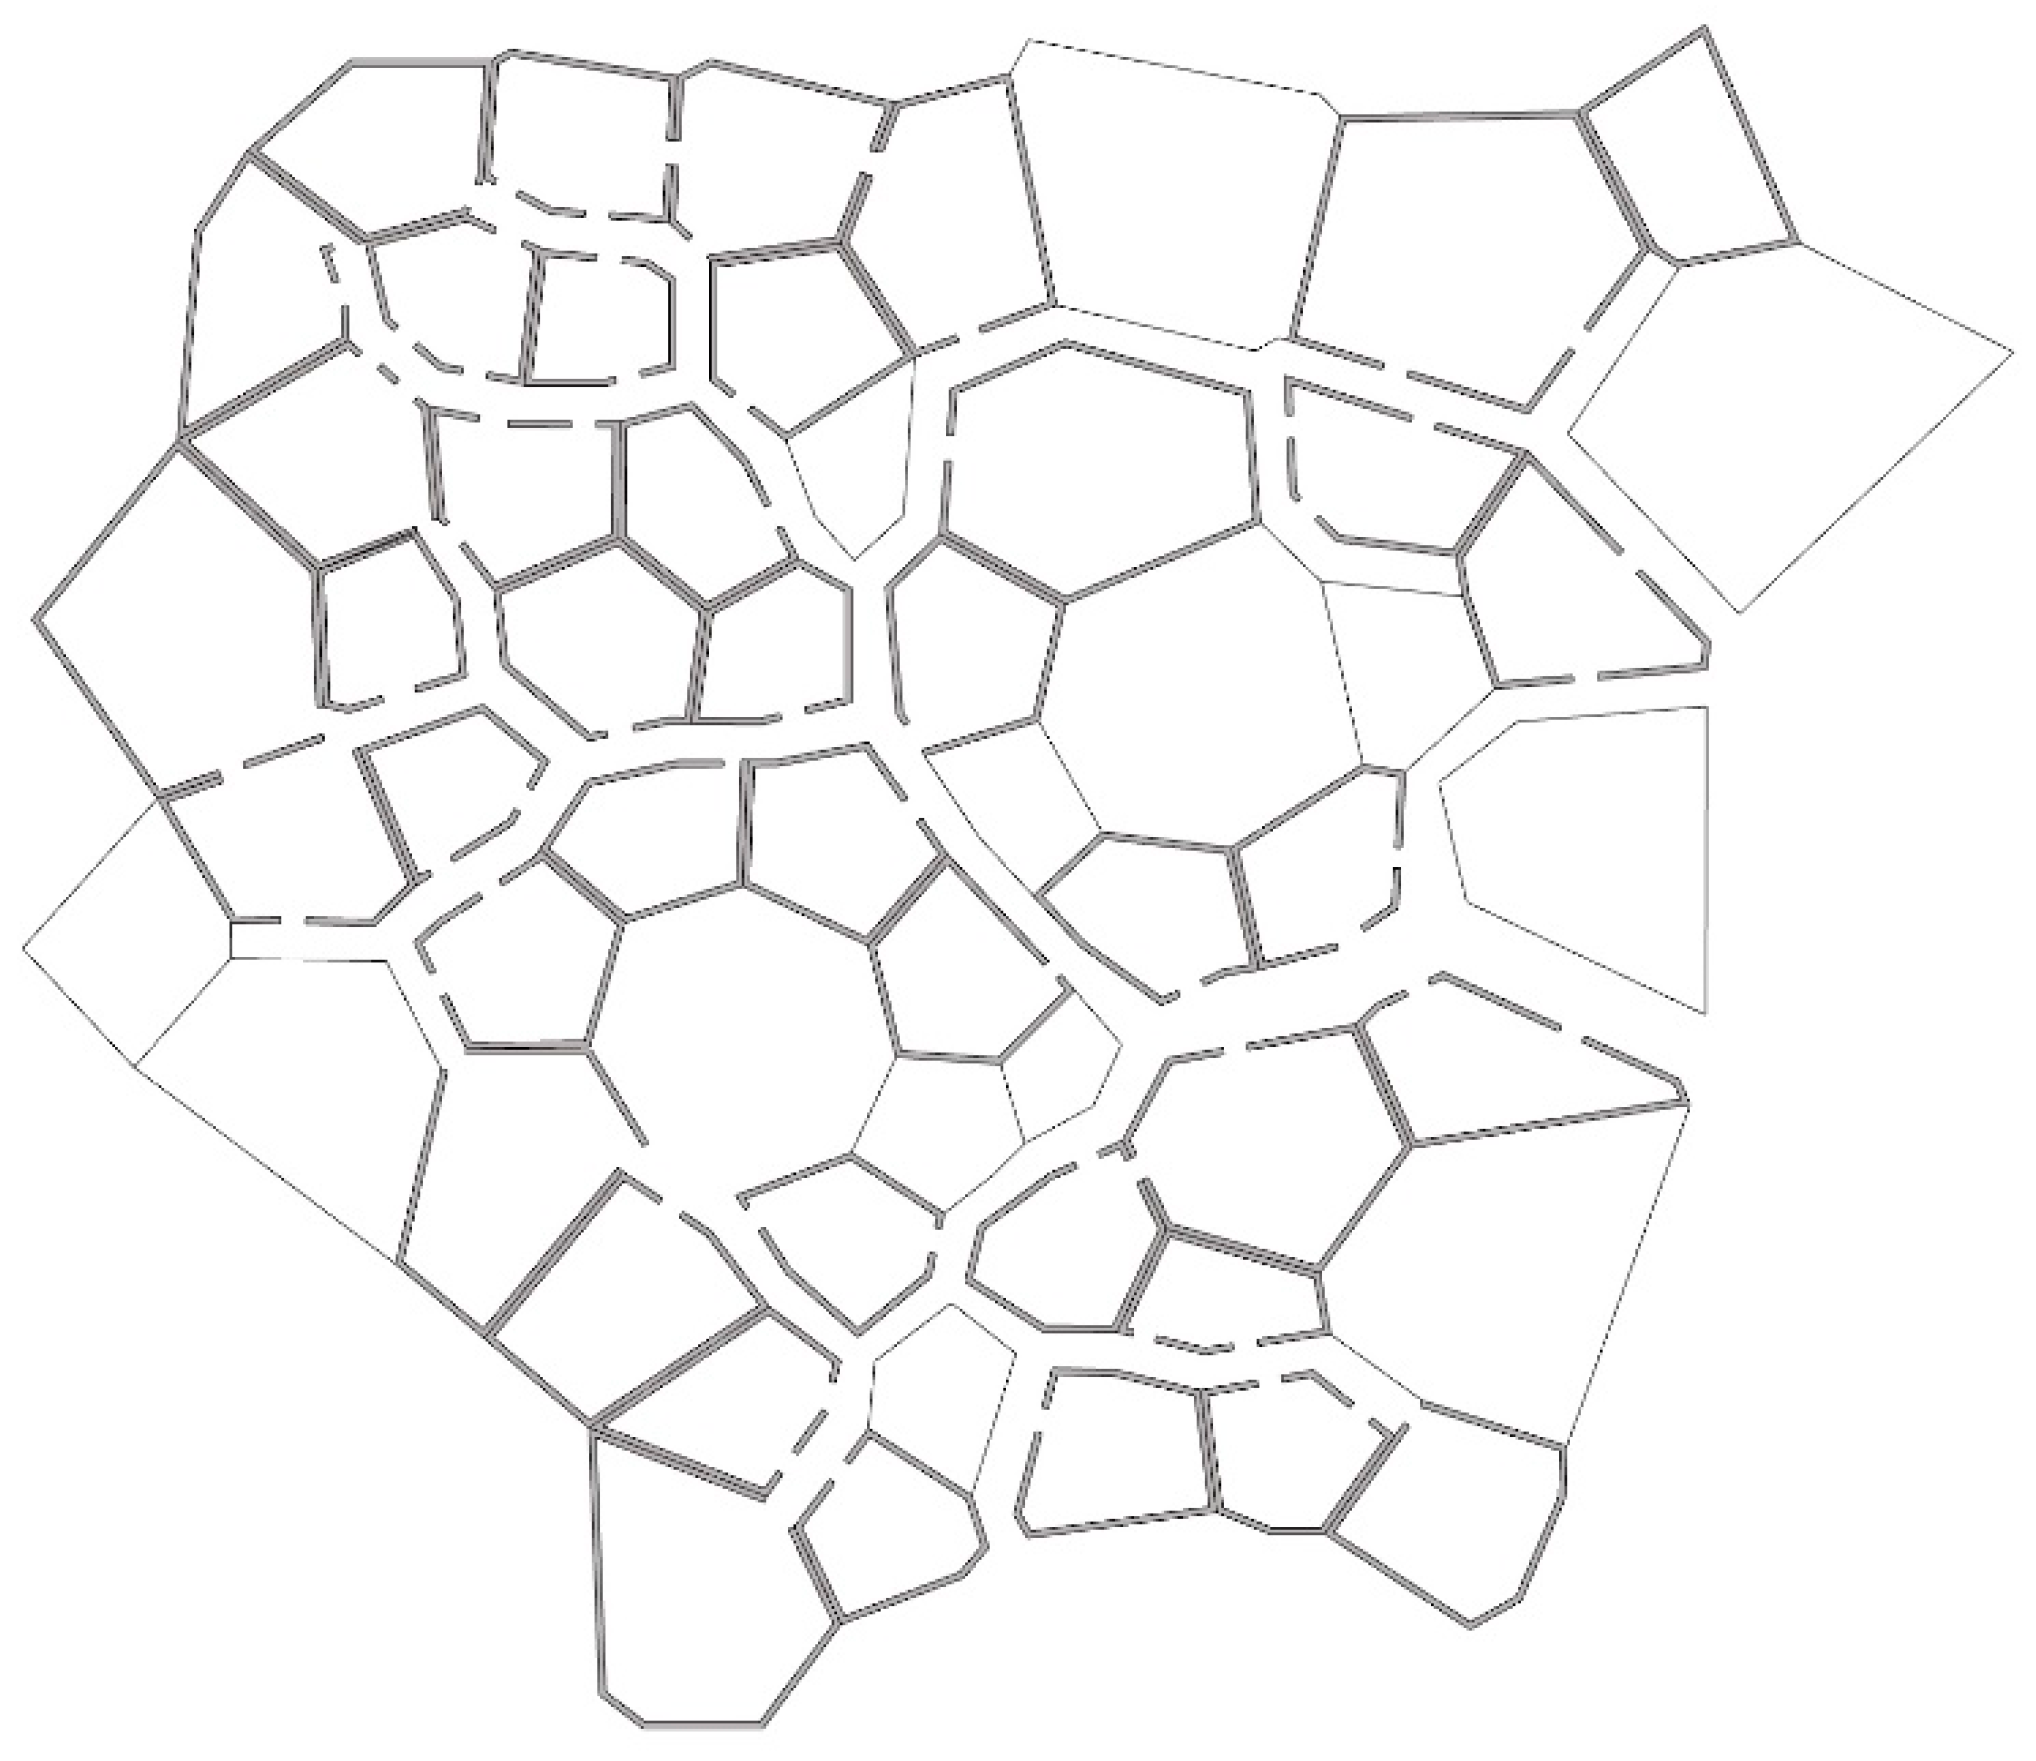
In order to test the resulting spatial configuration, we generated a model in Rhino Grasshopper (Figure 7) and used an Agent Based Modelling (ABM) simulation to evaluate the effects of the new configuration on residents. The simulation has been run using BOID [45]: A swarm behaviour library for Rhino Grasshopper developed by Peng Wang. In this simulation engine, agents move from an origin and destination points where a number of local rules apply. These are primarily obstacles (intended as opposite vectors on the position point for each iteration) and attractions (called interests and expressed as vectors that pull the agent towards certain points in the model). Agents are programmed with certain values for the vision (viewing cones) within the new spatial configuration. They detect points and areas of interest (for example the TV room or common rooms) through a fan-shaped vision of which parameters are angle, distance and angular resolution of the cone that represent what residents would actually see in their wandering. The points of interests are selected by the designers as precondition for the simulation. In this simulation, the decisions that agents (residents) take are based on what they can see from their current location (at each iteration) and the level of interest they have for a particular area.
Peng Wang’s swarm behaviour library aligns with the literature: Direct visual access to amenity areas is associated with improved wayfinding [12,13,14,15]. Visual access should reasonably promote awareness of opportunities and interest in participation in the activities of daily living, thereby promoting resident wellbeing [4].
By computing each agent individually, the PedSim engine returns complex flocking behaviours which we used in order to observe emergent behaviours within the new configuration. The simulation has been run for 15 min with generation of agents every 5 s. In total, agents produced around 100,000 trails before reaching the equilibrium (see Table 2 for details).
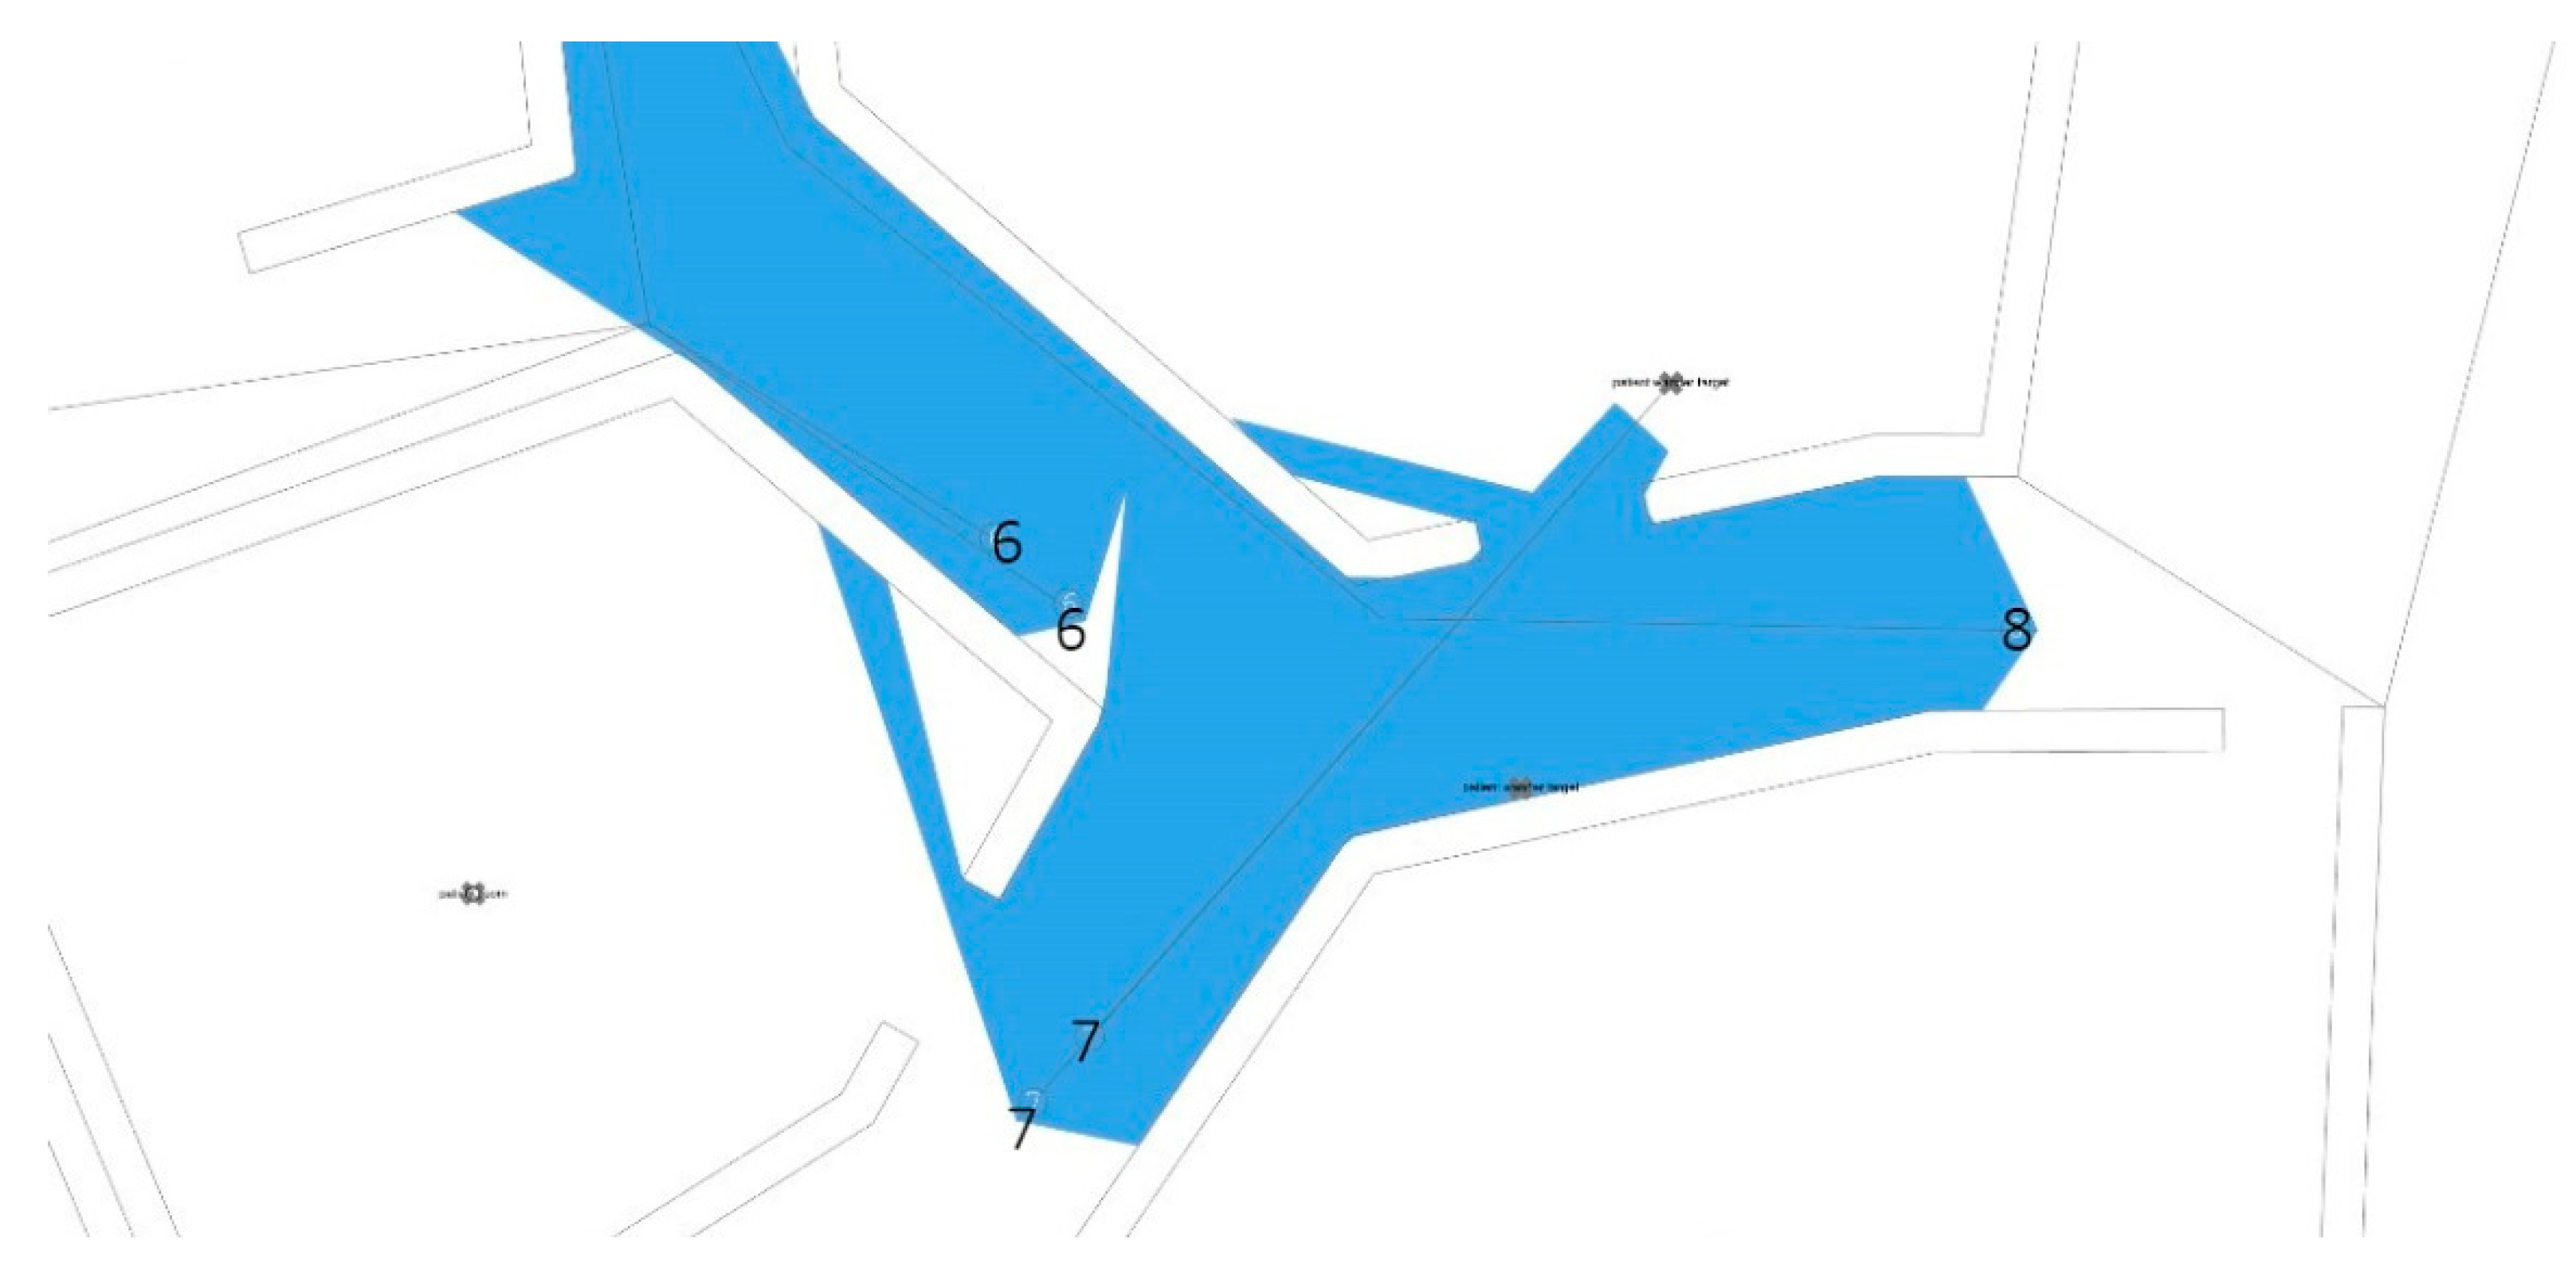
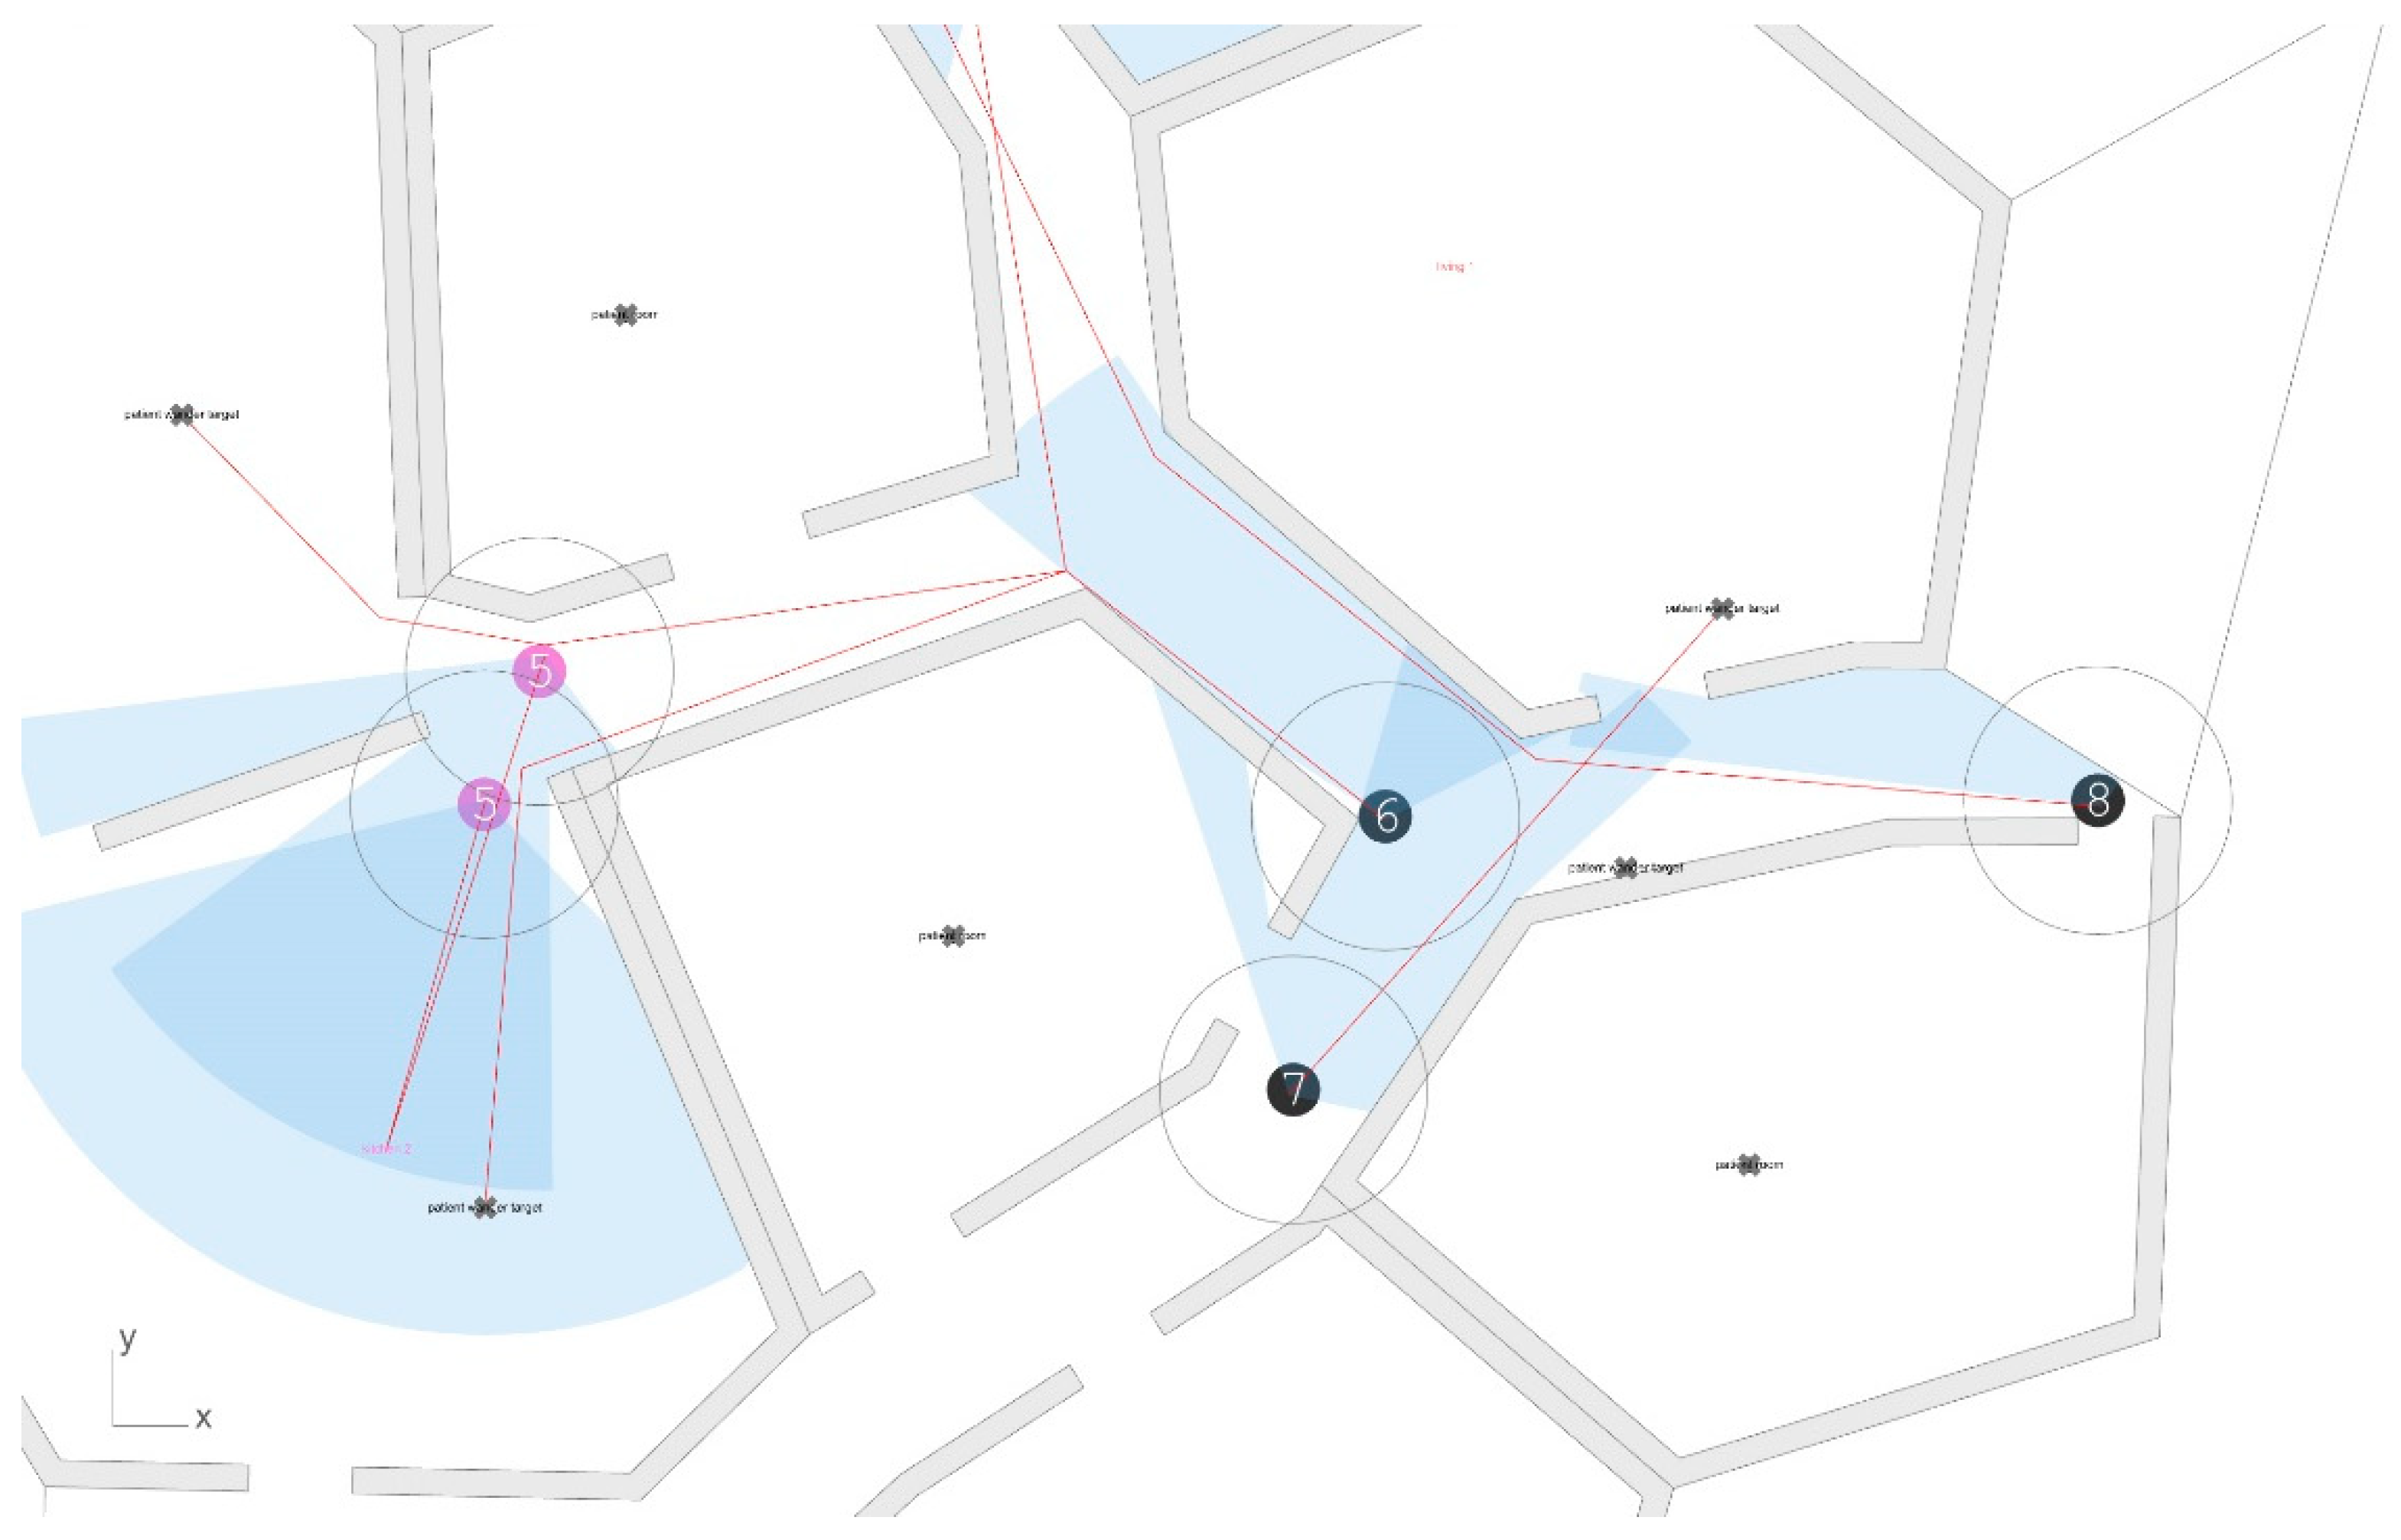
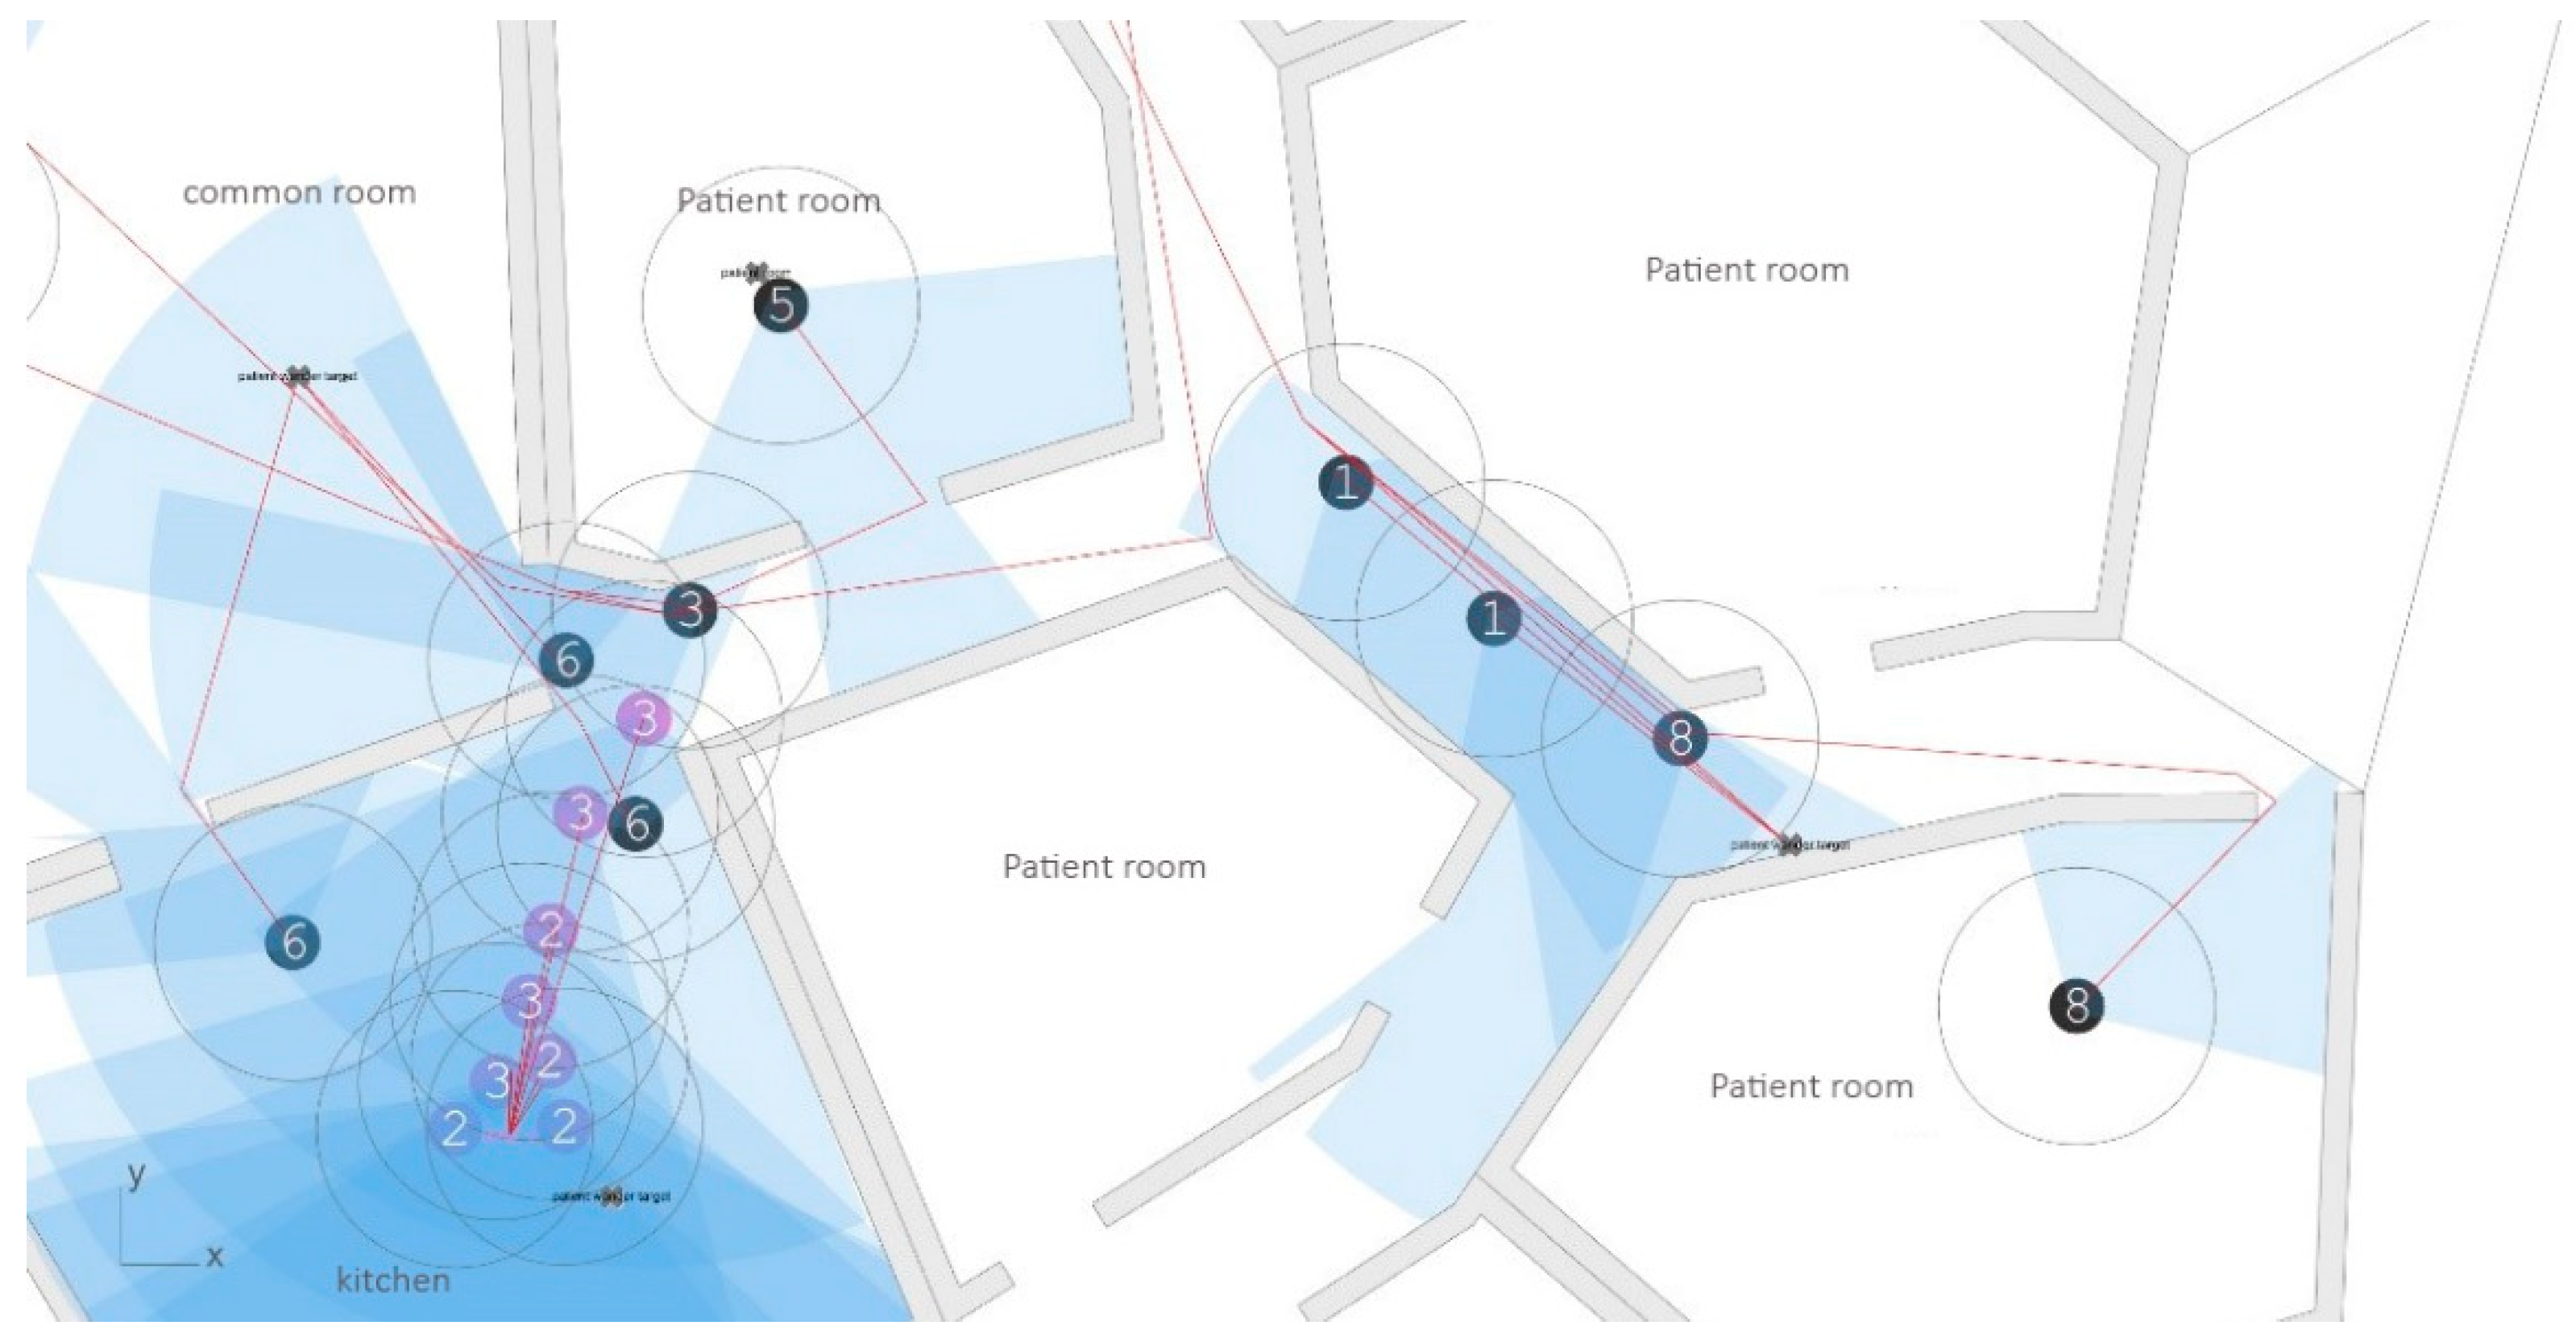
In Figure 8, we can see five agents walking through one of the main corridors as they approach one of the living rooms (living room 1), whilst in Figure 9 we can clearly observe what agents number 5–8 see in their walk.
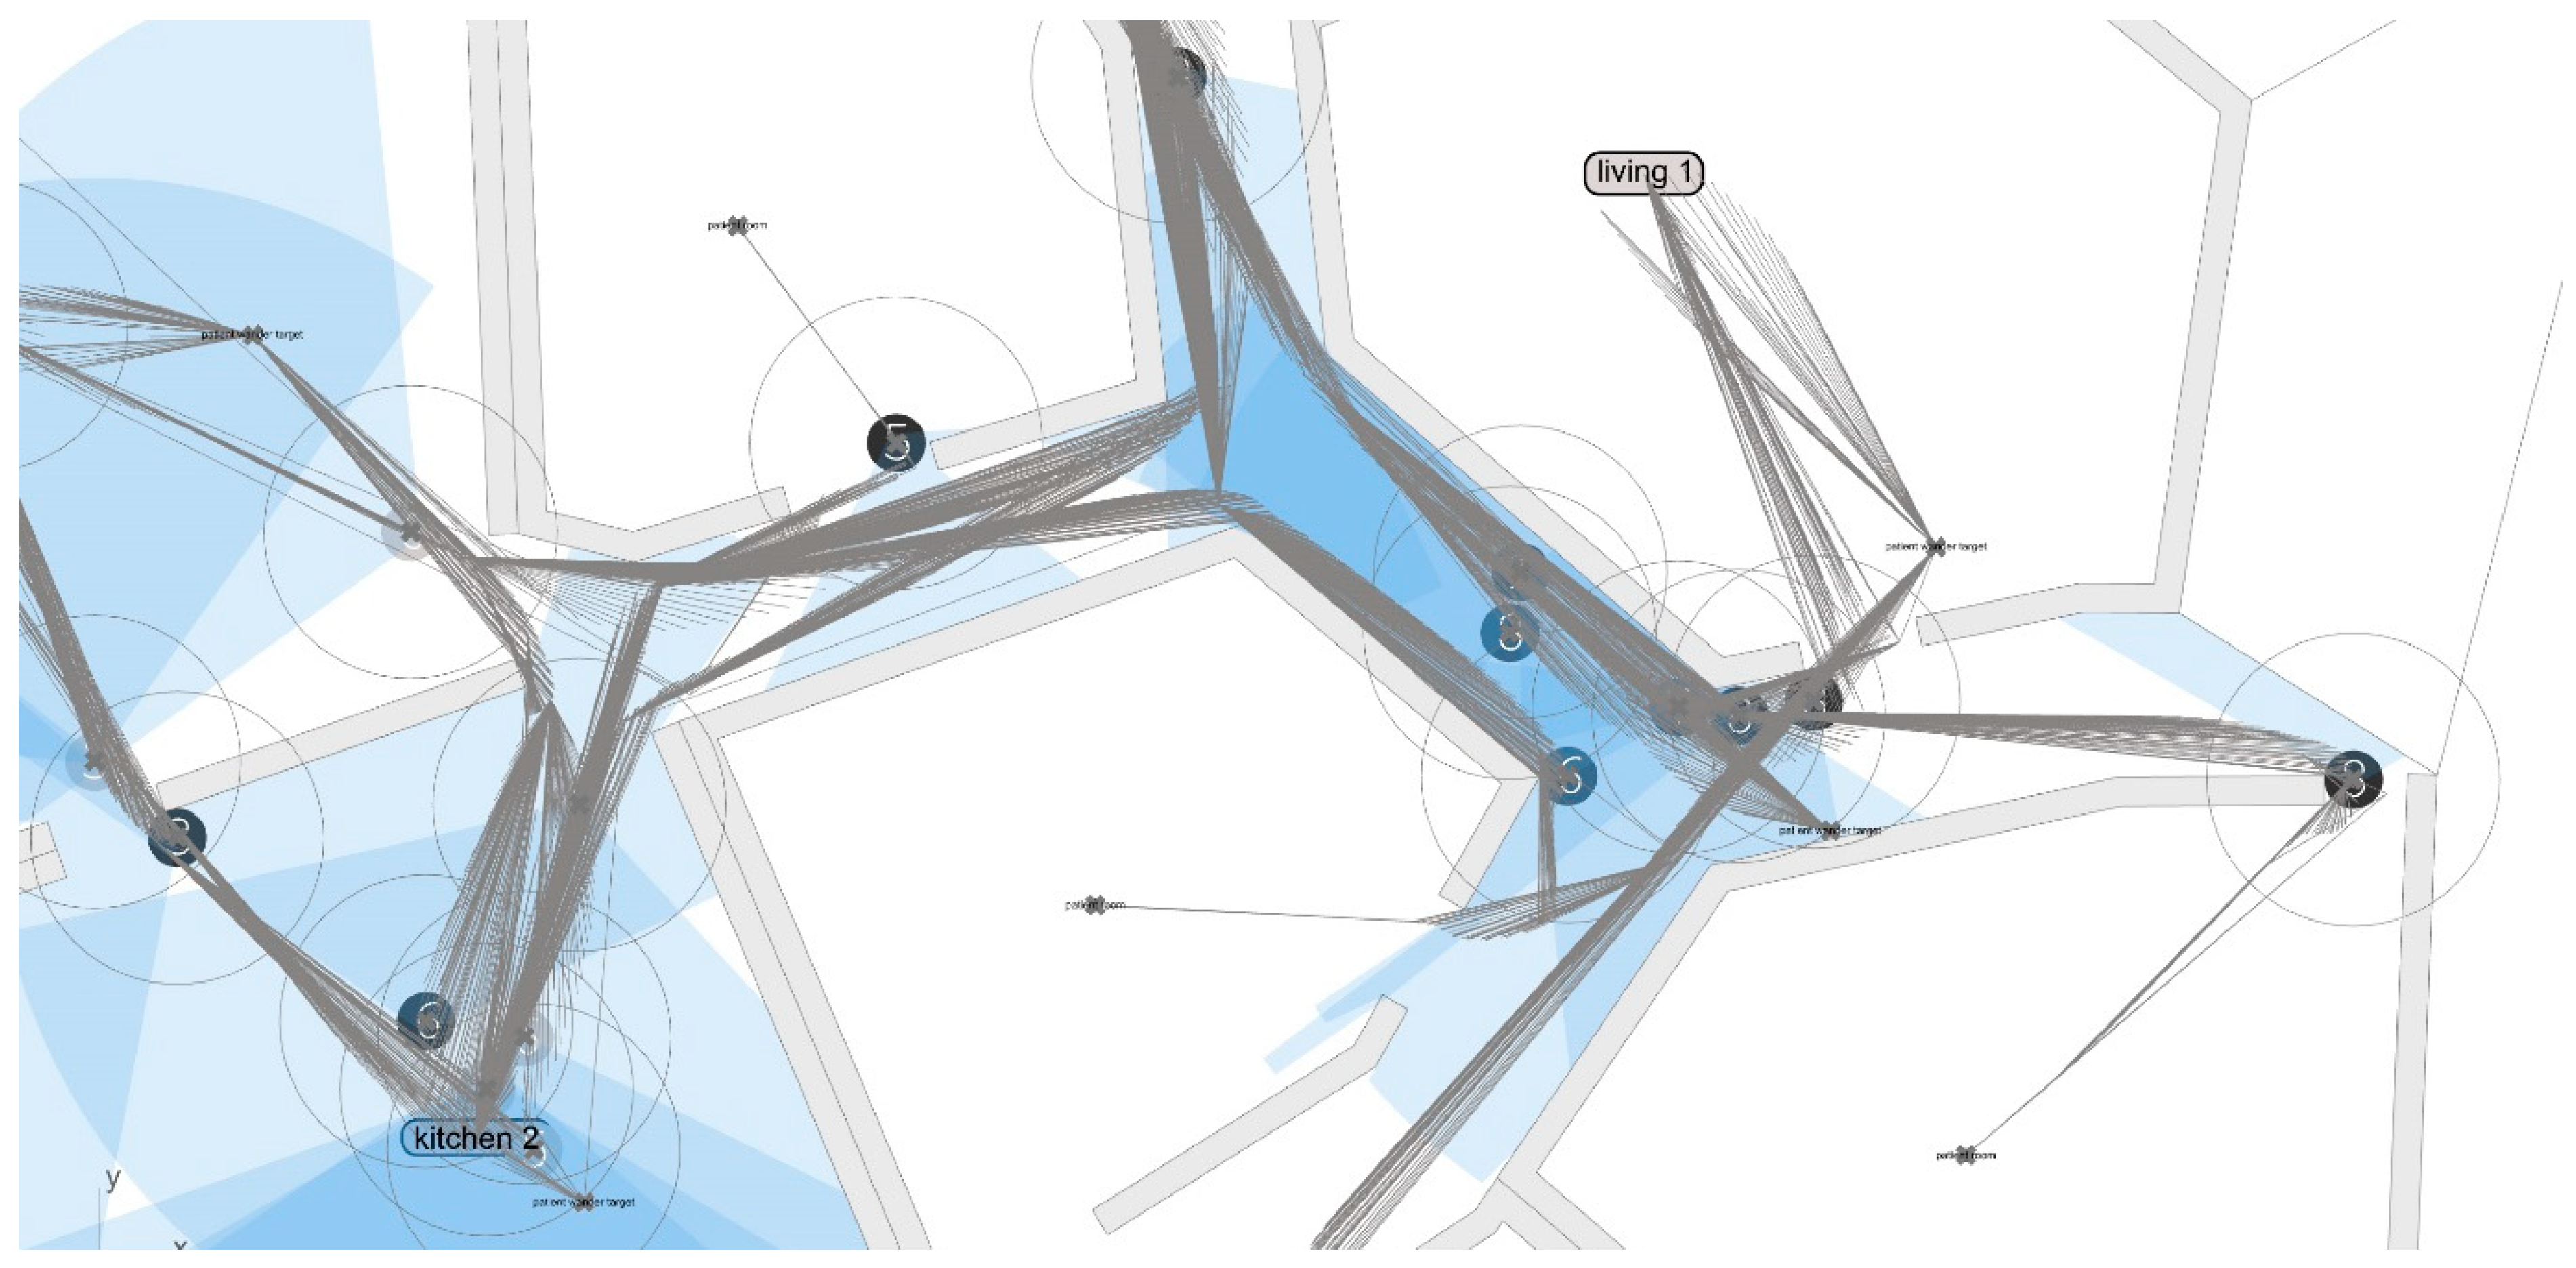
Figure 10 illustrates how a significant number of agents converge to one of the kitchens (Kitchen 2) after several iterations. The access to this kitchen is facilitated by the entrance, which the GA located at a corner between two corridors. The trails are shown in Figure 11.
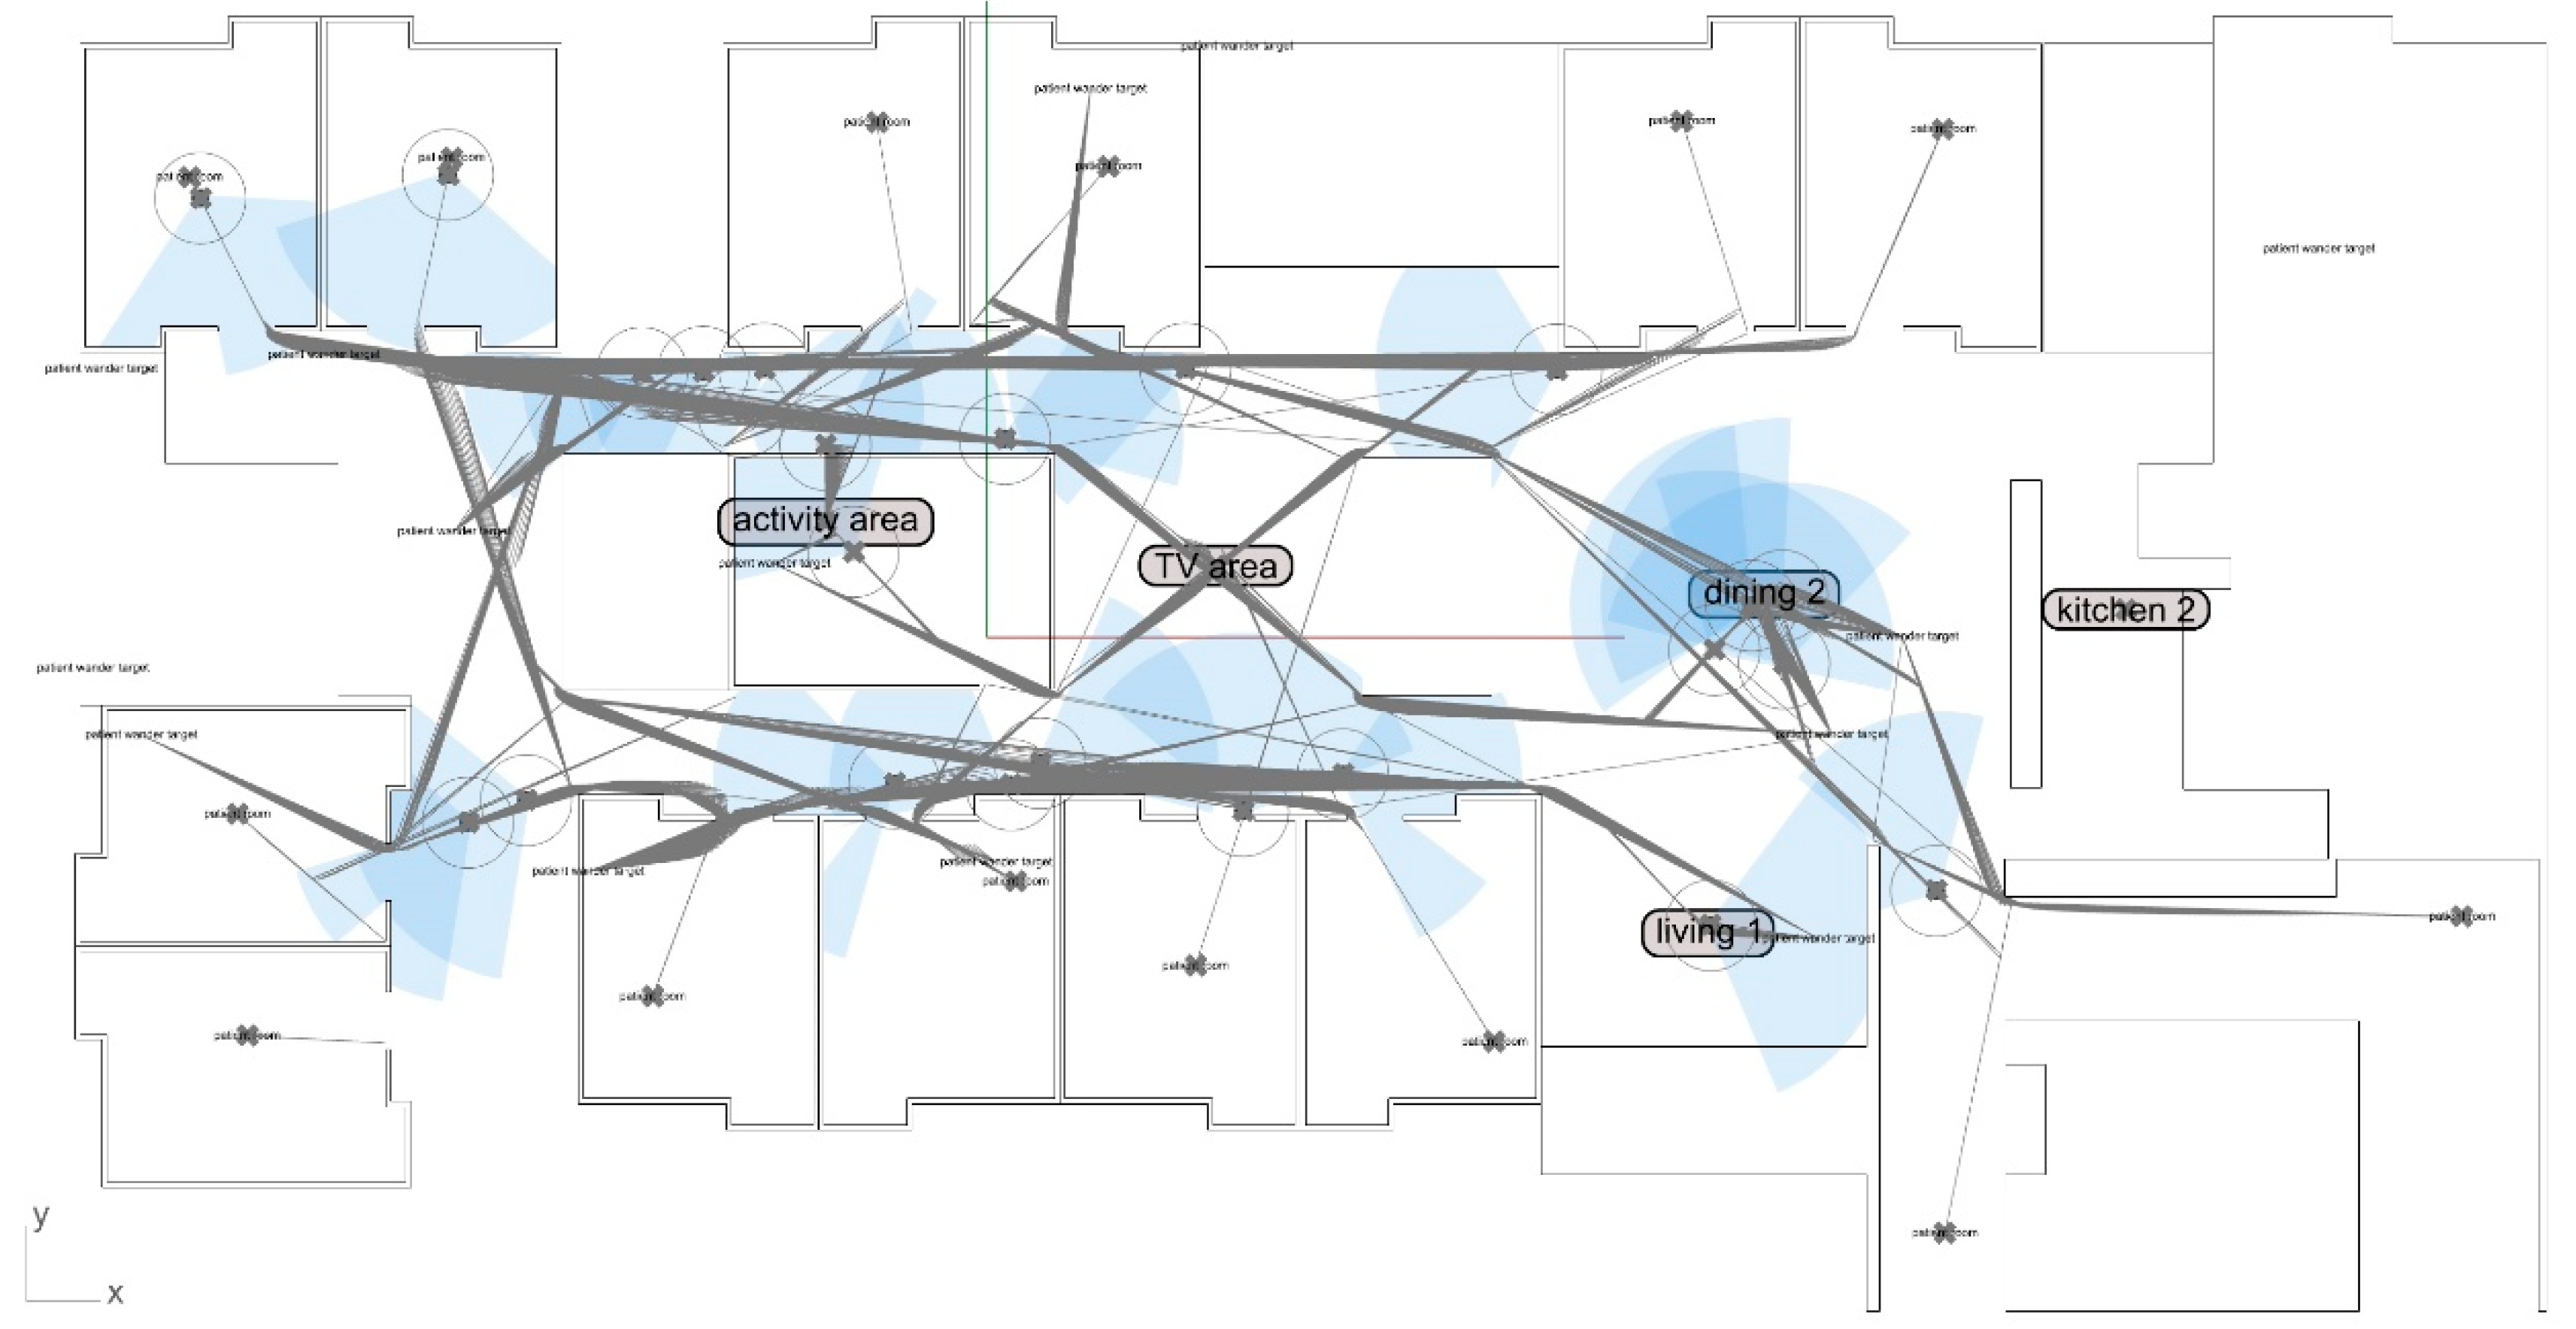
The new configuration has been compared with the same simulation settings. Figure 12 shows a number of agents (representing residents) who start their journey from their suites to go to a number of random end points. These represent the initial targets for the residents. During their journey, agents are attracted by key communal areas (areas of interest): Living room, kitchen, dining area, TV room and activity area. The attraction exercised to each agent is dependent on the visibility of the areas of interest from the location of each patient at every iteration of the simulation loop. The visibility is, in turn, related to the spatial configuration of available spaces (rooms, areas) and obstacles (walls, closed rooms).
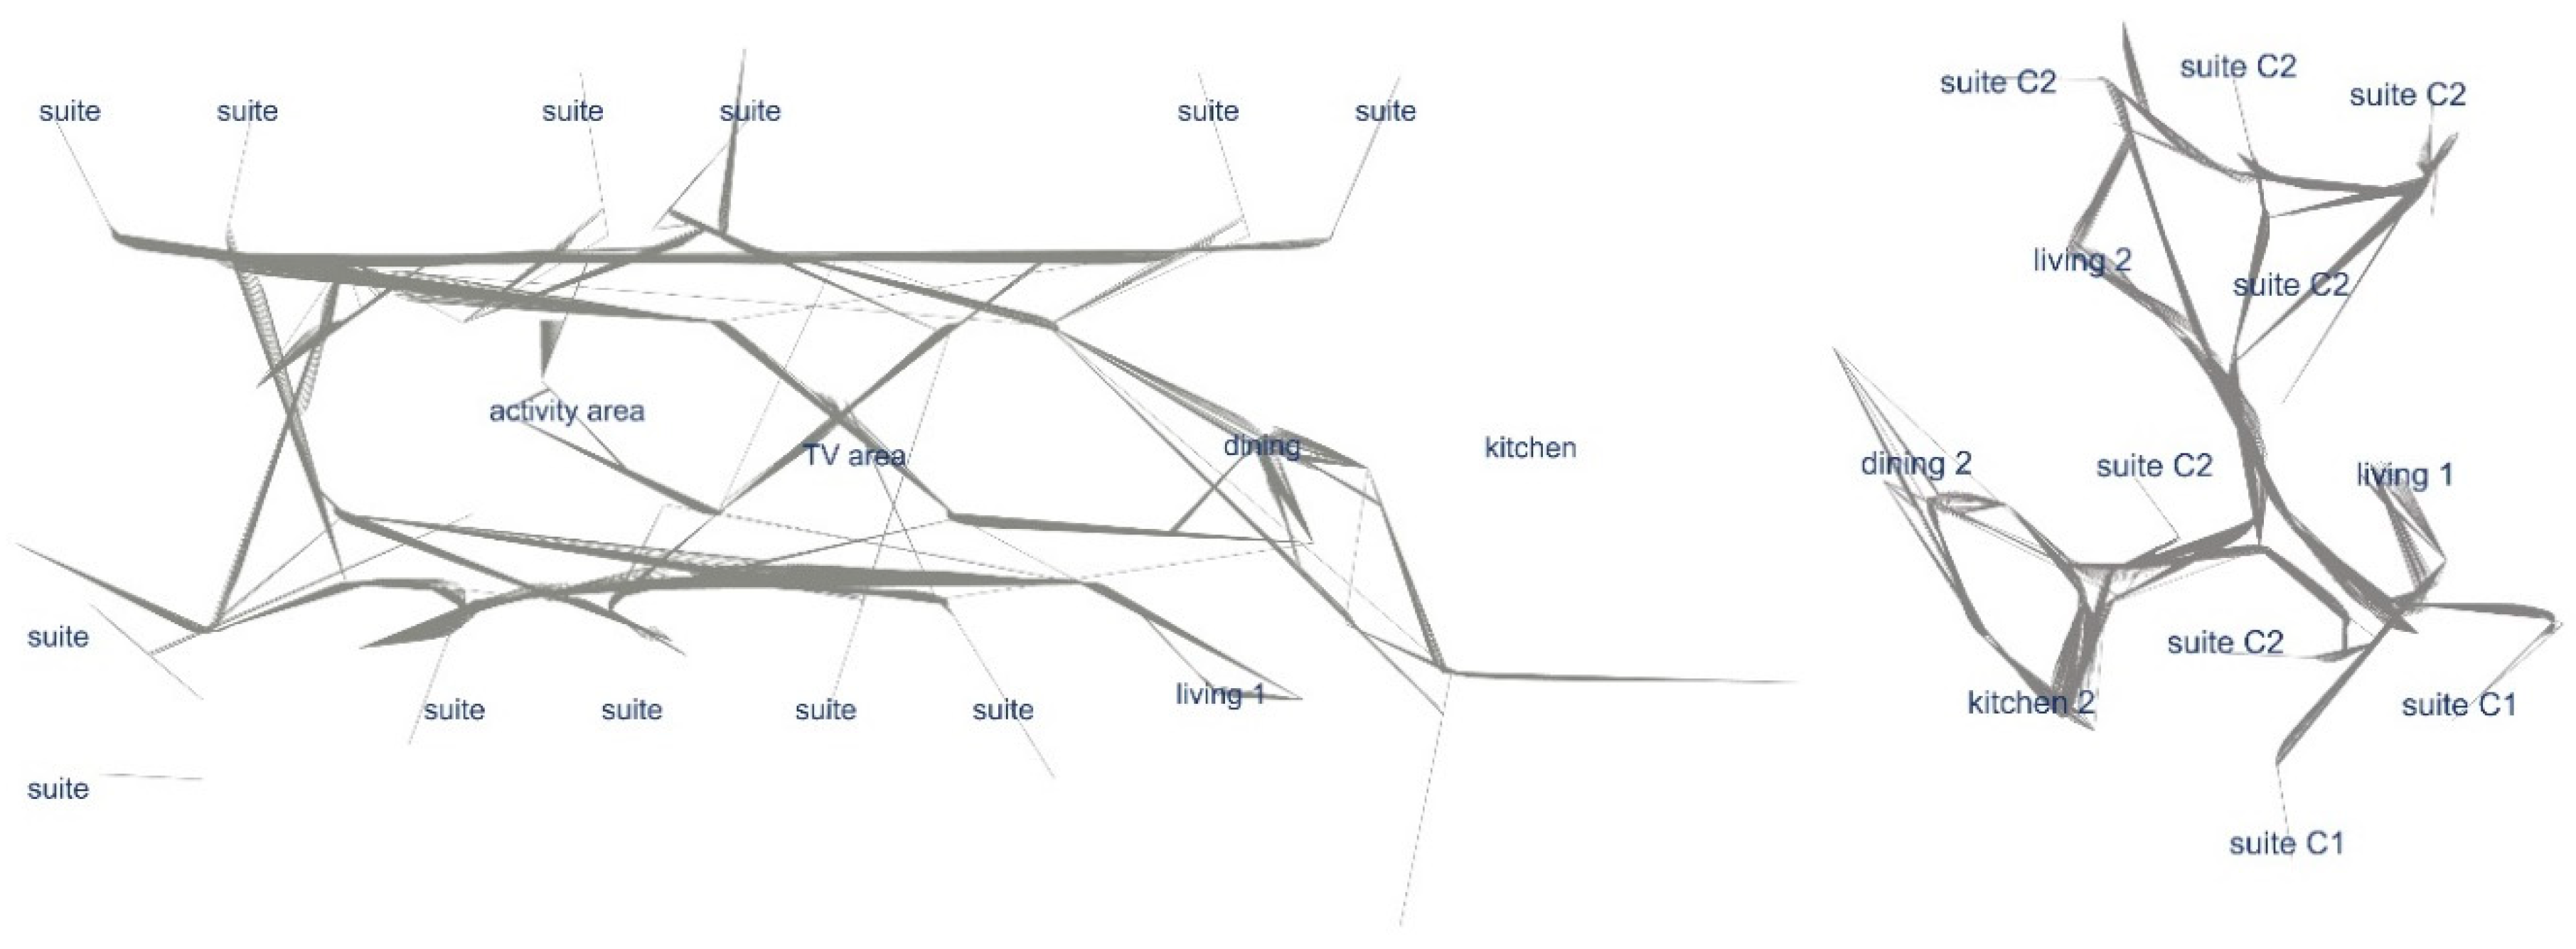
Figure 13 illustrates the comparison between the existing case study and the new care home configuration. The two simulations depict the journeys that agents (residents) make from their own rooms to the same (or similar) areas of interest. Whilst in the original configurations agents did not arrive at the kitchen and converged to the dining area, in the optimised version more agents have reached the kitchen than the dining area. Similarly, more agents arrived at the living area in the optimised configuration than in the existing case study. This is due to the fact that the optimised configuration appears more compact than the original, with a shorter length of corridors and the access to the areas of interests closer to each other. Agents have been able to see (more specifically their viewing cones have intersected the entrance of the areas of interest) the common rooms better (in an easier way) in the optimised version than the original.
By focusing on two main parameters: Accessibility and length of journey, we can observe that the optimised plan offers a higher performance. This is measured in terms of number and length of the trails (journeys) that residents need to make. As shown in Table 2, the original plan would require a smaller number of journeys for agents to perform their task if compared to the optimised plan (88,255 versus 99,528 journeys). However, the length of the trails in the original plan is almost double of the optimised configuration, with a total of 6464 Km versus 3716 Km. The optimised solution found with our GA halves the length of the total journeys of residents in this care home.
It is worth noting that the simulation was run with the generation of a new agent every 5 s. To convert the results to a more realistic set, we assume that during the 15 min simulation only one agent is generated per each origin point (that accounts for eight residents in total). With a conversation factor of 180 (that is 15 min = 900 s with 900/5 = 180), we calculated that in 3 min of simulation (in realistic time) one agent walks 73.25 m in the original floor plan. This value is perfectly in line with average walking speed of a person (1.4 m per s (m/s) = 84 m/min). In the optimised plan, we obtained that in 3 min one agent walks 37.34 m. This means that the new configuration requires residents to walk approximately half of the distance of the original plan (Table 3).
4. Discussion
Efficiency of building floor plans is rarely linked to sustainability. However, inefficient building plans cost more to run in terms of heating and lighting, cause more carbon emissions, and, depending on the scheme used, make the building users unnecessarily longer journeys between the spaces, thus wasting more of the valuable time. This is especially important in health facilities, such as care homes, where the efficiency of the floor plan and the effective and safe movement of both residents and care workers is paramount.
This work focused on a workflow to optimise a bidimensional spatial configuration (floor plan) in care homes settings. It is considered an initial phase of a larger undertaking where we only tested principles for automatic optimisation through genetic algorithms. We also wanted to test how we can generate elaborated inputs for the GA from existing studies on design criteria in care homes.
The effects of spatial layouts on energy performance in buildings are well-documented in recent studies published in this journal [46]. These are translated into energy use for space heating and cooling, effects on the energy use for lighting and ventilation, and more generally, on effects on thermal comfort and visual comfort. With our results, we argue that this optimisation method contributes to the achievement of environmental sustainability and, indirectly to social and economic sustainability. In a layout where shorter paths are needed to connect key parts of the facility, designers can identify parts of the facility that have different energetic needs (thermal comfort and lighting for example), resulting in a more intelligent use of buildings and resources.
Upon initial examination, the new spatial layout demonstrates that inputting a limited set of design criteria into the GA produces some optimisations (which are quantitatively measurable), but there is potential to expand the criteria to include functional adjacencies and the full breadth of design recommendations. However, the layout also provokes consideration of non-traditional approaches for spatial organisation with important affordances. For example, the resident suites are not clustered together within each pod, and the amenity and outdoor spaces are more distributed than in most care homes. Resident suites are typically clustered to achieve quieter zones within the pod and reduce intrusions from passing residents, but there are other ways to solve these problems, such as doorways set-back from corridors [47] and acoustic wall and door construction specifications. At the time of writing it is of particular interest that this non-traditional distributed spatial organisation presented by the GA could allow for planned infection control of residents within areas of the care home with access to amenities.
While the generated layout achieves optimisation for the limited design criteria explored, it should be expanded to meet the entire breadth of existing recommendations for care home environments. There is more work to be done on the elaboration of the design criteria. For example, future work should include the integration of objectives for corridors and other connections, visual interconnection and viewing cones for users, and more specific criteria for the residents’ suites which, for the purpose of this study, have been considered as all equal.
Moreover, the design criteria in future development of this study should consider five main categories: (1) Basic design configurations (spatial relationships and programming spaces arrangements); (2) ambiance (the overall residential feel of the space); (3) environmental attributes (including thermal comfort, light, circadian rhythms, acoustics, and glare); (4) assistive measures (ambulation devices and rail profiles, bio mechanics of walking gaits, sit to stand, etc.) and, finally, environmental wayfinding (ease of understanding the physical environment) [47].
Finally, future work should evaluate and test recommendations for a straight circulation system versus a curved one, visual access to relevant places, and meaningful reference points [6]. Though the cognitive and perceptual challenges of complex circulation forms are worth parsing to see if they can be overcome within various design approaches. Traditional building materials and methods make straight walls easy to build, but emergent technologies for building and design such as 3D printed buildings are making other approaches feasible. Even though the shortest distance between two points is a straight line, the optimized layout demonstrates that the shortest travel path through a complex layout may not be.
This study has demonstrated that GAs can be a useful tool for the practice of designing and analysing care home building layouts, in order to generate more sustainable spatial configurations. GAs can be used to consider a wider breadth of approaches to spatial organisation than is feasible within traditional design practices and may provoke innovation. Modelling simulations of resident activity within generated spatial organisations can allow for empirical analysis and testing of relevant criteria such as visual access and circulation paths, which can be translated to more sustainable design approaches.
Author Contributions
Conceptualization, S.C.; data curation, S.S.L.; formal analysis, T.T.; investigation, T.T. and J.S.; Methodology, S.C., S.S.L., T.T. and J.S.; resources, S.S.L., J.S.; visualization, S.C., T.T.; writing—review & editing, S.C. and S.S.L. All authors have read and agreed to the published version of the manuscript.
Funding
This research received no external funding. Support has generously been given by the School of Creative Arts at the University of Hertfordshire to conduct the experiments that underpin this study.
Acknowledgments
The authors wish to thank Robert Wrublowsky of MMP Architects Inc. for letting them use the floor plan of one of his projects as a starting point for the case study illustrated in this article and for his advice and support on the discussion of the design criteria. The authors are grateful to Prof Jankovic for his guidance and useful comments during the development of this study. Figure 8, Figure 9, Figure 10, Figure 11 and Figure 12 have been made by using PedSim library for Grasshopper by Peng Wang.
Conflicts of Interest
The authors declare no conflict of interest.
References
- Day, K.; Carreon, D.; Stump, C. The therapeutic design of environments for people with dementia: A review of the empirical research. Gerontologist 2000, 40, 397–416. [Google Scholar] [CrossRef] [PubMed] [Green Version]
- Wang, L.; Gwilliam, J.; Jones, P. Case study of zero energy house design in UK. Energy Build. 2009, 41, 1215–1222. [Google Scholar] [CrossRef]
- Verbeek, H.; Van Rossum, E.; Zwakhalen, S.M.; Kempen, G.I.; Hamers, J.P. Small, homelike care environments for older people with dementia: A literature review. Int. Psychogeriatr. 2009, 21, 252–264. [Google Scholar] [CrossRef] [PubMed]
- Calkins, M.P. From research to application: Supportive and therapeutic environments for people living with dementia. Gerontologist 2018, 58, S114–S128. [Google Scholar] [CrossRef] [PubMed]
- Lawton, M.P. Environment and Aging; Center for the Study of Aging: Albany, NY, USA, 1986. [Google Scholar]
- Marquardt, G.; Bueter, K.; Motzek, T. Impact of the design of the built environment on people with dementia: An evidence-based review. HERD Health Environ. Res. Des. J. 2014, 8, 127–157. [Google Scholar] [CrossRef]
- Kemerer, D. Addressing adventitious behaviors associated with dementia. J. Neurol. Neurosurg. Nurs. 2018, 7, 40–45. [Google Scholar] [CrossRef]
- Duffy, A.; Hallahan, P. Wandering behaviour and elopement in the nursing home. Br. J. Healthc. Assist. 2019, 13, 26–30. [Google Scholar] [CrossRef]
- Algase, D.L.; Moore, D.H.; Vandeweerd, C.; Gavin-Dreschnack, D.J. Mapping the maze of terms and definitions in dementia-related wandering. Aging Ment. Health 2007, 11, 686–698. [Google Scholar] [CrossRef]
- Algase, D.L.; Kupferschmid, B.; Beel-Bates, C.A.; Beattie, E.R. Estimates of stability of daily wandering behavior among cognitively impaired long-term care residents. Nurs. Res. 1997, 46, 172–178. [Google Scholar] [CrossRef]
- Lai, C.K.; Arthur, D.G. Wandering behaviour in people with dementia. J. Adv. Nurs. 2003, 44, 173–182. [Google Scholar] [CrossRef]
- Elmstaahl, S.; Rosén, I. Postural hypotension and EEG variables predict cognitive decline: Results from a 5-year follow-up of healthy elderly women. Dement. Geriatr. Cogn. Disord. 1997, 8, 180–187. [Google Scholar] [CrossRef]
- Marquardt, G.; Schmieg, P. Dementia-friendly architecture: Environments that facilitate wayfinding in nursing homes. Am. J. Alzheimer’s Dis. Other Dement. 2009, 24, 333–340. [Google Scholar] [CrossRef] [PubMed] [Green Version]
- Netten, A. The effect of design of residential homes in creating dependency among confused elderly residents: A study of elderly demented residents and their ability to find their way around homes for the elderly. Int. J. Geriatr. Psychiatry 1989, 4, 143–153. [Google Scholar] [CrossRef]
- Passini, R.; Pigot, H.; Rainville, C.; Tétreault, M.-H. Wayfinding in a nursing home for advanced dementia of the Alzheimer’s type. Environ. Behav. 2000, 32, 684–710. [Google Scholar] [CrossRef]
- Passini, R.; Rainville, C.; Marchand, N.; Joanette, Y. Wayfinding and dementia: Some research findings and a new look at design. J. Archit. Plan. Res. 1998, 15. No. 2 (Summer, 1998). [Google Scholar]
- Annerstedt, L.; Fournier, K.; Gustafson, L.; Hallen, U.; Malmkvist, I.; Salö, S.; Schultz, J.; Stjernfeldt, G.; Ahlund, O.; Tennek, J. Group Living for People with Dementia; Dementia Services Development Centre, University of Sterling: Stirling, UK, 1993. [Google Scholar]
- Aiken, L.H.; Sloane, D.M.; Sochalski, J. Hospital organisation and outcomes. Qual. Health Care QHC 1998, 7, 222. [Google Scholar] [CrossRef] [PubMed] [Green Version]
- Tripp-Reimer, T.; Doebbeling, B. Qualitative perspectives in translational research. Worldviews Evid.-Based Nurs. 2004, 1, S65–S72. [Google Scholar] [CrossRef]
- Cleary, T.A.; Clamon, C.; Price, M.; Shullaw, G. A reduced stimulation unit: Effects on patients with Alzheimer’s disease and related disorders. Gerontologist 1988, 28, 511–514. [Google Scholar] [CrossRef]
- Fleming, R.; Purandare, N. Long-term care for people with dementia: Environmental design guidelines. Int. Psychogeriatr. 2010, 22, 1084–1096. [Google Scholar] [CrossRef] [Green Version]
- Cohen, U.; Weisman, G.D. Holding on to Home: Designing Environments for People with Dementia; John Hopkins University Press: Baltimore, MD, USA, 1991. [Google Scholar]
- Brawley, E.C. Designing for Alzheimer’s Disease: Strategies for Creating Better Care Environments; John Wiley & Sons: Hoboken, NJ, USA, 1997; Volume 1. [Google Scholar]
- McIntyre, L.; Harrison, I. The effects of built environment design on opportunities for wellbeing in care homes. Int. J. Archit. Res. ArchNet-IJAR 2017, 11, 138–156. [Google Scholar] [CrossRef]
- Hall, H.; Sällemark, M.; Jerning, E. Effects of remoxipride and some related new substituted salicylamides on rat brain receptors. Acta Pharmacol. Toxicol. 1986, 58, 61–70. [Google Scholar] [CrossRef] [PubMed]
- Evans, L.K.; Strumpf, N.E. Tying down the elderly: A review of the literature on physical restraint. J. Am. Geriatr. Soc. 1989, 37, 65–74. [Google Scholar] [CrossRef] [PubMed]
- Nelson, I.; Hanna, M.G.; Alsanjari, N.; Scaravilli, F.; Morgan-Hughes, J.A.; Harding, A.E. A new mitochondrial DNA mutation associated with progressive dementia and chorea: A clinical, pathological, and molecular genetic study. Ann. Neurol. Off. J. Am. Neurol. Assoc. Child Neurol. Soc. 1995, 37, 400–403. [Google Scholar] [CrossRef] [PubMed]
- Annerstedt, L. An attempt to determine the impact of group living care in comparison to traditional long-term care on demented elderly patients. Aging Clin. Exp. Res. 1994, 6, 372–380. [Google Scholar] [CrossRef]
- Cohen-Mansfield, J.; Werner, P. The effects of an enhanced environment on nursing home residents who pace. Gerontologist 1998, 38, 199–208. [Google Scholar] [CrossRef] [PubMed]
- Chaudhury, H.; Hung, L.; Badger, M. The role of physical environment in supporting person-centered dining in long-term care: A review of the literature. Am. J. Alzheimer’s Dis. Other Dement. 2013, 28, 491–500. [Google Scholar] [CrossRef] [PubMed]
- Grant, L.A.; Kane, R.A.; Stark, A.J. Beyond labels: Nursing home care for Alzheimer’s disease in and out of special care units. J. Am. Geriatr. Soc. 1995, 43, 569–576. [Google Scholar] [CrossRef]
- Barnes, S. Space, choice and control, and quality of life in care settings for older people. Environ. Behav. 2006, 38, 589–604. [Google Scholar] [CrossRef]
- Cohen-Mansfield, J.; Werner, P. Environmental influences on agitation: An integrative summary of an observational study. Am. J. Alzheimer’s Care Relat. Disord. Res. 1995, 10, 32–39. [Google Scholar] [CrossRef]
- Zeisel, J.; Silverstein, N.M.; Hyde, J.; Levkoff, S.; Lawton, M.P.; Holmes, W. Environmental correlates to behavioral health outcomes in Alzheimer’s special care units. Gerontologist 2003, 43, 697–711. [Google Scholar] [CrossRef] [Green Version]
- Kleinberg, J.; Tardos, E. Algorithm Design; Pearson Education India: Bengaluru, India, 2006. [Google Scholar]
- Mitchell, M. An Introduction to Genetic Algorithms; MIT press: Cambridge, MA, USA, 1998. [Google Scholar]
- Miles, J.C.; Sisk, G.M.; Moore, C.J. The conceptual design of commercial buildings using a genetic algorithm. Comput. Struct. 2001, 79, 1583–1592. [Google Scholar] [CrossRef]
- Caldas, L.G.; Norford, L.K. A design optimization tool based on a genetic algorithm. Autom. Constr. 2002, 11, 173–184. [Google Scholar] [CrossRef]
- Liu, D.K.; Yang, Y.L.; Li, Q.S. Optimum positioning of actuators in tall buildings using genetic algorithm. Comput. Struct. 2003, 81, 2823–2827. [Google Scholar] [CrossRef]
- Ouarghi, R.; Krarti, M. Building Shape Optimization Using Neural Network and Genetic Algorithm Approach. Ashrae Trans. 2006, 112, 484–491. [Google Scholar]
- Tuhus-Dubrow, D.; Krarti, M. Genetic-algorithm based approach to optimize building envelope design for residential buildings. Build. Environ. 2010, 45, 1574–1581. [Google Scholar] [CrossRef]
- Wang, W.; Zmeureanu, R.; Rivard, H. Applying multi-objective genetic algorithms in green building design optimization. Build. Environ. 2005, 40, 1512–1525. [Google Scholar] [CrossRef]
- Stanley, K.O.; Miikkulainen, R. Evolving neural networks through augmenting topologies. Evol. Comput. 2002, 10, 99–127. [Google Scholar] [CrossRef]
- Simon, J. Evolving Floorplans. Available online: https://www.joelsimon.net/evo_floorplans.html (accessed on 2 March 2020).
- Reynolds, C.W. Flocks, herds and schools: A distributed behavioral model. In Proceedings of the 14th Annual Conference on Computer Graphics and Interactive Techniques, Anaheim, CA, USA, 27–31 July 1987; pp. 25–34. [Google Scholar] [CrossRef] [Green Version]
- Du, T.; Jansen, S.; Turrin, M.; van den Dobbelsteen, A. Effects of architectural space layouts on energy performance: A review. Sustainability 2020, 12, 1829. [Google Scholar] [CrossRef] [Green Version]
- Wrublowsky, R. Design Guide for Long Term Care Homes. 2018. Available online: https://www.fgiguidelines.org/wp-content/uploads/2018/03/MMP_DesignGuideLongTermCareHomes_2018.01.pdf (accessed on 2 March 2020).
Figure 1.
The overall process of a genetic algorithm: At any given iteration (1) the generated solutions are evaluated through a fitness function, (2) the best ones are selected as new breeders and the worst removed, then (3) the best solutions are randomly mutated to generate new candidate functions that (4) are inserted into a new generation.

Figure 2.
The three steps (a–c), and (d) of the process mapping a graph into a floor plan design. Source: Simon 2018.
Figure 2.
The three steps (a–c), and (d) of the process mapping a graph into a floor plan design. Source: Simon 2018.

Figure 3.
An overview of the hallway generation strategy based on Ant-Colony Optimisation. Source: Simon 2018. The figure illustrates the process of hallway generation in a generic configuration of 3 cells (a), where nodes and connections are generated inside each cell (b), the ACO method is used to find optmised connections among cells (c), and their optimisation (d).

Figure 4.
The final floor plan with the generated hallways: (a) shows the application of the hallway finding method to an entire floor plan, and final geometry (b). Source: Simon 2018.
Figure 4.
The final floor plan with the generated hallways: (a) shows the application of the hallway finding method to an entire floor plan, and final geometry (b). Source: Simon 2018.

Figure 5.
The final floor plan with the optimised spatial configuration.

Figure 6.
Fitness function diagram.

Figure 7.
Two dimensional model of the new care home in Rhinoceros.

Figure 8.
Viewing cones of agents in the simulation. Initial settings.

Figure 9.
Viewing cones of agents in the simulation. Agents 5, 6, 7 and 8 are indicated with circled areas with respective viewing cones.
Figure 9.
Viewing cones of agents in the simulation. Agents 5, 6, 7 and 8 are indicated with circled areas with respective viewing cones.

Figure 10.
Viewing cones of agents in the simulation. Agents gathering to the kitchen.

Figure 11.
Viewing cones of agents in the simulation. Trails of agents gathering to the kitchen.

Figure 12.
Simulation run in the original building configuration (the Irene Baron Eden Centre, Winnipeg, Manitoba, MMP Architects 2009, reproduced courtesy of R. Wrublowsky 2018).
Figure 12.
Simulation run in the original building configuration (the Irene Baron Eden Centre, Winnipeg, Manitoba, MMP Architects 2009, reproduced courtesy of R. Wrublowsky 2018).

Figure 13.
Comparison between the trails in the original building (left) and the optimised one (right).
Figure 13.
Comparison between the trails in the original building (left) and the optimised one (right).


Table 1.
Objectives for the optimisation of the care home. Activity spaces for the purposes of this document refer to resident accessible areas such as kitchens, dining room, lounges, laundry rooms, hobby areas, seating areas.
Table 1.
Objectives for the optimisation of the care home. Activity spaces for the purposes of this document refer to resident accessible areas such as kitchens, dining room, lounges, laundry rooms, hobby areas, seating areas.
| Criterion | Rationale | Notes | |
|---|---|---|---|
| 1 | Facility is subdivided into units of less than 13 residents’ private bedrooms | Reduces agitation, promotes wellbeing. | The facility may have multiples of these units, and the facility may be multi-storey. |
| 2 | Each unit has a functional kitchen accessible to residents. | Promotes choice and wellbeing through participation in the activities of daily living. | There can be a larger institutional kitchen off the unit where most of the meals are prepared, so long as a small functional kitchen is available for residents. |
| 3 | Each unit has a dining room not used for other activities. | Promotes good nutrition by cueing specifically for eating. | Min. 17 sq. ft/1.6 sq. m/resident. |
| 4 | Each unit has multiple lounges/activity spaces with varying sizes. | Room sizes control the size of social group, different room sizes afford a choice of the level of social and sensory stimulation and choices of activity. | Variety of spaces is better. A minimum of 1 space for a smaller group and a larger lounge. More is better. Even a small alcove for 2 along a corridor could be valuable. |
Table 2.
Comparison between the trails in the original and the optimised building: Curve numbers and total length. Simulation set (one agent every 5 s).
Table 2.
Comparison between the trails in the original and the optimised building: Curve numbers and total length. Simulation set (one agent every 5 s).
| Original Floor Plan | Optimised Floor Plan | |
|---|---|---|
| Number of curves | 88,255 curves | 99,528 curves |
| Total length | 6,464,782.42 m | 3,716,879.20 m |
Table 3.
Comparison between the trails in the original and the optimised building: Realistic set.
| Original Floor Plan | Optimised Floor Plan | |
|---|---|---|
| Number of curves | 490.3 curves | 552.93 curves |
| Total length | 35,915.45 m | 20,649.32 m |
| Trail length per agent (average) | 73.25 m | 37.34 m |
© 2020 by the authors. Licensee MDPI, Basel, Switzerland. This article is an open access article distributed under the terms and conditions of the Creative Commons Attribution (CC BY) license (http://creativecommons.org/licenses/by/4.0/).
Share and Cite
MDPI and ACS Style
Carta, S.; St. Loe, S.; Turchi, T.; Simon, J. Self-Organising Floor Plans in Care Homes. Sustainability 2020, 12, 4393. https://0-doi-org.brum.beds.ac.uk/10.3390/su12114393
AMA Style
Carta S, St. Loe S, Turchi T, Simon J. Self-Organising Floor Plans in Care Homes. Sustainability. 2020; 12(11):4393. https://0-doi-org.brum.beds.ac.uk/10.3390/su12114393
Chicago/Turabian StyleCarta, Silvio, Stephanie St. Loe, Tommaso Turchi, and Joel Simon. 2020. "Self-Organising Floor Plans in Care Homes" Sustainability 12, no. 11: 4393. https://0-doi-org.brum.beds.ac.uk/10.3390/su12114393
Note that from the first issue of 2016, this journal uses article numbers instead of page numbers. See further details here.