Article

Ammonia Volatilization Reduced by Combined Application of Biogas Slurry and Chemical Fertilizer in Maize–Wheat Rotation System in North China Plain

1
Institute of Environment and Sustainable Development in Agriculture, Chinese Academy of Agricultural Sciences, Beijing 100081, China
2
College of Water Resources and Civil Engineering, China Agricultural University, Beijing 100081, China
*
Author to whom correspondence should be addressed.
The authors contributed equally to this work.
Sustainability 2020, 12(11), 4400; https://0-doi-org.brum.beds.ac.uk/10.3390/su12114400
Submission received: 27 April 2020 / Revised: 19 May 2020 / Accepted: 22 May 2020 / Published: 27 May 2020
(This article belongs to the Section Environmental Sustainability and Applications)

Abstract

:
Digestate and biogas slurry (BS) are the byproduct of biogas engineering that could be used for elevating plant growth. However, the consequent emissions of ammonia from BS are considered a severe threat to the atmosphere. Herein, we conducted two consecutive field experiments with wheat–maize rotations to find out the optimum ratio of BS to combine with chemical fertilizer (CF) to reduce ammonia volatilization (AV) while keeping the stable crop yield. In maize season, 226.5 kg N/ha of CF was applied. In wheat season, 226.5 kg N/ha was applied at different ratios (100%, 80%, and 50%) between BS and CF. Our results found that the maximum yield of 6250 kg/ha was produced by CF, and this yield could be obtained through a combined application of 38% BS mixed with CF. Highest AV produced of 16.08 kg/ha by CF. BS treatments significantly reduced the emission from 18% to 32% in comparison to CF. The combined application of BS-CF produced the highest yield due to essential nutrients coming from both BS-CF. Subsequently, it reduced the AV depending on fertilizer type and fertilizer rate. An optimal ratio of 38% BS was recommended to produce the highest yield and lowest ammonia emissions. The application of BS together with different ratios of CF could be an alternative agricultural strategy to obtain desired crop yield and reduce AV in North China Plain (NCP).

1. Introduction

China is one of the major agricultural countries and provides nearly one-fifth of calories to humans worldwide [1]. There is high application of chemical nitrogen (N) fertilizer in the agricultural field to achieve high crop yield. The two main agricultural production systems in China are winter wheat and summer maize, that are grown annually. NCP is a hotspot of N input and N loss in China [2]. CF inputs have kept on increasing and have been far higher than crop demand in the NCP [3,4]. Data show that the Nitrogen Use Efficiency (NUE) of NCP is less than 39.6%, which means more than 60–70% of CF applied is often misused [4]. Excessive use of CF has caused severe environmental degradation [5]. Large amounts of N fertilizer are lost to the environment through N runoff, leaching, denitrification, and AV. AV is the major pathway of N loss [6]. In China, about 30% of N loss occurs via NH3 emission [7]. Ammonia is the main component of soluble alkaline gas in the atmosphere and has a significant effect on local air quality [5,8,9,10,11,12,13,14]. It can travel long distances before being converted into fine particles [15]. The deposition of ammonia causes severe environmental impacts on terrestrial and aquatic systems through eutrophication, reduced soil pH, and nutrient imbalances [16]. Consequently, ammonia deposition negatively affects living organisms [12,17,18,19,20]. Therefore, mitigation of NH3 emission from the cropland system is urgent for environmental protection. Taking food security and environmental friendliness into account, many studies have shown that the combination of organic fertilizers and CFs could concurrently improve soil productivity as well as yield. Livestock number in China has been increased dramatically in the last two decades. As a result, the amount of manure produced by livestock has increased significantly. Recent studies have shown that approximately 3600 Mt of fresh weight manure is produced annually [21]. From a significant amount of manure, about 80% is applied to the field, and the rest of 20% is left unmanaged [22]. The large amounts of manure waste released by the livestock farms can have a negative effect on the environment, unless properly unmanaged. Anaerobic digestion of manures for produce biogas digestate is of great use for livestock manure management [23]. BS is the by-product of biogas digestate and considered a good source of macro and micronutrients [24]. BS can be used to substitute the chemical fertilizer because of the high amount of nutrients concentration, including N, P, K, Zn, Mn, and B [25,26,27,28,29]. In general, the application of only CFs could decline soil fertility and enhance NH3 emissions. The use of digestate slurry from anaerobic digestion as fertilizer in crop production is an important strategy for minimizing NH3 emissions. However, sole application of organic fertilizer could only reduce NH3 emission, but the desired crop yield cannot be achieved [30]. Some studies showed that crop productivity could be significantly increased if slurry is applied together with CF [31,32]. For this reason, the optimum ratio of BS and CF should be developed to simultaneously reduce the loss of N through AV, and improve the crop yield of summer maize and winter wheat rotation system. However, the transportation of digestate slurry on fields is an uneconomical option for farmers. Furthermore, the oversupply of digestate in areas with intensive biogas plants is a major environmental concern. It has been demonstrated that over application of digestate can be avoided under controlled conditions, and it is an environmentally promising option still now, in spite of being an expensive option for farmers [33].
Therefore, this study aims to investigate the effects of BS treatments on the maize–wheat rotation crops and find out how to substitute the CF with a mix of CF and BS. The experiment was conducted in the field and the ammonia volatilization from different application ratios of BS and CF was evaluated. Furthermore, this study investigated how the AV kept minimum emissions, whether it is environmentally friendly or not. Hence, the following hypotheses were evaluated in this experiment (1) BS cannot increase crop yield constantly (2) BS can partially substitute CF and could simultaneously reduce the AV and improve crop yield.

2. Materials and Methods

2.1. Experimental Design

The experiment was carried out from June 2018 to June 2019 at Zhongyu Ecological Industrial Park, Binzhou City, Shandong Province (37°22′ N, 118°01′ E). The climate of the area is a temperate continental monsoon with an average temperature of 12.7 °C, the average sunshine hours are 2632 h, and the annual average precipitation is 564.8 mm. The soil type is saline-alkaline soil. The basic physical and chemical properties of the soil before the test in 2018 are shown below (Table 1).
In NCP, the essential agricultural production system is winter wheat-summer maize rotation. These two crops, winter wheat and summer maize, are simultaneously growing in one year. Before sowing, we cleaned all the crop residuals and prepared the land by harrowing. A total of four treatments (Table 2) were set up for the test, along with three replicates per treatment. A total of 12 cells, each cell area was 14 m × 10 m = 140 m2. The crop planting method in the test area was summer maize-winter wheat rotation. Summer maize was planted on 22 June 2018 and harvested in week of October 2018. With every treatment, the total nitrogen application rate in the maize season included 226.5 kg N ha−1 which was split into two parts, one at the time of sowing as basal fertilizer at 174 kg N ha−1 where 69 kg N was from urea and 105 kg N from Diammonium Phosphate (DAP). The other application was conducted at the jointing stage named tillering, at 52.5 kg ha−1. The total phosphorus application rate in the maize season was 322.5 kg P2O5 ha−1 as basal fertilizer. The water input in the maize season depended on natural rainfall. Winter wheat was planted on 9 October 2018 and harvested on 3 June 2019. With every treatment, the total nitrogen application rate in the winter wheat season was 226.5 kg ha−1, which was split into two parts. The first one at the sowing time was 68 kg ha−1, or one-third of the total, used as basal fertilizer, and the rest 158 kg ha−1 included both BS and CF. The application amount is shown in Table 2. The BS (digestion substrate: Pig manure) was provided by Zhongyu Ecological Industrial Park near the field. The physical and chemical properties of BS are mentioned in Table 3.
Water was irrigated in the greening period (28 November) and springtime (1 March). BS was irrigated at the second time. BS mixed with water to prepare different ratios was irrigated, which is mentioned in Table 2. Sufficient water was irrigated during that time. Slurry and water irrigation rate was 2500 m3/ha. The total phosphorus application rate in the wheat season was 322.5 kg P2O5 ha−1 and was used as basal fertilizer. The remaining management measures, such as weeding and pest control, are consistent with local farmland management methods.

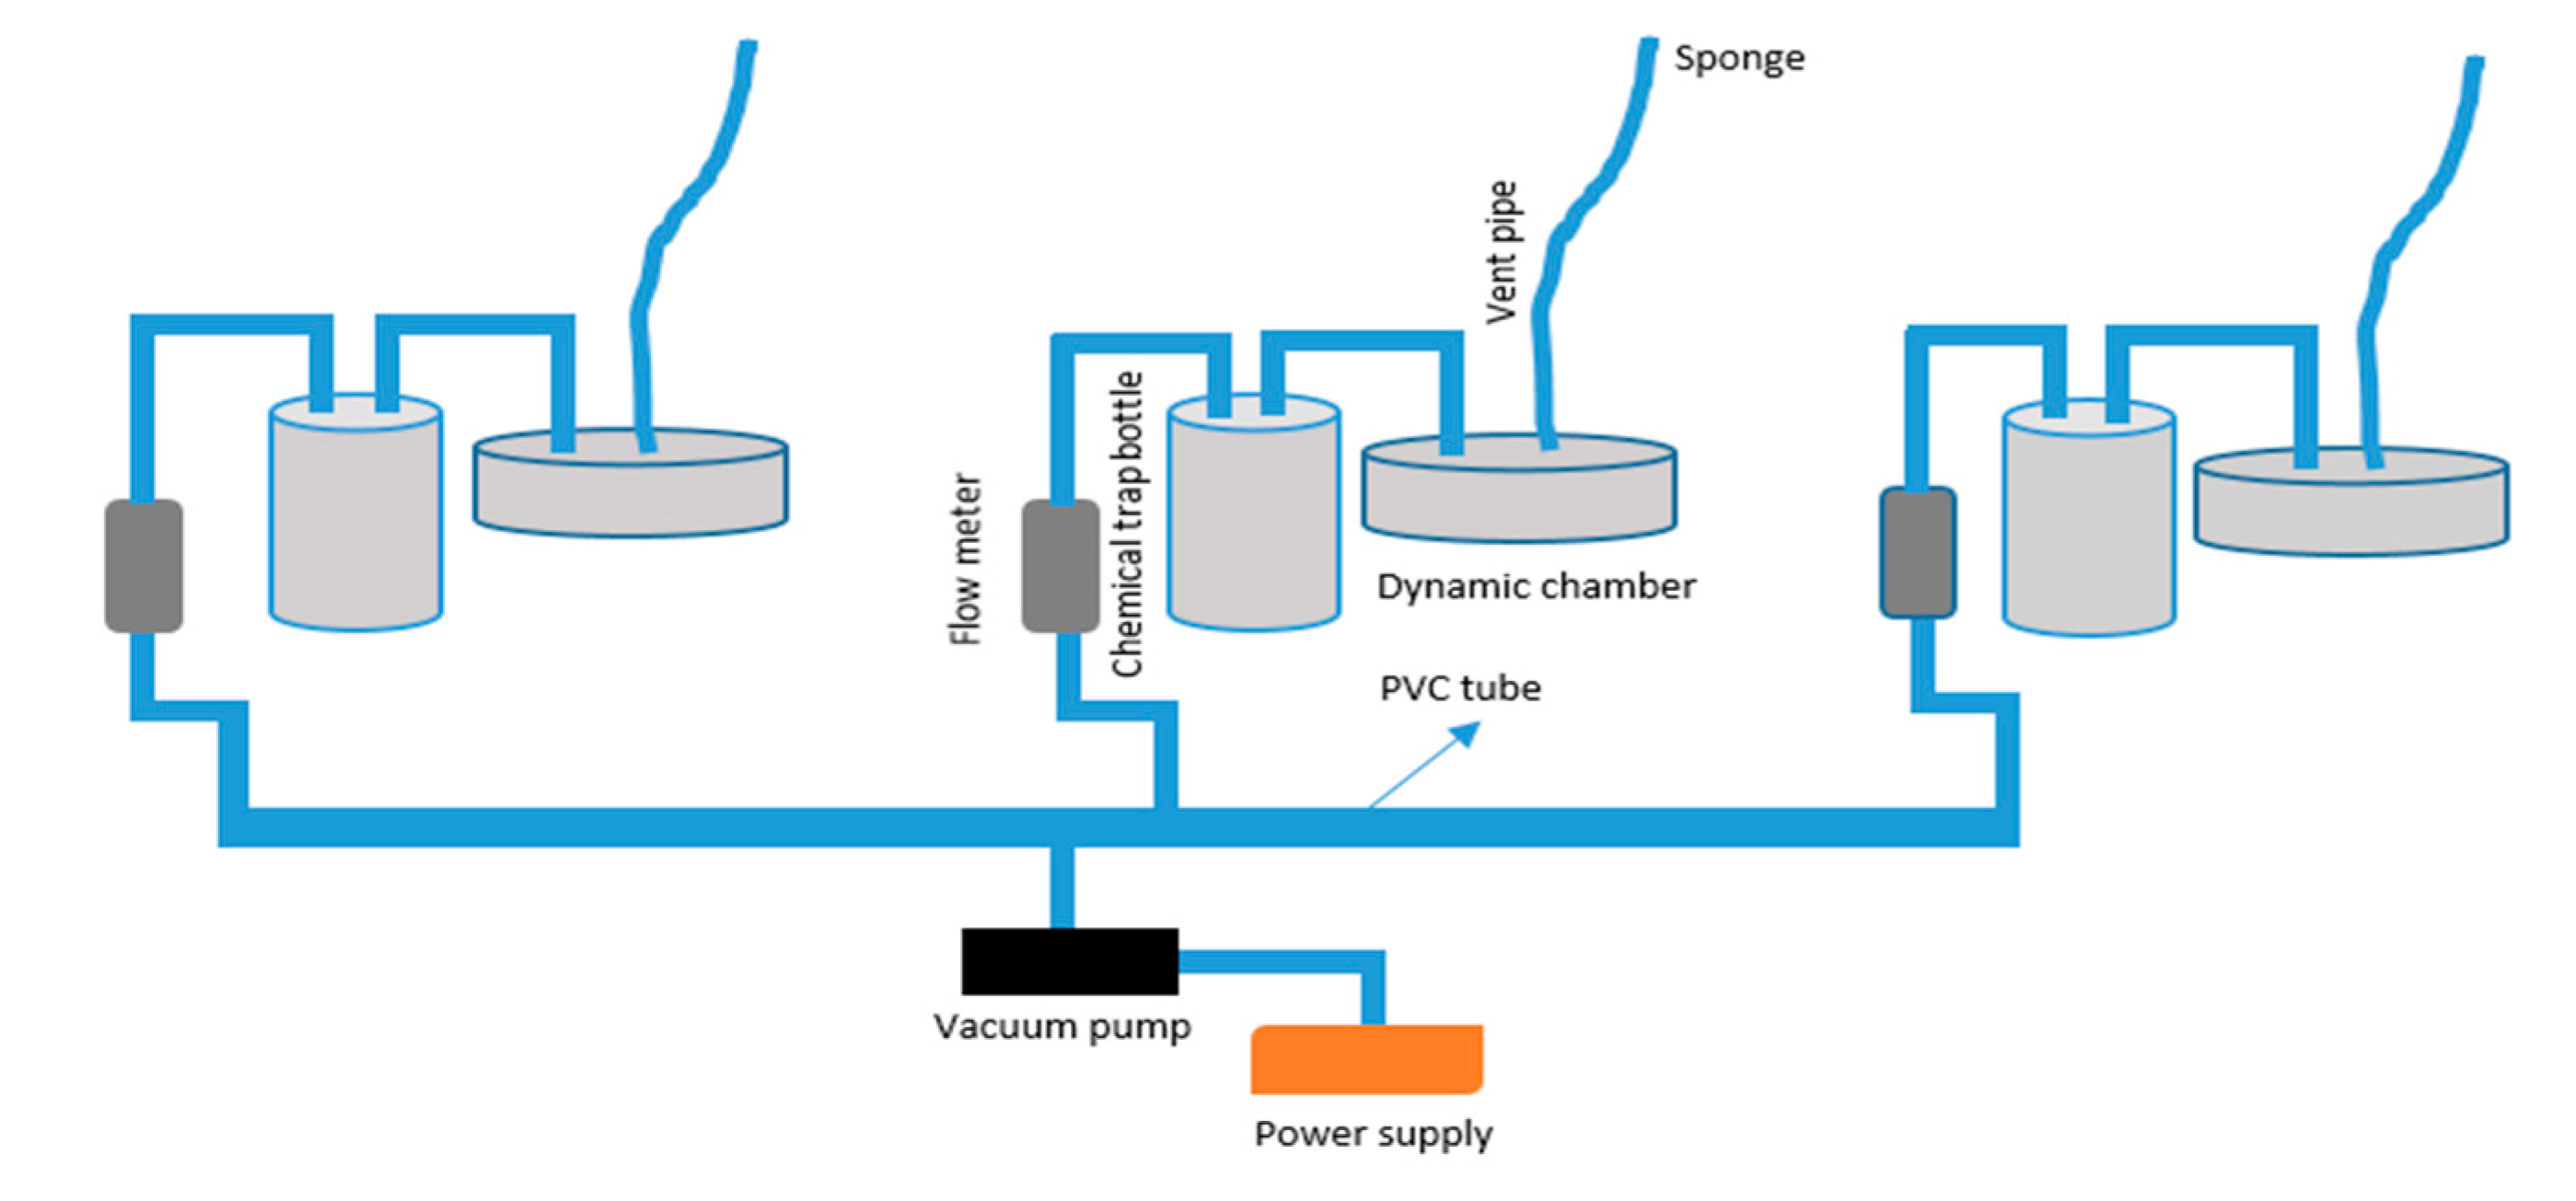
2.2. Measurement of AV

The dynamic chamber was applied to measure NH3 fluxes from summer maize and winter wheat field. The device consisted of a dynamic chamber, a vacuum pump, and an acid trap to collect NH3 gas. A vent pipe was connected to the chemical trap bottle and another part connected to the plastic to form a confined space (Figure 1). The cylindrical dynamic chamber was made of poly-methyl methacrylate with an inner diameter of 20 cm and a height of 5 cm. The vent pipe was held at a height of about 2.5 m above the ground surface. During the collecting time, a piece of sponge was put on the top of the vent pipe. Before putting sponge into the vent pipe, the sponge must be wetted by diluted sulfuric acid. Then the cover was placed on the base and the base was sealed with pure water to make it air tight. A chemical trap bottle filled with 60 mL of 0.01 M H2SO4 connected to one hole was used to collect NH3 gas from the top vent pipe and the other end was connected to the flowmeter. The air exchange rate through the chamber was set to 20 L min−1. The rubber plug of the flowmeter without the valve was inserted into one end of the PVC tube, and the other end of the PVC tube was connected to the vacuum pump. The airtightness of each latex tube connection, the metal head of the flowmeter, and the vacuum pump was thoroughly checked. The three pumps were properly connected to the power supply separately. The main switch was turned on and the flow rate of the flowmeter was adjusted to 20 L min−1. At the end of the hour, the pump switch was turned off. The acid absorption liquid bottle must be covered with red plug during transport to the field and back to the laboratory from the field. Immediately after the acid was returned to the laboratory, it was poured into a clean (purified water rinsed) plastic tube. The plastic tube must be numbered. The plastic bottles were stored at room temperature in the sampling order. NH3 volatilization was measured twice per day during the whole week after fertilization and one day every two weeks during other times. The NH3 volatilization rate was measured twice daily: Morning (9:00–11:00 a.m.) and afternoon (16:00–18:00 p.m.). The NH4+–N concentration in the acid trap was titrated with 0.01 mol L−1 standard diluted sulfuric acid solution [18,34]. The NH3 emission flux from maize–wheat fields was calculated according to the following equation:
VNi   = ( C 1 i   ×   V 1 i   +   C 2 i   ×   V 2 i ) × 14 × 001 π × R 2 × t × 12
where VNi represents the NH3 volatilization flux (Kg ha−1d−1) at day i, C1i and C2i are the concentration of H2SO4 (mol L−1) for the first and second time at day i, V1i and V2i are the consumption volume of H2SO4 (mL) for the first and second time at day i, t is the duration of each collection (h), and R is the cross-sectional area of the chamber (m).

2.3. Soil Samples and Plant Collection

During the collection of ammonia volatilization, the fresh soil samples were collected and stored frozen. The 50 g of surface soil samples were collected three times randomly near the ammonia volatilization sampling point in each plot. The water content of the collected fresh soil samples was measured, as well as the extracted NH4+–N. Fresh soil samples were sieved with a 2 mm sieve. After that, 10 g of the soil sample was put into a 100 mL plastic bottle. Then 50 mL of 0.01mol L−1 CaCl2 solution was added and shaken for 1 h. The extractable soil NH4+ was measured using an auto-analyzer 3(AA3) [35,36]. The rest of the soil samples were air-dried at room temperature to measure soil pH. The pH value of the soil was determined using distilled water suspensions. The soil to solution ratio was 1 to 2.5 (w:v). After shaking the suspensions for five minutes at 300 rpm on an orbital shaker, the samples were kept for 30 min at room temperature for sedimentation. The pH was then measured in the liquid supernatant [37]. During the harvesting of summer maize-winter wheat season, three separate areas (each 4 m2) were selected in the center of each plot and they were harvested to determine the fresh yield. After that, fresh yield was dried at natural sunlight and measured the actual yield of maize and wheat.

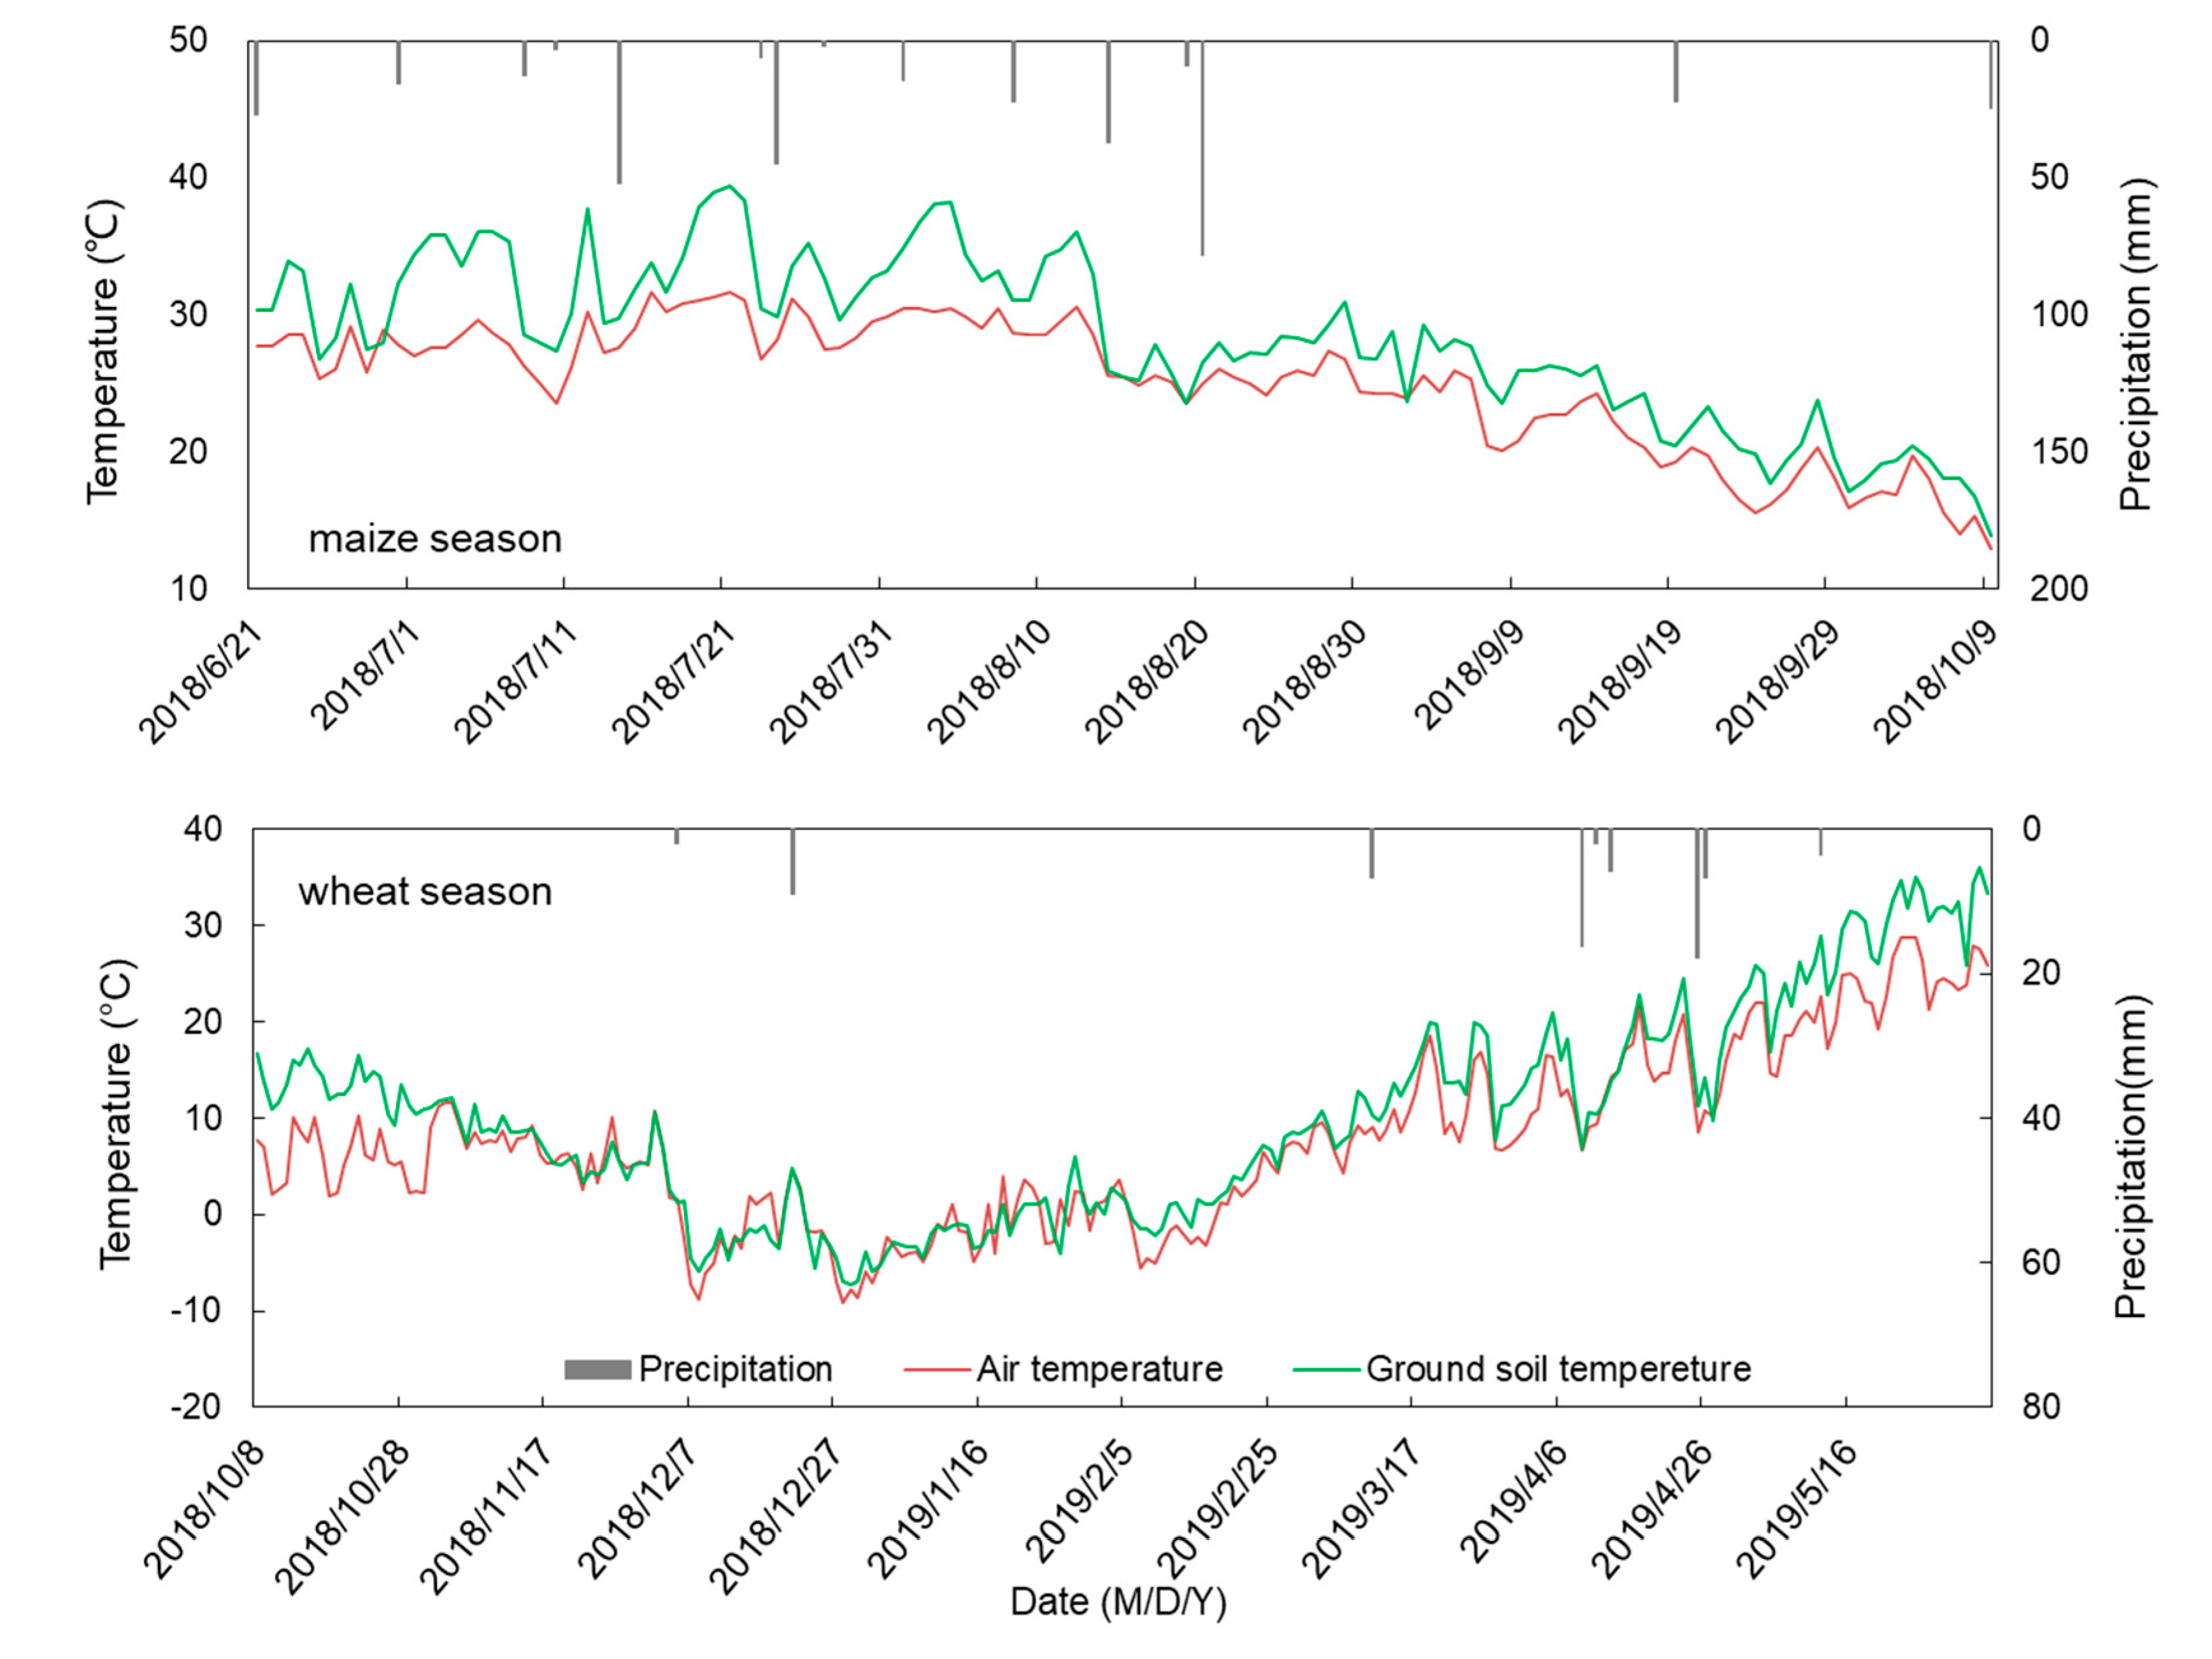
2.4. Environmental Indicator

A small weather station was set near the field to monitor the environmental indicators, such as air temperature, ground temperature, and wind speed. A rain gauge near our field was used to measure precipitation.

2.5. Statistical Analysis

Statistical analyses of the data were performed using the SPSS 22.0 analytical software package. A one-way ANOVA was carried out to test whether the differences in soil properties and NH3 gas fluxes among all the treatments were significant at the Turkey HSD test 0.05 probability level. Microsoft Excel Professional Plus 2016 was used for graphic design.

3. Results

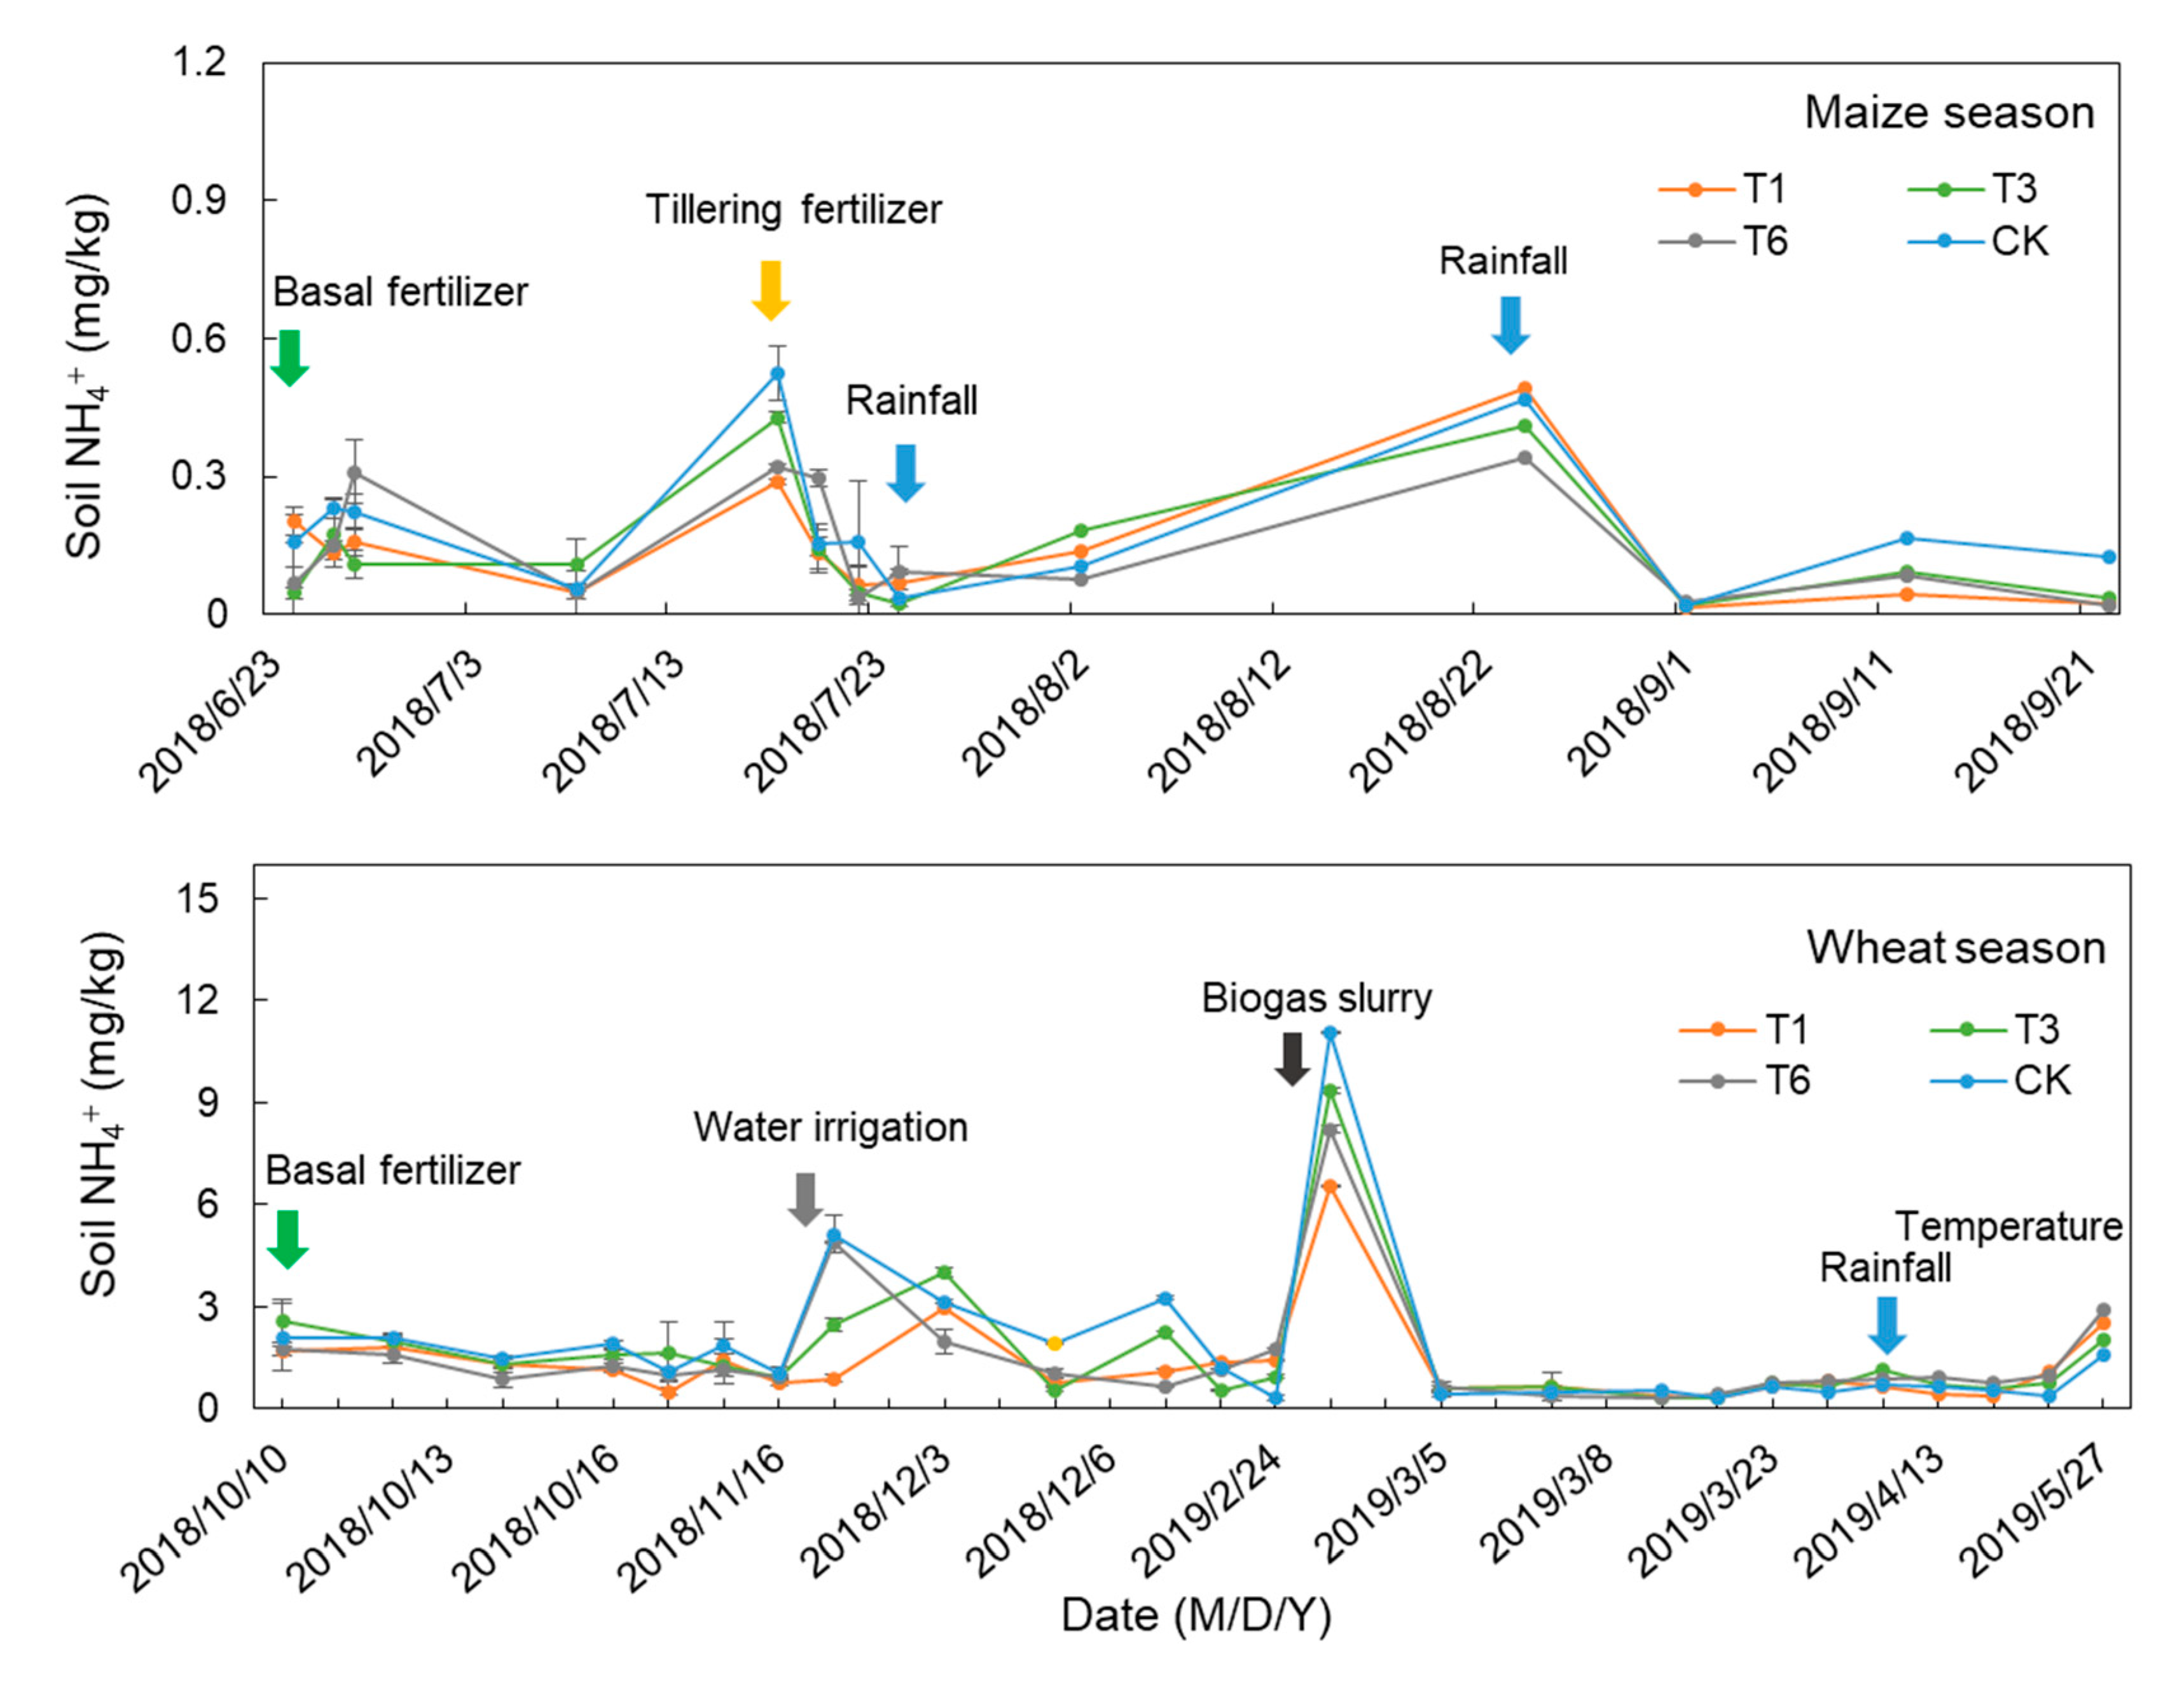
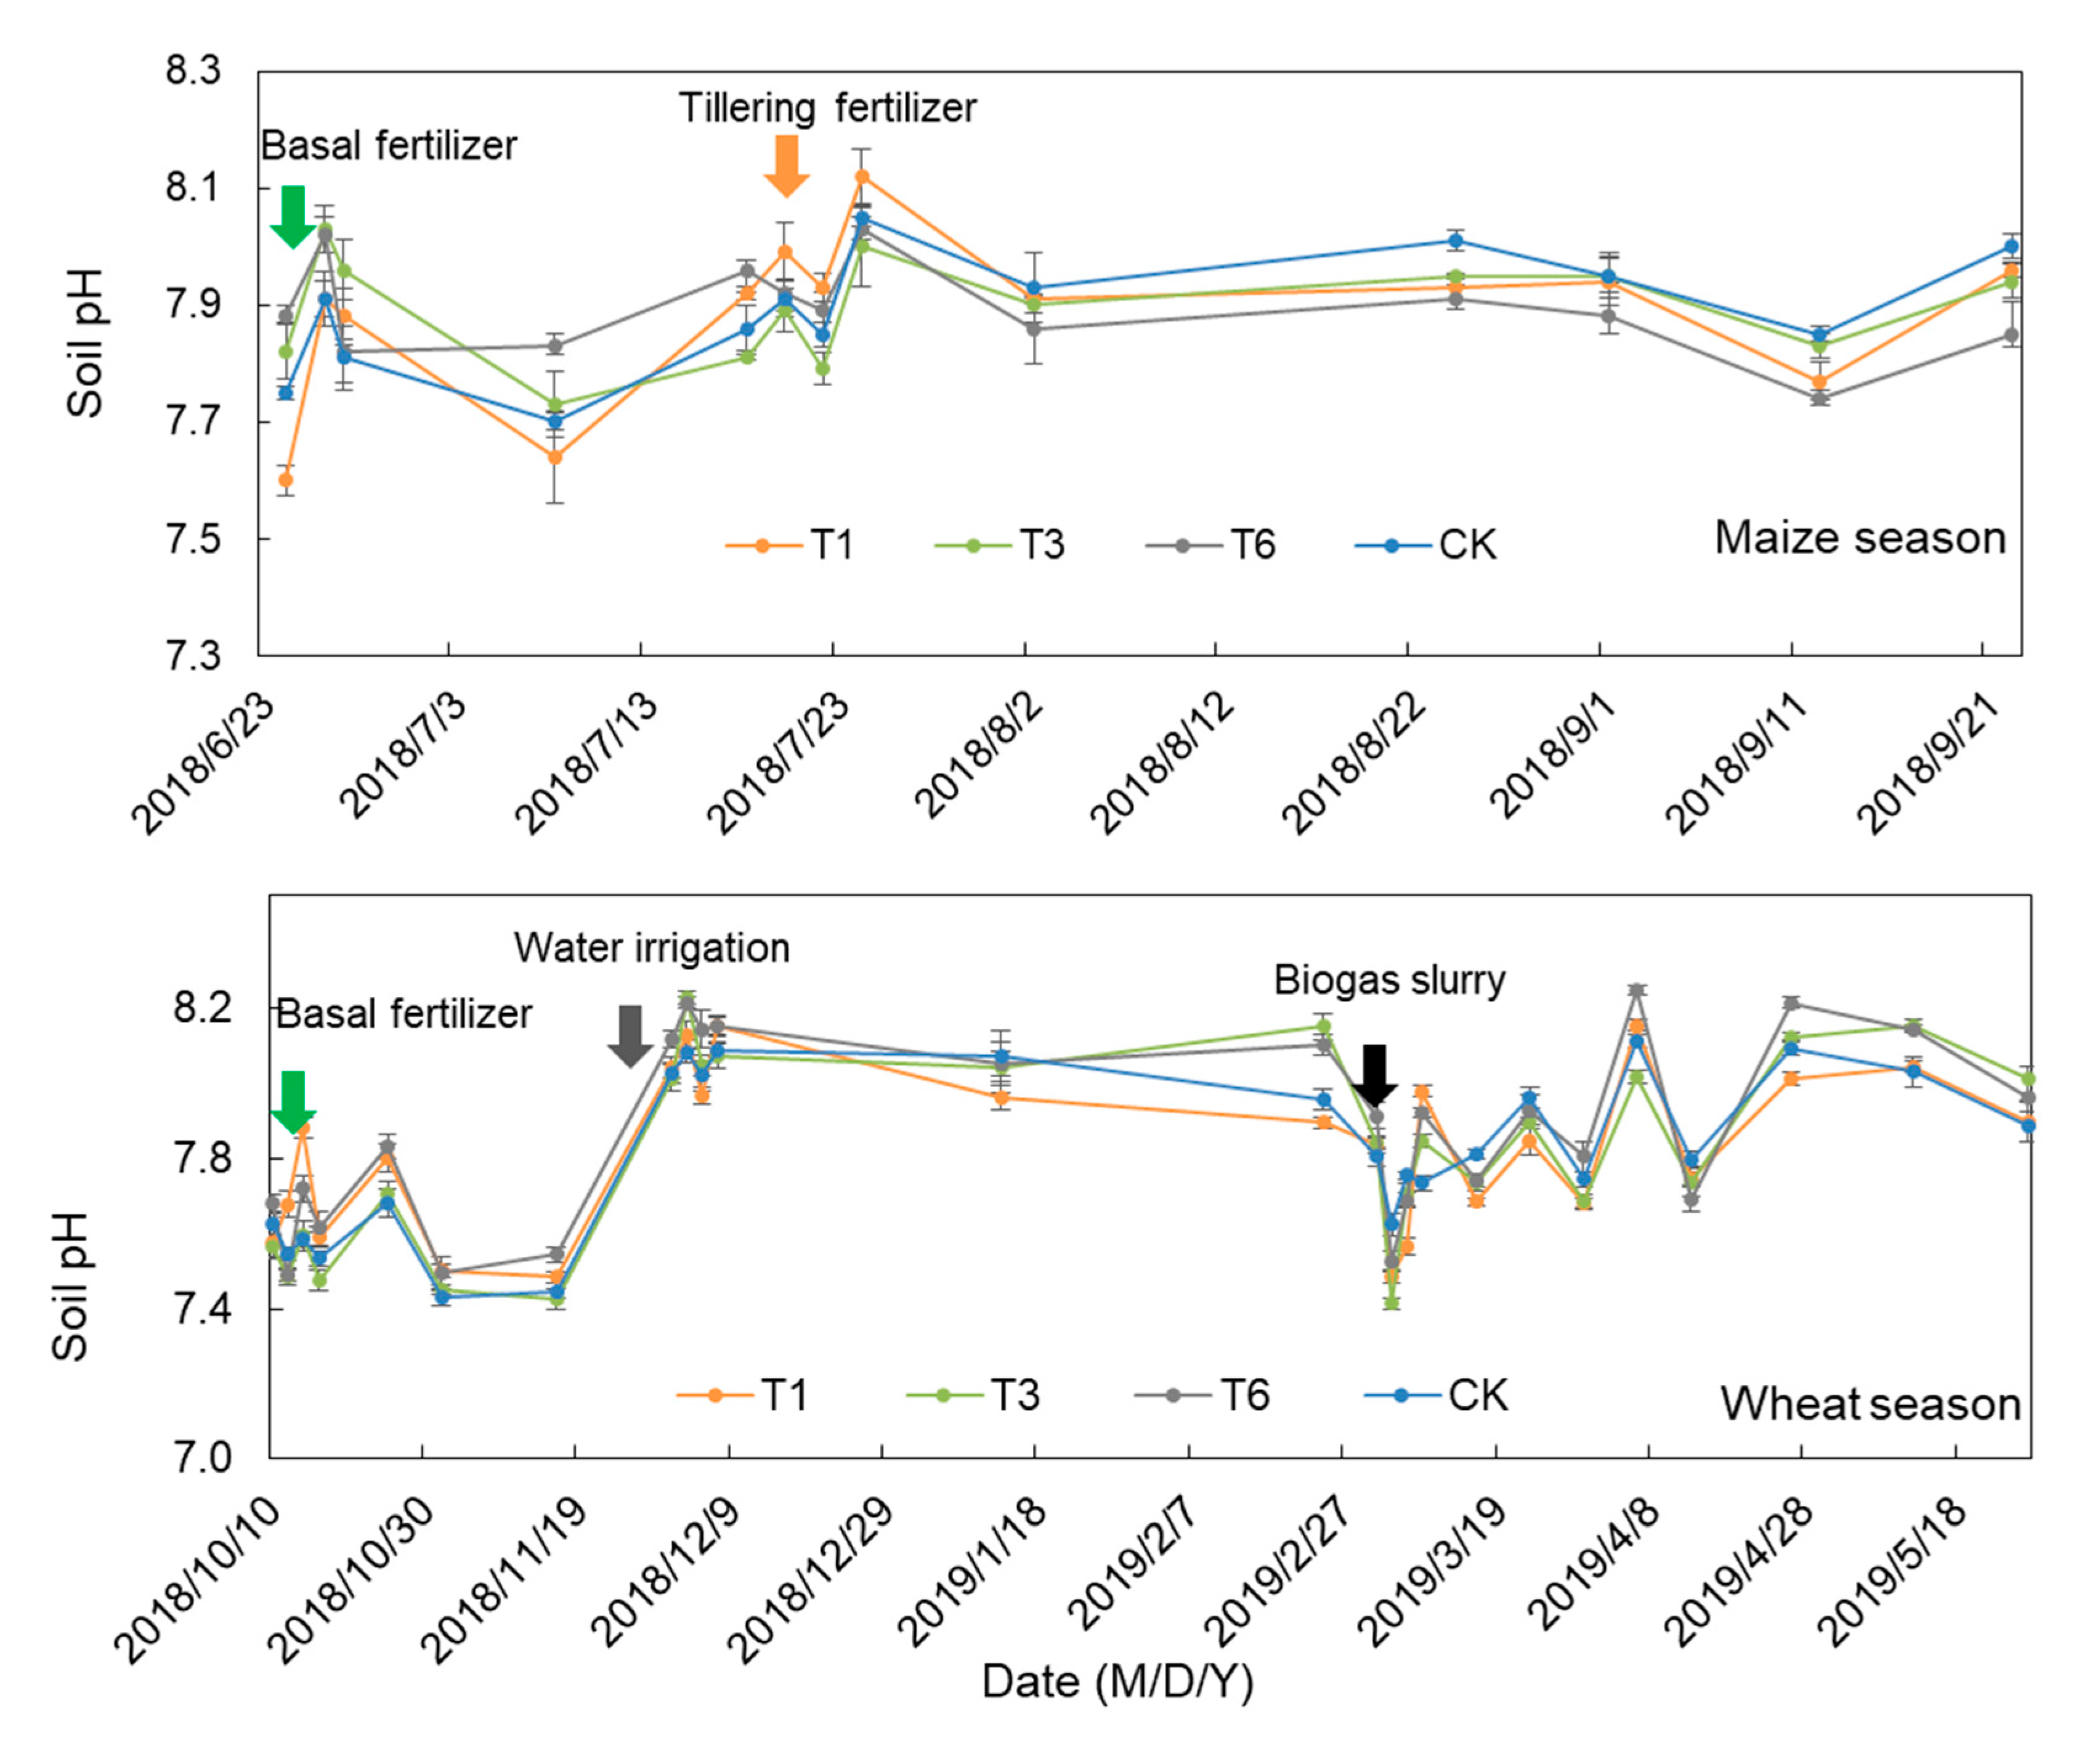
3.1. Environment Parameters

The precipitation was 373 mm in the maize season, and 75% of rainfall occurred between July and August in the maize season (Figure 2). The total amount of precipitation was very low (69 mm) in wheat season, of which 75% happened in April. The daily air temperature ranged from 12.9 °C to 31.6 °C and −9.1 °C to 28.7 °C with a mean of 25 °C and 7.4 °C in maize and wheat seasons, respectively (Figure 1). The trend of daily ground soil temperature was consistent with the air temperature. The daily ground soil temperature ranged from 13.9 °C to 39.4 °C with a mean 13.9 °C in maize season and −7.2 °C to 36 °C with a mean 10 °C in wheat season (Figure 2).
Temporal trends of soil NH4+–N concentration showed a similar pattern for all the N treatments. The soil NH4+–N concentration was significantly affected by N application, water irrigation and rainfall events, BS input, and air temperature in both maize and wheat season (Figure 3). A high peak value occurred on the second and fourth day after the basal and tillering fertilization application and it then sharply decreased. The maximum concentration, 1.66 mg/kg, appeared on second day after basal fertilizer in treatment CK and it was four times higher than the average concentration, in maize season. The maximum concentration, 3.87 mg/kg, appeared on first day after the basal fertilizer in treatment CK and it was 1.5 times higher than the average concentration, in wheat season. It is clear that CK produced the highest NH4+–N concentration compared to the other treatments. During the wheat season, among all treatments, CK produced the highest NH4+–N concentration after basal, water, and biogas slurry irrigation.
The pH value ranges between 7.60 to 8.12 in the maize season and 7.41 to 8.25 in the wheat season (Figure 4), but there was no significant difference among the treatments.

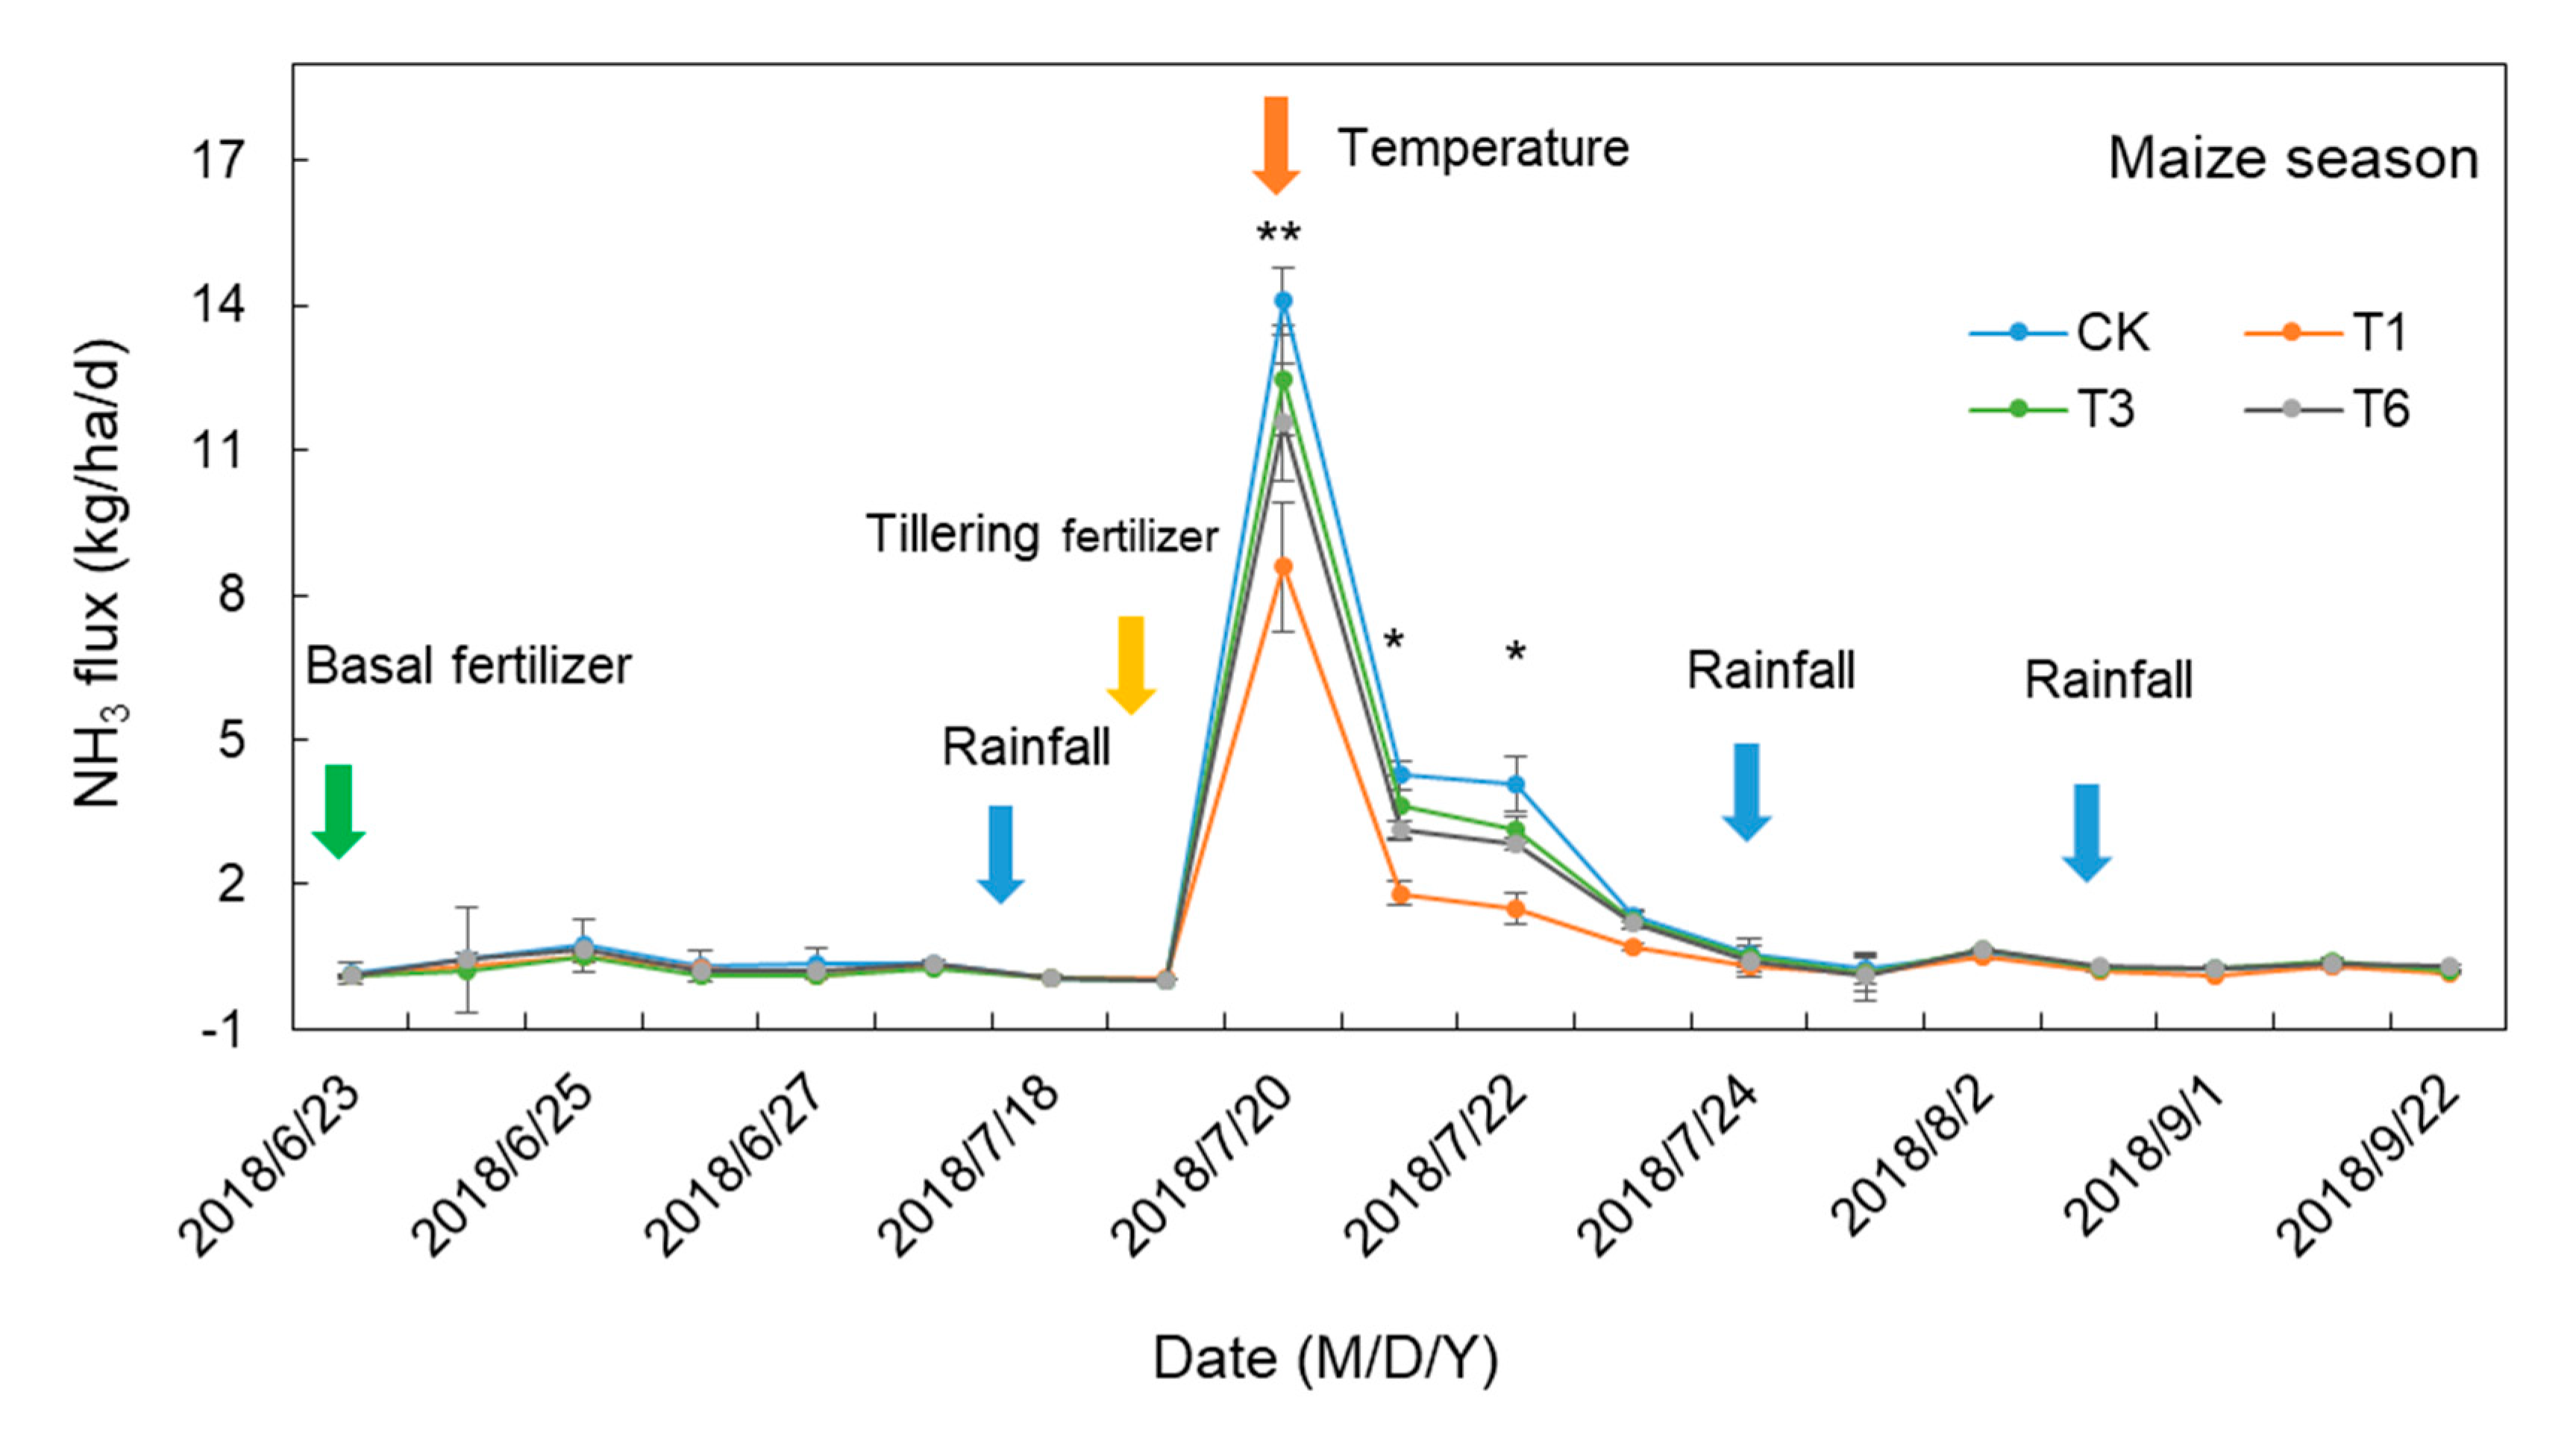
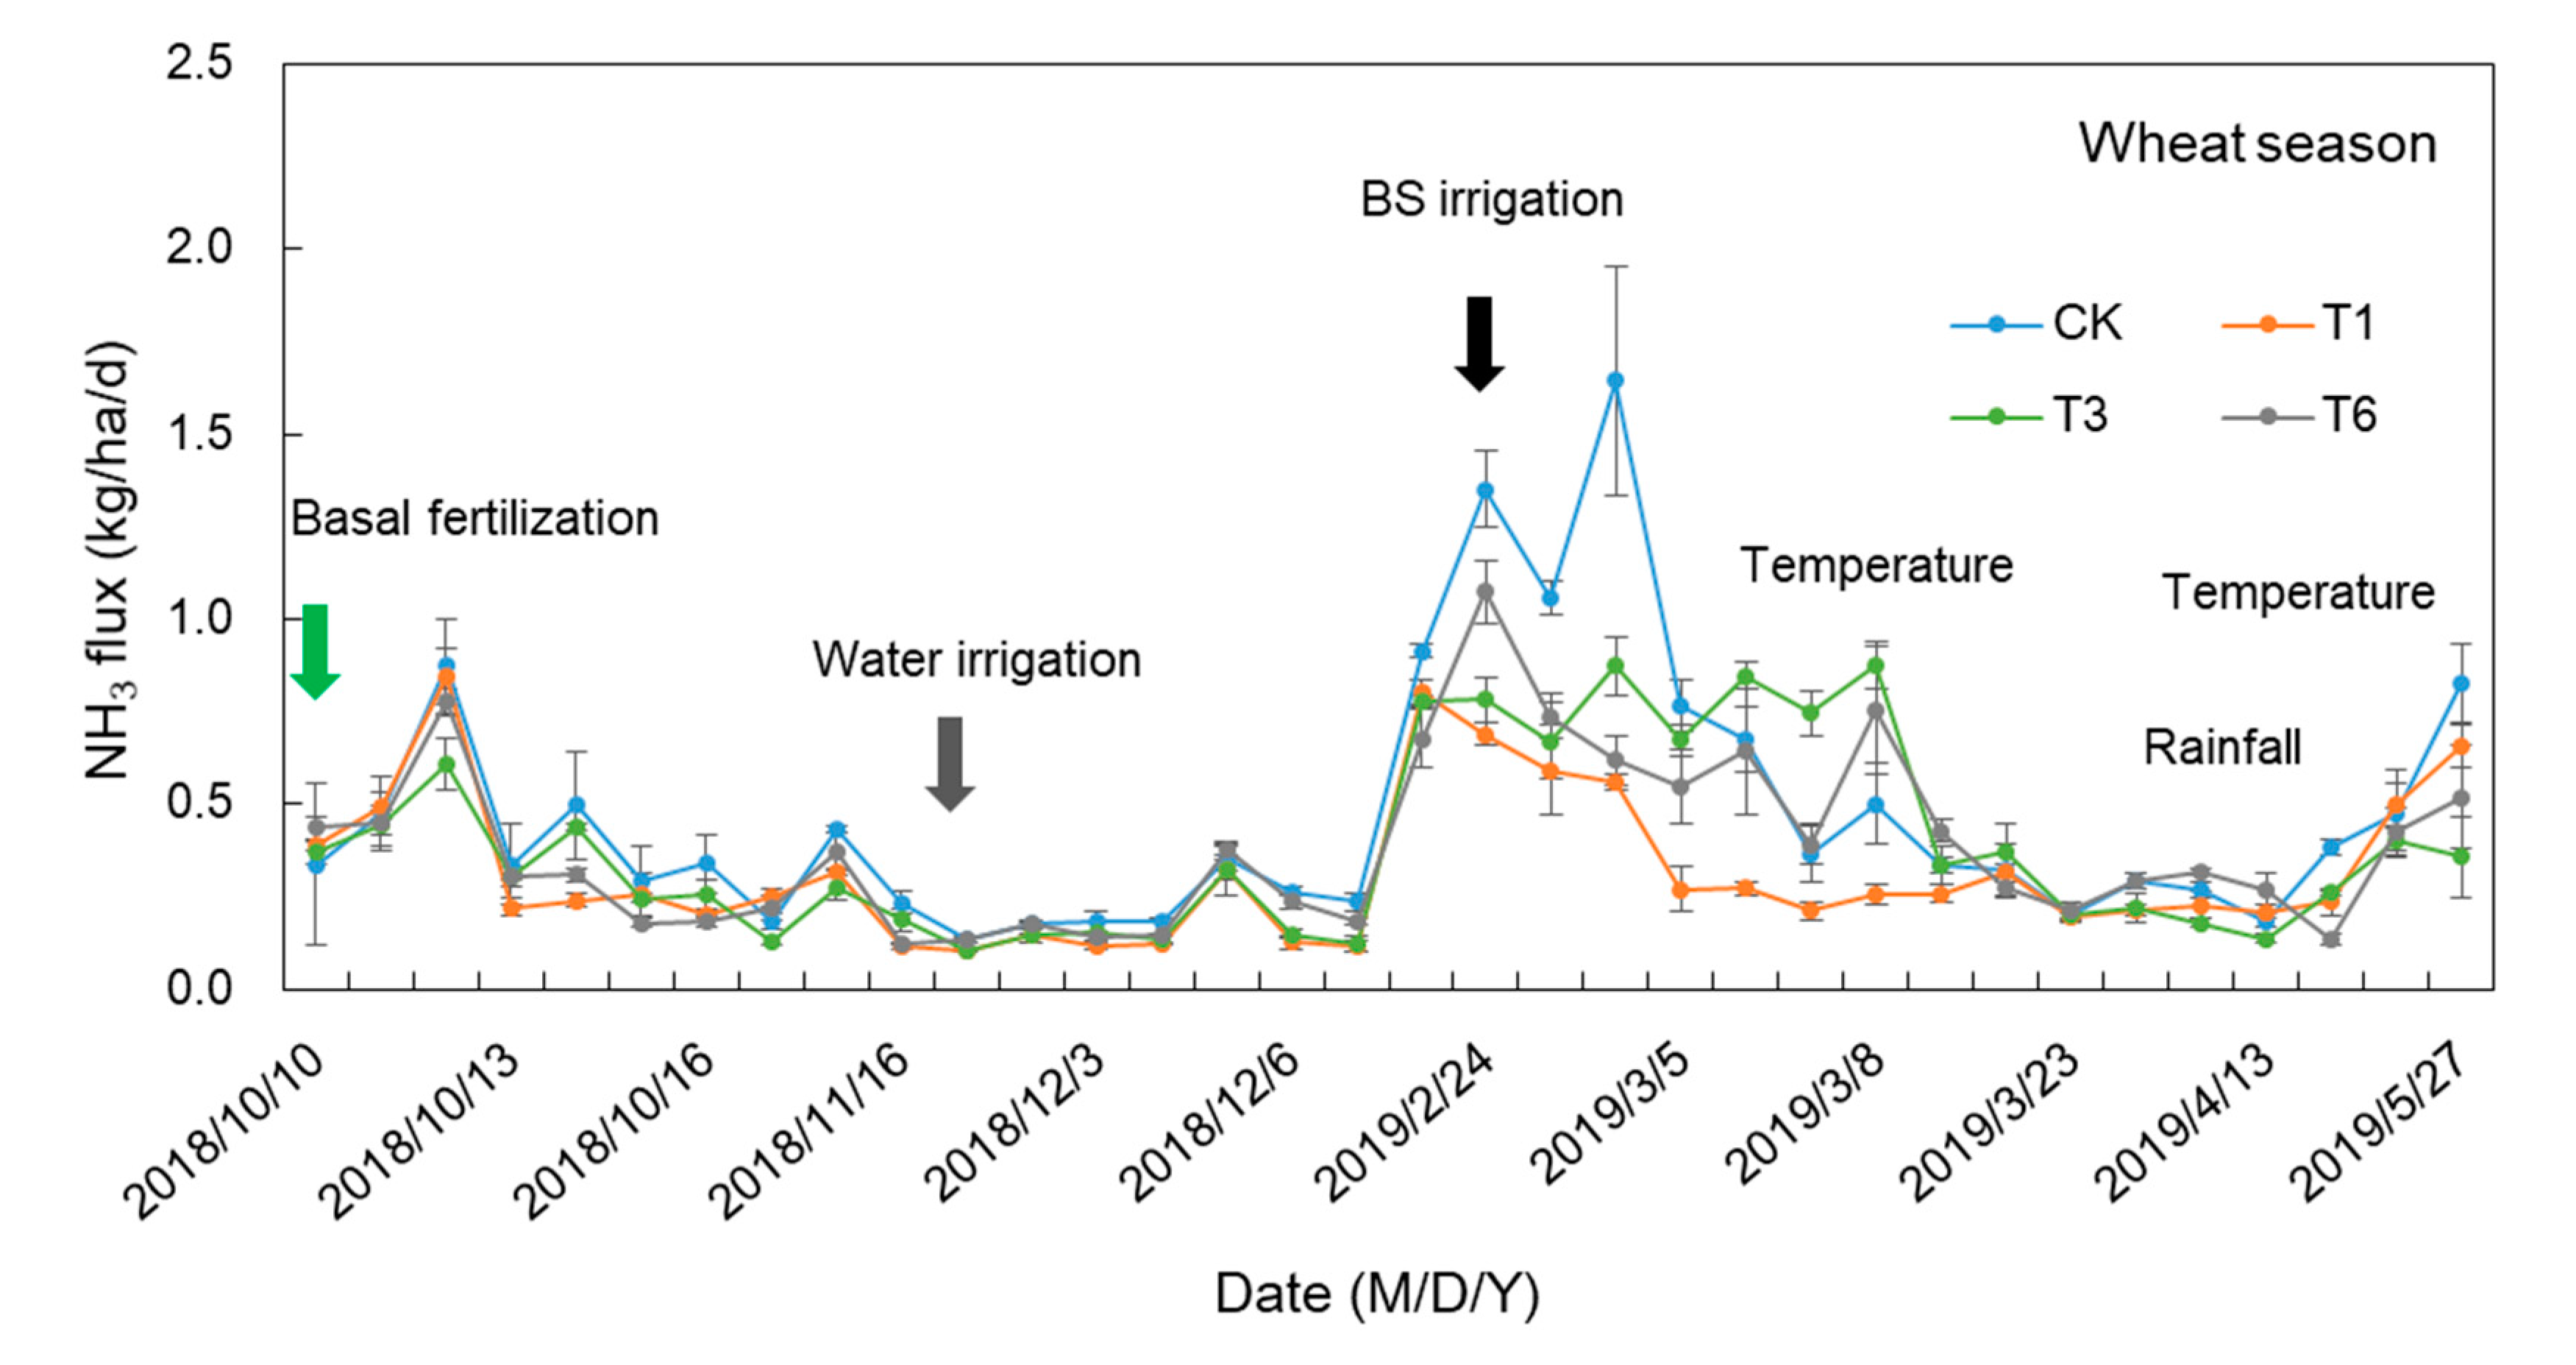
3.2. Flux of Ammonia Volatilization in Whole Season

During the maize season, all treatment showed a trend of increasing AV after fertilization followed by a trend of decrease (Figure 5). On the third day, all four treatments were in peak position and then decreased gradually to flat until the tillering fertilizer application. Although the highest accumulation appeared in CK treatment, there was no was significant difference among the treatments. Maximum emissions happened after tillering fertilizer but very little after basal fertilizer. After basal fertilization, the cumulative ammonia volatilization of about 2.40 ± 0.42, 1.70 ± 0.05, 1.09 ± 0.03, and 1.85 ± 0.05, (kg/ha/d) was found in CK, T1, T3, and T6 treatments, respectively, and the overall performance was CK > T6 > T1 > T3 (Table 4). The AV rate peaked on the second day, continued in the next four days after tillering fertilizer, and then, gradually decreased until 24 July. On the second day, the highest value in CK was 14.10 kg/ha/d and the lowest value in T1 was 8.58 kg/ha/day. After tillering fertilization, the cumulative AVs were 26.19 ± 0.10, 14.34 ± 0.66, 22.87 ± 0.98, and 21.13 ± 0.90, (kg/ha/d in CK, T1, T3, and T6 treatments, respectively. There was no significant result found after tillering fertilizer, although significant results were observed in separate events on 20 July, 22, and 24 July. Total AV after tillering fertilizer showed this trend: CK > T3 > T6 > T1 (Table 4).
During the whole growing season of maize, the highest accumulation was shown in CK about 28.9 kg/ha/d and T1, T3, and T6 about 14.34 kg/ha/d, 22.87 kg/ha/d, and 21.13 kg/ha/d, respectively.
After applying the base fertilizer, all treatments had a significant effect on AV, which showed a trend of increasing at first and then decreasing in the wheat season (Figure 6). AV mainly occurred within seven days after fertilization. On the third day, all four treatments were in peak position after basal fertilization and then decreased gradually and became flat except a small peak was observed on 1 November. Another peak point was found on 5 December after water irrigation. The highest peak was found in CK treatment at 0.873 kg/ha/d. At the end of basal fertilization, in January and February, we recorded higher value in CK treatment compared to the other three treatments. After basal fertilization, the cumulative AVs of 7.79 ± 0.08, 5.88 ± 0.05, 5.96 ± 0.05, and 6.50 ± 0.06, (kg/ha/d) were found in CK, T1, T3, and T6 treatments, respectively, and the overall performance was CK > T6 > T3 > T1 (Table 4). The highest accumulation appeared in CK treatment and it is significantly different in comparison to the other treatments. Similar trends were observed after tillering fertilization. The AV rate peaked on the second to third day after fertilization. On the third day, the highest value in CK was 1.641 kg/ha/d and the lowest value in T1 was 0.559 kg/ha/d. After tillering fertilization, the cumulative AVs of 8.29 ± 0.10, 5.00 ± 0.04, 7.14 ± 0.07, and 6.58 ± 0.05, (kg/ha/d) were found in CK, T1, T3, and T6 treatments, respectively, and the overall performance was CK > T3 > T6 > T1 (Table 2). The highest accumulation appeared in CK treatment and it is only significantly different compared to the T1 treatment.
During the whole growing season of wheat, the highest accumulation was shown in CK at 16.08 kg/ha/d. The cumulative AV for wheat season showed a trend: CK > T3 > T6 > T1 (Table 4).

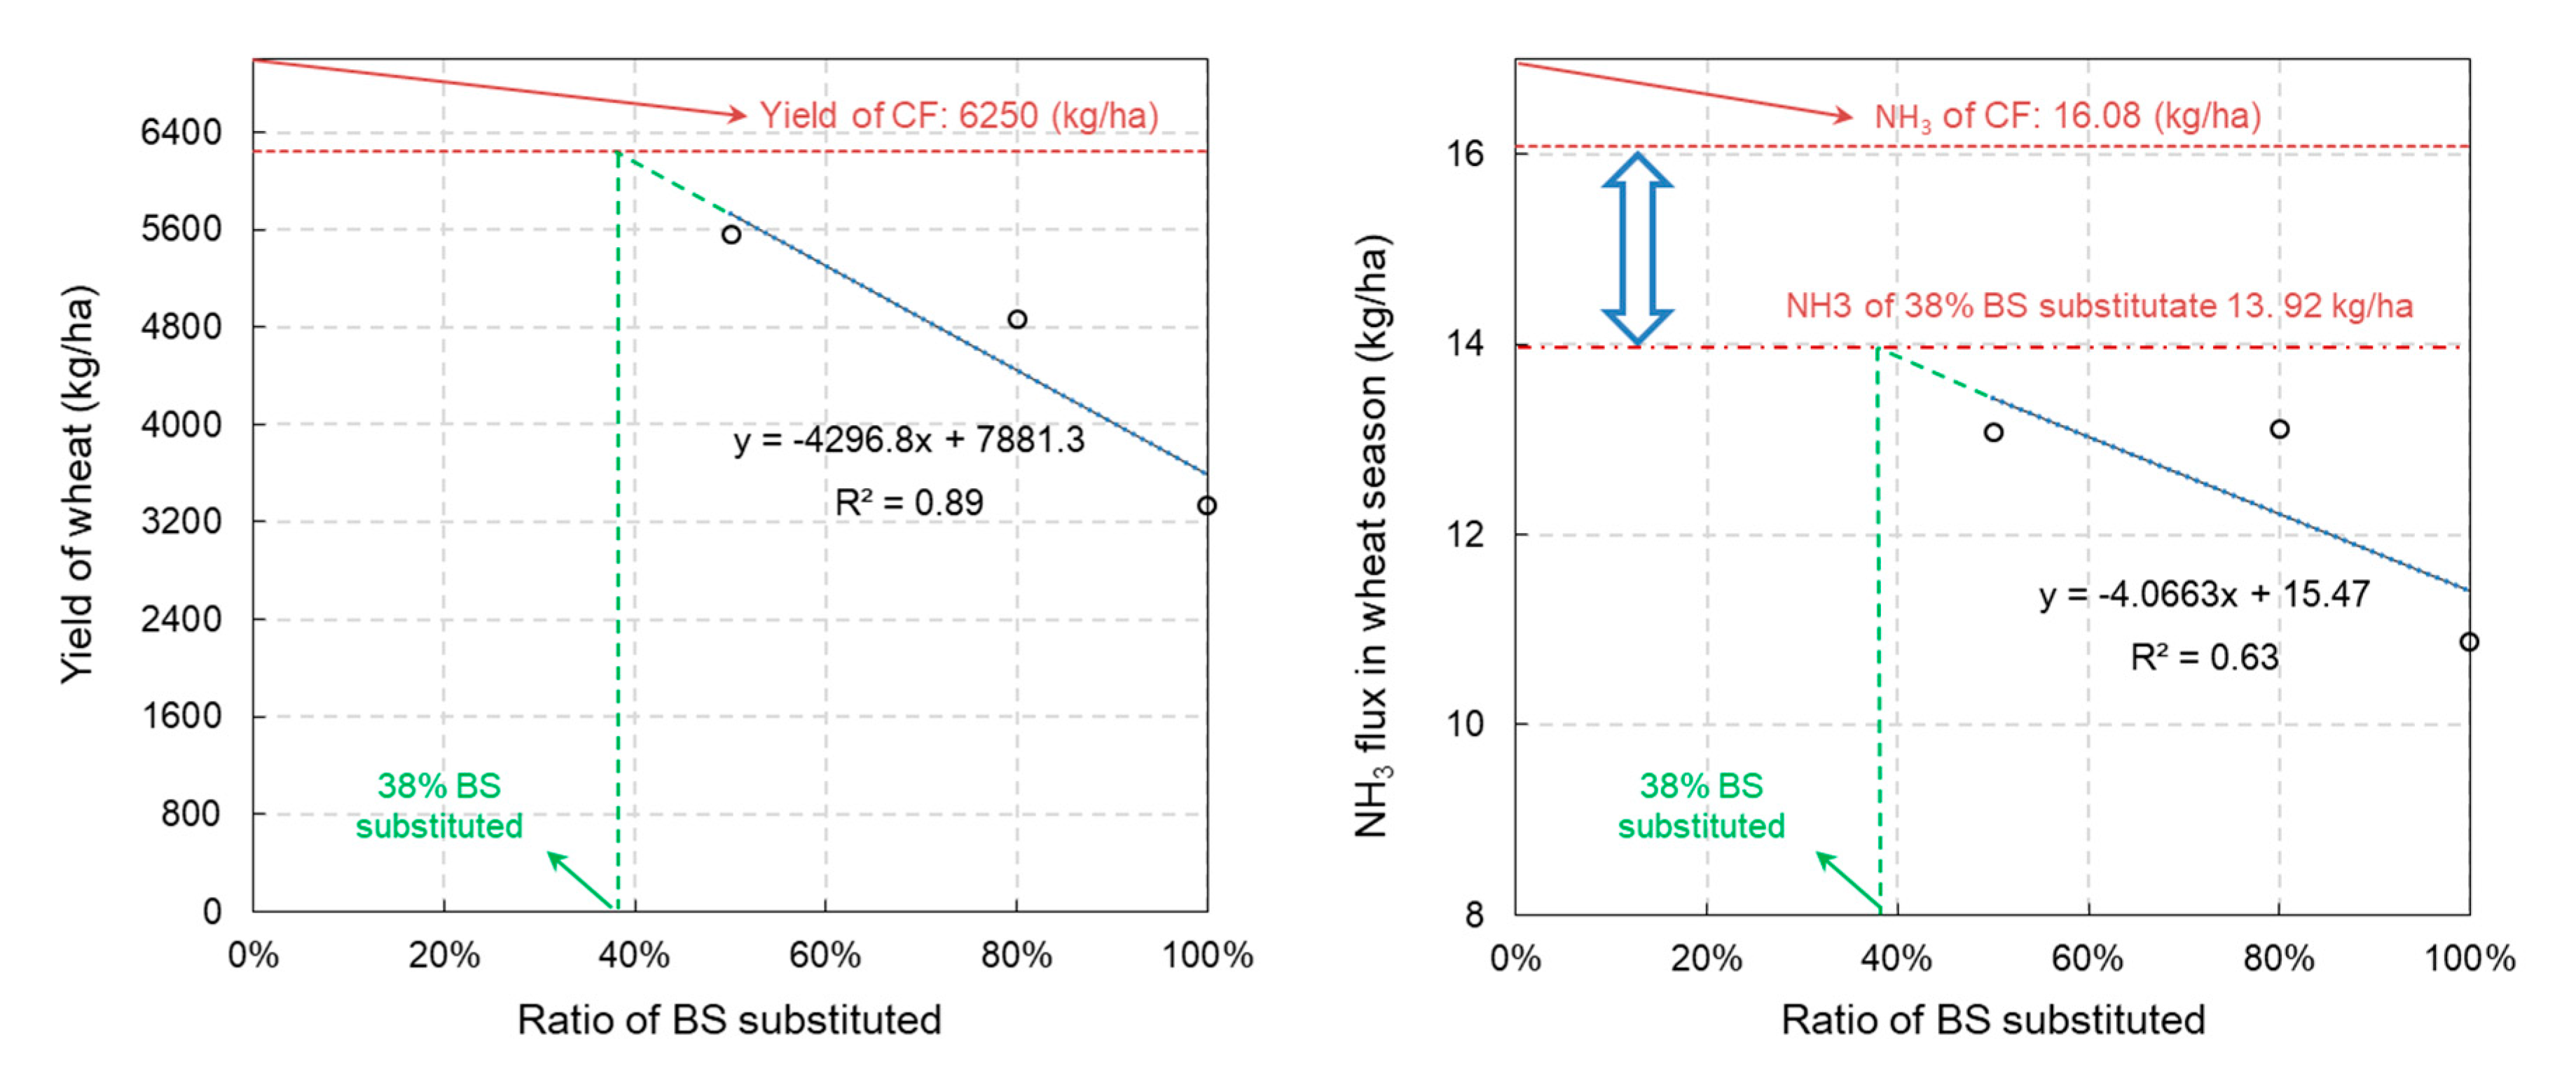
3.3. Optimal Ratio of BS Substitution

In maize season, the grain yield from the four different treatments averaged 5.62 t ha−1 in a range of 4.63–6.96 t ha−1. Treatment T3 produced the highest yield of 6.96 t ha−1, where T1, T6, and CK produced 4.63, 5.00, and 5.88 t ha−1, respectively (Table 5). There was no significant difference found among the treatments. In wheat season, the grain yield averaged 5 t ha−1 with a range of 3.33–6.25 t ha−1 (Table 5). Treatment CK produced the highest yield of 6.25 t ha−1, where T1, T3, and T6 produced 3.33, 4.87, and 5.57 t ha−1, respectively. T1 is significantly lower than other treatments.
During the maize season, we used only CF, while in the wheat season, we substituted part of the chemical fertilizer by biogas slurry. Different ratios of biogas slurry, such as 100%, 80%, and 50%, combined with chemical fertilizer were used (Figure 7). From the figure, it is clear that CK produced maximum yield of all. The yield decreased following the increasing ratio of BS. To simulate the optimal ratio of BS substitution, we firstly fitted a curve (Figure 6) to find out that the ratio of 38% BS with 62% CF would give the equivalent yield with CK. And then, we verified under the ratio of 38% BS substitution, NH3 flux was 13.92 kg/ha, which was 13.5% lower than NH3 flux of CK. The optimal ratio of BS substitution was 38% based on this simulation (Figure 7).

4. Discussion

4.1. Factors That Control the AV

AV was found to be the main way of nitrogen loss in the field, and the amount of loss was closely related to fertilization type and nitrogen application rate [38,39,40,41]. NH3 emission contributed to 19.4 ± 5.2% and 24.7 ± 5.6% of total N application rate in wheat and maize season, respectively, in NCP and typical pH of calcareous soil is 7.5 to 8.5 in NCP, where urea or ammonium bicarbonate are used, accounting for 80% of total fertilizers. Therefore, AV is usually considered the main N loss pathway in the maize season on NCP [3].
The factors that control the NH3 flux were soil NH4+, water input (irrigation and precipitation), soil pH, air temperature, and wind speed [42,43,44,45]. After being applied to the soil, urea hydrolyzes firstly. The hydrolysis rate of urea is correlated with the availability of water, urease activity, pH, and air temperature [46,47,48]. Water input is important for urea hydrolysis, which is related to soil microbial and enzymatic activity [49,50]. Hydrolysis of urea will be delayed or inhibited if the soils are very dry and water content lower than the permanent wilting point. Normally, the rate of hydrolysis will increase if the water content of the soil increases [47,48].
In this study, we observed an increase of NH3 emission after water irrigation in the wheat season [51] also proved that AV rate from soil irrigated immediately following fertilizer application is considerably higher than that from soil irrigated 5 h after fertilization. However, too much water input has the potential to carry urea or BS into the soil, minimizing loss of volatilization [7,38,45]. Previous studies found that rainfall increased infiltration of NH4+ into the soil, contributing to a reduction in AV. In this study, after rainfall on 23 and 24 July, AV decreased due to the loss of NH4+ concentration. In soils where water content is higher, activity of urease increases with temperature [48]. Optimum pH for soil urease activity ranges between pH 8 and 9. Hydrolysis of urea can be delayed in low pH soils or after adding acidifying anions combined with urea [52].
Urea in solution is hydrolyzed to NH4 ions and dissolved to NH3 (aq). An equilibrium exists between these two forms, that is governed by the pH and air temperature. Based on the acid base equilibrium, we found that the NH3 loss is low if pH < 7, but it increases noticeably when pH is > 7 [47]. Other than the formation of NH3(aq), air temperature controls equilibrium distribution between the NH3(g) and NH3(aq). On-site observations proved that high air temperature, which promoted the formation of NH3(aq) and accompanying NH3(g), significantly increased NH3 emission [11,53]. In this study, we saw a raise of NH3 fluxes after 1 May 2019 because the air temperature was higher than 20 °C. The roughness of surface soil contributed to the increase in turbulence, which resulted in an improvement in the friction speed. Consequently, it increases the exchange between the atmosphere and the surface of soil. Therefore, the top portion of NH3 gas mixed perfectly and circulated in the atmosphere and increased the NH3 emission. Accordingly, it increased the NH3 emission from supplied fertilizers due to the increasing temperature and wind speed. In contrast, high ground radiation, along with increasing wind speed, will decrease ground and plant surrounding temperatures and, subsequently, the possible emission from the solution. Hence, several studies of AV from applied manure to farmland revealed that NH3 emissions were not always associated with wind speed [42,47].
CF substituted by BS significantly reduced ammonia volatilization loss than urea in this study. Similar results were proved by previous studies in northern China for the wheat yield cropping system [51,54]. Urea is an alkaline fertilizer, it will hydrolyze and produce NH4+ and OH rate of hydrolysis depending on soil pH and temperature [47]. BS also contains a higher amount of NH4+–N concentrations and has higher slurry surface pH, which significantly affects ammonia emission [44]. However, through the same amount of N input, applications of different CF and BS ratio led to different soil NH4+, pH. We can see higher soil NH4+ and pH for CK treatment after tillering fertilization both in maize and wheat seasons (Figure 5 and Figure 6). That is the reason why NH3 flux for BS treatment were lower than CK.

4.2. Effects of Fertilizer Type on Crop Yield

The farmers use CF to increase crop production. However, if only CFs are continuously applied, it causes soil acidification and compaction, reduced fertility, and severe decline of land productivity, which seriously threatens the production capacity of farmland and its self-repairing capability and endangers the sustainable agricultural growth [41,55]. As we know, BS is considered a good source of macro (N, P, K) and micronutrients (Zn, Mn, B) that are necessary for plant growth [41]. However, if only organic manure is added to the soil, the desired increase in crop yield cannot be achieved according to our results and the previous study [30].
Crop productivity can be significantly increased if the slurry is used in combination with CF [31,32]. Likewise, BS and CF combination increased peanut grain yield and biomass, due to the increase of soil N availability. A similar effect was observed in rice, where a 10% yield increase occurred with a BS–CF combination. Moreover, the combination of BS–CF improved the yields in rapeseed [56]. In line with recent studies, medium concentration of BS to replace CFs herein significantly increased the crop yields, and NUE in NCP [57]. Similarly, a moderate ratio of manure (<40%) substituted by CF could reduce NH3 emissions and increase crop yields significantly were proved [5]. In this study, 38% of BS for substitution was proposed, which is not similar to previous studies. Previous studies only discussed BS and CF used separately. However, in our study, we used combined BS–CF and developed the ratio of 38–62%, which is a completely new idea.

4.3. Effects of Substituting Chemical Fertilizer by Biogas Slurry

CF substituted by BS significantly reduced ammonia emission in this study. Full substitution of CF by manure significantly decreased the AV in upland crops and rice fields [58]. However, full substitution of CF led to a yield penalty in both types of crops. Recent studies have suggested that a moderate ratio (<40%) of CF substitute by manure significantly increased NUE by 14.0% and 25.1% for upland crops and rice, respectively [5]. Studies also found that medium concentration of digestate biogas slurry (MDBS) increased the yield both in wheat and maize season. After that, no significant growth in yield was observed with a further increase in higher concentration of digestate biogas slurry (HDBS). The average nitrate leaching losses were 6% and 5% produced by CF and MDBS, respectively, in wheat growing season. In maize growing season, the average leaching losses were 10% and 8% contributed by CF and MDBS, respectively. In both growing season, CF produced the highest leaching loss compare to MDBS. Whereas higher concentration of digestate biogas slurry (HDBS) increased the leaching loss in comparison to MDBS. Therefore, MDBS increased the NUE with decreased leaching loss [57]. From the above two articles, it was clear that a moderate ratio of BS or partial substitution of CF by manure increased crop yield, NUE, and concurrently decreased AV and as well as N leaching. Similar results were observed in our study. We found that full substitution of CF by BS significantly decreased the AV in comparison to CF. However, full substitution of CF by BS led to a yield penalty. Different ratios of BS, such as 100%, 80%, and 50%, combined with CF, were used in our study. The yield was decreased following the increasing ratio of BS. From the above discussion, we come to this point that a moderate ratio of CF substituted by either BS or manure could increase the crop yield and synchronously reduced AV. Our findings, CF substituted by a ratio of 38% BS, significantly decreased the AV and increased the crop yield.

5. Conclusions

The main ambition of this study was to systematically evaluate and forecast NH3 losses during maize and wheat season after biogas slurry was applied in the field, compared with the CF practice at NCP. For both crops, the highest AV was obtained by CK treatment. Different emissions were found in maize season, although the amount of fertilization was the same and only CF was applied at that time. A possible reason for this may be the effect of BS from last year. In wheat season, the highest yield, as well as ammonia emission, was produced by CF and this yield could be produced from the ratio of 38% BS mixed with 62% CF. The ratio of 38% BS substitution, NH3 flux was 13.92 kg/ha, which was 13.5% lower than NH3 flux of CK. The novelty of this research was the lowest emissions and highest crop yield were observed in the combined use of both BS-CF and the ratio of 38:62. We conclude that there are great potentials for substituting CF by BS, and the optimal ratio of 38% BS was suggested to produce the highest yield and lowest NH3 emissions. Further research is required to find the optimum ratio of CF combine with BS could be an alternative agricultural strategy to obtain desired crop yield and simultaneously reduce the AV.

Author Contributions

Conceptualization, M.A.R., X.Z. and Q.Z.; methodology, M.A.R., X.Z. and Q.Z.; software, M.A.R. and X.Z.; validation, Q.Z., M.A.R., and X.Z.; formal analysis, M.A.R., X.Z. and Q.Z.; investigation, M.A.R., X.Z., S.L. (Shuqin Li), S.L. (Shengmei Lv), Y.L. and H.Z.; resources, Q.Z.; data curation, M.A.R., X.Z., S.L. (Shuqin Li), S.L. (Shengmei Lv), Y.L. and H.Z.; writing—original draft preparation, M.A.R., X.Z. and Q.Z.; writing—review and editing, M.A.R., X.Z. and Q.Z.; visualization, M.A.R. and X.Z.; supervision, Q.Z.; project administration, Q.Z.; funding acquisition, Q.Z., X.Z., S.L. (Shuqin Li). All authors have read and agreed to the published version of the manuscript.

Funding

Financial support for this paper was provided by the National Natural Science Foundation of China (41977072, 41907087), Central Public-interest Scientific Institution Basal Research Fund (BSRF201905), and Innovation Training Project for College Students: Nitrogen loss pathway and driven factors of wheat-maize rotation system in north China plain under the condition of biogas slurry application (2020).

Acknowledgments

We appreciate the institutional funding by the Institute of Environment and Sustainable Development in Agriculture, Graduate School of Chinese Academy of Agricultural Sciences, Beijing, China, making this research possible.

Conflicts of Interest

The authors declare no conflict of interest.

References

  1. Carlson, K.M.; Gerber, J.S.; Mueller, N.D.; Herrero, M.; MacDonald, G.K.; Brauman, K.A.; Havlik, P.; O’Connell, C.S.; Johnson, J.A.; Saatchi, S.; et al. Greenhouse gas emissions intensity of global croplands. Nat. Clim. Chang. 2016, 7, 63–68. [Google Scholar] [CrossRef]
  2. Zhao, R.F.; Chen, X.P.; Zhang, F.S.; Zhang, H.; Schröder, J.; Römheld, V. Fertilization and nitrogen balance in a wheat-maize rotation system in North China. Agron. J. 2006, 98, 938–945. [Google Scholar] [CrossRef]
  3. Ju, X.T.; Chen, X.P.; Yin, B.; Zhang, L.J.; Zhang, F.S.; Zhu, Z.-L.; Xing, G.-X.; Christie, P.; Cui, Z.L.; Zhang, S.L.; et al. Reducing environmental risk by improving N management in intensive Chinese agricultural systems. Proc. Natl. Acad. Sci. USA 2009, 106, 3041–3046. [Google Scholar] [CrossRef] [PubMed] [Green Version]
  4. Gao, W.; Huang, J.; Wu, D.; Li, X. Investigation on nitrate pollution in ground water at intensive agricultural region on Huanghe-huaihe-haihe plain. Eco Agric. Res. 1999, 7, 41–43. (In Chinese) [Google Scholar]
  5. Zhang, X.; Fang, Q.; Zhang, T.; Ma, W.; Velthof, G.L.; Hou, Y.; Oenema, O.; Zhang, F. Benefits and trade-offs of replacing synthetic fertilizers by animal manures in crop production in China: A meta-analysis. Glob. Chang. Biol. 2020, 26, 888–900. [Google Scholar] [CrossRef] [PubMed]
  6. Vitousek, P.M.; Matson, P.A.; Nziguheba, G.; Naylor, R.; Zhang, F.S.; Drinkwater, L.E.; Crews, T.; Holland, E.; Katzenberger, J.; Sanchez, P.A.; et al. Nutrient Imbalances in Agricultural Development. Science 2009, 324, 1519–1520. [Google Scholar] [CrossRef]
  7. Wang, Z.H.; Liu, X.J.; Ju, X.T.; Zhang, F.S.; Malhi, S.S. Ammonia volatilization loss from surface-broadcast urea: Comparison of vented- and closed-chamber methods and loss in winter wheat-summer maize rotation in North China Plain. Commun. Soil Sci. Plant Anal. 2004, 35, 2917–2939. [Google Scholar] [CrossRef]
  8. Chen, X.; Cui, Z.; Fan, M.; Vitousek, P.; Zhao, M.; Ma, W.; Wang, Z.; Zhang, W.; Yan, X.; Yang, J.; et al. Producing more grain with lower environmental costs. Nature 2014, 514, 486–489. [Google Scholar] [CrossRef]
  9. Zhang, Y.; Liu, X.J.; Fangmeier, A.; Goulding, K.T.W.; Zhang, F.S. Nitrogen inputs and isotopes in precipitation in the North China Plain. Atmos. Environ. 2008, 42, 1436–1448. [Google Scholar] [CrossRef]
  10. Zhang, Y.; Luan, S.; Chen, L.; Shao, M. Estimating the volatilization of ammonia from synthetic nitrogenous fertilizers used in China. J. Environ. Manag. 2011, 92, 480–493. [Google Scholar] [CrossRef]
  11. Zheng, X.; Chen, G.; Huang, Y.; Xu, X.; Fu, C.; Hu, F.; Han, S.; Yan, X. The Asian Nitrogen Cycle Case Study. AMBIO A J. Hum. Environ. 2009, 31, 79–87. [Google Scholar] [CrossRef] [PubMed]
  12. Su, C.; Yin, B.; Zhu, Z.; Shen, Q. Ammonia volatilization loss of nitrogen fertilizer from rice field and wet deposition of atmospheric nitrogen in rice growing season. J. Appl. Ecol. 2003, 14, 1884–1888. [Google Scholar]
  13. Matthews, E. Nitrogenous fertilizers: Global distribution of consumption and associated emissions of nitrous oxide and ammonia. Global Biogeochem. Cycles 1994, 8, 411–439. [Google Scholar] [CrossRef]
  14. Galloway, J.N.; Sutton, M.A.; Seitzinger, S.P.; Bekunda, M.; Townsend, A.R.; Martinelli, L.A.; Cai, Z.; Erisman, J.W.; Freney, J.R. Transformation of the Nitrogen Cycle: Recent Trends, Questions, and Potential Solutions. Science 2008, 320, 889–892. [Google Scholar] [CrossRef] [PubMed] [Green Version]
  15. Gruber, N.; Galloway, J.N. An Earth-system perspective of the global nitrogen cycle. Nature 2008, 451, 293–296. [Google Scholar] [CrossRef]
  16. McNeill, A.; Unkovich, M. The Nitrogen Cycle in Terrestrial Ecosystems. Nutr. Cycl. Terr. Ecosyst. 2007, 10, 37–64. [Google Scholar] [CrossRef]
  17. Anderson, N.; Strader, R.; Davidson, C. Airborne reduced nitrogen: Ammonia emissions from agriculture and other sources. Environ. Int. 2003, 29, 277–286. [Google Scholar] [CrossRef]
  18. Cao, Y.; Tian, Y.; Yin, B.; Zhu, Z. Assessment of ammonia volatilization from paddy fields under crop management practices aimed to increase grain yield and N efficiency. F. Crop. Res. 2013, 147, 23–31. [Google Scholar] [CrossRef]
  19. Kim, J.Y.; Song, C.H.; Ghim, Y.S.; Won, J.G.; Yoon, S.C.; Carmichael, G.R.; Woo, J.H. An investigation on NH3 emissions and particulate NH 4+-NO3- formation in East Asia. Atmos. Environ. 2006, 40, 2139–2150. [Google Scholar] [CrossRef]
  20. Pinder, R.W.; Adams, P.J.; Pandis, S.N. Ammonia emission controls as a cost-effective strategy for reducing atmospheric particulate matter in the Eastern United States. Environ. Sci. Technol. 2007, 41, 380–386. [Google Scholar] [CrossRef] [Green Version]
  21. Powlson, D.S.; van Kessel, C.; L’hirondel, J.-L.; Addiscott, T.M.; Cassman, K.G.; Benjamin, N.; Avery, A.A.; de Kok, T.M.; van Grinsven, H. When Does Nitrate Become a Risk for Humans? J. Environ. Qual. 2008, 37, 291. [Google Scholar] [CrossRef] [PubMed] [Green Version]
  22. Wang, F.; Dou, Z.; Ma, L.; Ma, W.; Sims, J.T.; Zhang, F. Nitrogen Mass Flow in China’s Animal Production System and Environmental Implications. J. Environ. Qual. 2010, 39, 1537–1544. [Google Scholar] [CrossRef] [PubMed] [Green Version]
  23. Chadwick, D.; Wei, J.; Yan’an, T.; Guanghui, Y.; Qirong, S.; Qing, C. Improving manure nutrient management towards sustainable agricultural intensification in China. Agric. Ecosyst. Environ. 2015, 209, 34–46. [Google Scholar] [CrossRef]
  24. Alburquerque, J.A.; de la Fuente, C.; Campoy, M.; Carrasco, L.; Nájera, I.; Baixauli, C.; Caravaca, F.; Roldán, A.; Cegarra, J.; Bernal, M.P. Agricultural use of digestate for horticultural crop production and improvement of soil properties. Eur. J. Agron. 2012, 43, 119–128. [Google Scholar] [CrossRef]
  25. Alam, S. Production of Organic Manure in Bangladesh; Bangladesh Livestock Research Institute’s Report; Bangladesh Livestock Research Institute: Dhaka, Bangladesh, 2006. [Google Scholar]
  26. Chen, G.; Zhao, G.; Zhang, H. Biogas slurry use as N fertilizer for two-season Zizania aquatica Turcz. in China. Nutr. Cycl. Agroecosyst. 2017, 107, 303–320. [Google Scholar] [CrossRef]
  27. Dahiya, A.K.; Vasudevan, P. Biogas Plant Slurry as an Alternative to Chemical Fertilizers. Biomass 1986, 9, 67–74. [Google Scholar] [CrossRef]
  28. Lu, J.; Jiang, L.; Chen, D.; Toyota, K.; Strong, P.J.; Wang, H. Decontamination of anaerobically digested slurry in a paddy field ecosystem in Jiaxing region of China. Agric. Ecosyst. Environ. 2012, 146, 13–22. [Google Scholar] [CrossRef]
  29. Sheets, J.P.; Yang, L.; Ge, X.; Wang, Z.; Li, Y. Beyond land application: Emerging technologies for the treatment and reuse of anaerobically digested agricultural and food waste. Waste Manag. 2015, 44, 94–115. [Google Scholar] [CrossRef] [Green Version]
  30. Liu, W.K.; Yang, Q.C.; Du, L. Soilless cultivation for high-quality vegetables with biogas manure in China: Feasibility and beneft analysis. Renew. Agric. Food Syst. 2009, 24, 300–307. [Google Scholar] [CrossRef]
  31. Groot, L.; Bogdanski, A. Bioslurry: Brown Gold? A Review of Scientifc Literature on the Co-Product of Biogas Production; Environment and Natural Resources Series; FAO: Rome, Italy, 2013. [Google Scholar]
  32. Malav, M.K.; Khan, S.; Kumar, S. Biogas Slurry: Source of Nutrients for Eco-friendly Agriculture. Int. J. Extensive Res. 2015, 2, 42–46. [Google Scholar]
  33. Duan, N.; Khoshnevisan, B.; Lin, C.; Liu, Z.; Liu, H. Life cycle assessment of anaerobic digestion of pig manure coupled with different digestate treatment technologies. Environ. Int. 2020, 137, 105522. [Google Scholar] [CrossRef] [PubMed]
  34. Serbian Environmental Protection Agency (SEPA). Standard Methods for the Examination of Water and Wastewater; Version 4; China Environmental Science Press: Beijing, China, 2002. [Google Scholar]
  35. Liu, H.; Li, H.; Zhang, A.; Rahaman, M.A.; Yang, Z. Inhibited effect of biochar application on N2O emissions is amount and time-dependent by regulating denitrification in a wheat-maize rotation system in North China. Sci. Total Environ. 2020, 721, 137636. [Google Scholar] [CrossRef] [PubMed]
  36. Lu, R. Analytical Methods of Soil and Agricultural Chemistry; China Agricultural Science and Technology Press: Beijing, China, 2000. (In Chinese) [Google Scholar]
  37. Abubaker, J.; Odlare, M.; Pell, M. Nitrous Oxide Production from Soils Amended with Biogas Residues and Cattle Slurry. J. Environ. Qual. 2013, 42, 1046–1058. [Google Scholar] [CrossRef] [PubMed]
  38. Shan, L.; He, Y.; Chen, J.; Huang, Q.; Wang, H. Ammonia volatilization from a Chinese cabbage field under different nitrogen treatments in the Taihu Lake Basin, China. J. Environ. Sci. 2015, 38, 14–23. [Google Scholar] [CrossRef] [PubMed]
  39. Wan, X.; Wu, W.; Li, C.; Liu, Y.; Wen, X.; Liao, Y. Soil ammonia volatilization following urea application suppresses root hair formation and reduces seed germination in six wheat varieties. Environ. Exp. Bot. 2016, 132, 130–139. [Google Scholar] [CrossRef]
  40. Xu, J.; Liao, L.; Tan, J.; Shao, X. Ammonia volatilization in gemmiparous and early seedling stages from direct seeding rice fields with different nitrogen management strategies: A pots experiment. Soil Tillage Res. 2013, 126, 169–176. [Google Scholar] [CrossRef]
  41. Yang, Q.; Liu, P.; Dong, S.; Zhang, J.; Zhao, B. Effects of fertilizer type and rate on summer maize grain yield and ammonia volatilization loss in northern China. J. Soils Sediments 2019, 19, 2200–2211. [Google Scholar] [CrossRef]
  42. Beauchamp, E.G.; Kidd, G.E.; Thurtell, G. Ammonia Volatilization From Liquid Dairy Cattle Manure in the Field. Can. J. Soil Sci. 1982, 62, 11–19. [Google Scholar] [CrossRef]
  43. Sommer, S.G.; Genermont, S.; Cellier, P.; Hutchings, N.J.; Olesen, N.E.; Morvan, T. Processes controlling ammonia emission from livestock slurry in the field. Eur. J. Agron. 2003, 19, 465–486. [Google Scholar] [CrossRef]
  44. Sommer, S.G.; Hutchings, N.J. Ammonia emission from field applied manure and its reduction-invited paper. Eur. J. Agron. 2001, 15, 1–15. [Google Scholar] [CrossRef]
  45. Sommer, S.G.; Olesen, J.E. Modelling ammonia volatilization from animal slurry applied with trail hoses to cereals. Atmos. Environ. 2000, 34, 2361–2372. [Google Scholar] [CrossRef]
  46. Bremner, J.M.; Douglas, L.A. Decomposition of Urea Phosphate in Soils. Soil Sci. Soc. Am. J. 1971, 35, 575–578. [Google Scholar] [CrossRef]
  47. Sommer, S.G.; Schjoerring, J.K.; Denmead, O.T. Ammonia emission from mineral fertilizers and fertilized crops. Adv. Agron. 2004, 82, 557–622. [Google Scholar]
  48. Vlek, P.L.G.; Carter, M.F. The effect of soil environment and fertilizer modifications on the rate of urea hydrolysis. Soil Sci. 1983, 136, 56–63. [Google Scholar] [CrossRef]
  49. Matsushima, M.; Lim, S.; Kwak, J.; Park, H.; Lee, S.; Lee, D.; Choi, W. Interactive effects of synthetic nitrogen fertilizer and composted manure on ammonia volatilization from soils. Plant Soil 2009, 325, 187–196. [Google Scholar] [CrossRef]
  50. Vandrc, R.; Clemens, J.; Goldbach, H.; Kaupenjohann, M. NH3, and N2O Emissions after Landspreading of Slurry as Influenced by Application Technique and Dry Matter-Reduction. I. NH3 Emissions. Z. Pflanz. Bodenkd. 1997, 160, 303–307. [Google Scholar] [CrossRef]
  51. Gu, L.; Liu, T.; Wang, J.; Liu, P.; Dong, S.; Zhao, B.; So, H.B.; Zhang, J.; Zhao, B.; Li, J. Lysimeter study of nitrogen losses and nitrogen use efficiency of Northern Chinese wheat. F. Crop. Res. 2016, 188, 82–95. [Google Scholar] [CrossRef]
  52. Ouyang, D.S.; Mackenuie, A.F.; Fan, M.X. Ammonia Volatilization from Urea Amended with Triple Superphosphate and Potassium Chloride. Soil Sci. Soc. Am. J. 1998, 62, 1443–1447. [Google Scholar] [CrossRef]
  53. Huang, X.; Song, Y.; Li, M.; Li, J.; Huo, Q.; Cai, X.; Zhu, T.; Hu, M.; Zhang, H. A high-resolution ammonia emission inventory in China. Global Biogeochem. Cycles 2012, 26, 1–14. [Google Scholar] [CrossRef]
  54. Zheng, F.; Dong, S.; Liu, P.; Zhang, J.; Zhao, B. Effects of combined application of manure and chemical fertilizers on ammonia volatilization loss and yield of winter wheat. J. Plant Nutr. Fertil. 2017, 23, 567–577. (In Chinese) [Google Scholar]
  55. Cui, Z.; Zhang, H.; Chen, X.; Zhang, C.; Ma, W.; Huang, C.; Zhang, W.; Mi, G.; Miao, Y.; Li, X.; et al. Pursuing sustainable productivity with millions of smallholder farmer. Nat. Publ. Gr. 2018, 555, 363–366. [Google Scholar] [CrossRef] [PubMed]
  56. Zheng, X.; Fan, J.; Cui, J.; Wang, Y.; Zhou, J.; Ye, M. Effects of biogas slurry application on peanut yield, soil nutrients, carbon storage, and microbial activity in an Ultisol soil in southern China. J. Soils Sediments 2016, 16, 449–460. [Google Scholar] [CrossRef]
  57. Du, H.; Gao, W.; Li, J.; Shen, S.; Wang, F.; Fu, L.; Zhang, K. Effects of digested biogas slurry application mixed with irrigation water on nitrate leaching during wheat-maize rotation in the North China Plain. Agric. Water Manag. 2019, 213, 882–893. [Google Scholar] [CrossRef]
  58. Ti, C.; Xia, L.; Chang, S.X.; Yan, X. Potential for mitigating global agricultural ammonia emission: A meta-analysis. Environ. Pollut. 2019, 245, 141–148. [Google Scholar] [CrossRef] [PubMed]
Figure 1. Schematic diagram of NH3 gas collection sampling set up.
Sustainability 12 04400 g001
Figure 2. Daily air temperature, ground soil temperature, and precipitation across the 2018/2019 wheat and maize season.
Sustainability 12 04400 g002
Figure 3. Seasonal variations in ammonium N concentrations in soil of different treatments during the 2018/2019 wheat and maize season. The vertical bars mean standard errors. Different color of down arrow indicates different event during both maize and wheat season. Maize season: 226.5 kg N ha−1 of CF applied in every treatment. Wheat season: 68 kg N ha−1 of chemical fertilizer applied in base fertilizer stage. Tillering stage, T1: 0 CF + 158 BS, T3: 79 CF + 79 BS, T6: 126 CF + 32 BS, CK: 158 CF + 0 BS, where CF = Chemical fertilizer, BS = Biogas slurry, different number indicates different amount of nitrogen per hectare.
Sustainability 12 04400 g003
Figure 4. Seasonal variations of the soil pH after the N application events and during the 2018/2019 maize and wheat season. The vertical bars mean standard errors. Different colors of down arrow indicate different events during both maize and wheat season. Maize season: 226.5 kg N ha−1 of CF applied in every treatment. Wheat season: 69 kg N ha−1 of chemical fertilizer applied in base fertilizer stage. Tillering stage, T1: 0 CF + 158 BS, T3: 79 CF + 79 BS, T6: 126 CF + 32 BS, CK: 158 CF + 0 BS, where CF = Chemical fertilizer, BS = Biogas slurry, different number indicates different amounts of nitrogen per hectare.
Sustainability 12 04400 g004
Figure 5. Trend of daily NH3–N emissions following the basal and the tillering fertilization during maize season. Single star (*) and double star (**) represents the significant daily difference, p < 0.05 and p < 0.01 respectively. Statistical difference according to the Turkey HSD test at probability level p < 0.05. The vertical bars mean standard errors. Different colors of down arrow indicate different events during maize season. Total 226.5 kg N ha−1 of CF applied in every treatment.
Sustainability 12 04400 g005
Figure 6. Trend of daily NH3–N emissions following the Basal and the tillering fertilization and water irrigation. The vertical bars mean standard errors. Different color of down arrow indicates different event during wheat season. Wheat season: 68 kg N ha−1 of chemical fertilizer applied in base fertilizer stage. Tillering stage, T1: 0 CF + 158 BS, T3: 79 CF + 79 BS, T6: 126 CF + 32 BS, CK: 158 CF + 0 BS, where CF = Chemical fertilizer, BS = Biogas slurry, different number indicates different amount of nitrogen per hectare.
Sustainability 12 04400 g006
Figure 7. Yield of wheat versus ratio of biogas slurry (BS) substitution and NH3 emission versus ratio of biogas slurry (BS) substitution. CF means chemical fertilizer.
Sustainability 12 04400 g007
Table 1. Physical and chemical properties of the soil.
LayerOrganic Matter (g kg−1)Total N (g kg−1)Total K (g kg−1)Available P (mg kg−1)Available N (mg kg−1)Available K (mg kg−1)
0–20 cm13.70.92170.683.4227.0
20–40 cm10.70.62122.046.5146.9
Table 2. Different ratios of BS and chemical fertilizer in wheat season.
Fertilizer Type T1T3T6CKFertilizer Type T1T3T6CK
Basal FertilizationCF, k/ha68686868Tillering FertilizationCF, Kg/ha079126158
BS, kg/ha0000BS, Kg/ha15879320
Note: T1, T3, T6, and CK represent the different treatments. Basal fertilization: 68 Kg N/ha was used in every treatment. Tillering fertilization: T1: 0 CF + 158 BS, T3: 79 CF + 79 BS, T6: 126 CF + 32 BS, CK: 158 CF + 0 BS. Different numbers indicate different fertilization rates, Kg N/ha. Where, CF: Chemical fertilizer, BS: Biogas slurry.
Table 3. Physio-chemical properties of the biogas slurry.
ParameterpHTNCODNH4+NNO3NTPTKFeAsHgCuZnCdPb
Value81710871315580.08130013904.505.260.091038770.173.61
Note: (COD, TN, NH4+N, NO3N, TP, TK, Fe) unit, mg/L and (As, Hg, Cu, Zn, Cd, Pb) unit, μg/L.
Table 4. Amount of ammonia volatilization for each fertilization and the whole period for the four different treatments in maize and wheat season.
VarietiesFertilizer TypeTreatments
T1T3T6CK
MaizeBasal fertilization1.70 ± 0.05b1.09 ± 0.03b1.85 ± 0.05b2.40 ± 0.42a
Tillering fertilization14.34 ± 0.66a22.87 ± 0.98a21.13 ± 0.90a26.19 ± 0.10a
Whole season16.04 ± 0.43a23.96 ± 0.65a22.98 ± 0.59a28.59 ± 0.72a
WheatBasal fertilization5.88 ± 0.05b5.96 ± 0.05b6.50 ± 0.06b7.79 ± 0.08a
Tillering fertilization5.00 ± 0.04b7.14 ± 0.07ab6.58 ± 0.05ab8.29 ± 0.10a
Whole season10.87 ± 0.04b13.10 ± 0.04b13.08 ± 0.04b16.08 ± 0.06a
Note: Standard Errors are shown in every treatment. Statistical difference was analyzed according to the Turkey HSD test at probability level p < 0.05. Small letters indicate the significant differences between treatments according to the post hoc Duncan test.
Table 5. Grain yield in both maize and wheat season of the four different treatments.
VarietiesGrain Yield, kg/ha
T1
(158 BS + 0 CF)
T3
(126 BS + 32 CF)
T6
(79 BS + 79 CF)
CK
(0 BS + 158 CF)
Maize4625 ± 257a6958 ± 1214a5875 ± 358a5000 ± 118a
Wheat3329 ± 146b4868 ± 233a5562 ± 29a6250 ± 270a
Note: The different lowercase letters in the same row indicate significant differences and same lowercase letters in the same row indicate no significant differences among the treatments according to Tukey HSD test (p < 0.05; n = 3), where BS = biogas slurry, and CF = Chemical fertilizer. Biogas slurry only applied in wheat season and only chemical fertilizer applied in maize season. Different numbers indicate different amounts of nitrogen per hectare.

