Concrete Early-Age Crack Closing by Autogenous Healing


Institute of Concrete Science and Technology (ICITECH), Universitat Politècnica de València, 46022 Valencia, Spain
*
Author to whom correspondence should be addressed.
Sustainability 2020, 12(11), 4476; https://0-doi-org.brum.beds.ac.uk/10.3390/su12114476
Submission received: 20 April 2020
/
Revised: 18 May 2020
/
Accepted: 28 May 2020
/
Published: 1 June 2020
(This article belongs to the Special Issue Crack Prediction and Preventive Repair Methods for the Increasing Sustainability and Safety Requirements of Structures)
Abstract
:Autogenous healing is mainly produced by continuing hydration or carbonation. The aim of this research is to quantify the crack closing produced by autogenous healing for early-age concrete. This healing was evaluated for two crack size levels, 0.1 mm and 0.4 mm, under three healing conditions: water immersion, a humidity chamber, and wet/dry cycles. Crack closing was evaluated after 7, 14, 28 and 42 days under healing conditions. The internal status of the cracks was verified visually and using phenolphthalein. The results show that specimens stored in the humidity chamber did not experience healing, while specimens under wet/dry cycles and water immersion achieved the complete closing of small-sized cracks (under 0.15 mm). Autogenous healing showed higher speed under wet/dry cycles but higher final efficiency under water immersion. However, the inspection of the interior of the specimens showed that self-closing occurred mostly on the surface, and carbonation in the crack faces was only noticed very near the specimen’s surface. Additionally, this study proposes a preliminary strategy to model autogenous healing in concrete in terms of crack closing.
1. Introduction
Self-healing concrete is as a special type of concrete which is capable of repairing its own damage (mainly cracks) without external help [1]. Autogenous healing is a self-healing phenomenon that can occur naturally, even in concrete which is not specifically designed for self-healing, as reported in the literature [1,2,3]. In recent years, specific technologies and products have been developed to promote or improve this property (autonomous healing) [1,2,3]. The continuing hydration of unhydrated cement particles or carbonation of calcium hydroxide are the main mechanisms that produce autogenous healing [3]. In general, the latter is thought to be the most important process for autogenous healing [4]. Carbonation occurs when calcium ions from portlandite, Ca(OH)2, contact with carbon dioxide contained in water and form calcium carbonate, Ca(CO)3.
One of the first studies published in this context [4] studied concrete autogenous healing by analyzing water permeability in cracked conditions in the presence of water. It was found that crack filling through the precipitation of calcium carbonate (calcite) was the main cause for the recovery of water tightness. Despite the importance of carbonation in producing autogenous healing, the process can be jointly affected by continued hydration and carbonation, with the former affecting especially the early period of self-healing and carbonation at later stages [5].
Autogenous healing has been reported [4] to have two phases of different behavior: a surface-controlled phase, and a diffusion-controlled phase. The first phase is controlled by the presence of calcium ions in the surface of the crack reacting with those contained in the water inside the crack, forming a calcium carbonate layer. The second phase starts when the calcium carbonate layer does not allow the direct contact of calcium ions with water, meaning that the process becomes dependent on the diffusion of ions from the concrete to the crack through that layer. The first phase would take place during the first 3–5 days of contact with the water flow, when crystal growth and crack width reduction are produced. The same study [4] reported only a very slow development of crystal growth and a decrease of water permeability after the first week of healing. Recent studies reported that autogenous healing has a higher speed during the first month of healing [6], and that it stopped or slowed greatly after 1–2 [7,8] or after 3–5 [6] months of healing under water immersion.
Some studies compared the effect of the age of a crack on autogenous healing efficiency. One study [7] compared cracks generated at 20, 24, 48 and 72 h, and concluded that early-age cracks had a better autogenous healing efficiency than older cracks. Other studies focused on cracks generated at the ages of 3 and 28 days, [9] and their results showed that early cracks closed quicker and more easily than larger cracks. Specifically, early-age cracks under 0.05 mm were closed by autogenous healing in 12 days; those between 0.1 and 0.2 mm in 29 days; and those between 0.2 and 0.3 mm in 44 days. On the contrary, 28 day cracks only closed completely for cracks under 0.05 mm in 12 days, while larger cracks remained open. In the case of older cracks, in [6], the authors compared 28 day and 6 month old cracks. It was shown that, despite crack healing effectiveness decreasing with age, the differences were small, which was probably due to the already advanced hydration at the age of 1 month.
Since the reactions for autogenous healing need the presence of water, its availability is a critical part of self-healing. Some studies have compared the effect of relative humidity (60%, 95% and water immersion) [7,10] or compared air curing with water curing [11]. They obtained a better response for specimen healing under water immersion in comparison to those in humidity chambers or under air curing. Recent studies [12] showed that Engineered Cementitious Composite (ECC) specimens healing under CO2-rich-water conditions resulted in the best self-healing performance in comparison with air, underwater, and CO2-rich-air healing conditions. In that specific case, cracks of size 0.458 mm were completely closed by autogenous self-healing in 30 days by the production of calcium carbonate (CaCO3). Another study analyzed concrete healing in water containing micro silica particles [13] and detected precipitates of calcium silicate hydrate and calcium carbonate in the interior of the crack, improving the crack healing efficiency.
When comparing the effect of water immersion or alternating wet/dry cycles, some studies [14,15] achieved better results for complete immersion in terms of the recovery of water tightness and crack closing, with high scattering in the case of wet/dry cycles [15]. On the contrary, other studies found better healing under wet/dry cycling conditions compared to complete water immersion [16,17,18]. The studies [16,17] obtained in ECC specimens showed that regimes with different moisture conditions did not achieve significant healing, as measured by resonant frequency, while regimes of water immersion or combined cycles did. They also reported that the combined cycles conditions obtained the best results.
In recent years, several methods have been proposed for the evaluation of the self-healing properties of concrete, with an effort towards their standardization. However, no standard has yet been released. Different methodologies have been used to evaluate improvements due to the healing process, which can be classified depending on the type of property of interest: transport properties, mechanical properties, filling of cracks, etc. The evaluation of surface cracks is the most straightforward method to evaluate self-healing, and it has therefore been frequently used as a secondary method to visually support other test results; nevertheless, some studies [9,19,20] have used crack closing as the main indicator of self-healing.
The objective of this research is to quantify the crack closure produced by autogenous healing for early-age concrete in cracks of two size levels: one centered around 0.1 mm and the other around 0.4 mm. These two crack sizes represent situations typically considered in service conditions and slightly over service conditions, respectively. This study compares crack closing under three healing conditions: water immersion, wet/dry cycles, and a humidity chamber. The latter serves as a reference condition without autogenous healing. Several methodologies are used to quantify autogenous healing, and a preliminary model to estimate crack closing is explored. Additionally, the internal status of the crack is studied visually and using phenolphthalein since carbonation is commonly considered to be the main process that produces autogenous healing.
2. Materials and Methods
2.1. Materials
This study analyzes autogenous healing in a concrete with strength class C30/37. The cement used was CEM I 42.5 R from Lafarge, without mineral additions since their presence could affect the healing reactions. Concrete with coarse aggregate was studied to work in a situation closer to real constructions, even though the presence of large aggregates might affect self-healing. The coarse aggregates were crushed calcareous aggregates of size (dmin/Dmax) 7/12 and 4/7 mm. The fine aggregate was natural calcareous sand. Limestone powder was added with the purpose of adapting the aggregates’ size distribution to obtain a more continuous particle distribution curve.
Superplastizer Sika ViscoCrete-5980 was added in order to obtain a mix with an S3 consistency class. Steel fibers were used for the purpose of controlling the crack width during the precracking and healing stages in an amount of 40 kg/m3 of steel fibers (0.51% by volume), which was already used successfully in [15]. Fibers were Dramix® RC 65/35 BN from Bekaert, of 35 mm in length and 0.55 mm in diameter. Table 1 shows the concrete dosage used in this research.
Cylindrical specimens, of size Φ150 × 300 mm, were cast following UNE-EN 12390-2. After casting, the specimens were left to cure in the mold for 24 h and then kept in a humidity chamber under standard conditions (20 ± 2 °C and >95% of relative humidity) until the time of testing. Three cylinders were used to characterize concrete through compressive strength tests at 28 days, as per EN 12390-3, and the consistency of the batch was characterized using slump test as per EN 12350-2. The slump obtained was 145 mm, which corresponds to a S3 consistency class, and the average compression strength obtained was 38.3 MPa. These characterization results are included in Table 1.
Cylindrical specimens were cut in half using a circular saw for concrete. In this way, specimens of size Φ150 × 150 mm were the final specimens obtained for the crack closing evaluation. The edge faces of each resulting cylinder were polished in order to eliminate mortar layers in the bottom surface in contact with the molds and asperities in the top free surface of the specimen as cast. This process allowed us to discern if a crack hit and broke an aggregate or if it passed through cement paste. Additionally, having a smooth surface is useful for a better evaluation of crack closing.
The small cylindrical concrete specimens were precracked at the age of 2 days. A splitting test was used to create cracks of two levels: 0.1 and 0.4 mm. Controlling the crack width and keeping the crack width fixed afterwards was possible thanks to the use of steel fibers in the mix. All specimens were left to heal at the age of 3 days over 42 days. Crack widths were analyzed after 0, 7, 14, 28 and 42 days of healing.
Three environmental exposure conditions were considered in order to determine the influence of water availability on the self-healing capability of the tested specimens:
- HC (humidity chamber): storage of the specimens inside a standard humidity chamber at 20 ± 2 °C and >95% relative humidity (control condition);
- WI (water immersion): continuous immersion in tap water at a temperature of 15 ± 1 °C, only adding water to compensate the evaporation and to maintain a constant water level;
- W/D (wet/dry cycles): immersion in tap water at a temperature of 15 °C for 3.5 days and air exposure for another 3.5 days (air conditions: 17 ± 1 °C and 40 ± 5% relative humidity).
In the three healing conditions, specimens were placed to maintain the crack in a lateral position to ensure comparability. In total, 18 cylindrical concrete specimens were precracked through the splitting test, producing two cracks per specimen. In total, 36 cracks were analyzed. These specimens were distributed equally to all the three healing exposures; thus, 12 cracks were analyzed per healing exposure. Since photos were taken after 0, 7, 14, 28 and 42 days of healing, in total, 180 photos were analyzed for this study.
2.2. Precracking Methodology
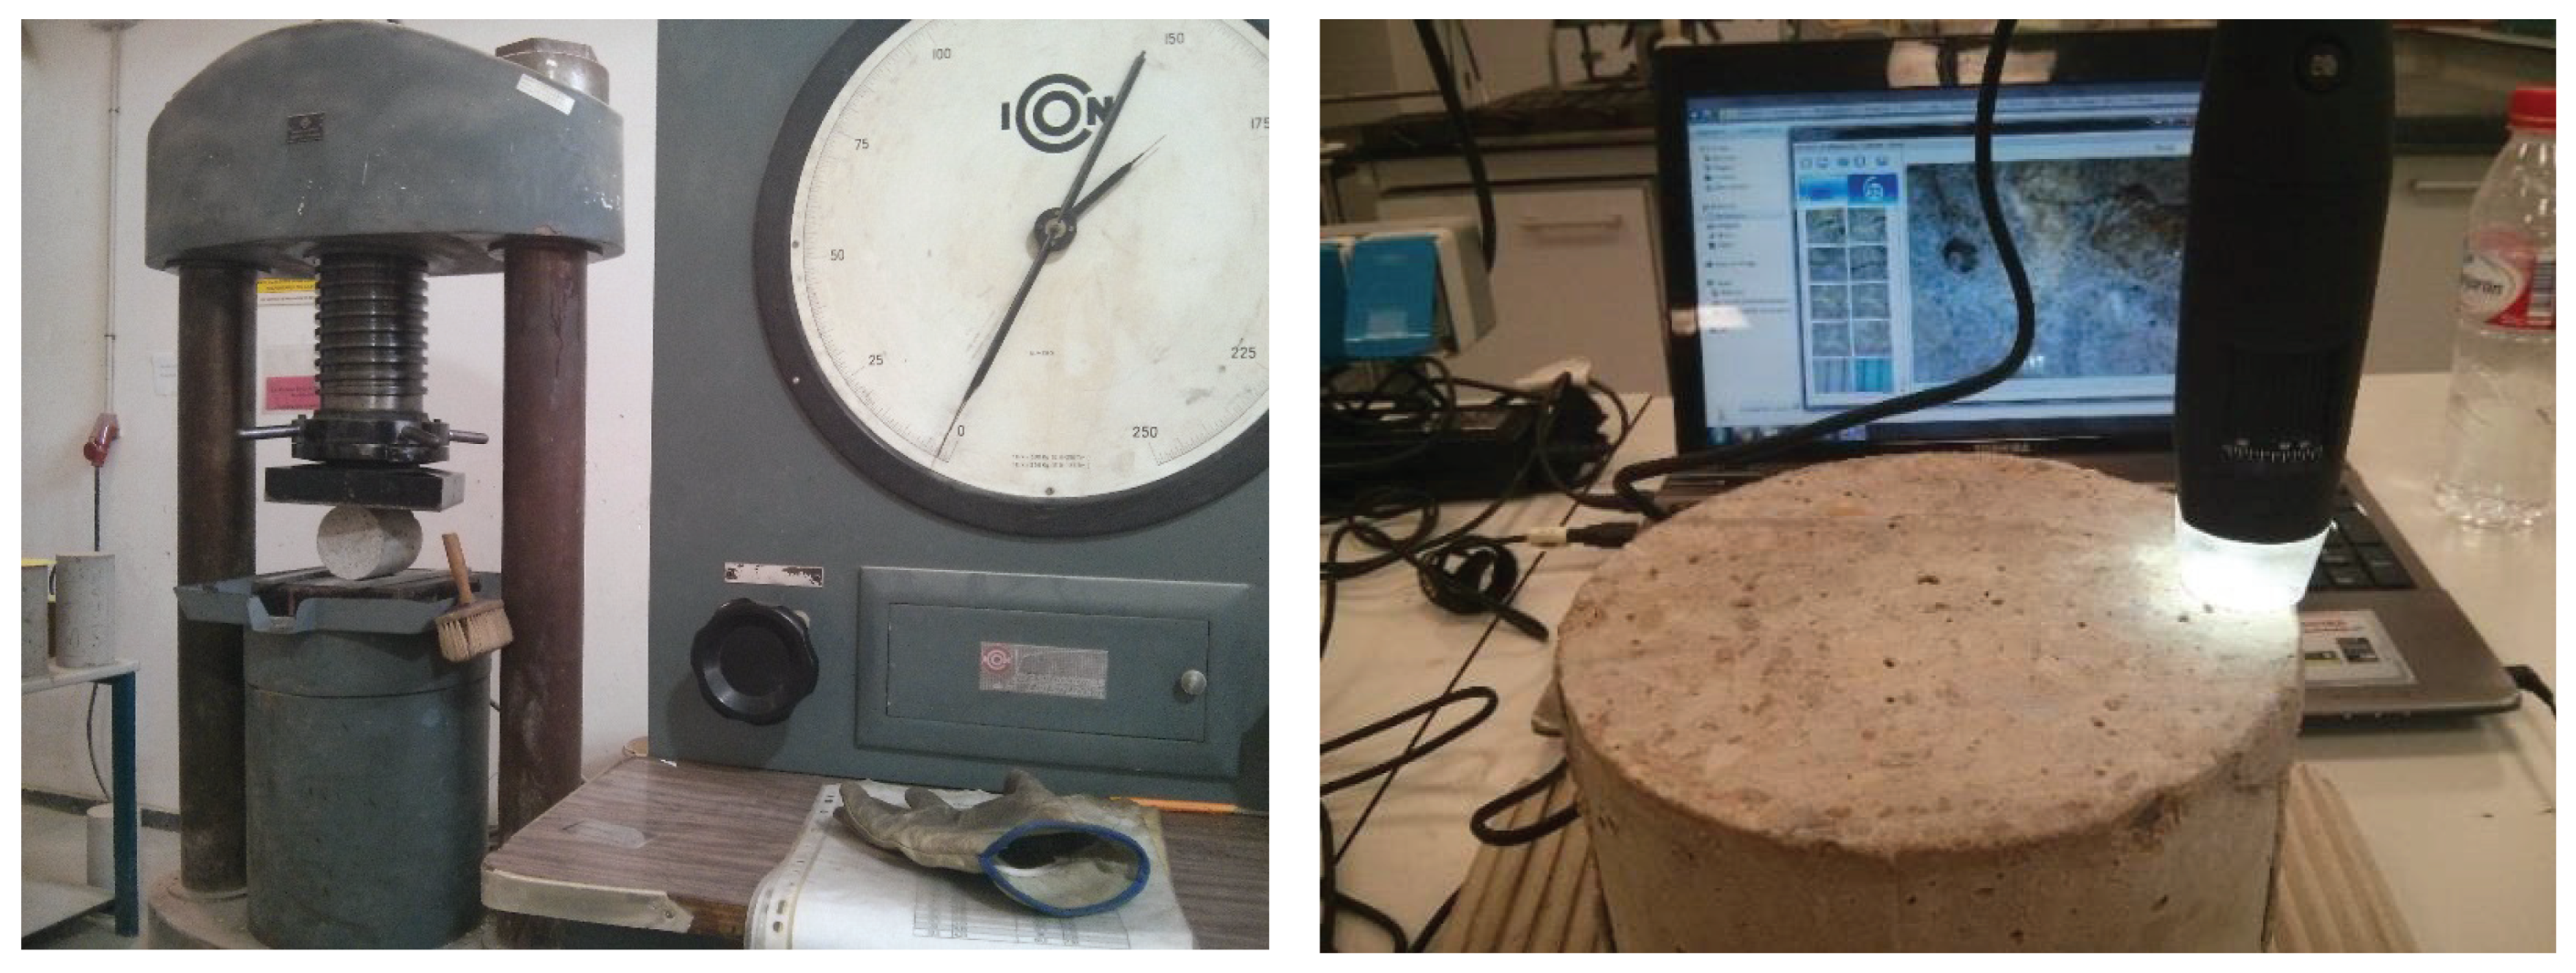
Cylindrical specimens were precracked at the age of 2 days by means of a splitting test (Figure 1 Left) to reach two target values of crack width, controlled by a calibration ruler.
Two levels of crack widths were studied: 0.1 and 0.4 mm. The former was selected as a value which is allowed in structural codes, even in XS aggressive environments, while the latter was selected as a high crack level among those allowed in the codes.
Using the reference ruler has an inherent dispersion due to the human factor, but the fibers used allowed a cracking control which was sufficiently good to differentiate the two intended cracks levels with acceptable variability. The cracks obtained were an average of 0.10 mm in size with a standard deviation of 0.04 mm for the group of cracks of size 0.1 mm, and an average of 0.38 mm with a standard deviation of 0.08 mm for the group of cracks of size 0.4 mm.
Besides being an approximate way to control the crack width, this method is very simple and allows a larger number of specimens to be cracked in a reasonable time frame.
2.3. Crack Width Measurement
In this work, an optical USB microscope (PCE-MM200) (PCE Instruments, Albacete, Spain) that was able to show cracks in real time on a computer was used. The microscope has LEDs to provide a light source and achieve clear images (Figure 1 Right). In order to calibrate the measures, the PCE-MM 200 software (of the microscope was used as well as a crack width ruler to verify the calibration of the measurements before each set of measurements. Each picture measured 1600 × 1200 pixels, with a resolution of 96 ppp. The pictures were analyzed with Adobe Photoshop CS6 (Adobe, San Jose, CA, USA) in order to evaluate the width of each crack. Crack width was evaluated in the geometrical center of the section of the cylinder.
Pictures were taken before and after each healing period to evaluate autogenous healing. Before taking pictures, all the concrete specimens were cleaned with compressed air to remove any dust impurities. Those specimens that healed for the last days in water immersion were left to dry for two hours under lab conditions to ensure a dry surface. Otherwise, the LEDs would reflect light due to the water located inside the crack.
Most of the time, Equation (1) was used to evaluate self-healing by crack closing:
where ω0 is the initial crack width (mm)—in this study, measured after precracking—and ωt is the final crack width (mm)—in this study, measured after a healing period of t days (t = 7, 14, 28 and 42 days). This equation has been previously used by several authors ([15,21,22], among others).
Crack closing rate = 1 − ωt/ω0
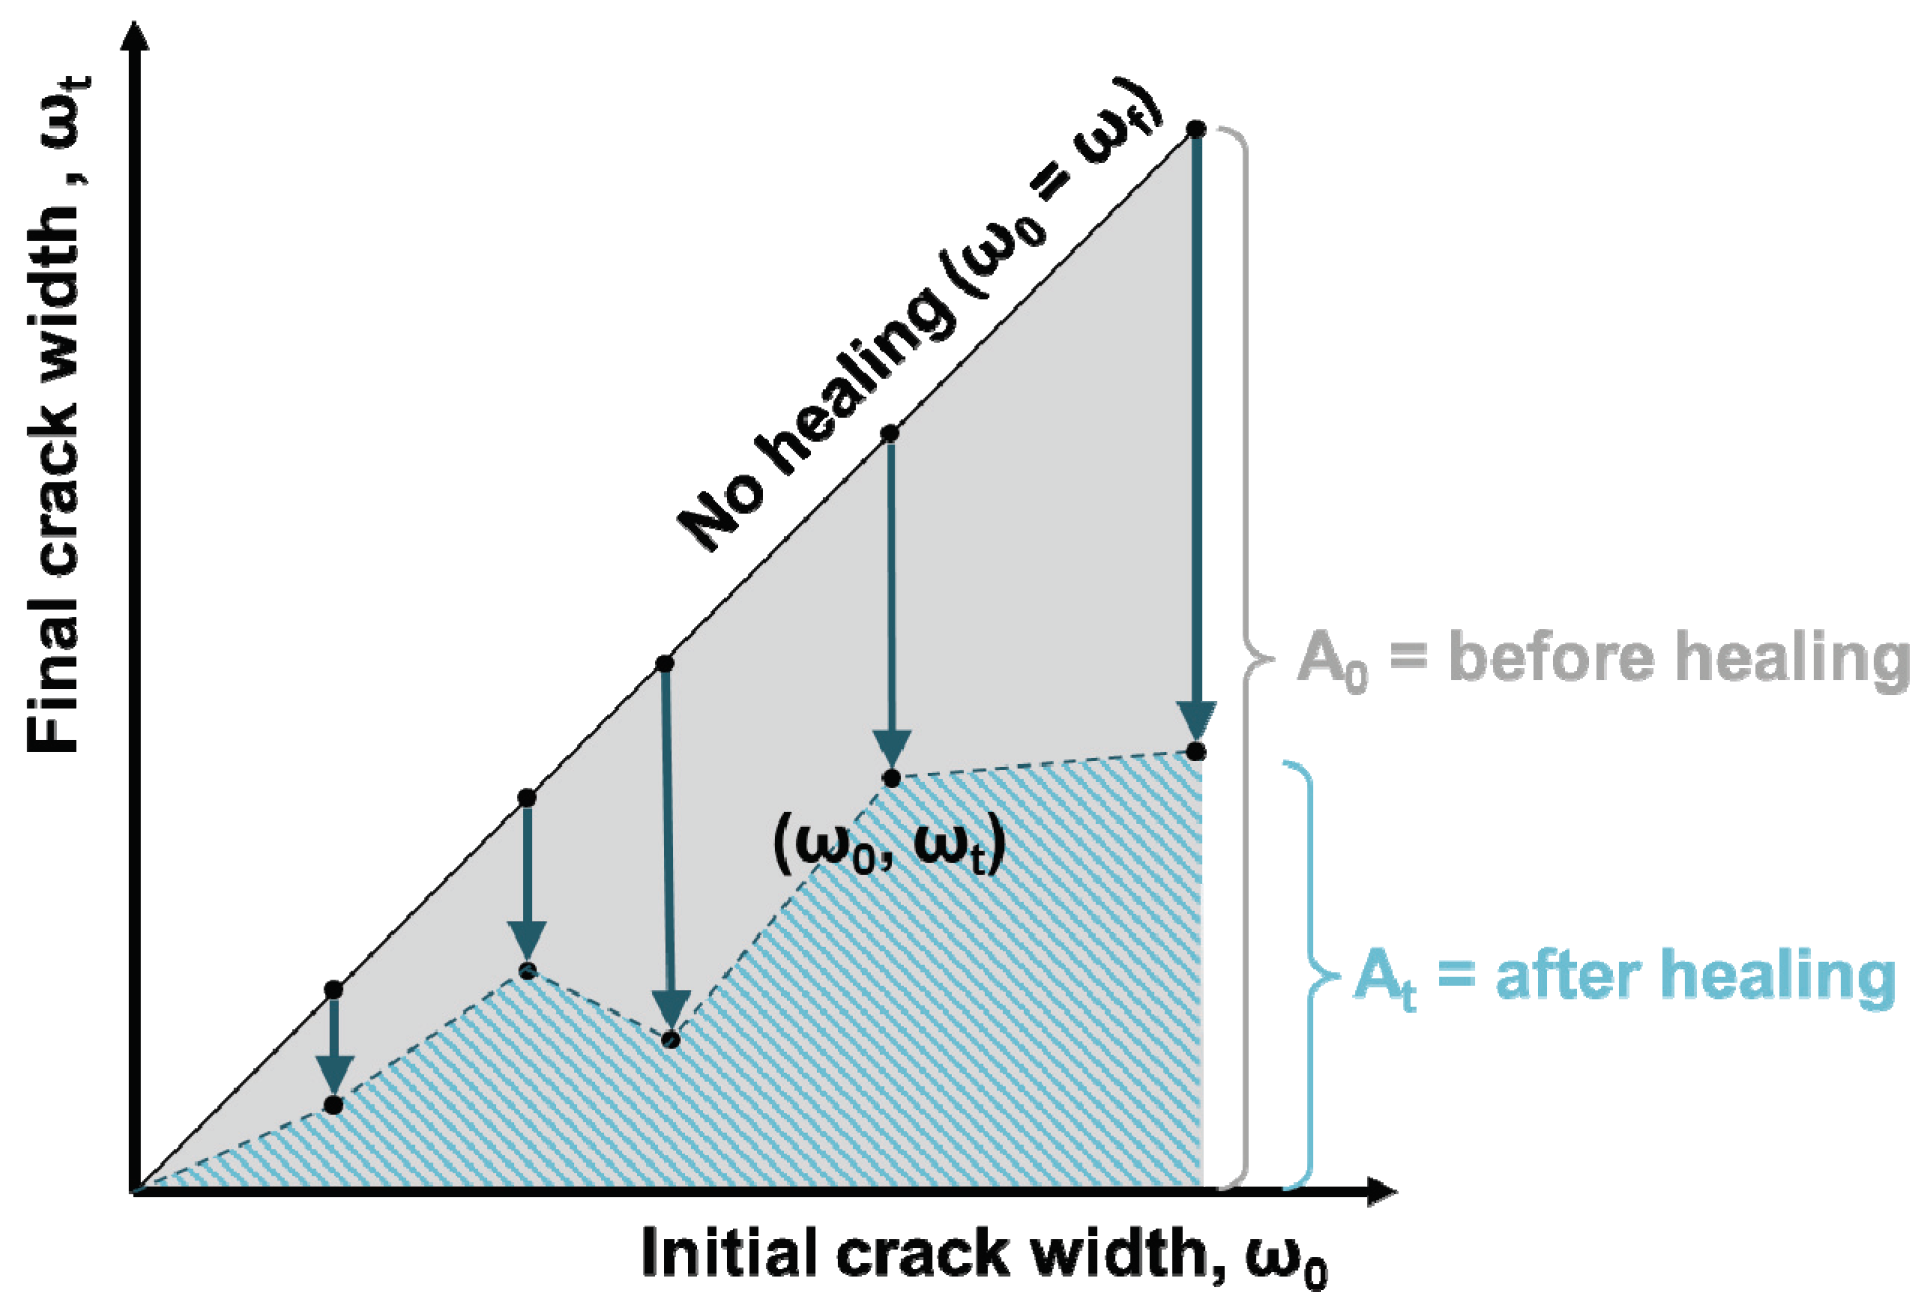
Other research [9,19,23] proposed the evaluation of a global value using a self-healing index β. This index is obtained by considering all the measures of crack width for certain type of concrete and its evolution with time. Β is calculated using the formula in Equation (2), and the conceptual diagram is displayed in Figure 2:
where A0 is the area between the bisecting line and the horizontal axis, and At is the area between the polyline that unites all the remaining crack width points and the horizontal axis (blue diagonal stripes in Figure 2).
β = 1 − At / A0
To ensure a fair comparison between concrete healing under the three conditions, the initial area before healing Ai must be similar in the compared cases; that is, the maximum crack widths considered have to be as similar as possible. In this study, the maximum crack widths considered for the conditions of the humidity chamber, wet/dry cycles and water immersion were 0.48 mm, 0.44 mm and 0.45 mm, respectively. Therefore, the results are considered to be comparable.
This work will evaluate the closure of the cracks by three methods: (1) directly analyzing the evolution of crack width, (2) the crack closing rate and (3) the described self-healing index.
2.4. Internal Crack and Carbonation
Several specimens displayed complete crack closing. To verify the internal status of the cracks, these healed specimens were cut transversally into two halves using a circular saw for concrete. Since the main causes of the reactions taking place are thought to be continuing hydration and carbonation, phenolphthalein was used as an indicator to verify if carbonation took place. After performing the cut, specimens were left to dry 30 min, and afterwards, phenolphthalein was applied to the surface of all specimens. Extra specimens from previous investigations were analyzed to complete the verification of this matter; specifically, these were specimens which had healed under water immersion at 30 °C for 6 months to maximize self-healing [24].
Additionally, the precipitates which formed on the surface were scratched and collected to perform X-ray diffraction (XRD) analysis.
3. Results and Discussion
3.1. Formation of Precipitates
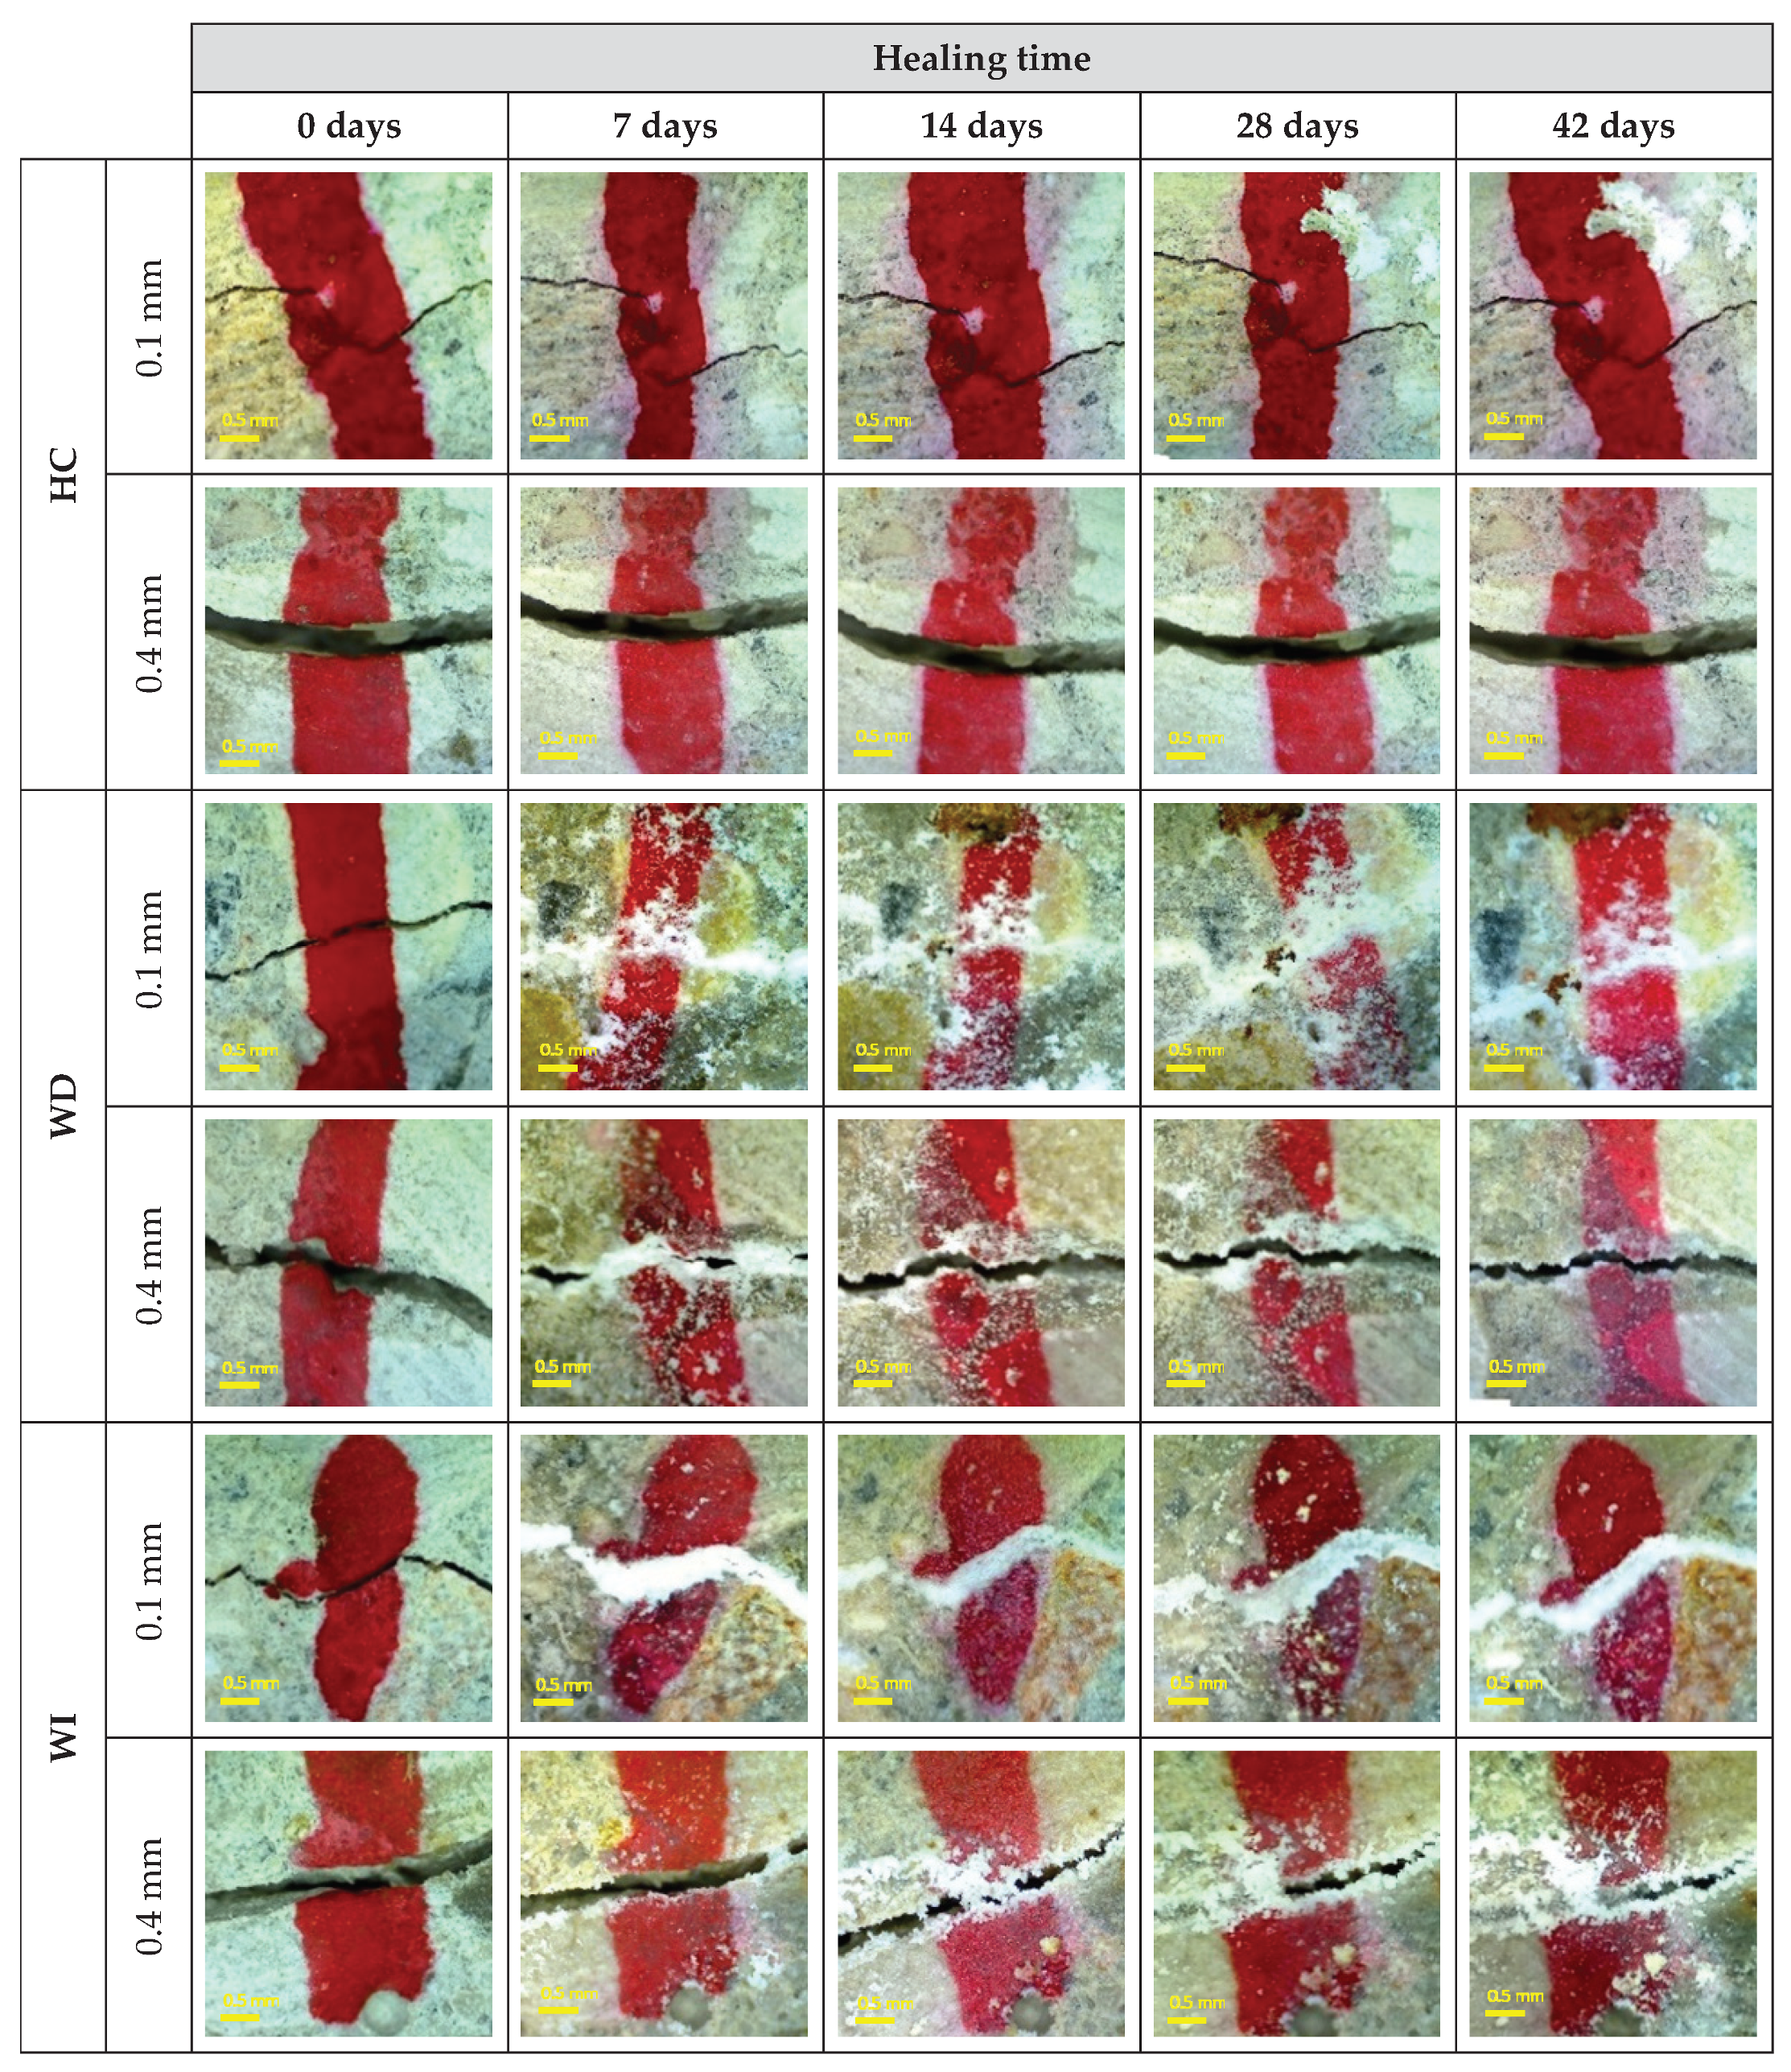
Figure 3 demonstrates the evolution of the visual appearance of cracks of widths of 0.1 and 0.4 mm which healed in the different conditions analyzed.
The results indicate that the specimens stored in the humidity chamber did not experience healing, while specimens under wet/dry cycles and water immersion achieved the complete closing of small-sized cracks (0.1 mm). Some cracks of width of 0.4 mm achieved high crack closing rates, with better results for those specimens which healed in water immersion.
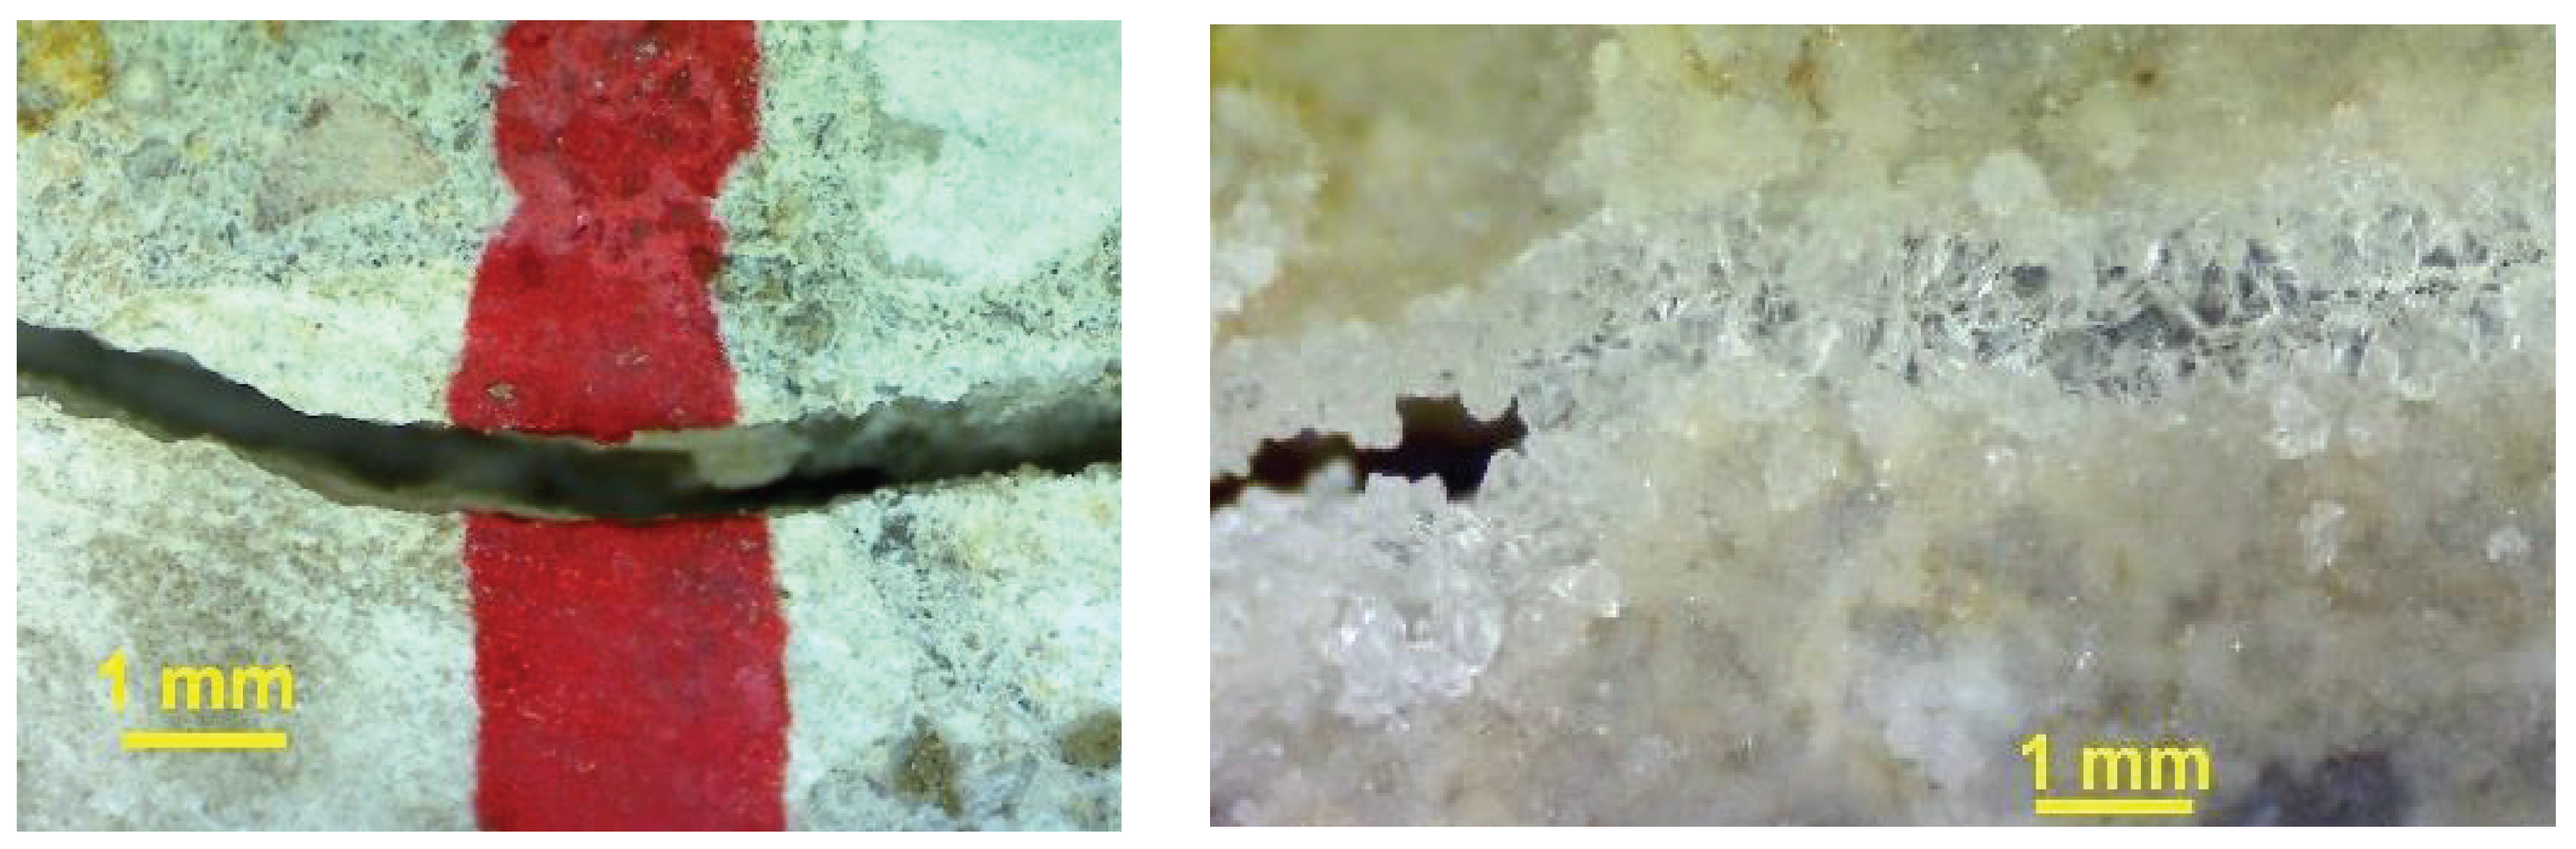
Some large cracks from specimens that healed under water immersion had tooth-like precipitates, with a different visual appearance than surface precipitates. Figure 4 shows photos with the details of two cracks of 0.4 mm. The left photo was taken from a specimen stored in a humidity chamber, which showed no formation of precipitates. The right photo was taken from a specimen healed under water immersion, where precipitates were shown to have formed in the surface and interior (close to the surface).
XRD analyses showed that the precipitates obtained by scratching the surface were composed mainly of calcite—the main compound also found in the literature—and brucite. Since magnesium could be found in small amounts in the limestone powder and in the cement, it was not unexpected that brucite was found, and other research also found brucite in specimens exposed to cyclic exposures [14]. These results suggest that the process producing the self-healing of the tested 2 day cracks can be considered mainly to be carbonation.
3.2. Crack Closing
The crack width of all these specimens was quantified and analyzed through the methods described in Section 2.3.
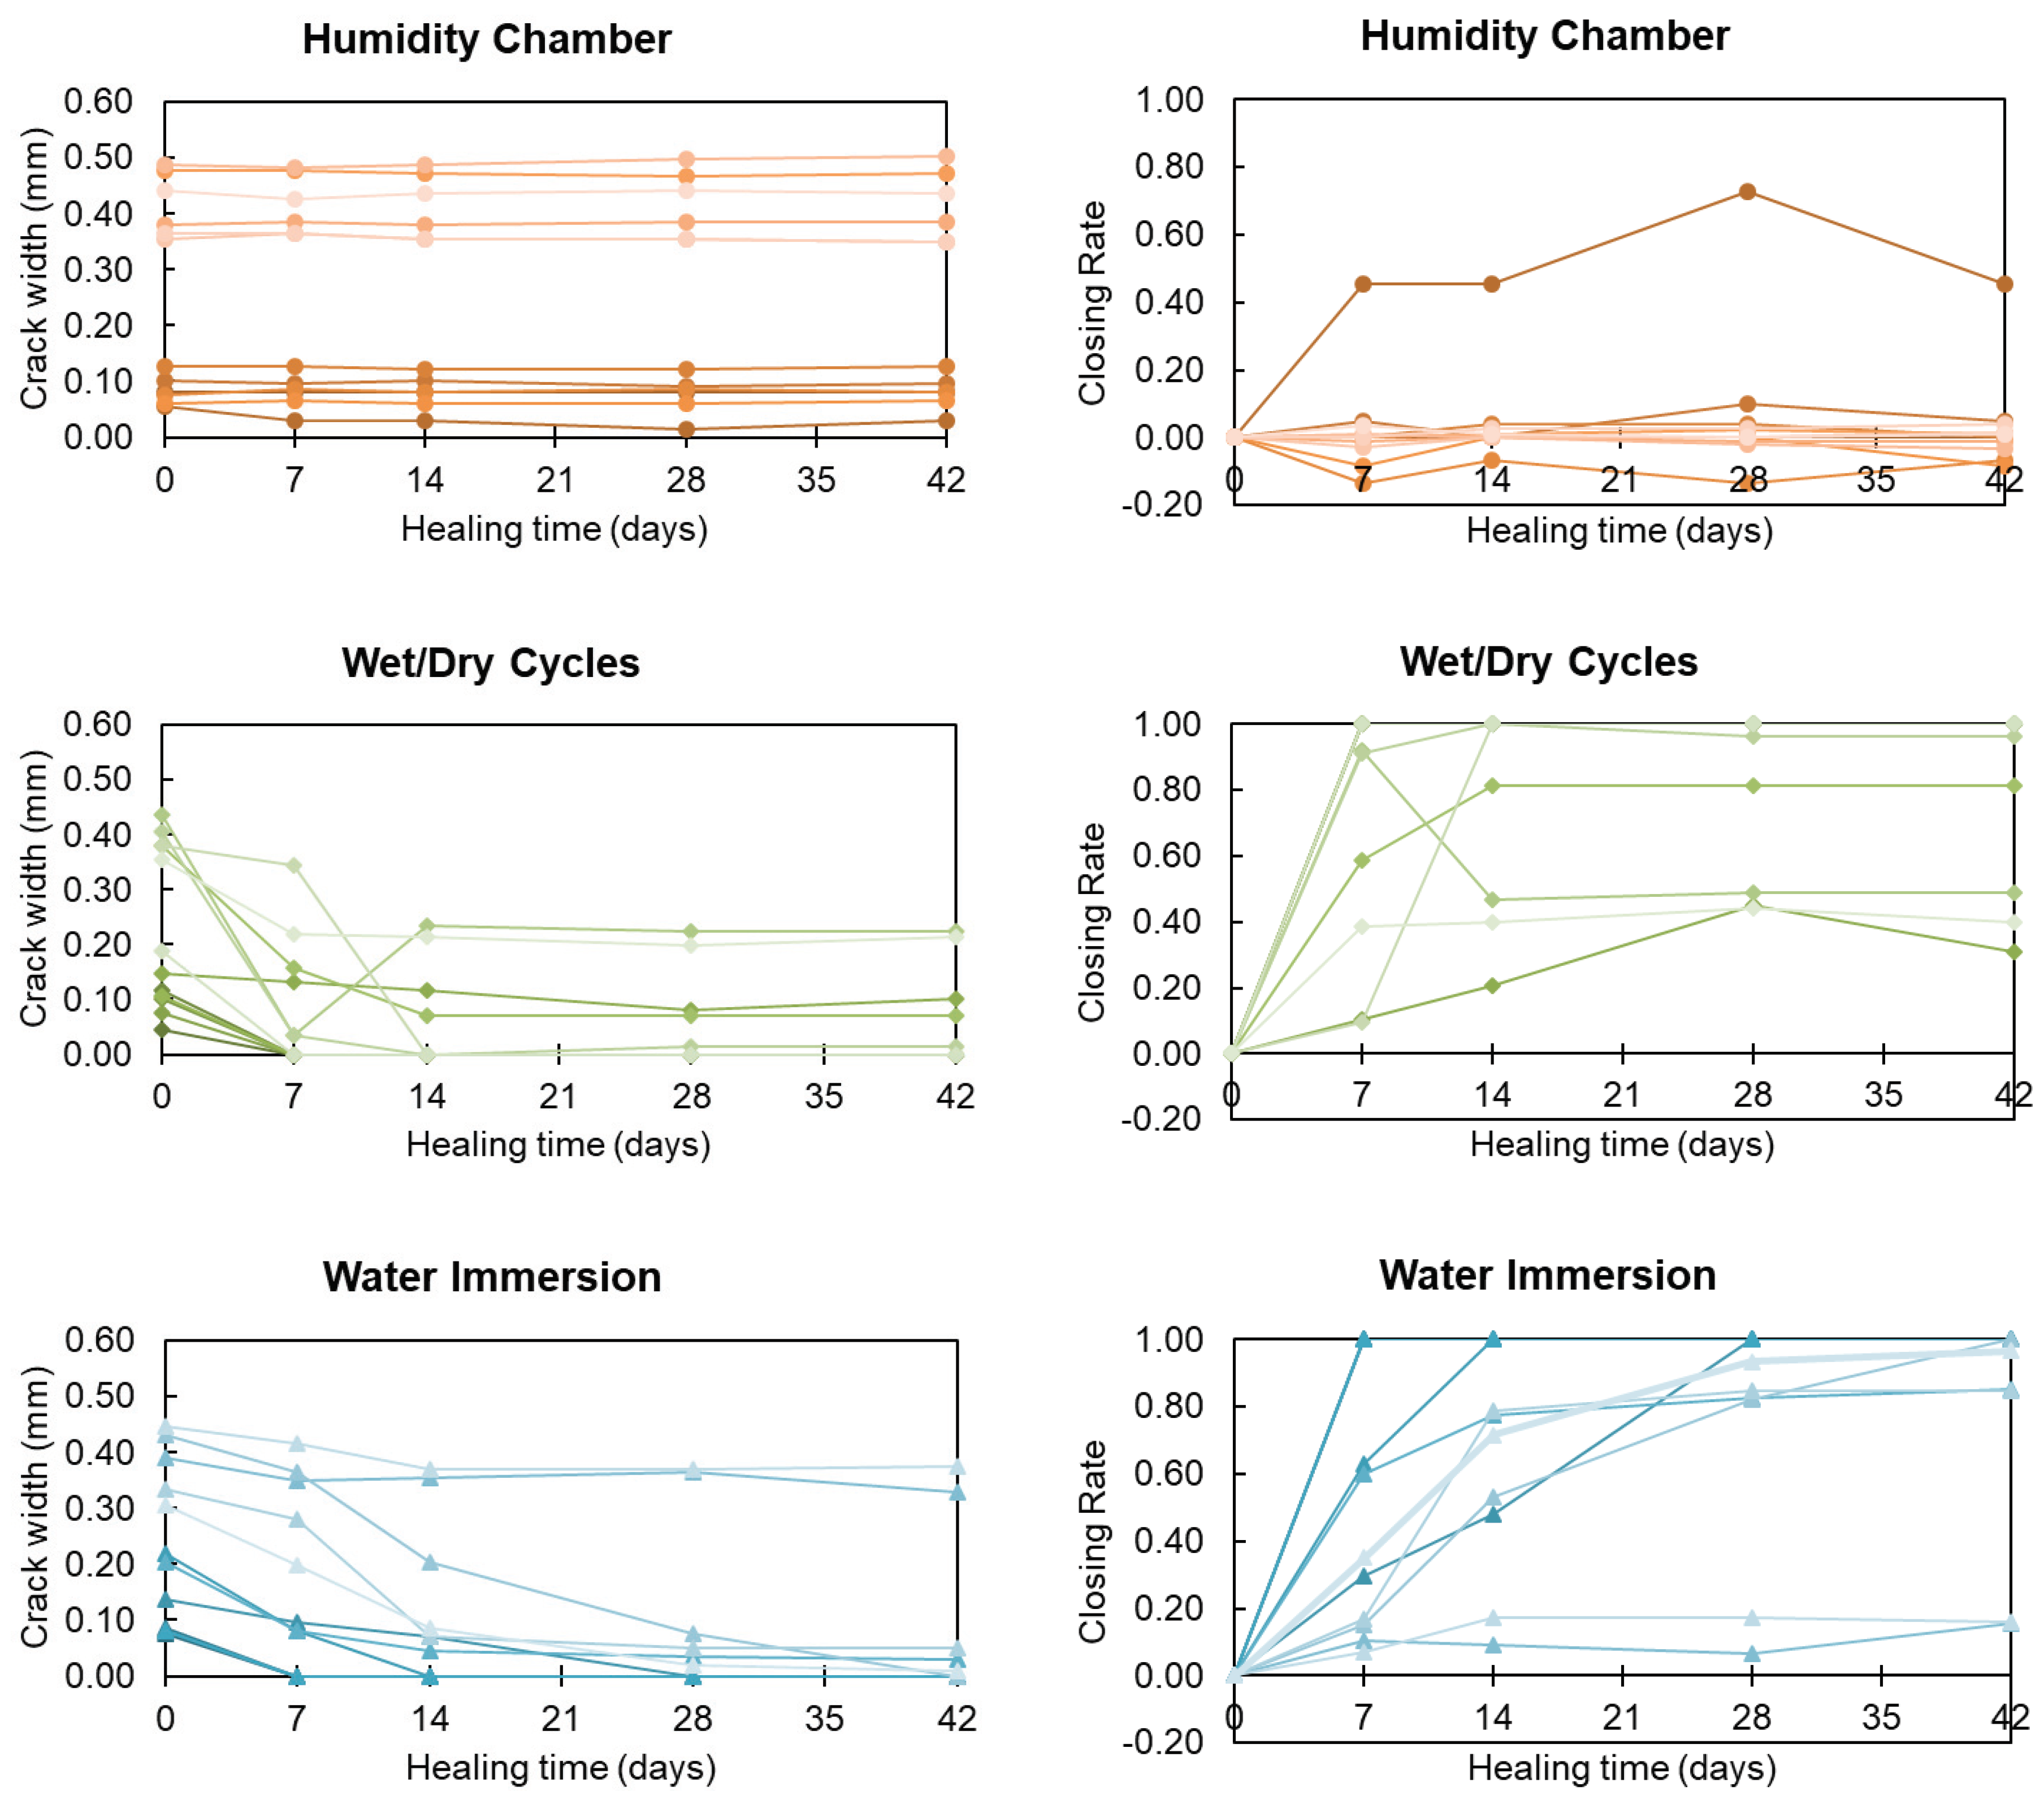
Figure 5 (left column) shows the evolution of crack closing for the 12 cracks that were analyzed for each of the three different exposures: top row for the humidity chamber, middle row for wet/dry cycles, and bottom row for water immersion.
The results show that cracks stored in the humidity chamber had stable behavior, showing that this condition did not produce precipitates in the cracks, and the variations of crack width were produced by the error in the measures. Specimens healed under wet/dry cycles showed a quick formation of precipitates in the crack up to 14 days but stabilized afterwards. Conversely, specimens which healed under water immersion experienced decreases of crack width by the formation of the precipitates even after that time. Cracks with widths over 0.42–0.45 mm were too large to start the formation of precipitates and the process of closing the crack even under water immersion.
One of the cracks exposed to wet/dry cycles experienced a certain reopening between the measurements taken at the seventh and 14th days of healing. This result was produced by the separation of some of the precipitates closing the crack, which could have been produced by handling during the processes of introduction and removal from water. This fact suggests that the precipitates formed during the first days of healing may be not strongly attached to the matrix.
The right column of Figure 5 shows the same results as calculated using the crack closing rate defined in Equation (1). In this case, the results showed some dispersion for the case of the specimens healed in a humidity chamber for one specimen, but the rest of the values oscillated around 0.00. This dispersion was produced in the crack with the smallest size, because the expression divides two small numbers, and the differences in the measurements exceed the precision of the method. For specimens healing in the wet/dry cycles and in water immersion, the results obtained with this parameter gave the same information as the crack closing evolution.
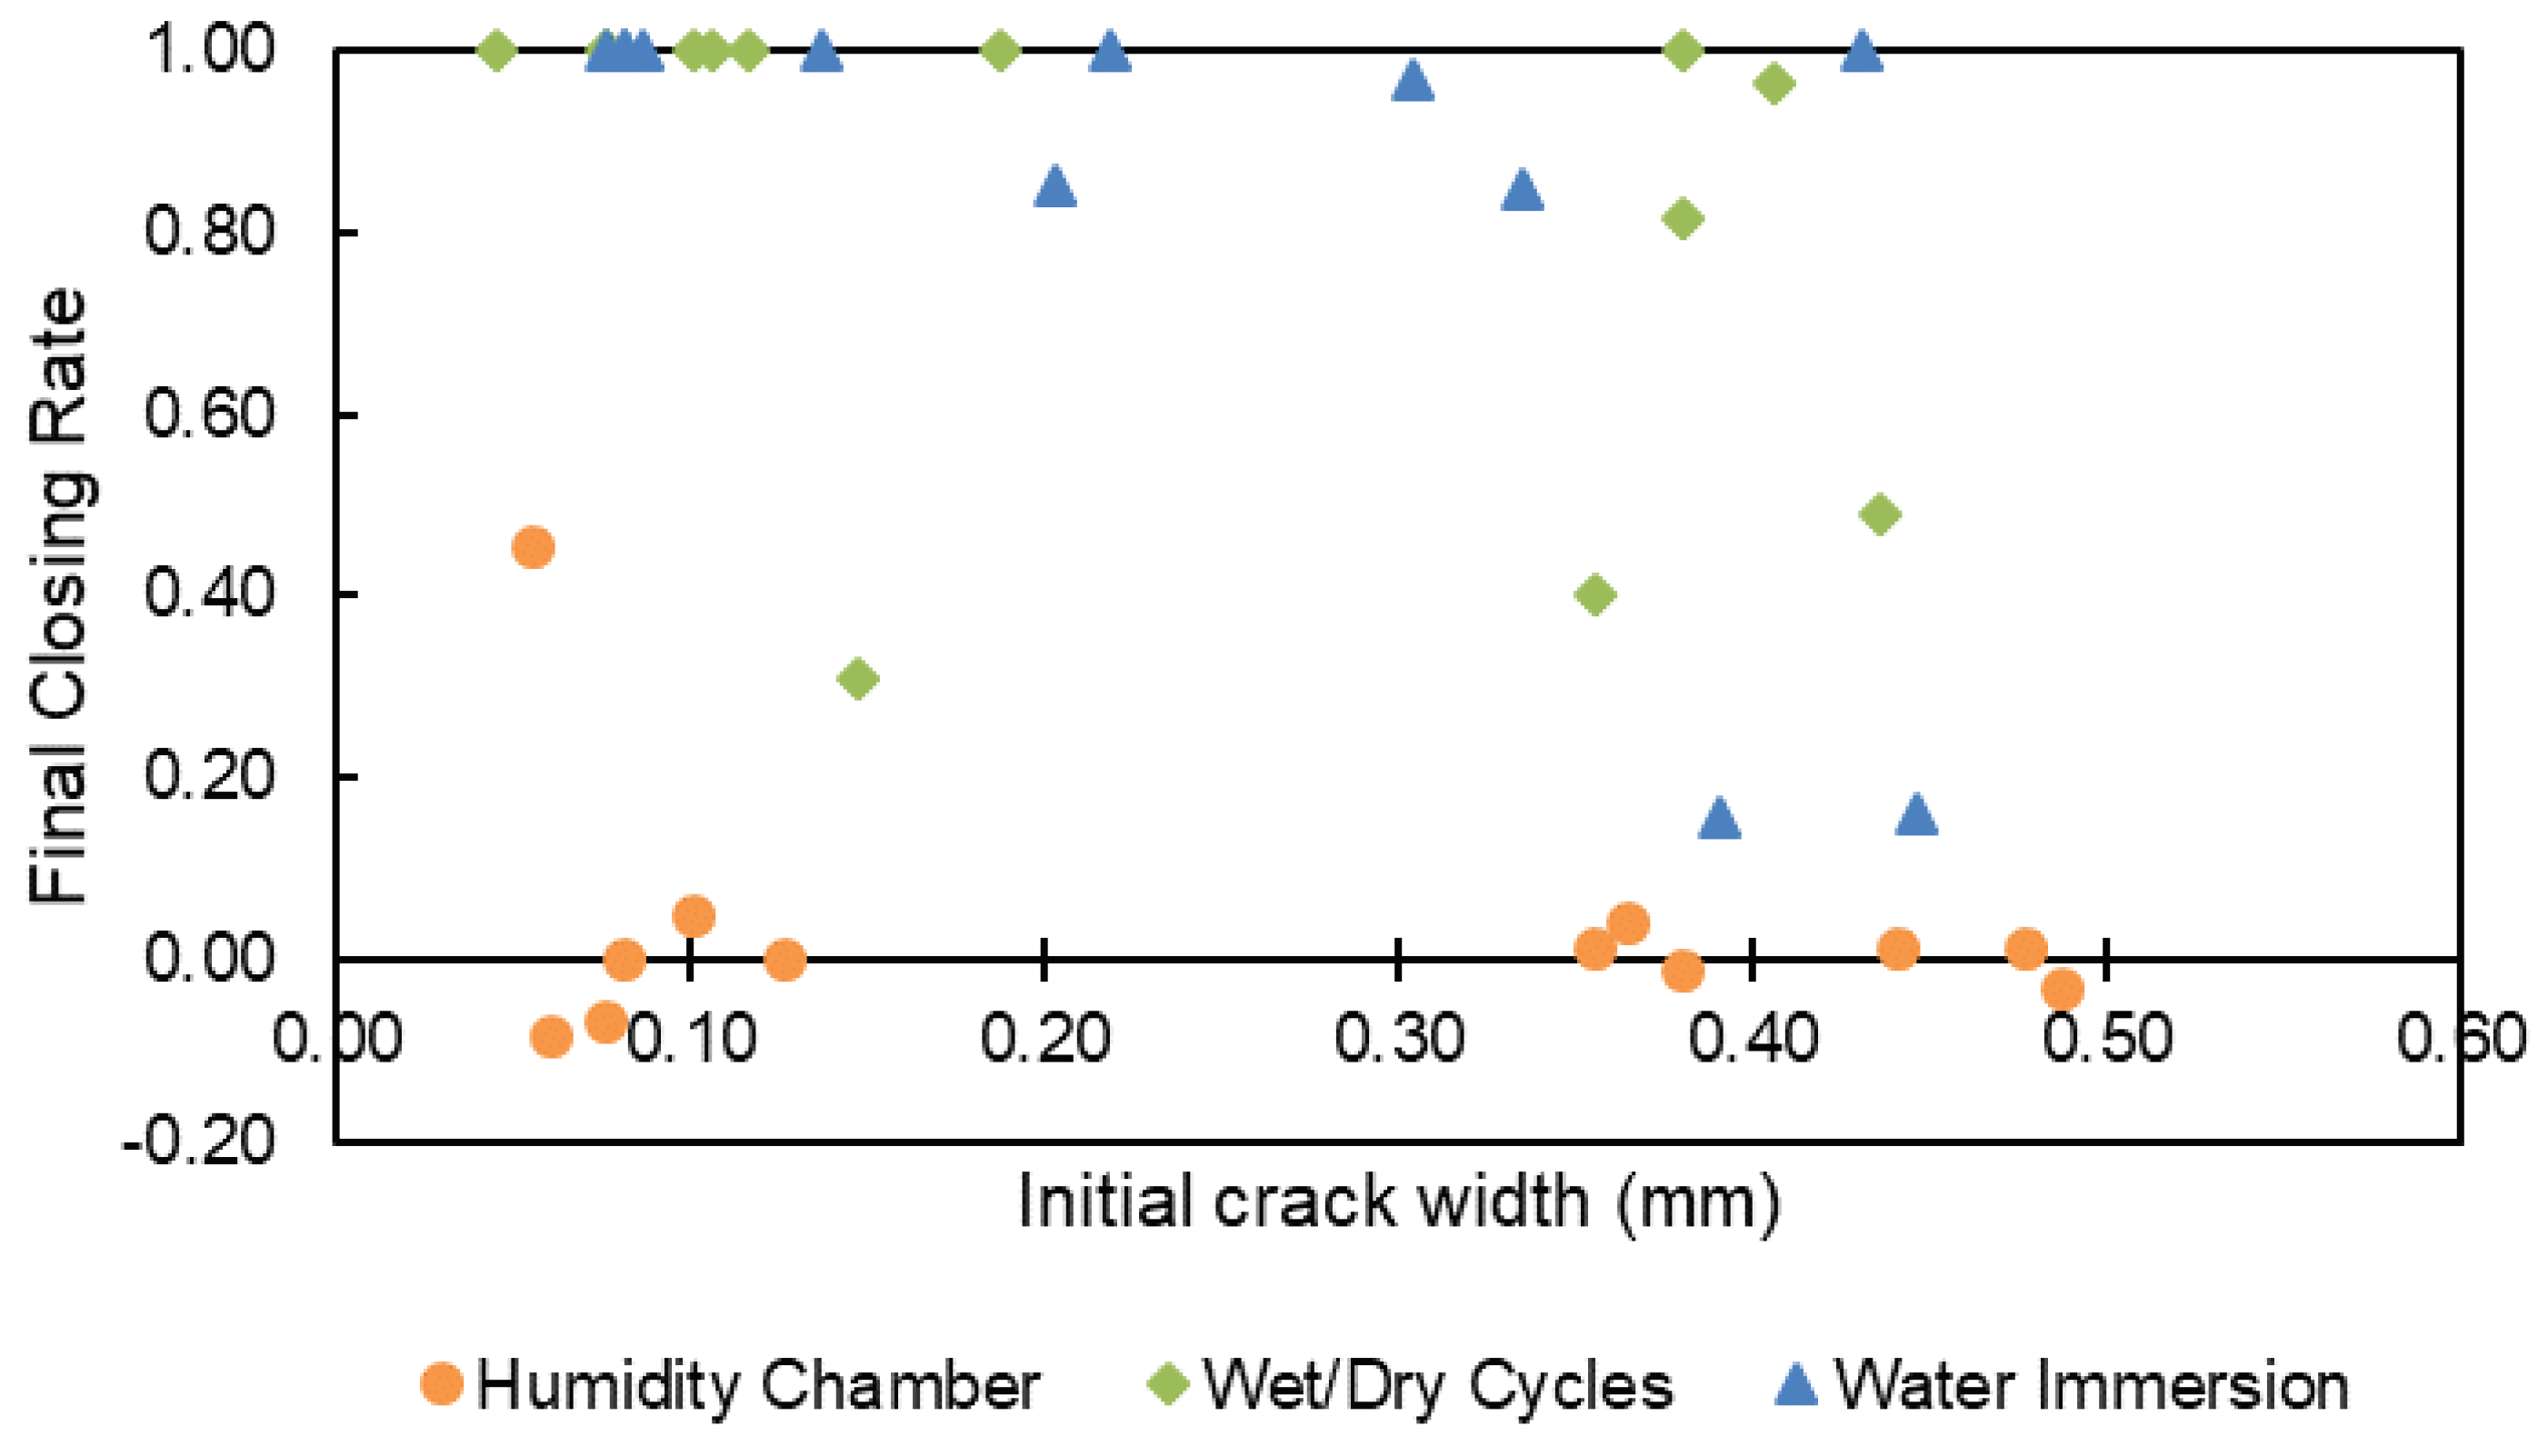
Analyzing the final values of the crack closing rates depending on their initial crack width (Figure 6), it can be confirmed that specimens in the humidity chamber did not heal, independent of their initial crack width, and that they can be used as the control group. Specimens healing under wet/dry cycles and water immersion achieved complete crack closing for cracks under 0.15 mm, and generally good crack closing for cracks between 0.15 and 0.35 mm. However, crack closing drastically decreased for larger cracks.
The result that small cracks self-close more efficiently than larger cracks has already been reported in the literature [4,11,14]. The results do not display a minimum threshold crack width that must be reached so that the water necessary for the reactions can enter more easily, as suggested by other research [19,25]. In [15], however, the authors suggested that this effect tis produced by the precision limits of the method. Similar to the results obtained in [8,9], cracks over 300 μm did not exhibit significant crack closing and are not likely to experience further crack closing even if exposed to water for one year [8].
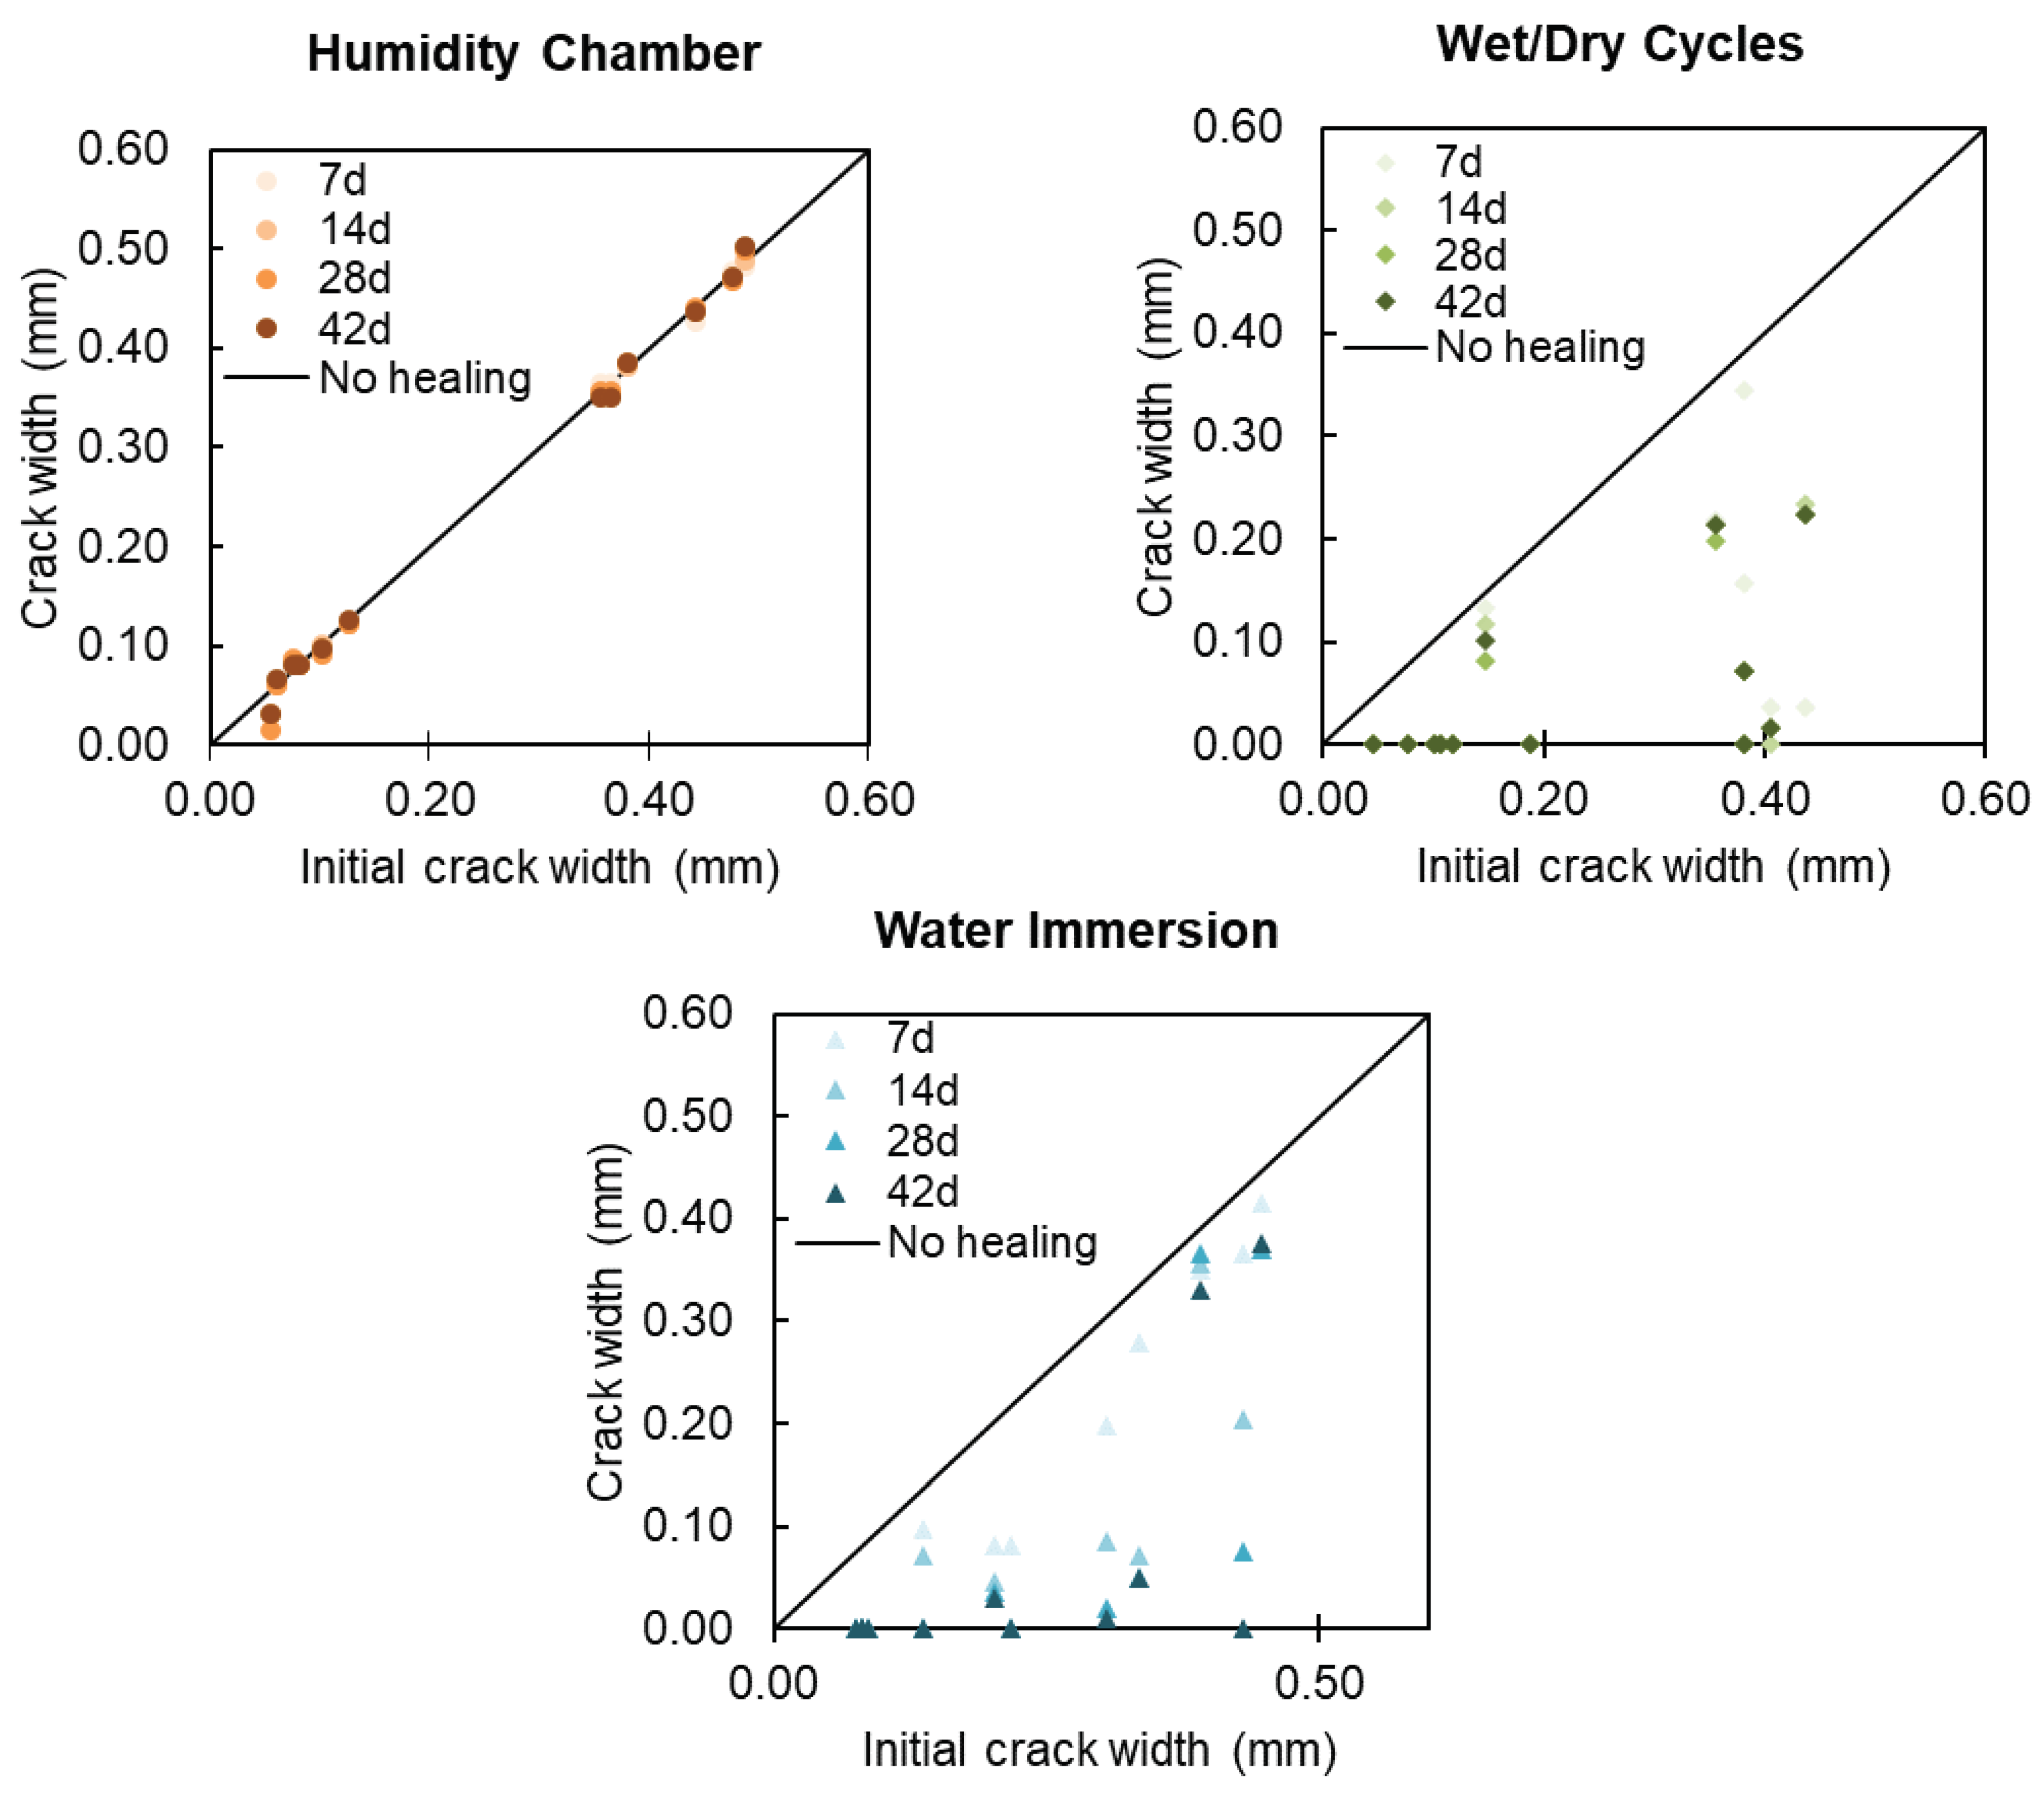
Similar conclusions to those obtained with the crack closing rate can be reached when representing crack width in the vertical axis with respect to the original crack width in the horizontal axis (Figure 7). These graphs show that for specimens healing in the humidity chamber, all the points gather around the bisecting line of “no healing”. In the cases of wet/dry cycles and water immersion, the points are close to the horizontal axis, indicating crack closing.
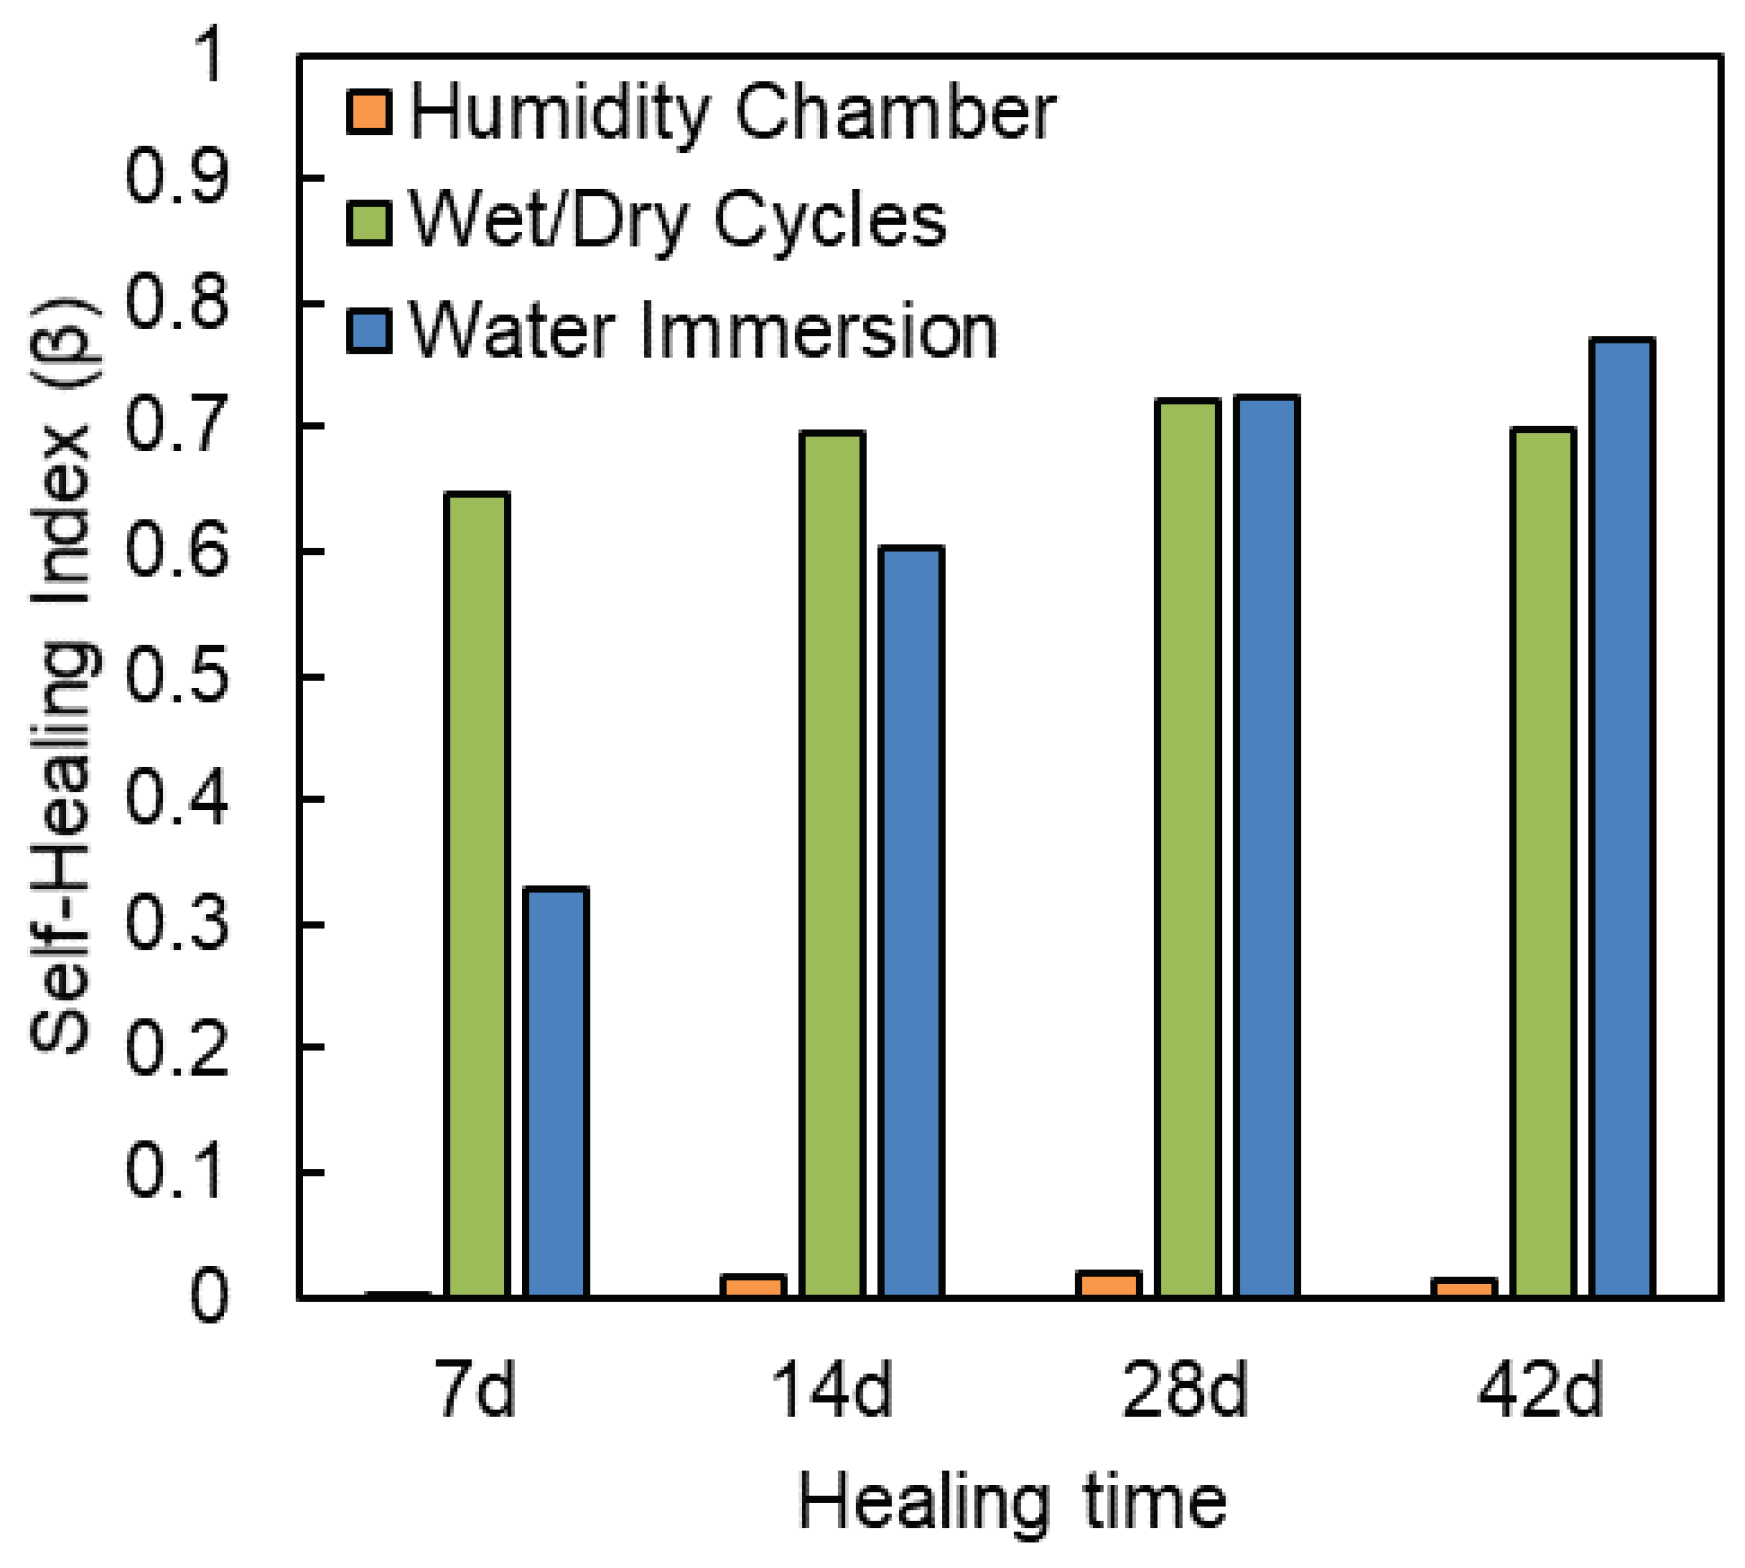
The graphs displayed in Figure 7 are used to calculate the self-healing index of crack closing β, following Equation (2). The results obtained for this self-healing index of crack closing are represented in Figure 8. This graph displays that specimens that healed under wet/dry cycles healed at a considerably higher speed than those specimens healing under water immersion. However, this speed of healing remained at an efficiency of around 65–72%, while in the case of specimens healing under water immersion, their crack closing kept improving even in the step between 28 and 42 days of healing. However, after 42 days of healing under water immersion, the maximum efficiency obtained for this concrete with early-age cracks was only 77%.
Edvardsen [4] has already stated that an efficiency limit should exist for autogenous healing produced by carbonation, due to the two-phase process explained in Section 1. This result gives some insights to the apparent discrepancies found in the literature regarding which healing condition is better. Some studies found better results for wet/dry cycles compared with continuous water immersion [17,26], and those results seemed contradictory to other results which displayed better behavior for water-immersed specimens [14,15]. This apparent contradiction may be produced by the different evaluation methods and criteria. For example, in [15], the authors used early-age precracking and 42 day healing times, but only analyzed final self-healing, not the evolution with time; and in the case of [14], the results were reported after 1 year of healing. In these two cases, water immersion was reported as better than wet/dry cycles. On the other hand, in [17], the authors suggested that a rapid rate of autogenous healing was produced for the first few cycles of water exposure and lowered after 4–5 cycles, reaching a plateau beyond 10 cycles (which lasted around 10 days). Their results for early-age cracks are consistent with the results of this work. These results could be different for older cracks; for example, in [14], the authors only observed self-healing under water immersion.
The points represented in Figure 7 follow a quadratic-like trend; this is more pronounced in the case of specimens healing under water immersion, but very disperse in the case of wet/dry cycles. This type of trend suggests two key points: a) that the maximum completely healable crack width (with 100% of crack closing) can be obtained in the point where the trend intersects with the horizontal axis, and b) there is a value of crack width for which autogenous healing is not feasible, which would be obtained at the point where the trend intersects the bisecting line that indicates “no healing”.
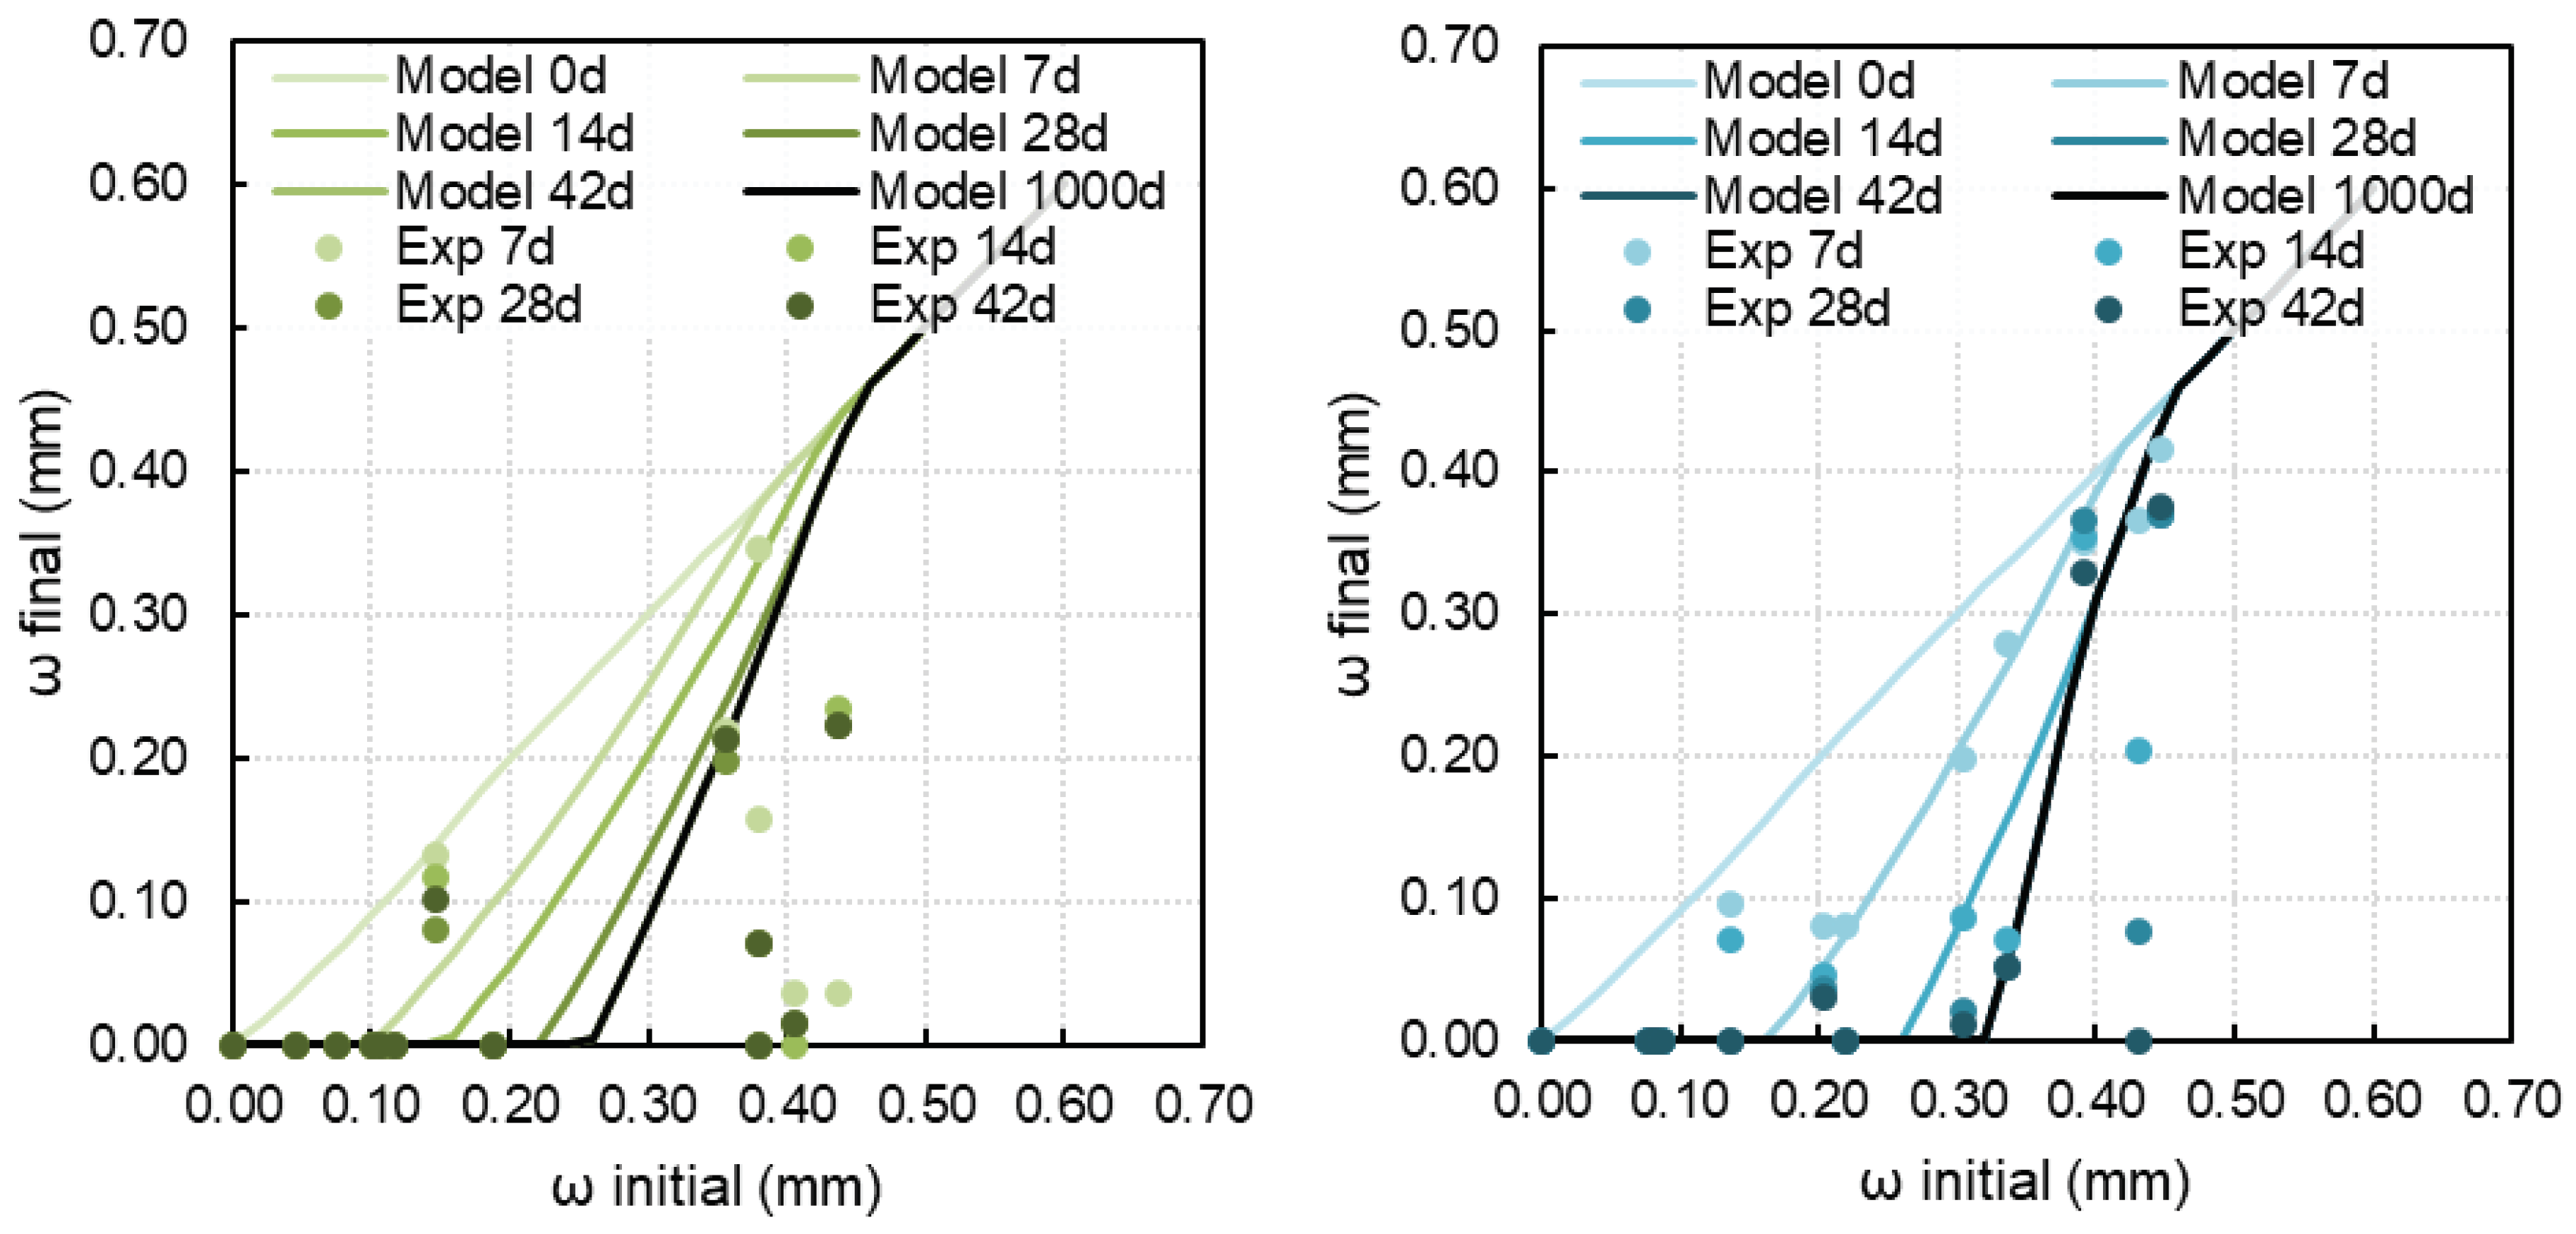
This study proposes a preliminary model to estimate the self-healing produced in concrete in terms of crack closing. This model should be able to estimate the final remaining crack width y for a crack of size x, after a healing time t. To this end, Equation (3) is proposed, with y being a quadratic equation of x, and also being affected potentially by t through the parameters a and c, shown in Equations (4) and (5). This equation guarantees that for t = 0, the resulting equation is the bisecting line (that is, no healing).
where
Y = min { y (t − 1); max { 0; a ∗ x2 + b ∗ x − c }}
a = β ∗ mt
c = λ ∗ tn
These parameters where calculated for the WD and WI conditions, respectively, by minimizing the least squares error (LSE) of the equations with the experimental results of this work. Three out of these five parameters were very similar in the two groups and thus were fixed as a local mix-setup parameter using the average of the values obtained for WD and WI. Afterwards, the model was run again to adjust the fitting as much as possible. This allowed us to obtain an optimized model with only two parameters that depend on the healing conditions. After obtaining this local optimization, the conditions were removed to run the optimizing tool again, and the three parameters fixed remained unchanged. Table 2 shows the values obtained for the five model parameters, displaying in grey the fixed values. The LSE value for the WD group was 4.503 and the value for the WI group was 1.300; that is, those specimens under water immersion showed a better fit to the model.
The curves obtained with these models are represented in Figure 9, for specimens healing under wet/dry cycles and specimens healing under water immersion. In both cases, there is a maximum crack width for which no crack closing happens by autogenous healing, and that limit can be considered to be a crack width over 0.45 mm. Additionally, it is clear that the size of the completely “healable” crack, for which 100% of crack closing is obtained, increases with time, and the size of a “healable” crack is higher when specimens heal underwater. For instance, in specimens healing in the wet/dry cycle conditions, only cracks of 0.10 mm can heal completely after 7 days, while this value increases to 0.16 mm under water immersion conditions. Similarly, after 42 days of healing, in the WD conditions, only cracks of 0.25 mm can be expected to show complete crack closing, while in the case of WI, this may happen for cracks up to 0.32 mm. Additionally, the model shows no significant differences between healing for 28 and 42 days; in fact, the same happens for the points of the model corresponding to specimens healing during 1000 days. These results also show that WD conditions obtain faster self-healing during the first 28 days, but this efficiency is reduced with time. The cracks that benefit more from water immersion conditions as compared to wet/dry cycles conditions are those between 0.25 and 0.32 mm.
The standard error of regression (S) obtained for these models is summarized in Table 3. The group under wet/dry cycles had much more disperse values, and the accuracy of the model is not strong. However, in the case of specimens healing under water immersion, smaller S values were obtained, showing more accuracy. The dispersion obtained is around 0.10 mm, which is similar to the dispersion of the experimental results.
3.3. Internal Crack and Carbonation
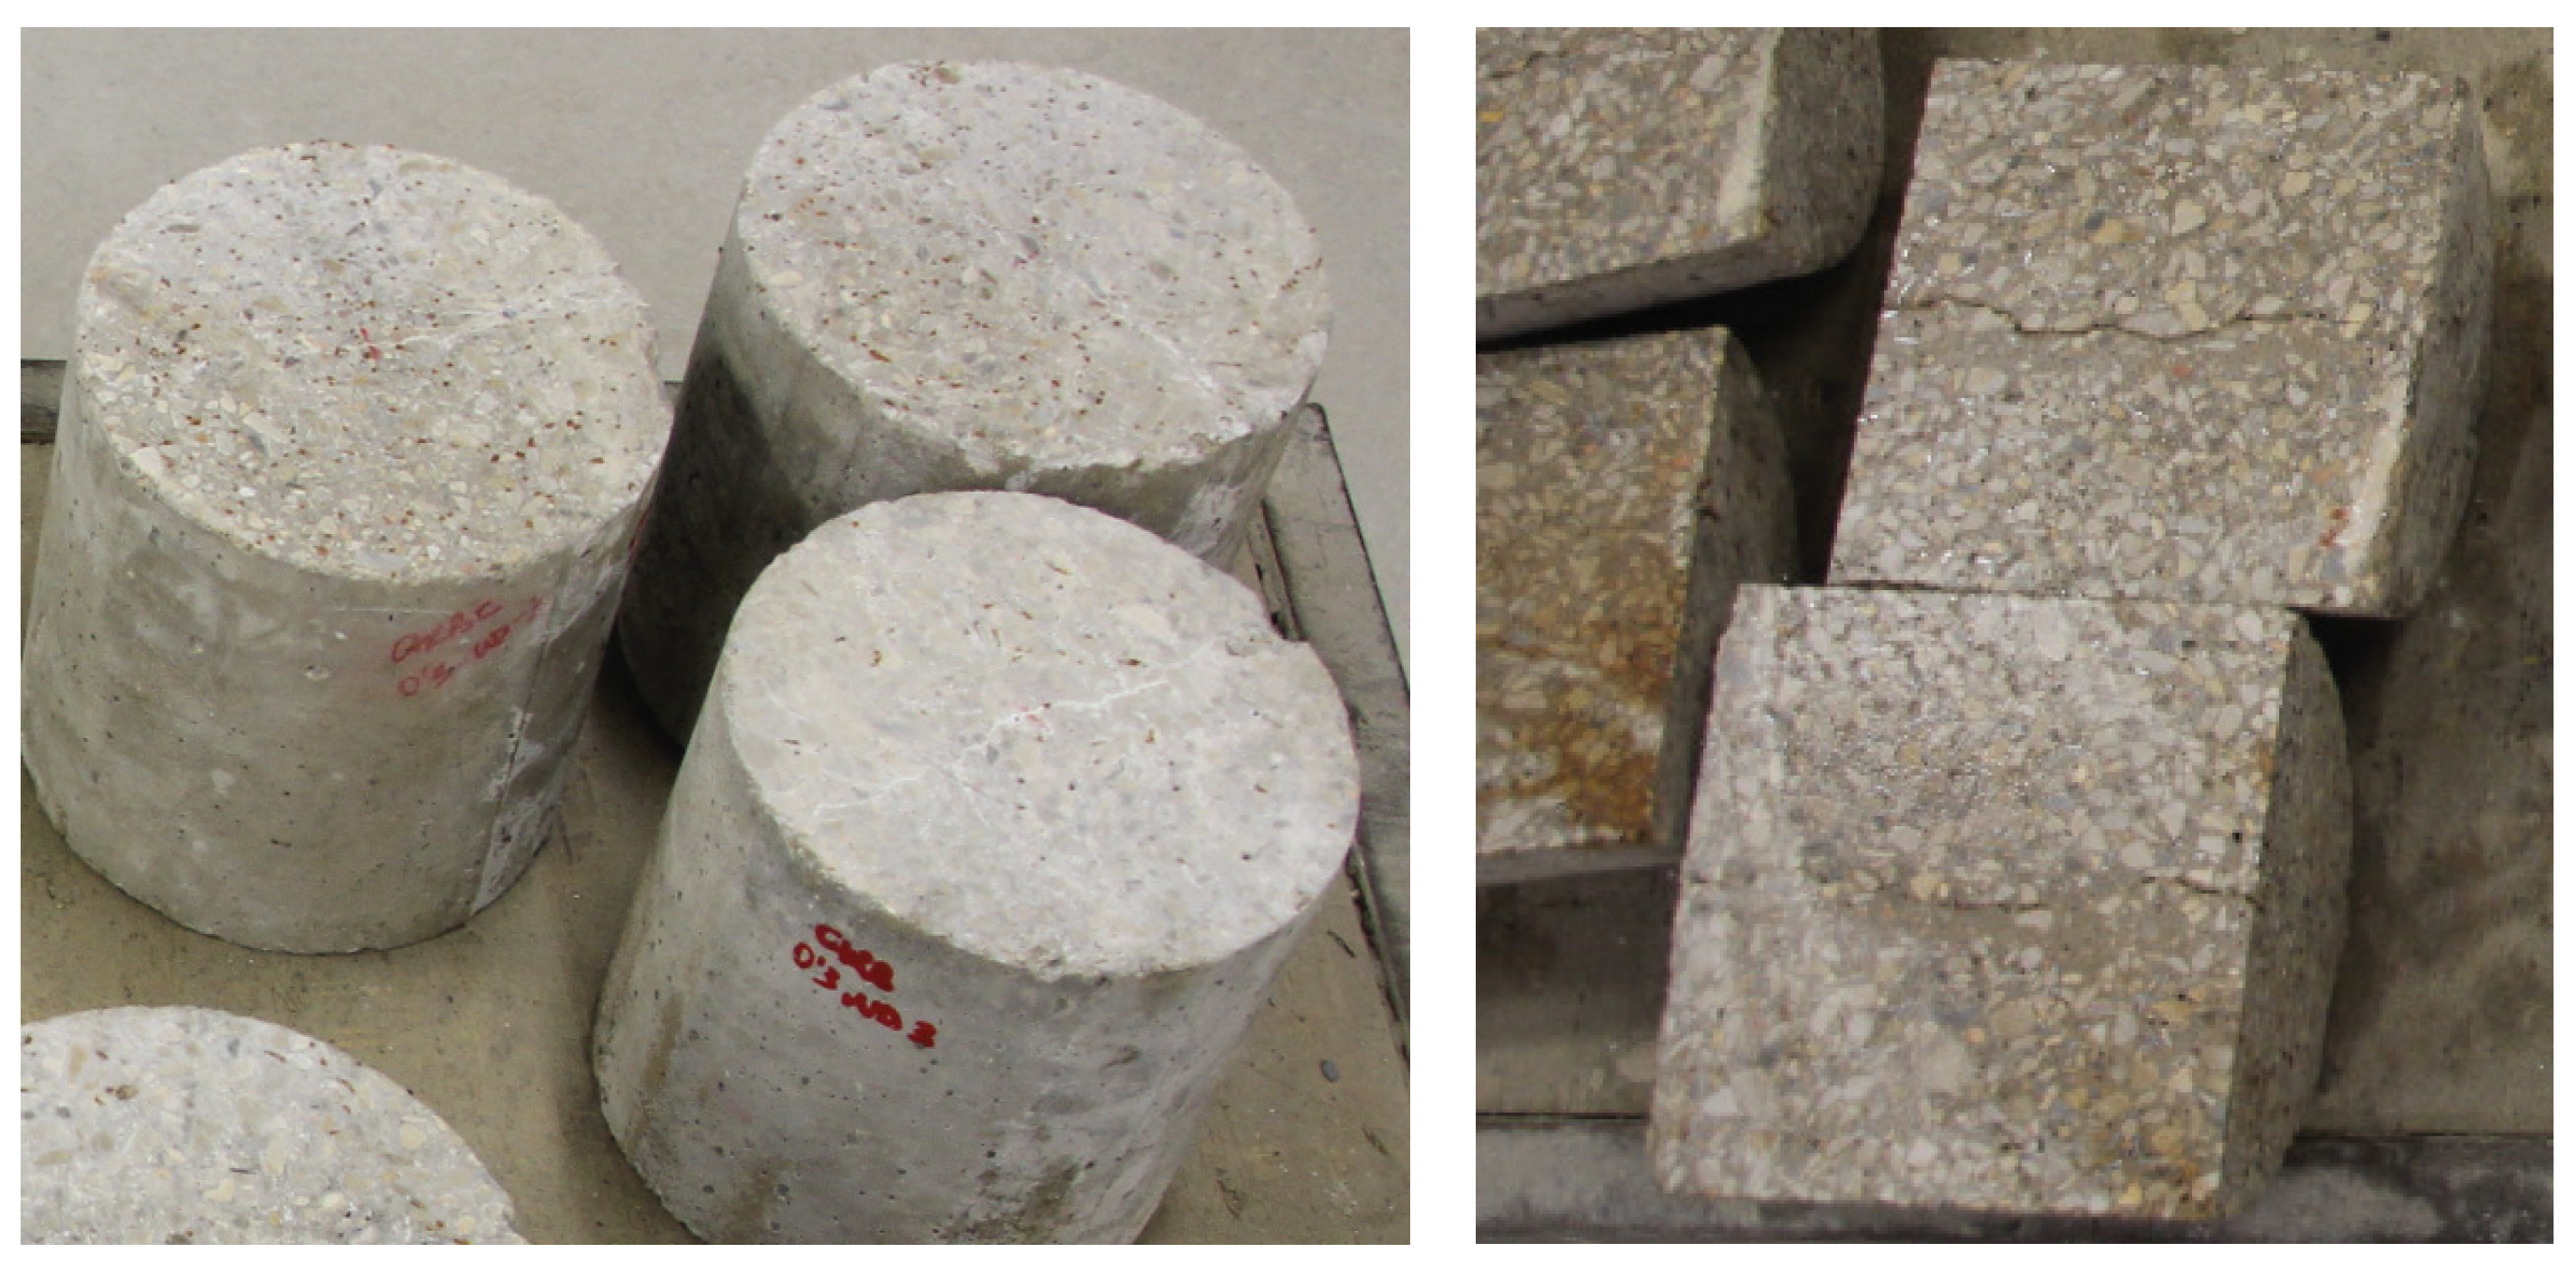
To assess whether crack closing occurred in the interior of the specimens, cuts transversal to the crack plane were performed into the tested cylindrical specimens as detailed in Section 2.4. Figure 10 shows specimens that experienced large cracks with partial healing produced under wet/dry cycles before and after performing the cut.
Figure 10 Left shows the surfaces on which the cracks were completely or partially healed (white precipitates), while after performing the cut (Figure 10 Right), unfilled cracks were visible. In the case of small cracks, they were not easily visible after performing the cut. However, due to the partial alteration of the crack produced during the cut, which implies that particles were loosened, the internal crack width could not be measured accurately for comparison with the surface crack width. This fact introduces questions on how surface and internal crack widths affect the whole process of self-healing and also which evaluation methods are more effective to better quantify self-healing.
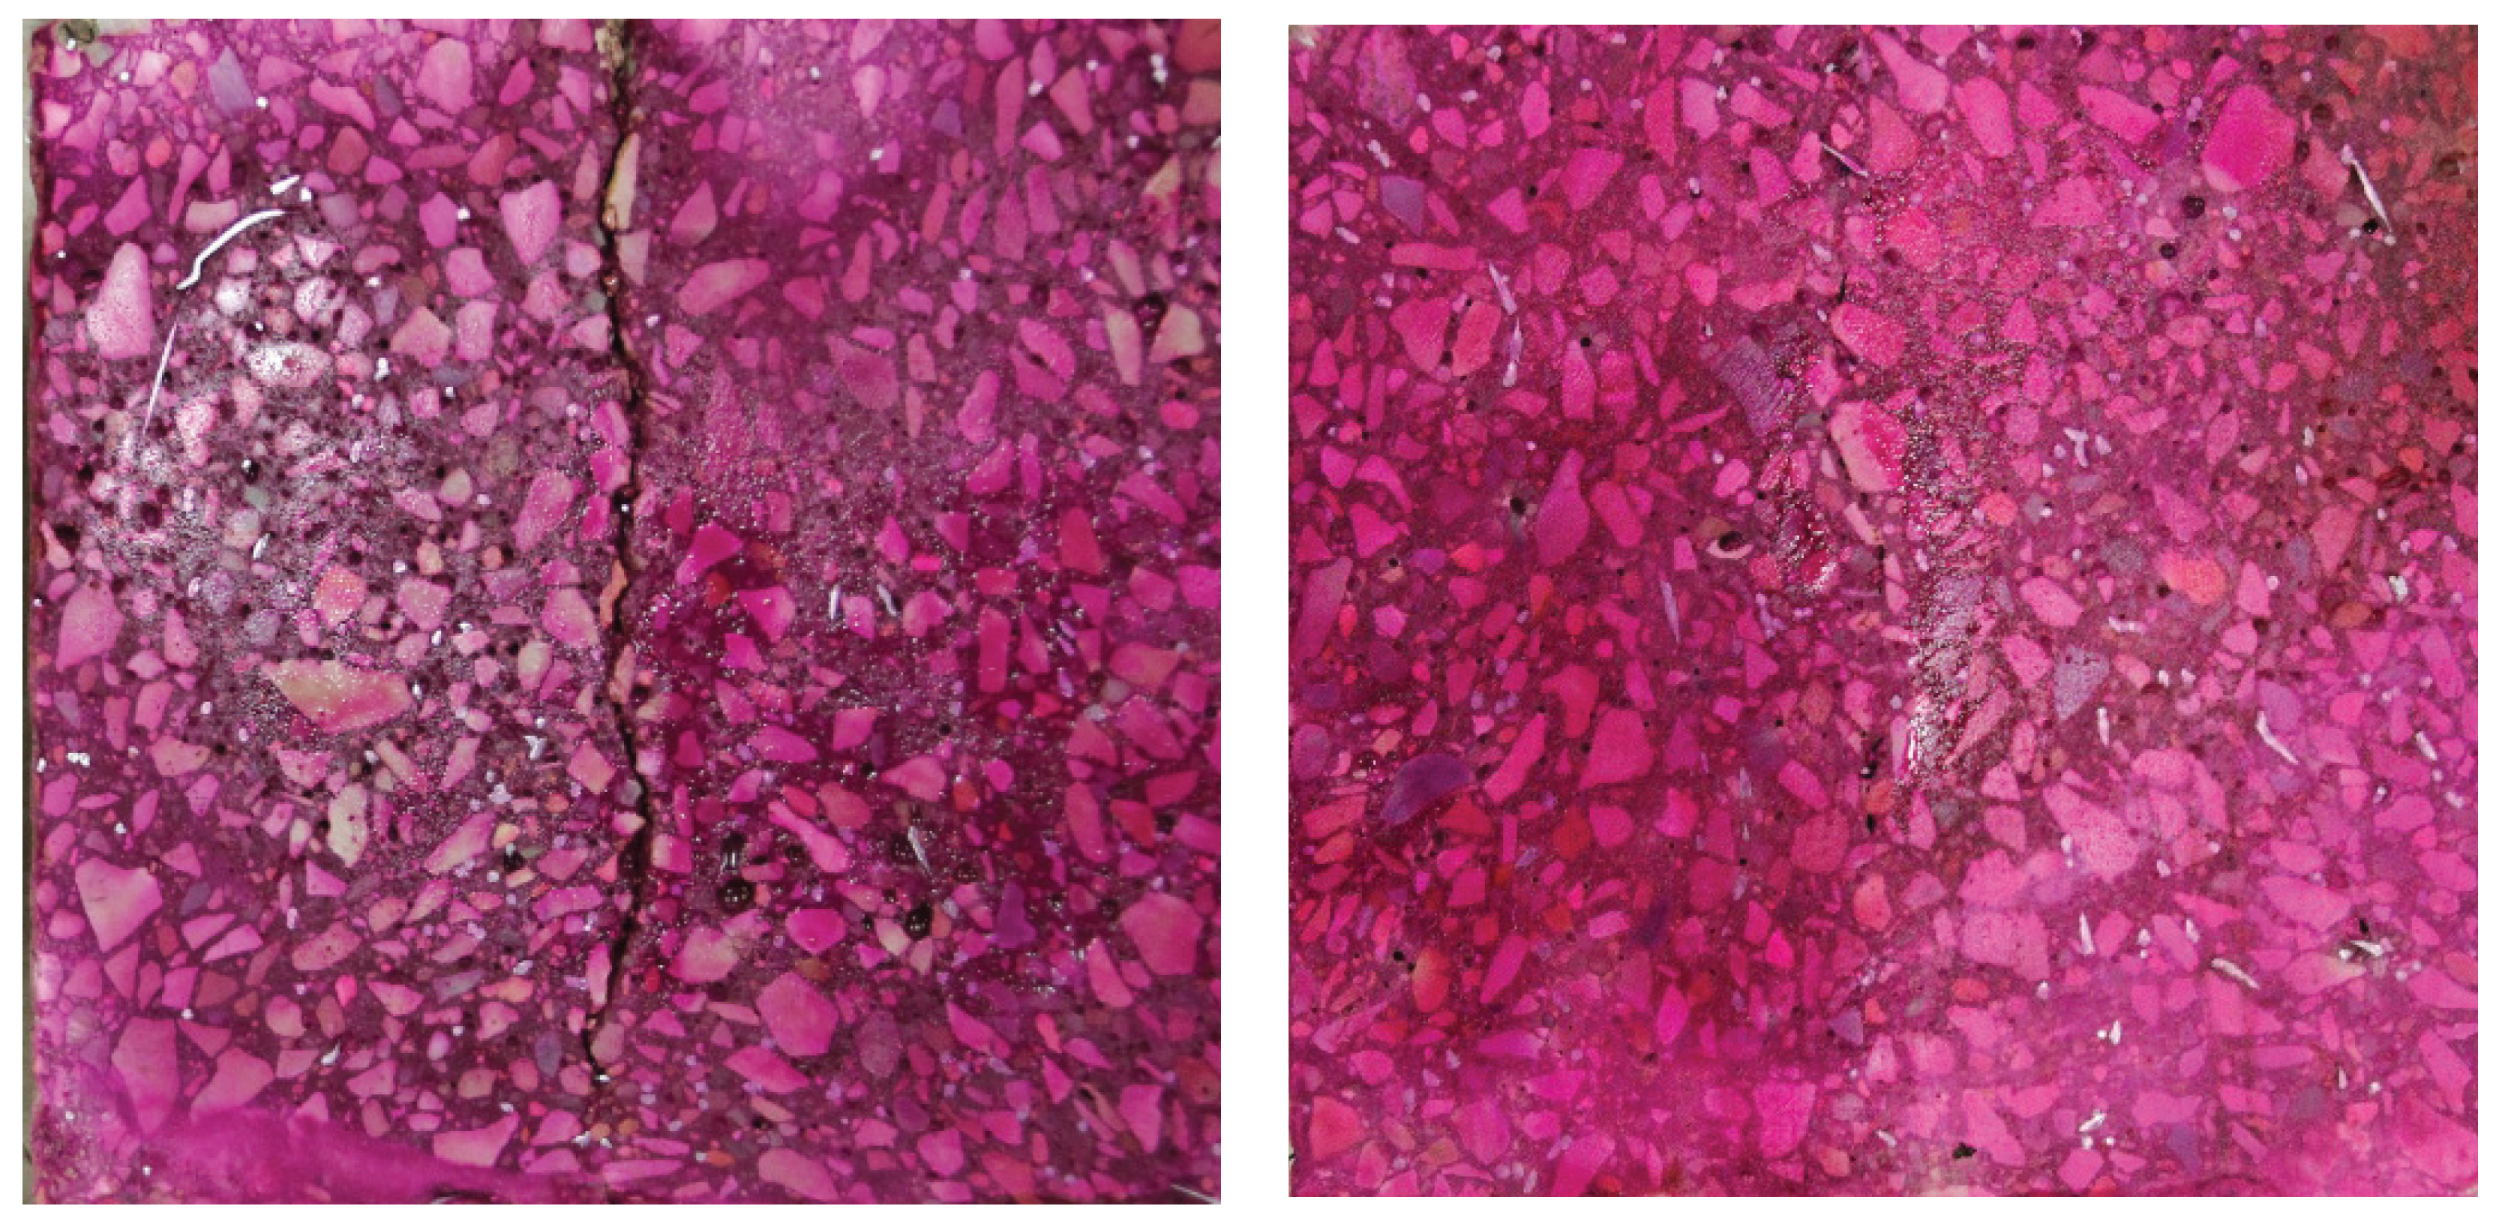
After performing the transversal cut to the cylinders, phenolphthalein was applied to the surface of all cut specimens, and the resulting sections were photographed. The sections obtained showed no coloring differences for cracks of a size around 0.10 mm with respect to cracks of size around 0.40 mm, independently of the healing condition (under water immersion, wet/dry cycles or being stored in humidity chamber). Figure 11 shows the cross section of two specimens with large cracks of size around 0.4 mm as an example; the left picture shows a specimen stored in a humidity chamber, and the right picture shows a specimen healed under wet/dry cycles. Both sections were colored in magenta, indicating surfaces which were not carbonated. However, the beginning of carbonation seems to be present in some parts (top part of the crack in Figure 11 Left), while no indication is found in other areas (bottom part of the crack in Figure 11 Left). It should be noted that the cutting process with the saw may have altered the section or the appearance of precipitates.
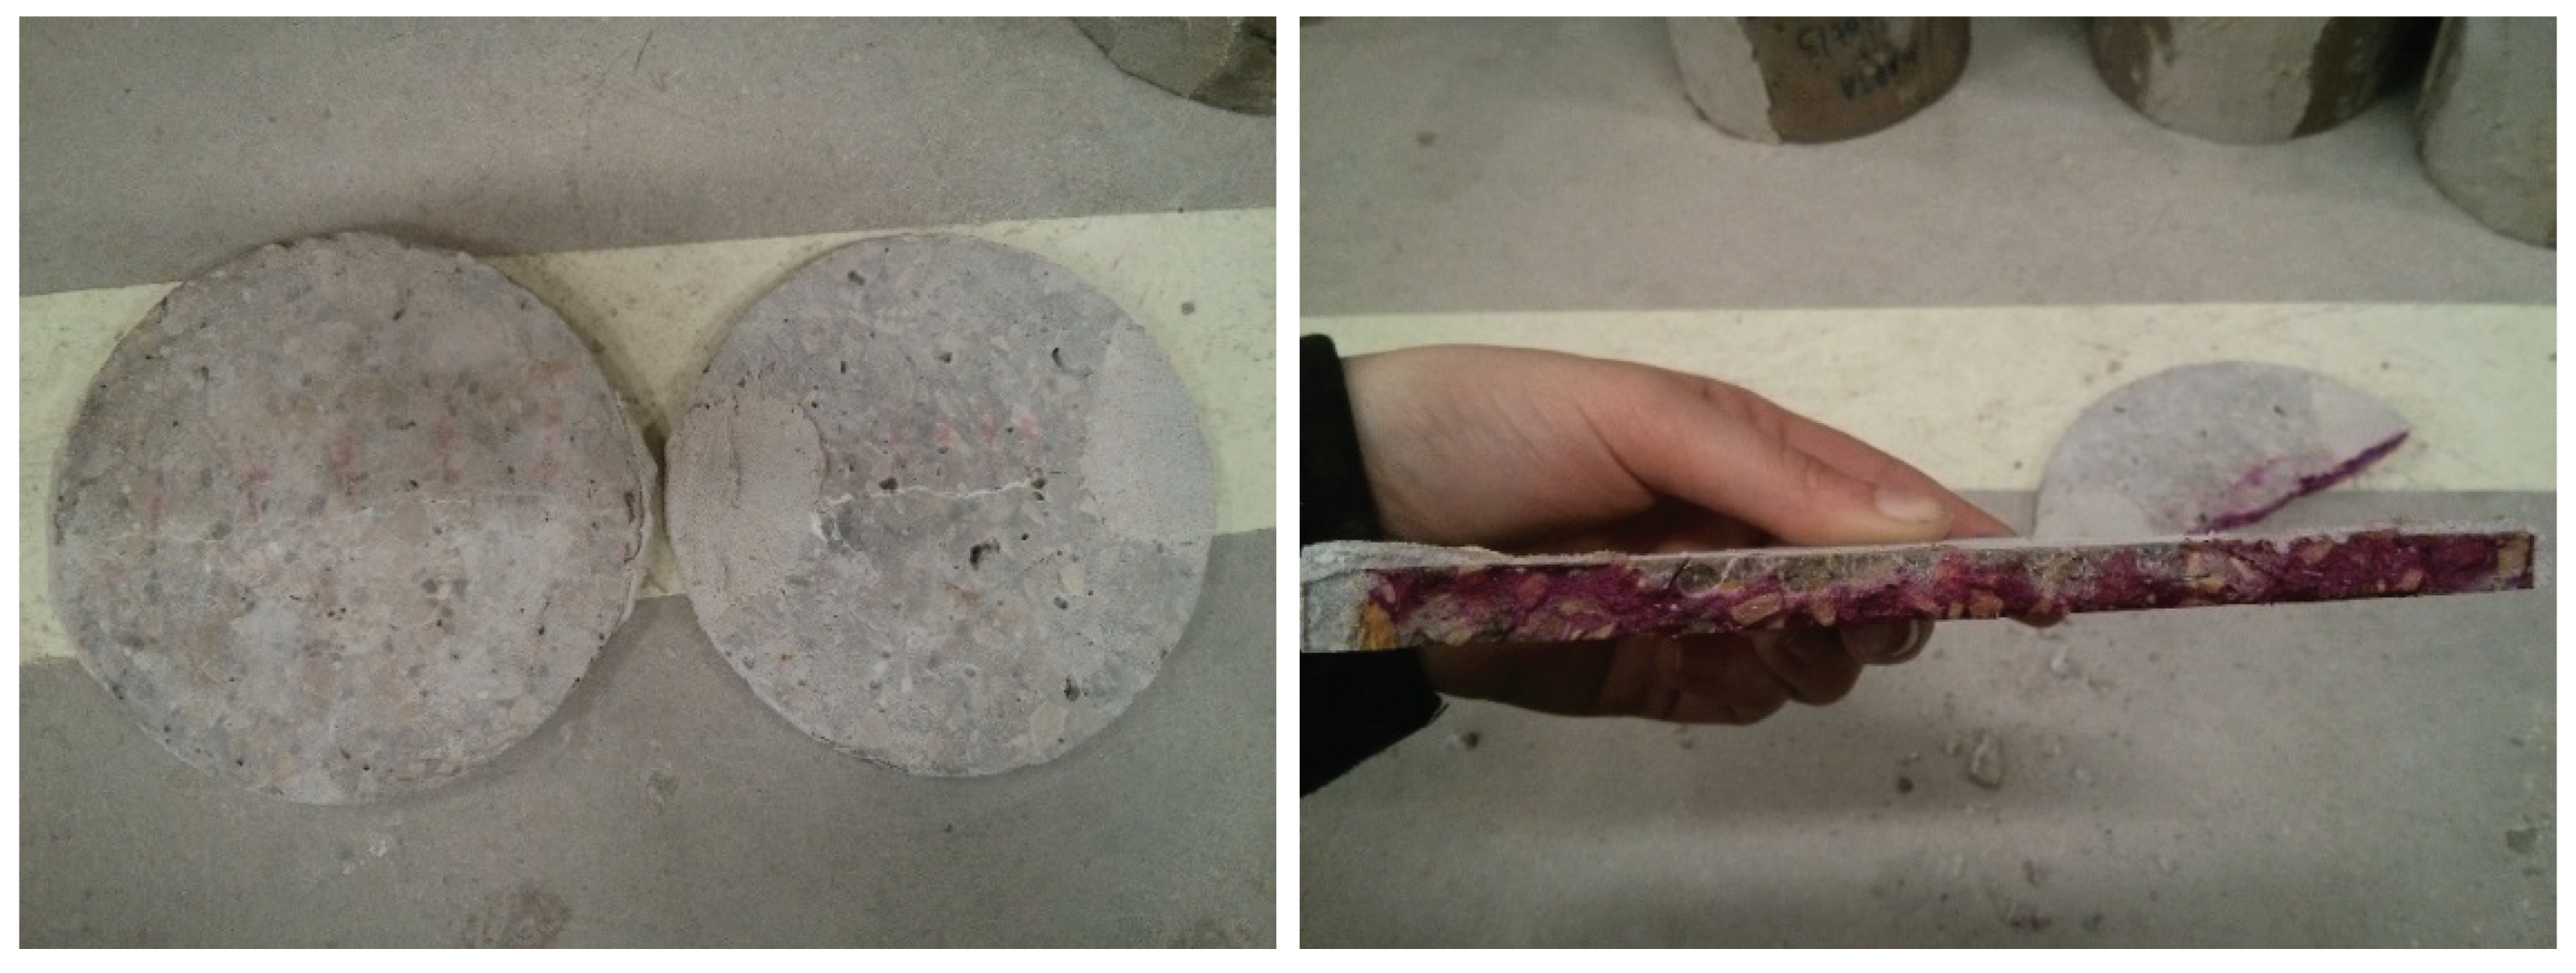
In fact, additional tests carried out in the extra specimens tested from other experimental campaigns [24], which were older and were exposed for a longer time to water immersion conditions (a total of 6 months), showed carbonation in the closest area to the surface (uncolored area in Figure 12), with a depth between 5 and 10 mm for all the disks tested. These results confirm the trend published in [8], in which a maximum crack depth of 0.34 mm from the surface was obtained.
For comparison purposes, other studies performed in uncracked mortars of around 45–50 MPa detected carbonation depths of 3 mm after 120 days [27]. Another study performed in concrete with CEM I and the same water/cement ratio to this study, and thus a similar compressive strength (33 MPa), showed that concrete specimens tested needed 2 years of exposition in outdoor conditions to reach more than 3 mm of carbonation depth; after 6 years, carbonation depth was maintained under 8 mm [28]. These results suggest that carbonation cannot effectively promote the internal autogenous healing of the cracks, and the process detected mainly produces surface depositions that seal the cracks.
4. Conclusions
The objective of this research was to study the crack closing produced by autogenous healing. Two factors were considered: (i) crack sizes of 0.1 mm and 0.4 mm, and (ii) healing conditions of water immersion, a humidity chamber and wet/dry cycles. The conclusions that can be drawn are as follows:
- High humidity environments were not able to produce visible crack closing. Specimens under wet/dry cycles and water immersion achieved complete closing for cracks under 0.15 mm and generally good closing for cracks between 0.15 and 0.35 mm. Crack closing was drastically decreased for larger cracks.
- Specimens under wet/dry cycles healed at a higher speed than those specimens healing under water immersion during the first 7 days of healing. However, the process of healing decreased after 7 days under wet/dry cycles, obtaining a global efficiency of 65–72%. Conversely, under water immersion, crack closing continued after the first 7 days, obtaining a global efficiency of 77% after 42 days of healing.
- A preliminary model was proposed to estimate crack closing in concrete with the purpose of estimating the remaining crack width for a given initial crack. The curves obtained by the model show that the “healable” crack width (with 100% of crack closing) increased with healing time. Healing for 7 days under wet/dry cycles was enough to close cracks of 0.10 mm, while healing for the same time under water immersion was enough to close cracks of 0.16 mm. Similarly, after 42 days of healing, these values increased to 0.25 mm (wet/dry) and 0.32 mm (water immersion). However, cracks over 0.45 mm did not experience autogenous healing under the conditions considered in this work.
- Autogenous healing closed surface cracks, but the cracks remained mostly empty internally. The precipitates formed were calcite and brucite, which are carbonation byproducts, but the visual appearance and phenolphthalein showed that the interior of specimens remained without detectable carbonation.
Author Contributions
Conceptualization, P.S. and M.R.-F.; methodology, P.S. and M.R.-F.; formal analysis, P.S. and M.R.-F.; investigation, P.S. and M.R.-F.; data curation, M.R.-F.; writing—original draft preparation, M.R.-F; writing—review and editing, M.R.-F and P.S.; supervision, P.S. All authors have read and agreed to the published version of the manuscript.
Funding
This research received no external funding.
Acknowledgments
The authors acknowledge in depth discussions on the subject with A. Moragues.
Conflicts of Interest
The authors declare no conflict of interest.
References
- Rooij, M.; van Tittelboom, K.; Belie, N.; Schlangen, E. Self-Healing Phenomena in Cement-Based Materials: State-of-the-Art Report of RILEM Technical Committee; Springer: Dordrecht, The Netherlands, 2013; ISBN 9400766246. [Google Scholar]
- De Belie, N.; Gruyaert, E.; Al-Tabbaa, A.; Antonaci, P.; Baera, C.; Bajare, D.; Darquennes, A.; Davies, R.; Ferrara, L.; Jefferson, T.; et al. A Review of Self-Healing Concrete for Damage Management of Structures. Adv. Mater. Interfaces 2018, 5, 1800074. [Google Scholar] [CrossRef]
- Van Tittelboom, K.; De Belie, N. Self-healing in cementitious materials-a review. Materials (Basel) 2013, 6, 2182–2217. [Google Scholar] [CrossRef] [PubMed] [Green Version]
- Edvardsen, C. Water permeability and autogenous healing of cracks in concrete. ACI Mater. J. 1999, 96, 448–454. [Google Scholar]
- Yuan, L.; Chen, S.; Wang, S.; Huang, Y.; Yang, Q.; Liu, S.; Wang, J.; Du, P.; Cheng, X.; Zhou, Z. Research on the improvement of concrete autogenous self-healing based on the regulation of cement particle size distribution (PSD). Materials (Basel). 2019, 12, 2818. [Google Scholar] [CrossRef] [PubMed] [Green Version]
- Gagné, R.; Argouges, M. A study of the natural self-healing of mortars using air-flow measurements. Mater. Struct. Constr. 2012, 45, 1625–1638. [Google Scholar] [CrossRef]
- Ter Heide, N.; Schlangen, E. Selfhealing of early age cracks in concrete. In Proceedings of the First International Conference on Self Healing Materials, Noordwijk aan Zee, The Netherlands, 18–20 April 2007; pp. 1–12. Available online: http://0-extras-springer-com.brum.beds.ac.uk/2007/978-1-4020-6249-0/documents/69.pdf (accessed on 29 May 2020).
- Suleiman, A.R.; Nehdi, M.L. Effect of environmental exposure on autogenous self-healing of cracked cement-based materials. Cem. Concr. Res. 2018, 111, 197–208. [Google Scholar] [CrossRef]
- Jaroenratanapirom, D.; Sahamitmongkol, R. Self-crack closing ability of mortar with different additives. J. Met. Mater. Miner. 2011, 21, 9–17. [Google Scholar]
- Schlangen, E.; Ter Heide, N.; van Breugel, K. Crack healing of early age cracks in concrete. In Measuring, Monitoring and Modeling Concrete Properties; Springer: Dordrecht, The Netherlands, 2007. [Google Scholar]
- Qian, S.; Zhou, J.; de Rooij, M.R.; Schlangen, E.; Ye, G.; van Breugel, K. Self-healing behavior of strain hardening cementitious composites incorporating local waste materials. Cem. Concr. Compos. 2009, 31, 613–621. [Google Scholar] [CrossRef]
- Yıldırım, G.; Khiavi, A.H.; Yeşilmen, S.; Şahmaran, M. Self-healing performance of aged cementitious composites. Cem. Concr. Compos. 2018, 87, 172–186. [Google Scholar] [CrossRef]
- Rajczakowska, M.; Habermehl-Cwirzen, K.; Hedlund, H.; Cwirzen, A. The Effect of Exposure on the Autogenous Self-Healing of Ordinary Portland Cement Mortars. Materials (Basel) 2019, 12, 3926. [Google Scholar] [CrossRef] [Green Version]
- Fagerlund, G.; Hassanzadeh, M. Self-Healing of Cracks in Concrete Long-Term Exposed to Different Types of Water; Division of Building Materials, LTH, Lund University: Lund, Sweden, 2010; ISBN 4646222442. [Google Scholar]
- Roig-Flores, M.; Pirritano, F.; Serna, P.; Ferrara, L. Effect of crystalline admixtures on the self-healing capability of early-age concrete studied by means of permeability and crack closing tests. Constr. Build. Mater. 2016, 114, 447–457. [Google Scholar] [CrossRef]
- Yang, Y.; Lepech, M.D.; Yang, E.H.; Li, V.C. Autogenous healing of engineered cementitious composites under wet-dry cycles. Cem. Concr. Res. 2009, 39, 382–390. [Google Scholar] [CrossRef]
- Yang, Y.; Yang, E.H.; Li, V.C. Autogenous healing of engineered cementitious composites at early age. Cem. Concr. Res. 2011, 41, 176–183. [Google Scholar] [CrossRef]
- Liu, H.; Huang, H.; Wu, X.; Peng, H.; Li, Z.; Hu, J.; Yu, Q. Effects of external multi-ions and wet-dry cycles in a marine environment on autogenous self-healing of cracks in cement paste. Cem. Concr. Res. 2019, 120, 198–206. [Google Scholar] [CrossRef]
- Van Tittelboom, K.; Gruyaert, E.; Rahier, H.; De Belie, N. Influence of mix composition on the extent of autogenous crack healing by continued hydration or calcium carbonate formation. Constr. Build. Mater. 2012, 37, 349–359. [Google Scholar] [CrossRef]
- Huang, H.; Ye, G.; Damidot, D. Effect of blast furnace slag on self-healing of microcracks in cementitious materials. Cem. Concr. Res. 2014, 60, 68–82. [Google Scholar] [CrossRef]
- Wiktor, V.; Jonkers, H.M. Quantification of crack-healing in novel bacteria-based self-healing concrete. Cem. Concr. Compos. 2011, 33, 763–770. [Google Scholar] [CrossRef]
- Snoeck, D.; De Belie, N. Mechanical and self-healing properties of cementitious composites reinforced with flax and cottonised flax, and compared with polyvinyl alcohol fibres. Biosyst. Eng. 2012, 111, 325–335. [Google Scholar] [CrossRef]
- Ferrara, L.; Van Mullem, T.; Alonso, M.C.; Antonaci, P.; Borg, R.P.; Cuenca, E.; Jefferson, A.; Ng, P.-L.; Peled, A.; Roig-Flores, M.; et al. Experimental characterization of the self-healing capacity of cement based materials and its effects on the material performance: A state of the art report by COST Action SARCOS WG2. Constr. Build. Mater. 2018, 167, 115–142. [Google Scholar] [CrossRef] [Green Version]
- Roig-Flores, M. Self-Healing Concrete: Efficiency Evaluation and Enhancement with Crystalline Admixtures. Ph.D. Thesis, Universitat Politècnica de València, Valencia, Spain, 2018. [Google Scholar]
- Zhong, W.; Yao, W. Influence of damage degree on self-healing of concrete. Constr. Build. Mater. 2008, 22, 1137–1142. [Google Scholar] [CrossRef]
- Sisomphon, K.; Copuroglu, O.; Koenders, E.A.B. Effect of exposure conditions on self healing behavior of strain hardening cementitious composites incorporating various cementitious materials. Constr. Build. Mater. 2013, 42, 217–224. [Google Scholar] [CrossRef]
- Argiz, C.; Menéndez, E.; Moragues, A.; SanjuAn, M.A. Recent advances in coal bottom ash use as a new common Portland cement constituent. Struct. Eng. Int. J. Int. Assoc. Bridg. Struct. Eng. 2014, 24, 503–508. [Google Scholar] [CrossRef]
- Czarnecki, L.; Woyciechowski, P. Concrete carbonation as a limited process and its relevance to concrete cover thickness. ACI Mater. J. 2012, 109, 275–282. [Google Scholar]
Figure 1.
Precracking by splitting test (left) and USB microscope to analyze cracks (right).

Figure 2.
Concept for the evaluation of a global crack closing, following the methods used in [9,19].

Figure 3.
Examples of crack closing evolution for each case studied. HC: humidity chamber; WD: wet/dry cycle; WI: water immersion.
Figure 3.
Examples of crack closing evolution for each case studied. HC: humidity chamber; WD: wet/dry cycle; WI: water immersion.

Figure 4.
Zoom of a specimen with a 0.4 mm crack stored in a humidity chamber for 42 days (left) and detail of crystals formed in a specimen healed in water immersion during 42 days (right).
Figure 4.
Zoom of a specimen with a 0.4 mm crack stored in a humidity chamber for 42 days (left) and detail of crystals formed in a specimen healed in water immersion during 42 days (right).

Figure 5.
Evolution of crack width (left column) and crack closing rate (right) for the three exposures.
Figure 5.
Evolution of crack width (left column) and crack closing rate (right) for the three exposures.

Figure 6.
Final crack closing rate after 42 days of healing depending on the initial crack width.

Figure 7.
Representation of crack width at each healing time considered (vertical axis) compared with the initial crack width (horizontal axis).
Figure 7.
Representation of crack width at each healing time considered (vertical axis) compared with the initial crack width (horizontal axis).

Figure 8.
Self-healing index of crack closing for concrete healing under the three selected conditions.
Figure 8.
Self-healing index of crack closing for concrete healing under the three selected conditions.

Figure 9.
Self-healing models for crack closing by autogenous healing in wet/dry (left) and water immersion conditions (right).
Figure 9.
Self-healing models for crack closing by autogenous healing in wet/dry (left) and water immersion conditions (right).

Figure 10.
Surface cracks healed in specimens with large cracks healing under WD cycles, and internal crack after cutting the cylinder transversally to the crack.
Figure 10.
Surface cracks healed in specimens with large cracks healing under WD cycles, and internal crack after cutting the cylinder transversally to the crack.

Figure 11.
Two examples of tested specimens with the whole section without carbonation. The left picture shows a section of a small crack specimen stored in humidity chamber; the right picture shows a section of a large crack specimen healed in wet/dry cycles.
Figure 11.
Two examples of tested specimens with the whole section without carbonation. The left picture shows a section of a small crack specimen stored in humidity chamber; the right picture shows a section of a large crack specimen healed in wet/dry cycles.

Figure 12.
Sealed disks (left) and broken half of a disk after the phenolphthalein test (right).


Table 1.
Concrete mix proportions and characterization properties.
| Constituent | Quantity (kg/m3) |
|---|---|
| Cement CEM I 42.5 R | 275 |
| Water | 165 |
| Gravel (4–12 mm) | 908 |
| Natural sand | 988 |
| Limestone powder | 50 |
| Superplasticizer | 5 |
| Steel fibers | 40 |
| Slump (mm) | 145 |
| Avg. Compression strength (MPa) | 38.3 |
Table 2.
Model parameters obtained for wet/dry cycles and water immersion.
| WD | WI | |
|---|---|---|
| λ | 0.02176 | |
| β | 1.03393 | |
| ρ | 0.80543 | |
| n | 0.74699 | 1.06304 |
| m | 0.57343 | 1.66690 |
Table 3.
Standard error of regression (S) for all model curves obtained.
| S (mm) | ||||
|---|---|---|---|---|
| 7 Days | 14 Days | 28 Days | 42 Days | |
| WD | 0.186 | 0.191 | 0.162 | 0.157 |
| WI | 0.038 | 0.073 | 0.101 | 0.121 |
© 2020 by the authors. Licensee MDPI, Basel, Switzerland. This article is an open access article distributed under the terms and conditions of the Creative Commons Attribution (CC BY) license (http://creativecommons.org/licenses/by/4.0/).
Share and Cite
MDPI and ACS Style
Roig-Flores, M.; Serna, P. Concrete Early-Age Crack Closing by Autogenous Healing. Sustainability 2020, 12, 4476. https://0-doi-org.brum.beds.ac.uk/10.3390/su12114476
AMA Style
Roig-Flores M, Serna P. Concrete Early-Age Crack Closing by Autogenous Healing. Sustainability. 2020; 12(11):4476. https://0-doi-org.brum.beds.ac.uk/10.3390/su12114476
Chicago/Turabian StyleRoig-Flores, Marta, and Pedro Serna. 2020. "Concrete Early-Age Crack Closing by Autogenous Healing" Sustainability 12, no. 11: 4476. https://0-doi-org.brum.beds.ac.uk/10.3390/su12114476
Note that from the first issue of 2016, this journal uses article numbers instead of page numbers. See further details here.