A Comparative Life Cycle Assessment of Electronic Retail of Household Products


1
Faculty of Environmental Technology, University of Chemistry and Technology Prague, Technická 5, 16000 Prague, Czech Republic
2
Faculty of Architecture, Czech Technical University, 16000 Prague, Czech Republic
*
Author to whom correspondence should be addressed.
Sustainability 2020, 12(11), 4604; https://0-doi-org.brum.beds.ac.uk/10.3390/su12114604
Submission received: 18 May 2020
/
Revised: 1 June 2020
/
Accepted: 1 June 2020
/
Published: 4 June 2020
(This article belongs to the Special Issue Carbon Footprint and Sustainability Assessment)
Abstract
:Electronic shopping is getting more and more popular, and it is not only clothes and electronics that people buy online, but groceries and household products too. Based on real-life data from a major cosmetics and household products retailer in the Czech Republic, this study set to assess the life cycle environmental impact of parcel delivery. Two archetype parcels containing common household and hygiene products were designed and packed in two distinct ways, and the environmental impact was quantified using the Life Cycle Assessment method. It showed that it is environmentally beneficial to use plastic cushions to insulate the goods instead of paper. However, the most important process contributing to the environmental burden was found to be electricity consumption in the logistics center. Hence, the importance of energy efficiency and efficient space utilization was demonstrated on alternative scenarios. Since the cardboard box the goods are packed in turned out to be another important contributor, an alternative scenario was designed where a reusable plastic crate was used instead. Even though the scenario was based on several simplistic assumptions, it showed a clear potential to be environmentally beneficial. In the study, contribution of other processes was scrutinized, as well as sensitivity to variation of parameters, e.g. transportation distances. The main scientific contribution of this work is to show the importance of logistics and distribution of products to end customers in the rapidly developing field of electronic retail of household products.
1. Introduction
The electronic retail is getting an ever bigger market share. More and more people adopt this way of shopping. In the EU, the number of individuals who have purchased goods online grew from 40% in 2010 to 63% in 2019 [1]. While the most prevalent online purchases in the EU are of clothes and sports goods (purchased by 65% of the internet shoppers [1]), the share of people buying food and groceries online more than doubled over the last ten years (from 13% in 2010 to 27% in 2019) [1]. This all means that there were over 87 billion parcels delivered globally and 9.3 billion parcels delivered in Europe in 2018 [2]. With such a massive movement of goods come potentially great environmental consequences. On this scale, even small improvements might bring substantial benefits and vice versa.
In the past years, several authors have set to investigate the environmental impact of e-commerce, usually in comparison to conventional brick-and-mortar shops. For example, Weber et al. [3] compare electronic and traditional retail of flash drives and conclude that the electronic retail results in lower carbon emission, similarly to Edwards et al. [4] or Hischier [5]. Authors often focus on the transportation impact coupled with shopping. Wiese et al. [6] compare the CO2 emission of traditional and online retail of clothing, same as Smidfelt Rosqvist and Winslott Hiselius [7], and Wygonik and Goodchild [8] analyze various scenarios of the last-mile goods movement. The baseline scenarios usually result in similar conclusions: Online shopping leads to reduction in the environmental impact of shopping, mainly through a more efficient delivery to customers. These conclusions are, however, based on often problematic or simplistic assumptions, as explained by van Loon et al. [9]. The main environmental impact of conventional shopping is attributed to passenger car transport, which may vary significantly. Shopping trips are also usually coupled with other purposes [4], and their efficiency depends on the size of the basket [10]. The environmental impact of the transportation in conventional shopping may also be reduced when public transport is used [4]. Were the customers to cycle or walk to the shop, the main burden of conventional shopping disappears. Furthermore, the idealistic scenarios where the parcel delivery is efficient and always successful are unrealistic [4,6,9]. Therefore, neither online shopping nor conventional retail, as such, significantly outcompete the other, it depends on the consumer behavior.
On the other hand, the alleged environmental benefits of online retail are definitely not the main reason why the business is growing so rapidly. Online shopping is here to stay and grow, even were it environmentally destructive. It may be, then, more useful to stop comparing the two ways of shopping, and aim to optimize the whole process of online shopping, especially the packaging which was found to be one of the most significant aspects [11]. Although the manufacturing phase of the product is usually much more resource and energy intensive, reducing the environmental impact of the shopping phase may still be important, especially for the retailers [12]. For many authors, the main question stands: Is it better to use a recyclable cardboard box, or a reusable plastic crate? Levi et al. [13] thus assess packaging and distribution of fruit in Italy, same as Tua et al. [14]. Koskela et al. [12] compare plastic crates and cardboard boxes for bread distribution in Finland. They all come to different conclusions based on how the scenario is designed.
In this paper, the standardized Life Cycle Assessment (LCA) methodology (ISO 14040:2006 and 14044:2006 [15]) is employed to analyze the life cycle of electronic retail of household products, based on data from a major cosmetics and household products retailer dm-drogerie markt Czech Republic. Two real-life packaging systems are compared for two model parcels. Finally, a hypothetical alternative scenario is designed, where reusable plastic crates are used instead of cardboard boxes. The model includes the life cycle of a product from packaging to delivery. The production and transportation of the products up to the packaging phase are excluded, as the scope of the study focuses on the retailer. In this system, the parcels are delivered to one of the brick-and-mortar shops of the retailer, where the customers collect the goods themselves. The last-mile phase, being extremely variable, is omitted from the model.
2. Materials and Methods
A life cycle model of electronic retailing was developed following the ISO standard for Life Cycle Assessment. This section is structured according to the steps of LCA. In the following paragraph are described the details of the systems, data sources, and the assumptions made.
2.1. Goal and Scope
The main goal of this study is to compare two systems of parcel packaging as well as identifying the main factors contributing to the environmental impact of electronic retail. The LCA models were developed using GaBi 9 software [16], based on real-life data from a major cosmetics and household products retailer in the Czech Republic. To describe the background processes, data from the integrated GaBi Database [17] were used, and, if unavailable, from ecoinvent 3.3 database [18]. Two exemplar parcels were designed and packed into a cardboard box in two distinct ways (photos of the parcels in Appendix A). Additionally, an alternative hypothetical scenario, where reusable plastic crates are used instead of carboard boxes, was designed. The LCA model includes all activities coupled with the retailer, including manufacture and transport of the packaging material, logistics center, and transportation of the parcel. The manufacture phase and primary packaging of the goods and freight transport are excluded up to the moment when the goods are packed into the box. The parcels are eventually delivered to one of the many brick-and-mortar shops of the retailer, where they are collected by a customer. As handling of the online shopping parcels, so far, holds only a marginal role in the activities of the shops, no energy consumption from the shops is assumed to be attributed to the parcel. The last-mile phase is extremely variable, as the mode of transport and distance depends on the customer’s preferences entirely. Although—depending on the often unrealistic assumptions [9]—the customer transport might lead to a dominant fraction of the environmental burden of shopping, including the last-mile transport, would shape the results disproportionally, as the scope of this study is mainly on activities of the retailer. The end-of-life phase of the packaging materials is modelled based on common waste management in the Czech Republic.
The functional unit was designed as “delivery of one parcel”. There are two kinds of model parcels containing similar products that are directly comparable. Parcels no. 1 and no. 2 contain similar products but are packed in a distinct way, and the same stands for parcels no. 3 and no. 4. For each of the four scenarios, an alternative was designed where a reusable plastic crate is used instead of cardboard box.
2.2. Life Cycle Inventory
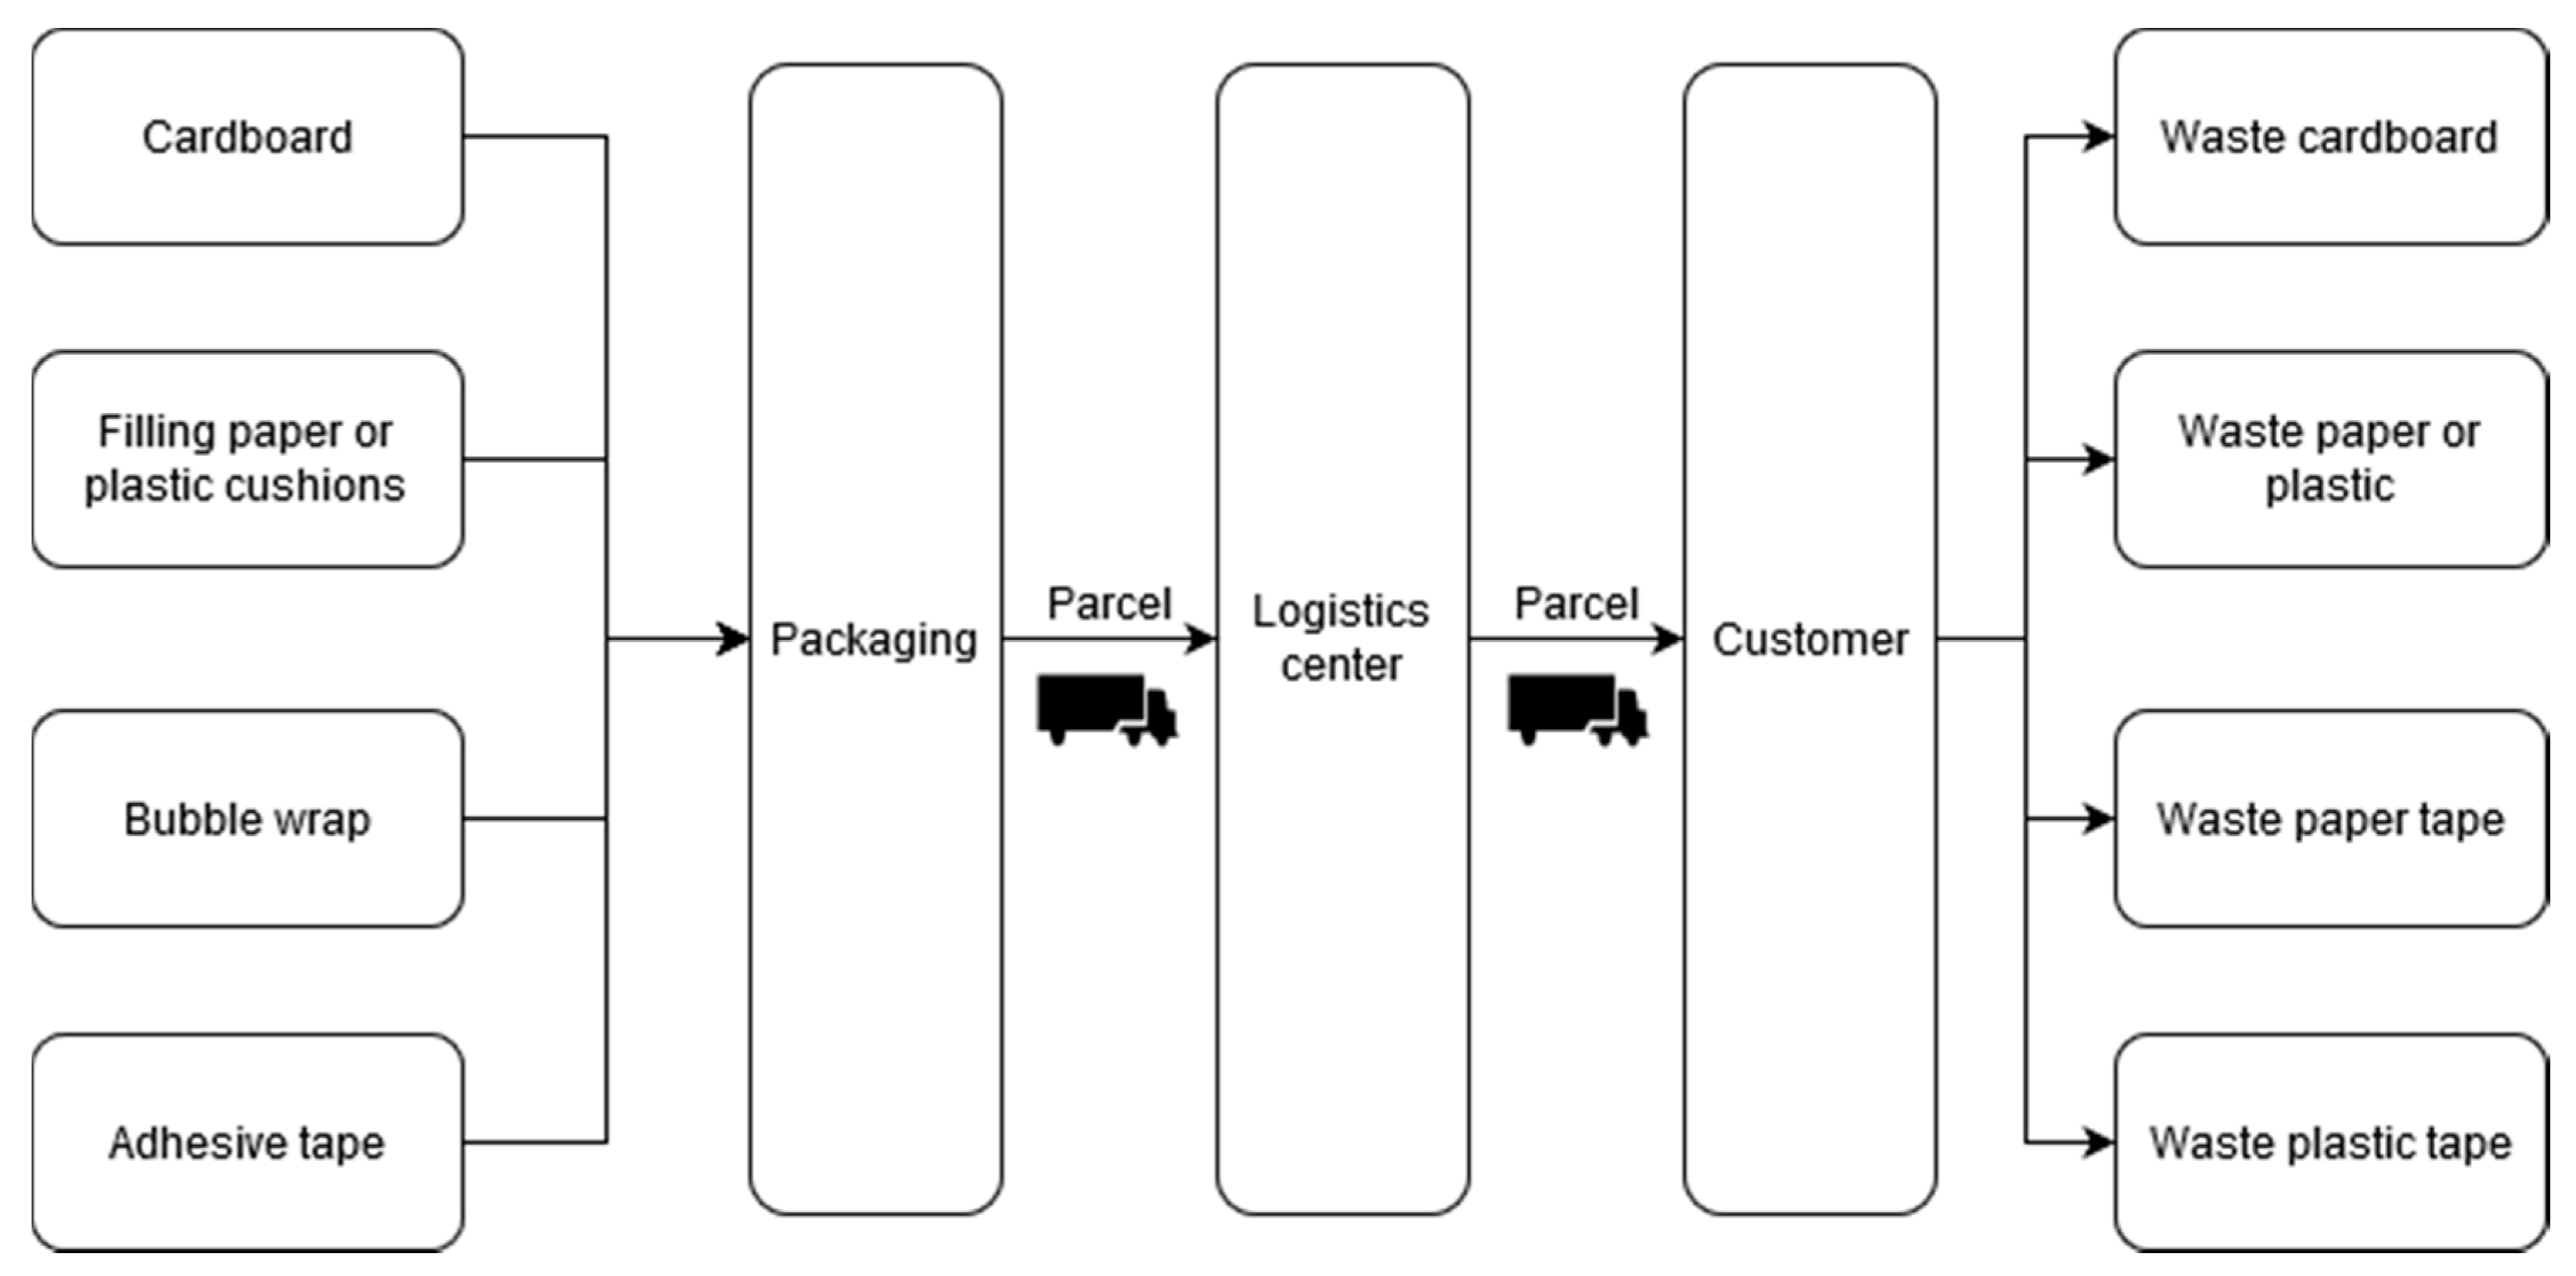
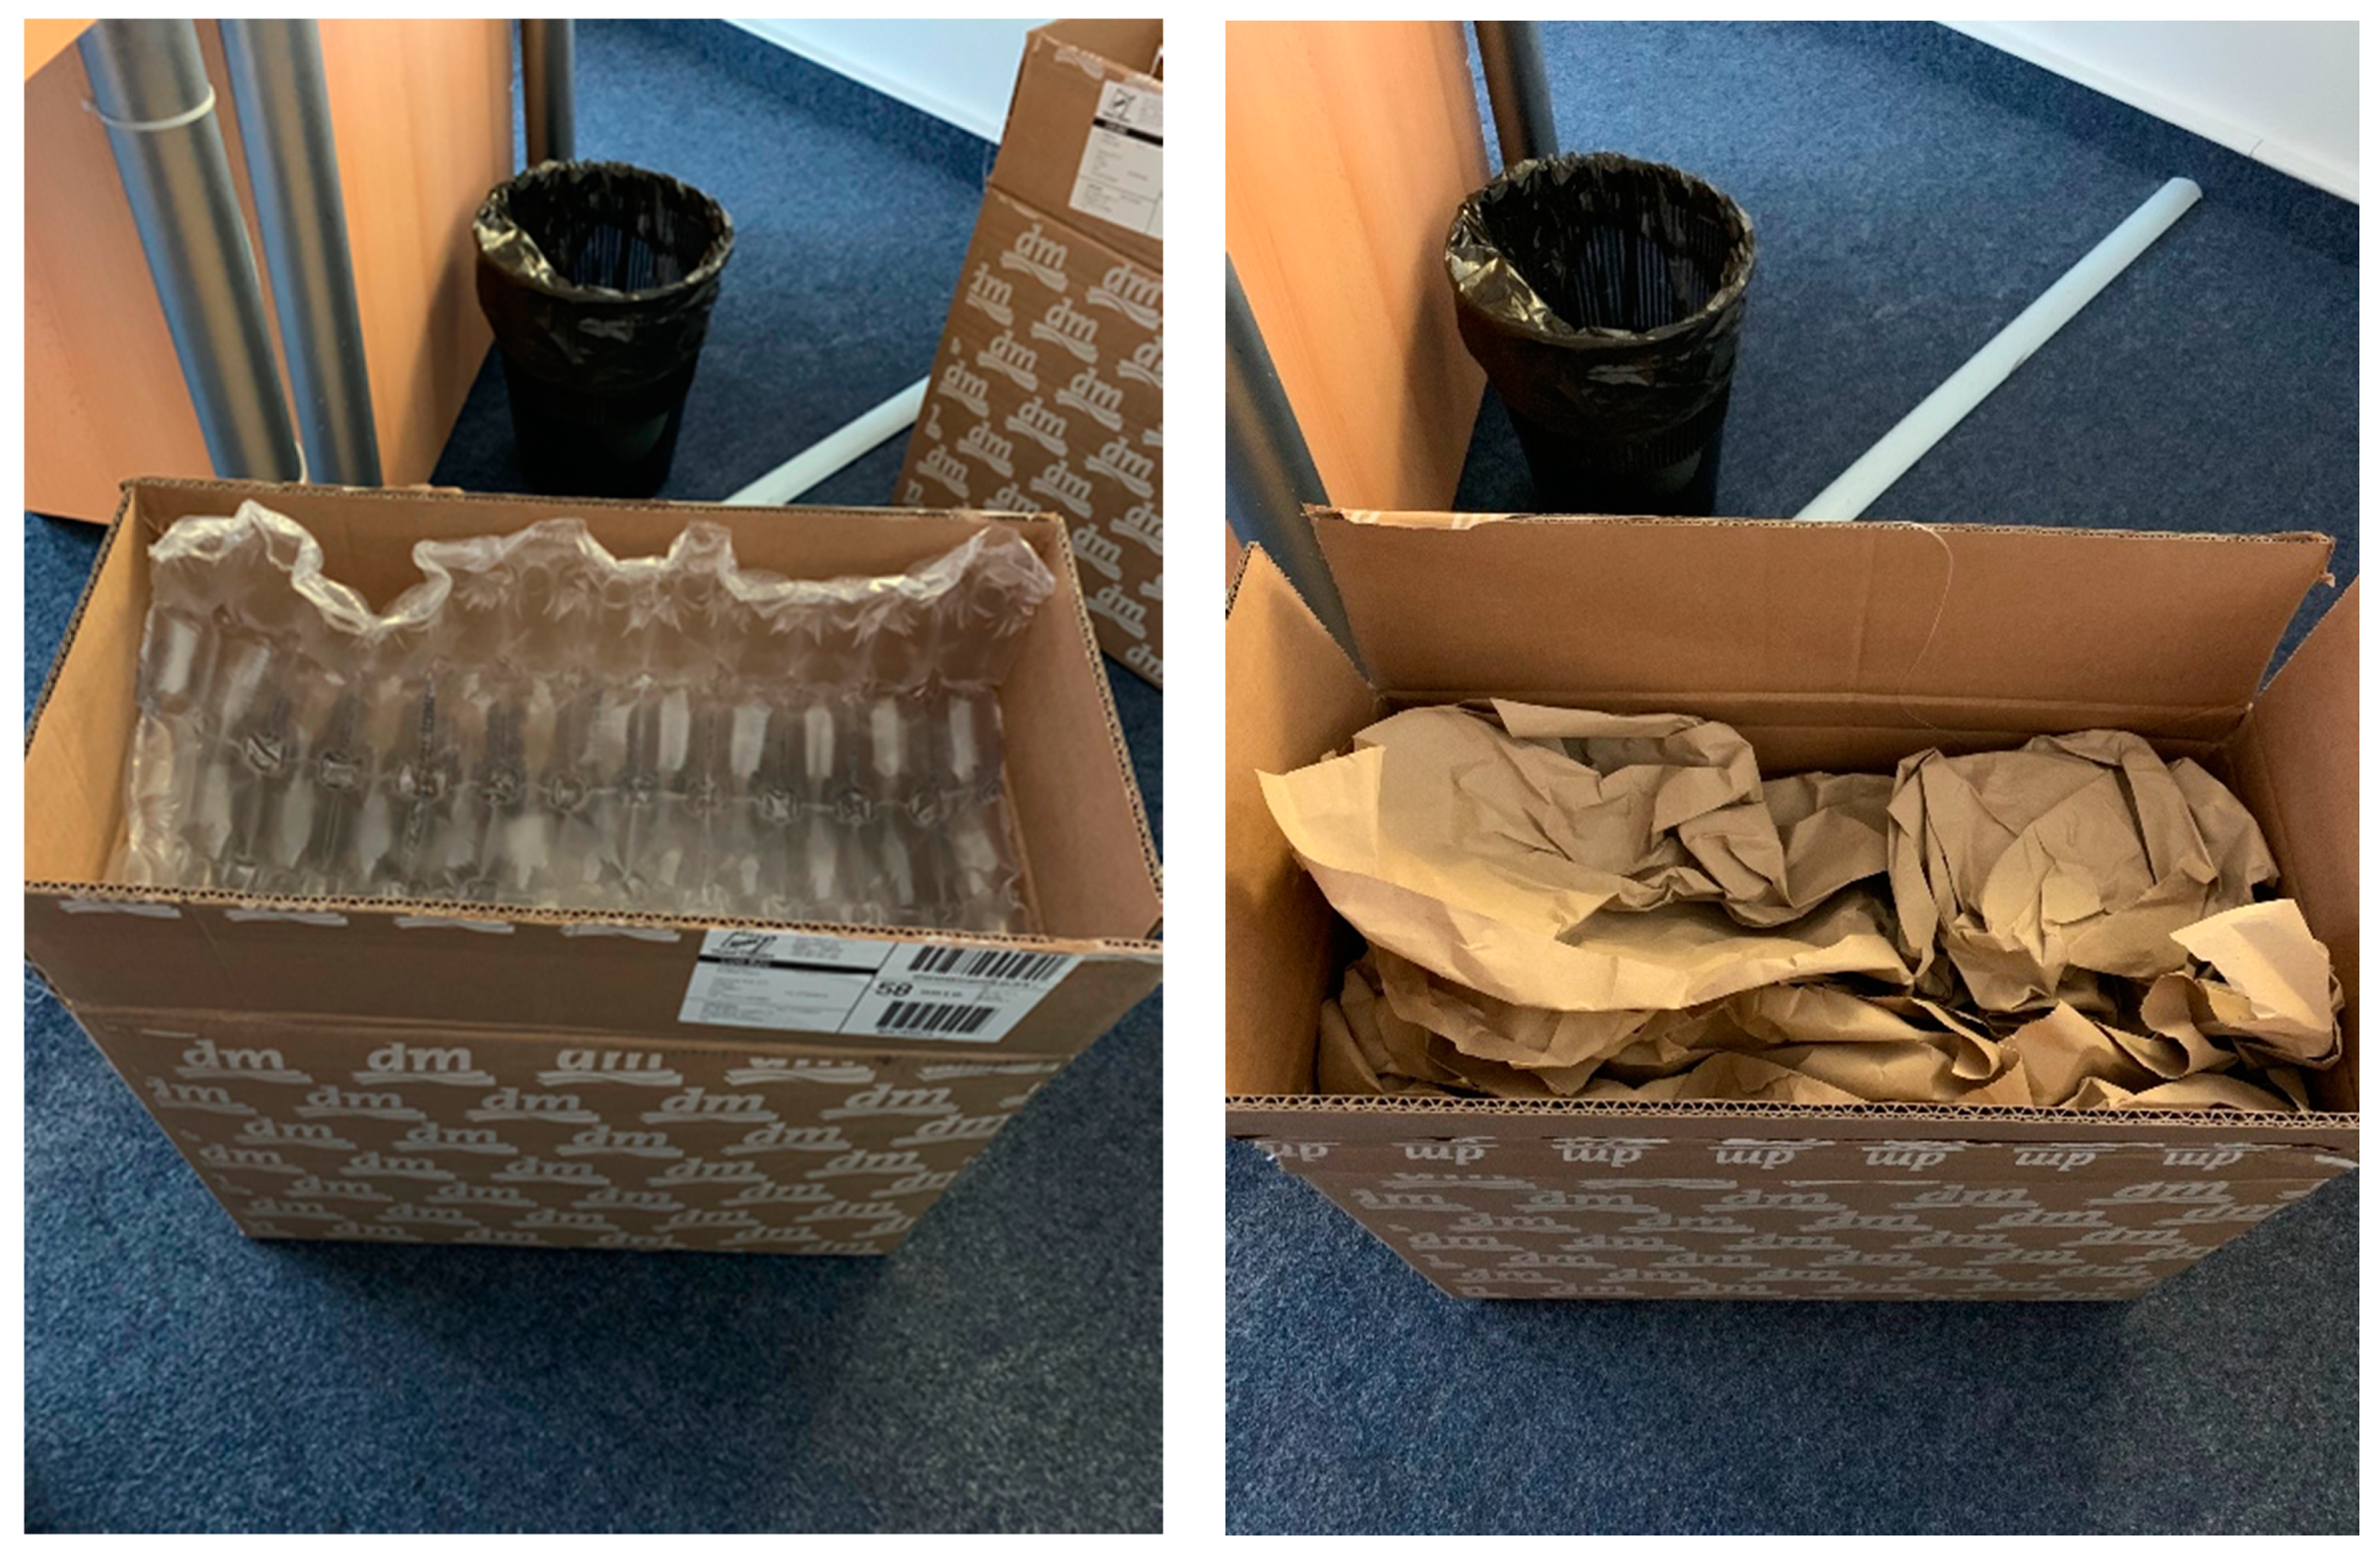
The primary data describing the system were acquired directly from the retailer. The retailer designed two exemplary parcels containing common household and hygiene products like paper towels, diapers, or paper tissues in parcels no. 1 and no. 2; and shower gel, laundry detergent or nail polish in parcels no. 3 and no. 4. The parcels were packaged using two distinct standard methods: parcels no. 1 and no. 4 were insulated using paper, while in parcels no. 2 and no. 3, plastic cushions were used. Due to the nature and weight of the goods, additional zip bags and bubble wrap were used to insure the goods in the parcels no. 3 and no. 4. Finally, the box was secured by paper adhesive tape, and plastic adhesive tape in case of heavy parcels (no. 3 and no. 4). The materials used for packaging, parcel weights, and transportation distances are presented in Table 1. In the alternative scenario, instead of the cardboard box, a 1.5 kg reusable plastic crate made from recycled plastic is used. It is only a hypothetical scenario and an exact design of the crate is yet undetermined. Therefore, the way the parcel is packed (amount of packaging material) was assumed to be similar as in the baseline scenarios. The plastic crate was assumed to be recirculated 200 times before disposal as waste. This number corresponds to the reuse rate presented by Levi et al. [13] and Tua et al. [14], while Koskela et al. [12] estimated up to 700 circulations. The transportation distance of a new plastic crate to packaging was assumed to be similar to that of a cardboard box (180 km) and the transport distance for recirculation was assumed to be the same as the distance to the logistics center (110 km). The distance the parcel is transported from the logistics center to a customer was set to 100 km, which is the average distance. A simplified diagram of the LCA model is presented in Figure 1.
For expedition and intermediate storage of the parcels, the retailer rents an area of 2184 m2 out of the total 7170 m2 of a logistics center. In the logistics center, electricity is consumed mainly for lighting and partly in the administrative area, natural gas is used for heating, and some drinking water is consumed. A fraction of the consumption of energy and resources was allocated to the retailer according to the area proportion. On average, there are 8672 parcels delivered per month. The total energy consumption and the amount attributed to one parcel is presented in Table 2. In the model, the average grid mix in the Czech Republic was assumed to be used. The packaging necessary for electronic shopping results in the generation of additional waste that needs to be disposed of. In the model, all of the material used for packaging of the parcels is assumed to be disposed of immediately. The waste management was modelled following the current waste management system in the Czech Republic—combination of recycling (32%), incineration (18%), and landfilling (50%) [19].
3. Results and Discussion
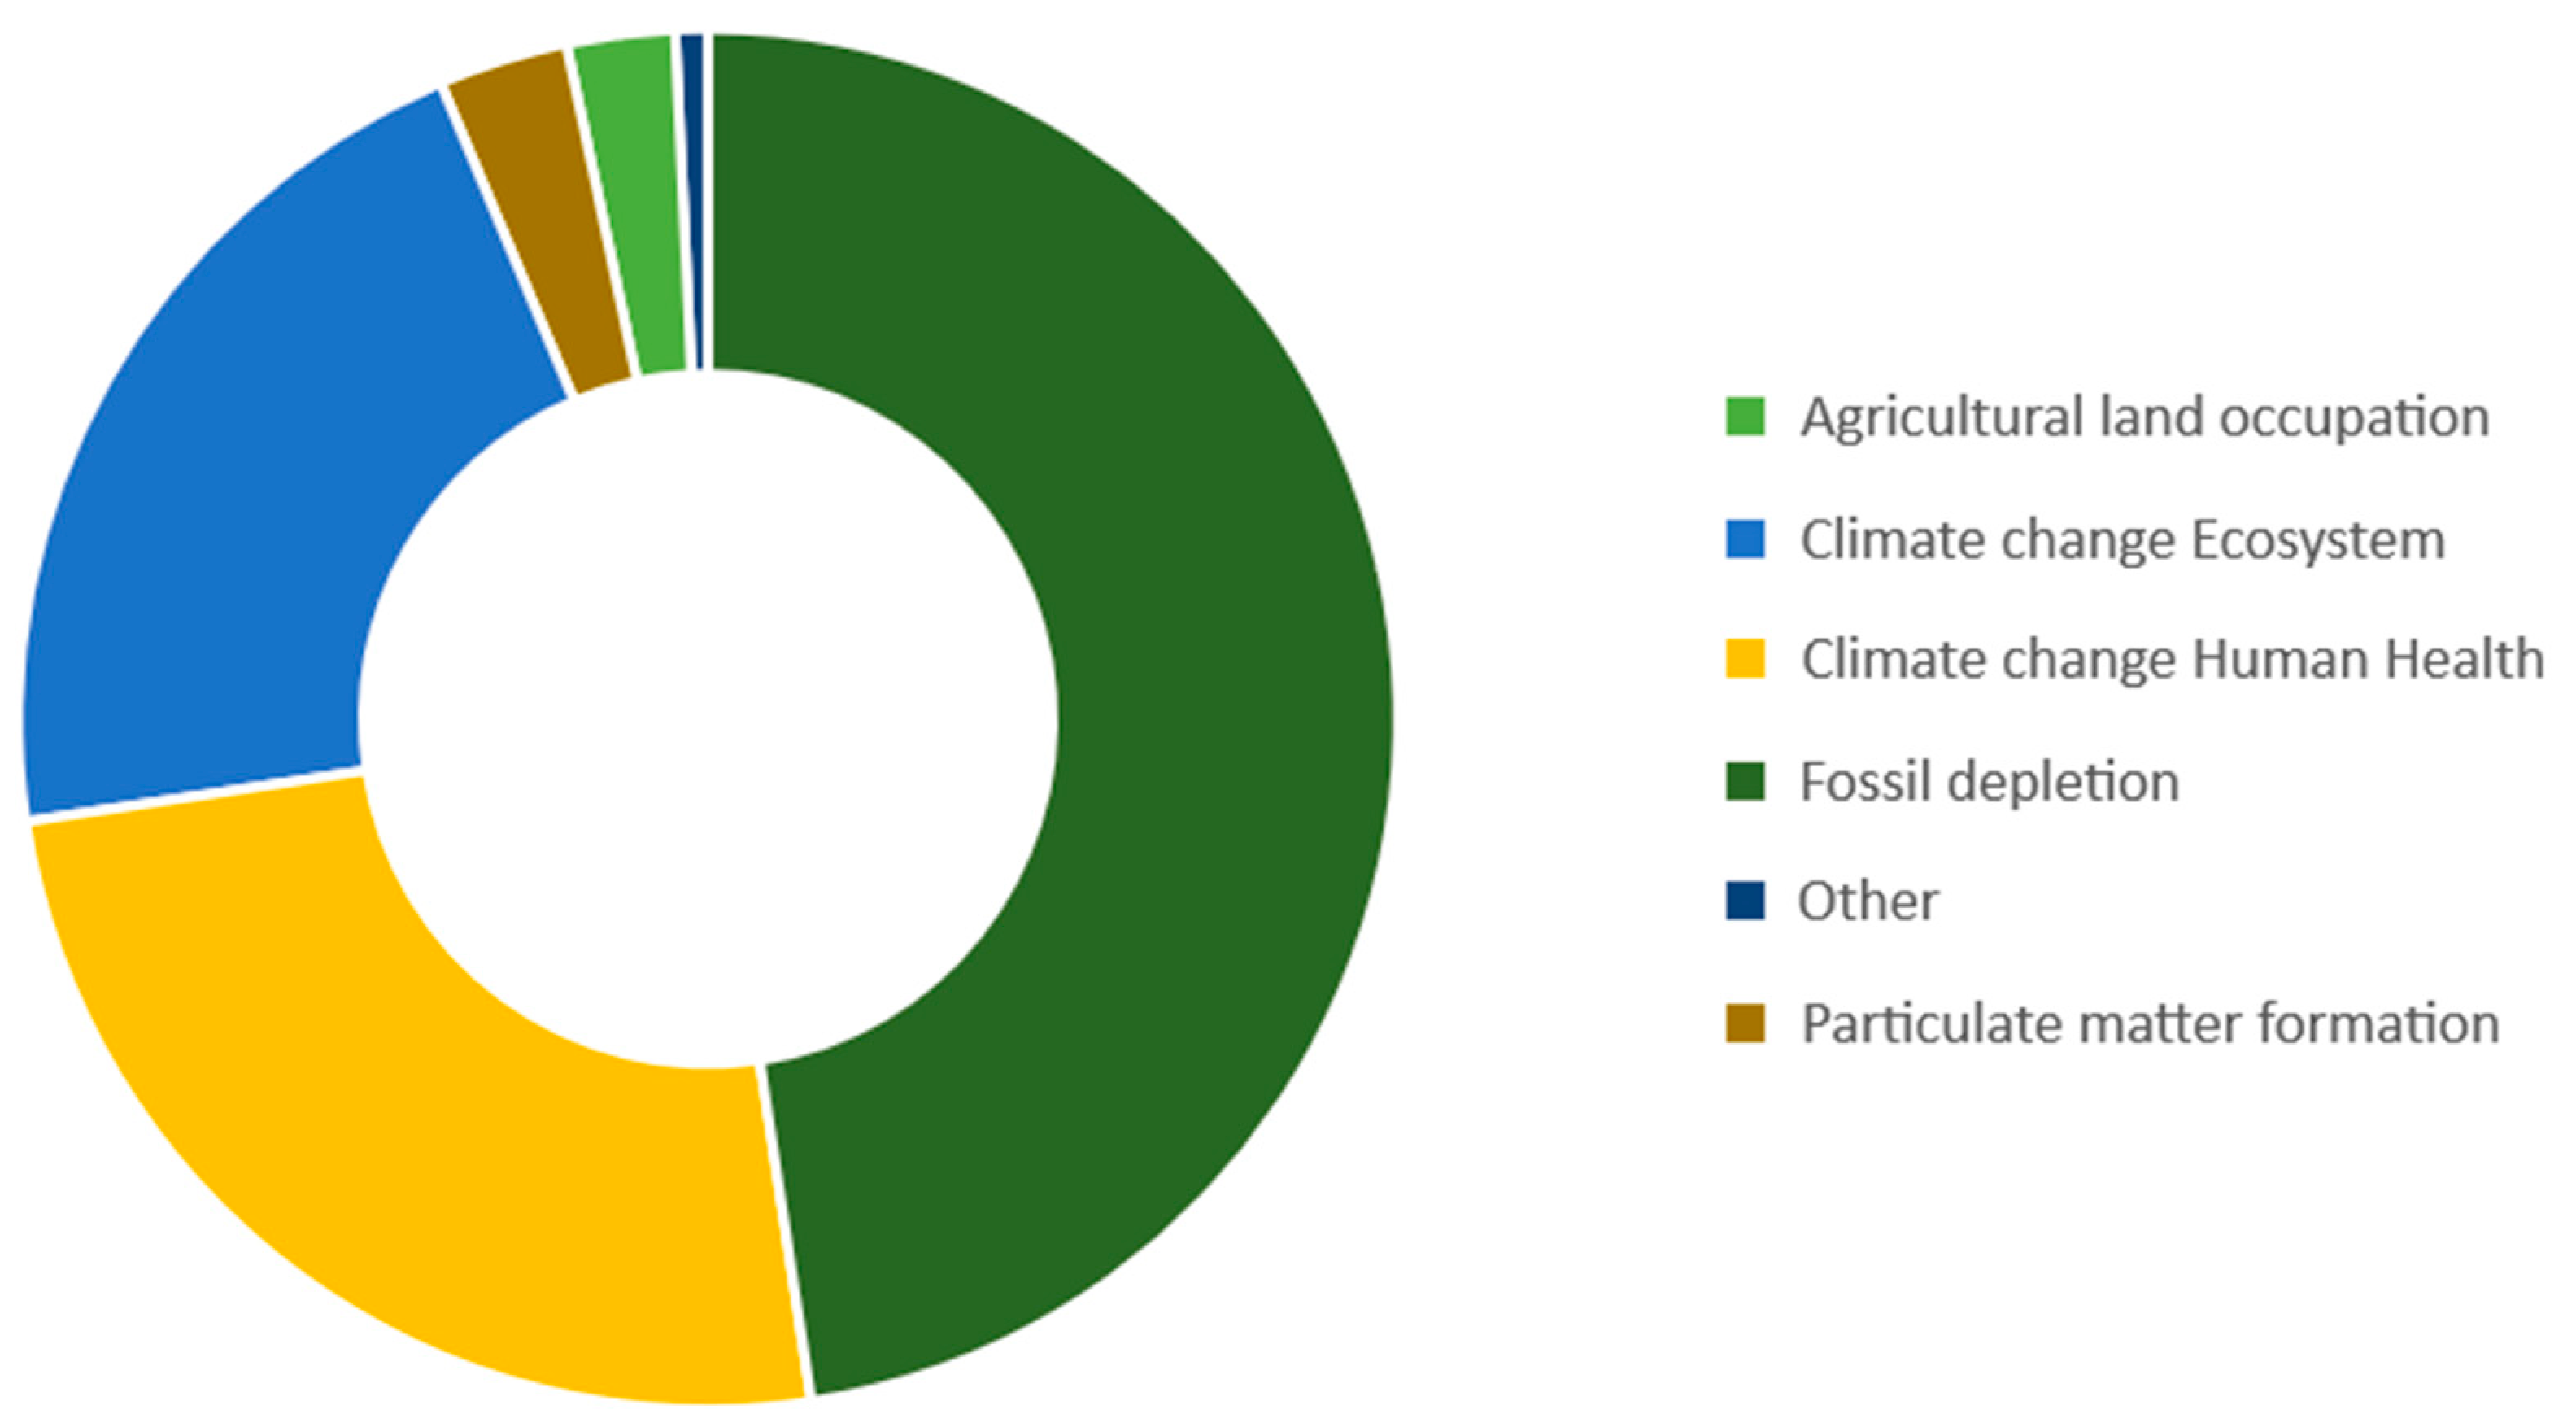
For the environmental characterization of the emission flows, the ReCiPe 2016 (H) Life Cycle Impact Assessment (LCIA) methodology was employed [20]. This methodology converts emissions to environmental impact categories both on midpoint and endpoint levels. The chart in Figure 2 shows a relative importance of each impact category in the context of Europe, based on normalized and weighed endpoint results. As normalization factors for the ReCiPe 2016 LCIA methodology are not yet available, the older ReCiPe 1.08 (H) [21] was used. However, since this methodology is already outdated, these results have only indicative value. According to the normalization results, the most significant impact categories are Climate Change and Fossil Depletion, followed by Particulate Matter Formation and Agricultural Land Occupation; nevertheless, the latter is no longer present in the new methodology. The importance of the other impact categories appears low in the European context.
3.1. Baseline Scenario
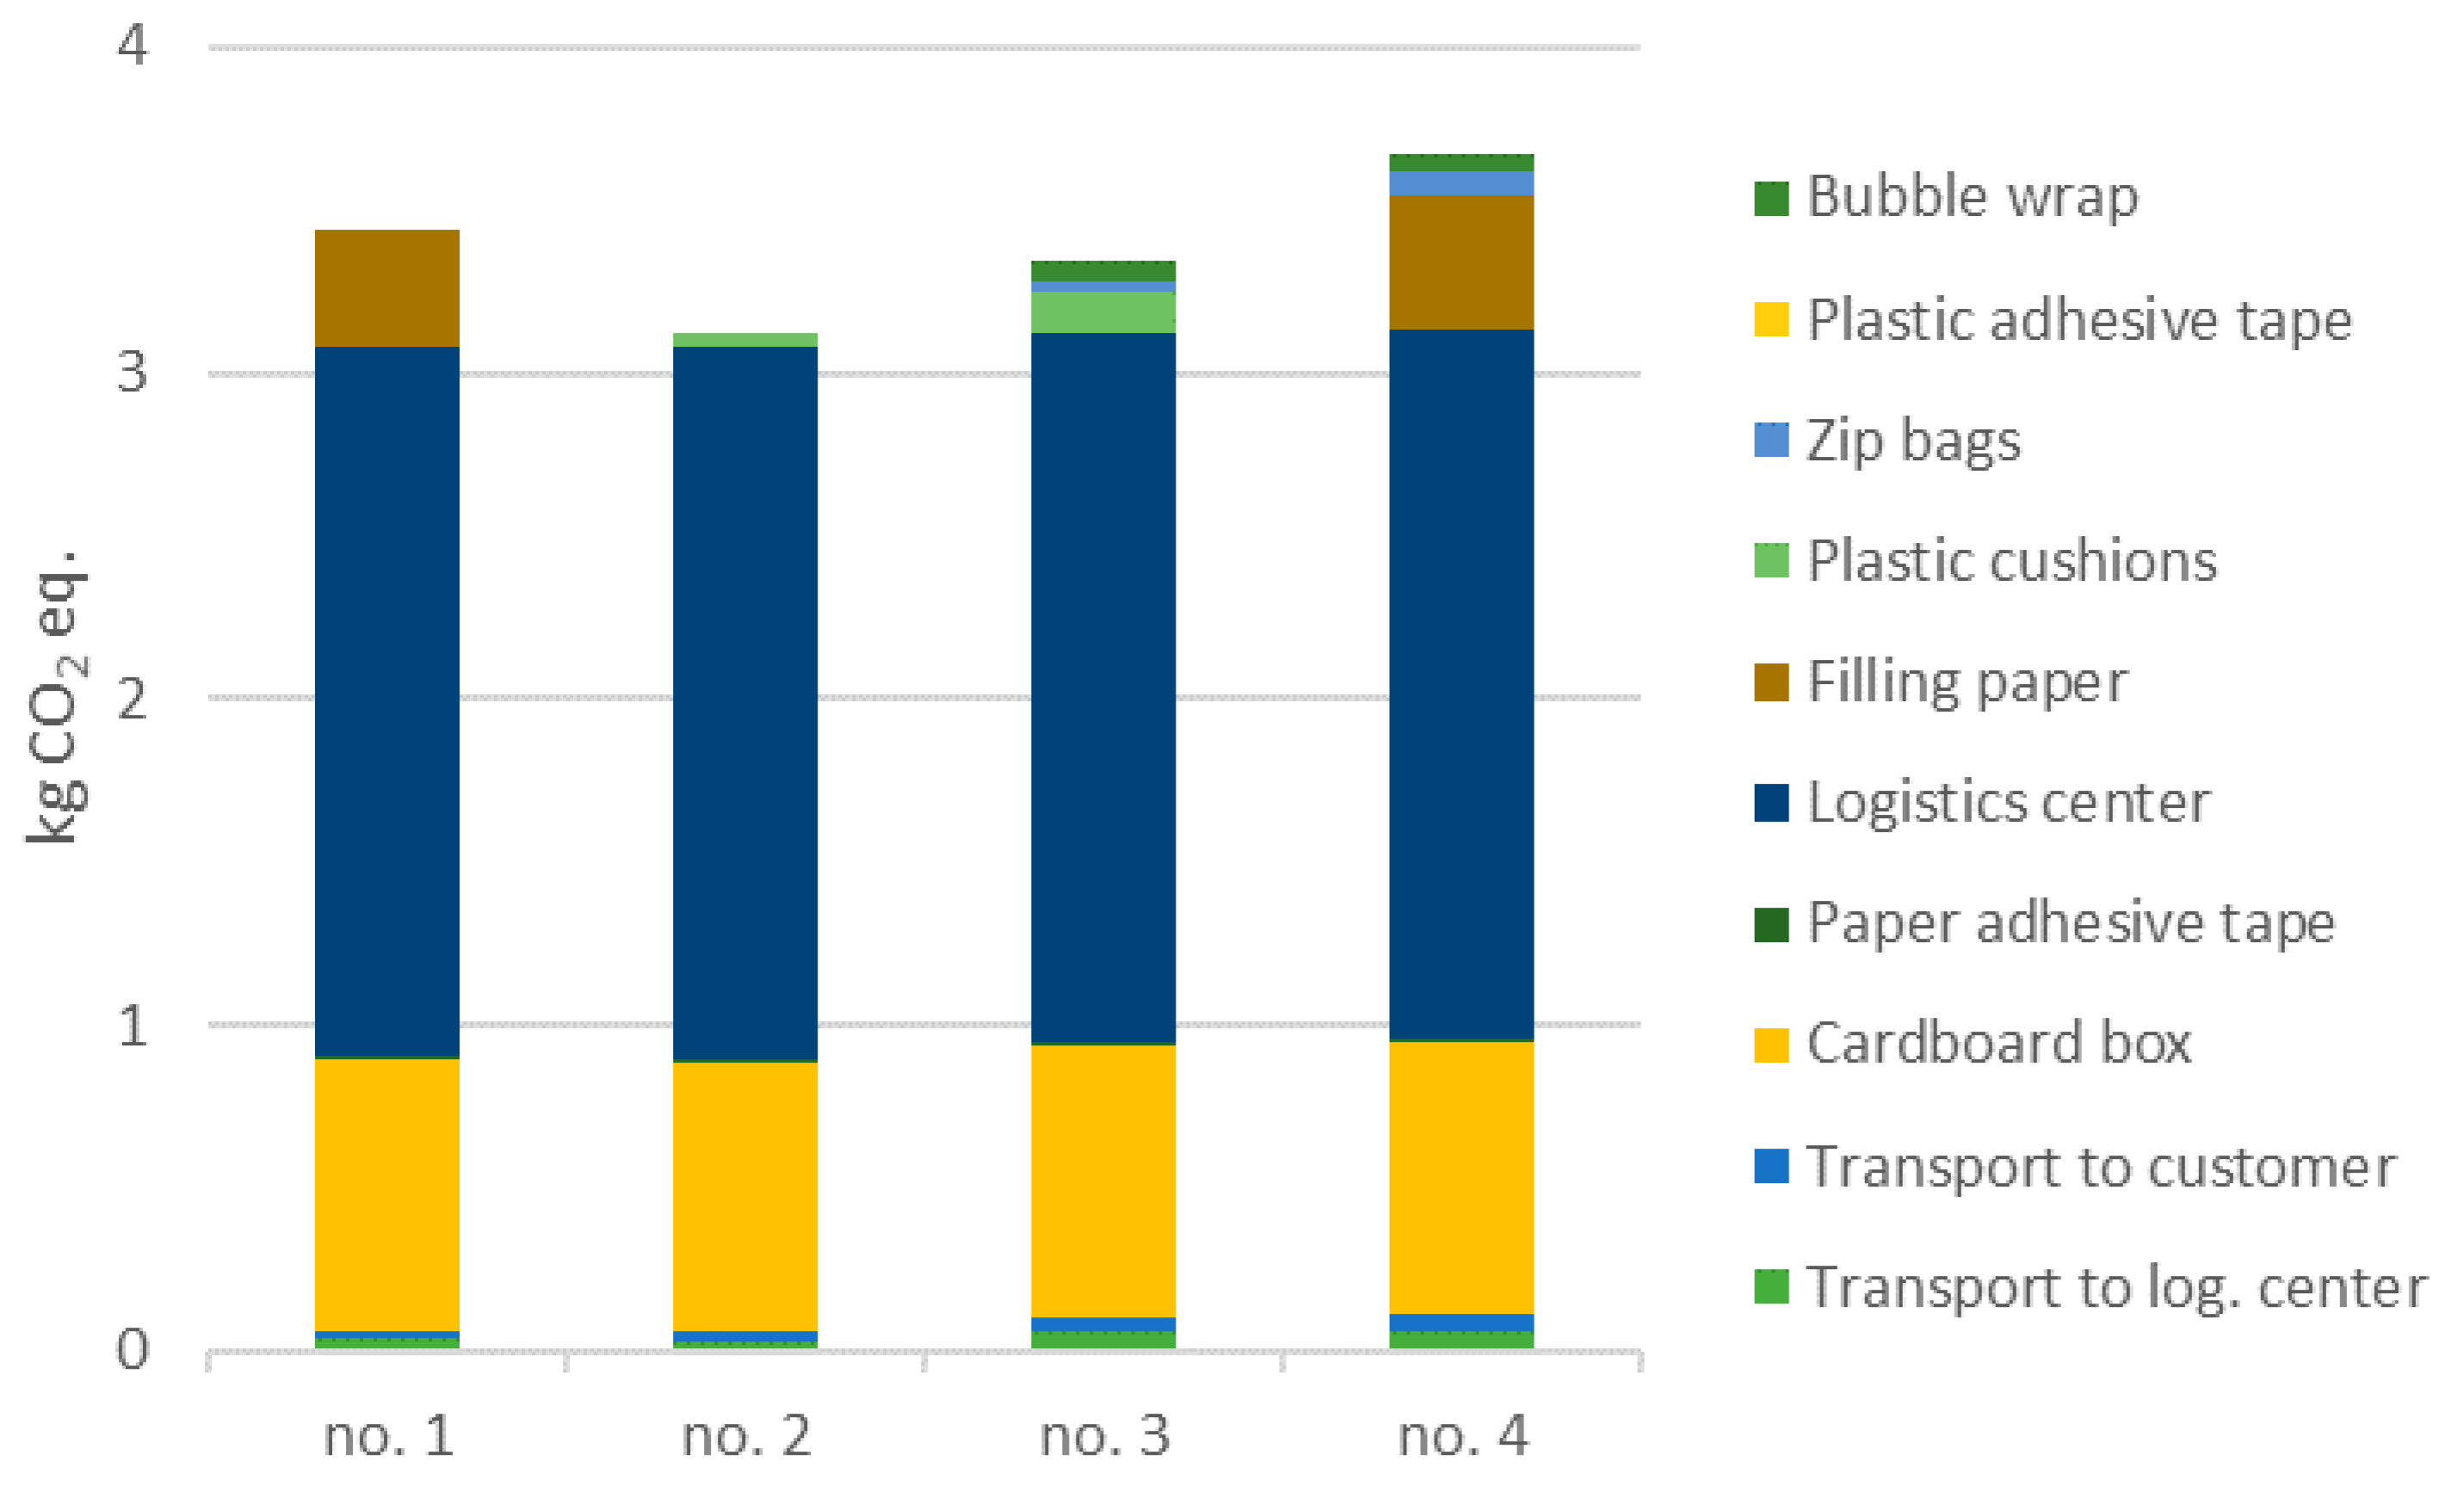
One of the main goals of this study was to compare which of the two distinct packaging systems for electronic retail results in lower environmental impact. When examining the overall results (midpoint results in Table 3, endpoint results in Appendix B), it is apparent that the systems where plastic cushions are used instead of paper are beneficial in all impact categories: Parcel no. 2 shows lower environmental impact than no. 1, and parcel no. 3 lower than no. 4. The difference is driven mainly by the filling paper which, being substantially heavier than the plastic cushions, causes a larger environmental impact throughout the life cycle.
The impact on the Climate Change category has been quantified to range from 3.12 kg CO2 eq. for parcel no. 2 to 3.68 kg CO2 eq. for parcel no. 4 (Table 3). These numbers roughly correspond to those presented by Levi et al. [13] and are in the same range as those of Koskela et al. [12]. As presented in Figure 3, the main contributors to this impact category are the energy consumption in logistics center (2.18 kg CO2 eq.) and the cardboard box (0.83 kg CO2 eq.). In the logistics center, it is mainly the electricity consumption that causes the environmental impact. As mentioned above, when paper is used to insulate the box, it becomes another significant contributor. Transportation of the parcels contributes to the Climate Change impact category by several percent, similarly as bubble wrap and filling cushions, where used. The impact of the adhesive tapes is lower.
When biogenic carbon is included, the impact of paper products is partly reduced and the difference between the parcels is lower. The logistics center then becomes a dominating driver. Considering Fossil Depletion, the logistics center is a dominating driver as well, contributing to between 70% and 80%, depending on the scenario. On the other hand, since the main source of electricity in the Czech Republic is still lignite combustion [22], in another country where cleaner sources are used, the environmental impact of electricity use would be lower and vice versa. Between 13% to 15% of the Fossil Depletion is attributed to the cardboard box, the second most important contributor. Significance of the filling paper is larger in some other impact categories, especially the human toxicity, ecotoxicity, and eutrophication categories, where it contributes with over 20%. Even though it appears that use of plastic cushions instead of paper is a significantly favorable option, it should be noted that the most debated environmental issue caused by the use of plastics—the plastic littering and the omnipresence of microplastic particles [23,24]—is not (yet) included in the LCIA methodologies. Although some indicators have been proposed, e.g., Littering Potential for carrier bags [25], a comprehensive impact category characterizing this issue is yet to be developed. Plastic littering is, however,—in a country where a relatively effective waste management operates—more of a social issue that should be dealt with on another level [26]. Furthermore, this kind of packaging is not among the products that are most often littered, like beverage containers or food packaging [27,28].
3.2. Alternative Scenario—Plastic Crates
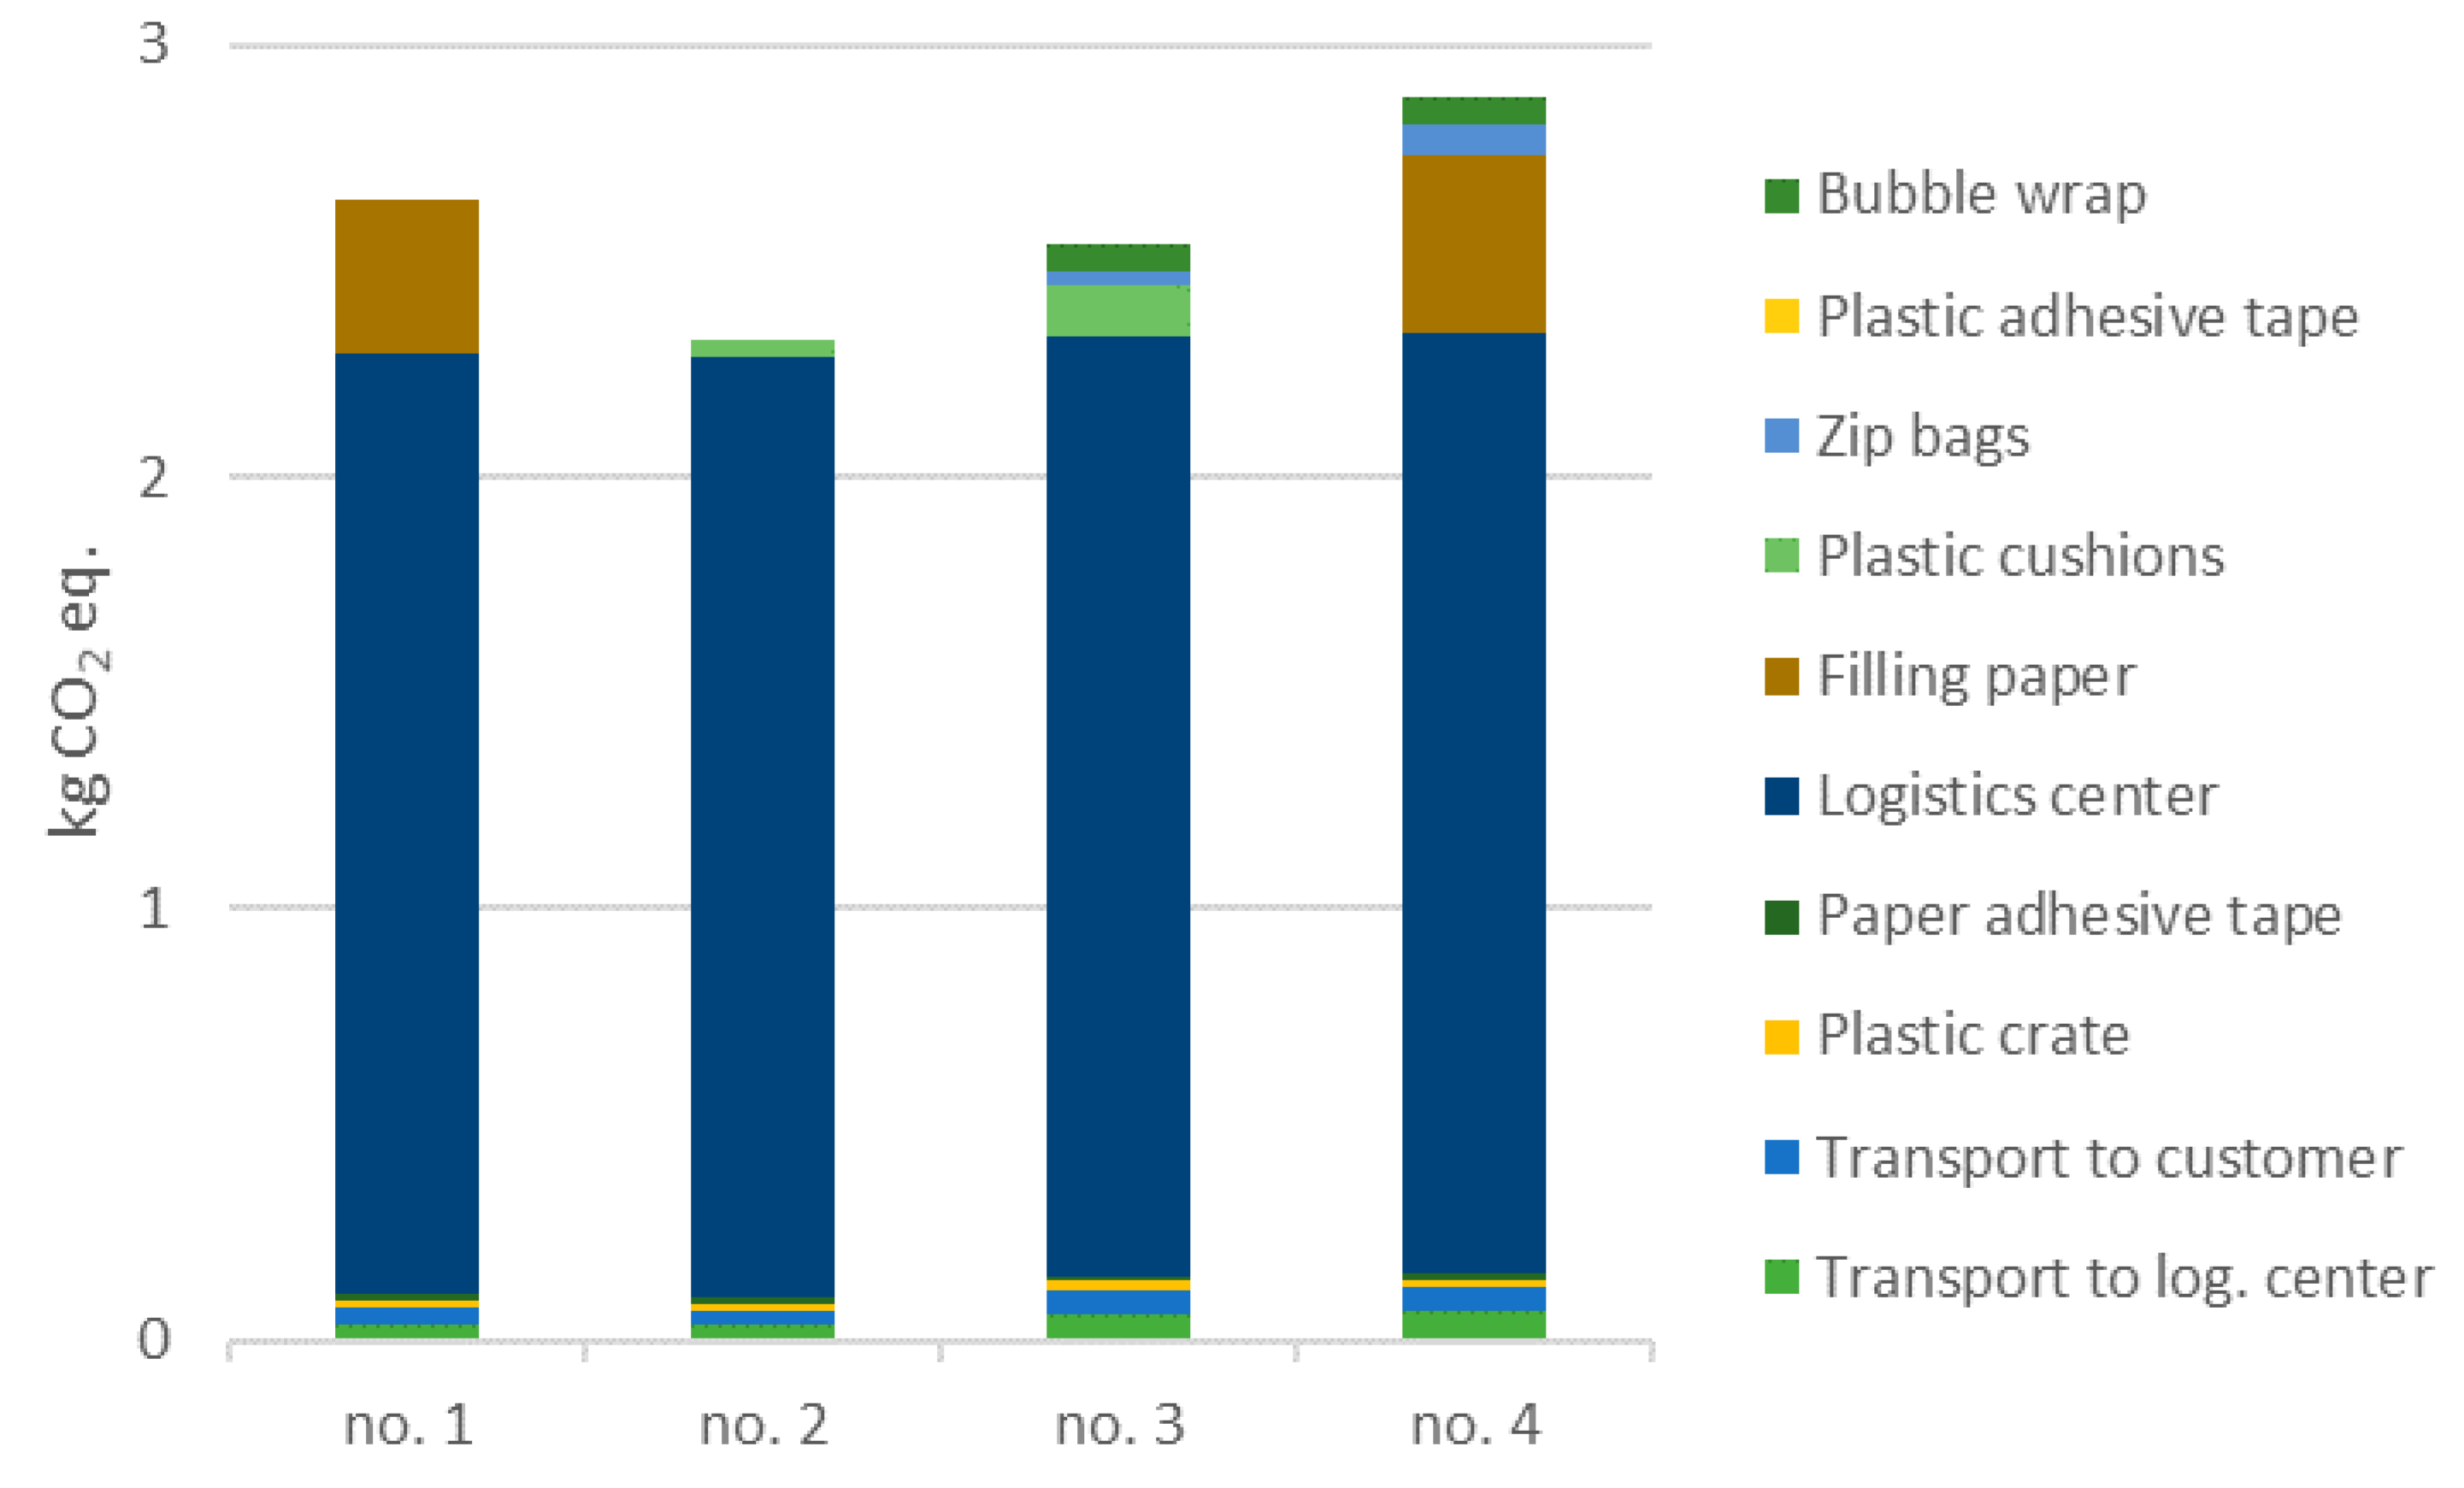
As presented in the previous section, the use of cardboard boxes is an important factor in the life cycle environmental impact of electronic retail. Therefore, the hypothetical alternative scenario was designed. The overall results are presented in Table 3. The difference is most apparent in the default Climate Change impact category. Although, as the plastic crate is heavier, the transportation emissions slightly rise, the overall impact of the alternative scenario is significantly lower. As the crate is recirculated, the impact of production and end-of-life is much lower. However, with large transportation distances, the increase of transportation impact caused by greater weight might overcome the benefits, as it happened for Tua et al. [14] or Koskela et al. [12]. Were the transportation distances—to logistics center, to customer, and for the return of the plastic crate—to grow to 500 km, the climate change impact of the parcel no. 1 would grow to 2.93 kg CO2 eq. from the 2.64 kg CO2 eq.; it would grow to 3.30 kg CO2 eq. were they to grow to 1000 km; and at 1500 km it would grow to 3.67 kg CO2 eq., which is a larger impact than the baseline scenario. However, these distances are not likely in a country the size of the Czech Republic. The situation changes when biogenic carbon is included. Then, the climate change impact of the alternative scenarios is almost identical to the baseline, since the plastic crate is made from fossil resources. In most other categories, the impact of the alternative scenario is lower, by a smaller or larger margin. It is therefore apparent that substitution of cardboard boxes for a plastic crate shows a potential to be environmentally beneficial. On the other hand, this alternative scenario is based on several simplistic assumptions. If a retailer decided to employ reusable plastic crates, the system should be scrutinized in more detail (Figure 4).
3.3. Sensitivity Analysis
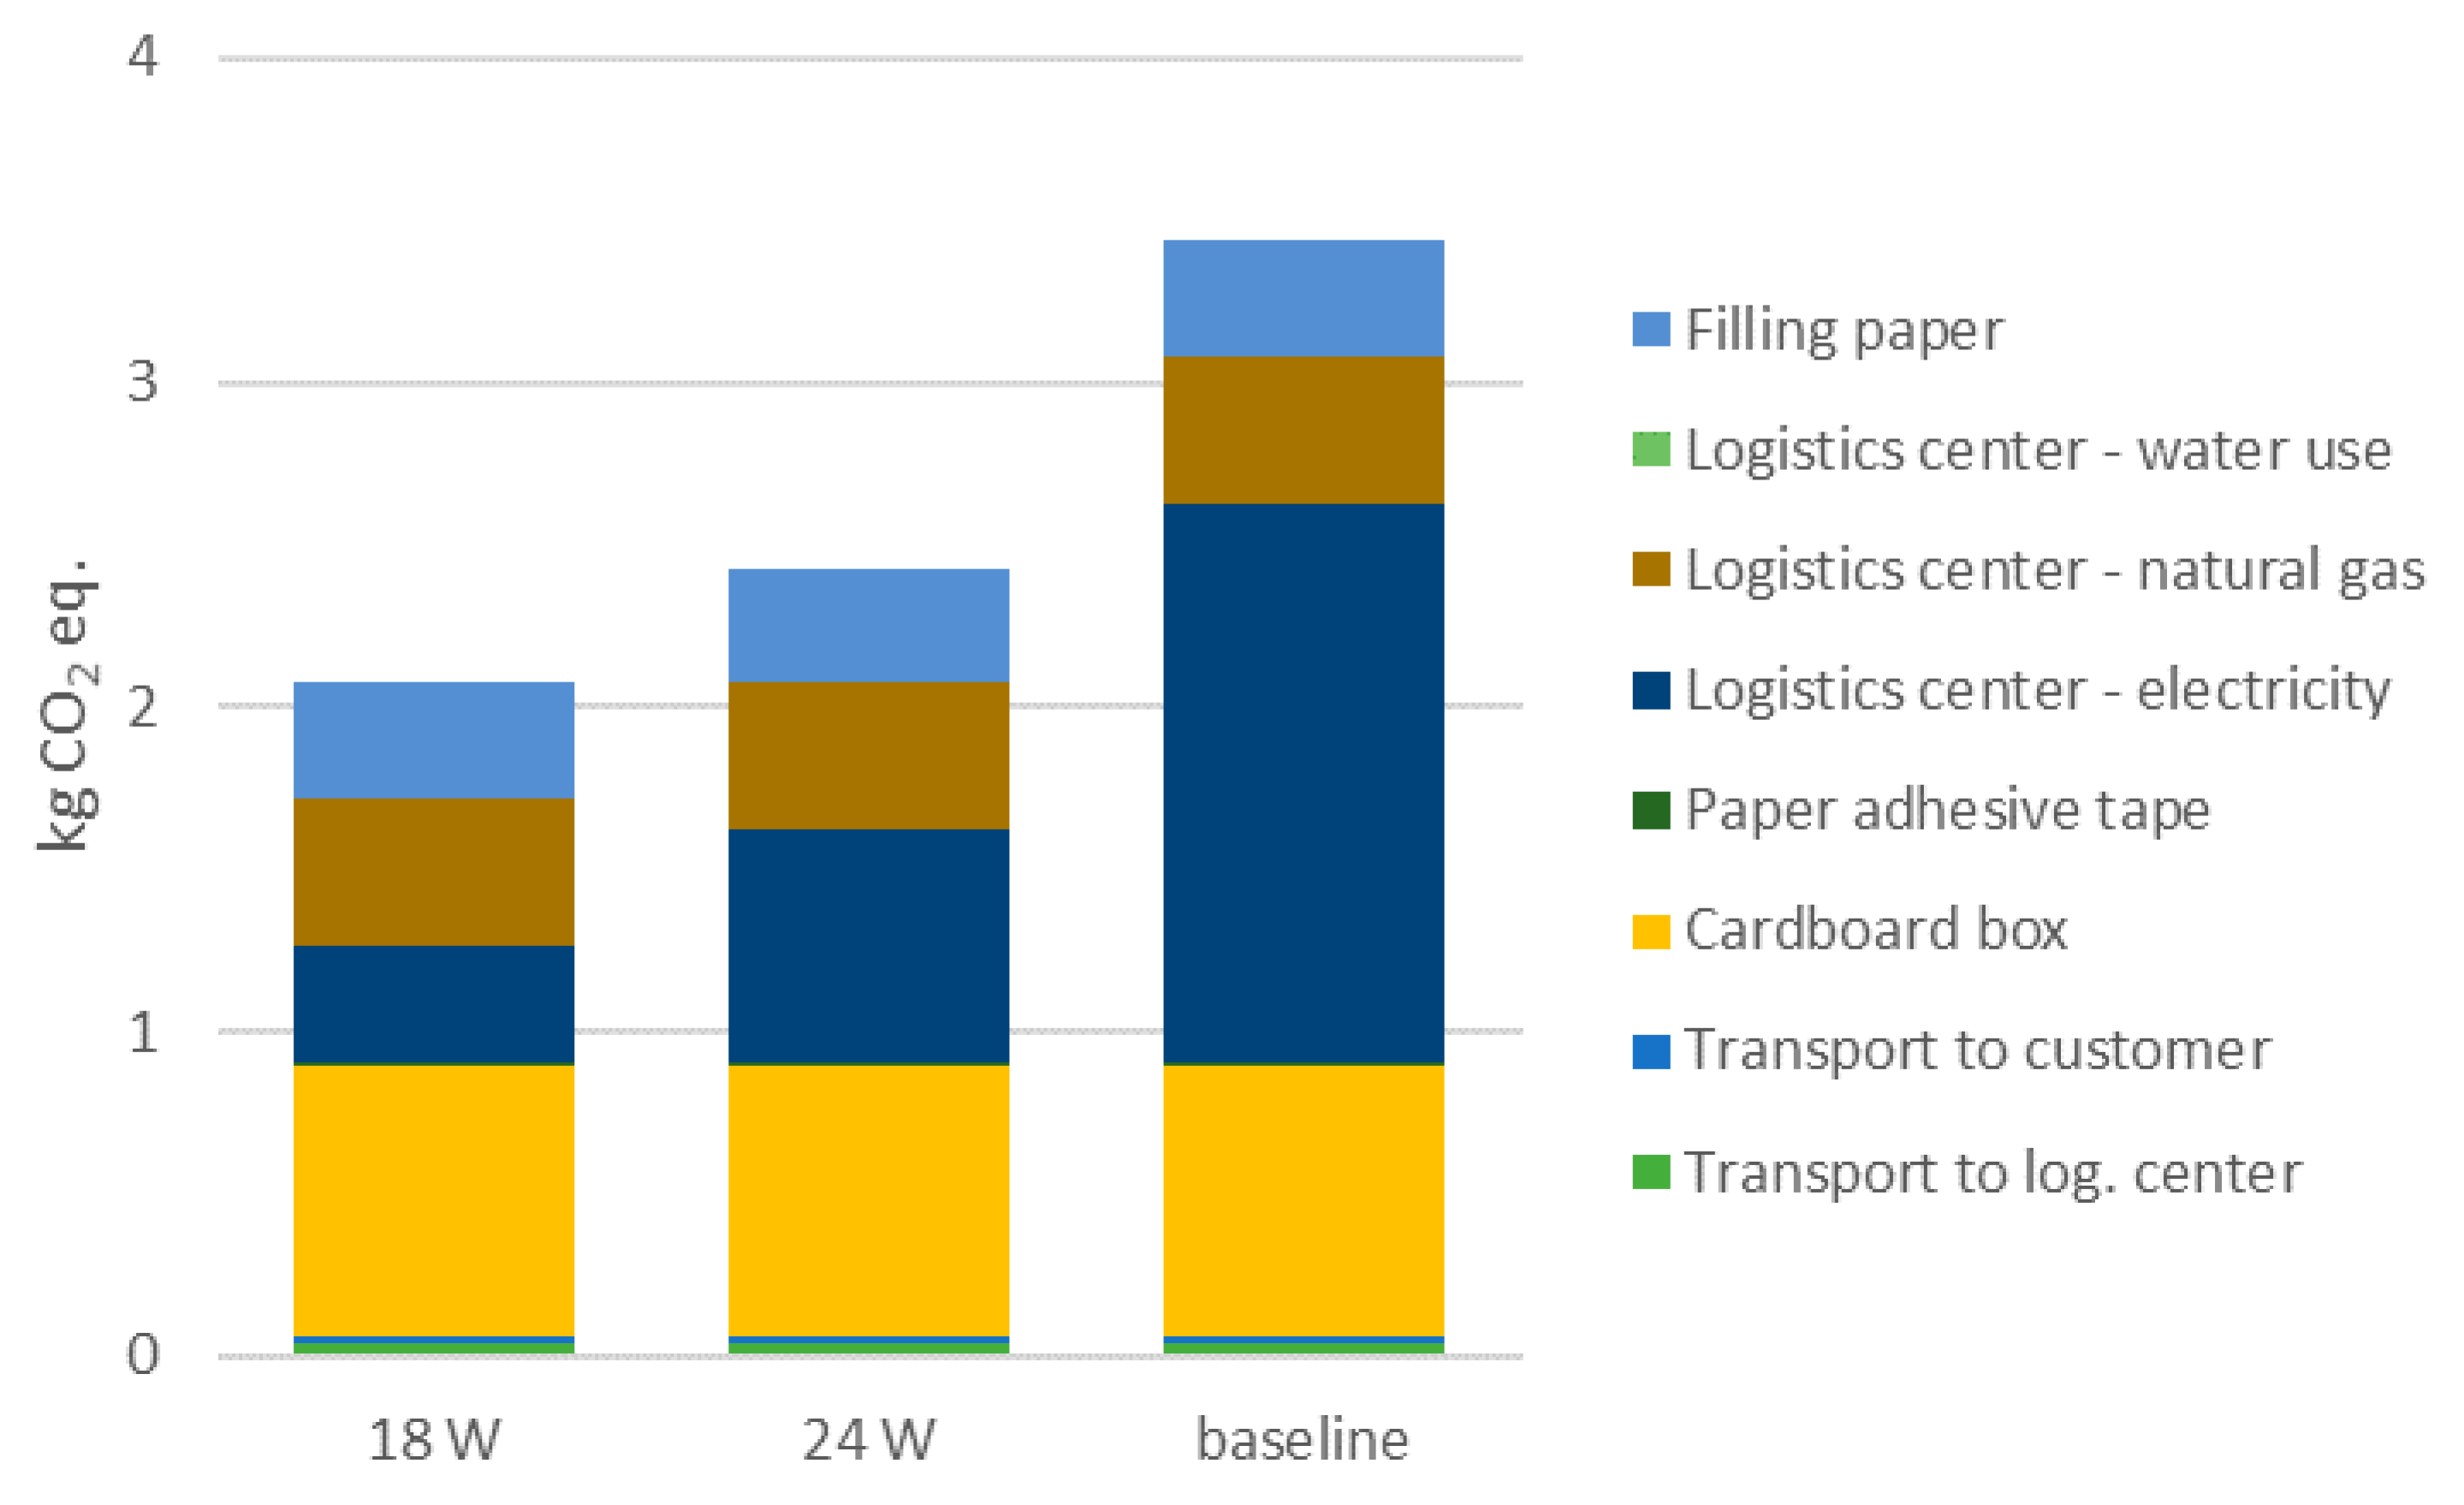
The consumption of electricity in the logistics center was found to be the most important contributor to the life cycle environmental impact of the electronic retail. The impact of the electricity to climate change was quantified to 1.72 kg CO2 eq. Because in the e-retail scenario described in this model quite old-school fluorescent lights were used, the sensitivity was analyzed to the case where 18 W or 24 W LED tube lights were used, instead of the old 58 W fluorescent lights. To simplify the calculation, it was assumed that all of the electricity is used for lighting of the storage area, although some fraction is also used in the administrative area. It turned out that use of more efficient lights would lead to tremendous environmental benefits. If 18 W LED lights were used, the impact of the electricity use in the logistics center to Climate Change would decrease to 0.36 kg CO2 eq. and it would decrease to 0.71 kg CO2 eq. with 24 W lights. Comparison of the Climate Change impacts of the scenarios is presented in Figure 5. There is a similar decrease in the other impact categories. Although the actual electricity use reduction would not be as large as assumed in this simple scenario, it shows the importance of energy efficiency and efficient space utilization in the logistics centers. It also means that the environmental impact of electronic retail, in general, might easily be lower than what was quantified in this scenario. The environmental impact of electricity consumption also highlights the need to look for cleaner sources of energy. However, this is a broader socio-economic issue that is usually beyond direct influence of a retailer or a consumer.
What may also vary substantially is the distance a parcel is transported. Sensitivity of the results to changes in transportation distance was evaluated for the parcel no. 1. In the baseline scenario, the distance the parcel travels from the logistics center to a customer was set to 100 km, which corresponds to the average distance. In the case where the distance is 50 km, the overall impact to climate change decreases from 3.439 kg CO2 eq. for the baseline scenario to 3.420 kg CO2 eq., and increases to 3.466 kg CO2 eq. when the distance is 200 km. As larger distances are unlikely in a country the size of the Czech Republic, it may be concluded that the results are not sensitive to the location of customer. Additionally, the distance between packaging and a logistics center might differ in other situations. If the distance changes from the baseline 110 km, to 50 km, the climate change impact is reduced from 3.439 kg CO2 eq. to 3.417 kg CO2 eq., and grows to 3.478 kg CO2 eq. when the distance is 250 km. If the truck utilization efficiency decreased from the average 61%—that is, the default value in the GaBi database—to 40%, the overall contribution to the Climate Change category would increase to 3.454 kg CO2 eq. The trend is similar in the other impact categories, hence, the transportation attributes only by several percent in most likely scenarios.
The hypothetical alternative scenario is based on several assumptions that might affect the results. Sensitivity of the results to variation in the assumptions was evaluated for the parcel no. 1. With the assumed crate weight of 1.5 kg, the impact on Climate Change was 2.640 kg CO2 eq. Were the crate lighter, at 1 kg, the burden decreases to 2.626 kg CO2 eq., and use of a 2 kg plastic crate would lead to 2.653 kg CO2 eq. Furthermore, the number of times the crate is recirculated may vary. If the crate is recirculated 50 or 500 times, the results remain nearly unchanged. However, when the crate is reused only 10 times, the climate change burden increases to 2.754 kg CO2 eq. This finding corresponds to that of Tua et al. [14], who concluded that, in their scenario, the results do not change much when the reuse rate is over 20. The burden on the other impact categories changes in a similar manner. Hence, the results are not sensitive to the assumed weight of the used plastic crate nor the number of times the crate is reused.
4. Conclusions
As the electronic retail sector is rapidly growing, this study set out to scrutinize the life cycle environmental impact of online shopping for household products. It was found that the additional packaging of products in electronic retail of household products represents an additional environmental burden. It has also been shown that logistics has a significant environmental impact that should be reduced in the future. Using the Life Cycle Assessment methodology with the functional unit designed as “delivery of one parcel”, two distinct packaging systems were compared based on real-life data from a major cosmetics and household products retailer in the Czech Republic. Analyzing the life cycle of e-retail of two kinds of archetype parcels—manufacturing and freight transport of the products were assumed to be outside the system boundaries, as well as the last-mile transport—it showed that using plastic cushions causes a smaller environmental burden than using paper to insulate the goods. However, the main driver of the environmental impact was electricity consumption in the logistics center. Seeing that most of the electricity is needed for lighting of the storage area where old-school fluorescent lamps were used, the importance of more efficient lighting, as well as efficient space utilization in the logistics, was demonstrated on the alternative scenarios. The second most important aspect of the electronic retail appeared to be the use of cardboard boxes. Therefore, the alternative scenario was designed, where reusable plastic crates are used instead. Although the alternative scenario is only hypothetical and is based on several simplistic assumptions, it showed a great potential to be environmentally beneficial, regardless of changes in the assumed parameters. The transportation of the parcels—to the logistics center and to the brick-and-mortar shop where the customer collects it—contributed to the environmental impact only by several percent, even considering the variability of the distances. Similarly, the filling cushions and bubble wrap, where used, contributed to the overall burden by several percent. The share of the adhesive tapes does not appear important.
What does this mean then? The results appear conclusive: It is environmentally beneficial to use the much lighter plastic cushions instead of paper. Similarly, it would be worthwhile to design a reusable plastic crate that would substitute the single-use cardboard box. However, it is questionable whether a commercial enterprise would endorse this significantly better option when public image of plastics is contrary, particularly when the plastic littering problem is not yet included in such environmental analyses. On the other hand, it is intuitive: The less material used, the less energy and resources are needed. On the scale that the electronic retail sector operates, even small improvements in the single parcels would lead to great benefits overall. This is blatantly manifested with the energy use in the logistics center. Nevertheless, in the perspective of today’s climate and ecological crisis, it would be best if the customers avoided excessive consumerism whatsoever.
Author Contributions
V.K. outlined the research topic, performed data collection and LCA analysis. J.M. also performed and improved LCA analysis and wrote the whole manuscript. All authors have read and agreed to the published version of the manuscript.
Funding
This research received no external funding.
Acknowledgments
This work was supported by the institutional support of the University of Chemistry and Technology, Prague. The authors would like to acknowledge Radek Rottner from dm-drogerie markt Czech Republic for the effort of data collection and practical aspects of the study.
Conflicts of Interest
The authors declare no conflict of interest.
Appendix A
Figure A1.
Photos of the parcels.

Appendix B. Endpoint Results

Table A1.
LCIA results of the four baseline scenarios and the alternative scenarios where plastic crates are used, calculated using ReCiPe 2016 (H) endpoint methodology.
Table A1.
LCIA results of the four baseline scenarios and the alternative scenarios where plastic crates are used, calculated using ReCiPe 2016 (H) endpoint methodology.
| Baseline Scenario | Alternative Scenario—Plastic Crate | |||||||
|---|---|---|---|---|---|---|---|---|
| no.1 | no.2 | no.3 | no.4 | no.1 | no.2 | no.3 | no.4 | |
| Climate Change FW Ecosystems, default, excl. biogenic carbon (species.yr) | 2.63E-13 | 2.39E-13 | 2.56E-13 | 2.81E-13 | 2.02E-13 | 1.77E-13 | 1.94E-13 | 2.20E-13 |
| Climate Change FW Ecosystems, incl. biogenic carbon (species.yr) | 2.06E-13 | 1.75E-13 | 1.92E-13 | 2.25E-13 | 2.08E-13 | 1.77E-13 | 1.94E-13 | 2.27E-13 |
| Climate Change Human Health, default, excl. biogenic carbon (DALY) | 3.19E-06 | 2.89E-06 | 3.10E-06 | 3.41E-06 | 2.45E-06 | 2.15E-06 | 2.36E-06 | 2.67E-06 |
| Climate Change Human Health, incl biogenic carbon (DALY) | 2.50E-06 | 2.12E-06 | 2.33E-06 | 2.73E-06 | 2.52E-06 | 2.15E-06 | 2.35E-06 | 2.75E-06 |
| Climate Change Terr. Ecosystems, default, excl. biogenic carbon (species.yr) | 9.63E-09 | 8.73E-09 | 9.35E-09 | 1.03E-08 | 7.39E-09 | 6.49E-09 | 7.12E-09 | 8.06E-09 |
| Climate Change Terr. Ecosystems, incl. biogenic carbon (species.yr) | 7.53E-09 | 6.40E-09 | 7.03E-09 | 8.23E-09 | 7.60E-09 | 6.47E-09 | 7.10E-09 | 8.30E-09 |
| Fine Particulate Matter Formation (DALY) | 9.37E-07 | 8.59E-07 | 8.96E-07 | 9.83E-07 | 8.34E-07 | 7.56E-07 | 7.93E-07 | 8.80E-07 |
| Fossil Depletion ($) | 0.146 | 0.142 | 0.191 | 0.187 | 0.099 | 0.095 | 0.144 | 0.140 |
| Freshwater Consumption, FW Ecosystems (species.yr) | 1.15E-14 | 9.46E-15 | 9.88E-15 | 1.22E-14 | 8.00E-15 | 5.92E-15 | 6.34E-15 | 8.70E-15 |
| Freshwater Consumption, Human Health (DALY) | 1.72E-08 | 1.43E-08 | 1.48E-08 | 1.81E-08 | 1.05E-08 | 7.58E-09 | 8.09E-09 | 1.14E-08 |
| Freshwater Consumption, Terr. Ecosystems (species.yr) | 1.15E-10 | 9.84E-11 | 1.02E-10 | 1.21E-10 | 7.42E-11 | 5.77E-11 | 6.14E-11 | 8.01E-11 |
| Freshwater Ecotoxicity [species.yr] | 2.30E-13 | 2.07E-13 | 2.45E-13 | 2.65E-13 | 1.60E-13 | 1.37E-13 | 1.75E-13 | 1.95E-13 |
| Freshwater Eutrophication (species.yr) | 2.03E-11 | 1.41E-11 | 1.48E-11 | 2.20E-11 | 1.16E-11 | 5.37E-12 | 6.12E-12 | 1.33E-11 |
| Human Toxicity, cancer (DALY) | 2.79E-09 | 2.64E-09 | 2.94E-09 | 3.06E-09 | 2.58E-09 | 2.44E-09 | 2.73E-09 | 2.85E-09 |
| Human Toxicity, non-cancer (DALY) | 2.00E-08 | 1.86E-08 | 2.32E-08 | 2.39E-08 | 1.26E-08 | 1.13E-08 | 1.59E-08 | 1.66E-08 |
| Ionizing Radiation (DALY) | 3.81E-10 | 3.66E-10 | 3.72E-10 | 3.89E-10 | 3.63E-10 | 3.48E-10 | 3.54E-10 | 3.71E-10 |
| Land Use (species.yr) | 4.92E-09 | 3.09E-10 | 3.66E-10 | 5.74E-09 | 5.48E-09 | 8.61E-10 | 9.18E-10 | 6.30E-09 |
| Marine Ecotoxicity (species.yr) | 7.91E-14 | 7.36E-14 | 9.48E-14 | 9.74E-14 | 5.96E-14 | 5.40E-14 | 7.53E-14 | 7.79E-14 |
| Marine Eutrophication (species.yr) | 2.09E-13 | 1.73E-13 | 1.78E-13 | 2.20E-13 | 1.03E-13 | 6.62E-14 | 7.19E-14 | 1.14E-13 |
| Metal Depletion ($) | 2.50E-03 | 1.91E-03 | 2.08E-03 | 2.74E-03 | 1.27E-03 | 6.78E-04 | 8.55E-04 | 1.51E-03 |
| Photochemical Ozone Formation, Ecosystems (species.yr) | 6.21E-10 | 5.32E-10 | 5.74E-10 | 6.72E-10 | 5.03E-10 | 4.15E-10 | 4.56E-10 | 5.54E-10 |
| Photochemical Ozone Formation, Human Health (DALY) | 4.34E-09 | 3.73E-09 | 4.01E-09 | 4.69E-09 | 3.52E-09 | 2.91E-09 | 3.20E-09 | 3.87E-09 |
| Stratospheric Ozone Depletion (DALY) | 4.58E-10 | 4.32E-10 | 4.69E-10 | 4.95E-10 | 3.45E-10 | 3.19E-10 | 3.57E-10 | 3.82E-10 |
| Terrestrial Acidification (species.yr) | 9.81E-10 | 9.05E-10 | 9.44E-10 | 1.03E-09 | 8.89E-10 | 8.13E-10 | 8.52E-10 | 9.35E-10 |
| Terrestrial Ecotoxicity (species.yr) | 6.47E-12 | 5.97E-12 | 6.58E-12 | 7.06E-12 | 5.39E-12 | 4.89E-12 | 5.50E-12 | 5.97E-12 |
References
- Eurostat E-Commerce Statistics for Individuals. Available online: https://ec.europa.eu/eurostat/statistics-explained/index.php/E-commerce_statistics_for_individuals#General_overview (accessed on 10 February 2020).
- Ecommerce News Europe: 9.3 Billion Parcels in 2018. Available online: https://ecommercenews.eu/europe-9-3-billion-parcels-in-2018/ (accessed on 10 February 2020).
- Weber, C.L.; Hendrickson, C.T.; Matthews, H.S.; Nagengast, A.; Nealer, R.; Jaramillo, P. Life cycle comparison of traditional retail and e-commerce logistics for electronic products: A case study of buy.com. In Proceedings of the 2009 IEEE International Symposium on Sustainable Systems and Technology, ISSST, Phoenix, AZ, USA, 18–20 May 2009. [Google Scholar]
- Edwards, J.B.; McKinnon, A.C.; Cullinane, S.L. Comparative analysis of the carbon footprints of conventional and online retailing: A “last mile” perspective. Int. J. Phys. Distrib. Logist. Manag. 2010, 40, 103–123. [Google Scholar] [CrossRef]
- Hischier, R. Car vs. packaging-a first, simple (environmental) sustainability assessment of our changing shopping behaviour. Sustainability 2018, 10, 3061. [Google Scholar] [CrossRef] [Green Version]
- Wiese, A.; Toporowski, W.; Zielke, S. Transport-related CO2 effects of online and brick-and-mortar shopping: A comparison and sensitivity analysis of clothing retailing. Transp. Res. Part D Transp. Environ. 2012, 17, 473–477. [Google Scholar] [CrossRef]
- Smidfelt Rosqvist, L.; Winslott Hiselius, L. Online shopping habits and the potential for reductions in carbon dioxide emissions from passenger transport. J. Clean. Prod. 2016, 131, 163–169. [Google Scholar] [CrossRef]
- Wygonik, E.; Goodchild, A.V. Urban form and last-mile goods movement: Factors affecting vehicle miles travelled and emissions. Transp. Res. Part D Transp. Environ. 2018, 61, 217–229. [Google Scholar] [CrossRef]
- Van Loon, P.; McKinnon, A.C.; Deketele, L.; Dewaele, J. The growth of online retailing: A review of its carbon impacts. Carbon Manag. 2014, 5, 285–292. [Google Scholar] [CrossRef]
- Van Loon, P.; Deketele, L.; Dewaele, J.; McKinnon, A.; Rutherford, C. A comparative analysis of carbon emissions from online retailing of fast moving consumer goods. J. Clean. Prod. 2015, 106, 478–486. [Google Scholar] [CrossRef]
- Pålsson, H.; Pettersson, F.; Winslott Hiselius, L. Energy consumption in e-commerce versus conventional trade channels—Insights into packaging, the last mile, unsold products and product returns. J. Clean. Prod. 2017, 164, 765–778. [Google Scholar] [CrossRef]
- Koskela, S.; Dahlbo, H.; Judl, J.; Korhonen, M.R.; Niininen, M. Reusable plastic crate or recyclable cardboard box? A comparison of two delivery systems. J. Clean. Prod. 2014, 69, 83–90. [Google Scholar] [CrossRef]
- Levi, M.; Cortesi, S.; Vezzoli, C.; Salvia, G. A comparative life cycle assessment of disposable and reusable packaging for the distribution of Italian fruit and vegetables. Packag. Technol. Sci. 2011, 24, 387–400. [Google Scholar] [CrossRef]
- Tua, C.; Biganzoli, L.; Grosso, M.; Rigamonti, L. Life cycle assessment of reusable plastic crates (RPCs). Resources 2019, 8, 110. [Google Scholar] [CrossRef] [Green Version]
- Finkbeiner, M.; Inaba, A.; Tan, R.B.H.; Christiansen, K.; Klüppel, H.J. The new international standards for life cycle assessment: ISO 14040 and ISO 14044. Int. J. Life Cycle Assess. 2006, 11, 80–85. [Google Scholar] [CrossRef]
- thinkstep. GaBi ts-Software for Life Cycle Assessment. Available online: https://www.thinkstep.com/software/gabi-software/gabi-professional (accessed on 28 February 2020).
- thinkstep. GaBi LCA Databases. Available online: http://www.gabi-software.com/international/databases/gabi-databases/ (accessed on 28 February 2020).
- Wernet, G.; Bauer, C.; Steubing, B.; Reinhard, J.; Moreno-Ruiz, E.; Weidema, B. The ecoinvent database version 3 (part I): Overview and methodology. Int. J. Life Cycle Assess. 2016, 21, 1218–1230. [Google Scholar] [CrossRef]
- CZSO. Generation, Recovery and Disposal of Waste. In Environment; CZSO: Prague, Czech, 2019. Available online: www.czso.cz (accessed on 28 February 2020).
- Huijbregts, M.A.J.; Steinmann, Z.J.N.; Elshout, P.M.F.; Stam, G.; Verones, F.; Vieira, M.; Zijp, M.; Hollander, A.; van Zelm, R. ReCiPe2016: A harmonised life cycle impact assessment method at midpoint and endpoint level. Int. J. Life Cycle Assess. 2017, 22, 138–147. [Google Scholar] [CrossRef]
- Goedkoop, M.; Heijungs, R.; Huijbregts, M.; De Schryver, A.; Struijs, J.; van Zelm, R. ReCiPe 2008 A Life Cycle Impact Assessment Method Which Comprises Harmonised Category Indicators at the Midpoint and the Endpoint Level; Ruimte en Milieu, M.V.V., Ordening en Milieubeheer, R., Eds.; RIVM: Bilthoven, The Netherlands, 2009; Available online: www.leidenuniv.nl (accessed on 28 February 2020).
- IEA Czech Republic. Available online: https://www.iea.org/countries/czech-republic (accessed on 28 February 2020).
- Cole, M.; Lindeque, P.; Halsband, C.; Galloway, T.S. Microplastics as contaminants in the marine environment: A review. Mar. Pollut. Bull. 2011, 62, 2588–2597. [Google Scholar] [CrossRef] [PubMed]
- Horton, A.A.; Walton, A.; Spurgeon, D.J.; Lahive, E.; Svendsen, C. Microplastics in freshwater and terrestrial environments: Evaluating the current understanding to identify the knowledge gaps and future research priorities. Sci. Total Environ. 2017, 586, 127–141. [Google Scholar] [CrossRef] [PubMed] [Green Version]
- Civancik-Uslu, D.; Puig, R.; Hauschild, M.; Fullana-i-Palmer, P. Life cycle assessment of carrier bags and development of a littering indicator. Sci. Total Environ. 2019, 685, 621–630. [Google Scholar] [CrossRef] [PubMed]
- Schultz, P.W.; Bator, R.J.; Large, L.B.; Bruni, C.M.; Tabanico, J.J. Littering in Context: Personal and Environmental Predictors of Littering Behavior. Environ. Behav. 2013, 45, 35–59. [Google Scholar] [CrossRef] [Green Version]
- Crabb, P.B.; Lessack, M.P. Some things are just made to be littered. Int. J. Soc. Ecol. Sustain. Dev. 2014, 5, 39–47. [Google Scholar] [CrossRef] [Green Version]
- Carpenter, E.; Wolverton, S. Plastic litter in streams: The behavioral archaeology of a pervasive environmental problem. Appl. Geogr. 2017, 84, 93–101. [Google Scholar] [CrossRef]
Figure 1.
Simplified diagram of the LCA (Life Cycle Assessment) model—baseline scenario.

Figure 2.
Pie chart showing relative importance of the impact categories using ReCiPe 1.08 (H/H) endpoint Europe normalization and weighing results.
Figure 2.
Pie chart showing relative importance of the impact categories using ReCiPe 1.08 (H/H) endpoint Europe normalization and weighing results.

Figure 3.
Graph showing contribution of process groups to Climate Change (kg CO2 eq.) impact category for the four baseline scenarios.
Figure 3.
Graph showing contribution of process groups to Climate Change (kg CO2 eq.) impact category for the four baseline scenarios.

Figure 4.
Graph showing contributions of process groups to Climate Change (kg CO2 eq.) impact category for the four alternative scenarios where reusable plastic crates are used.
Figure 4.
Graph showing contributions of process groups to Climate Change (kg CO2 eq.) impact category for the four alternative scenarios where reusable plastic crates are used.

Figure 5.
Comparison of the scenarios where a more efficient lighting is used to the baseline. Climate change impact category (kg CO2 eq.) results for the parcel no. 1 and contribution of process groups.
Figure 5.
Comparison of the scenarios where a more efficient lighting is used to the baseline. Climate change impact category (kg CO2 eq.) results for the parcel no. 1 and contribution of process groups.

Table 1.
Weight of the goods, amount and types of packaging material, and the distance it is transported per one parcel.
Table 1.
Weight of the goods, amount and types of packaging material, and the distance it is transported per one parcel.
| no. 1 | no. 2 | no. 3 | no. 4 | Distance | Vehicle | |
|---|---|---|---|---|---|---|
| Goods | 2.99 kg | 2.99 kg | 5.96 kg | 5.96 kg | x | x |
| Cardboard box | 0.68 kg | 0.68 kg | 0.68 kg | 0.68 kg | 180 km | Truck (Euro 5) |
| Filling paper | 0.42 kg | x | x | 0.49 kg | 160 km | Truck (Euro 5) |
| Plastic cushions HDPE | x | 0.02 kg | 0.06 kg | x | 700 km | Van (Euro 6) |
| Bubble wrap LDPE | x | x | 0.03 kg | 0.03 kg | 20 km | Truck (Euro 5) |
| Zip bags HDPE | x | x | 0.02 kg | 0.04 kg | 60 km | Van (Euro 6) |
| Paper adhesive tape | 4.641 g | 4.641 g | 4.641 g | 4.641 g | 220 km | Van (Euro 6) |
| Plastic adhesive tape PP | x | x | 0.196 g | 0.196 g | 220 km | Van (Euro 6) |
| Parcel to logistic center | 4.095 kg | 3.695 kg | 6.755 kg | 7.205 kg | 110 km | Truck (Euro 5) |
| Parcel to customer | 4.095 kg | 3.695 kg | 6.755 kg | 7.205 kg | 100 km | Truck (Euro 5) |
HDPE = High Density Polyethylene; LDPE = Low Density Polyethylene; PP = Polypropylene.
Table 2.
Energy and resources consumption in the logistics center per month, parts attributed to retailer, and consumption attributed to one parcel.
Table 2.
Energy and resources consumption in the logistics center per month, parts attributed to retailer, and consumption attributed to one parcel.
| Logistics Center (Per Month) | Retailer Area (Per Month) | One Parcel | |
|---|---|---|---|
| Drinking water | 25 m3 | 8.33 m3 | 2.88 l |
| Electricity | 21.5 MWh | 7.17 MWh | 2.48 kWh |
| Natural gas | 16 MWh | 5.33 MWh | 1.85 kWh |
Table 3.
LCIA (Life Cycle Impact Assessment) results of the four baseline scenarios and the alternative scenarios where plastic crates are used, calculated using ReCiPe 2016 (H) midpoint methodology.
Table 3.
LCIA (Life Cycle Impact Assessment) results of the four baseline scenarios and the alternative scenarios where plastic crates are used, calculated using ReCiPe 2016 (H) midpoint methodology.
| Baseline Scenario | Plastic Crate | |||||||
|---|---|---|---|---|---|---|---|---|
| no.1 | no.2 | no.3 | no.4 | no.1 | no.2 | no.3 | no.4 | |
| Climate Change, default (kg CO2 eq.) | 3.439 | 3.120 | 3.340 | 3.677 | 2.640 | 2.320 | 2.540 | 2.878 |
| Climate Change, incl. bio. (kg CO2 eq.) | 2.689 | 2.290 | 2.510 | 2.940 | 2.713 | 2.310 | 2.540 | 2.965 |
| FPMF (kg PM2.5 eq.) | 0.001 | 0.001 | 0.001 | 0.002 | 0.001 | 0.001 | 0.001 | 0.001 |
| Fossil Depletion (kg oil eq.) | 0.955 | 0.946 | 1.070 | 1.060 | 0.820 | 0.811 | 0.938 | 0.925 |
| FW Consumption (m3) | 0.020 | 0.018 | 0.019 | 0.021 | 0.012 | 0.011 | 0.012 | 0.013 |
| FW Ecotoxicity (kg 1,4 DB eq.) | 3.31E-04 | 2.98E-04 | 3.53E-04 | 3.81E-04 | 2.30E-04 | 1.97E-04 | 2.52E-04 | 2.80E-04 |
| FW Eutrophication (kg P eq.) | 3.03E-05 | 2.10E-05 | 2.21E-05 | 3.28E-05 | 1.73E-05 | 8.00E-06 | 9.12E-06 | 1.98E-05 |
| H. Toxicity, cancer (kg 1,4-DB eq.) | 0.001 | 0.001 | 0.001 | 0.001 | 0.001 | 0.001 | 0.001 | 0.001 |
| H. Tox., non-cancer (kg 1,4-DB eq.) | 0.088 | 0.082 | 0.102 | 0.105 | 0.055 | 0.049 | 0.070 | 0.073 |
| IR (Bq C-60 eq. to air) | 0.045 | 0.043 | 0.044 | 0.046 | 0.043 | 0.041 | 0.042 | 0.044 |
| Land Use (Annual crop eq.·y) | 0.555 | 0.035 | 0.041 | 0.647 | 0.617 | 0.097 | 0.103 | 0.709 |
| Marine Ecotoxicity (kg 1,4-DB eq.) | 0.001 | 0.001 | 0.001 | 0.001 | 0.001 | 0.001 | 0.001 | 0.001 |
| Marine Eutrophication (kg N eq.) | 1.25E-04 | 1.04E-04 | 1.07E-04 | 1.32E-04 | 6.17E-05 | 4.00E-05 | 4.34E-05 | 6.82E-05 |
| Metal Depletion (kg Cu eq.) | 0.008 | 0.006 | 0.007 | 0.008 | 0.004 | 0.002 | 0.003 | 0.005 |
| POF, Ecosystems (kg NOx eq.) | 0.005 | 0.004 | 0.004 | 0.005 | 0.004 | 0.003 | 0.004 | 0.004 |
| POF, Human Health (kg NOx eq.) | 0.005 | 0.004 | 0.004 | 0.005 | 0.004 | 0.003 | 0.004 | 0.004 |
| Strat. Ozone Depl. (kg CFC-11 eq.) | 8.63E-07 | 8.14E-07 | 8.84E-07 | 9.33E-07 | 6.51E-07 | 6.02E-07 | 6.72E-07 | 7.20E-07 |
| Terr. Acidification (kg SO2 eq.) | 0.005 | 0.004 | 0.004 | 0.005 | 0.004 | 0.004 | 0.004 | 0.004 |
| Terr. Ecotoxicity (kg 1,4-DB eq.) | 0.568 | 0.524 | 0.577 | 0.619 | 0.473 | 0.429 | 0.482 | 0.524 |
FMPF = Fine Particulate Matter Formation; FW = Freshwater; H. Tox. = Human Toxicity; IR = Ionizing Radiation; POF = Photochemical Ozone Formation; Strat. Ozone Depl. = Stratospheric Ozone Depletion; Terr. = Terrestrial.
© 2020 by the authors. Licensee MDPI, Basel, Switzerland. This article is an open access article distributed under the terms and conditions of the Creative Commons Attribution (CC BY) license (http://creativecommons.org/licenses/by/4.0/).
Share and Cite
MDPI and ACS Style
Matuštík, J.; Kočí, V. A Comparative Life Cycle Assessment of Electronic Retail of Household Products. Sustainability 2020, 12, 4604. https://0-doi-org.brum.beds.ac.uk/10.3390/su12114604
AMA Style
Matuštík J, Kočí V. A Comparative Life Cycle Assessment of Electronic Retail of Household Products. Sustainability. 2020; 12(11):4604. https://0-doi-org.brum.beds.ac.uk/10.3390/su12114604
Chicago/Turabian StyleMatuštík, Jan, and Vladimír Kočí. 2020. "A Comparative Life Cycle Assessment of Electronic Retail of Household Products" Sustainability 12, no. 11: 4604. https://0-doi-org.brum.beds.ac.uk/10.3390/su12114604
Note that from the first issue of 2016, this journal uses article numbers instead of page numbers. See further details here.