Review

Spatio-Temporal Trends of E-Bike Sharing System Deployment: A Review in Europe, North America and Asia

by
Nikolaos-Fivos Galatoulas
1,2,
Konstantinos N. Genikomsakis
2,3 and
Christos S. Ioakimidis
2,3,*
1
Department of Thermodynamics and Mathematical Physics, University of Mons, Boulevard Dolez 31, 7000 Mons, Belgium
2
European Research Area Chair (*Holder) ‘Net-Zero Energy Efficiency on City Districts, NZED’ Unit, Research Institute for Energy, University of Mons, Rue de l’Epargne, 56, 7000 Mons, Belgium
3
Inteligg P.C., Karaiskaki 28, 10554 Athens, Greece
*
Author to whom correspondence should be addressed.
Sustainability 2020, 12(11), 4611; https://0-doi-org.brum.beds.ac.uk/10.3390/su12114611
Submission received: 27 April 2020 / Revised: 28 May 2020 / Accepted: 2 June 2020 / Published: 5 June 2020
(This article belongs to the Collection Urban Energy Management and Sustainable Transportation)

Abstract

:
Recent data on conventional bike and/or electric bike (e-bike) sharing systems reveal that more than 2900 systems are operating in cities worldwide, indicating the increased adoption of this alternative mode of transportation. Addressing the existing gap in the literature regarding the deployment of e-bike sharing systems (e-BSSs) in particular, this paper reviews their spatio-temporal characteristics, and attempts to (a) map the worldwide distribution of e-BSSs, (b) identify temporal trends in terms of annual growth/expansion of e-BSS deployment worldwide and (c) explore the spatial characteristics of the recorded growth, in terms of adoption on a country scale, population coverage and type of system/initial fleet sizes. To that end, it examines the patterns identified from the global to the country level, based on data collected from an online source of BSS information worldwide. A comparative analysis is performed with a focus on Europe, North America and Asia, providing insights on the growth rate of the specific bikesharing market segment. Although the dockless e-BSS has been only within three years of competition with station-based implementations, it shows a rapid integration to the overall technology diffusion trend, while it is more established in Asia and North America in comparison with Europe and launches with larger fleet sizes.

1. Introduction

Recent years have witnessed a rapid growth in the popularity of bikesharing systems (BSSs) globally, in alignment with the urban transformations implied in the context of smart city planning, where zones dedicated to pedestrian and public transportation access are adopted as a key measure for decongestion, while BSSs provide a sustainable mobility alternative for densely populated city centers [1]. Supported by technological advances over the years, including mobile technology, electronic payment and GPS-enabled devices, BSSs have been overcoming many operational challenges to provide fully automated, secure and cost-effective systems. Even though the BSS concept dates back to the 1960s, and despite the fact that less than 10 cities globally were operating such systems until the late 1990s [2], sharing systems based on conventional bikes and/or electric bikes (e-bikes), which in the latter case are typically referred to as e-bike sharing systems (e-BSSs), have grown to more than 2900 systems operating in cities worldwide, as of November 2019, according to the bikesharing map developed by DeMaio and Meddin [3].
To a significant extent, the success of BSSs, and later of e-BSSs over the past years, with both dock-based (or station-based) and dockless (or free-floating) implementations, followed the developments in station infrastructure, enabling automated electronic access to bikes/e-bikes, smartphone technologies and fast credit card transactions. With an updated service point infrastructure, main obstacles in the functionality of the system were overcome. Information on station locations, vehicle availability or reservation on-demand, anti-theft and vandalism prevention, rapid payments and member subscription programs comprise the main advancements that ensured an enhanced and feature-rich system operability. On the one hand, real-time tracking of the vehicles through the on-board installed GPS components and alarm systems aims to prevent theft and vandalism, while on the other hand, it enables information technology (IT) solutions on the operators server side to guide users into dedicated parking zones for avoiding congestion of bikes in central areas or suggest drop-off locations that facilitate rebalancing via an application on users’ smartphones.
Aiming to explore the adoption patterns of BSSs and their evolution over the past decades, the authors in [4] combined quantitative and qualitative methods on data from operators in Europe and North America and secondary sources (Internet, online surveys and reports) within the context of diffusion innovation theory [5], which describes the rate of adoption of an innovation while it spreads through social systems (urban societies), assuming that it is related to the gradual shifts on the perception of the innovation’s characteristics. Their findings suggested that Europe was leading in the adoption rate, while the deployment of BSSs in North America was gaining momentum and expected to follow in investment. According to their timing in adopting a new technology, specific groups can be defined based on the level of risk-taking and stage of adoption as to the maturity of the innovation. Hence, diffusion innovation theory is suitable when analyzing the trends of e-BSS deployment growth over different continents. In a similar direction, the work in [6] provided empirical results on the dispersion of bikesharing innovation focusing on the BiciMAD system, which is the e-BSS with electrically assisted bikes deployed in Madrid, based on a series of surveys among subscribers, where the adopter profiles were categorized in four main segments, with cycling familiarity being the main classification attribute. Criteria for selecting e-bikes for the e-BSS fleet are examined in [7].
The paper in [8] presented the automated collection process of bikesharing data from 38 BSSs located in Europe, the Middle East, Asia, Australasia and the Americas, in order to analyze the temporal and spatial patterns, relationships and characteristics. The work in [2] reviewed the literature in bikesharing from North America, Asia, Europe and Australia, covering a wide range of relevant topics, such as growth, usage patterns, user preferences, demographics and barriers to bikesharing. The study in [9] discussed the findings from the scientometric analysis of 208 articles on bikesharing, revealing that the US, China, Canada, England and Australia are the most significant contributors in this field of research, while identifying the underlying trend and increasing interest of the research community in dockless BSSs. In this context, the authors in [10] employed an empirical analysis to examine and compare the deployment of dock-based and dockless BSSs in China. The differences in spatio-temporal usage patterns of dockless BSSs linking to metro stations were analyzed in [11], using Shanghai, China as a case study. Similarly, spatio-temporal usage patterns of BSSs near rail transit stations in Beijing, China were discussed in [12].
Combining all the above, this paper addresses the gap in the literature regarding the deployment of the e-BSS in particular, conducting a review of its spatio-temporal characteristics. To that end, it examines the patterns identified from the global to the country level, based on data collected from an online source of self-service automated, advanced automated and mixed automated/manned public use BSSs worldwide [3]. A comparative analysis is performed with a focus on Europe, North America and Asia. From the processing and visualization of the collected data, insights on the growth rate of the specific bikesharing market segment can be revealed. To the best of the authors’ knowledge, the present study comprises the first attempt to (a) map the worldwide distribution of e-BSSs, (b) identify temporal trends in terms of annual growth/expansion of e-BSS deployment worldwide and (c) explore the spatial characteristics of the recorded growth, in terms of adoption on a country scale, population coverage and type of system/initial fleet sizes. From a scientific point of view, the contributions of this paper include the analysis of spatial and temporal trends on e-BSS deployment in the context of diffusion innovation theory, as well as the identification of relationships between the total e-BSS size and population size of the cities in the regions under study, using linear regression modelling.
The rest of this paper is organized as follows: Section 2 presents the methods employed for the data collection, processing and analysis of the spatio-temporal relationships. Section 3 presents the results obtained and provides an extensive discussion on the spatio-temporal trends of e-BSS deployment in Europe, North America and Asia, while Section 4 underlines the main conclusions of this work.

2. Materials and Methods

2.1. Data Collection

The analysis of BSS data usually is performed on data released sporadically from operators, or by supplied application programming interfaces (APIs), which enable external software developers to access operator website generated data [8]. The aim of this analysis is to capture global trends regarding the deployment of e-BSSs, through gathering and mapping the following information fields: city of operation, launch date, number of e-bikes on initial stage of deployment, geographical coordinates, number of stations, country of operation, continent, whether the system was previously a conventional bikeshare and running a mixed fleet system.
An open access online source containing information on BSSs worldwide, initiated by Paul DeMaio in 2007 and maintained by Russell Meddin since 2009, namely The Bike-sharing Map (www.bikesharingmap.com) [3], provides an extensive database for mining e-BSS locations, fleet and station sizes along with launch dates and updates on operation status. Each entry of the database also includes a field with the source describing the deployment of the system, e.g., news, and publications on operators’ or public authorities’ websites, among others. The Bike-sharing Map is typically employed for the purposes of relevant studies on the deployment of BSSs, as in [2,8,10]. In this context, The Bike-sharing Map is employed for the purposes of this work as a suitable database containing e-BSS deployment data for the three regions under study, namely Asia, Europe, and North America. The website was accessed on November 2019, and a total of 2937 BSS information entries were processed in the RStudio integrated development environment [13], employing software tools written in the R programming language [14]. Data were initially acquired in KML format, and converted to formats compatible with the processing software, resulting to four fields containing string values.

2.2. Data Treatment

Upon retrieval, the dataset was filtered based on a string search for the terms “e-bike” or “pedelec”, consequently, entries with mixed fleet compositions (bikes and e-bikes) were considered in the analysis, leading to a dataset of 266 entries tallying 79,163 shared e-bikes. Geographical coordinates of system locations were directly extractable from the mined dataset, by means of a string separator on the name of city field, further distinguishing point coordinates as different columns (latitude, longitude) for map visualization purposes and a reverse geolocation of the country and continent fields. In addition, a string query on city names was applied in order to retrieve city population size data, therefore completing the comparison on fleet size coverage ratios from the quota database. With the use of string manipulation, launch dates were extracted and stored in a separate column, formatted accordingly. It is important to mention that 19 entries (16 station-based, 3 dockless, with 10,923 e-bikes) were not included in historical plots due to missing timestamp information, following a manual screening process. In turn, city population quotas were retrieved via string matching with the world cities dataset [15] and a control operation on coordinates, therefore certain locations were excluded from the population coverage evaluation due to their exclusion from the queried dataset.
For the purposes of this work, exploratory data analysis (EDA) is employed as a data analysis method for summarizing the data so as to detect patterns, extract main characteristics and create graphical representations using different parameters.

2.3. Linear Modelling

Linear models, or regression models compare the distribution of a response variable (in this case the total number of deployed e-bikes) or a characteristic of this distribution to that of an explanatory or independent variable (city population). Statistical significance is evaluated by means of the p-test value, indicating the suitability of the selected independent variable in the explanation of the variance in the response variable. Both variable distributions were identified with rightward skewness, meanwhile, the 95th percentile of the e-bike fleet size distribution was calculated at 1000 e-bikes, while for the city distribution population, it was estimated at 8.2 million citizens. Population and e-BSS launch fleet size values were both log-transformed on the base of 10, resulting in normally distributed variables, which in turns enables a better visualization and facilitates the interpretation of the coefficient of correlation. The hypothesis checked was whether population size is proportional to the roll-out fleet size, in other words, if operators decided to launch a larger system depending on the city’s population.

3. Results and Discussion

In this section, a description of the key similarities and differences among the e-BSSs recorded in the database is attempted through exploratory data analysis and accompanying visualizations. It must be mentioned that determining the exact e-BSS adoption trends is hindered by its inherent rapid growth rate as well as the multiple data sources available. Moreover, the dataset refers to e-BSS launches, therefore capturing a single instance of the systems’ state, while ridership data were unavailable. Analyzing e-BSS launch data can be useful in understanding the strategic viewpoint of actors in the e-BSS market, thereupon explaining their operative decisions and how they tailor their initial fleet size depending on the intended installation.
The structure of the analysis was designed to trace the diffusion characteristics from a worldwide perspective to a breakdown per continent and further on the presentation of adoption leaders at the national level, in terms of cumulative number of deployed systems and respective size, as well as vehicle to population ratios and details on the largest systems reported in the data.

3.1. Global Outlook of E-BSS Deployment

A global outlook on the uptake of e-bikes in bikesharing is explored in the present section. An assessment of the temporal evolution of e-BSS is performed through an initial screening of the primary dataset, containing both conventional and electrified fleet systems. The annual shares of the number of system launches are distinguished upon their bikesharing system type, revealing the gradual penetration of e-BSS compared with the established conventional bikesharing.
Observing the recorded annual worldwide system deployments—note that 2019 is not fully incorporated since entries are updated until November 2019 (Figure 1)—demonstrates the rapid growth of bikesharing during the past decade, from a total of 20 new systems deployed in 2008 to 337 in 2018, equivalent to an average annual growth rate of 39.6%. In Figure 1, BSSs offering both conventional and electric bikes are classified as e-BSSs, representing a partial or full electrification of the bike fleet. Focusing on the average annual growth rate of e-BSSs during the decade 2008–2018, it is estimated at 79.3%. Moreover, by the comparison of annual growth rates, three major milestones can be identified, reflecting different innovation maturity stages concerning bikesharing technology. An abrupt increase can be traced to the variation in figures from 2012 to 2013, with 59 systems (53 BSSs and 6 e-BSSs) launching in 2012 compared with 135 in 2013 (124 BSSs and 11 e-BSSs), translating to a 129% increase in deployment. Next, a deceleration can be observed from 2014 to 2015, reflecting the failure of third generation bikesharing technology to convince in terms of operability and scalability, equivalent to a 16% decrease. From 2015 till the peak observed in 2018, an increasing growth trend is recorded (139% over three years), with 2018 topping deployment rates with a total of 337 systems (259 BSSs and 78 e-BSSs) starting their operation during that year. More specifically, e-BSSs expanded from 17 launches in 2015 to 78 in 2018, corresponding to an almost 4-fold growth. The latter can be accounted to the introduction of massive systems in China and the USA, along with dockless bikesharing gaining acceptance and persuading investors as a reliable solution. Interestingly, figures for 2019 underline the potential of e-BSSs to scale-up and compete with conventional BSSs, since 31.7% of service launches (65 e-BSSs) were e-bike-based.
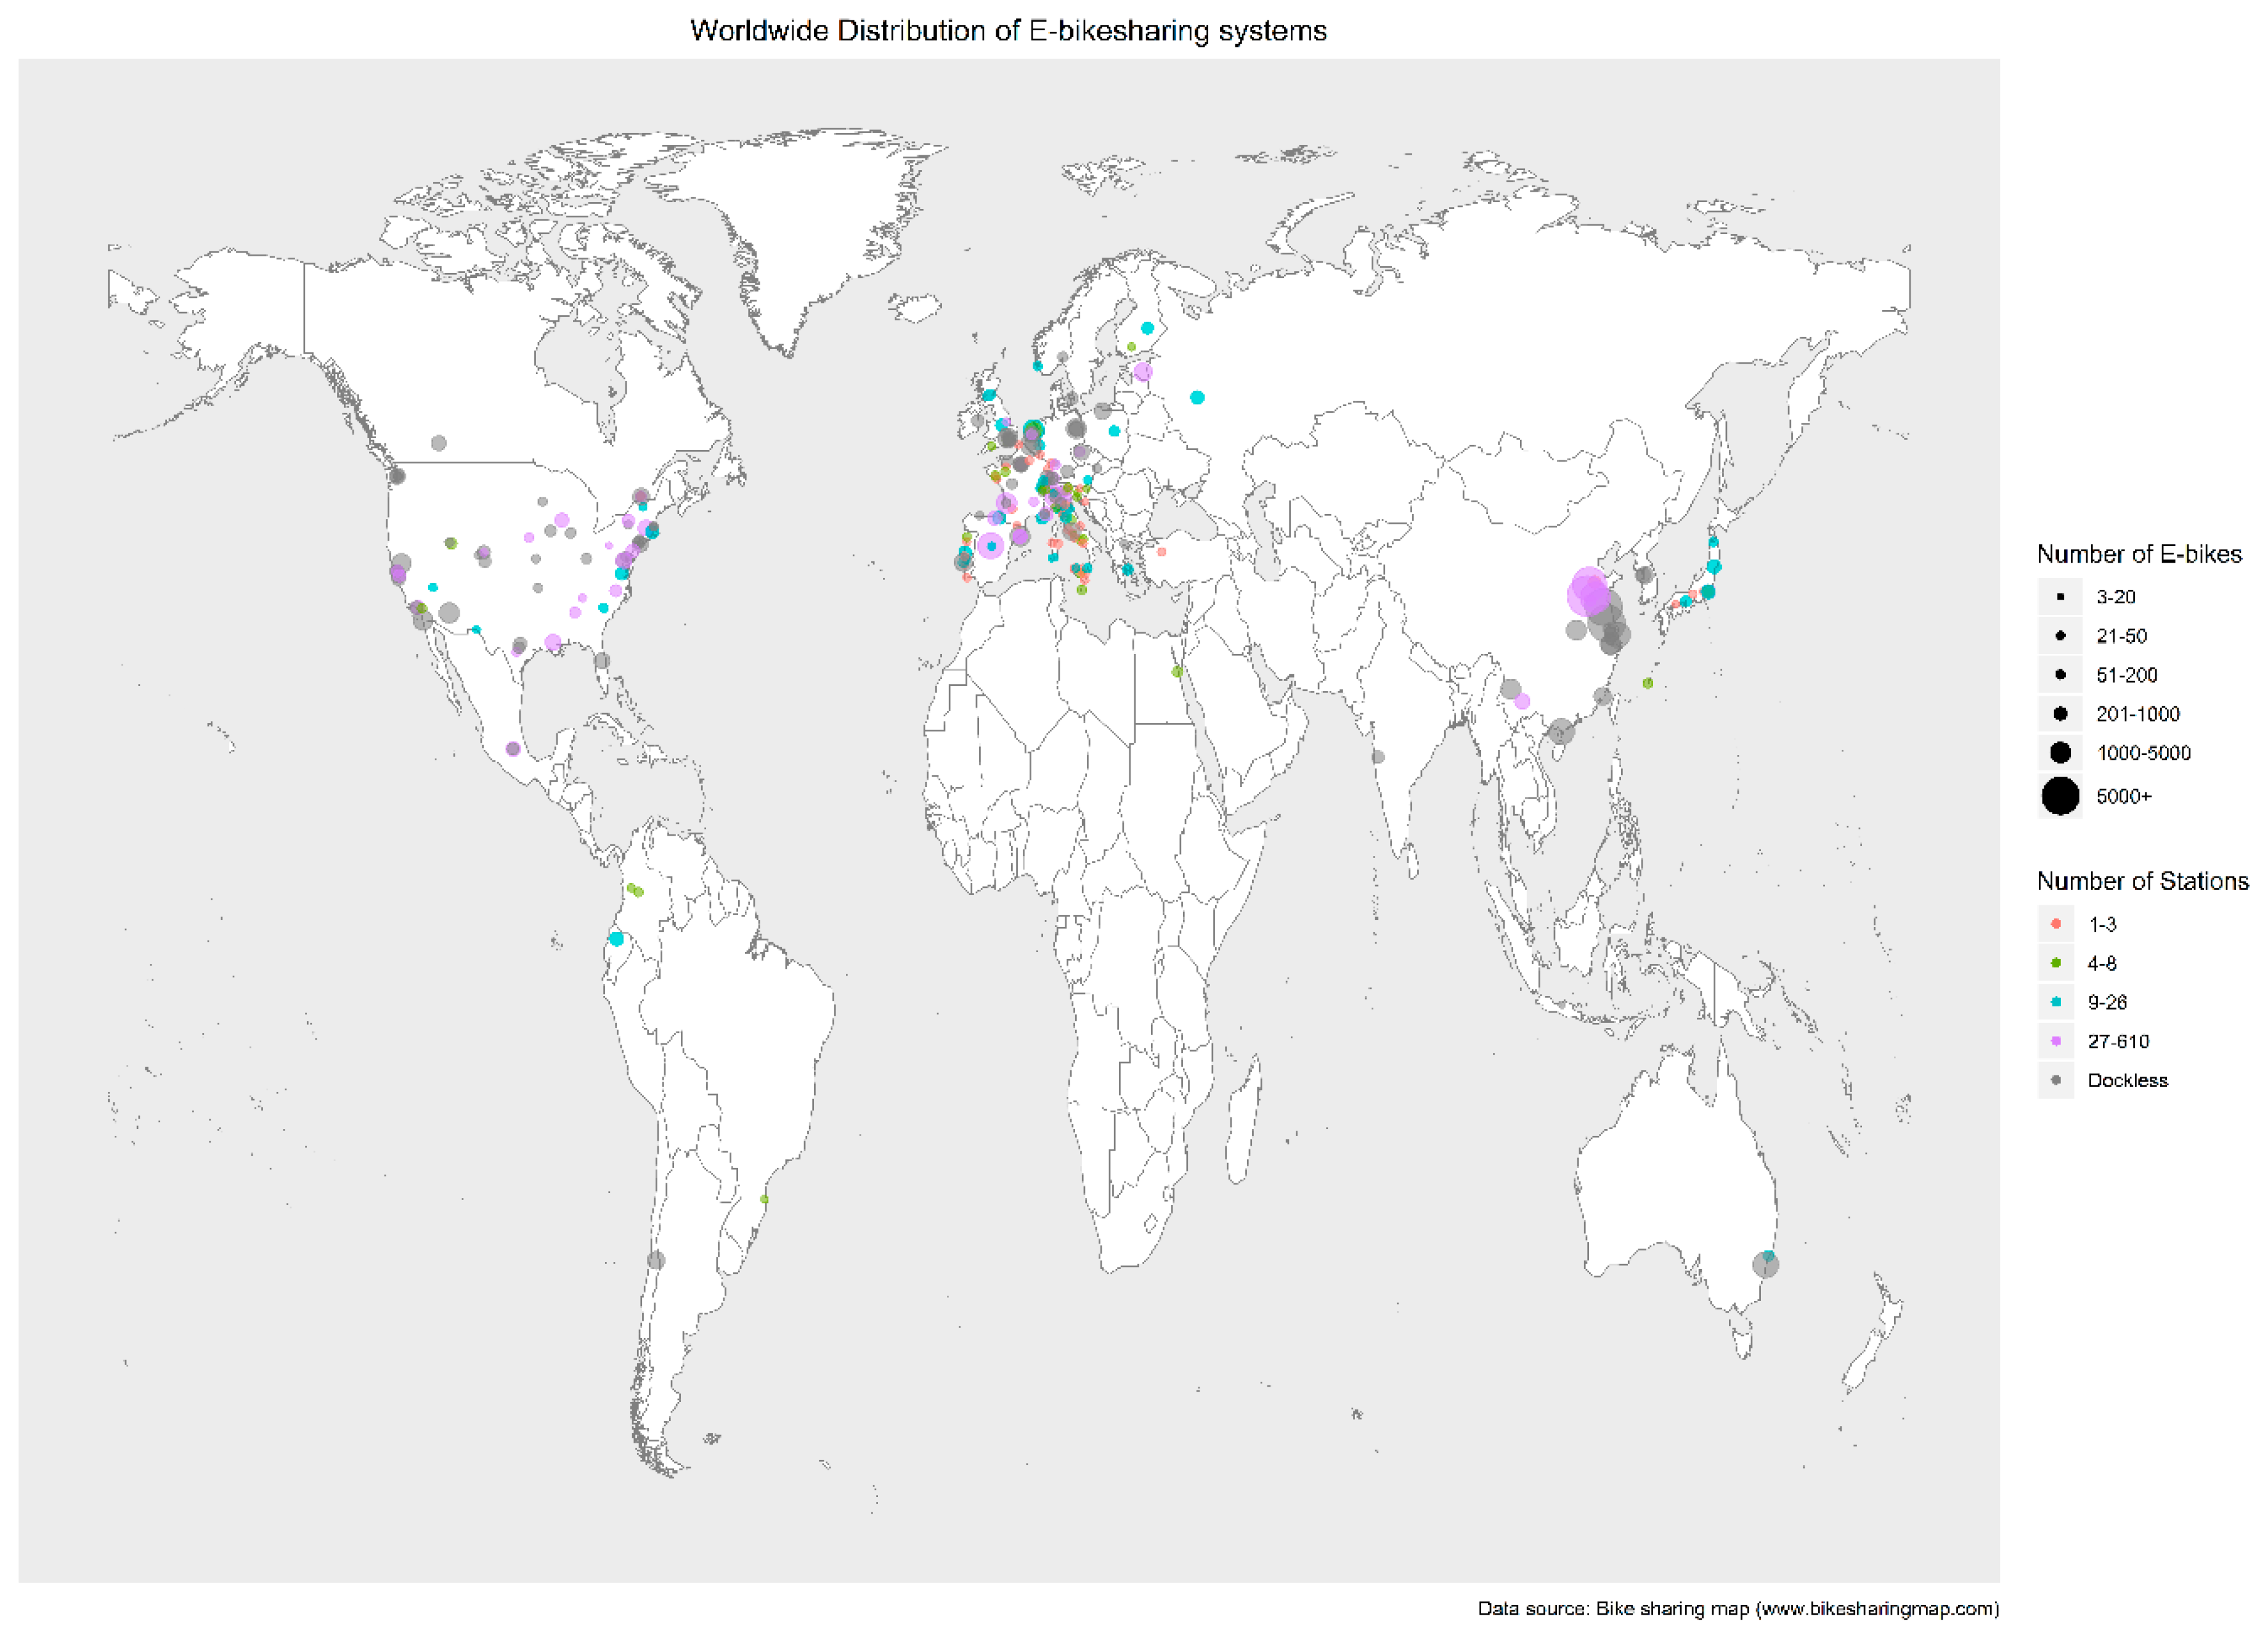
Figure 2 maps the global distribution of the e-BSS locations based on the geographical coordinates mined from the primary dataset. In accordance with the findings in [4], the majority of e-BSSs are primarily located in Europe (59%) followed by the Americas (27%) and Asia (13.1%), while Egypt and Australia are the only countries from Africa and Oceania featured in the dataset. However, larger fleets are met in Asia (35,963 e-bikes), where the adoption of the technology occurred at a later stage, on which fourth generation bikesharing technologies were developed with geo-tracking integrated on the shared vehicles, allowing the operation and control of extended fleet coverage. Europe trails with 25,564 shared e-bikes, while North America registered 13,894 e-bikes, evidencing that e-BSSs are diffused mainly on the North Hemisphere (95% of worldwide shared e-bike fleet). In total, 231 cities were included in the dataset, with Europe leading in small station-based launches in contrast with North America and Asia, where larger scale launches were realized. The first record in the dataset is a station-based e-BSS located in Monaco, launching in 2008 with 10 e-bikes in four stations as a mixed fleet scheme and operated by the local bus company, and thus can be credited as the longest running e-BSS in Europe.

3.2. Analysis per Region

Since a global outlook on the uptake of e-BSSs has been provided in the previous section, it is yet essential to detail the spatio-temporal trends per region. It can be noted that the e-BSS is becoming a considerable alternative in bikesharing as proven by the respective shares of launches per system type worldwide, specifically during the past two years. Large-scale deployments infer higher initial capital investment costs when contrasted with conventional BSSs, and when considering the average market purchase value of an e-bike in relation to that of a regular bike.
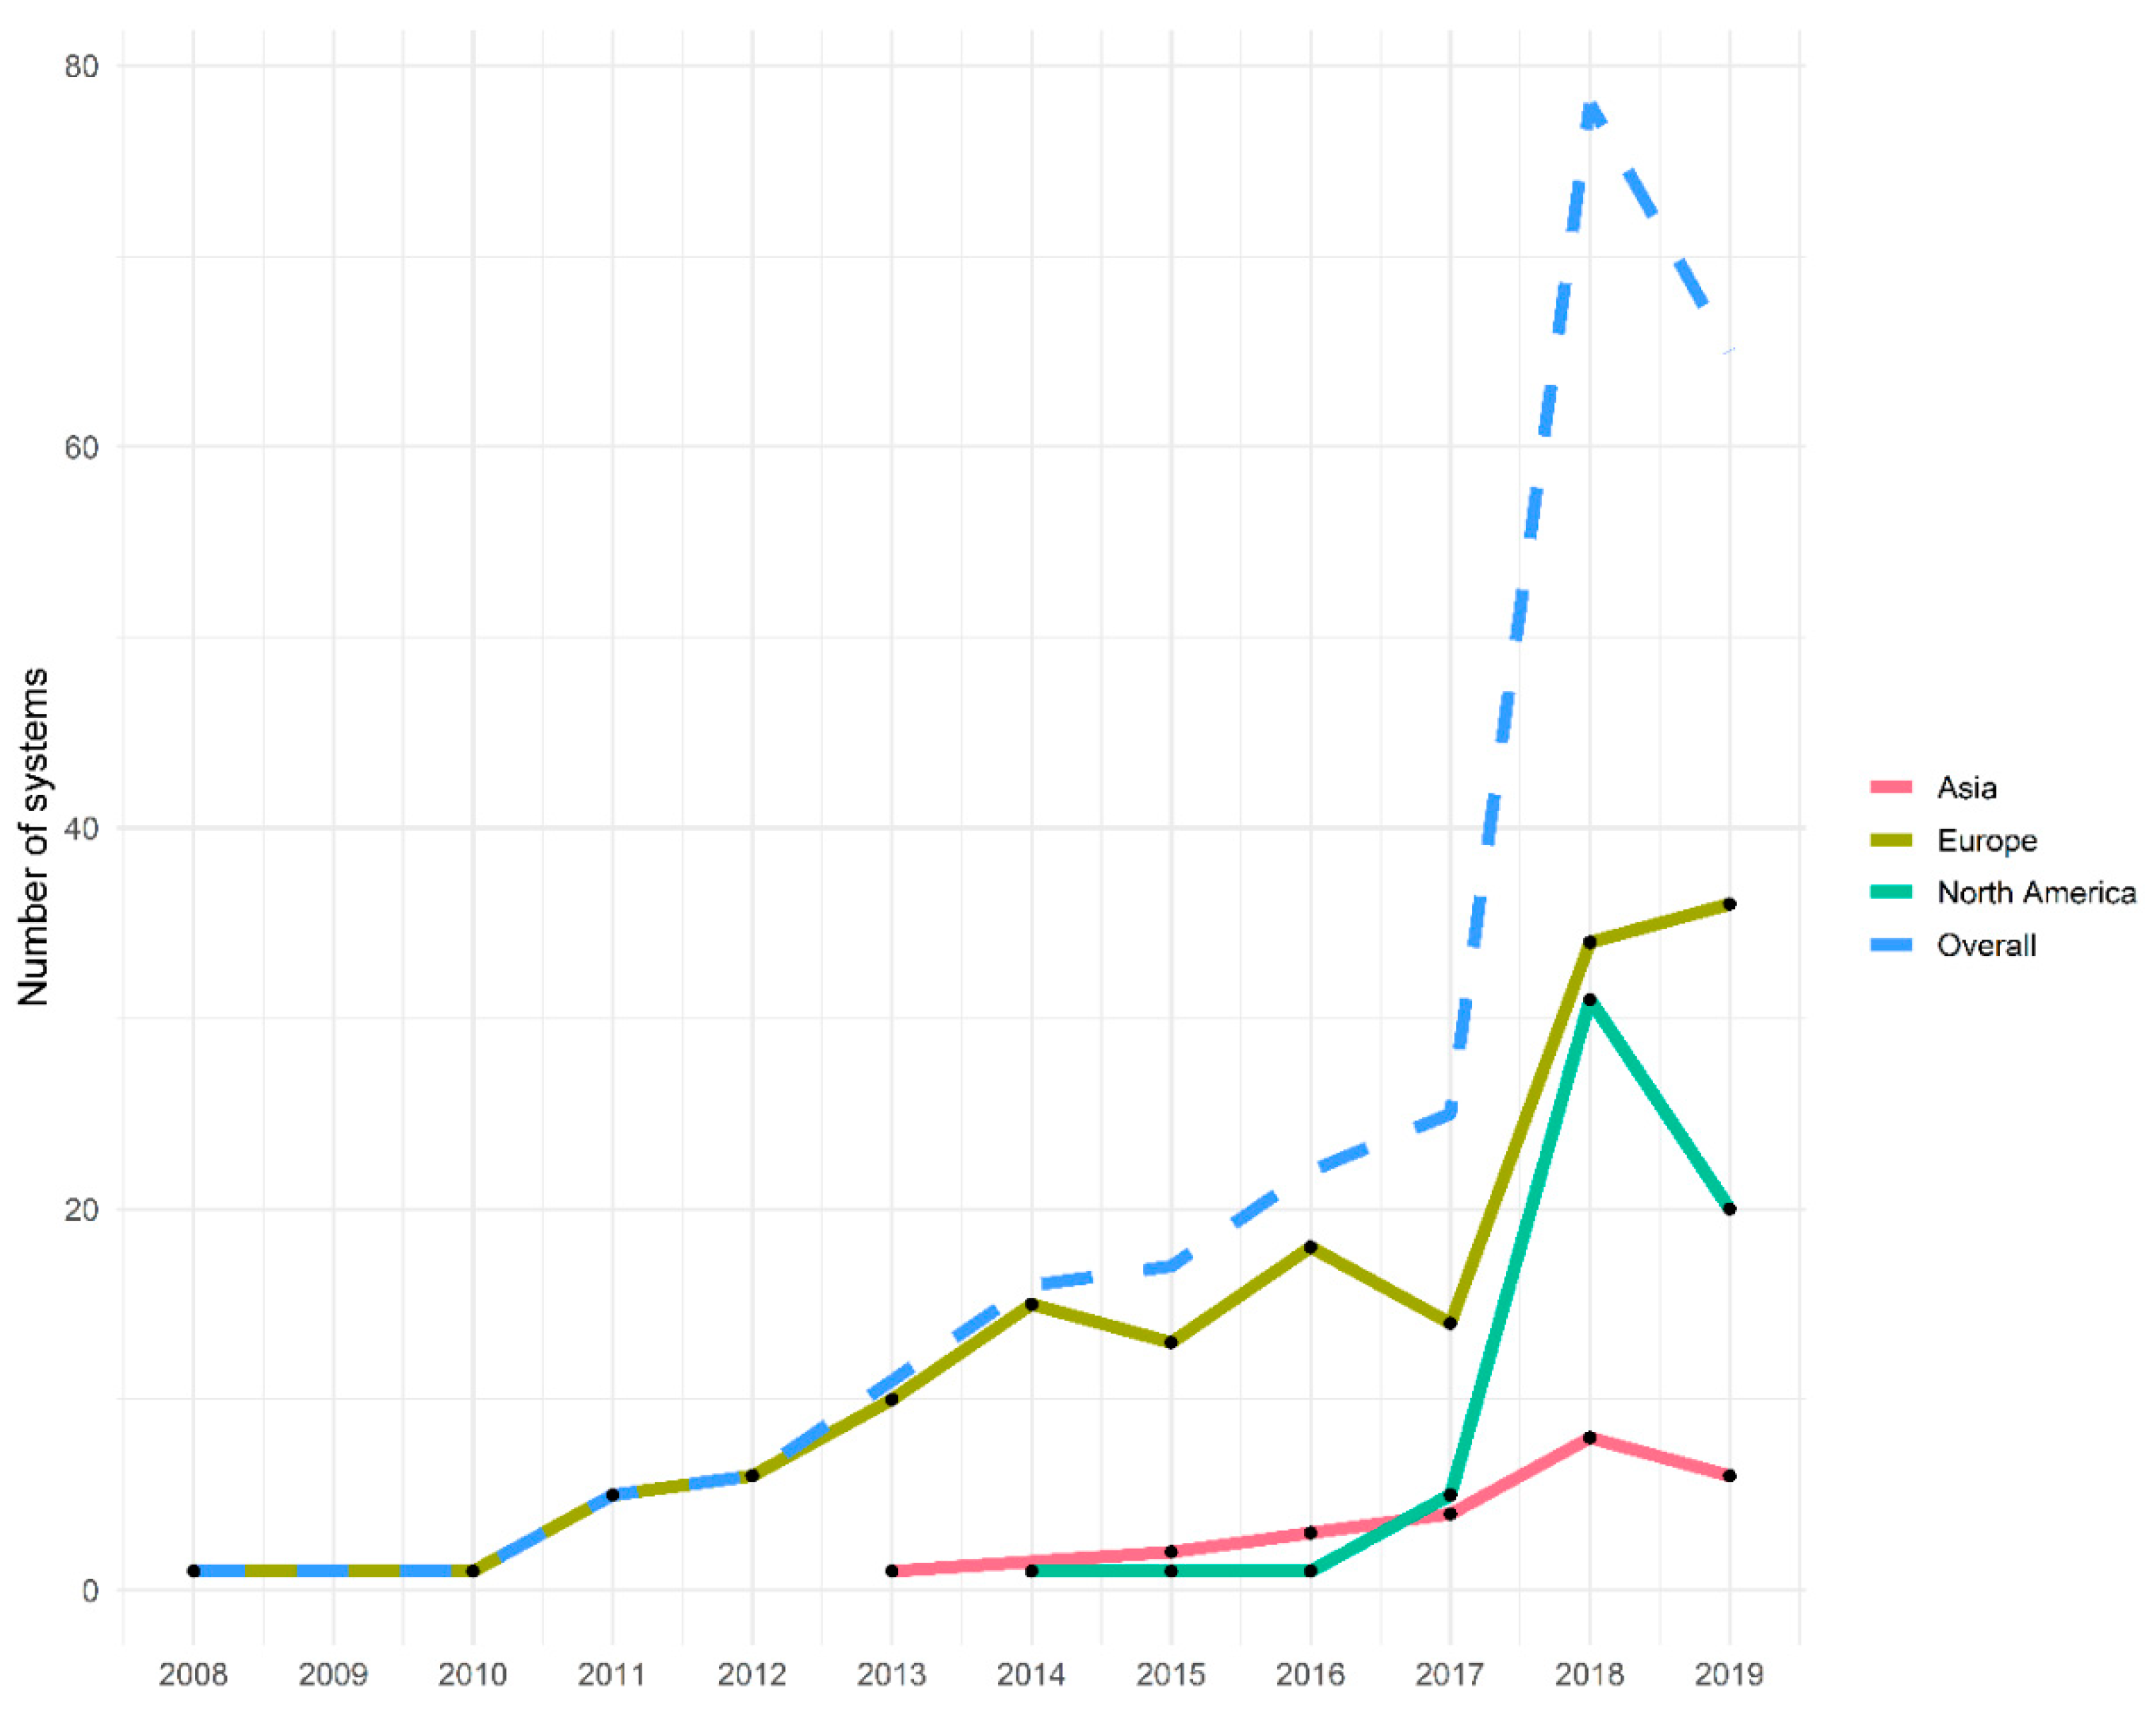
Investigating the rate of e-BSS diffusion, an initial step is to record the global overall trend in annual system launches. To this end, Figure 3 details the number of new systems per year in Europe, North America and Asia, as well as the overall worldwide trend. All curves resemble a sigmoid curve, in accordance with the key feature of innovation diffusion theory [5], and thus a delayed adoption during the first years, followed by a rapid growth. Breaking down the deployment rate per region, it can be observed that Europe held the initiative in adoption for the first five years till the concept was spread to Asia and one year later to North America. In fact, the overall trend coincides with the European market until 2013, although the uptake of electrified shared bike fleets was reluctant. The delayed entry of the two other key regions contributed to the global average annual growth rate of e-BSSs for the period 2014–2017, where the European market presented variations and instability. However, the level of system launches remained relatively low in both regions, characteristic of the delayed adoption of e-BSSs. Impressively, the increase in the cumulative number of system launches in North America traced the European trend in 2018, taking off e-BSSs to 23.1% of new bikesharing systems in that year. The differences in diffusion patterns per region can be summarized in the following statements: Europe led the adoption in the first years when bikesharing technology was still in the third generation and gradually transitioning to the fourth, with a stable diffusion pattern till 2018; Asia since 2015 is establishing the fourth generation bikesharing technology, remaining hesitant in the large-scale integration of e-bikes; meanwhile, North America is presenting a clear diffusion pattern, boosting the e-BSS uptake. Since 2019 is not fully included, all average annual growth rates are calculated till 2018, corresponding to 230% for North America, 58.3% for Asia and 75.8% for Europe.
An important contribution to the e-BSS expansion was marked by large actors in vehicle sharing schemes, for instance, Forever-Gonbike in Asia launched seven systems during 2017–2018, representing a high share of the innovation’s diffusion (average 56% of overall deployments in Asia) alongside public investment, while Uber, Jump and Lime in North America were responsible for the launch of 29 systems in the three-year period 2017–2019 (average 52% of overall deployments in North America), signifying the shift from the innovator stage to the early adoption phase of the technology and attempting to gain a pivotal placement in leading the e-BSS landscape. In Europe, the market appears more fragmented with the large multinationals playing a minor part in e-BSS diffusion along with smaller operators.
In terms of the number of e-bikes, large players dominated the annual percentage shares of e-BSS deployment during the past three years with massive roll-outs over the three examined regions. In detail, 72% of shared e-bikes deployed globally in 2017 were attributed to a large operator, mainly Forever-Gonbike with 62%. This is repeated in 2018, where 71% of shared e-bikes globally were rolled-out by a large operator, in this case with respective shares distributed more smoothly among operators, while in 2019, this percentage dropped to 30%.
Aiming to examine in detail the technical characteristics of e-BSS deployments, a disaggregation of the diffusion curves presented above is pursued upon three exploratory variables (Figure 4). Firstly, the total number of e-bikes deployed as an indicator of the system’s size, then a variable capturing whether a specific system is operating a mixed shared fleet and finally a variable indicating the type of vehicle sharing (dockless or station-based). The latter comprises the main technological attribute distinguishing the operating model followed by e-BSS operators, in the meantime providing a quantified comparative basis for the assessment of the innovation diffusion between the third generation bikesharing counterposed with the fourth generation technology.
As a general observation, it can be supported that the dockless e-BSS is more established in Asia and North America in comparison with Europe and launches with larger fleet sizes (mean 465) than station-based e-BSSs (mean 166). The first dockless e-BSS launched in Cincinnati, Ohio in 2014 with a fleet size of 102 e-bikes, prior to its wide establishment from 2016 and onwards. Cross-examining the evolution of fleet type annual percentage shares on the global scale, in the last two years, the dockless e-BSS has gained a significant share since its introduction. In particular, 47 out of 78 total e-BSS deployments were dockless in 2018, in contrast to 7 out of 25, in 2017. The pattern proceeds till November 2019, where 34 out of 67 e-BSSs were dockless bikeshares. Elaborating these findings per region and taking into account the respective fleet sizes for the period during which both types coincide (2016–2019), in Europe, dockless e-bikes deployed constituted 13% in 2016 and reached 78% of total e-bikes deployed in 2019, in Asia, e-BSS fleets were mainly composed (98%) of dockless e-bikes till 2019 when the trend reversed and the respective recorded shares were 15% dockless and 85% station-based, meanwhile in North America, a 70% fraction at the end of 2017 dropped to 45% in late 2019. What is notable in the case of the dockless e-BSS is its rapid integration to the overall technology diffusion trend, only within three years of competition with station-based implementations. Specifically, the recorded average annual growth rate from 2014 to 2019 for dockless e-BSSs was 200%, whereas for station-based e-BSSs, it was 18%. Nevertheless, the overall growth of station-based remains positive since from 2008 to 2019, it corresponded to a 60.7% annual growth rate.
Regarding the inclusion of e-bikes in mixed fleet sharing schemes, the data revealed that in Europe, where e-BSS adoption was engaged earlier than the other regions, e-bikes were initially offered as an additional vehicle option in conventional BSSs until 2012, when the first exclusively electrified e-BSS launched in Predazzo, Italy. The gradient scale in Figure 4 describes the percentage of systems, regardless of docking type, operating under a mixed fleet scheme with their respective launch year. It can be derived from the first years of e-BSS launches in Europe, that the implementations were mainly foreseen as mixed fleet schemes, similar to North America. In addition, station-based schemes supplying a mixed fleet are more favorable than dockless schemes.
Another factor for e-BSS deployment unraveling further details on the temporal characteristics of the diffusion was the monthly seasonality of launches per region. Figure 5 presents the number of e-BSS deployments per region by month of launch. It is evident that summer months are the most preferred for the launch of an e-BSS (40%). This can be accounted to certain aspects, such as the seasonal character of bikesharing due to the dependence of ridership from weather conditions, the fact that the studied regions are located in the Northern Hemisphere and the aim of operators to attract also tourists in order to accelerate their service roll-out plan. In detail, July holds a 17% share, trailed by June at 16% and May at 10%. The distribution for Asia is uniform with a peak from March to June, however, the number of entries is only 24, in Europe, the peak is recorded in June with 32 entries out of 153 resembling a normal distribution, while for North America, an abrupt peak (21 e-BSSs out of 59) appears in July, with the remaining months trailing, therefore concentrating a lower preference for deployment.
Within the context of discovering the underlying motives for e-BSS diffusion and launch fleet sizing as a function of population, a linear regression model is applied on each region between the logarithms of population size and the logarithm of the number of e-bikes deployed. This log transformation is motivated from assuming a non-linear relationship for the compared variables. Additionally, capturing the correlation between these variables can provide useful arguments for validating the assumption that cities with larger populations will necessarily require larger fleet coverage. In this direction, Figure 6 demonstrates the resulting plots with their respective fitted linear regression curves. Clearly, a low correlation (0.0567) pinpoints the inadequacy of the fitted curve to describe the relationship between the data points from Asia, suggesting that a polynomial relationship could improve the regression model’s accuracy. By comparing the strengths of correlation, attempting to model the relationship between population and fleet size fails to score a reasonable adjusted R squared value for Asia, therefore contradicting the initial hypothesis. Nevertheless, the assumption is confirmed for the remaining two regions with calculated correlations higher than the results presented for the early stages of the bikesharing technology diffusion in [4].
Specifically, the previous study focusing on the diffusion of public BSSs over a 15-year timespan (1998–2012) presented a 0.1994 R2 value for 55 BSSs in Europe and 0.1315 for 19 BSSs in North America. The respective values estimated in this study were 0.4679 for 97 e-BSSs in Europe and 0.1484 on 45 e-BSSs in North America. Although these coefficients are relatively low to suggest a strong correlation between the examined variables, it has to be mentioned that cities recording more than one system were aggregated on a common population value.

3.3. Deployment on Country Scale

Deployment trends at the continental level revealed differences in average annual growth rates between the three regions with the highest incorporation in the dataset, nonetheless, an exploration of the magnitude of the trends on a country scale allows the inference of the contribution of specific e-bike markets. It is expected that major drivers in the adoption of e-BSSs will be the largest bikesharing markets with an established cycling tradition. A normalization on population size serves as the weighted comparative standard for the appeal of e-BSS technology, as well as the growth potential in the studied location. Furthermore, this analysis can highlight specific deployment features in finer resolution.
Aiming to explore the characteristics of the innovation diffusion at the national level, 
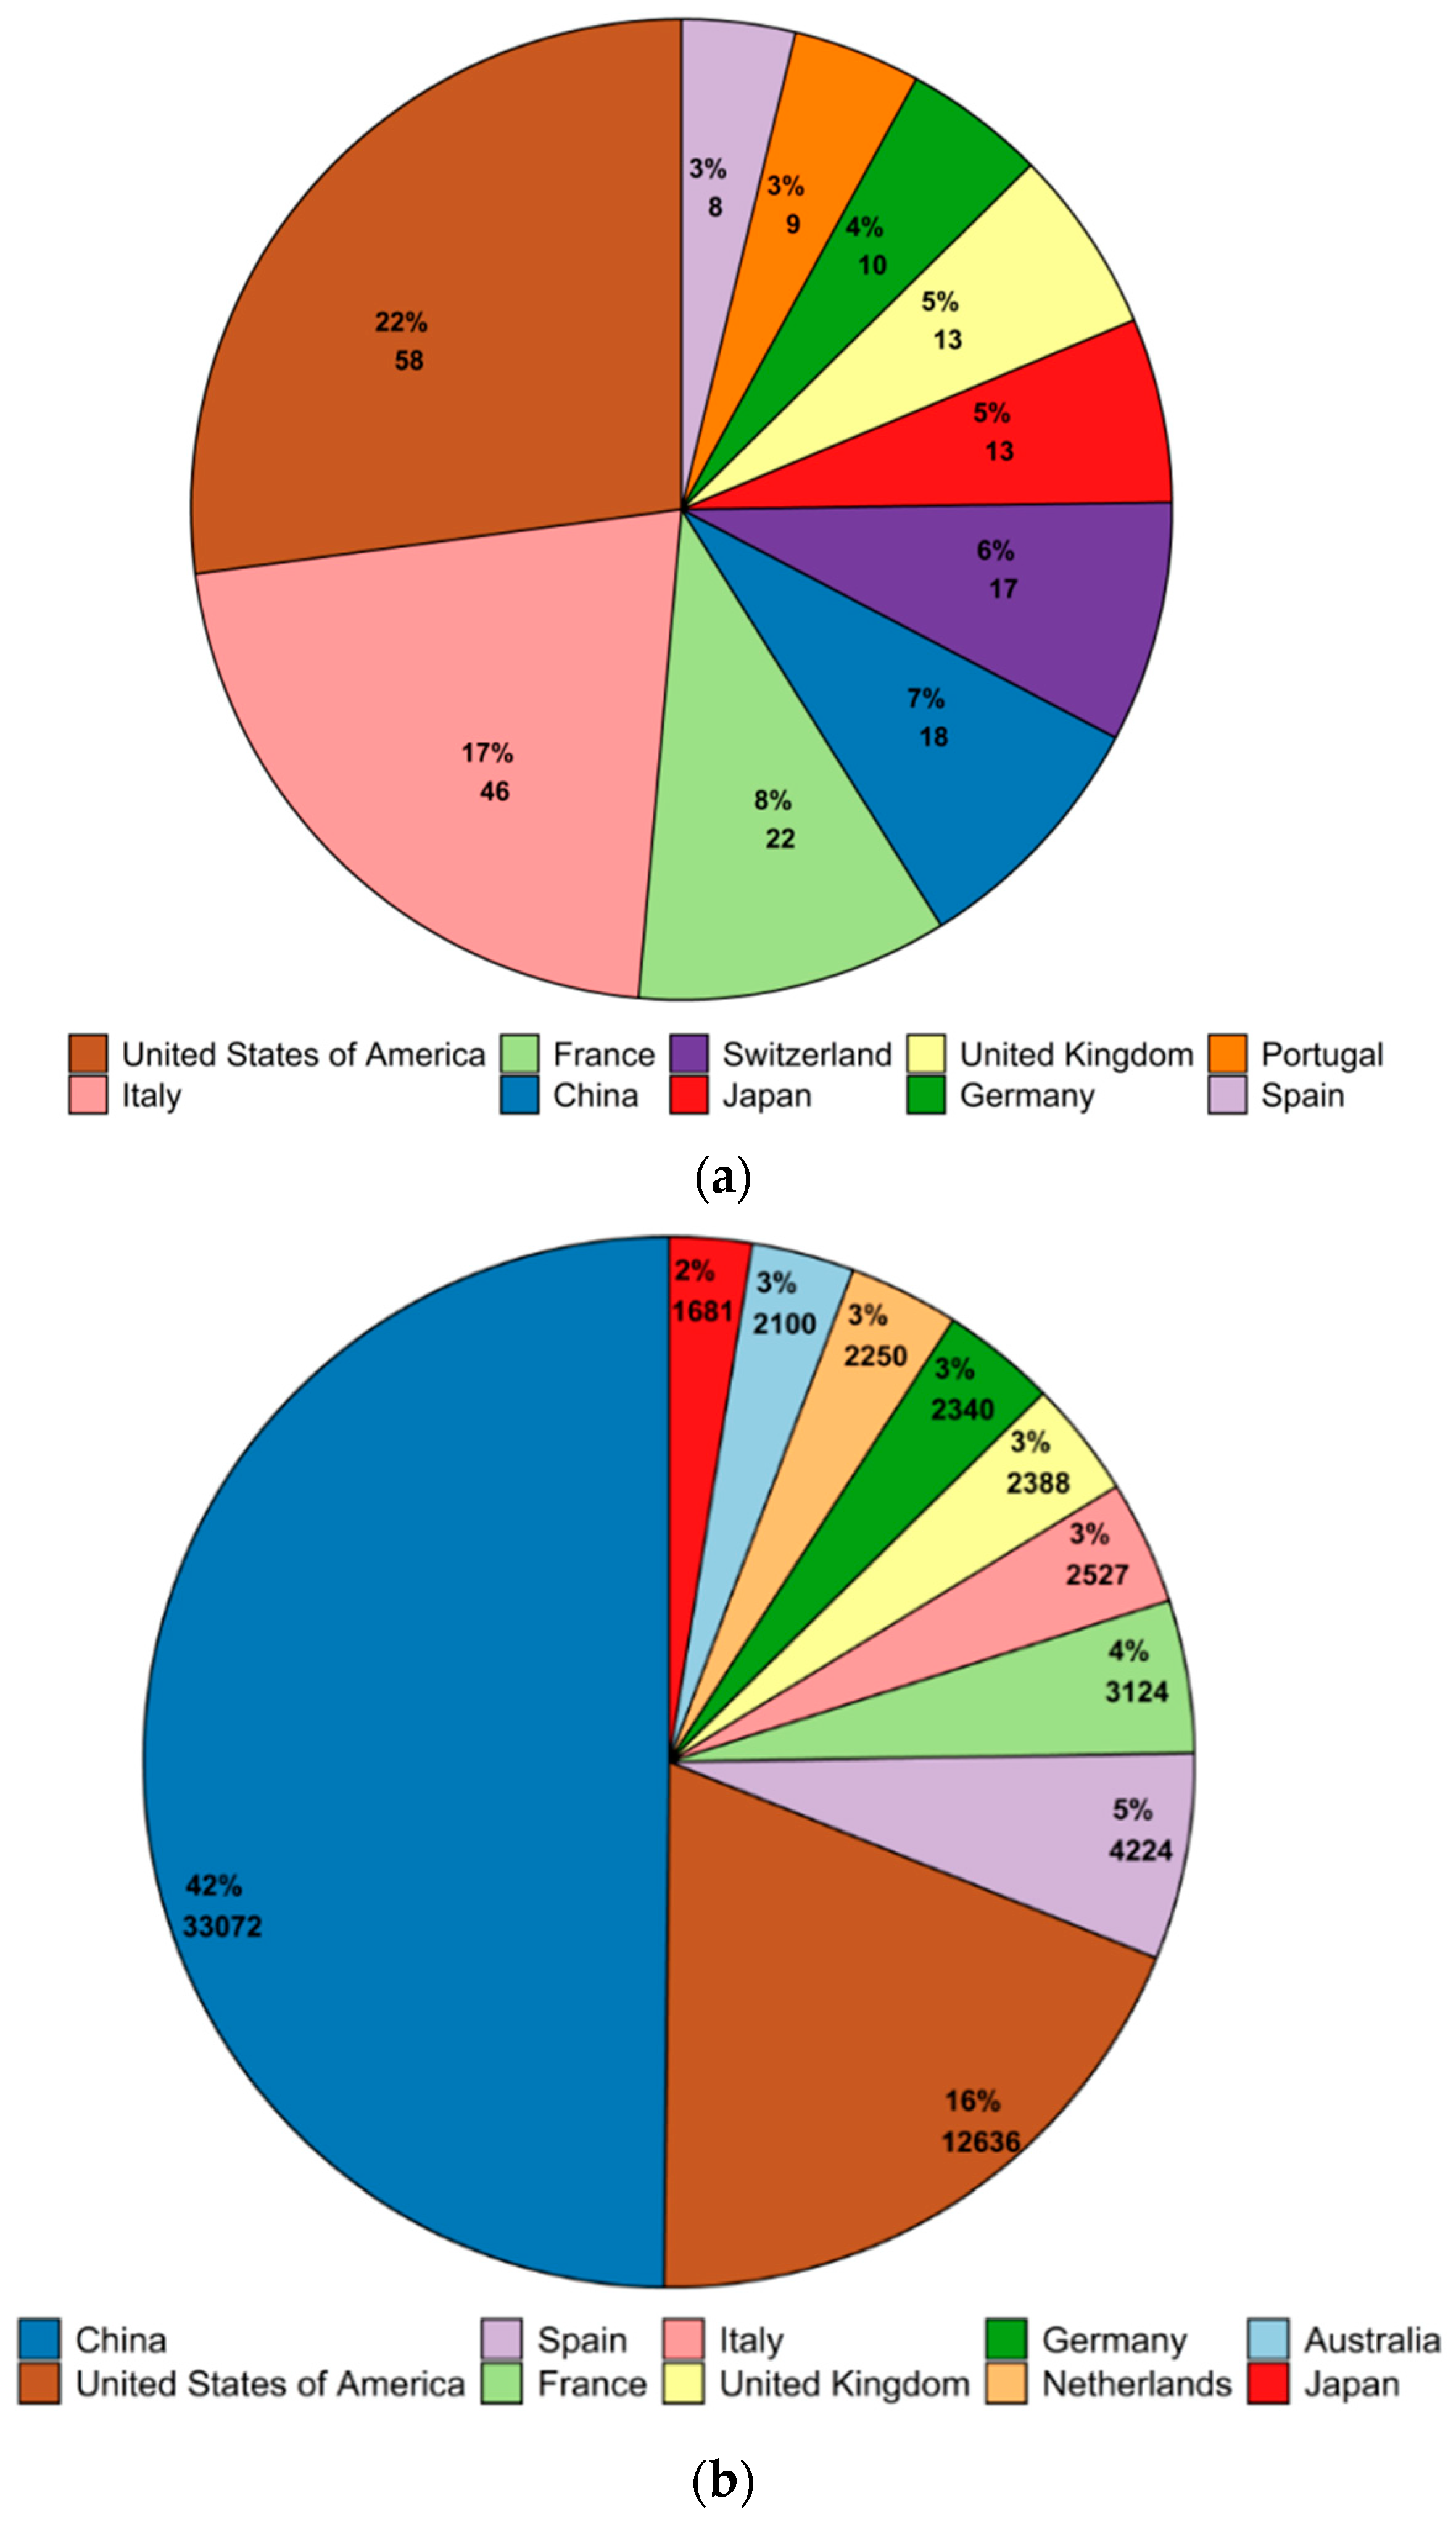
Figure 7a illustrates the top 10 countries in the adoption of e-BSS based on the number of entries per countries in the dataset registering at least six launched systems, and Figure 7b depicts the top 10 ranking of countries based on the percentage breakdown of e-bikes deployed during the examined period. Indicatively, Italy which holds the second biggest share of deployed e-BSSs (17% with 46 entries) would have been overrepresented if the analysis was performed solely on the absolute number of systems as in the results presented in [10]. The corresponding share is attributed to an extensive deployment of mostly third generation systems which were small-scale station-based (up to 20 bikes fleet) and operating in small cities, in contrast with the large fourth generation deployments met in Chinese large cities or the US [16]. When the ranking is based on the percentage breakdown of e-bikes deployed during the examined period (Figure 7b), China records the largest share of available e-bikes on e-BSS launches (42%) followed by the USA (16%). Combining the above, an average e-BSS launch fleet size per country can be estimated with the values of 1837 e-bikes per system for China and 218 for the USA. However, this number hinders the extraction of a rigid conclusion on the diffusion of the technology due to the omission of important historical parameters concerning the stages of bikesharing technology’s evolution (more reluctant and small-scale deployments preferred during the first years of the diffusion) and spatio-demographic traits such as tailoring the launch fleet size to the intended location’s metropolitan area and population.
A common trend can be attributed to the USA and China regarding adoption patterns, specifically, both enter the e-BSS landscape after fourth generation products reach the market and from 2017 onwards show a tendency in launching large-scale (>1000 bikes fleet) dockless systems. This temporal pattern is reflected in almost every facet of Figure 5, where at least one large-scale dockless e-BSS appears on the map after 2017. Italy and Switzerland comprise the main leaders in the early adoption stages since 2012 and 2010, respectively [17], while China and the USA are the main areas of e-BSS deployment in recent years. The latter reflects the shift in the e-bikesharing technology innovation, from an early period when the Italian company Bicincitta engaged a wide deployment campaign throughout rural areas, offering a demo third generation system for small-scale applications [18], to the emergence of key innovation leaders (it cannot be considered as an exaggeration to coin the term fifth generation for the ongoing service schemes offered from Chinese bikesharing companies [9]) in the form of private funded initiatives combined with governmental subsidies enacted later in the implementation phase.
Driven by the roll-out strategy experienced in the Chinese e-bike sharing market and in line with the latest demands of the fourth generation of bikesharing, companies in the USA decided to engage on aggressive roll-outs of dockless e-BSSs with free floating e-bikes accessible at major densely populated cities, with each stakeholder offering his own built-in technology and pricing policy [19]. This transition can be linked with the market placement of large mobility-on-demand providers (i.e., Uber) through the purchase of bike tech companies (Jump Bikes), therefore permitting larger-scale campaigns and higher initial capital investments.
Ranking the top 10 performing cities on the e-BSS fleet size to population ratio was performed solely on city populations cross-validated with the city population dataset. Importantly, the results (Figure 8) were scaled on e-bike availability per 1000 citizens for the purposes of comparability with previous studies. It can be noted that Tengzhou, China ranks in first place with 28.3 e-bikes per 1000 citizens, along with four other Chinese cities (i.e., Liaocheng third, Yangzhou fourth and Dali seventh), followed by Locarno, Italy with 18.7 e-bikes per 1000 citizens. Highly performing European cities are also Tartu, Estonia and Valetta, Malta, with their rate computed from only one system serving small populations in both cities, i.e., 750 e-bikes deployed in Tartu and 50 e-bikes in Valetta, whereas Chinese cities with 15 entries tallying 32,340 e-bikes present a more reliable figure. For example, the US market, which is highly incorporated in the population quota dataset with 43 entries, recorded two top-ranking cities with 5.9 and 5.1 e-bikes per 1000 citizens over an average country level of 1. In contrast, Italy, the second most represented country in terms of the number of systems (i.e., 28 in Figure 7a) in the population quota database, ranked 20th in country averages, at a 0.5 ratio. Hence, in contrast with the rankings in Figure 7, the analysis from the population coverage suggests that leaders in number of deployed systems would not necessarily land a position in the highest ranks of population coverage due to the rate’s sensitivity to low population values.
Table 1 lists the largest e-BSSs included in the dataset, describing their launch date, number of e-bikes, number of docking stations, operator, population in millions and total BSS fleet size of all systems available within the studied location. Values for the last data field were extracted from an online source with live data on bikesharing from 300+ cities [20]. The largest recorded roll-out was 5000 e-bikes in two Chinese cities, namely Yangzhou and Shunyang, while in Europe, the largest roll-outs are recorded for Madrid (BiciMAD around 2000 e-bikes, launched 2014), Amsterdam (Urbee 1150 e-bikes, launched 2016), Brussels (Uber 1200 dockless e-bikes, started in 2019) and Milan (BikeMi, 1000 e-bikes, launched 2016). A dockless e-BSS in San Diego was the largest roll-out for North America, where the most frequent value for initial fleet size was 500. Evidently, larger systems launch in Chinese cities, while flexible access to shared e-bikes (dockless shared fleet) is more favored for large-scale deployments.
In Hangzhou, a Chinese city that alone accounts for almost one million shared bicycles, a new system launched in January 2018 which introduced 1000 e-bikes in the district of Binjiang that run on a large removable battery. The difference is that these batteries are stored and charged in a separate solar-powered vending machine at each station. As an effect, users can still choose between a conventional or e-bike, but without the responsibility of carrying and maintaining the battery [21]. The opposite principle applies in the case of the envisioned e-BSS for Stockholm, where a fleet of “hybrid bikes” will be rolled out with members carrying the responsibility for charging a battery that is compatible with the vehicle and receiving it upon subscription. Aiming to lower the cost of the membership fees, the city authorities reached an agreement with the system operator for allocation of advertising space in privileged locations [22].

3.4. Discussion

The results in the previous sub-sections revealed the diversity of e-BSS adoption patterns depending on the examined scale. Mainly, the technology has spread to three regions, namely Europe, North America and Asia, being initiated in Europe and with short delays arriving in the other continents. The temporal evolution of e-BSSs compared to conventional BSSs demonstrates the gradual penetration of electrified fleet deployments throughout three stages, firstly as a pure innovation followed by an early adoption period (stabilized on 9% of total bikesharing launches) and lately as an established transportation solution. In fact, in the last two years, e-BSSs comprise almost one quarter on average of all BSS roll-outs worldwide.
In terms of system fleet size, China and USA constitute the key market leaders in e-BSS deployment. Other cases of large-scale systems have been launched also in large cities in Europe and Australia with dockless e-BSSs gaining popularity in contrast to station-based implementations. City population presents a positive correlation with launch fleet size, validating the hypothesis that deployment decisions vary depending on scale. According to the findings presented in Figure 6, Europe demonstrates a statistically significant relationship between initial fleet size and targeted city population, whereas in Asia and North America, large-scale systems are launched in cities with a population over 100,000 citizens.
The dynamics of the deployment trends observed point that the peak in the e-BSS diffusion curve has not yet been reached. Bikesharing remains a considerable micro-mobility solution with e-bikes bearing the potential to extend the technology’s scalability, also confirmed by the rapid diffusion rate presented in the analysis. The maturity of BSS adoption in a city’s transportation plan facilitates and motivates the transition or the integration of e-BSSs. It becomes clear that fully characterizing the diffusion patterns of the e-BSS technology requires the inclusion of key categorical predictors and quantitative variables, for example, utilization patterns, budget considerations, mobility plans, level of established cycling culture, public or private operator model, selected payment system (impeding or not flexible vehicle acquisition) and trip costs. However, the purpose of implementing a BSS on each of the cities recorded in the database was beyond the scope of this study.
Tracing the deployment characteristics at the country level, multiple aspects were explored, such as top adopters according to percentage breakdown of the number of e-BSSs, total fleet size compared with the global fleet size, system size to population ratio and the largest systems recorded in the database. After a close examination of the results presented in Figure 7 and Figure 8, as well as in Table 1, China undoubtedly drives e-BSS adoption followed by the USA, in alignment with the rapid diffusion rate of the BSS technology. In addition, e-BSS deployment in these countries is also influenced from the presence of an innovation competition that attracts more operators into planning future implementations or pursuing to introduce the technology to new locations in order to achieve a market advantage. At this point, it is noted that a permit is necessary for an operator to deploy a system in a city, thus deployment trends are subject to local transport policy and regulation.
Importantly, the degree of e-BSS expansion on an urban scale is impacted by the competition with other vehicle sharing technologies apart from conventional BSSs, such as e-scooter rental/sharing systems or ridesharing depending on the service level of micro-mobility demand. Especially, in cities where alternative micro-mobility schemes have established their presence within the transportation landscape, this hinders the appeal of an e-BSS roll-out for a prospective operator. Recent studies comparing ridership patterns between scooter sharing schemes and BSSs in cities where both are offered revealed that shared bikes were mostly used for commuting while shared scooters for recreation in Washington D.C. [23], and that scooter sharing exhibits an increased utilization rate on a smaller fleet size than BSSs in Singapore, although over a significantly lower total daily usage [24]. Notwithstanding this, the large-scale integration of micro-mobility schemes is beneficial for transport systems, such as alleviating rush-hour congestion, and therefore this competition may lead to a broader positive outcome [25,26].

4. Conclusions

This study attempted to identify patterns in the spatial and temporal characteristics of e-BSS deployment. To this end, the data collected were processed in three stages corresponding to a different spatial resolution: (a) a global outlook of deployments, generating a map with the e-BSSs operating presently with respective sizes and preferred type of infrastructure as well as the comparison of e-BSS deployment growth with that of conventional BSSs, (b) on a continental scale, focusing on the 95% of the worldwide fleet which is found in Asia, Europe and North America and (c) leaders at the country level, continental trends were further broken down in country figures.
Respective average annual growth rates per continent were calculated along with their temporal evolution. As a result, the overall trend was mainly shaped by the European market comprising the innovator phase according to diffusion innovation theory until 2014, when the other two continents enter the picture. Although these regions stepped-in later in the early adopter phase, their annual growth rates were relatively high, supported by the advent of large operators, resulting in North America and Europe equally contributing to the technology’s diffusion in 2018. It became clear that e-BSS technology diffusion in Europe recorded years of deceleration with renewed interest spurred by the introduction of dockless e-bikesharing and recovering in growth rate. Concerning the most preferred launch month for a new e-BSS, summer months ranked first among all continents due to the fact that weather conditions are more suitable for cycling, thus a higher possibility of user acquisition for operators in early stages of the systems’ operations. Regarding the present status of the technology growth rate, data till November 2019 point to a recession in the overall trend as a consequence of declining deployment rates in North America and Asia, with Europe demonstrating a minor increase in deployed systems and constituting the main area of e-BSS deployment activity.
Top-performing countries in terms of e-BSSs deployed and e-bikes in e-BSSs, along with cities with the largest population coverage and system size, have been identified, denoting the countries and cities respectively, which have recorded greater progress in the technology’s diffusion. In Asia, Japan and China comprise the key drivers of the technology’s diffusion, while in Europe France, Italy, Germany and the United Kingdom, this mobility alternative is more prone to be adopted at urbanized areas, showing a proportionality between the population size and the number of shared vehicles. In China and the US, the dockless e-BSS shows a greater favorability, especially for densely urbanized areas. An explanation for this can be traced to (a) bike tech companies, software, middleware and vehicle producers established in these countries, (b) investor schemes aligned with public initiatives and (c) dockless bikesharing enabling larger population coverage.
It is important to note that a challenge for prospective e-BSSs was the justification of their impact in alleviating traffic congestion and the intended extension of current public transportation systems as a measure for addressing the first/last mile problem. Moreover, the cost of production, environmental footprint of the upstreaming process and waste management from abandoned or damaged fleet resources constitute extra barriers in the wide-scale adoption of shared e-bike fleets. To this end, operators take initiatives in investing in recycling bike components, for instance, Mobike reached a strategic partnership with China Renewable Resources Co., Ltd. for the management of an estimated 10 million shared bikes lifecycle [27].
Summarizing the advantages and drawbacks of e-bikesharing, on one hand, it is appealing to broader population groups than conventional BSSs, especially older adults [28], in the meantime extending the spatial coverage per trip in comparison with BSSs. Comfort issues due to intensive physical effort required in cycling can be diminished, since pedaling is assisted. From the perspective of the transition to low-carbon mobility, the e-BSS promotes the use of charging infrastructure, familiarizing users with the concept of electric mobility. In sustainability terms, station-based systems potentially support the integration of renewable generation resources for supplying the charging needs of the deployed fleet.
On the other hand, disadvantages for e-BSS deployment comprise its higher operational, fleet acquisition and maintenance costs per vehicle compared with BSS as also the dependency on charging infrastructure presents an extra installation cost per docking station in station-based implementations. Moreover, ensuring the safe coexistence with other types of motorized vehicles in road traffic entails the development of advanced cycling infrastructure, bike lanes, signaling and awareness from private car users on adapting their driving style. Operators must ensure vehicle security, leading to increased security costs per shared vehicle or station, investing in related bikesharing technology.
Certain limitations of the present study can be addressed within the scope of future research. Initially, the data collection was performed solely on e-BSS launches, permitting only the analysis of system deployment trends, whereas an alternative approach should be adopted in the case of tracking e-BSS progress and growth, and to a certain extent an indicator for system expansion. However, this would require access to historical operator data or another acclaimed third-party data resource, detailing the status of each system (number of users, number of e-bikes, etc.) on various dates. Nonetheless, the instantaneous capture of the system roll-out characteristics is important in understanding the process of sizing a fleet or selecting the type of bikesharing (dockless or station-based) system according to the profile of the defined location. In this context, an analysis on the seasonality of e-BSS use could be an interesting direction of future work upon the availability of relevant data. Moreover, a finer-resolution model capturing additional attributes of e-BSS deployments on a city scale could correlate the launch fleet size per location (apart from the population) with other variables, such as available budget, cycling culture, city structure and geographical characteristics, population density, income, IT penetration rates and authorities’ visions in transportation planning. Second, the use of the term e-BSS in this study was broadly extended to contain any functioning system registered in the database till November 2019 running a fleet with e-bikes, therefore contemplating mixed bikesharing schemes. Assumptions on the seasonality of deployments can be validated through the study of the correlation with weather data. Last, certain data-fields mined from The Bike-sharing Map can be explored, such as the conversion rate of previously BSS to e-BSS or the ratio of e-bikes to conventional bikes on mixed fleet deployments. Running mixed bikesharing fleets presents a challenge to service operators, mostly in the case of rebalancing fleet resources, where state of charge provisions impose constraints in scheduling vehicle repositioning.

Author Contributions

Conceptualization, N.-F.G., K.N.G. and C.S.I.; methodology, N.-F.G. and K.N.G.; data curation, N.-F.G.; writing—original draft preparation, N.-F.G. and K.N.G.; writing—review and editing, C.S.I.; visualization, N.-F.G.; supervision, K.N.G. and C.S.I. All authors have read and agreed to the published version of the manuscript.

Funding

This work was partially supported by the E.U. Seventh Framework Program under grant agreement no. 621408 (RE-SIZED: Research Excellence for Solutions and Implementation of Net-Zero Energy City Districts), the European Regional Development Fund and Wallonia Region, project reference FEDER C3E2D–Wal-e-cities and the E.U. Erasmus+ ‘E-DRIVE TOUR, ‘bEyonD the boRder of electrΙc VEhicles: an advanced inTeractive cOURse’ project reference 612522.

Conflicts of Interest

The authors declare no conflict of interest.

References

  1. Li, W.; Kamargianni, M. Providing quantified evidence to policy makers for promoting bike-sharing in heavily air-polluted cities: A mode choice model and policy simulation for Taiyuan-China. Transp. Res. Part A Policy Pract. 2018, 111, 277–291. [Google Scholar] [CrossRef]
  2. Fishman, E. Bikeshare: A review of recent literature. Transp. Rev. 2016, 36, 92–113. [Google Scholar] [CrossRef]
  3. Bikesharingmap, The Bike-Sharing World Map. Available online: www.bikesharingmap.com (accessed on 18 November 2019).
  4. Parkes, S.D.; Marsden, G.; Shaheen, S.A.; Cohen, A.P. Understanding the diffusion of public bikesharing systems: Evidence from Europe and North America. J. Transp. Geogr. 2013, 31, 94–103. [Google Scholar] [CrossRef]
  5. Rogers, E. Diffusion of Innovations, 5th ed.; Free Press: New York, NY, USA, 2003. [Google Scholar]
  6. Munkácsy, A.; Monzón, A. Diffusion of Bike Sharing as an Innovation Vector in the City: The Case of BiciMAD (Madrid). J. Urban Technol. 2018, 25, 1–26. [Google Scholar] [CrossRef]
  7. Galatoulas, N.F.; Genikomsakis, K.N.; Ioakimidis, C.S. Analysis of potential demand and costs for the business development of an electric vehicle sharing service. Sustain. Cities Soc. 2018, 42, 148–161. [Google Scholar] [CrossRef]
  8. O’Brien, O.; Cheshire, J.; Batty, M. Mining bicycle sharing data for generating insights into sustainable transport systems. J. Transp. Geogr. 2014, 34, 262–273. [Google Scholar] [CrossRef]
  9. Si, H.; Shi, J.G.; Wu, G.; Chen, J.; Zhao, X. Mapping the bike sharing research published from 2010 to 2018: A scientometric review. J. Clean. Prod. 2019, 213, 415–427. [Google Scholar] [CrossRef]
  10. Gu, T.; Kim, I.; Currie, G. To be or not to be dockless: Empirical analysis of dockless bikeshare development in China. Transp. Res. Part A Policy Pract. 2019, 119, 122–147. [Google Scholar] [CrossRef]
  11. Yan, Q.; Gao, K.; Sun, L.; Shao, M. Spatio-Temporal Usage Patterns of Dockless Bike-Sharing Service Linking to a Metro Station: A Case Study in Shanghai, China. Sustainability 2020, 12, 851. [Google Scholar] [CrossRef] [Green Version]
  12. Wang, Z.; Cheng, L.; Li, Y.; Li, Z. Spatiotemporal Characteristics of Bike-Sharing Usage around Rail Transit Stations: Evidence from Beijing, China. Sustainability 2020, 12, 1299. [Google Scholar] [CrossRef] [Green Version]
  13. RStudio Team. RStudio: Integrated Development for R. (RStudio, Inc., Boston, MA). Available online: http://www.rstudio.com (accessed on 18 November 2019).
  14. Ihaka, R.; Gentleman, R. R: A language for data analysis and graphics. J. Comput. Graph. Stat. 1996, 5, 299–314. [Google Scholar] [CrossRef]
  15. Becker, R.A.; Wilks, A.R. Constructing a Geographical Database, Statistics Research Report [95.2]; AT&T Bell Laboratories: Murray Hill, NJ, USA, 1995. [Google Scholar]
  16. Mátrai, T.; Tóth, J. Comparative assessment of public bike sharing systems. Transp. Res. Procedia 2016, 14, 2344–2351. [Google Scholar] [CrossRef] [Green Version]
  17. DeMaio, P. Bike-sharing: History, impacts, models of provision, and future. J. Public Transp. 2009, 12, 41–56. [Google Scholar] [CrossRef]
  18. Garau, C.; Masala, F.; Pinna, F. Cagliari and smart urban mobility: Analysis and comparison. Cities 2016, 56, 35–46. [Google Scholar] [CrossRef]
  19. Hirsch, J.A.; Stratton-Rayner, J.; Winters, M.; Stehlin, J.; Hosford, K.; Mooney, S.J. Roadmap for free-floating bikeshare research and practice in North America. Transp. Rev. 2019, 39, 706–732. [Google Scholar] [CrossRef]
  20. Bike Share Map. Available online: http://bikes.oobrien.com (accessed on 18 November 2019).
  21. Zhu, Y.; Diao, M. Understanding the spatiotemporal patterns of public bicycle usage: A case study of Hangzhou, China. Int. J. Sustain. Transp. 2020, 14, 163–176. [Google Scholar] [CrossRef]
  22. Popan, C. Bicycle Utopias: Imagining Fast and Slow Cycling Futures; Routledge: London, UK, 2019. [Google Scholar]
  23. McKenzie, G. Spatiotemporal comparative analysis of scooter-share and bike-share usage patterns in Washington, D.C. J. Transp. Geogr. 2019, 78, 19–28. [Google Scholar] [CrossRef]
  24. Zhu, R.; Zhang, X.; Kondor, D.; Santi, P.; Ratti, C. Understanding spatio-temporal heterogeneity of bike-sharing and scooter-sharing mobility. Comput. Environ. Urban Syst. 2020, 81, 101483. [Google Scholar] [CrossRef]
  25. Shaheen, S.; Cohen, A. Shared Micromoblity Policy Toolkit: Docked and Dockless Bike and Scooter Sharing. UC Berkeley Transp. Sustain. Res. Cent 2019. [Google Scholar] [CrossRef]
  26. Gössling, S. Integrating e-scooters in urban transportation: Problems, policies, and the prospect of system change. Transp. Res. Part D Transp. Environ. 2020, 79, 102230. [Google Scholar] [CrossRef]
  27. Lai, X.; Sun, Z.; Liu, J.; Wu, G. Resource recycle efficiency improvement analysis for sharing bicycles: Value chain perspective. J. Clean. Prod. 2020, 255. [Google Scholar] [CrossRef]
  28. Van Cauwenberg, J.; de Geus, B.; Deforche, B. Cycling for Transport Among Older Adults: Health Benefits, Prevalence, Determinants, Injuries and the Potential of E-bikes. In Geographies of Transport and Ageing; Palgrave Macmillan: Cham, Switzerland, 2018; pp. 133–151. [Google Scholar] [CrossRef]
Figure 1. Number of bikesharing systems (BSSs) launched worldwide from 2008 to 2019 with respect to fleet type (conventional or electrified) along with the corresponding annual percentage shares.
Sustainability 12 04611 g001
Figure 2. Visualization of the distribution of electric (e)-BSSs on global scale, data mined from The Bike-sharing Map based on reported entries till November 2019 (Source: [3]).
Sustainability 12 04611 g002
Figure 3. Diffusion curve of e-bike sharing systems: comparison of number of new systems per year in Europe, North America, Asia and the worldwide trend.
Sustainability 12 04611 g003
Figure 4. Diffusion curve of e-BSS: comparison of the number of system deployments per year by type (station-based or dockless) and region, color gradient scale denoting the percentage of roll-outs operating a mixed fleet.
Sustainability 12 04611 g004
Figure 5. Number of e-BSS deployments per region by month of launch, as an indicator for deployment seasonality.
Sustainability 12 04611 g005
Figure 6. Comparison of the logarithm of total e-BSS fleet size versus the logarithm of population size for cities in Europe, North America and Asia with the corresponding linear regression coefficients.
Sustainability 12 04611 g006
Figure 7. Top 10 e-bike sharing countries: (a) percentage breakdown and number of e-BSSs deployed by country, and (b) percentage breakdown and number of e-bikes deployed in e-BSSs by country.
Sustainability 12 04611 g007
Figure 8. Top 10 performing cities in terms of total number of e-bikes deployed in e-BSS to population ratio.
Sustainability 12 04611 g008
Table 1. Top 10 e-BSS included in the analyzed dataset (November 2019 data).
City of OperationLaunch DateNumber of E-BikesNumber of StationsOperatorPopulation (Millions)Total BSS Fleet Size (All Systems) [20]
Yangzhou, Jiangsu, China1 November 20175000DocklessForever GonBike4.420,000
Shuyang, Suqian, Jiangsu, China8 September 20185000DocklessForever GonBike1.95000
Liaocheng, China4 April 20194060370Public Bicycle Service5.75000
Tengzhou, China14 May 20193000DocklessPublic Bicycle Service0.83000
Madrid, Spain23 June 20142030165BiciMAD3.22430
Shanghai, China1 May 20172000DocklessForever GonBike23.7180,000
Sydney, Australia7 November 20182000DocklessLime4.43000
Brussels, Belgium25 April 20191200DocklessJump/Uber1.08242
Amsterdam, The Netherlands23 December 2016115025Urbee2.33150
Milan, Italy13 November 20161000280BikeMi8.215,000
Hangzhou, Zhejiang, China12 January 20181000DocklessPublic Bicycle Service21.123,794
San Diego, California, USA15 February 20181000DocklessLime1.415,000
Suizhou, Hubei, China1 May 20181000DocklessForever GonBike2.524,891
Dali, Yunnan, China1 June 20181000DocklessForever GonBike0.1n/a
Barcelona, Catalonia, Spain30 June 20181000DocklessScoot1.85229

