Analyzing Spatial Variance of Airbnb Pricing Determinants Using Multiscale GWR Approach


1
Department of Geology and Geography, West Virginia University, Morgantown, WV 26506, USA
2
Department of Culture, Tourism & Content, Kyung Hee University, Seoul 02447, Korea
*
Author to whom correspondence should be addressed.
Sustainability 2020, 12(11), 4710; https://0-doi-org.brum.beds.ac.uk/10.3390/su12114710
Submission received: 30 April 2020
/
Revised: 15 May 2020
/
Accepted: 4 June 2020
/
Published: 9 June 2020
(This article belongs to the Special Issue Sustainable Tourism in the Social Media and Big Data Era)
Abstract
:A sharing economy accommodation service like Airbnb, which provides trust between strangers to connect them for profiting from underutilized assets, was born and has thrived thanks to the innovations in the platform technology. Due to the unique structure of Airbnb, the pricing strategies of hosts are very different from the conventional hospitality industry. However, existing Airbnb pricing studies have limitations considering the varying scale of operation among hosts, spatial variances in pricing strategies, and crucial geographic information for estimating the influence of the pricing variables, as well as ignoring inter-city variances. In this research, we explored the spatially heterogeneous relationship between price and pricing variables using an innovative spatial approach, Multiscale Geographically Weighted Regression (MGWR). Analysis results for Airbnb listing in Log Angeles and New York in the US showed the effectiveness of MGWR regarding estimating the influence of pricing variables spatially. By revealing spatially heterogeneous and dependent relationships, this research fills gaps in Airbnb pricing research and deepens the understanding of the pricing strategies of the hosts.
1. Introduction
Pricing has become one of the most effective tools for customer satisfaction and promotion of demand [1]. Pricing strategy has been widely used in the tourism and hospitality industry, and become a field of revenue management, applied to airlines, hotels, restaurants, golf, casinos, and theme parks [2,3,4,5]. With the advancement in tourism information services that enable customers to compare prices, the strategic importance of pricing is tremendous now more than ever [2,6].
Tourism products are experience goods that users have strong heterogeneity in their value recognition, which makes revenue management for the hospitality industry focus on price differentiation [7]. Numerous studies have investigated strategies for pricing and enhancing profit margin in the hospitality industry, focusing on hotels [8]. However, sharing economy accommodation has distinctive attributes compared to hotels, mainly due to its residential housing-based service. These unique features make it challenging to apply the conventional understanding of the hospitality industry on the value recognition of users [9,10,11,12]. For example, the star rating system based on user reviews has limited influence on the price of Airbnb listings, unlike the hotel industry, while indirect signals such as the service duration and personal information of the hosts are considered as alternative sources for the trust and significant influence on the price [9,13].
However, existing Airbnb pricing studies have limitations considering spatial variances and crucial geographic information for estimating the influence of the pricing variables. It is well known that the influence of pricing variables may have local variations, indicating different dynamics among factors across space [14,15]. To explicitly reflect this spatial heterogeneity, the geographically weighted regression (GWR) has been utilized for pricing research into hotels and Airbnb hosts [16] and the provisions of accommodations in the sharing economy [17,18,19,20]. An issue here is that GWR does not consider a varying scale of spatial heterogeneity, treating all variables as having an identical scale of operation [21]. Pricing variables are spatial processes that determine the price, and each of them will operate under a different scale, from local to global. However, to date, no research effort has been made that considers this multiscale regression approach for Airbnb pricing analysis.
The second issue is negligence on a crucial decision criterion for accommodation: distance to tourism destinations [14]. Since tourists are the most frequent customers of Airbnb [6], the distance criterion needs to be included in Airbnb pricing research. A few previous studies have considered the distance variable in their pricing model. However, they used surrogate points such as a city center and highway exits for tourism destinations [22,23], which is not an accurate representation. A tourist will consider accessibility to multiple tourism destinations to make accommodation decisions. Therefore, distance to multiple tourism destinations must be explicitly considered in the Airbnb pricing research.
Furthermore, the possibility of spatial heterogeneity in pricing decisions among different areas has not been explored in the previous Airbnb research, such as inter-city differences. It is highly likely that different regions will show varying spatial dynamics of pricing decisions, as each of them have unique characteristics. Analyzing big data that cover multiple cities and comparing the results will reveal such inter-city level spatial heterogeneity, as well as intra-city level spatial variance in each location. Such a comparison will help us understand the underlying causes of varying patterns of pricing strategies more effectively. However, to date, the authors have not found Airbnb pricing research that made a comparison of pricing strategies among places.
In this research, we try to answer these research questions to fill the gaps mentioned above in the analysis of the sharing economy and the interaction between tourist attractions and accommodation, using big data: (1) what does relationship between price and pricing variables look like if we consider spatial heterogeneity in multiscale?; and (2) How does the distance of tourist attractions affect the price? We utilize a novel spatial approach that enables us to reveal more complex relationships and spatial patterns among pricing determinants and Airbnb listing price. We use the Multiscale GWR (MGWR) model for estimating the influence of pricing variables on varying scales. Using MGWR, we compare the influence of pricing variables in two major tourist destinations in the US, Los Angeles and New York. Additional geographic information, distances to popular tourism destinations, poverty ratio, and Airbnb listing density are also included as Airbnb pricing variables to reflect the influence of external factors. The structure of this research is as follows. We will review the previous studies related to pricing research in shared economy accommodation and attempts to understand spatial heterogeneity in pricing strategies. Study areas and the research method will be introduced. We then present the MGWR analysis results for the influence of the pricing variables in LA and New York, which will be followed by discussions and concluding remarks.
2. Background and Literature Review
2.1. Sharing Economy, Tourism, and Sustainability
The sharing economy is a social phenomenon from the convergence of mobile technology and social media platforms [24]. There are many definitions of the sharing economy by academics [25,26]. However, the sharing economy can be narrowly defined as a business or online platform which provides temporary access to underutilized physical assets for a fee or for free without a transfer of ownership [27].
Although the sharing economy uses the word “sharing,” the core of the sharing economy is not charity but a decentralized commerce platform connecting under-utilized assets and potential customers [28]. The sharing economy coordinates the acquisition and distribution of goods for a fee or other compensation, which is called “collaborative consumption” in academia [29].
Because the most valuable under-utilized assets for people are a house and a car, sharing economy activities have flourished, especially for accommodation and transportation services in the tourism industry [30]. The sharing economy services in the tourism industry not only provide the cost leadership based on the idling capacity of resources but also suggest a new way of life among the local community through interactive communication [31,32,33]. The emerging trend of fully independent tourists accelerated the growth of the sharing economy in the tourism industry [34,35].
Regarding sustainability, the emerging sharing economy in the tourism industry has a higher possibility of this than the traditional industry. Through the utilization of under-utilized assets, the sharing economy can increase the amount of service without additional construction or acquisition, which would decrease the environmental footprint of the industry [31]. Several studies have shown that consumers of the sharing economy have a higher interest in the local community and the environment, so that both consumers and suppliers lead to a reduced consumption of energy and water and reduced waste generation [30,33]. This change in consumption activity ultimately contributes to the reduction in greenhouse gas emissions and is considered to be an effective response to climate change [25].
Furthermore, the sharing economy increases the employment rate of the local community [36], as well as the profits of the community [37]. For example, Airbnb’s message to tourists, “travelers to your neighborhood,” encourages them to have new experiences via sharing the same space with the local community members, which makes the Airbnb tourists engage more in economic activities in the local areas, like eating at a local restaurant, than other tourists [37]. On the supply side, the gains in the sharing economy operations help to vitalize the local economy, as those benefits are transferred to hosts who operate at the local scene [37,38,39]. Consumers of the sharing economy are also given the opportunity to experience meaningful social experiences within the community, away from the traditional tourism industry’s consumption system [25]. The human capital of the community that provides idle assets to the sharing economy serves as a bridge between these opportunities and helps consumers to respect the culture of the community and to resolve social imbalances [32,40].
2.2. Pricing Research in Hospitality Industry
Pricing strategy is a crucial tool in the accommodation business for sales optimization [41]. The tourism services and accommodations are highly perishable; therefore, pricing has been used as a strategic tool to promote demand for the specified time [1]. Pricing strategy in the tourism industry has incorporated heterogeneity within hospitality services and grown as a discipline referred to as revenue management [2,5,42]. With readily available pricing comparison tools for the customers based on innovative mobile technologies and tourism information systems, the importance of revenue management has been increased more than ever [2,6]. Understanding how customers recognize the value of the various attributes of the accommodation has become crucial for successful revenue management [4].
However, a direct survey to customers is not a viable option due to the numerousness of hotel service attributes. Naturally, the indirect inference of the decision-making criteria of consumers has become the standard practice, such as conjoint analysis and the hedonic pricing model [14]. The hedonic pricing model (HPM) is based on the characteristics theory, which assumes that the utilities of customers are structured not from a good itself but from attributes within the good [43]. Typically, a single good has multiple attributes by its nature, and customers try to make the optimal selection of the attributes to maximize their utilities under the budget constraints [44]. Observation of market price can reveal a unit value of each attribute within the given good, and this is referred to as the hedonic price. The highly differentiated market usually shows a better performance from measuring the hedonic price [45].
Thus, the hospitality industry, where the most sophisticated price and product differentiation is used under high competition, frequently uses the HPM to recognize the value of various attributes in the hotel service. Previous studies have found that star ratings, location, reputation, amenities, cleanliness, room attributes, and facilities are vital attributes for the hotel price [23,46,47,48,49].
It is generally accepted that the most critical attributes for the hotel pricing are the star ratings and location [14,47]. Star ratings can be perceived as an index signal evaluated by an independent organization that does not benefit from the biased report of hotel quality and experience. This makes the star rating system strongly influential to customers and hotels as well [13]. Empirical studies also showed that star ratings of hotels have high explanatory power on the hotel price [23,50,51].
Hotel location and the surrounding environment are additional key drivers of product differentiation in the revenue management of hotels. For example, hotel customers willingly pay more for a room with a better view [52]. The hotel industry has been aware of such consumer behavior regarding location, and this has been reflected in the hotel price [46]. Empirical studies have revealed that sea views [14,46,51], city center [23,51,53], and transportation center [47,50,54] are the most-considered location factors for hotel pricing.
Despite the importance of location in the hospitality industry, previous studies in tourism have failed to capture spatial variations properly in the HPM. In many cases, researchers assumed that each region has homogeneous geographical characteristics to control the heterogeneity among regions. From this perspective, every hedonic pricing study for each city has unique value and meaning [14]. However, even in a small city, various geographical characteristics affect the pricing of hotels in different ways. To reflect this, strategies that indirectly include heterogeneity have been developed, such as converting spatial heterogeneity to dichotomous variables [46,53] and including simple Euclidean distance information as a variable [23,54]. However, these strategies oversimplify the spatial heterogeneity or even distort it, failing to reflect spatial variance in the results.
2.3. Pricing Model in the Sharing Economy
Airbnb listings are based on residential housing in the local communities, and their characteristics are extremely different from those of the hotels. The difference between Airbnb listings and hotels come from not only real estate, but also service, amenities, the personality of hosts, and local communities. Thus, accumulated knowledge of revenue management in the hospitality industry cannot be applied directly to the sharing economy accommodations [9].
Most pricing studies on Airbnb commonly pointed out that the standardization of business is the key difference between Airbnb and hotels. In the case of hotels, the shape and format of services are quite similar among hotels due to the standardization, so that consumers can easily recognize or compare the values of the service to these industrial service standards. Unlike hotels, each listing in Airbnb has unique characteristics that are hard to compare. However, Airbnb’s user interface provides standardized information of listings to customers. In this way, customers recognize the value of listings through the user interface of the platform [13].
Acknowledging these differences, pricing studies on Airbnb have recently started using HPM [9,13,16,55,56]. This revealed that trust-related information and the attributes of a given property have a statistically significant impact on the price, while amenities and other service factors showed mixed or even contradicting results. The customer review has been considered as the most indicative information on the quality of Airbnb listings. However, the interactivity of the trust mechanism in Airbnb has distorted the reviews under social pressure from the hosts [57].
Although the reviews of customers are still meaningful indicators of the price [9,13], customers have started to look for other signals to eliminate the biases. The empirical studies found that the status of the host, the service length of the listing, and the super host badge are now utilized for customers to measure the quality and value of a listing [6,56].
The attributes of the given property, and the number, size and types of rooms also showed statistically significant effects on the price of Airbnb listings through product differentiation like hotels. However, amenities and other service factors did not show consistent results. Sometimes, they showed contradictory results [55,56].
2.4. Limitations of Previous Hedonic Pricing Research for Sharing Economy Accommodation
The fundamental assumption of GWR (or any other spatial analysis methods) is Tobler’s First Law of Geography: “Everything is related to everything else. However, near things are more related than distant things” [58]. If we translate this for Airbnb pricing, the decision-making processes of Airbnb hosts are related, not independent, so the pricing strategy of one host will influence (and be influenced by) other hosts of nearby listings. However, nearby hosts’ strategies will be more influential to each other than distant hosts’ strategies. There will also be a threshold distance where the degree of this interaction diminishes to an irrelevant level, which would be the scale of operation. With it, the differences in the attributes of listings and surrounding environment create spatial variances in pricing strategies, resulting in heterogeneous patterns of the influence of each pricing variable, instead of the uniform one across the region, as depicted in OLS(Ordinary Least Squares) analysis results.
GWR captures spatial heterogeneity in pricing strategies by conducting a localized estimation of the influence of the pricing variables. The core idea of GWR is directly capturing geographical variance in regression estimates across space [59]. Unlike OLS, it computes localized regression coefficients of given explanatory variables for a given location, only using its neighboring locations, to show the varying influence of pricing variables. The neighborhood is defined by search bandwidth, a reflection of the concept of the scale of operation. Airbnb pricing research has adopted the concept of locally varying relationships among variables, introducing GWR to the research [16,19,20].
However, the scale of operation is likely to vary for each pricing variable, depending on its nature [21,52]. For example, management variables such as cancellation policy and superhost status are likely to show a similar tendency at the regional or global level. Other variables, such as the number of bedrooms, guests, and distance to tourism destinations, would be the more localized scale of operation, as the influence of them would be more sensitive to the local environment. A critical limitation of GWR is that it applies an identical scale of operation for all the explanatory variables, ignoring the possibility of varying scales [21]. If we assume that all the pricing variables have an identical scale of operation, it will result in creating false spatial variances in global variables. Differences in the scale of operation among local variables will be ignored as well.
Another issue is a lack of or flawed consideration of the proximity to local tourism destinations. Considering that most customers of Airbnb are tourists, proximity to major tourism destinations is the key factor for pricing decisions. However, it has been completely neglected in most previous studies [9,55]. The few studies that attempted to consider it they have used surrogate locations, such as a city center and highway exits, instead of using actual locations [16,23,51]. These are inaccurate representations of tourism destinations, as they are not necessarily located in the city center or near the highway. Considering that most tourists would like to visit multiple destinations, measuring the distance to a single destination is not an effective way to reflect tourists’ influence of the location on price [60].
Previous studies only focus on analyzing pricing strategy in a single city [14]. However, considering the unique characteristics of each city, we will likely see significantly different patterns in pricing strategies among cities. These different patterns may be the product of external factors, such as the size, demographics, and employment structure of the given city. Therefore, to improve our understanding of Airbnb pricing decisions, comparison studies among cities need to be conducted.
To analyze the influence of pricing variables on Airbnb price accurately, a different regression model needs to be utilized to reflect the different scale of operation. Additional pricing variables also need to be included to reflect the geographical characteristics of the given areas.
3. Method, Data, and Study Area
3.1. Study Area and Data
We chose two famous and large tourist destinations in the United States, Los Angeles and New York, that have a large number of Airbnb listings and distinctive characteristics. They are located on the opposite side of North America, showing very different demographics, population densities, landscapes, and climate.
Airbnb listing data were collected from ‘Inside Airbnb’ (http://insideairbnb.com), which is an independent Airbnb data collection website, providing updated and cleaned listing data around the world every month. The most recent listing datasets available at the time of our data collection effort (September 2019) of New York and LA were collected from Inside Airbnb websites. Additionally, listings in Jersey City were included as a part of the New York dataset, considering its proximity and easy access to New York. For the New York area, a total of 51,385 Airbnb listings were collected. For LA, Inside Airbnb collected 45,044 Airbnb listings for the same month.
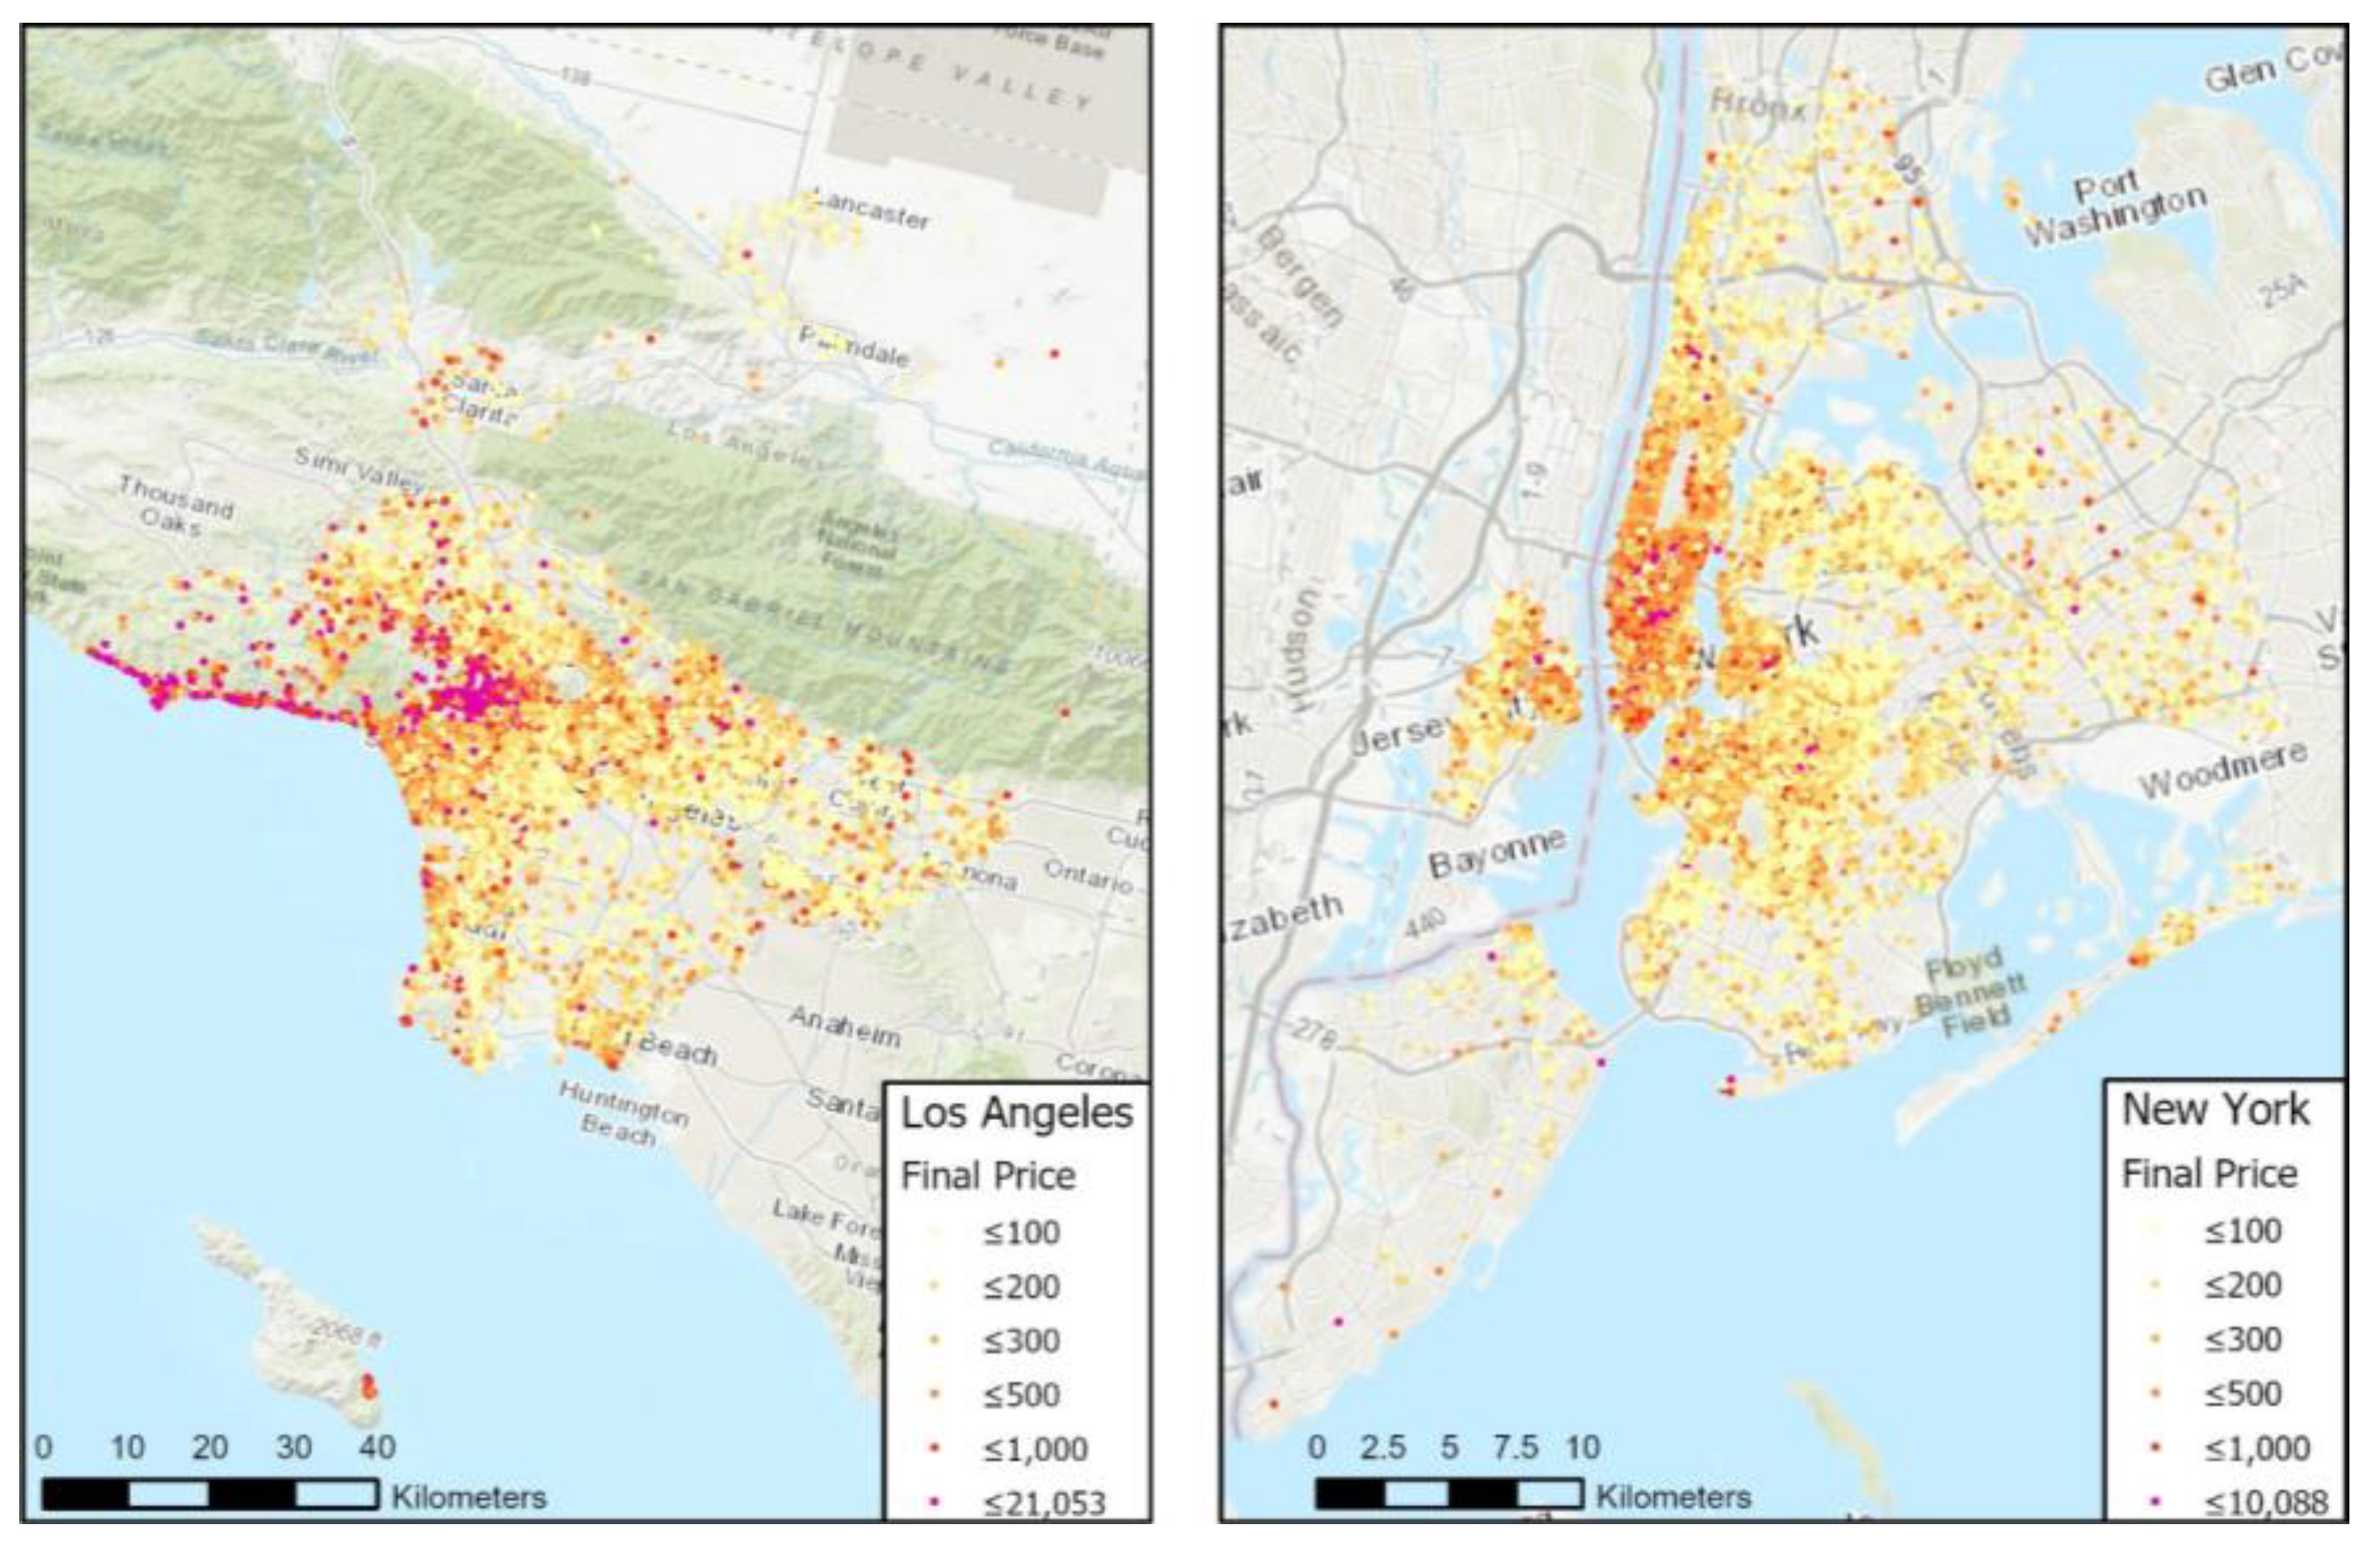
We defined the price of Airbnb listing as the listed price plus cleaning fee of each listing. The cleaning fee is a “one-time fee charged by a host to cover the cost of cleaning” after each stay. The amount of the fee was widely varying for each host, even for the listings with similar conditions and locations. As this fee will be included in the final price, it should be included in the price variable. However, we excluded listings that charged a cleaning fee higher than the listed price, as this price abuse possibly distorts the analysis results. After this filtering, a total of 44,291 records were remained, 20,422 and 23,869 for LA and New York, respectively. Figure 1 depicts the general distribution of Airbnb listing in the two cities with price information, while Table 1 shows descriptive statistics of the price.
Based on the previous research, we selected nine pricing variables, with three additional variables (Table 2). We grouped variables in four categories: listing functions, attributes of host, reputation, and geographical characteristics. Listing functions include the number of bathrooms, bedrooms, and guests, rental type, and cancellation policy, representing the attributes of each Airbnb listing. The rent type variable was included to represent different accommodation types that are unique to Airbnb. The attributes of the host are also crucial, so we have adopted duration and superhost status variables. The influence of feedback from other tourists (reputation) was considered through rating and reviews variables. The last category is geographical characteristics, which are density, poverty ratio, and distance index. Density was included to consider the influence of the existence of other competitors on the accommodation price. The poverty ratio from the 2016 American Community Survey was used to indirectly reflect the impact of the housing price of a given Airbnb listing and its neighborhood, since individual housing price data were not available.
The distance variable was included to reflect tourists’ consideration for accessibility to popular tourism destinations, which was measured using straight line distance, as travel time in these large cities is very sensitive to traffic conditions. It has been proved that a straight distance can be used as a surrogate for network travel distance in urban areas with a dense grid road network [61]. The second consideration was measuring the distance to multiple destinations. We picked the top 30 popular tourism destinations of each city, based on Tripadvisor’s ‘Things to do’ ranking. In LA, to reflect the unique characteristics of the area, we have included ten beaches on the list. We then derived a distance index for each listing by adding inverse distances to the selected destinations. The inverse distance represents the distance decay effect in the accessibility.
3.2. Multiscale Geographically Weighted Regression
A regression model estimates relationships between explanatory and response variables. Conventional models like OLS assume globally identical relationships in a given region. Therefore, they estimate the relationships, expressed as correlation coefficients, using the entire cases with the same level of weight. If we apply this logic to the Airbnb pricing strategy, we would assume that all the hosts in the region use the same logic and criteria to determine their price, independently to each other. However, this is not entirely true. First, the decision criteria will vary, responding to the surrounding environment. For example, Airbnb listings located in an area with higher housing prices are likely to be more sensitive to the number of bedrooms and bathrooms, compared to lower housing price areas. Furthermore, spatial dependency may exist in the hosts’ decision-making process. They will consider the pricing behavior of nearby hosts. The surrounding environment of Airbnb listings in proximity would also be similar, resulting in a similar pricing strategy. To estimate relationships between pricing variables and Airbnb price, we should consider spatial non-stationary processes that determine the influence of pricing variables on the outcome, as well as their spatial dependency.
To accept spatial non-stationary processes and use it for regression analysis, the scale of operation of processes must be analyzed [21]. The scale of operation can be defined as a threshold distance that represents an area where a spatial process works similarly. A spatial process will work differently for every location, in varying degrees of change [21]. However, estimating correlation coefficients for a location based on only one case is not acceptable, as it only uses a single sample. Instead, we can expand the scope of analysis to other cases that are assumed to have a very similar spatial process [21]. This scope is the scale of operation of the given spatial process. For a local process, this will vary significantly across the region, as it has a limited scale of operation. If a process has a large enough scale of operation to cover the entire given region, we call it a global process, which has an ignoble level of spatial heterogeneity. To estimate the relationship for the process, only cases within its scale of operation should be used, as we assume spatial non-stationary of processes [21]. Since we assume spatial heterogeneity, this step needs to be repeated for each case in the given region [21,62].
Another crucial concept is spatial dependency [21,62]. Socio-economic decision-making processes like Airbnb pricing decisions cannot happen entirely independent to each other. Decision-makers will influence each other either directly or indirectly, and similarity in the surrounding environment will also add another layer of resemblance. This spatial dependency, as stated in Tobler’s First Law of Geography [63], has a diminishing impact, along with distance [62]. To consider this regression analysis for spatial non-stationary processes, distance-decayed weight needs to be applied for analysis, even for those cases within the scale of operation [62]. Closely located cases will have more influence than cases located near the boundary of the scale of operation. It should be noted that, however, this does not mean that such a method would be able to identify the reasons behind the spatial dependency. This approach focuses on estimating relationships under the influence of the spatial dependency, revealing the degree of spatial dependency. Still, it can be used as an exploratory tool for further analysis to find hidden variables or processes behind the spatial dependency.
Based on this logic, GWR was developed to estimate locally varying coefficients for the explanatory variables for each sample location, , with intercept and residual [62]. The expression of the GWR model is like the following
where:
- : dependent variable at location ;
- : jth explanatory variable at location
- : jth local correlation coefficient at location ;
- : error term at location .
As mentioned previously, to estimate a unique set of coefficients using the given case and nearby cases (neighbors), a distance-based non-zero weight function will be applied for them. The weight function can be a Gaussian function or a kernel function. Other cases located beyond the bandwidth will get zero weight.
Then how does GWR estimate the scale of operation? Under ideal circumstances, we would know the actual scale of the operation of the given spatial process. However, this is not the case for most research, requiring an approach based on the distribution of the given data. GWR uses least-squares cross-validation and goodness of fit measures to estimate the distance that minimizes the sum of residuals, considering distance decay effect. In other words, it searches the distance that can maximize the similarity of the spatial process.
For each location i, GWR derives a set of unique parameters using weighted least squares. The weight is determined by distance from the given location, usually based on a kernel function. Only neighboring locations, defined as either the locations within a given distance threshold (fixed) or the given number of the nearest locations regardless of the distance (adaptive), will be given non-zero weight. This is expressed as in matrix form
where denotes a j × 1 vector of estimated coefficients, X represents n × j matrix of the explanatory variables, W(i) means diagonal weight matrix, and y is a n × 1 vector for the dependent variable.
However, as stated earlier, applying an identical scale of operation for every explanatory variable can be a wrong idea. To consider the mixed effect of a local and global variable simultaneously, GWR model was modified as follows, referred to as semi-parametric GWR, or SGWR [64]
This model estimates coefficients of global variables and local variables separately, limiting spatial variance only for local explanatory variables. In simple terms, SGWR computes general linear regression for global variables, while it produces local estimates only for variables designated as local.
However, SGWR has two limiting issues. Firstly, making the distinction between local and global variables could be arbitrary or extremely time-consuming. Arbitrary classification possibly results in erroneous estimation. Alternatively, the local-global variable test is possible by altering a variable’s category one at a time, followed by the goodness-of-fit test for evaluation. However, this can be a very time-consuming procedure, as all possible combinations need to be evaluated. Furthermore, even if the local-global distinction can be made easily, SGWR only allows two scales of interaction: global or fixed-scale local.
To overcome this limitation, Fotheringham et al. (2017) propose another variation of GWR, multiscale GWR (MGWR) [21]. The fundamental idea of MGWR is using different search bandwidth, the scale of operation, for each explanatory variable to estimate its coefficient. Bandwidths are determined by the data rather than relying on external factors.
Here, indicates the scale of operation (bandwidth) of the jth explanatory variable. To determine the bandwidth, MGWR requires a different approach than GWR and SGWR as it needs to derive multiple different bandwidths for given variables at the same time, so it uses a back-fitting approach. This back-fitting is initialized from ordinary GWR or OLS estimation, and tests goodness-of-fit for each variable to find the most suitable bandwidth to reflect the scale of operation indicated in the given dataset.
4. Results
4.1. Traditional Hedonic Pricing Model
Before the analysis of MGWR, we conducted the traditional HPM-analysis-based OLS method, and summarized the reultd in Table 3. In the listing functions group, the number of guests, bedrooms, and bathrooms have positive relationships with the price, while sharing a property (private room or shared room) lowers the price. The tendency of the listing functions is similar to previous research results in both cities [9,56]. However, the influence of the cancellation policy is different in LA and New York. In New York, the strict cancellation policy has a positive effect on the price compared to a moderate one, while a flexible policy has no impact. In LA, the influence of cancellation policies was precisely the opposite. Previous studies also showed similarly mixed results: a strict policy may have a positive impact [13,56] or may not have any significant influence, while flexible policies impact negatively [9]. Local characteristics may determine the relationship between the cancellation policy and the price.
The OLS results revealed that web-based reputation variables have a negative influence on the price. This seems to contradict the previous theories about the influence of reputation. However, it has been theoretically and empirically confirmed that the customers have less faith in the review ratings of the Airbnb listings, as the rating score can be determined by any customer, unlike ratings for hotels evaluated by a third party [13]. The number of reviews also showed the same tendency as in previous studies, impacting negatively on the price. On the other hand, superhost status and service duration have a positive impact on the price. In the signal theory, the customers try to find alternatives (superhost, durations) for the neutralized signals (rating, the number of reviews) to make decisions [13]. Our finding agrees with the signal theory.
In the geographic information group, distance to the tourism destinations and poverty ratio follows the conventional pricing mechanism. The positive coefficient shows a similar tendency to the analysis in the existing HPMs [6,14]. LA has a relatively higher coefficient for the distance. This is a reflection of the geographical characteristics of the two cities, as the destinations in the New York area are clustered to each other compared to LA destinations, and most accommodations are located close to those destinations. The larger size of the LA area is also assumed to influence the pricing decisions regarding distance, which was reflected in the different scale bars that appeared in figures.
However, the relationship between the density of nearby Airbnb listings and the price showed almost opposite results compared to the traditional understanding of the competition and price in the economics, as it turned out to be utterly irrelevant in the LA area while showing a positive influence in New York. After all, Airbnb accommodation is not a business that provides identical goods at the same location. Therefore, it can be interpreted as Airbnb listings being more sensitive to demand based on geographical location, and higher density is an indication of higher demand, which corresponds to the results in Chen and Xie (2017) [9].
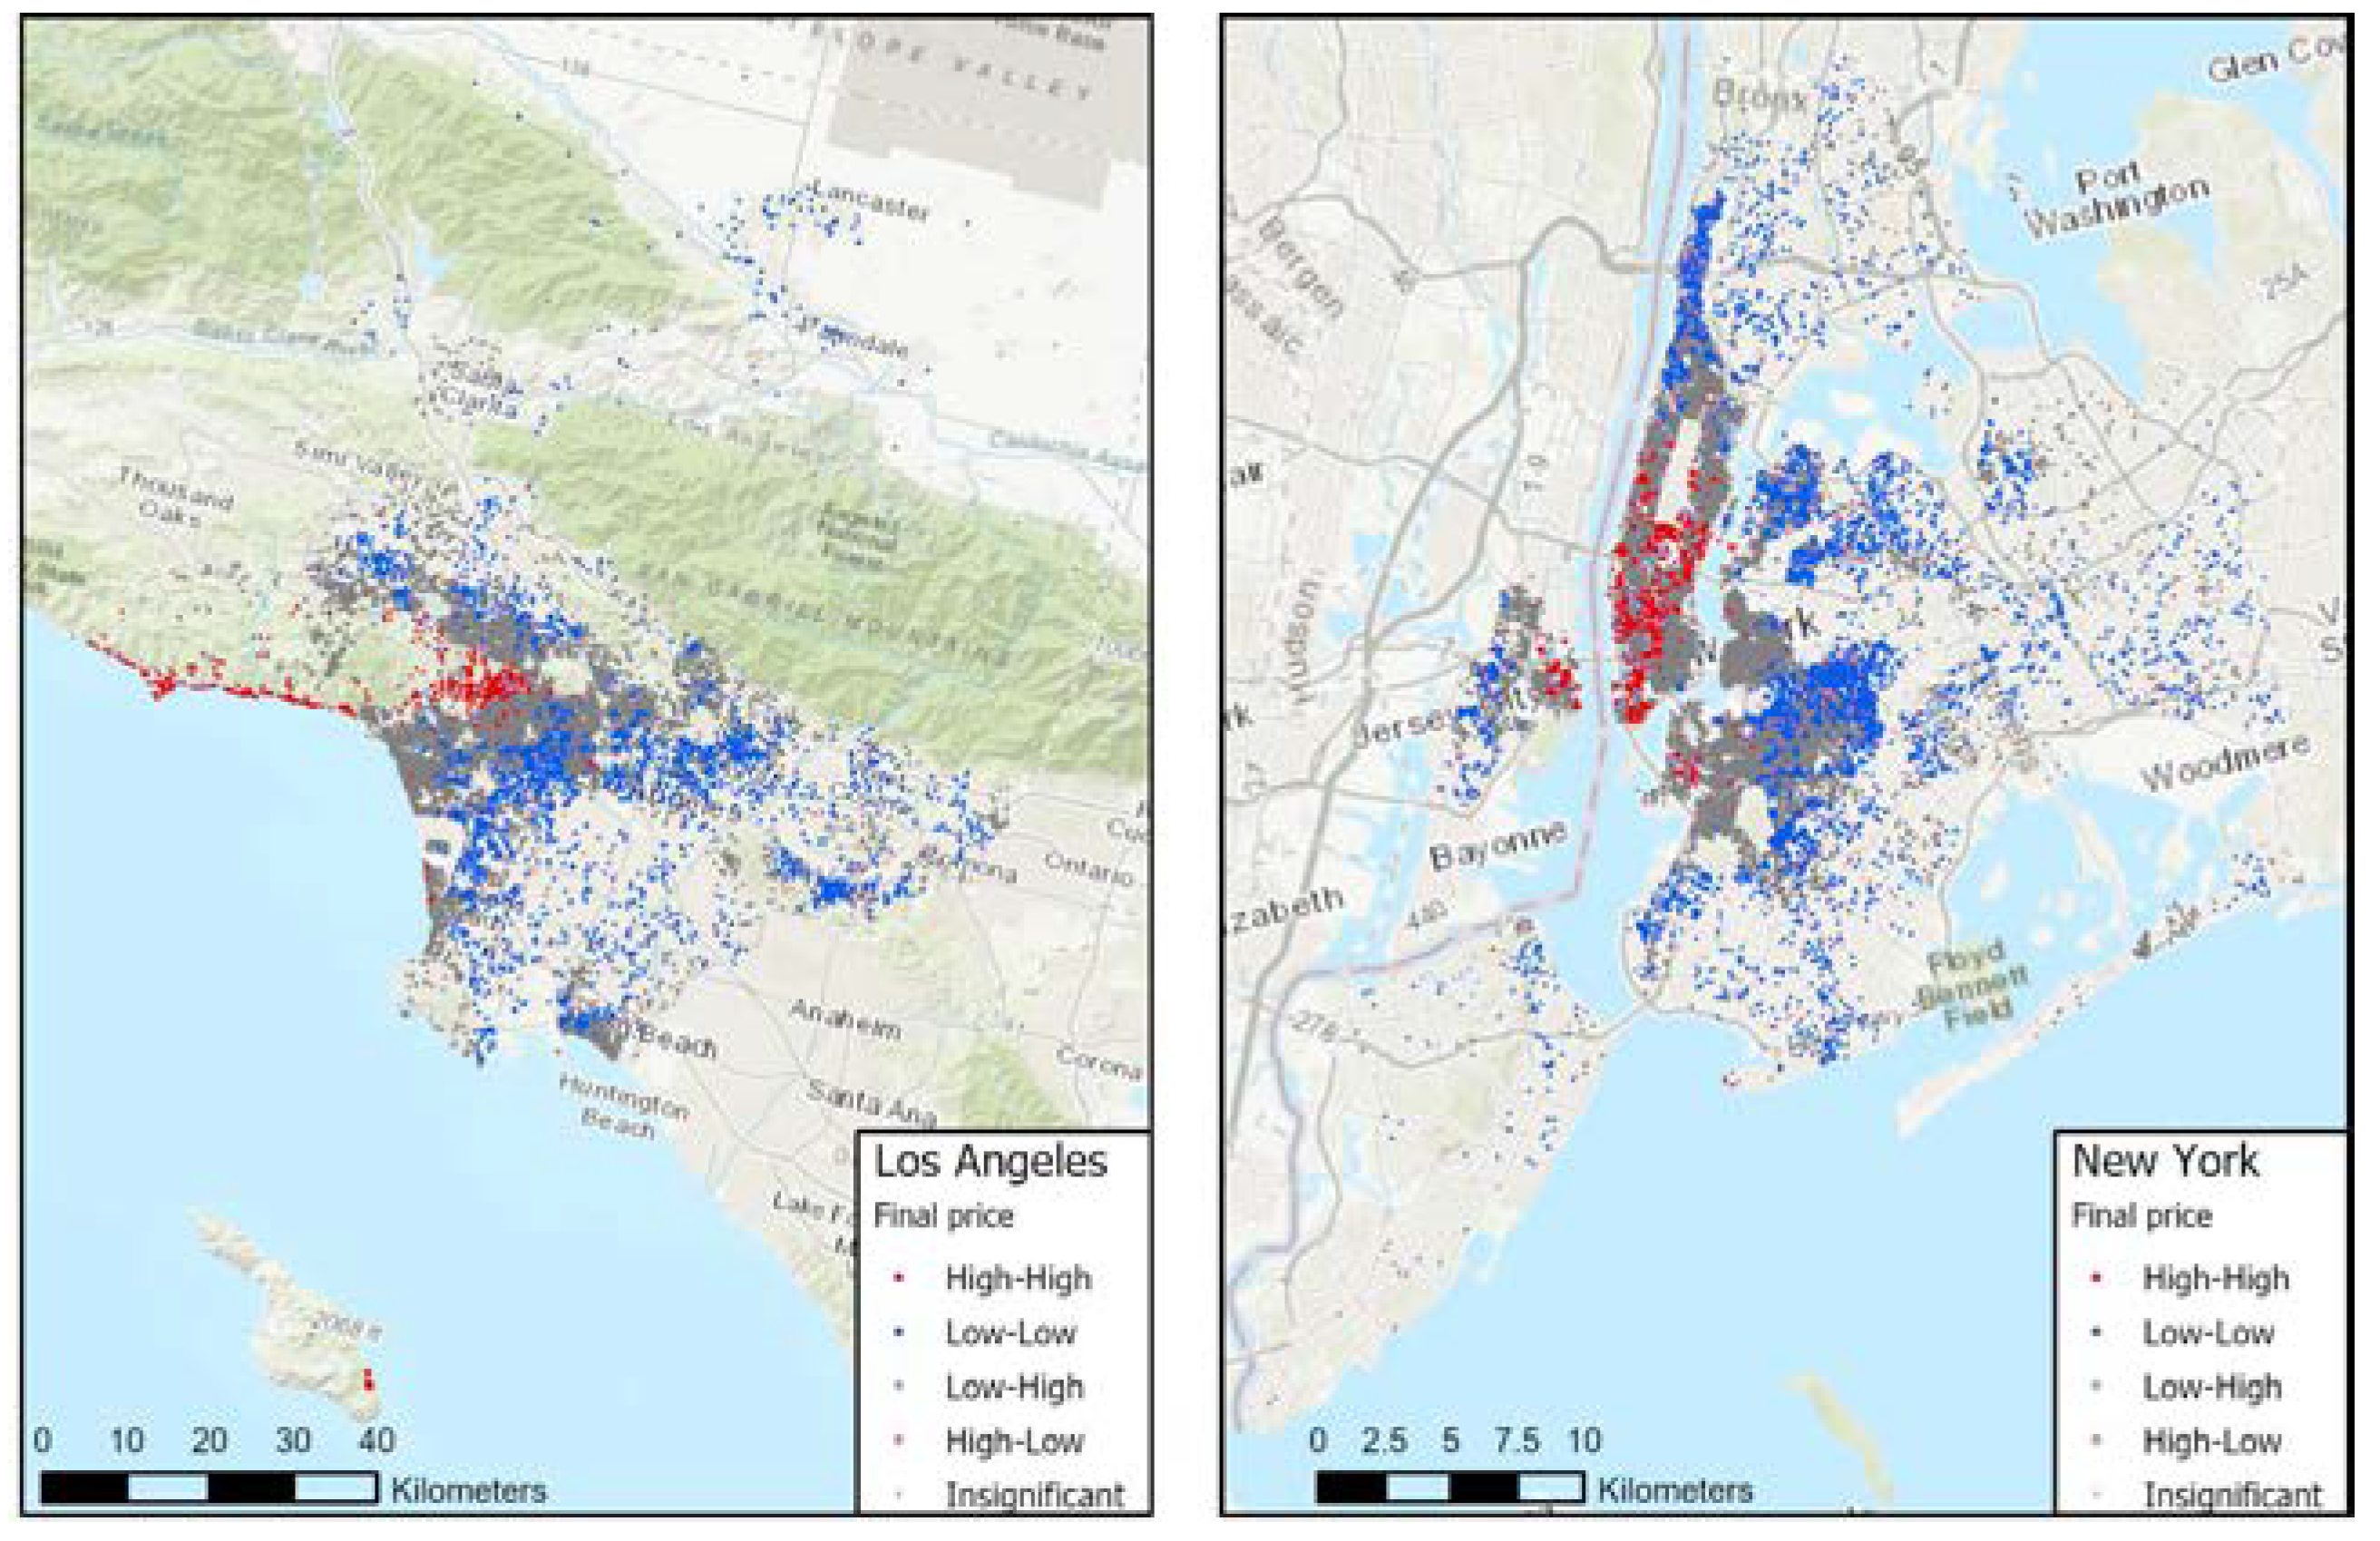
The implication of the negative relationship between the review rating and the price in the OLS-based HPM needs to be discussed more in detail, which also appeared in the previous studies [13,16]. We assume that it is a result of spatial spurious regression, based on our findings like high t-values (LA: −18.766, NY: −7.762) with relatively lower R2 values, as well as the existence of spatial autocorrelation in both cities as depicted in Figure 2 (high-high and low-low clusters). Spatial spurious regression is a regression that shows false evidence of the correlation between two independent non-stationary variables due to random walk in error terms. Methods that can consider spatial non-stationarity are required to analyze such datasets with spatial spurious regression [65], such as GWR and its variations.
4.2. MGWR Analysis Results
MGWR estimation results are presented in Table 4 and Table 5, which only include statistically significant cases. As each case has unique correlation coefficients for the explanatory variables, their mean, standard deviation, median, minimum, and maximum values were presented to summarize tendency in each city. Bandwidth, or the scale of the interaction of each variable, were also included. The ratio of significance represents the percent of statistically significant cases for each variable. The explanatory power of MGWR is noticeably higher than OLS, which indicates that MGWR successfully considers localized spatial influence in the price of Airbnb listings.
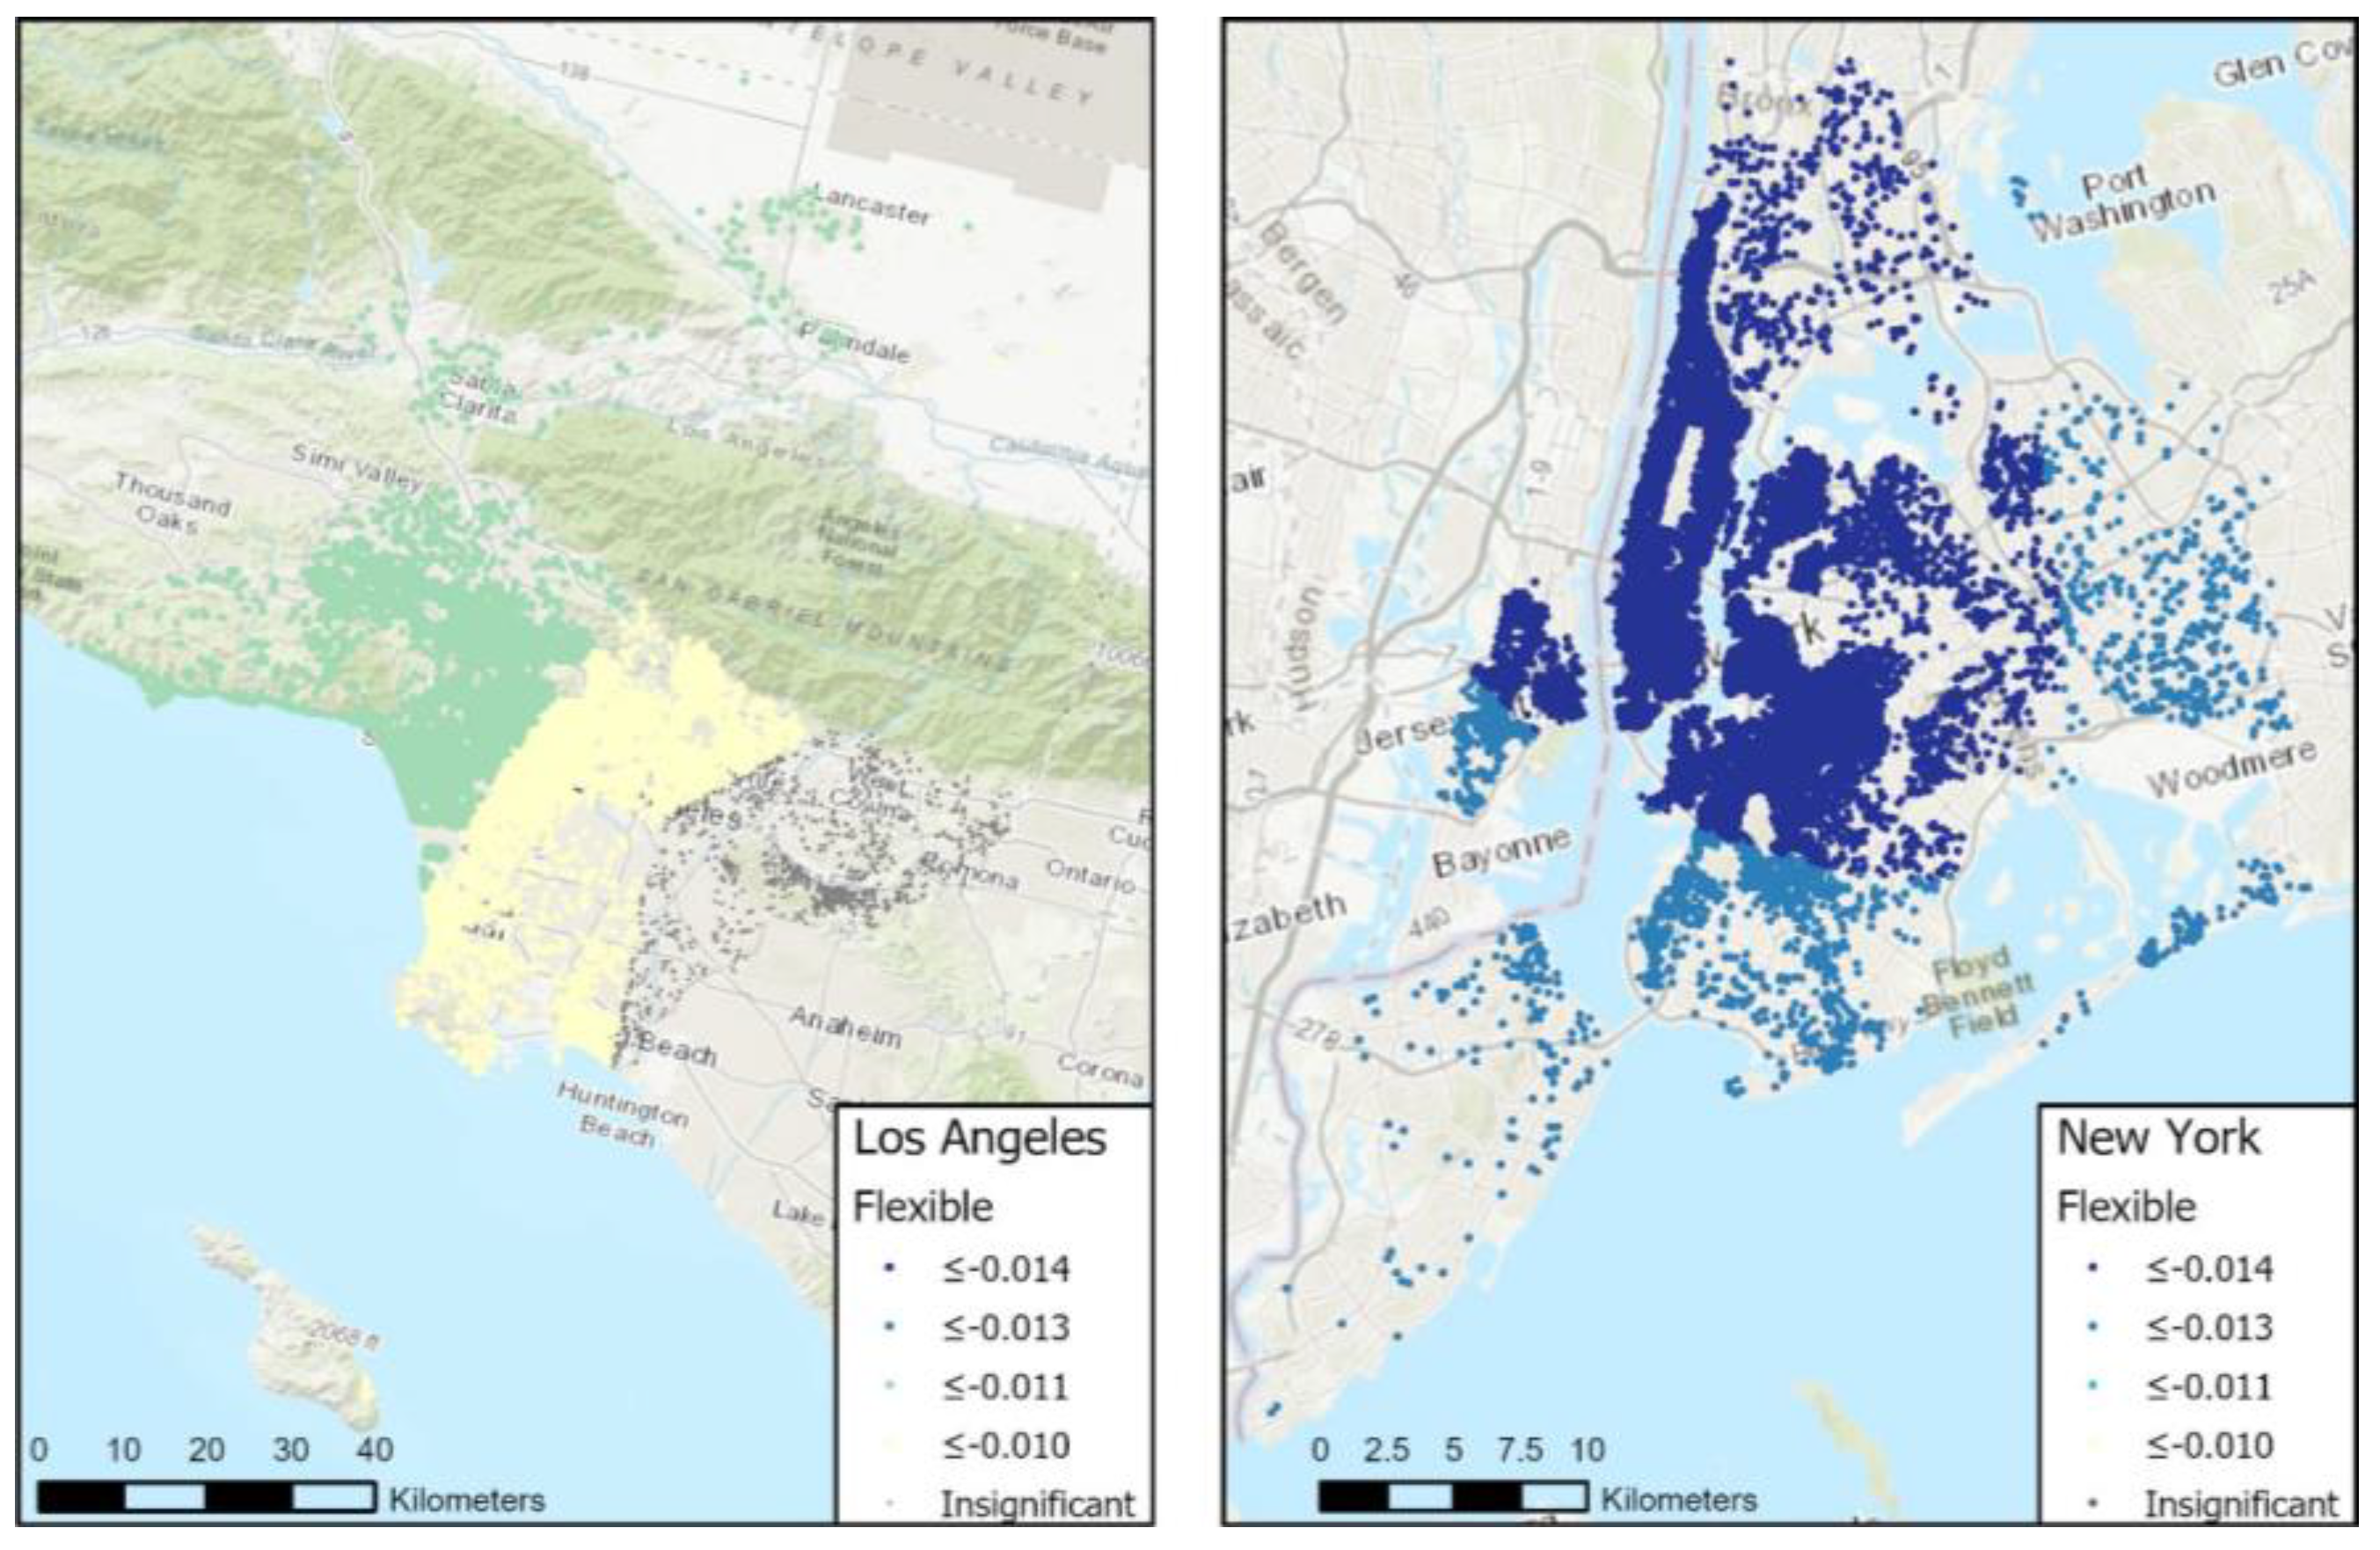
Regarding the scale of operation of the pricing variables, MGWR results revealed that (1) the scale of operation varies widely among variables; and (2) even for the identical variable, the scale of operation differs between cities. Based on the bandwidth and the statistical distribution of the coefficients across each city, we classified the pricing variables as local, regional, and global variables. In LA, one cancellation policy dummy (flexible), the number of reviews, and the distance to tourism destinations were identified as global variables. In New York, the strict dummy variable appeared to be regional, and superhost, poverty ratio, and Airbnb density were identified as global variables in addition to the above three variables. These global variables can be interpreted in two ways: (1) Airbnb hosts in each city use similar pricing strategies regarding these variables, and/or (2) the hosts are influenced by other competitors’ pricing strategy related to these variables’ city-wide scale. The spatial distribution of correlation coefficients of the flexible cancellation policy in the two cities in Figure 3 shows the global characteristic of the given variable. In LA, the flexible policy resulted in a slight price drop of 1%, with less than 0.1% variance across the entire area. A similar observation has been made in the New York area, though the influence on the price was a little stronger than the LA area.
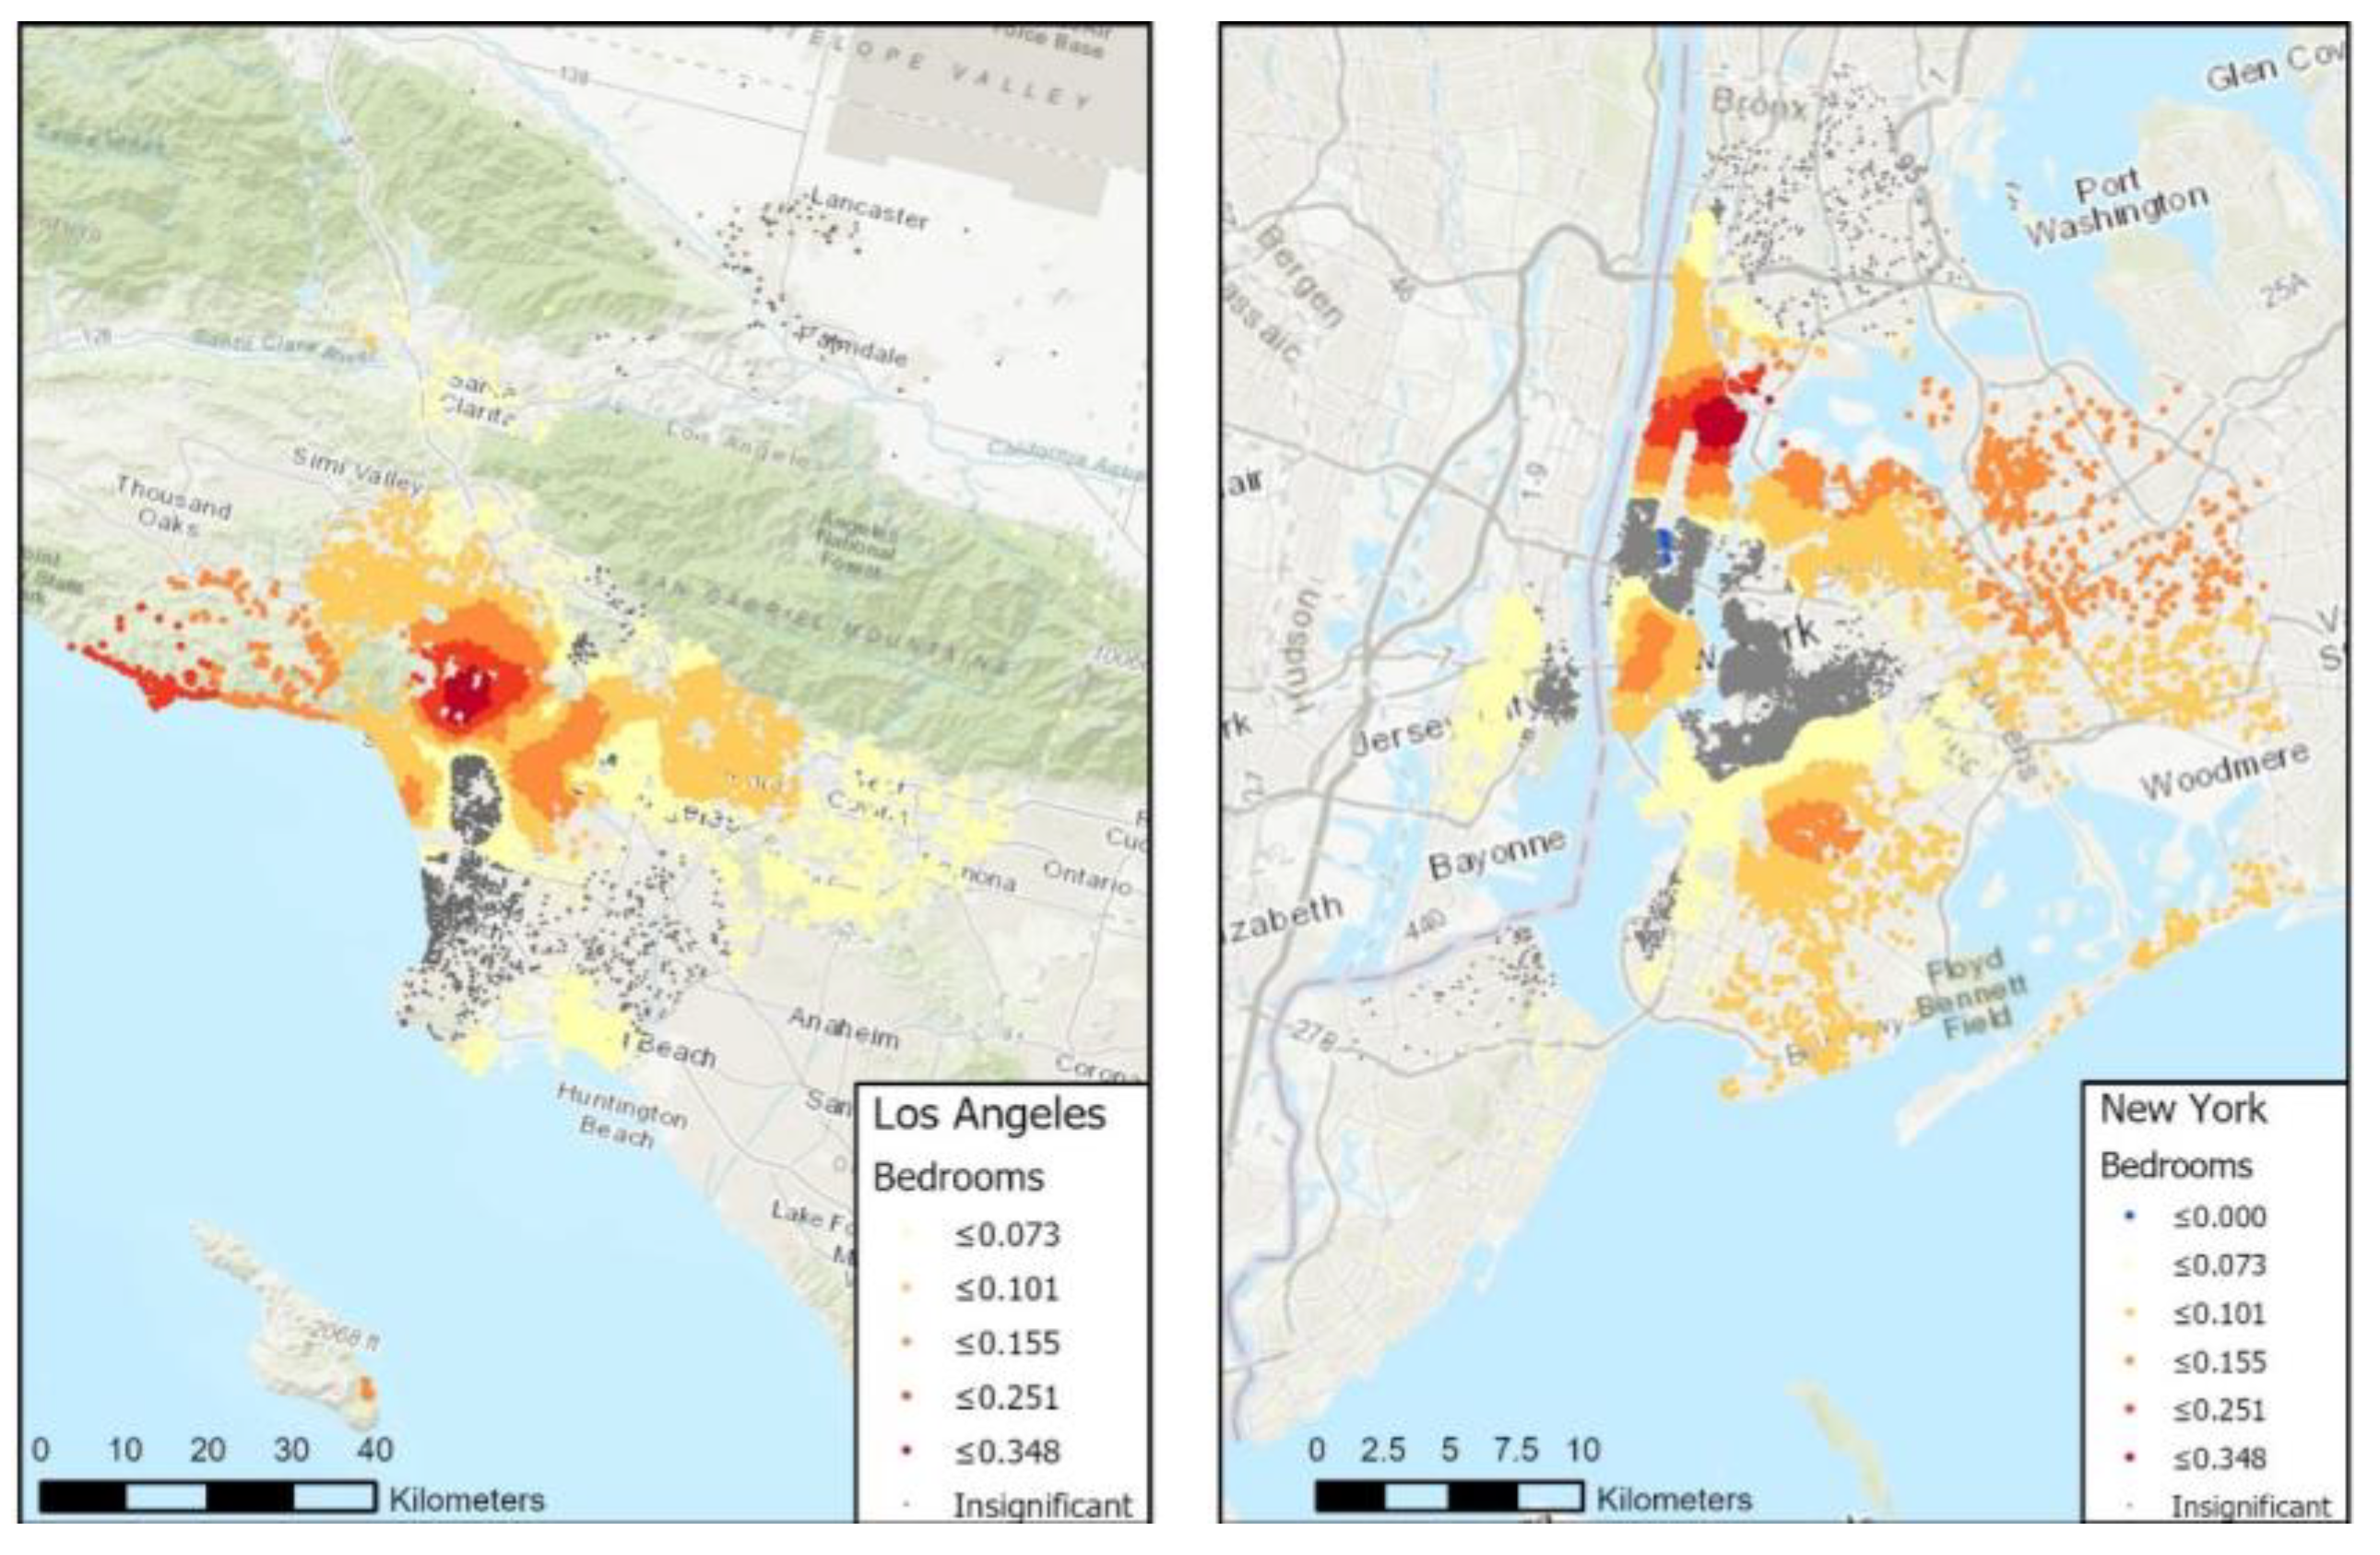
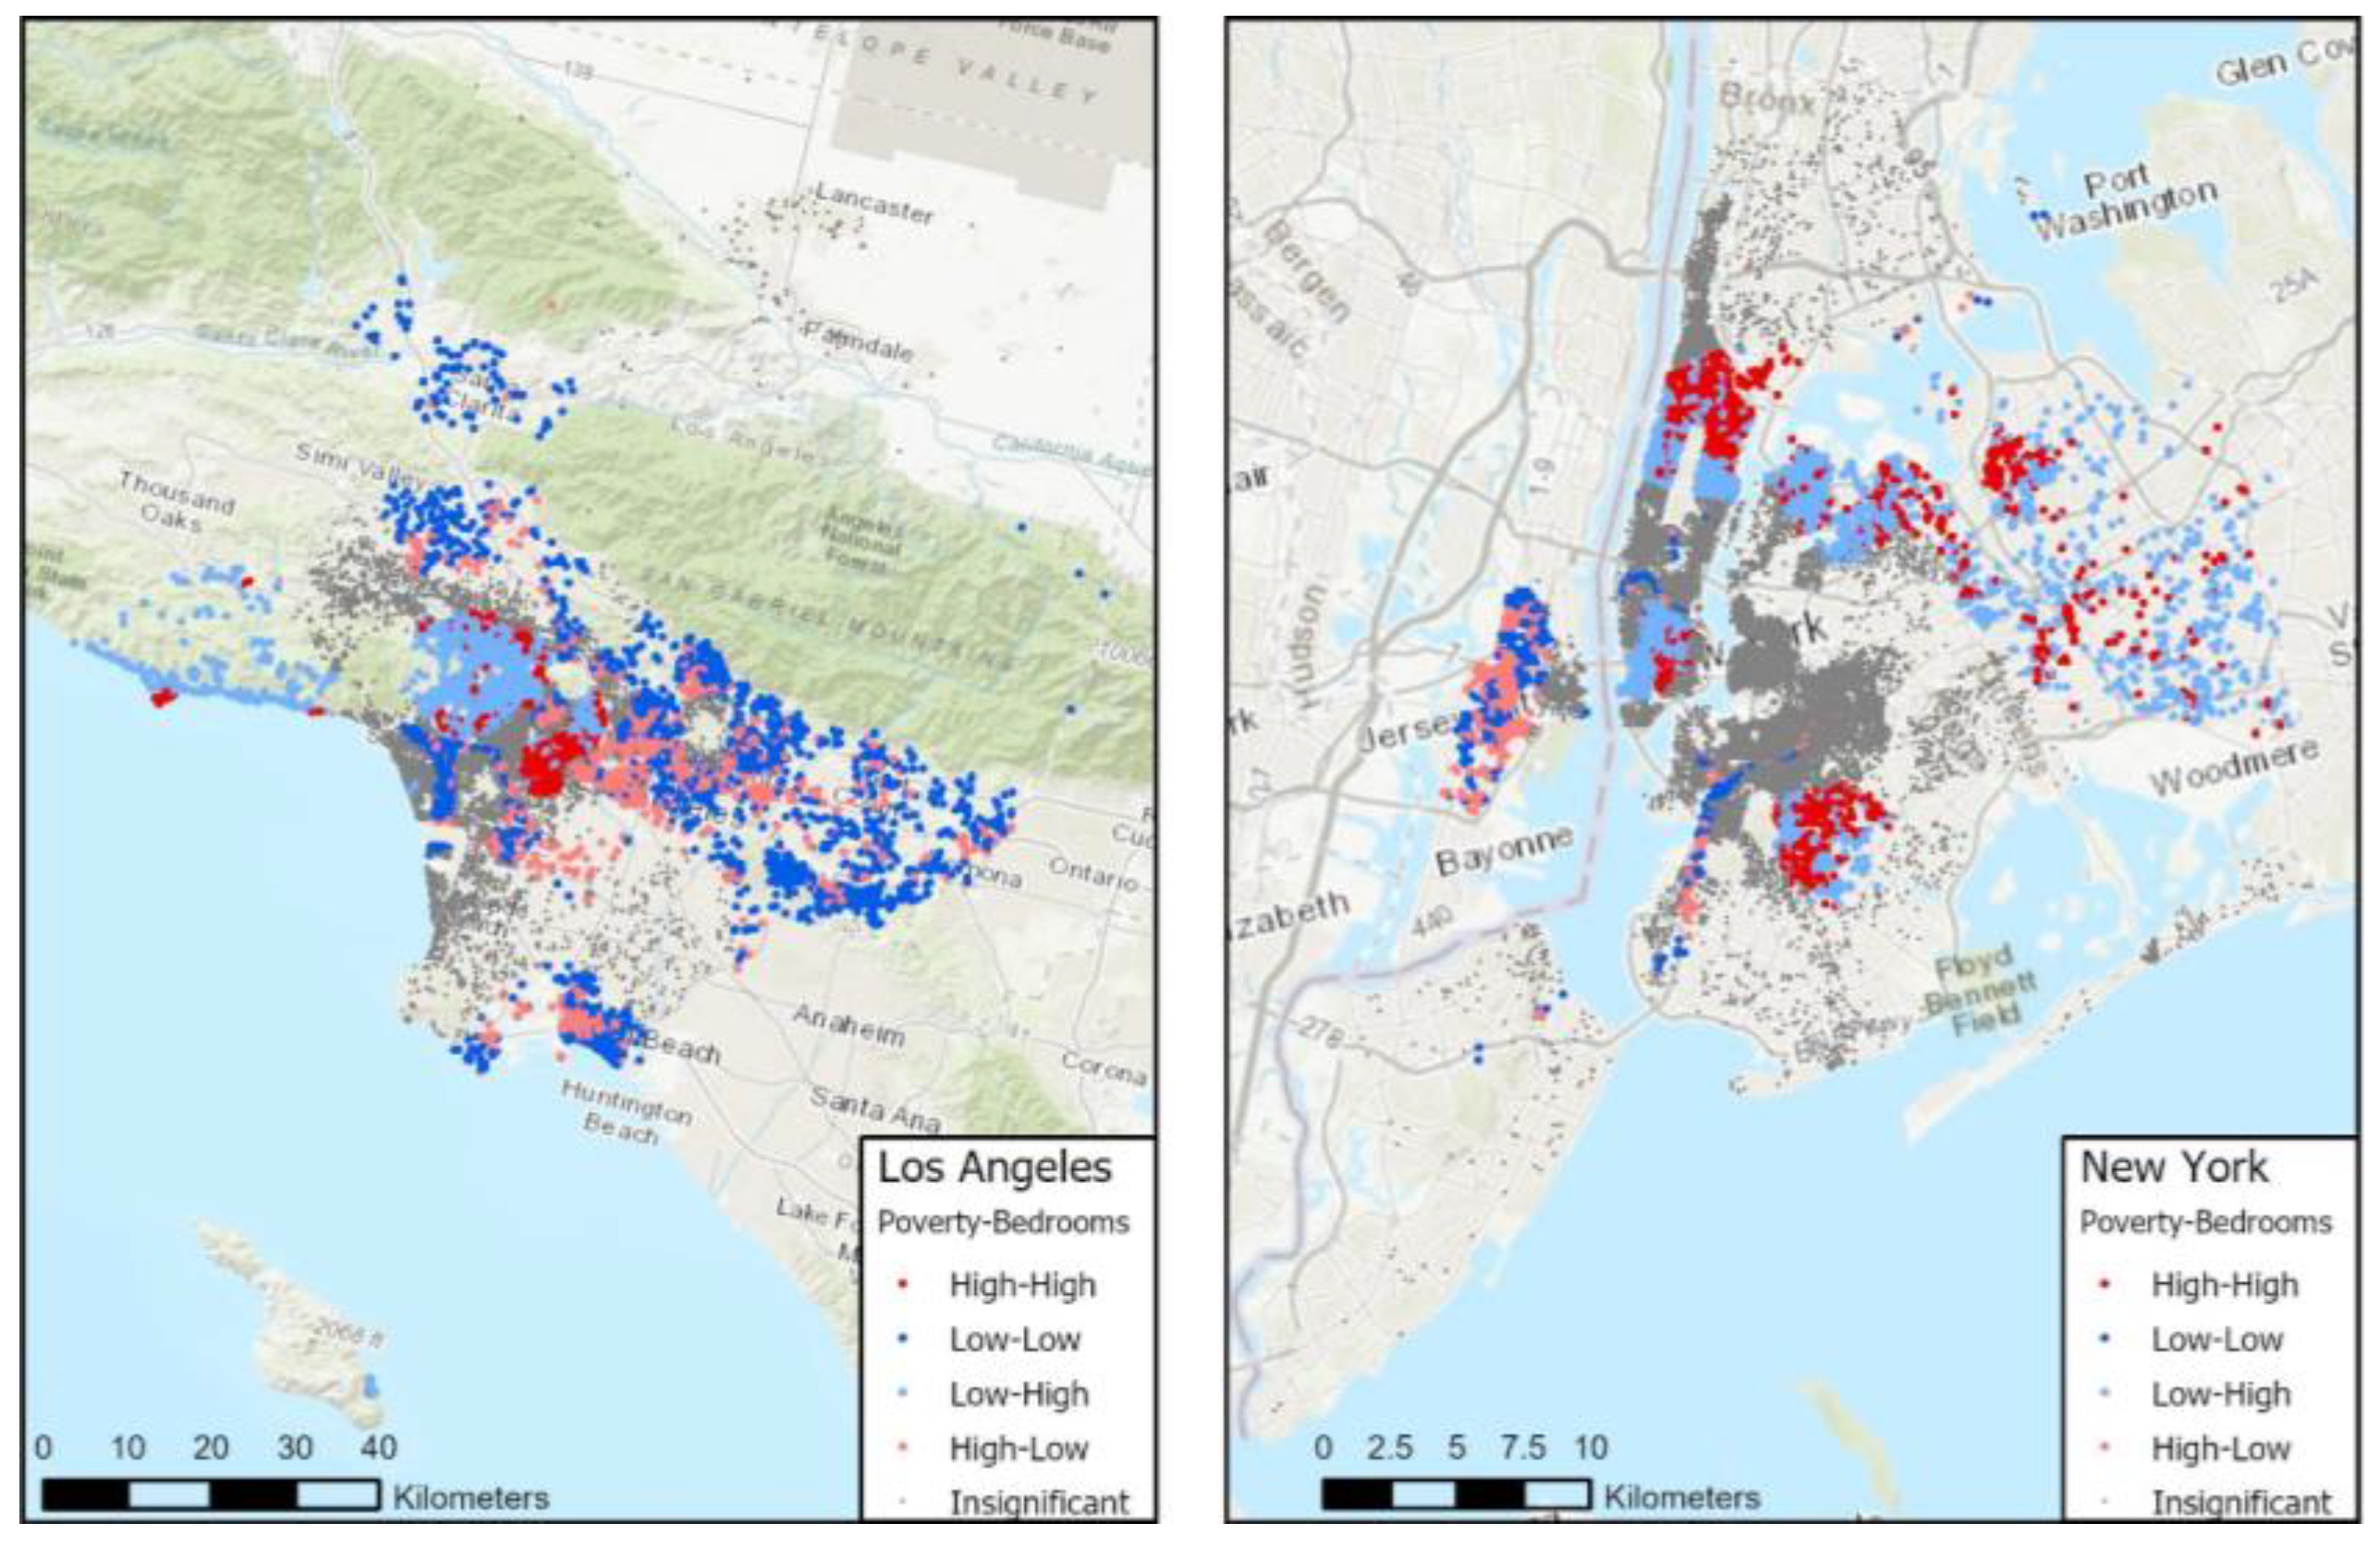
The distribution of the coefficients for the number of bedrooms shows the difference between local and global variables clearly (Figure 4). The bandwidth of the bedroom is about 1.3 km in both cities, which reveals that the hosts in the two cities tend to refer only the neighboring competitor’s strategy regarding the pricing with bedrooms. In the New York area, the stronger influence of the bedrooms that appeared in Harlem and lower Brooklyn areas can be partially explained by the poverty ratio. Figure 5 shows bivariate cluster analysis results between the poverty ratio and the correlation coefficient of bedroom variable, where high–high points are clustered in those two areas. However, in the LA area, such a relationship was not observed (Figure 5). Instead, Airbnb listings more sensitive to the number of bedrooms are clustered in the Hollywood area (central cluster) and Malibu area (western beach area), where the poverty rate is relatively low (low–high clusters). Therefore, this could be a result of higher housing prices.
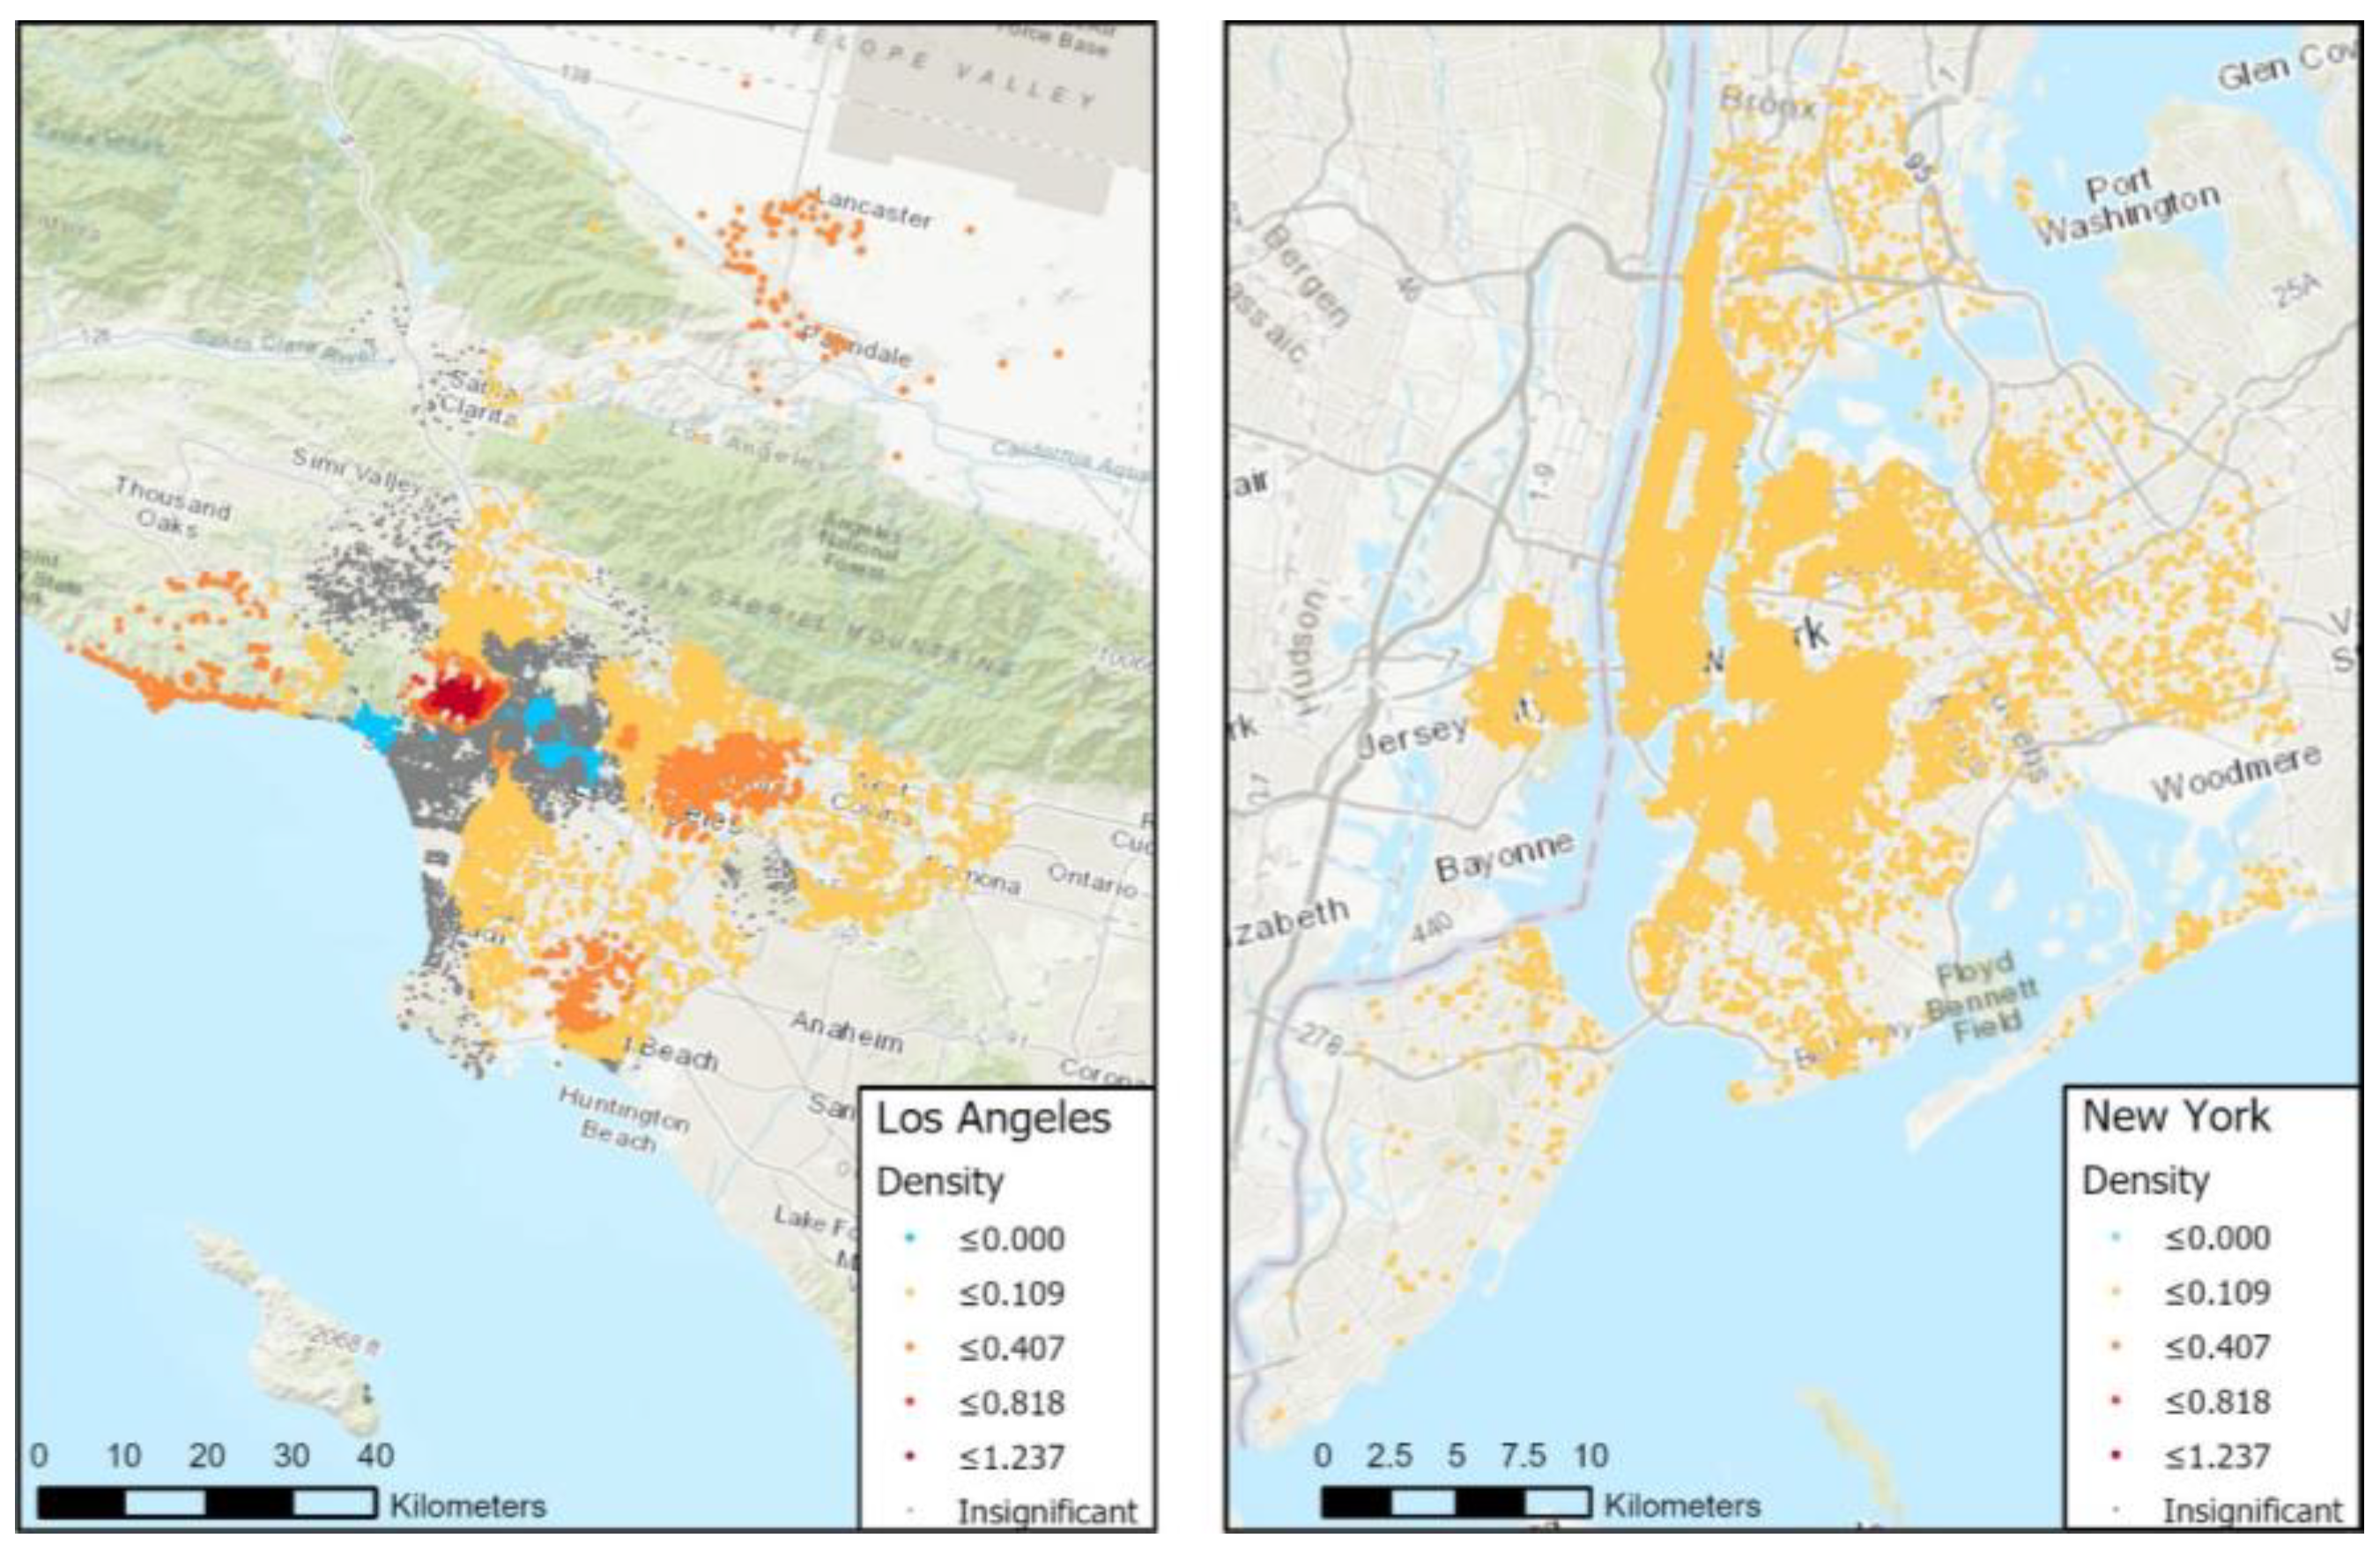
However, the influence of the pricing variables has inter-city differences, not just intra-city variances. For example, the density of Airbnb listings has a globalized scale of operation in the New York area, increasing by 10% in the final price with a rising one-standard deviation (Figure 6). On the other hand, the density is a local variable with much narrower bandwidth (670 m) in LA. This is consistent with the conclusions of previous studies, where the price characteristics of accommodations vary significantly from city to city [14,53].
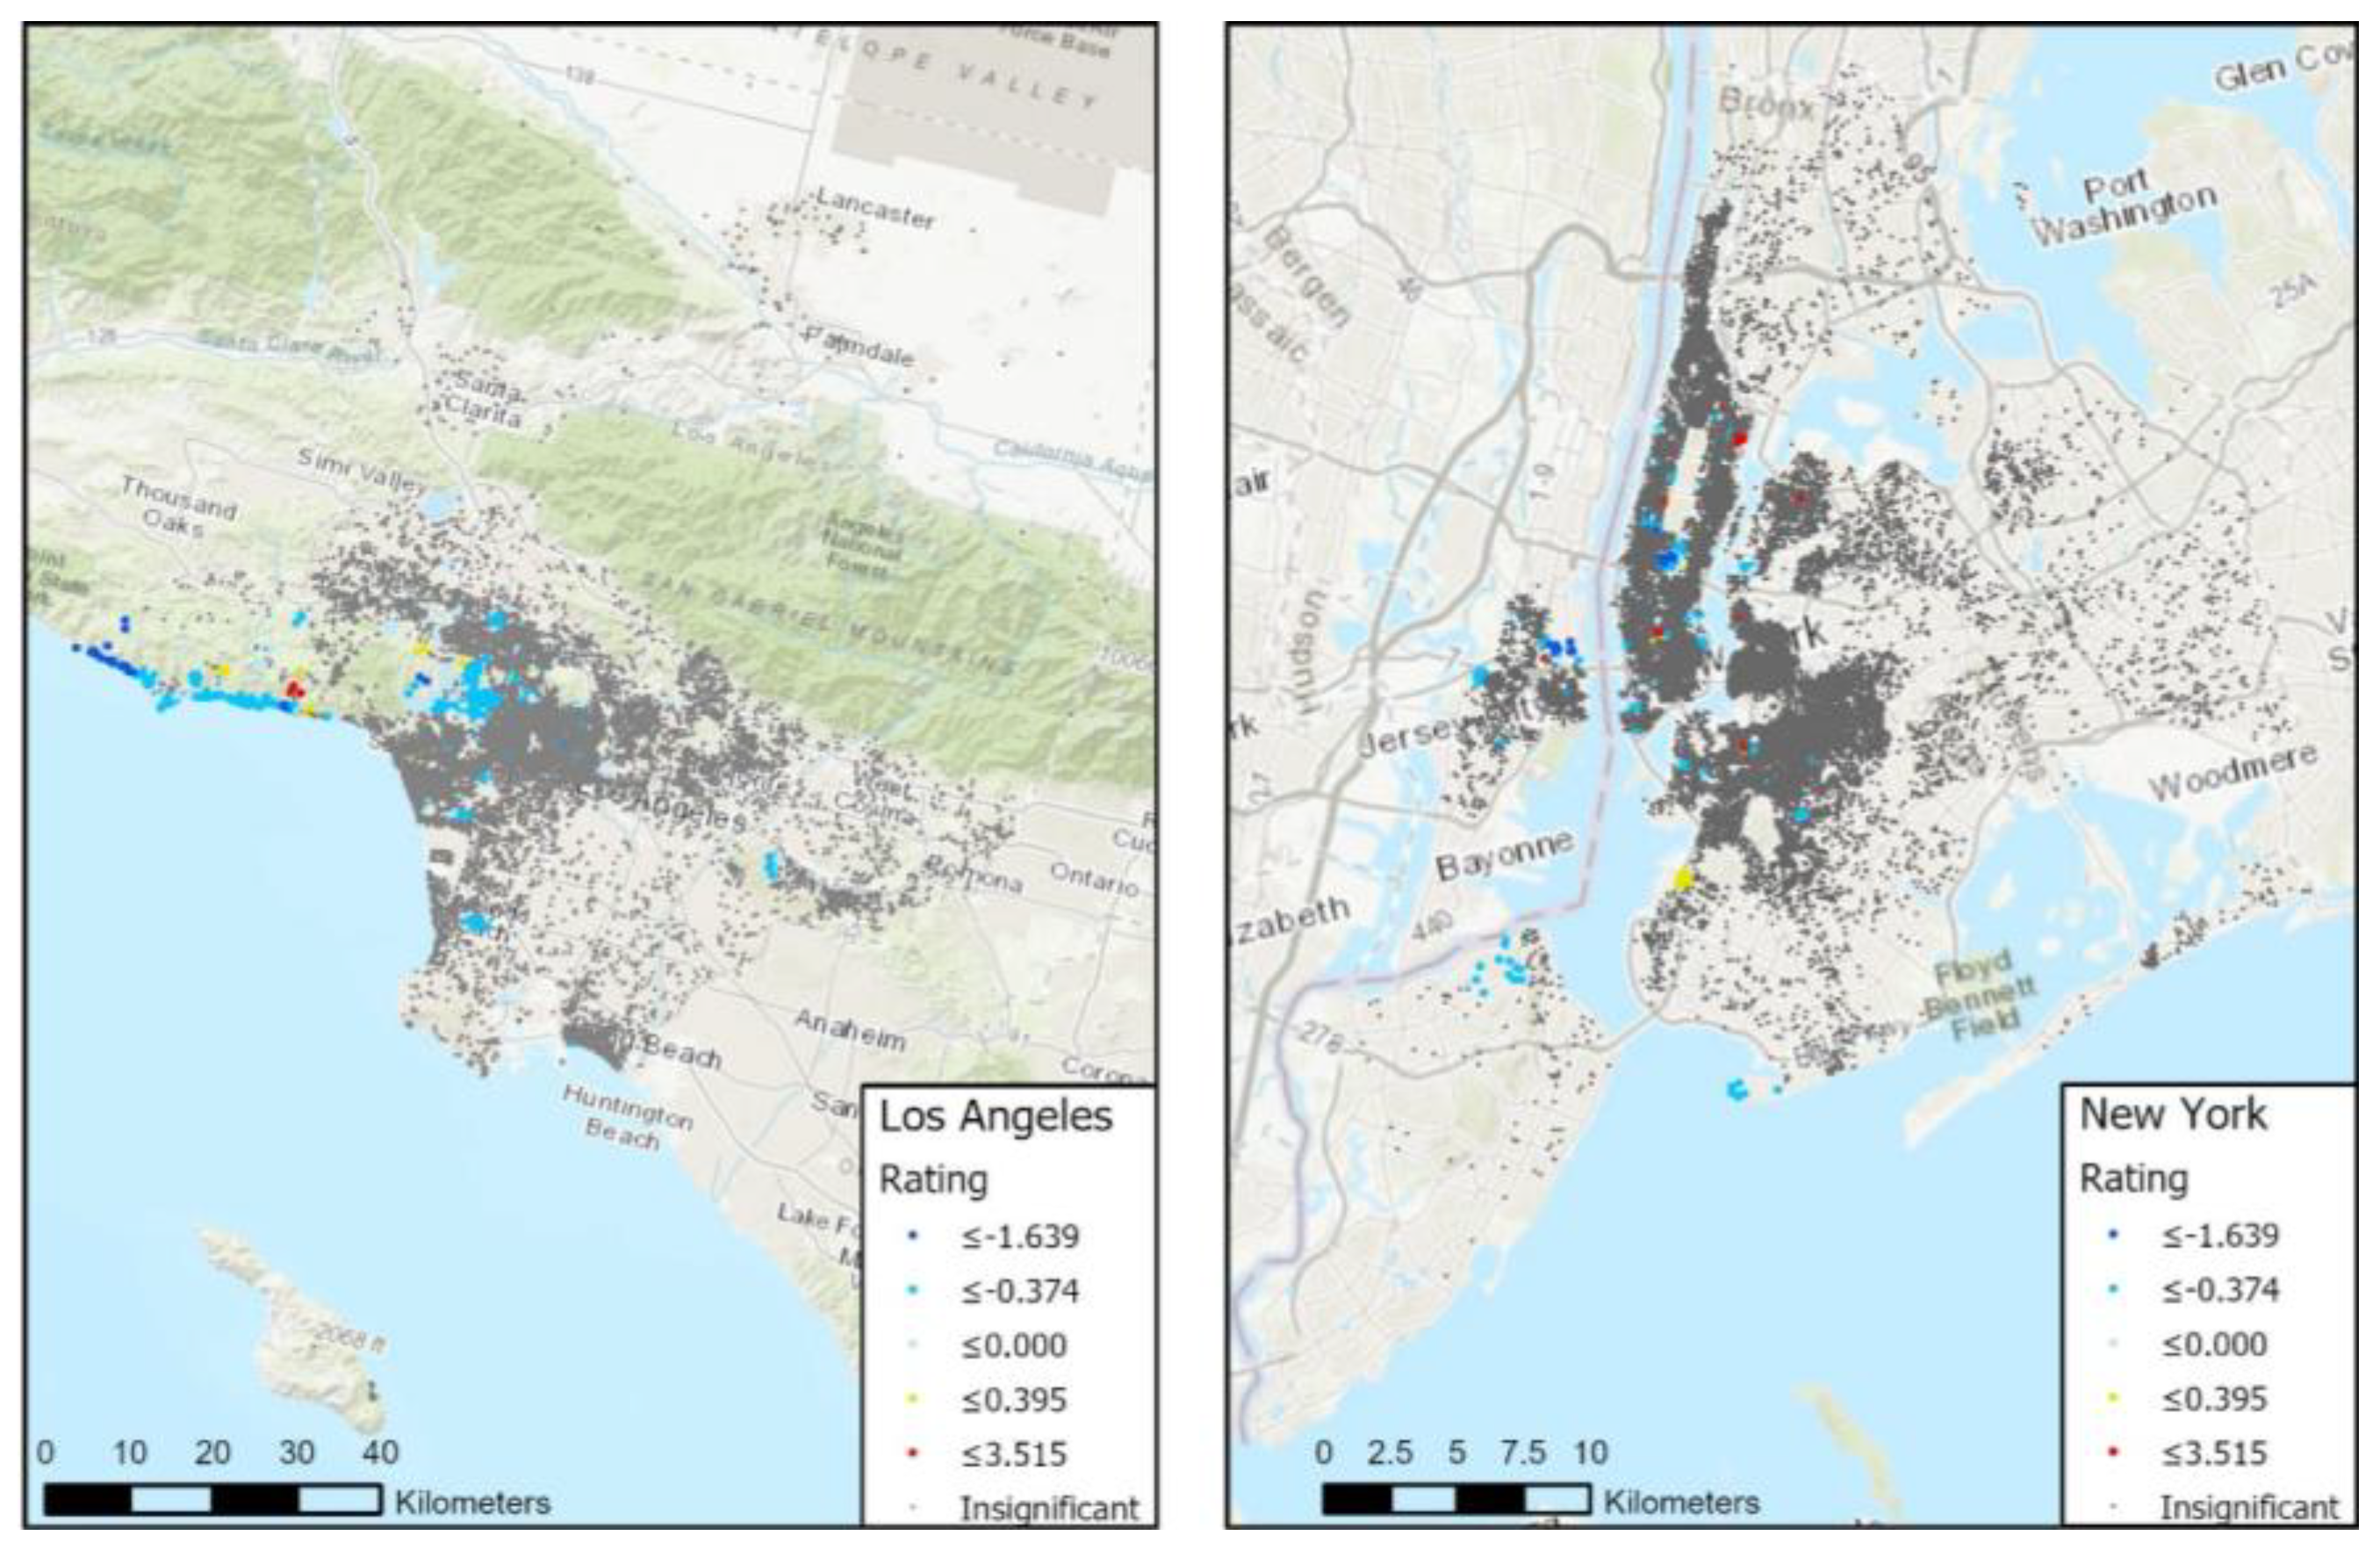
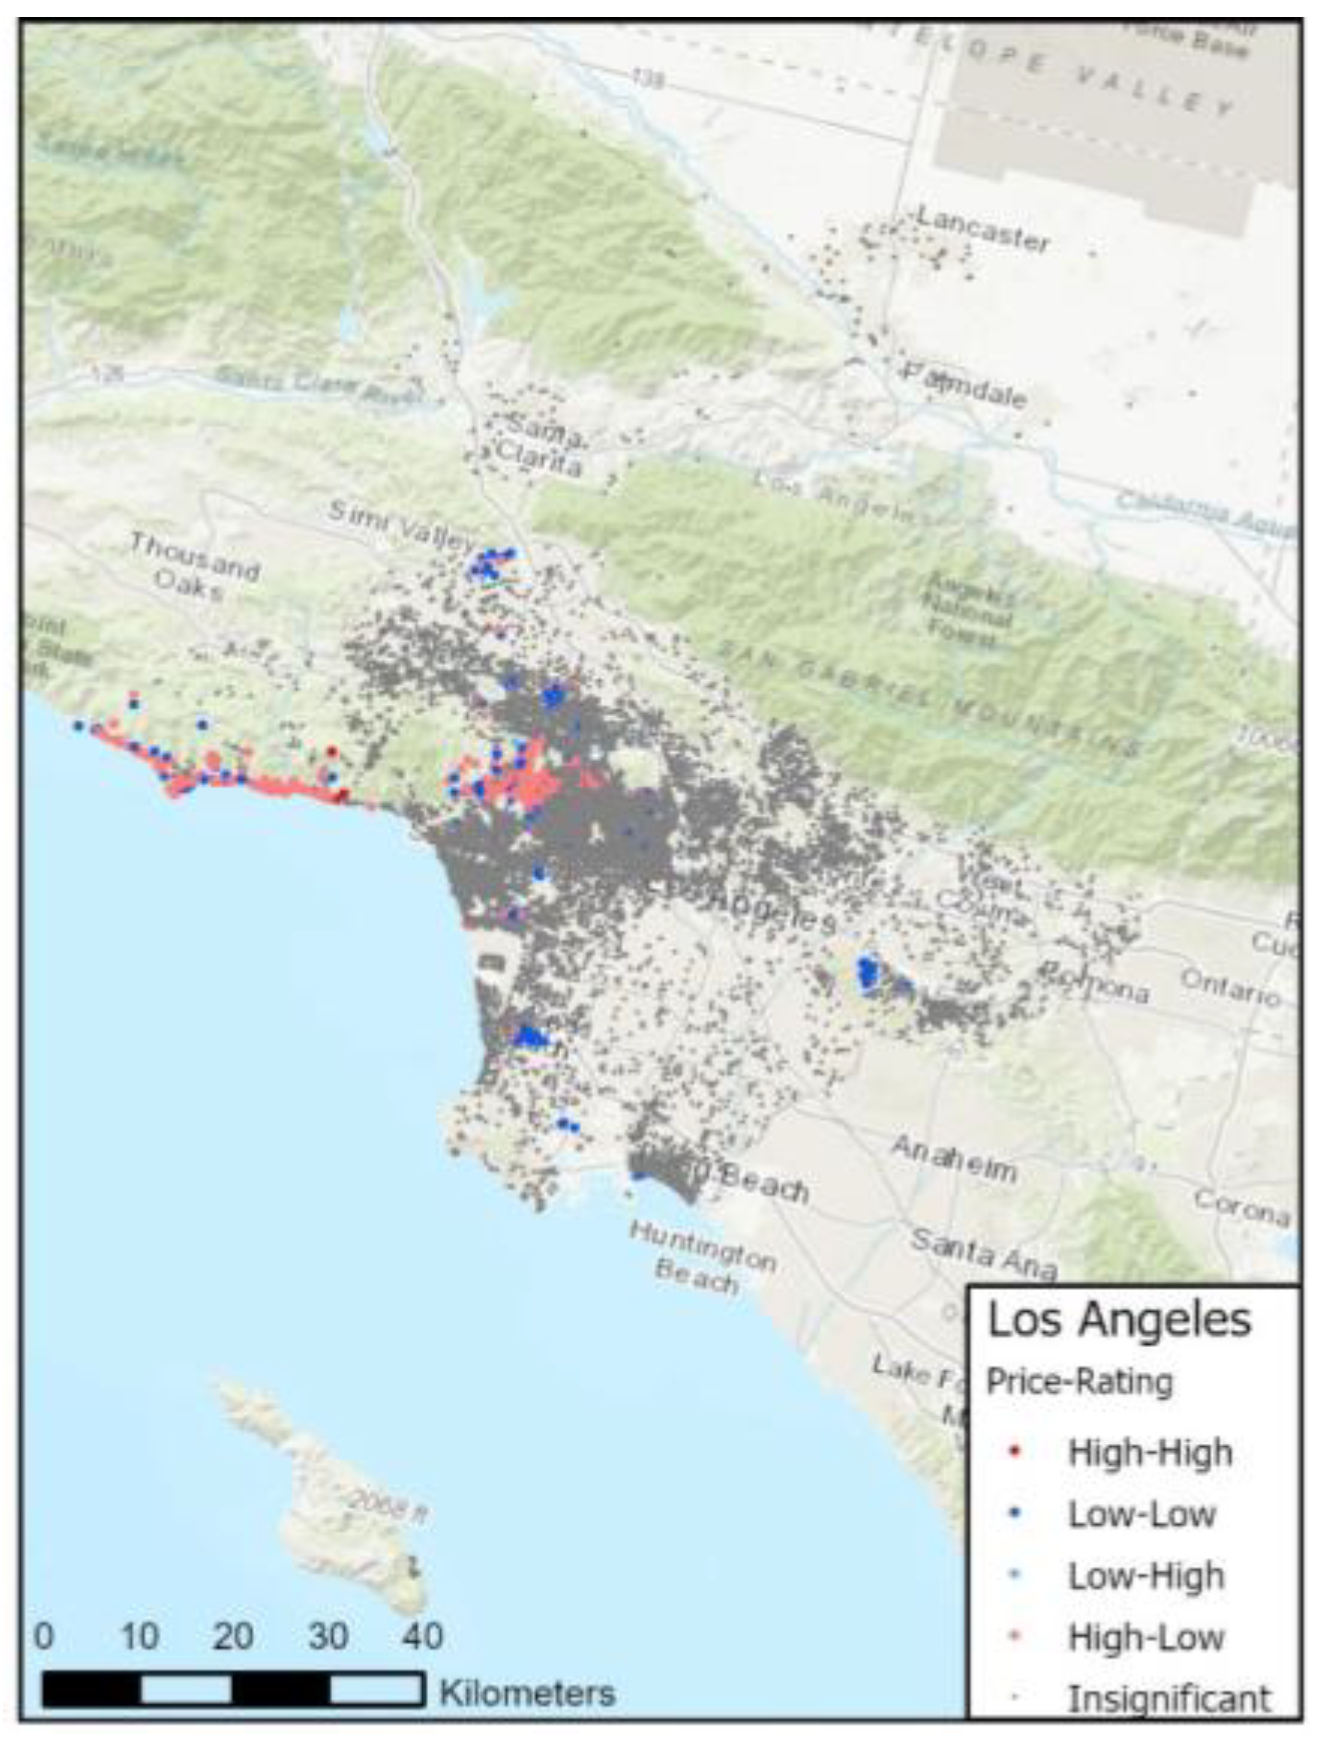
The most noteworthy aspect of this study is the relationship between review rating and Airbnb price. In OLS results, they have a negative relationship with significantly higher t-values (LA: −18.766, NY: −7.762). However, MGWR revealed a different pattern (Figure 7). The review rating was not statistically significant in most of the listings in the two cities. In New York, no distinctive pattern exists, and less than 5% of Airbnb listings in New York show statistically valid relationship between the review rating and price. This confirms that the observed effect of the review rating in the OLS-based HPM was incorrect, which was the result of spatial spurious regression. Spatial non-stationary should be considered using MGWR to prevent such erroneous estimation. In the case of LA, a negative relationship exists in Hollywood and Malibu areas. This is consistent with the previous Airbnb research, as well as hotel practice [13,56]. There have been two possibilities suggested for this anomaly in the Airbnb pricing [16]. Firstly, biased and inconsistent customer review ratings in the Airbnb platform. It has been discovered that the ratings in Airbnb tend to be higher than other accommodation platforms [35], which can lead to such different relationships between the price and the review ratings in Airbnb. Another possibility is the unique nature of customer satisfaction in Airbnb, as the customers mostly value its low price. In the previous Airbnb research, the low price has been recognized as the core value of Airbnb, along with cultural exchange. This causes a higher correlation between the low price and the satisfaction of Airbnb, as a customer likely to give higher ratings more easily for a low-priced listing, since the expectation for other factors would be low. However, for the high-priced listings, an opposite tendency would exist, as it is possible that a customer has higher expectations that are likely to result in disappointment regarding other services. Figure 8 shows bivariate cluster analysis results for the price and review rating for the LA area, which suggests the potential influence of the expectation-based negative relationship in LA (high–low clusters).
5. Discussions and Conclusions
In this research, we analyzed the pricing determinants of Airbnb listings in LA and New York, using OLS and MGWR HPMs. OLS-based results presented similar results to the previous Airbnb studies regarding the influence of listing functions, attributes of the host, reputation variables, and geographical characteristics. The results also showed that the explanatory powers of the identical pricing variables were different between locations, and distinctive geographical properties explain this. However, OLS was not able to reveal the reasons behind such differences, since it cannot include spatial variance in the model. The opposite estimation in the review rating to the previous studies could not be explained with OLS results. On the contrary, MGWR was able to reveal that the spatial variance (the scale of operation) of pricing variables varies within a city, as well as between cities, due to their geographical characteristics. Unlike the OLS, MGWR estimated differing spatial influences for the variables. From this, MGWR provided the groundwork to analyze how geographical location affects the influence of the pricing variables, as well as geographic visualization of the results. Additionally, we presented that the traditional OLS-based approach can mislead a non-significant relationship to a significant one due to its ignorance of spatial variance.
Based on the MGWR results, we demonstrated the importance of the spatial variance and effectiveness of MGWR for pricing research, providing a deepened understanding of the pricing strategies in Airbnb listings. From a theoretical perspective, this research presented the risk of spatial spurious regression in the OLS-based HPM by comparing it with MGWR results. We also proved that MGWR is a useful tool to account for spatial variance in pricing strategies.
Practically, this research showed that pricing models were different among cities and even within a city, with visualization of the results over the maps. Using the MGWR method, this research proposes a practical approach for analyzing spatially varying relationships between pricing determinants and prices for different cities and regions. In addition, in constructing the price policy, the model provides guidelines for practitioners to effectively distinguish the influence of various factors related to price through the model. By theoretically explaining the relationship between price and review rating, which has not been adequately explained in the previous price research, we have empirically demonstrated a methodology to optimize the price of Airbnb and other sharing economy services.
This study suggested a method to effectively analyze the relationship between the price and the geographical characteristics of tourist destinations, but did not cover detailed characteristics of the region. Subsequent studies are expected to expand on how the diversity of a tourist attraction affects price and service characteristics. There is also a need to look more socially and economically into why regional differences in influence arise.
It should be noted that this research has several limitations. First, the estimated pricing strategies and the scale of operation of the variables cannot be generalized, since this research analyzed only two cities. We will need more cities to analyze how the geographical characteristics of locations affect the pricing determinants. Second, distance measurements to tourism destinations need to be updated to reflect various transportation modes for tourists and actual travel time considering traffic and road conditions. Fourth, the housing price of individual houses that host Airbnb listings needs to be included as a pricing variable to evaluate the influence of the housing price directly and more accurately. Lastly, monthly or seasonal variations in the price and the pricing strategy need to be considered since the price varies with time.
Author Contributions
Conceptualization, I.H. and C.Y.; Data Collection: I.H.; Method: I.H.; Analysis: I.H., and C.Y.; writing and editing: I.H. and C.Y.; supervision of the research: C.Y. All authors have read and agreed to the published version of the manuscript.
Funding
This research received no external funding.
Conflicts of Interest
The autors declare no conflict of interes.
References
- Kimes, S.E.; Chase, R.B. The strategic levers of yield management. J. Serv. Res. 1998, 1, 156–166. [Google Scholar] [CrossRef]
- Abrate, G.; Fraquelli, G.; Viglia, G. Dynamic pricing strategies: Evidence from European hotels. Int. J. Hosp. Manag. 2012, 31, 160–168. [Google Scholar] [CrossRef] [Green Version]
- Guillet, B.D.; Mohammed, I. Revenue management research in hospitality and tourism. Int. J. Contemp. Hosp. Manag. 2015, 27, 526–560. [Google Scholar] [CrossRef]
- Wirtz, J.; Kimes, S.E.; Theng, J.H.P.; Patterson, P. Revenue management: Resolving potential customer conflicts. J. Revenue Pricing Manag. 2003, 2, 216–226. [Google Scholar] [CrossRef]
- Wirtz, J.; Kimes, S.E. The moderating role of familiarity in fairness perceptions of revenue management pricing. J. Serv. Res. 2007, 9, 229–240. [Google Scholar] [CrossRef]
- Gibbs, C.; Guttentag, D.; Gretzel, U.; Morton, J.; Goodwill, A. Pricing in the sharing economy: A hedonic pricing model applied to Airbnb listings. J. Travel Tour. Mark. 2018, 35, 46–56. [Google Scholar] [CrossRef]
- Vives, A.; Jacob, M.; Payeras, M. Revenue management and price optimization techniques in the hotel sector: A critical literature review. Tour. Econ. 2018, 24, 720–752. [Google Scholar] [CrossRef]
- Chen, C.; Schwartz, Z. Room rate patterns and customers’ propensity to book a hotel room. J. Hosp. Tour. Res. 2008, 32, 287–306. [Google Scholar] [CrossRef]
- Chen, Y.; Xie, K. Consumer valuation of Airbnb listings: A hedonic pricing approach. Int. J. Contemp. Hosp. Manag. 2017, 29, 2405–2424. [Google Scholar] [CrossRef]
- Ikkala, T.; Lampinen, A. Monetizing Network Hospitality: Hospitality and Sociability in the Context of Airbnb. In Proceedings of the 18th ACM Conference on Computer Supported Cooperative Work & Social Computing, Vancouver, CB, Canada, 14–18 March 2015; pp. 1033–1044. [Google Scholar]
- Ceptureanu, E.G.; Ceptureanu, S.I.; Herteliu, C.; Cerqueti, R. Sustainable consumption behaviours in P2P accommodation platforms: An exploratory study. Soft Comput. 2020, 1–8. [Google Scholar] [CrossRef]
- Liang, L.J.; Choi, H.C.; Joppe, M. Understanding repurchase intention of Airbnb consumers: Perceived authenticity, electronic word-of-mouth, and price sensitivity. J. Travel Tour. Mark. 2018, 35, 73–89. [Google Scholar] [CrossRef]
- Teubner, T.; Hawlitschek, F.; Dann, D. Price determinants on airbnb: How reputation pays off in the sharing economy. J. Self Gov. Manag. Econ. 2017, 5. [Google Scholar] [CrossRef]
- Soler, I.P.; Gemar, G.; Correia, M.B.; Serra, F. Algarve hotel price determinants: A hedonic pricing model. Tour. Manag. 2019, 70, 311–321. [Google Scholar] [CrossRef]
- Adamiak, C.; Szyda, B.; Dubownik, A.; García-Álvarez, D. Airbnb Offer in Spain—Spatial Analysis of the Pattern and Determinants of Its Distribution. ISPRS Int. J. Geo Inf. 2019, 8, 155. [Google Scholar] [CrossRef] [Green Version]
- Zhang, Z.; Chen, R.; Han, L.; Yang, L. Key factors affecting the price of Airbnb listings: A geographically weighted approach. Sustainability 2017, 9, 1635. [Google Scholar] [CrossRef] [Green Version]
- Lagonigro, R.; Martori, J.C.; Apparicio, P. Understanding Airbnb spatial distribution in a southern European city: The case of Barcelona. Appl. Geogr. 2020, 115, 102136. [Google Scholar] [CrossRef]
- Shabrina, Z.; Buyuklieva, B.; Ming, M.N.K. Airbnb, hotels, and saturation of the food industry: A multi-scale GWR approach. arXiv 2019, arXiv:1905.12543. [Google Scholar]
- Xu, F.; Hu, M.; La, L.; Wang, J.; Huang, C. The influence of neighbourhood environment on Airbnb: A geographically weighed regression analysis. Tour. Geogr. 2019. [Google Scholar] [CrossRef]
- Xu, Y.-H.; Pennington-Gray, L.; Kim, J. The sharing economy: A geographically weighted regression approach to examine crime and the shared lodging sector. J. Travel Res. 2019, 68, 1193–1208. [Google Scholar] [CrossRef]
- Fotheringham, A.S.; Yang, W.; Kang, W. Multiscale geographically weighted regression (MGWR). Ann. Am. Assoc. Geogr. 2017, 107, 1247–1265. [Google Scholar] [CrossRef]
- Hung, W.-T.; Shang, J.-K.; Wang, F.-C. Pricing determinants in the hotel industry: Quantile regression analysis. Int. J. Hosp. Manag. 2010, 29, 378–384. [Google Scholar] [CrossRef]
- Pawlicz, A.; Napierala, T. The determinants of hotel room rates: An analysis of the hotel industry in Warsaw, Poland. Int. J. Contemp. Hosp. Manag. 2017, 29, 571–588. [Google Scholar] [CrossRef]
- Yi, J.; Yuan, G.; Yoo, C. The effect of the perceived risk on the adoption of the sharing economy in the tourism industry: The case of Airbnb. Inf. Process. Manag. 2020, 57, 102108. [Google Scholar] [CrossRef]
- Curtis, S.K.; Lehner, M. Defining the sharing economy for sustainability. Sustainability 2019, 11, 567. [Google Scholar] [CrossRef] [Green Version]
- Plewnia, F.; Guenther, E. Mapping the sharing economy for sustainability research. Manag. Decis. 2018. [Google Scholar] [CrossRef]
- Frenken, K.; Schor, J. Putting the sharing economy into perspective. Environ. Innov. Soc. Transit. 2017, 23, 3–10. [Google Scholar] [CrossRef]
- Acquier, A.; Daudigeos, T.; Pinkse, J. Promises and paradoxes of the sharing economy: An organizing framework. Technol. Forecast. Soc. Chang. 2017, 125, 1–10. [Google Scholar] [CrossRef]
- Belk, R. You are what you can access: Sharing and collaborative consumption online. J. Bus. Res. 2014, 67, 1595–1600. [Google Scholar] [CrossRef]
- Sung, E.; Kim, H.; Lee, D. Why do people consume and provide sharing economy accommodation?—A sustainability perspective. Sustainability 2018, 10, 2072. [Google Scholar] [CrossRef] [Green Version]
- Botsman, R.; Rogers, R. What’s Mine is Yours: The Rise of Collaborative Consumption; Harper Business: New York, NY, USA, 2010. [Google Scholar]
- Guttentag, D. Airbnb: Disruptive innovation and the rise of an informal tourism accommodation sector. Curr. Issues Tour. 2015, 18, 1192–1217. [Google Scholar] [CrossRef]
- Tussyadiah, I.P. An Exploratory Study on Drivers and Deterrents of Collaborative Consumption in Travel. In Information and Communication Technologies in Tourism 2015; Springer: Cham, Switzerland, 2015; pp. 817–830. [Google Scholar]
- Sacks, D. The sharing economy. Fast Co. 2011, 155, 88–131. [Google Scholar]
- Zervas, G.; Proserpio, D.; Byers, J.W. The rise of the sharing economy: Estimating the impact of Airbnb on the hotel industry. J. Mark. Res. 2017, 54, 687–705. [Google Scholar] [CrossRef] [Green Version]
- Fang, B.; Ye, Q.; Law, R. Effect of sharing economy on tourism industry employment. Ann. Tour. Res. 2016, 57, 264–267. [Google Scholar] [CrossRef]
- Midgett, C.; Bendickson, J.S.; Muldoon, J.; Solomon, S.J. The sharing economy and sustainability: A case for Airbnb. Small Bus. Inst. J. 2018, 13, 51–71. [Google Scholar]
- Lyon, J. ‘Buy Local’ Campaigns can Actually Supercharge Sales; CNN Money: Atlanta, GA, USA, 2014; Available online: https://money.cnn.com/2014/03/28/smallbusiness/buy-local/ (accessed on 8 June 2020).
- Weisul, K. Consumers Buy into “Buy Local”; Bloomberg Businessweek Magazine: New York, NY, USA, 2010; Available online: https://www.bloomberg.com/news/articles/2010-02-18/consumers-buy-into-buy-local (accessed on 8 June 2020).
- Martin, C.J.; Upham, P.; Budd, L. Commercial orientation in grassroots social innovation: Insights from the sharing economy. Ecol. Econ. 2015, 118, 240–251. [Google Scholar] [CrossRef]
- Yoo, M.; Lee, S.; Bai, B. Hospitality marketing research from 2000 to 2009: Topics, methods, and trends. Int. J. Contemp. Hosp. Manag. 2011, 23, 517–532. [Google Scholar] [CrossRef]
- Kimes, S.E.; Wirtz, J. Has revenue management become acceptable? Findings from an international study on the perceived fairness of rate fences. J. Serv. Res. 2003, 6, 125–135. [Google Scholar] [CrossRef]
- Thrane, C. Hedonic price models and sun-and-beach package tours: The Norwegian case. J. Travel Res. 2005, 43, 302–308. [Google Scholar] [CrossRef]
- Lancaster, K.J. A new approach to consumer theory. J. Polit. Econ. 1966, 74, 132–157. [Google Scholar] [CrossRef]
- Rosen, S. Hedonic prices and implicit markets: Product differentiation in pure competition. J. Polit. Econ. 1974, 82, 34–55. [Google Scholar] [CrossRef]
- Fleischer, A. A room with a view—A valuation of the Mediterranean Sea view. Tour. Manag. 2012, 33, 598–602. [Google Scholar] [CrossRef] [Green Version]
- Lee, S.K.; Jang, S. Room rates of US airport hotels: Examining the dual effects of proximities. J. Travel Res. 2011, 50, 186–197. [Google Scholar]
- Schamel, G. Weekend vs. midweek stays: Modelling hotel room rates in a small market. Int. J. Hosp. Manag. 2012, 31, 1113–1118. [Google Scholar] [CrossRef]
- Zhang, Z.; Ye, Q.; Law, R. Determinants of hotel room price: An exploration of travelers’ hierarchy of accommodation needs. Int. J. Contemp. Hosp. Manag. 2011, 23, 972–981. [Google Scholar] [CrossRef]
- Abrate, G.; Capriello, A.; Fraquelli, G. When quality signals talk: Evidence from the Turin hotel industry. Tour. Manag. 2011, 32, 912–921. [Google Scholar] [CrossRef]
- Espinet, J.M.; Saez, M.; Coenders, G.; Fluvià, M. Effect on prices of the attributes of holiday hotels: A hedonic prices approach. Tour. Econ. 2003, 9, 165–177. [Google Scholar] [CrossRef]
- Latinopoulos, D. Using a spatial hedonic analysis to evaluate the effect of sea view on hotel prices. Tour. Manag. 2018, 65, 87–99. [Google Scholar] [CrossRef]
- Chen, C.-F.; Rothschild, R. An application of hedonic pricing analysis to the case of hotel rooms in Taipei. Tour. Econ. 2010, 16, 685–694. [Google Scholar] [CrossRef] [Green Version]
- Thrane, C. Examining the determinants of room rates for hotels in capital cities: The Oslo experience. J. Revenue Pricing Manag. 2007, 5, 315–323. [Google Scholar] [CrossRef]
- Chattopadhyay, M.; Mitra, S.K. Do airbnb host listing attributes influence room pricing homogenously? Int. J. Hosp. Manag. 2019, 81, 54–64. [Google Scholar] [CrossRef]
- Wang, D.; Nicolau, J.L. Price determinants of sharing economy based accommodation rental: A study of listings from 33 cities on Airbnb.com. Int. J. Hosp. Manag. 2017, 62, 120–131. [Google Scholar] [CrossRef] [Green Version]
- Zervas, G.; Proserpio, D.; Byers, J. A first look at online reputation on Airbnb, where every stay is above average. SSRN 2015. [Google Scholar] [CrossRef] [Green Version]
- Tobler, W.R. Geographical filters and their inverses. Geogr. Anal. 1969, 1, 234–253. [Google Scholar] [CrossRef]
- Brunsdon, C.; Fotheringham, S.; Charlton, M. Geographically weighted regression. J. R. Stat. Soc. Ser. D (Stat.) 1998, 47, 431–443. [Google Scholar] [CrossRef]
- Zhang, H.; Zhang, J.; Lu, S.; Cheng, S.; Zhang, J. Modeling hotel room price with geographically weighted regression. Int. J. Hosp. Manag. 2011, 30, 1036–1043. [Google Scholar] [CrossRef]
- Cudnik, M.T.; Yao, J.; Zive, D.; Newgard, C.; Murray, A.T. Surrogate markers of transport distance for out-of-hospital cardiac arrest patients. Prehosp. Emerg. Care 2012, 16, 266–272. [Google Scholar] [CrossRef]
- Fotheringham, A.S.; Charlton, M.E.; Brunsdon, C. Geographically weighted regression: A natural evolution of the expansion method for spatial data analysis. Environ. Plan. A 1998, 30, 1905–1927. [Google Scholar] [CrossRef]
- Tobler, W.R. A computer movie simulating urban growth in the Detroit region. Econ. Geogr. 1970, 46, 234–240. [Google Scholar] [CrossRef]
- Brunsdon, C.; Fotheringham, A.S.; Charlton, M. Some notes on parametric significance tests for geographically weighted regression. J. Reg. Sci. 1999, 39, 497–524. [Google Scholar] [CrossRef]
- Lee, L.-F.; Yu, J. Spatial Nonstationarity and Spurious Regression: The Case with a Row-normalized Spatial Weights Matrix. Spat. Econ. Anal. 2009, 4, 301–327. [Google Scholar] [CrossRef]
Figure 1.
Airbnb and price distribution in Los Angeles (left) and New York (right).

Figure 2.
Local Moran’s I results for the price.

Figure 3.
MGWR result for cancellation policy (flexible over moderate).

Figure 4.
MGWR result for bedroom.

Figure 5.
Bivariate cluster analysis for poverty rate and the number of bedrooms.

Figure 6.
MGWR result for density.

Figure 7.
MGWR results for review rating.

Figure 8.
Bivariate cluster analysis of price and rating in LA.


Table 1.
Price distribution (US dollar).
| LA | NY | |
|---|---|---|
| Mean | 209.9 | 207.9 |
| Median | 167 | 150 |
| Min | 10 | 10 |
| Max | 21,053 | 10,888 |
| Standard deviation | 623.3 | 313.9 |
Table 2.
Selected pricing variables.
| Variable | Explanation | |
|---|---|---|
| Listing functions | guests | The number of accepted guests |
| bedrooms | The number of bedrooms in a listing | |
| bathrooms | The number of bathrooms in a listing | |
| rent type: shared/entire | Rental type of a listing: shared, entire unit/house | |
| policy: strict/moderate/flexible | Cancelation policy of a listing: strict, moderation, flexible | |
| Attributes of host | duration | Duration of a host in Airbnb |
| superhost | Superhost status of a host | |
| Reputation | reviews | Number of reviews for a listing |
| rating | Rating score for a listing, 0–100 scale | |
| Geographical characteristics | density | The number of other Airbnb listings within 1 km range |
| proverty_r | The ratio of households under the federal poverty line (census blockgroup) | |
| dist_index | Combined distance index to 30 popular tourism destinations in a city (sum of inversed distance) | |
Table 3.
OLS results.
| LA | New York | |||||
|---|---|---|---|---|---|---|
| Variables | Coefficient | SD | T-Value | Coefficient | SD | T-Value |
| guests | 0.053 *** | 0.01 | 5.54 | 0.200 *** | 0.009 | 21.917 |
| bedrooms | 0.157 *** | 0.01 | 15.722 | 0.078 *** | 0.008 | 9.533 |
| bathrooms | 0.387 *** | 0.008 | 48.006 | 0.124 *** | 0.007 | 18.685 |
| shared | −0.080 *** | 0.007 | −12.08 | −0.100 *** | 0.007 | −14.057 |
| strict | −0.007 | 0.007 | −1.015 | 0.020 *** | 0.007 | 2.725 |
| flexible | −0.034 *** | 0.007 | −4.695 | −0.001 | 0.008 | −0.096 |
| superhost | 0.025 *** | 0.006 | 4.053 | 0.030 *** | 0.006 | 4.773 |
| duration | 0.017 *** | 0.006 | 2.994 | 0.020 *** | 0.006 | 3.228 |
| rating | −0.115 *** | 0.006 | −18.766 | −0.049 *** | 0.006 | −7.762 |
| reviews | −0.015 ** | 0.006 | −2.461 | −0.041 *** | 0.006 | −6.366 |
| density | −0.008 | 0.008 | −1.09 | 0.020 *** | 0.007 | 3.038 |
| poverty_r | −0.055 *** | 0.006 | −9.413 | −0.031 *** | 0.006 | −5.134 |
| dist_index | 0.028 *** | 0.008 | 4.363 | 0.195 *** | 0.007 | 27.841 |
| R2 = 0.368 | R2 = 0.205 | |||||
**: p < 0.01, ***: p < 0.001.
Table 4.
Multiscale Geographically Weighed Regression (MGWR) results of LA area.
| Variables | Bandwidth (m) | Mean | Std | Min | Median | Max | Ratio of Significance (%) |
|---|---|---|---|---|---|---|---|
| guests | 45 | 0.264 | 0.540 | −3.216 | 0.300 | 2.384 | 9.3 |
| bedrooms | 1321 | 0.100 | 0.039 | 0.043 | 0.093 | 0.324 | 90.9 |
| bathrooms | 250 | 0.289 | 0.141 | −0.225 | 0.253 | 0.931 | 61.0 |
| shared | 3663 | −0.064 | 0.015 | −0.181 | −0.063 | −0.026 | 99.8 |
| strict | 264 | −0.097 | 0.210 | −0.798 | −0.126 | 0.346 | 5.9 |
| flexible | 20,427 | −0.011 | 0.000 | −0.012 | −0.011 | −0.010 | 93.9 |
| superhost | 3452 | 0.042 | 0.047 | −0.048 | 0.051 | 0.097 | 2.8 |
| duration | 20,428 | N/A | N/A | N/A | N/A | N/A | 0.0 |
| rating | 43 | −0.503 | 0.465 | −2.763 | −0.368 | 0.909 | 6.7 |
| reviews | 20,441 | −0.015 | 0.000 | −0.016 | −0.015 | −0.015 | 100.0 |
| density | 670 | 0.068 | 0.155 | −0.196 | 0.076 | 1.237 | 48.2 |
| poverty_r | 1869 | −0.014 | 0.071 | −0.089 | −0.041 | 0.295 | 26.1 |
| dist_index | 15,732 | 0.019 | 0.004 | 0.014 | 0.019 | 0.031 | 22.7 |
| R2 = 0.705 | |||||||
Table 5.
MGWR results of New York area.
| Variables | Bandwidth (m) | Mean | Std | Min | Median | Max | Ratio of Significance (%) |
|---|---|---|---|---|---|---|---|
| guests | 44 | 0.443 | 0.548 | −4.674 | 0.377 | 4.351 | 14.6 |
| bedrooms | 1391 | 0.097 | 0.050 | −0.063 | 0.088 | 0.348 | 64.1 |
| bathrooms | 110 | 0.339 | 0.347 | −2.116 | 0.294 | 2.637 | 20.3 |
| shared | 81 | −0.192 | 0.460 | −1.409 | −0.242 | 3.926 | 11.4 |
| strict | 18,305 | 0.025 | 0.008 | 0.014 | 0.024 | 0.037 | 91.0 |
| flexible | 23,868 | −0.014 | 0.000 | −0.014 | −0.014 | −0.013 | 100.0 |
| superhost | 23,868 | 0.024 | 0.000 | 0.024 | 0.024 | 0.025 | 100.0 |
| duration | 45 | 0.002 | 1.273 | −7.844 | 0.219 | 4.715 | 3.2 |
| rating | 44 | −0.340 | 0.744 | −4.392 | −0.330 | 3.515 | 4.9 |
| reviews | 23,845 | −0.030 | 0.001 | −0.032 | −0.030 | −0.027 | 100.0 |
| density | 23,868 | 0.049 | 0.000 | 0.049 | 0.049 | 0.050 | 100.0 |
| poverty_r | 23,868 | −0.016 | 0.000 | −0.017 | −0.016 | −0.015 | 100.0 |
| dist_index | 20,393 | 0.115 | 0.004 | 0.110 | 0.114 | 0.132 | 100.0 |
| R2 = 0.598 | |||||||
© 2020 by the authors. Licensee MDPI, Basel, Switzerland. This article is an open access article distributed under the terms and conditions of the Creative Commons Attribution (CC BY) license (http://creativecommons.org/licenses/by/4.0/).
Share and Cite
MDPI and ACS Style
Hong, I.; Yoo, C. Analyzing Spatial Variance of Airbnb Pricing Determinants Using Multiscale GWR Approach. Sustainability 2020, 12, 4710. https://0-doi-org.brum.beds.ac.uk/10.3390/su12114710
AMA Style
Hong I, Yoo C. Analyzing Spatial Variance of Airbnb Pricing Determinants Using Multiscale GWR Approach. Sustainability. 2020; 12(11):4710. https://0-doi-org.brum.beds.ac.uk/10.3390/su12114710
Chicago/Turabian StyleHong, Insu, and Changsok Yoo. 2020. "Analyzing Spatial Variance of Airbnb Pricing Determinants Using Multiscale GWR Approach" Sustainability 12, no. 11: 4710. https://0-doi-org.brum.beds.ac.uk/10.3390/su12114710
Note that from the first issue of 2016, this journal uses article numbers instead of page numbers. See further details here.